Cambridge IGCSE Science - Combined 0653 — 2019 Feb/March Paper 6 · Variant 2
0653/62/F/M/19 · 4 questions · 40 marks · ≈45 min
The question paper and its mark scheme, free to read here and free to download. This is Cambridge’s own paper, exactly as it was sat.
Question paper16 pages


Mark scheme7 pages
Answers below. Sit the paper first if you are practising.
Questions as text
Q1 · A student investigates the germination of seeds that have been kept at different…
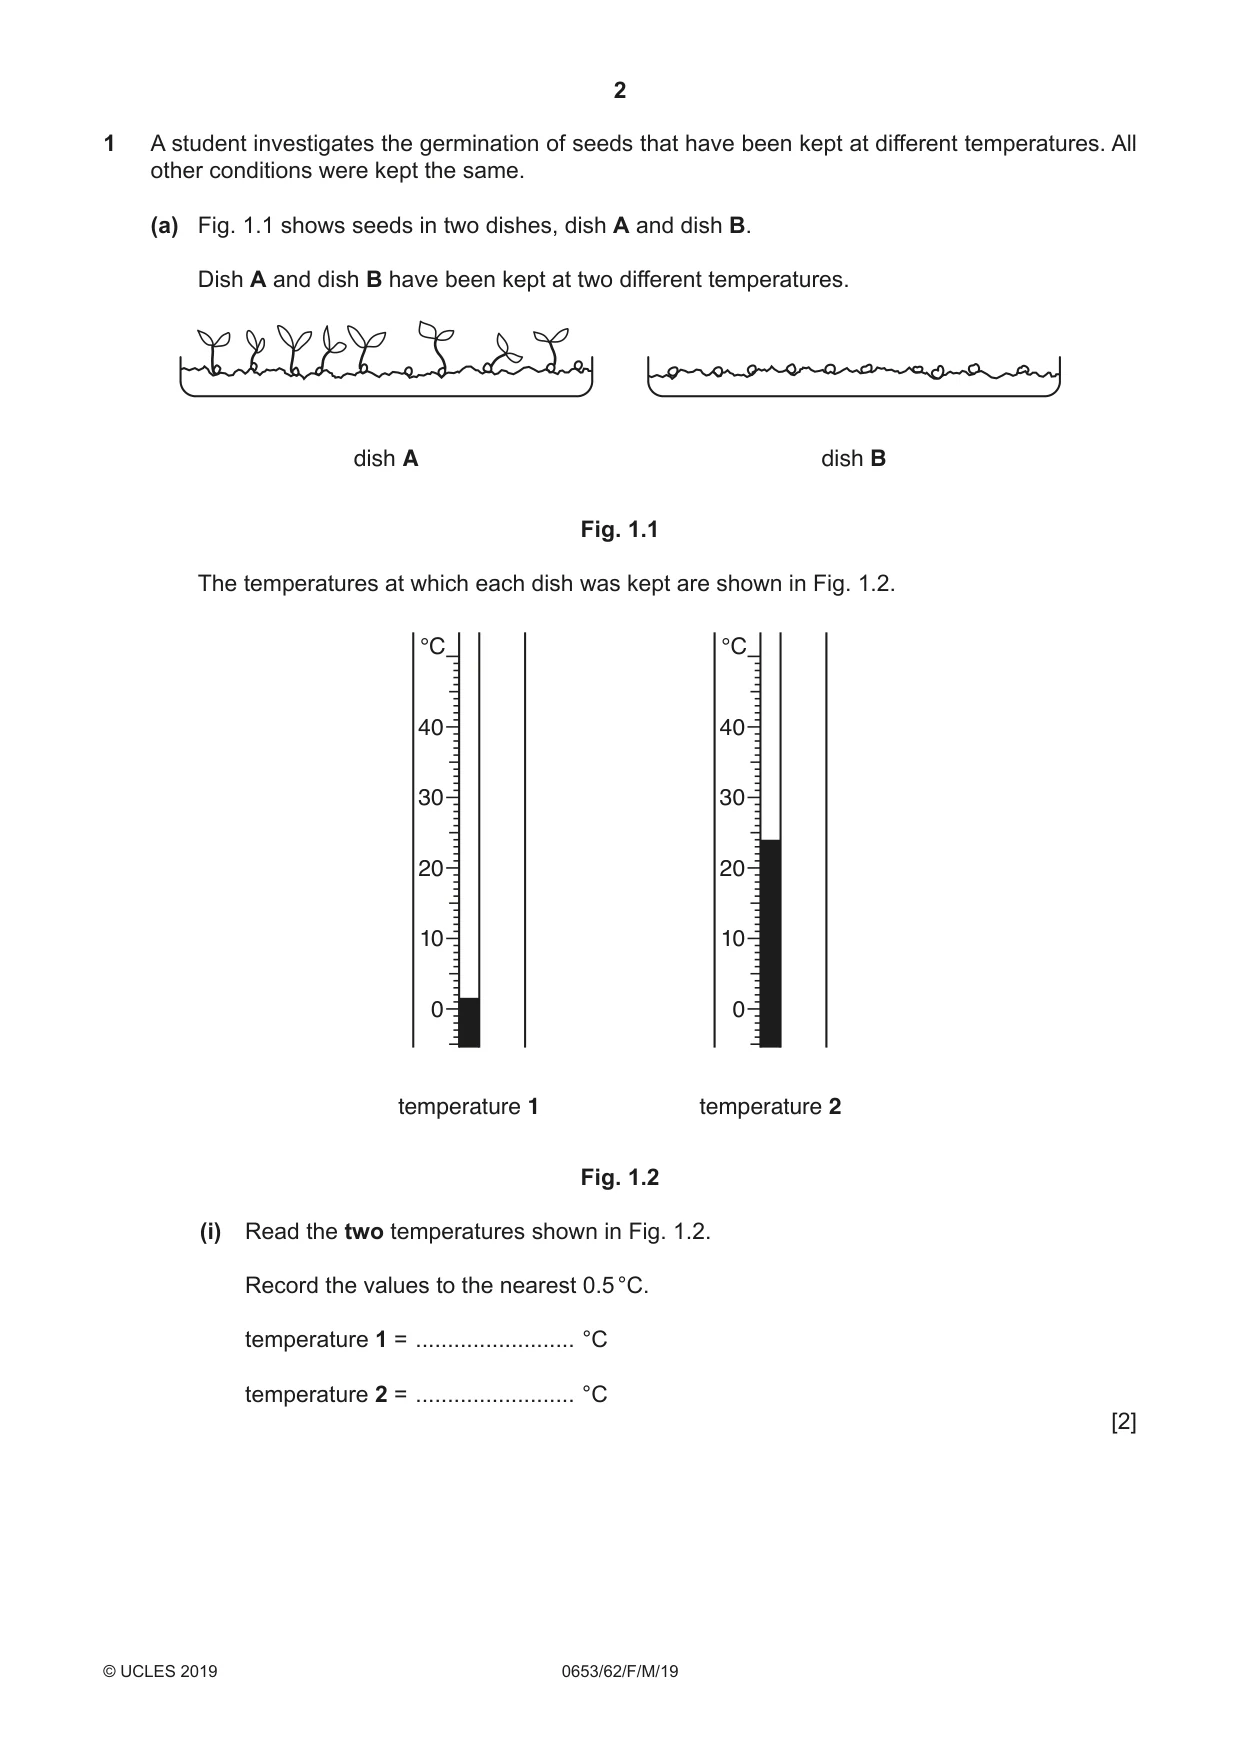
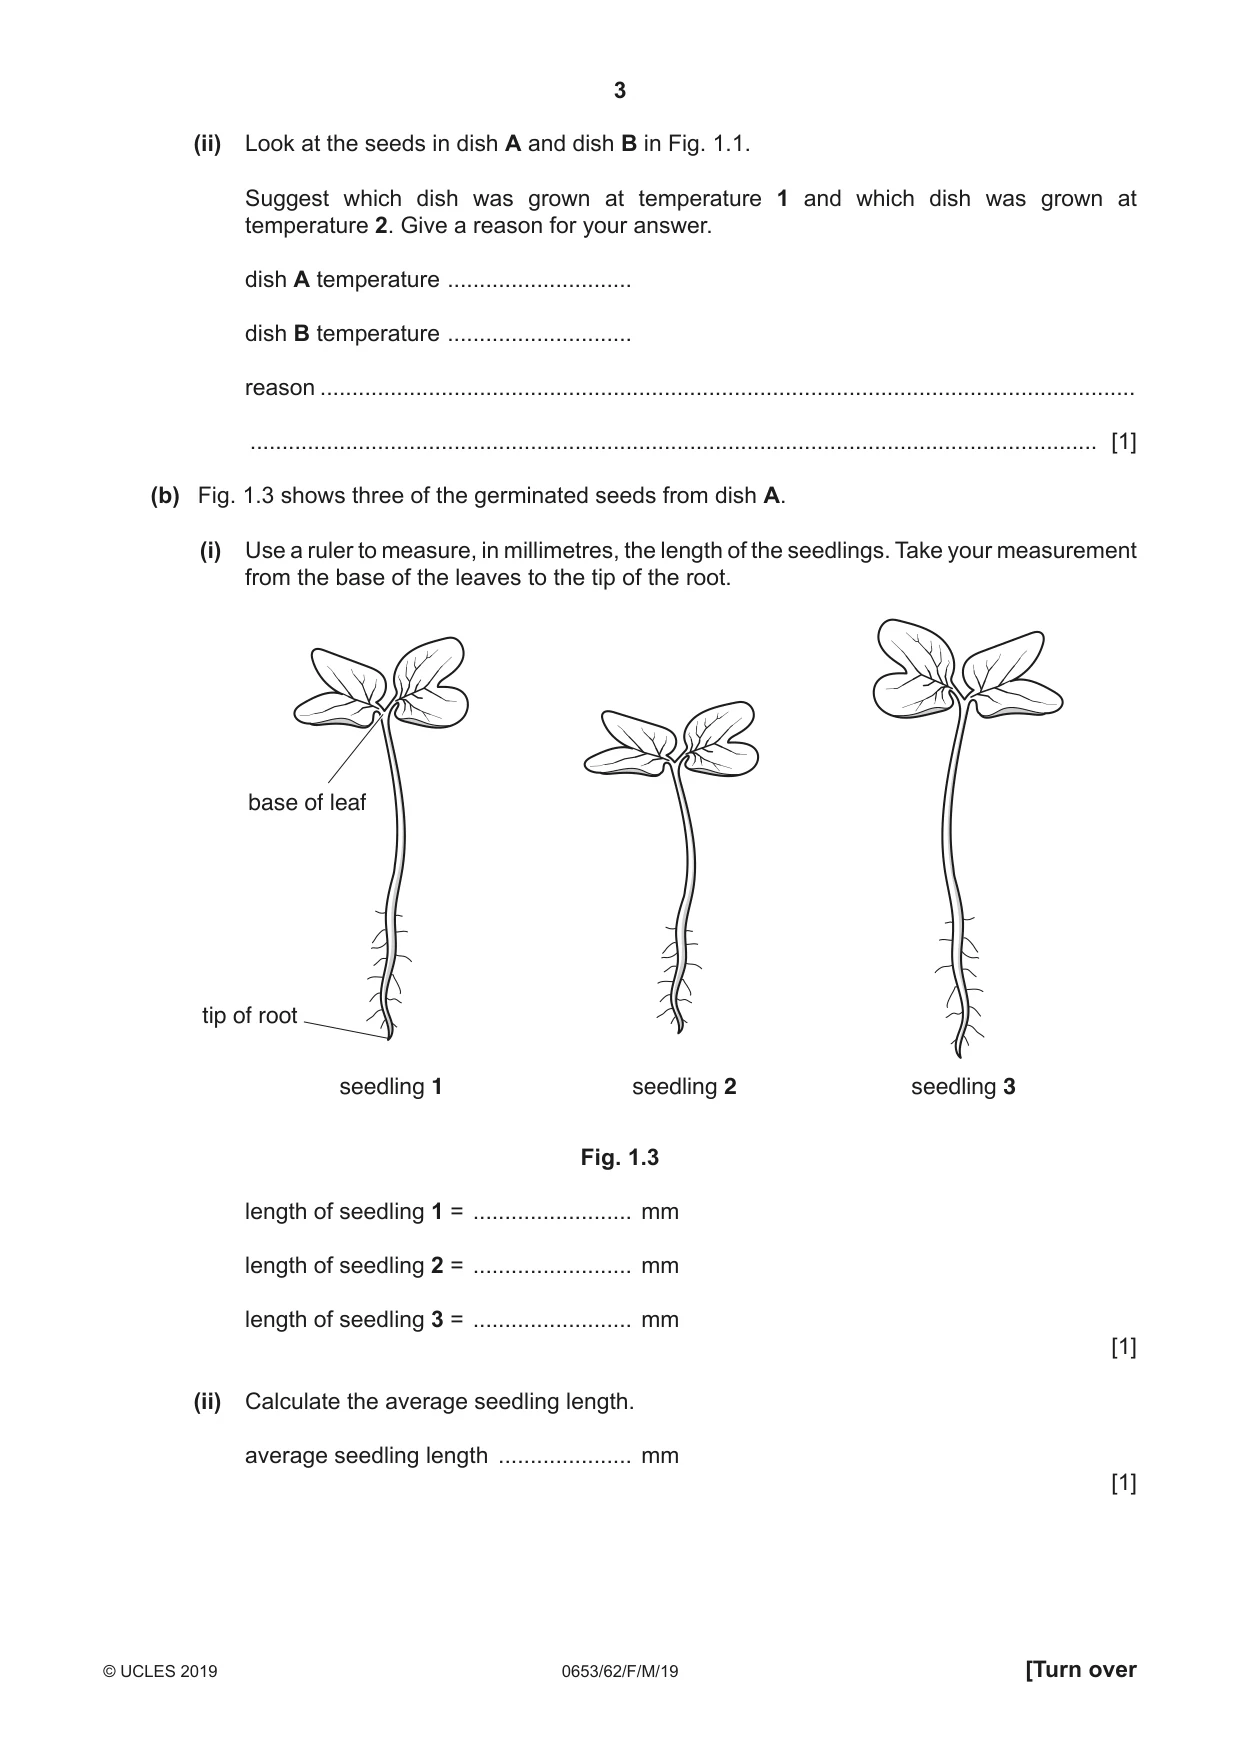
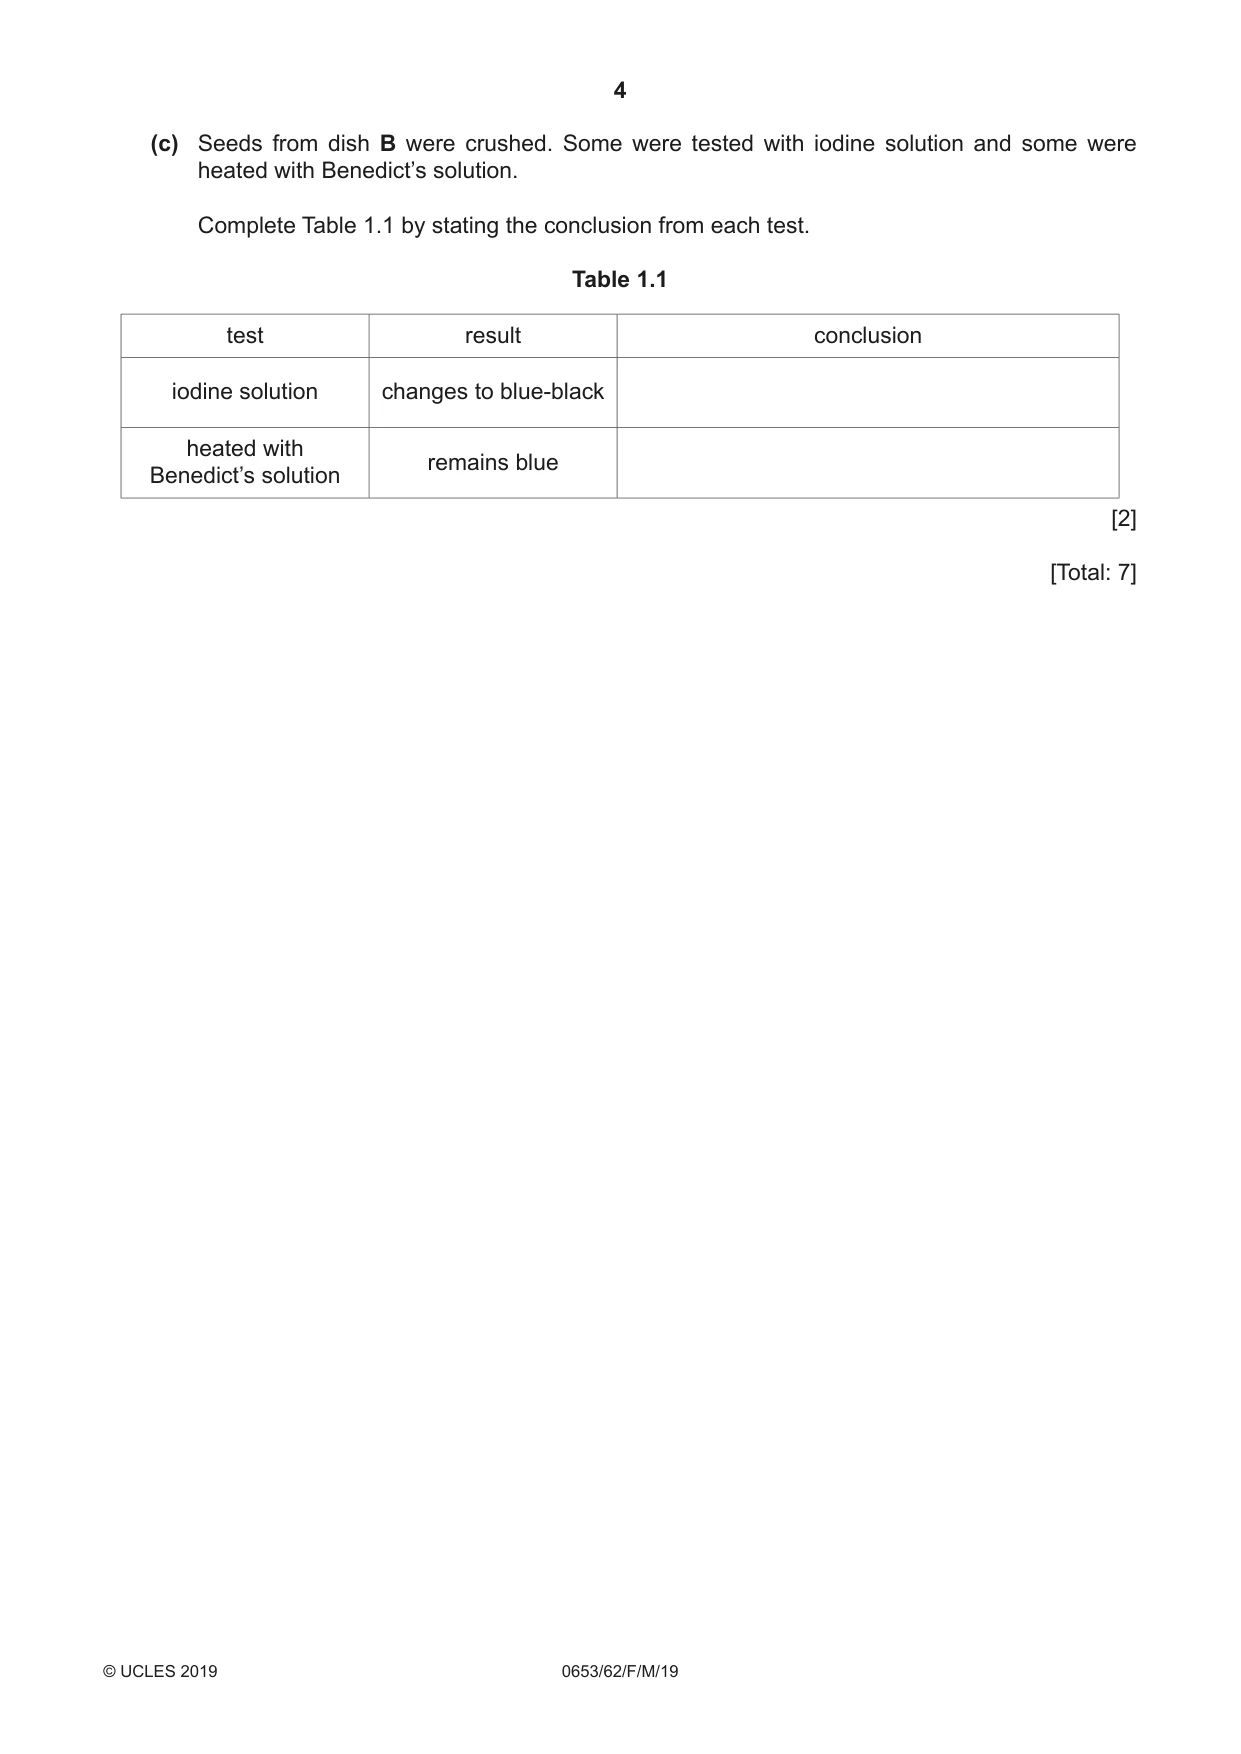
1 A student investigates the germination of seeds that have been kept at different temperatures. All other conditions were kept the same. (a) Fig. 1.1 shows seeds in two dishes, dish A and dish B. Dish A and dish B have been kept at two different temperatures. dish A dish B Fig. 1.1 The temperatures at which each dish was kept are shown in Fig. 1.2. °C °C 40 40 30 30 20 20 10 10 0 0 temperature 1 temperature 2 Fig. 1.2 (i) Read the two temperatures shown in Fig. 1.2. Record the values to the nearest 0.5 °C. temperature 1 = ......................... °C temperature 2 = ......................... °C [2] (ii) Look at the seeds in dish A and dish B in Fig. 1.1. Suggest which dish was grown at temperature 1 and which dish was grown at temperature 2. Give a reason for your answer. dish A temperature ............................. dish B temperature ............................. reason ................................................................................................................................ ..................................................................................................................................... [1] (b) Fig. 1.3 shows three of the germinated seeds from dish A. (i) Use a ruler to measure, in millimetres, the length of the seedlings. Take your measurement from the base of the leaves to the tip of the root. base of leaf tip of root seedling 1 seedling 2 seedling 3 Fig. 1.3 length of seedling 1 = ......................... mm length of seedling 2 = ......................... mm length of seedling 3 = ......................... mm [1] (ii) Calculate the average seedling length. average seedling length ..................... mm [1] (c) Seeds from dish B were crushed. Some were tested with iodine solution and some were heated with Benedict’s solution. Complete Table 1.1 by stating the conclusion from each test. Table 1.1 test result conclusion iodine solution changes to blue-black heated with remains blueBenedict’s solution [2] [Total: 7]
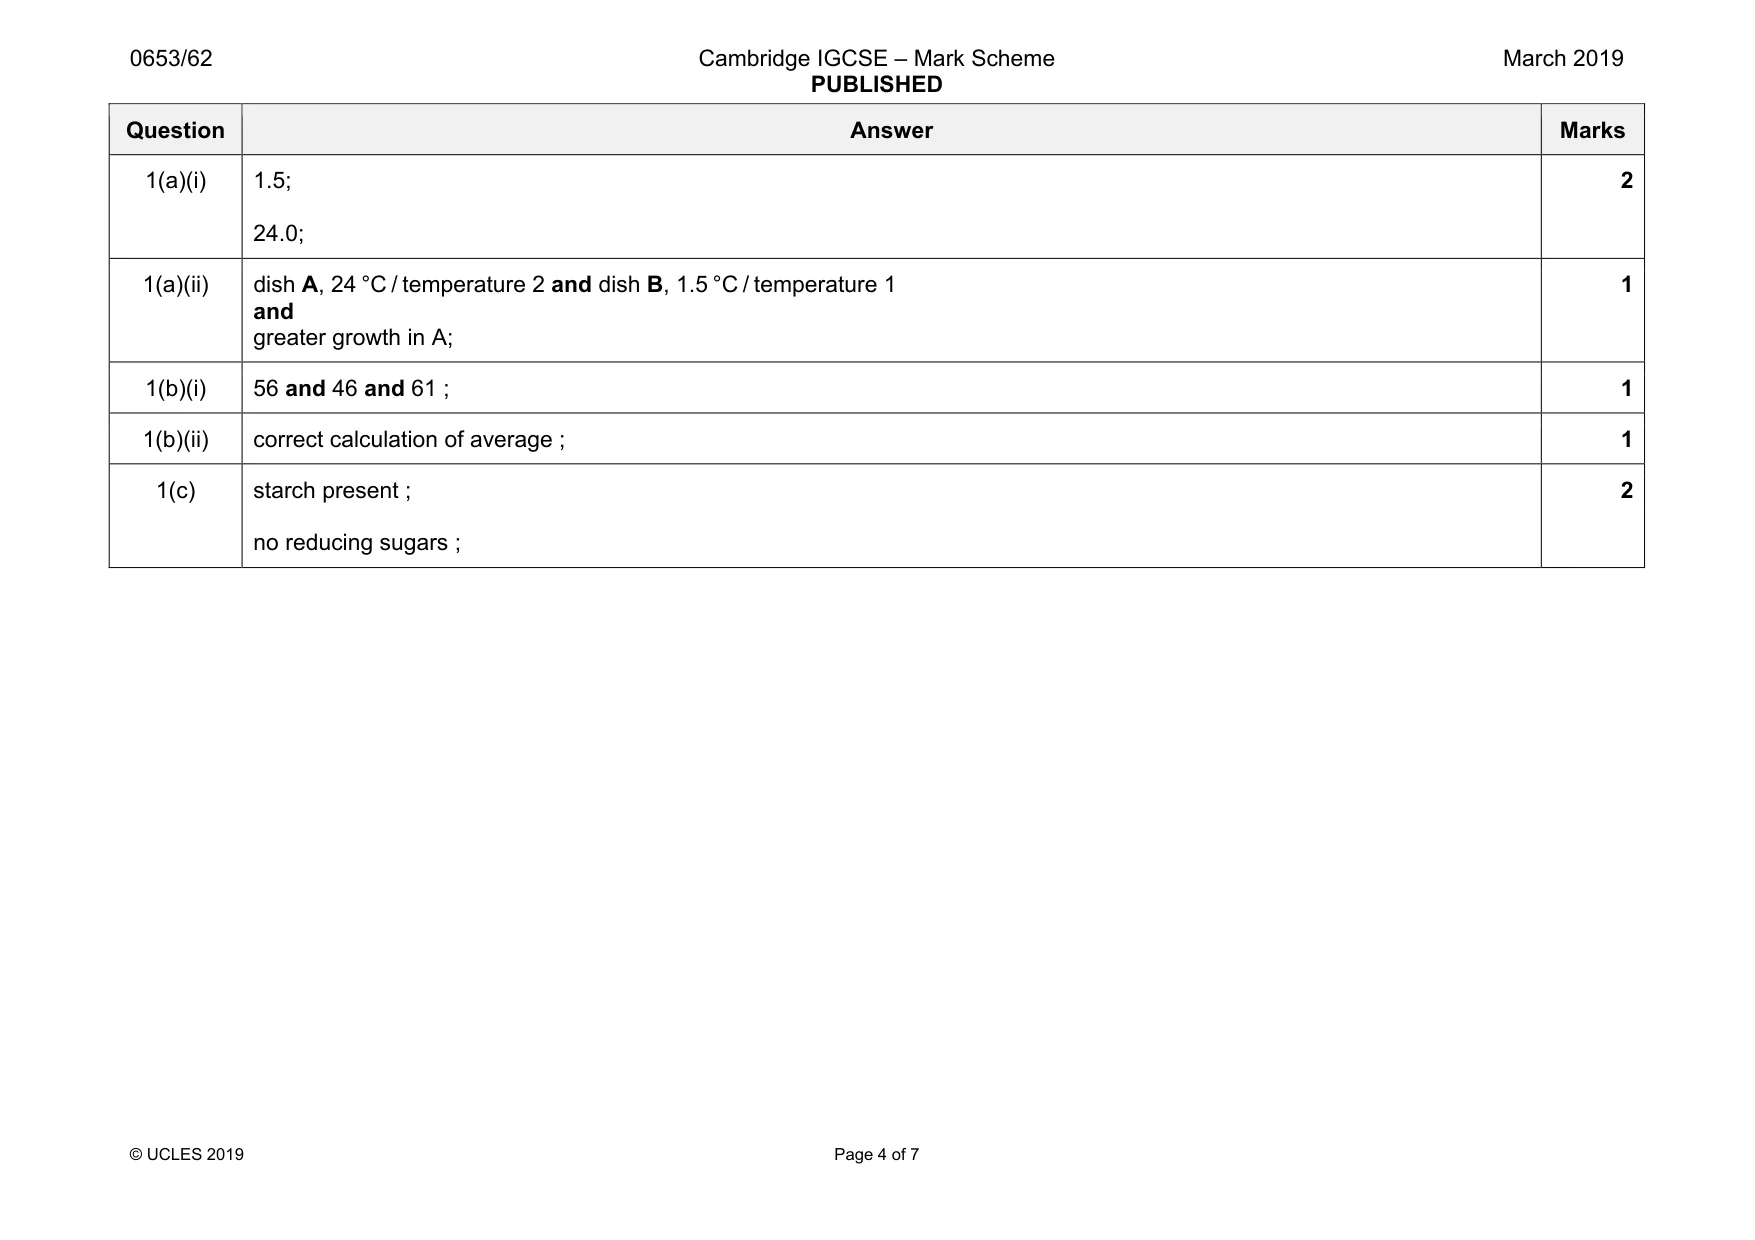
Mark scheme: 1(a)(i) 1.5; 24.0; 2 1(a)(ii) dish A, 24 °C / temperature 2 and dish B, 1.5 °C / temperature 1 and greater growth in A; 1 1(b)(i) 56 and 46 and 61 ; 1 1(b)(ii) correct calculation of average ; 1 1(c) starch present ; no reducing sugars ; 2
More questions on Physical quantities and measurement techniques
Q2 · A student cuts a potato into cylinders as shown in Fig
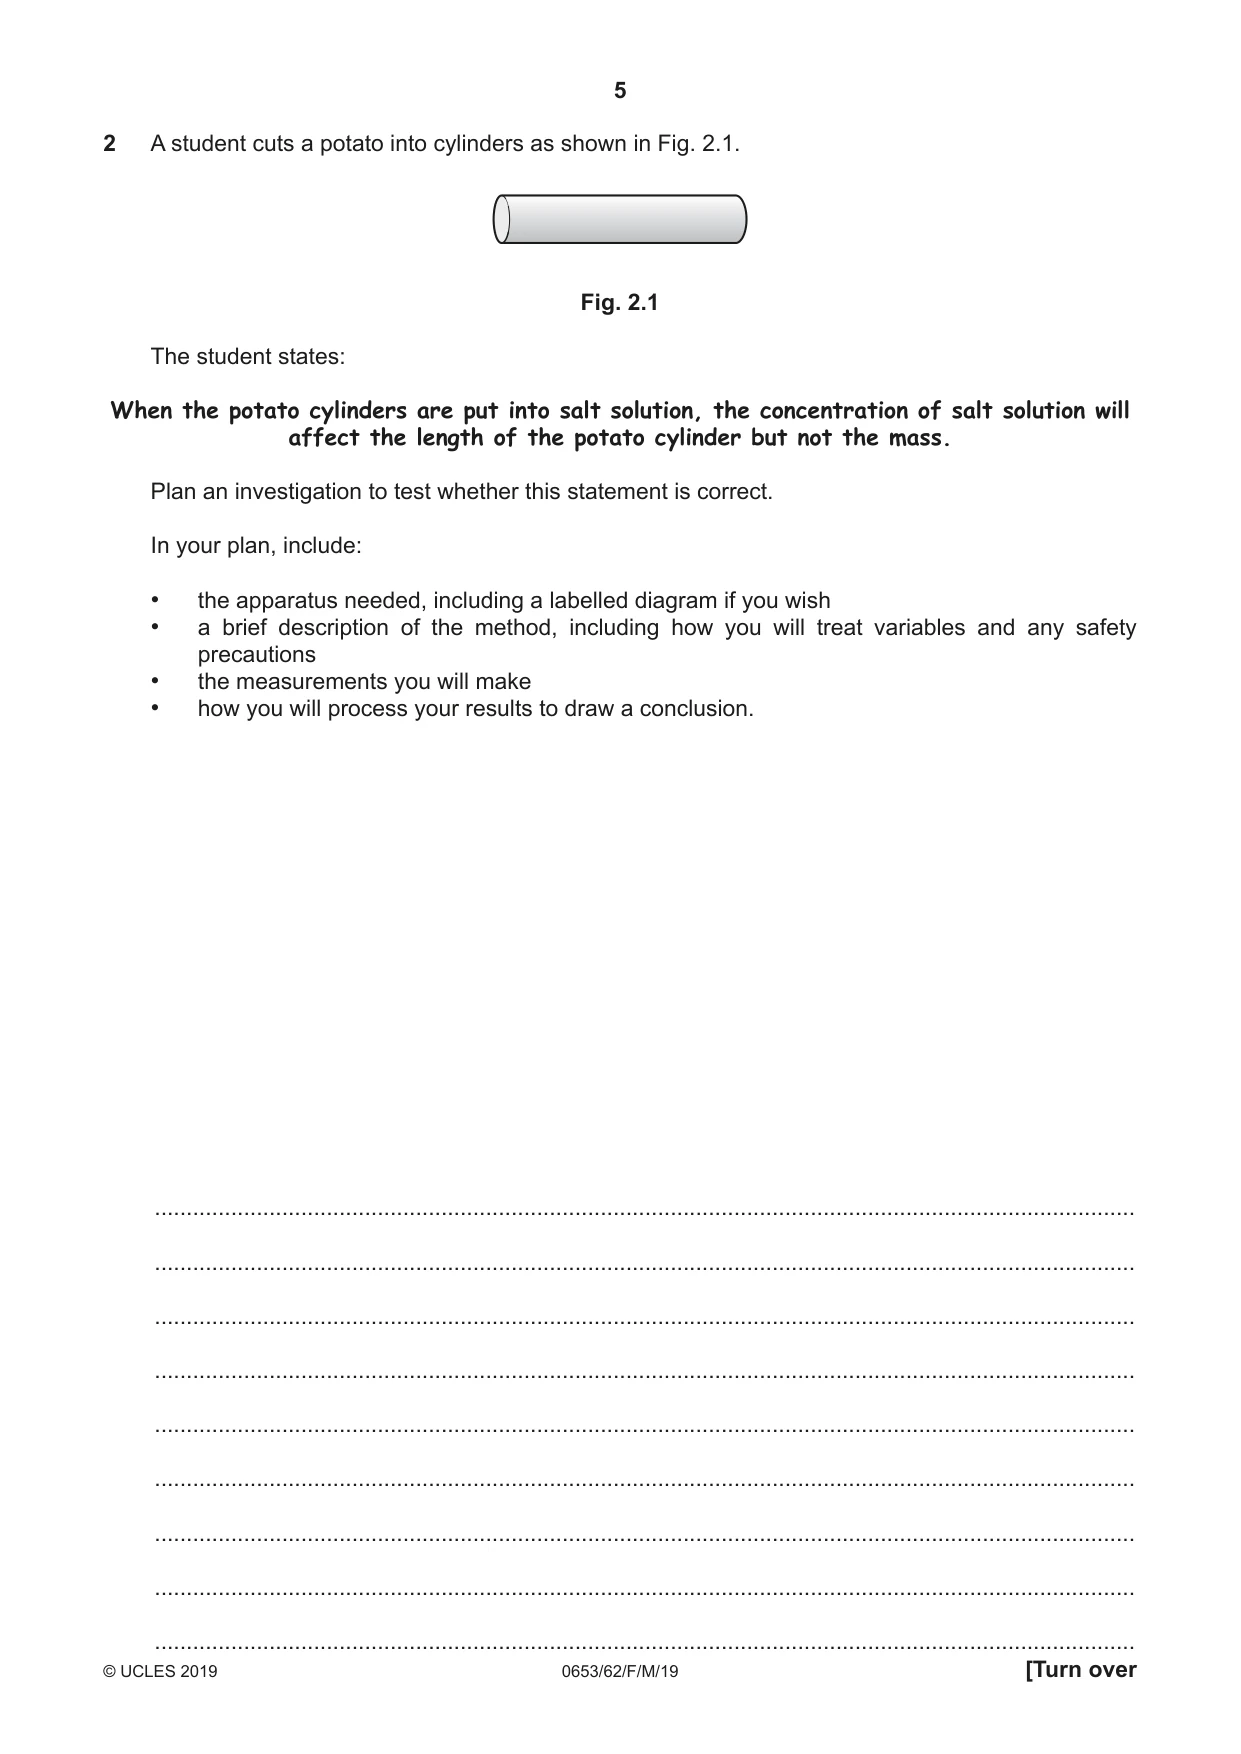
2 A student cuts a potato into cylinders as shown in Fig. 2.1. Fig. 2.1 The student states: When the potato cylinders are put into salt solution, the concentration of salt solution will affect the length of the potato cylinder but not the mass. Plan an investigation to test whether this statement is correct. In your plan, include: • the apparatus needed, including a labelled diagram if you wish • a brief description of the method, including how you will treat variables and any safety precautions • the measurements you will make • how you will process your results to draw a conclusion. .......................................................................................................................................................... .......................................................................................................................................................... .......................................................................................................................................................... .......................................................................................................................................................... .......................................................................................................................................................... .......................................................................................................................................................... .......................................................................................................................................................... .......................................................................................................................................................... .......................................................................................................................................................... .......................................................................................................................................................... .......................................................................................................................................................... .................................................................................................................................................... [7]
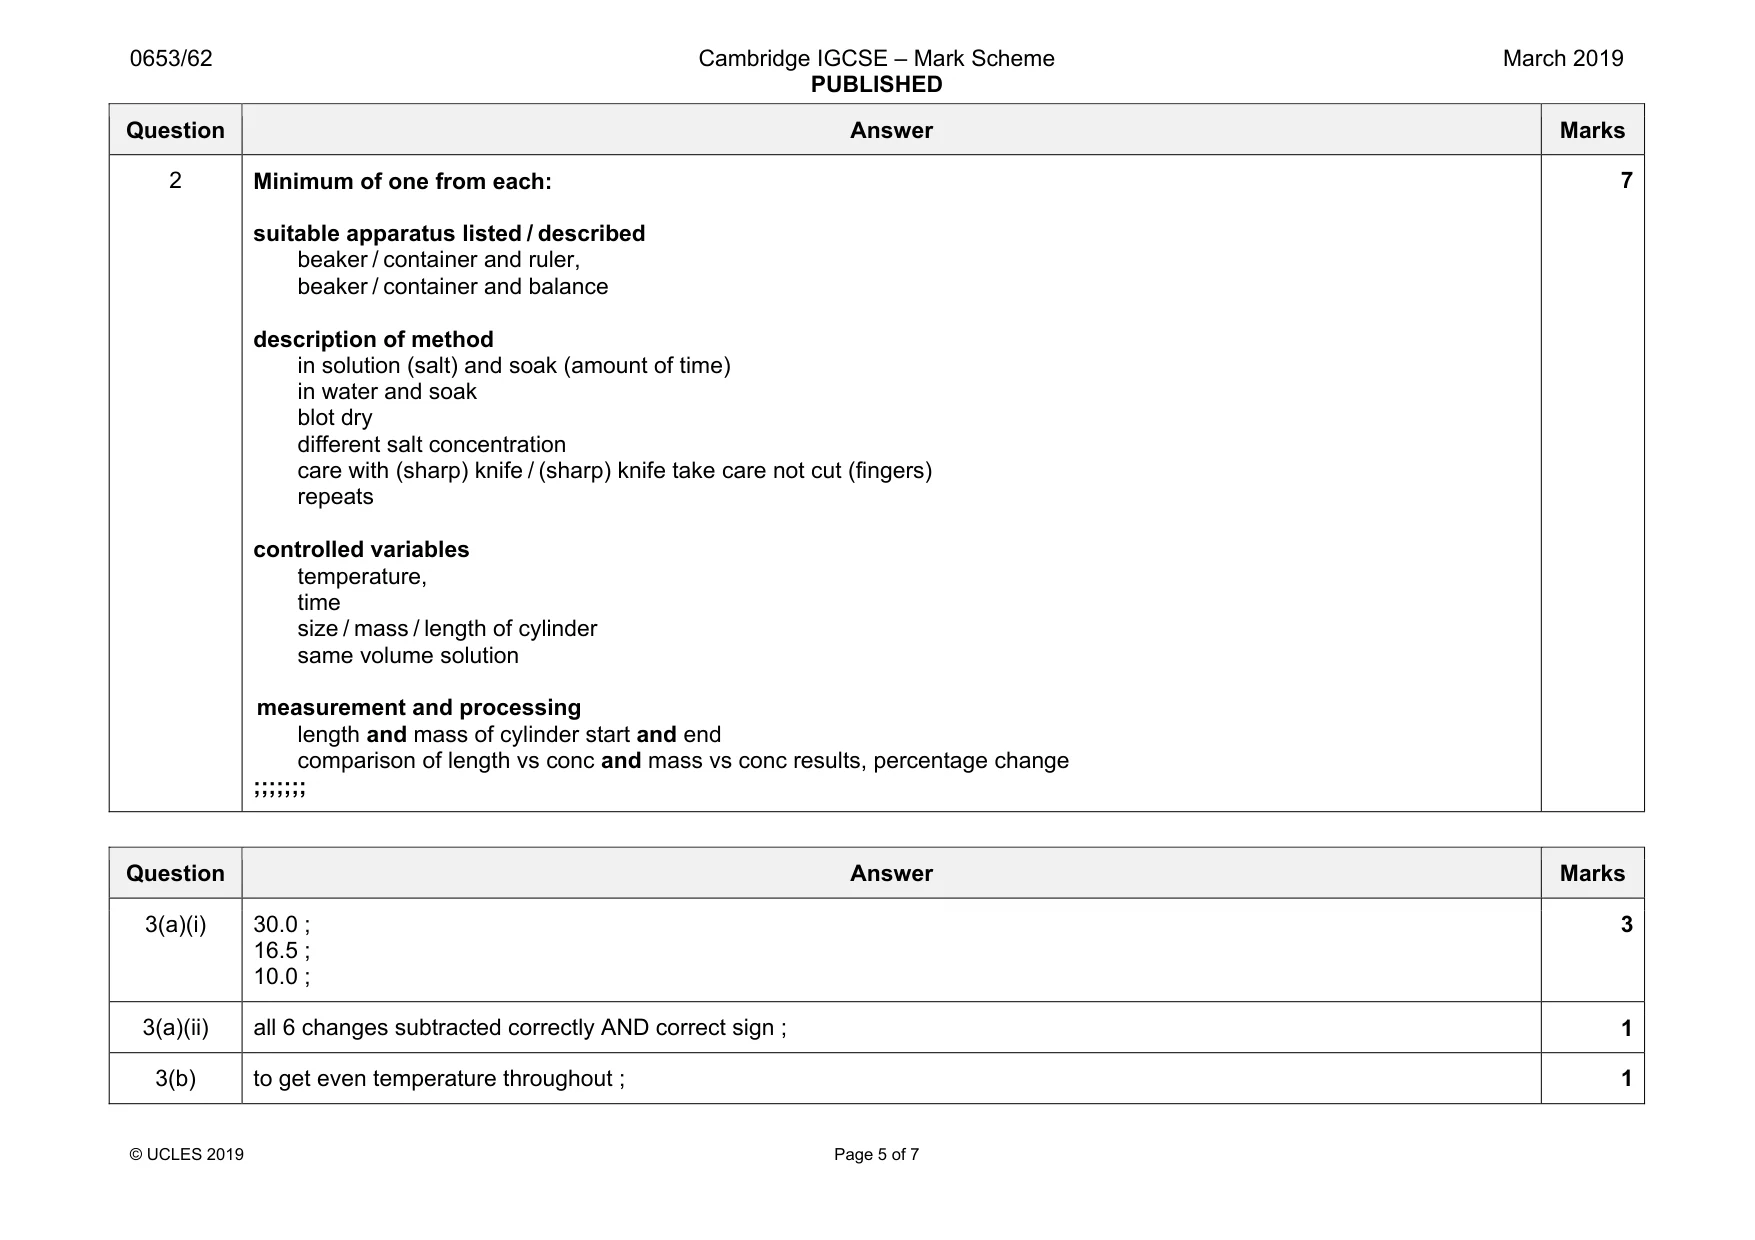
Mark scheme: 2 Minimum of one from each: suitable apparatus listed / described beaker / container and ruler, beaker / container and balance description of method in solution (salt) and soak (amount of time) in water and soak blot dry different salt concentration care with (sharp) knife / (sharp) knife take care not cut (fingers) repeats controlled variables temperature, time size / mass / length of cylinder same volume solution measurement and processing length and mass of cylinder start and end comparison of length vs conc and mass vs conc results, percentage change ;;;;;;; 7
Q3 · A student investigates the change in temperature which occurs when sodium carbonate and…
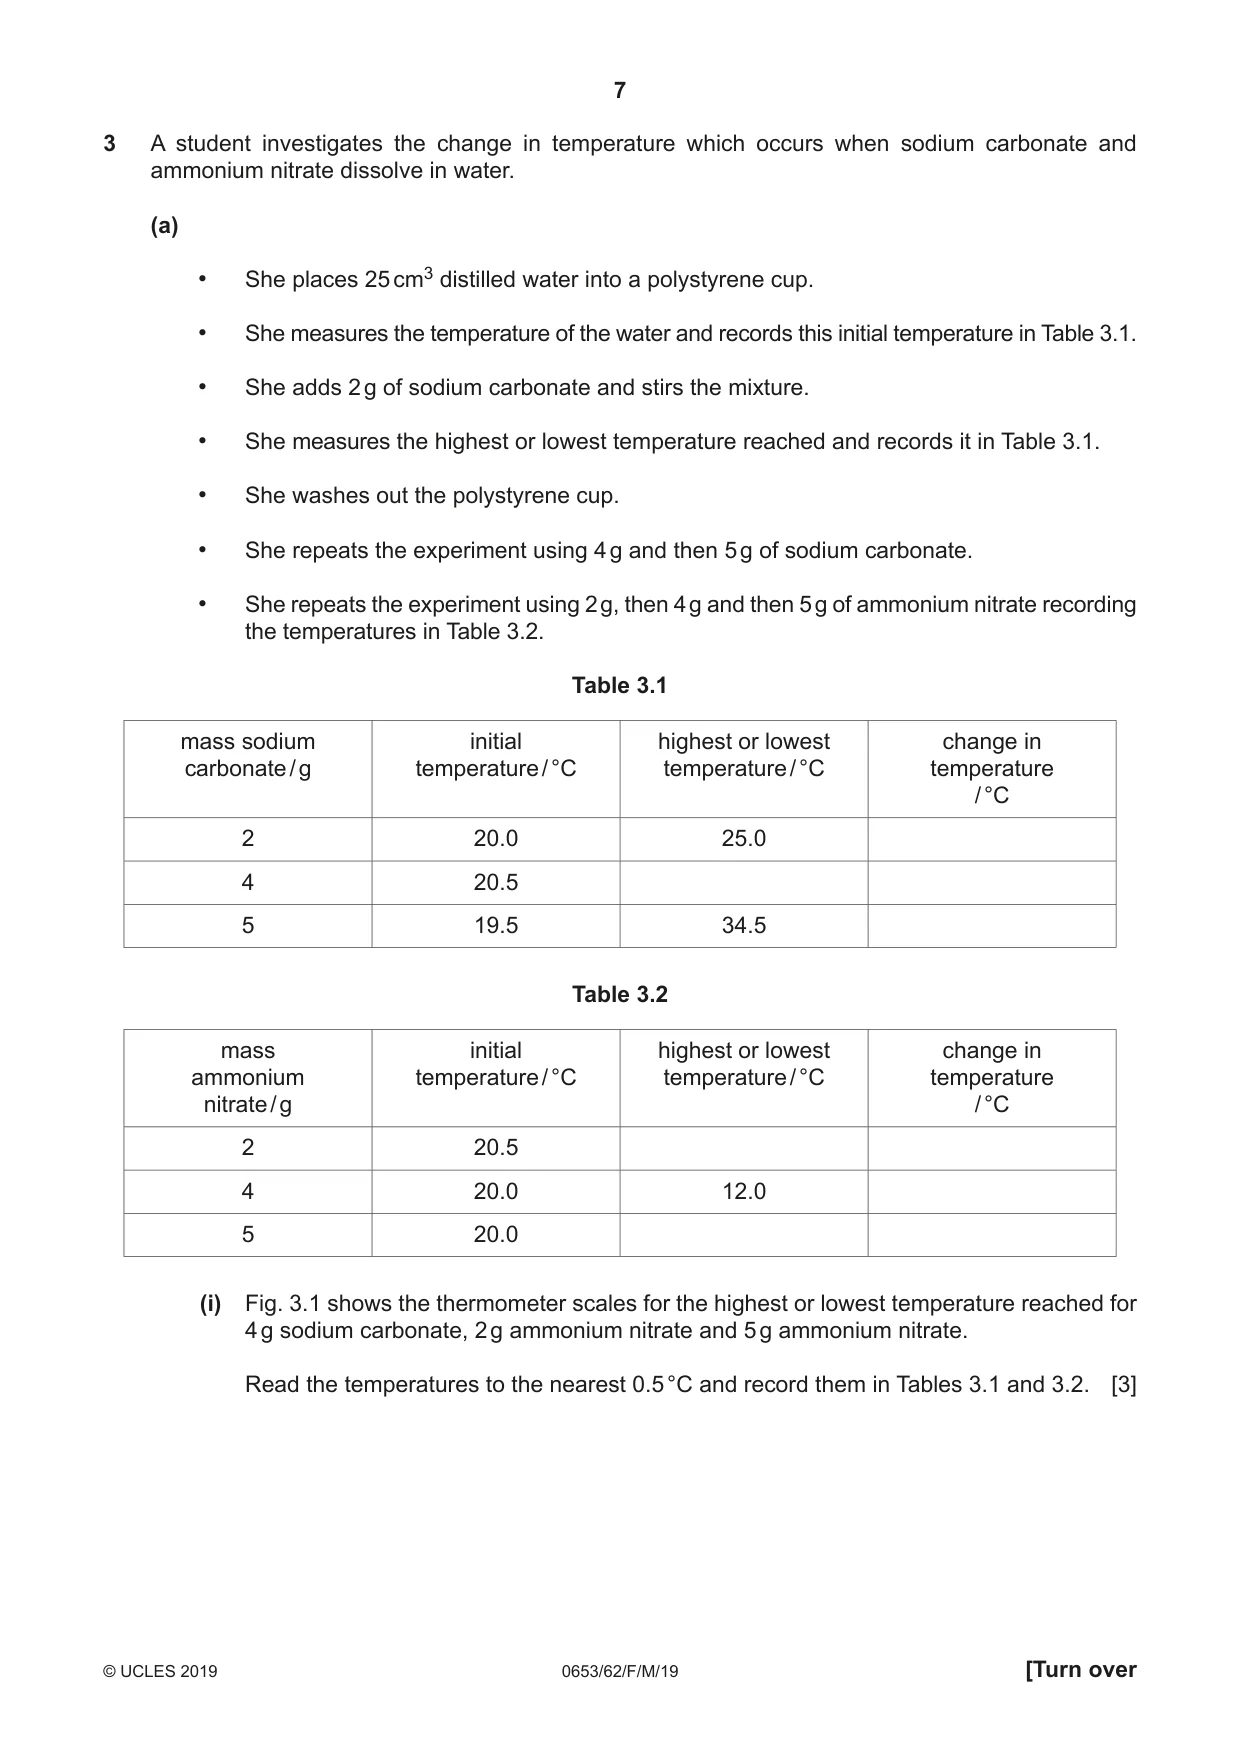
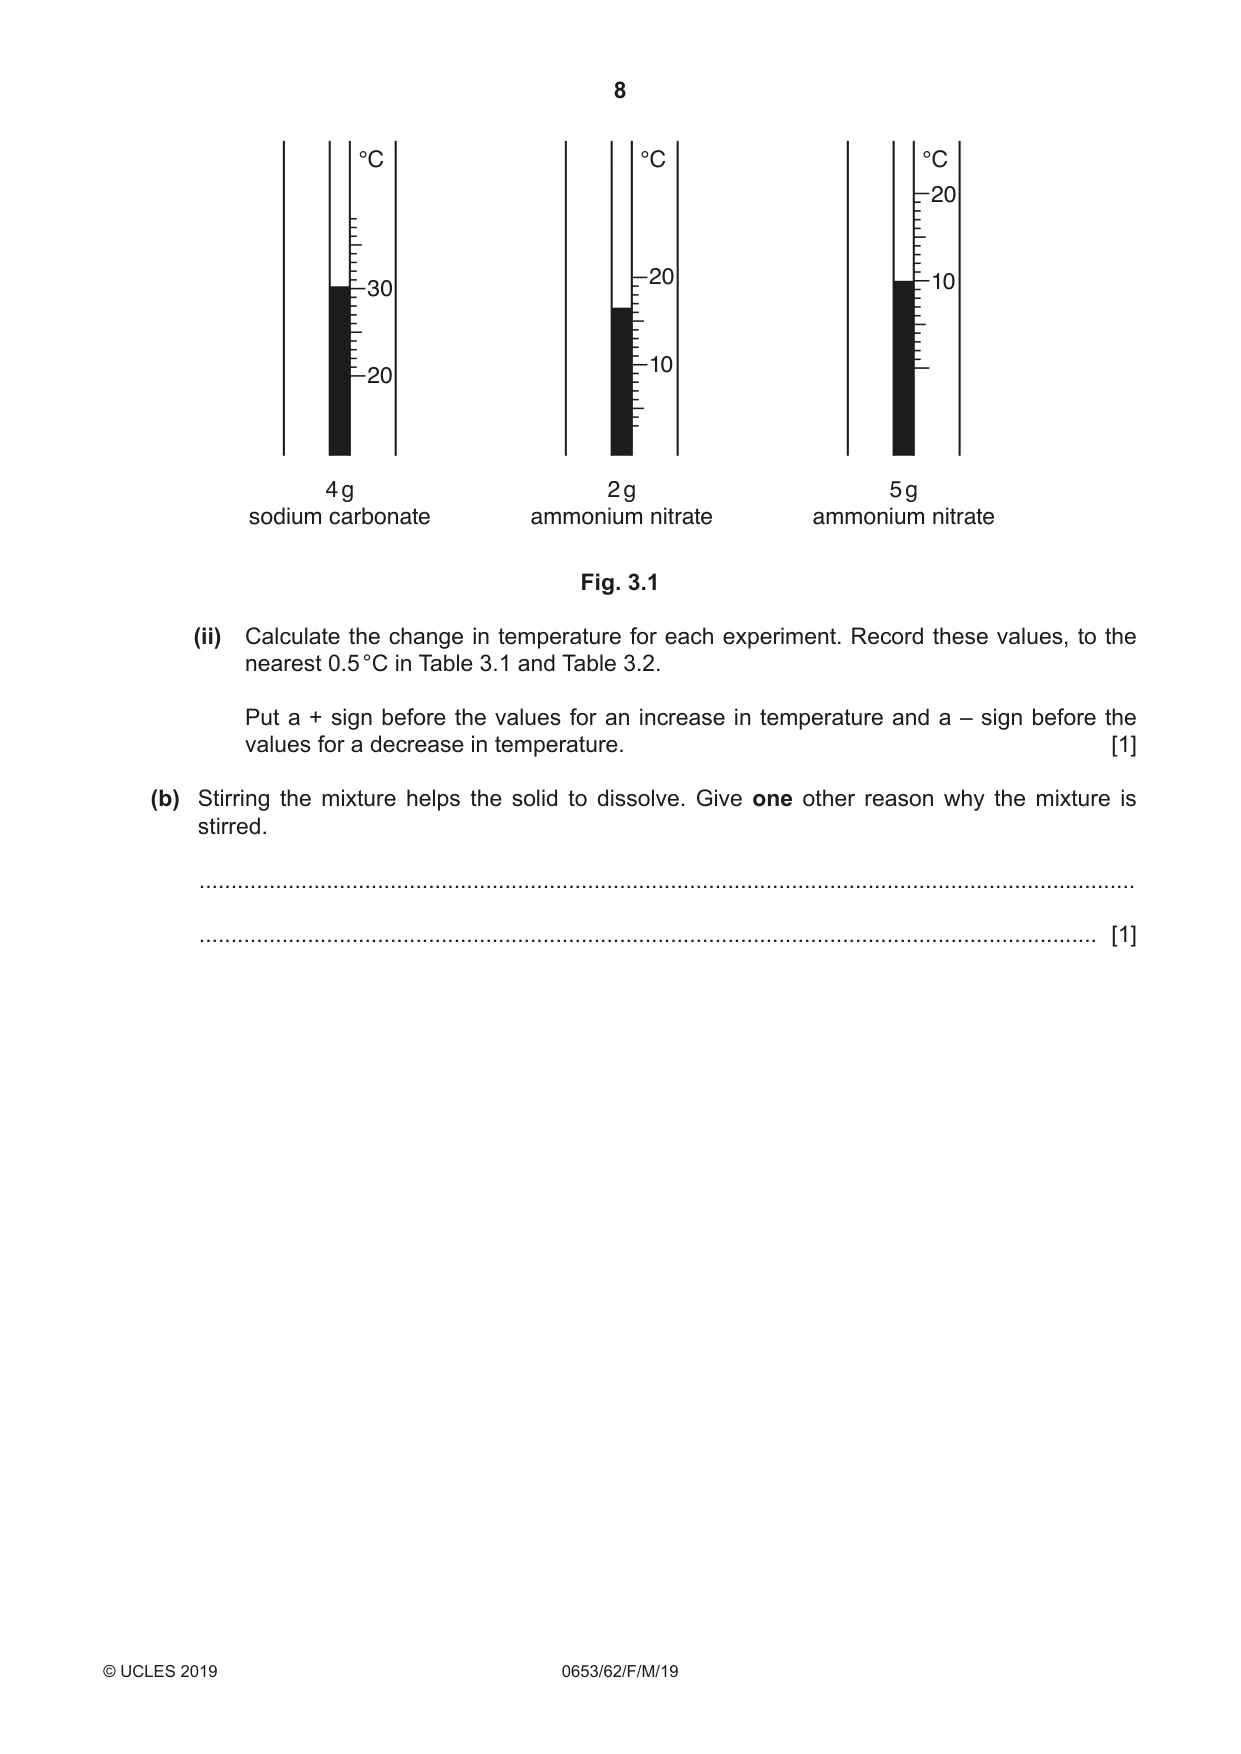
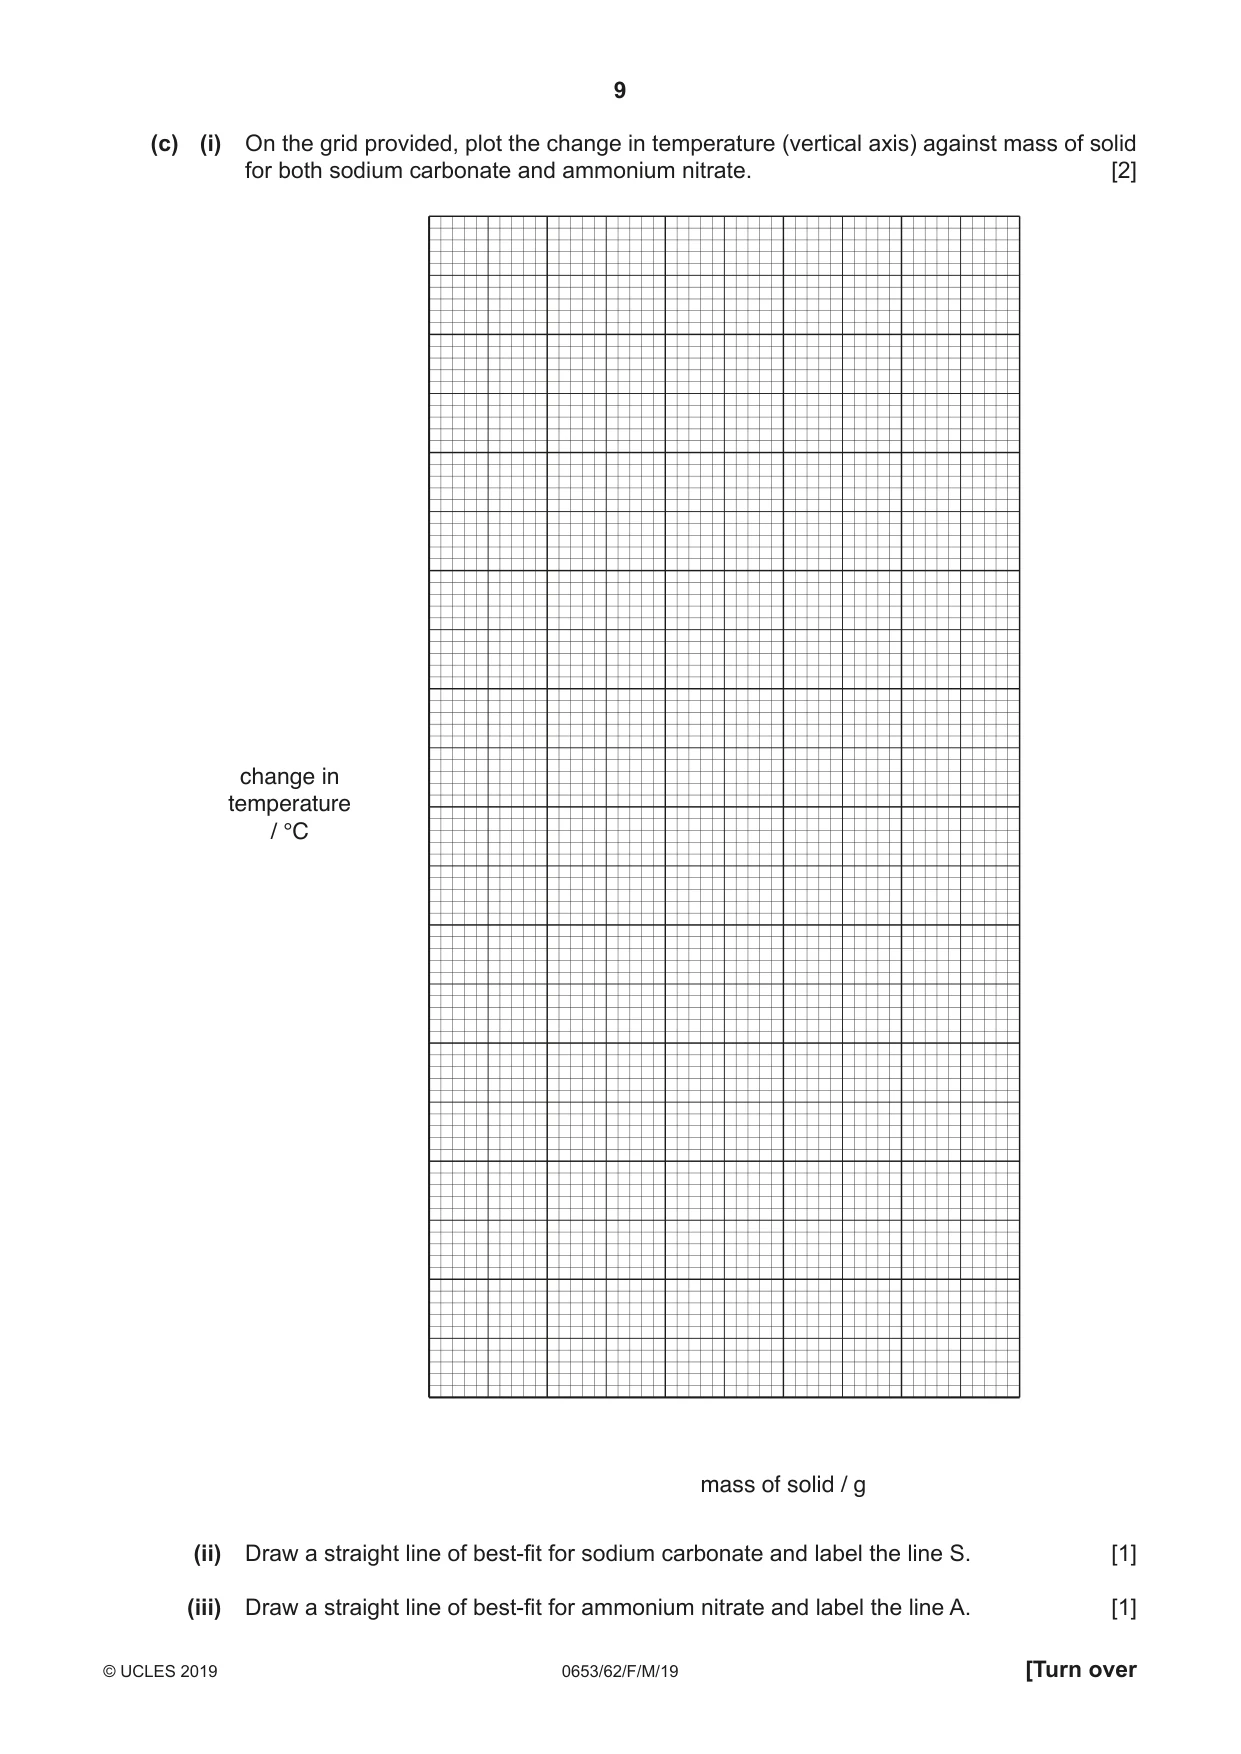
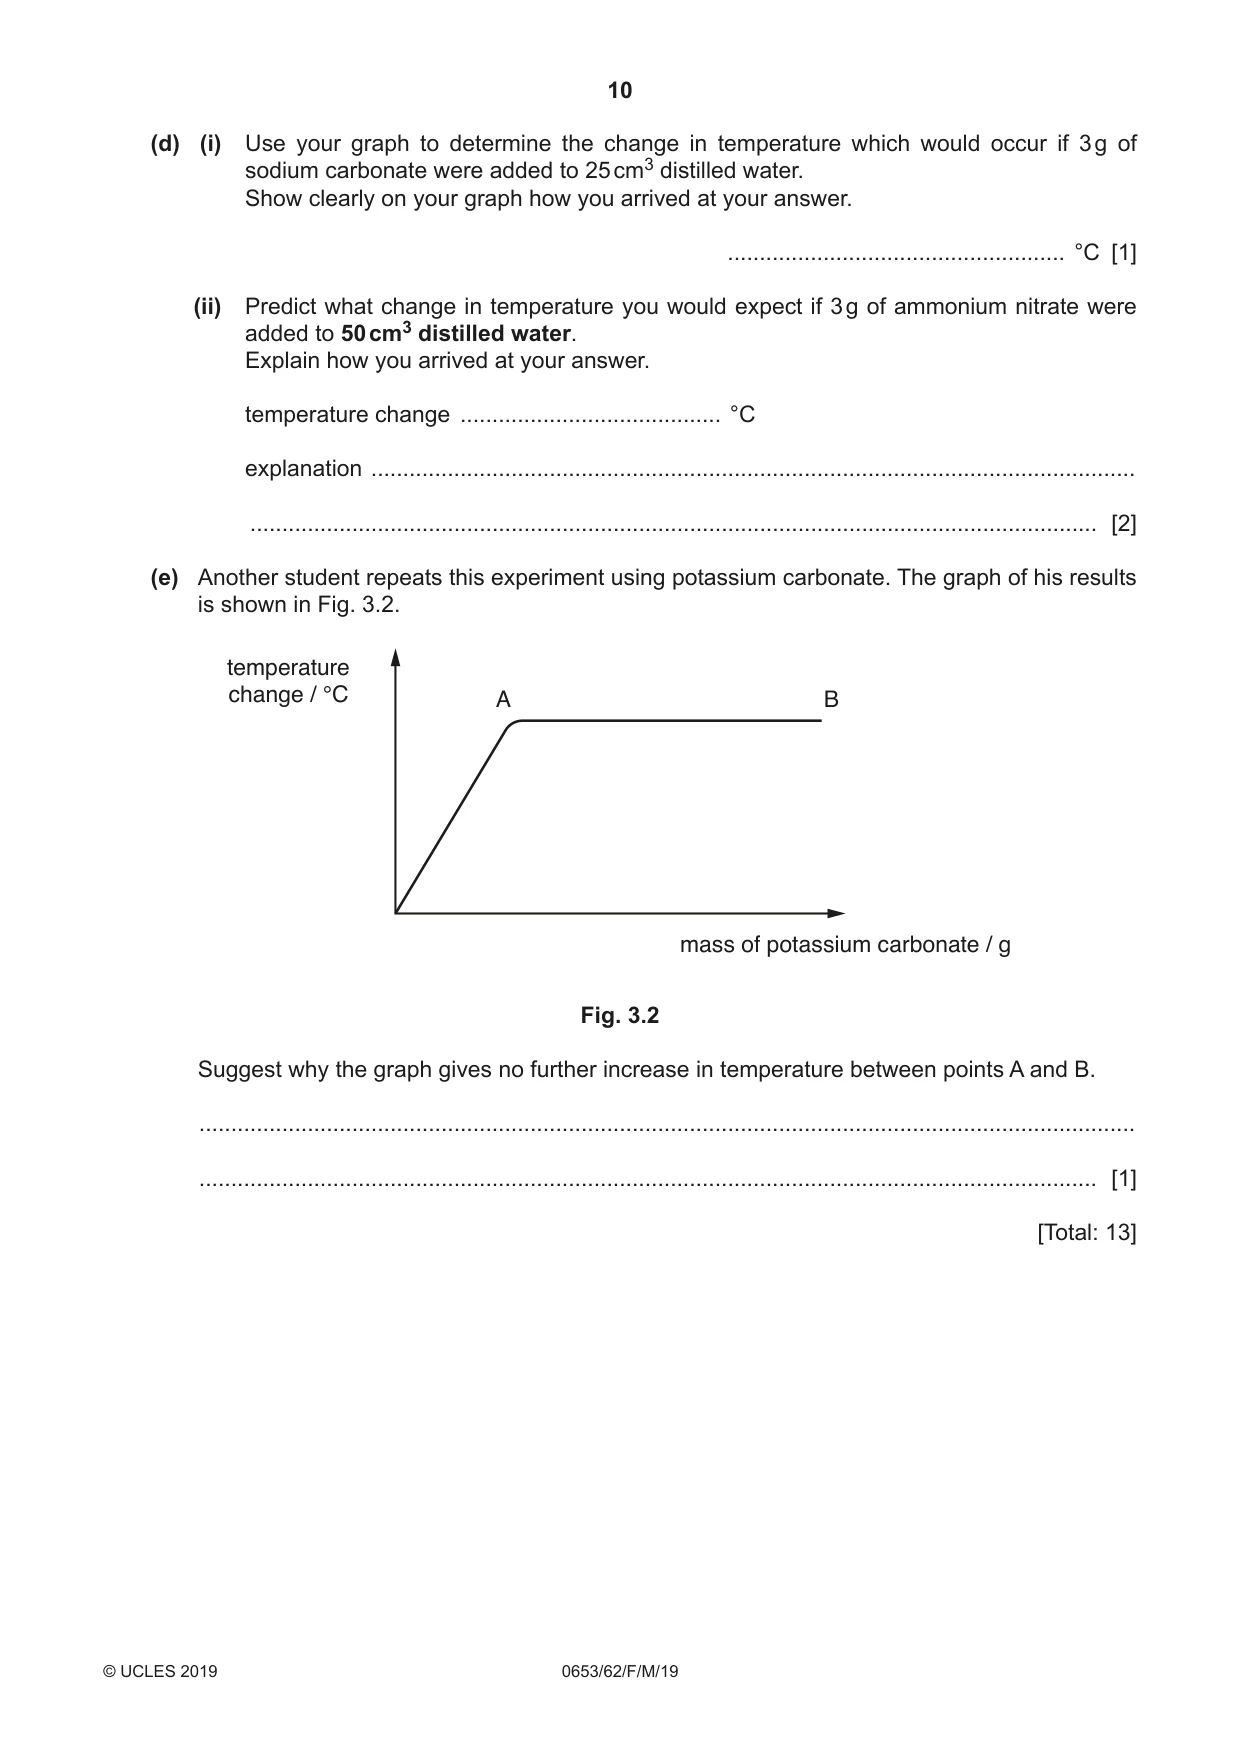
3 A student investigates the change in temperature which occurs when sodium carbonate and ammonium nitrate dissolve in water. (a) • She places 25 cm3 distilled water into a polystyrene cup. • She measures the temperature of the water and records this initial temperature in Table 3.1. • She adds 2 g of sodium carbonate and stirs the mixture. • She measures the highest or lowest temperature reached and records it in Table 3.1. • She washes out the polystyrene cup. • She repeats the experiment using 4 g and then 5 g of sodium carbonate. • She repeats the experiment using 2 g, then 4 g and then 5 g of ammonium nitrate recording the temperatures in Table 3.2. Table 3.1 mass sodium initial highest or lowest change in carbonate / g temperature / °C temperature / °C temperature / °C 2 20.0 25.0 4 20.5 5 19.5 34.5 Table 3.2 mass initial highest or lowest change in ammonium temperature / °C temperature / °C temperature nitrate / g / °C 2 20.5 4 20.0 12.0 5 20.0 (i) Fig. 3.1 shows the thermometer scales for the highest or lowest temperature reached for 4 g sodium carbonate, 2 g ammonium nitrate and 5 g ammonium nitrate. Read the temperatures to the nearest 0.5 °C and record them in Tables 3.1 and 3.2. [3] °C °C °C 20 20 10 30 10 20 4 g 2 g 5 g sodium carbonate ammonium nitrate ammonium nitrate Fig. 3.1 (ii) Calculate the change in temperature for each experiment. Record these values, to the nearest 0.5 °C in Table 3.1 and Table 3.2. Put a + sign before the values for an increase in temperature and a – sign before the values for a decrease in temperature. [1] (b) Stirring the mixture helps the solid to dissolve. Give one other reason why the mixture is stirred. ................................................................................................................................................... ............................................................................................................................................. [1] (d) (i) Use your graph to determine the change in temperature which would occur if 3 g of sodium carbonate were added to 25 cm3 distilled water. Show clearly on your graph how you arrived at your answer. ..................................................... °C [1] (ii) Predict what change in temperature you would expect if 3 g of ammonium nitrate were added to 50 cm3 distilled water. Explain how you arrived at your answer. temperature change ......................................... °C explanation ........................................................................................................................ ..................................................................................................................................... [2] (e) Another student repeats this experiment using potassium carbonate. The graph of his results is shown in Fig. 3.2. temperature change / °C A B mass of potassium carbonate / g Fig. 3.2 Suggest why the graph gives no further increase in temperature between points A and B. ................................................................................................................................................... ............................................................................................................................................. [1] [Total: 13]
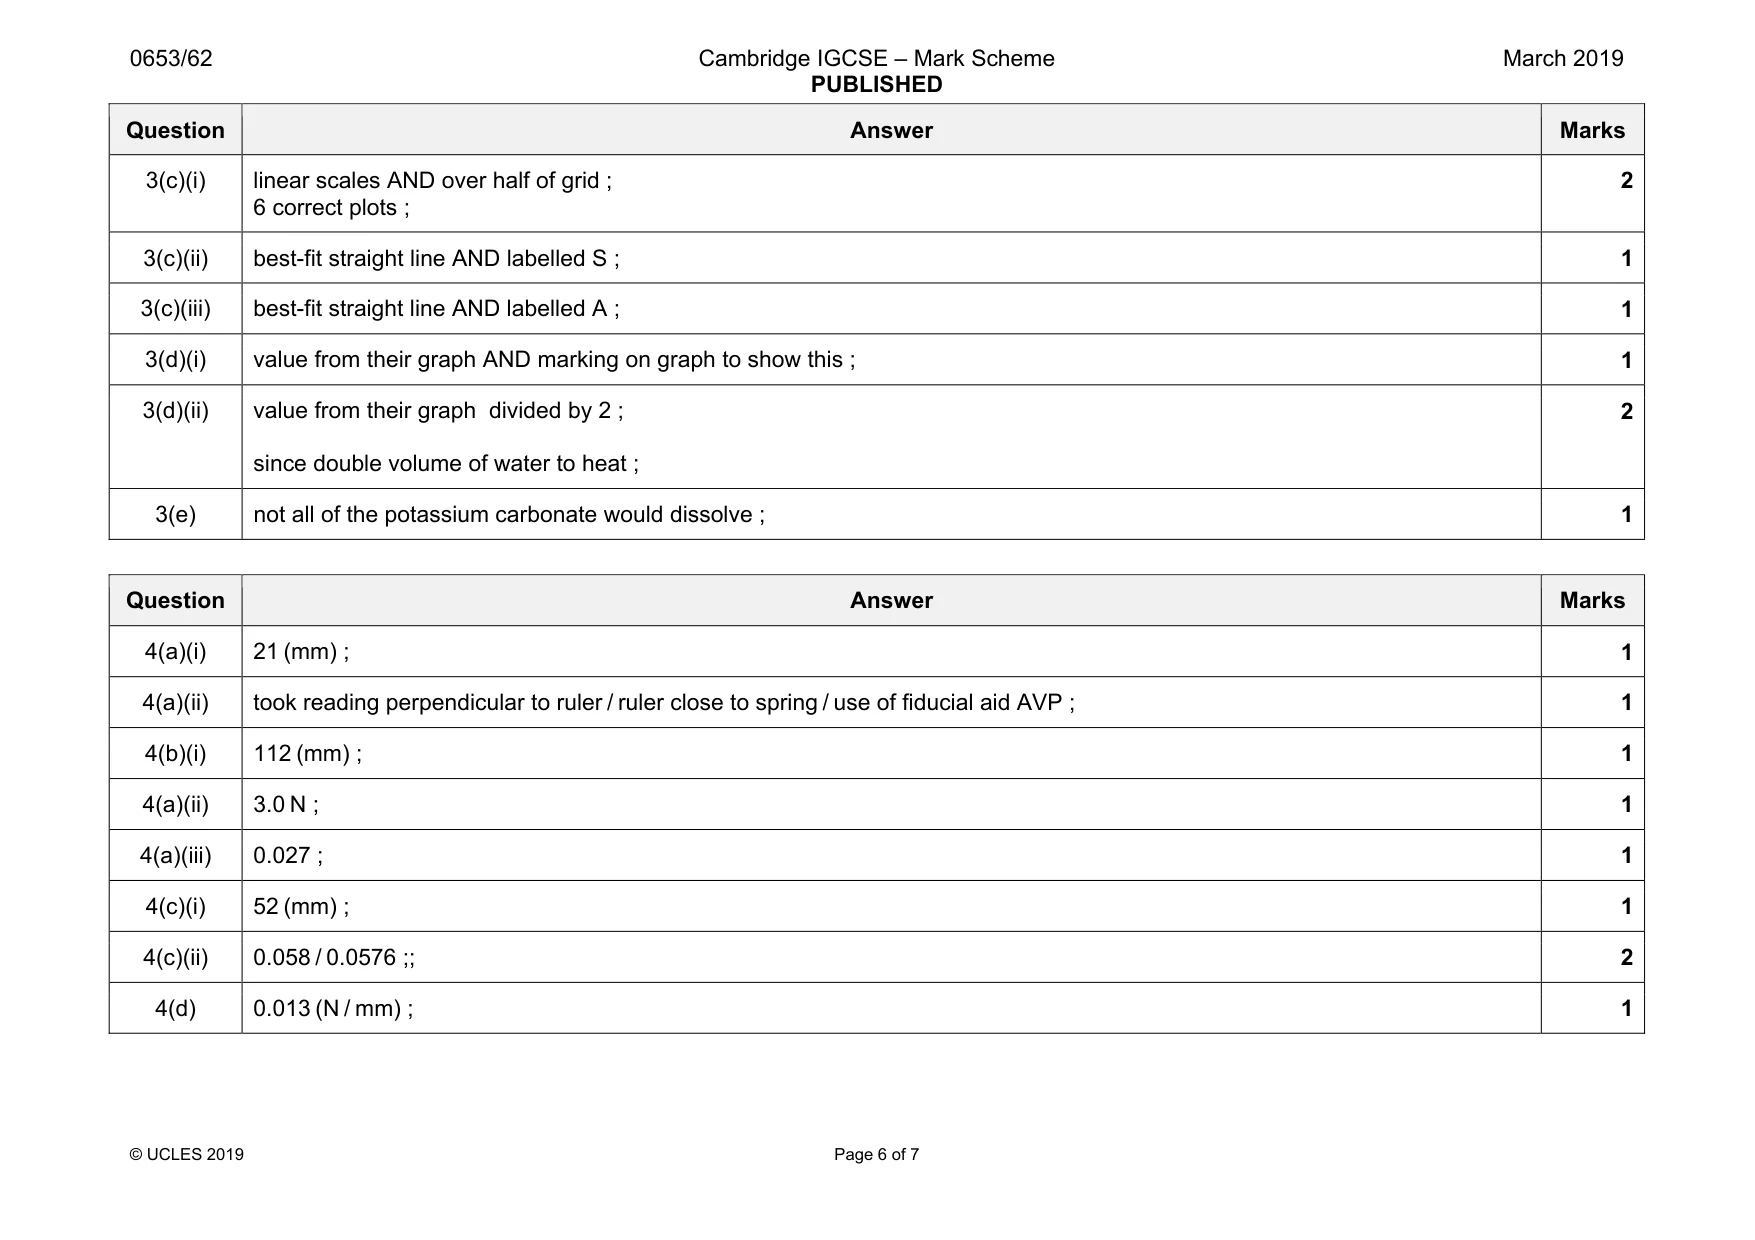
Mark scheme: 3(a)(i) 30.0 ; 16.5 ; 10.0 ; 3 3(a)(ii) all 6 changes subtracted correctly AND correct sign ; 1 3(b) to get even temperature throughout ; 1 Question Answer Marks 3(c)(i) linear scales AND over half of grid ; 6 correct plots ; 2 3(c)(ii) best-fit straight line AND labelled S ; 1 3(c)(iii) best-fit straight line AND labelled A ; 1 3(d)(i) value from their graph AND marking on graph to show this ; 1 3(d)(ii) value from their graph divided by 2 ; since double volume of water to heat ; 2 3(e) not all of the potassium carbonate would dissolve ; 1
Q4 · A student investigates the spring constant of different combinations of identical springs
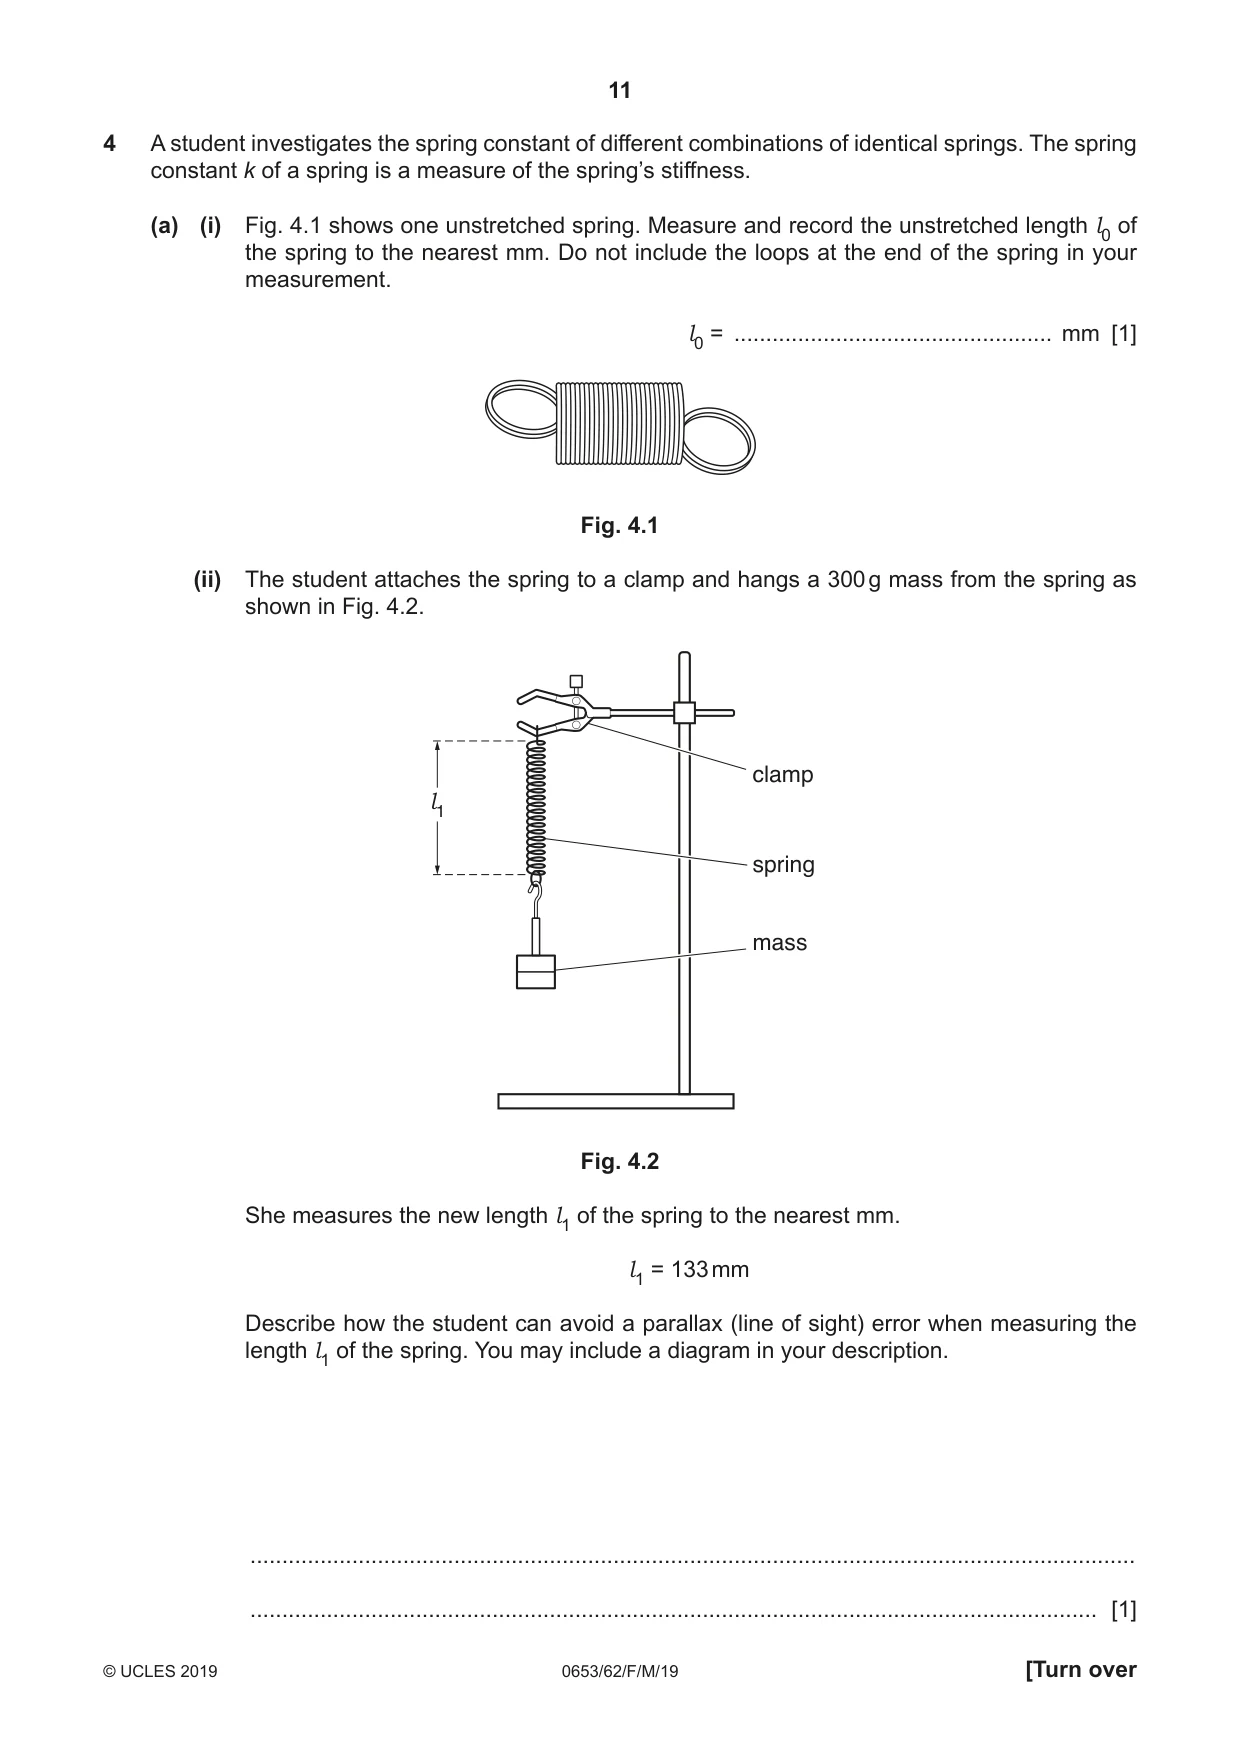
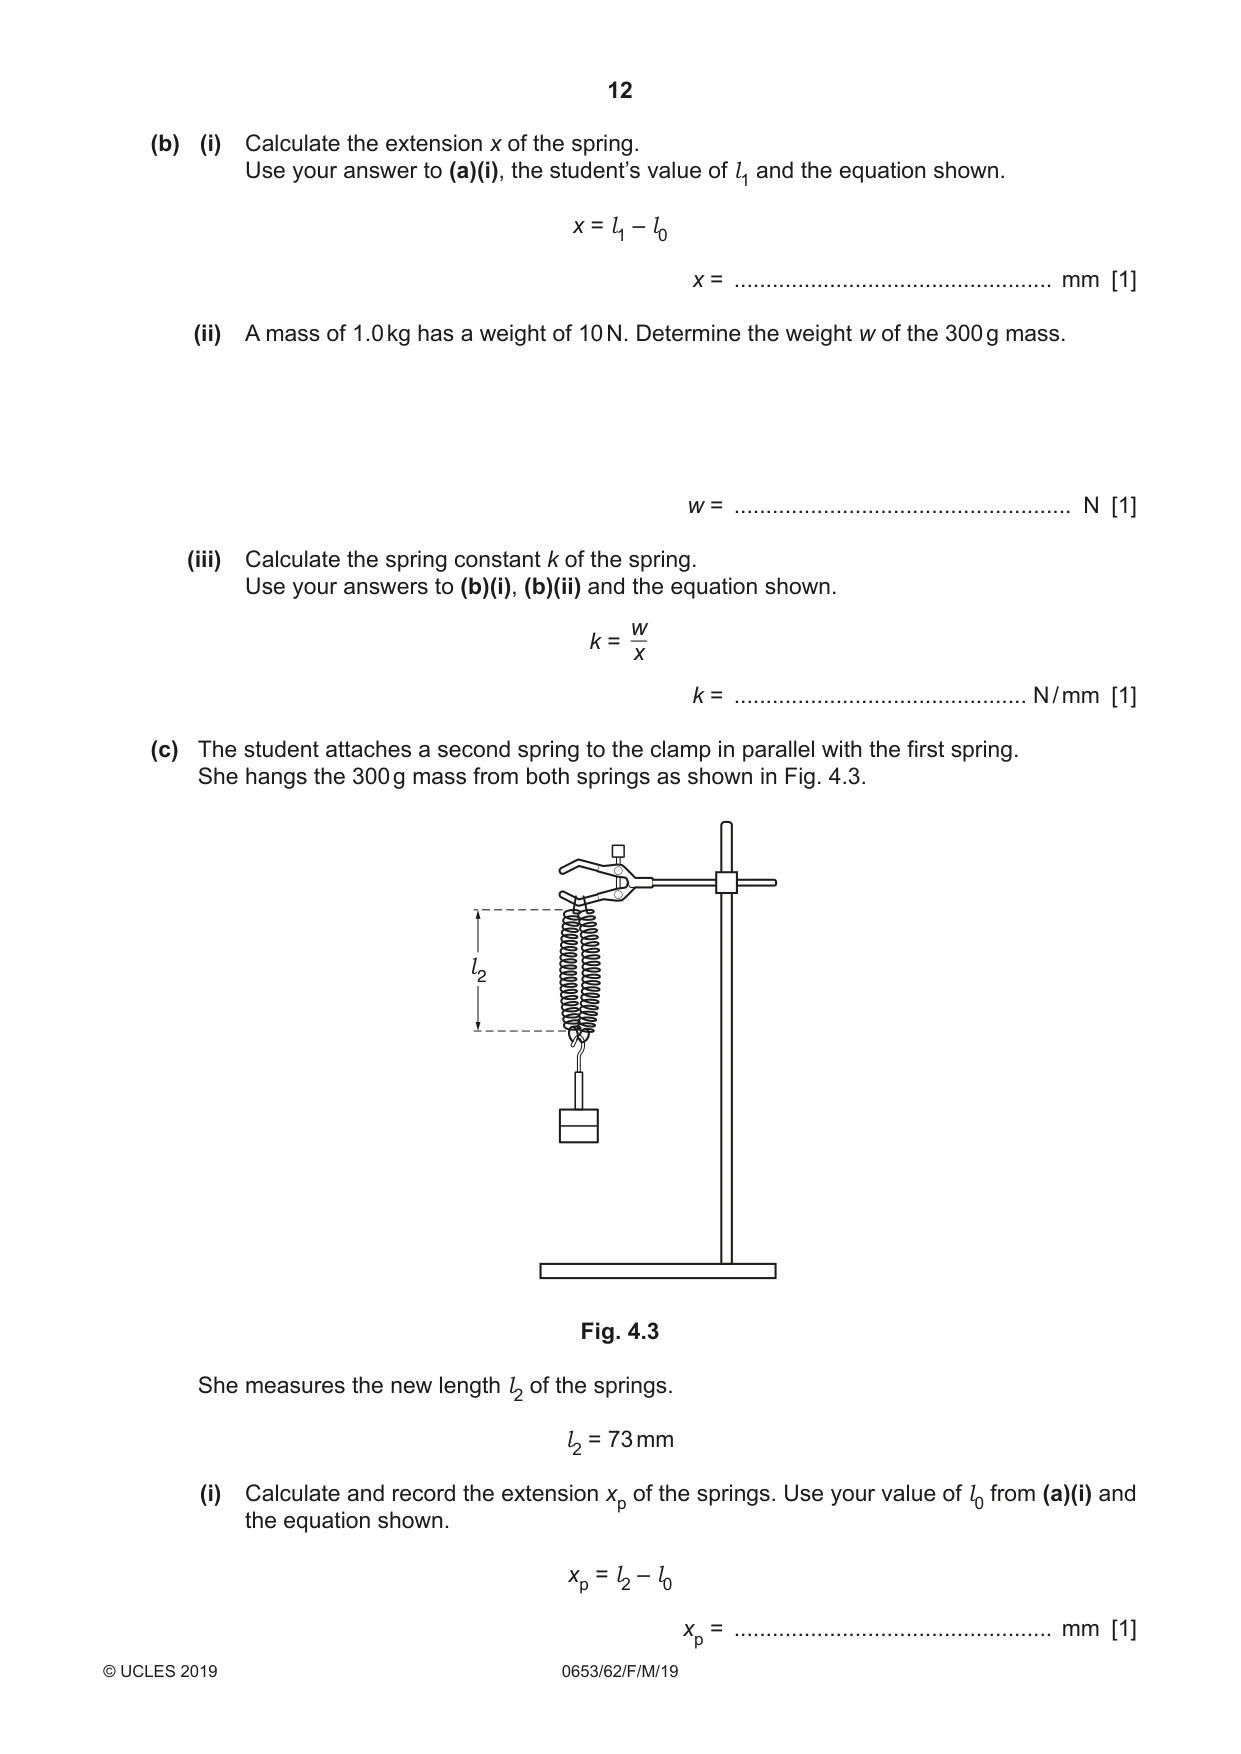
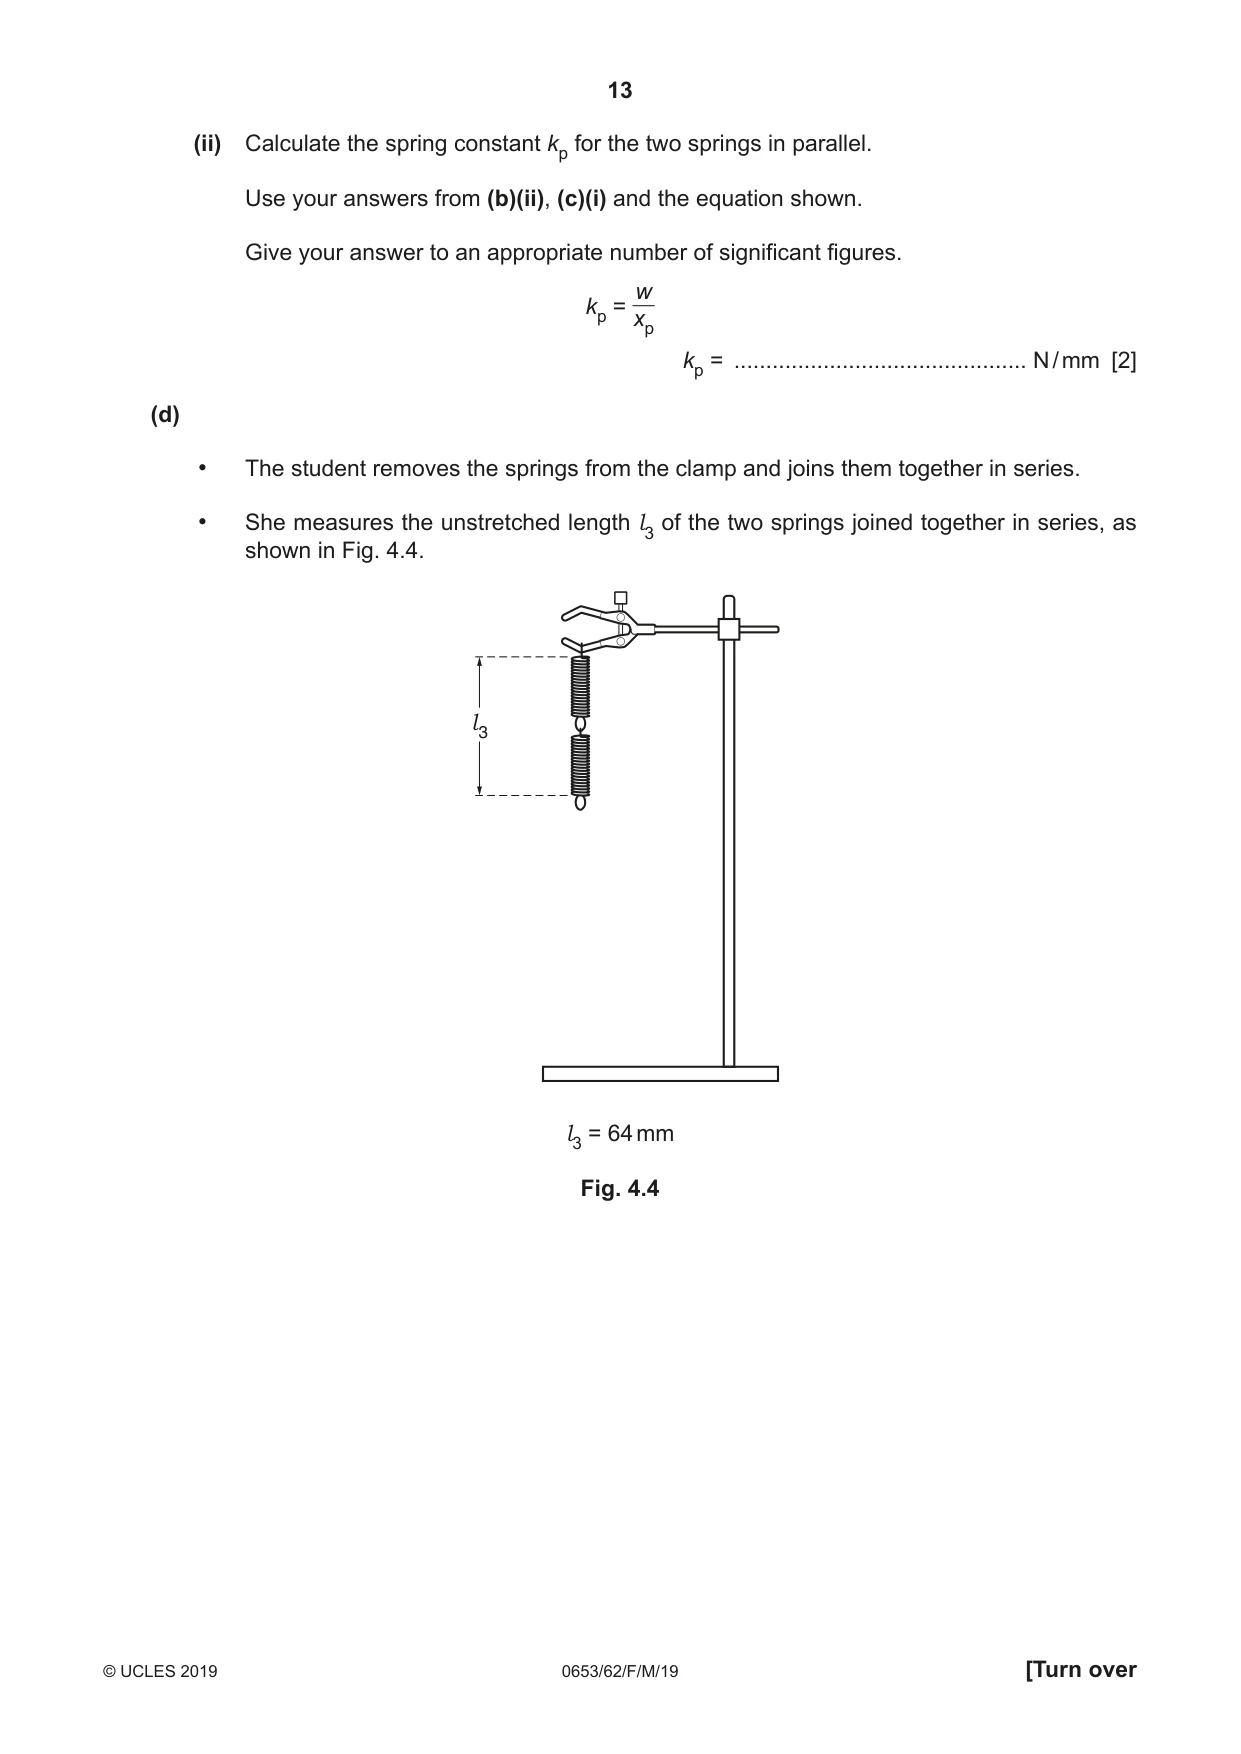
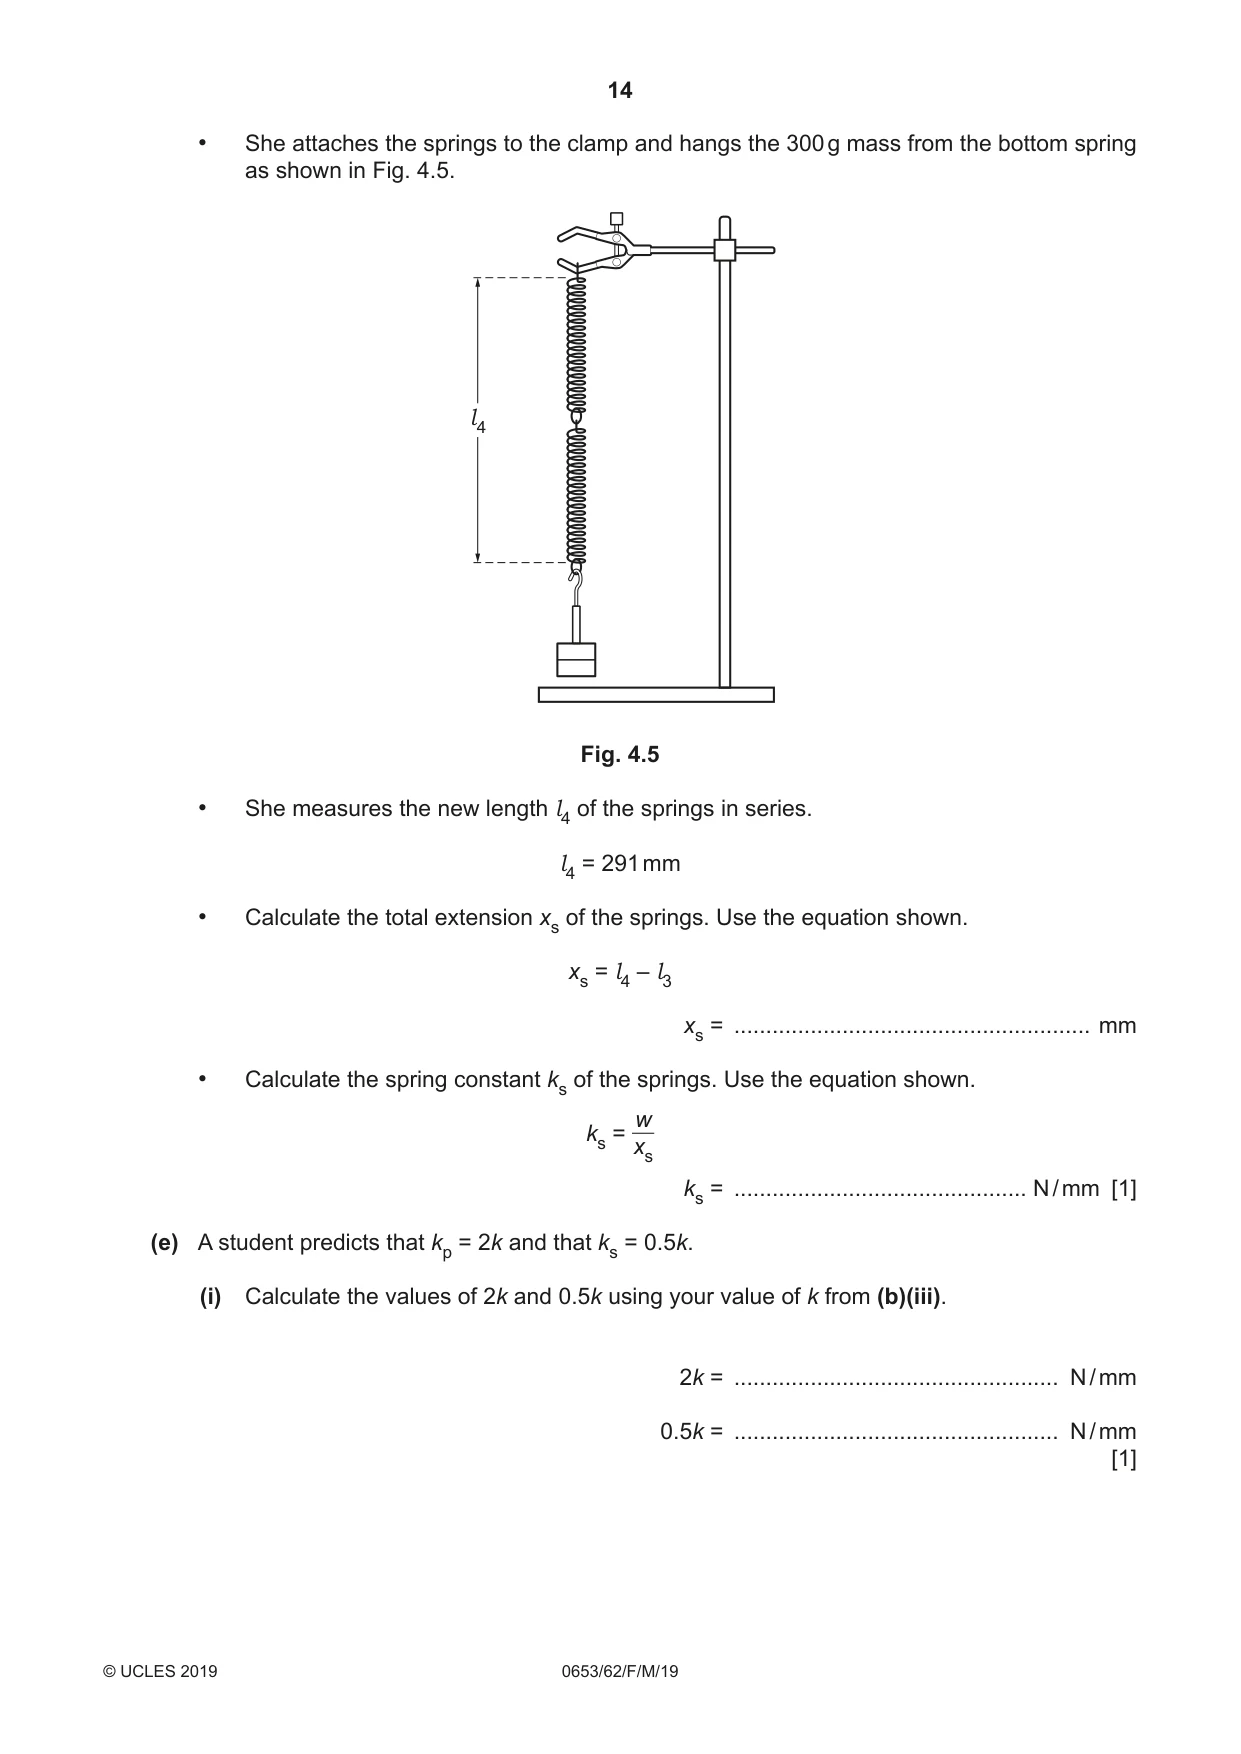
4 A student investigates the spring constant of different combinations of identical springs. The spring constant k of a spring is a measure of the spring’s stiffness. (a) (i) Fig. 4.1 shows one unstretched spring. Measure and record the unstretched length l0 of the spring to the nearest mm. Do not include the loops at the end of the spring in your measurement. l0 = .................................................. mm [1] Fig. 4.1 (ii) The student attaches the spring to a clamp and hangs a 300 g mass from the spring as shown in Fig. 4.2. clamp l1 spring mass Fig. 4.2 She measures the new length l1 of the spring to the nearest mm. l1 = 133 mm Describe how the student can avoid a parallax (line of sight) error when measuring the length l1 of the spring. You may include a diagram in your description. ........................................................................................................................................... ..................................................................................................................................... [1] (b) (i) Calculate the extension x of the spring. Use your answer to (a)(i), the student’s value of l1 and the equation shown. x = l1 – l0 x = .................................................. mm [1] (ii) A mass of 1.0 kg has a weight of 10 N. Determine the weight w of the 300 g mass. w = ..................................................... N [1] (iii) Calculate the spring constant k of the spring. Use your answers to (b)(i), (b)(ii) and the equation shown. w k = x k = .............................................. N / mm [1] (c) The student attaches a second spring to the clamp in parallel with the first spring. She hangs the 300 g mass from both springs as shown in Fig. 4.3. l2 Fig. 4.3 She measures the new length l2 of the springs. l2 = 73 mm (i) Calculate and record the extension xp of the springs. Use your value of l0 from (a)(i) and the equation shown. xp = l2 – l0 xp = .................................................. mm [1] (ii) Calculate the spring constant kp for the two springs in parallel. Use your answers from (b)(ii), (c)(i) and the equation shown. Give your answer to an appropriate number of significant figures. w kp = xp kp = .............................................. N / mm [2] (d) • The student removes the springs from the clamp and joins them together in series. • She measures the unstretched length l3 of the two springs joined together in series, as shown in Fig. 4.4. l3 l3 = 64 mm Fig. 4.4
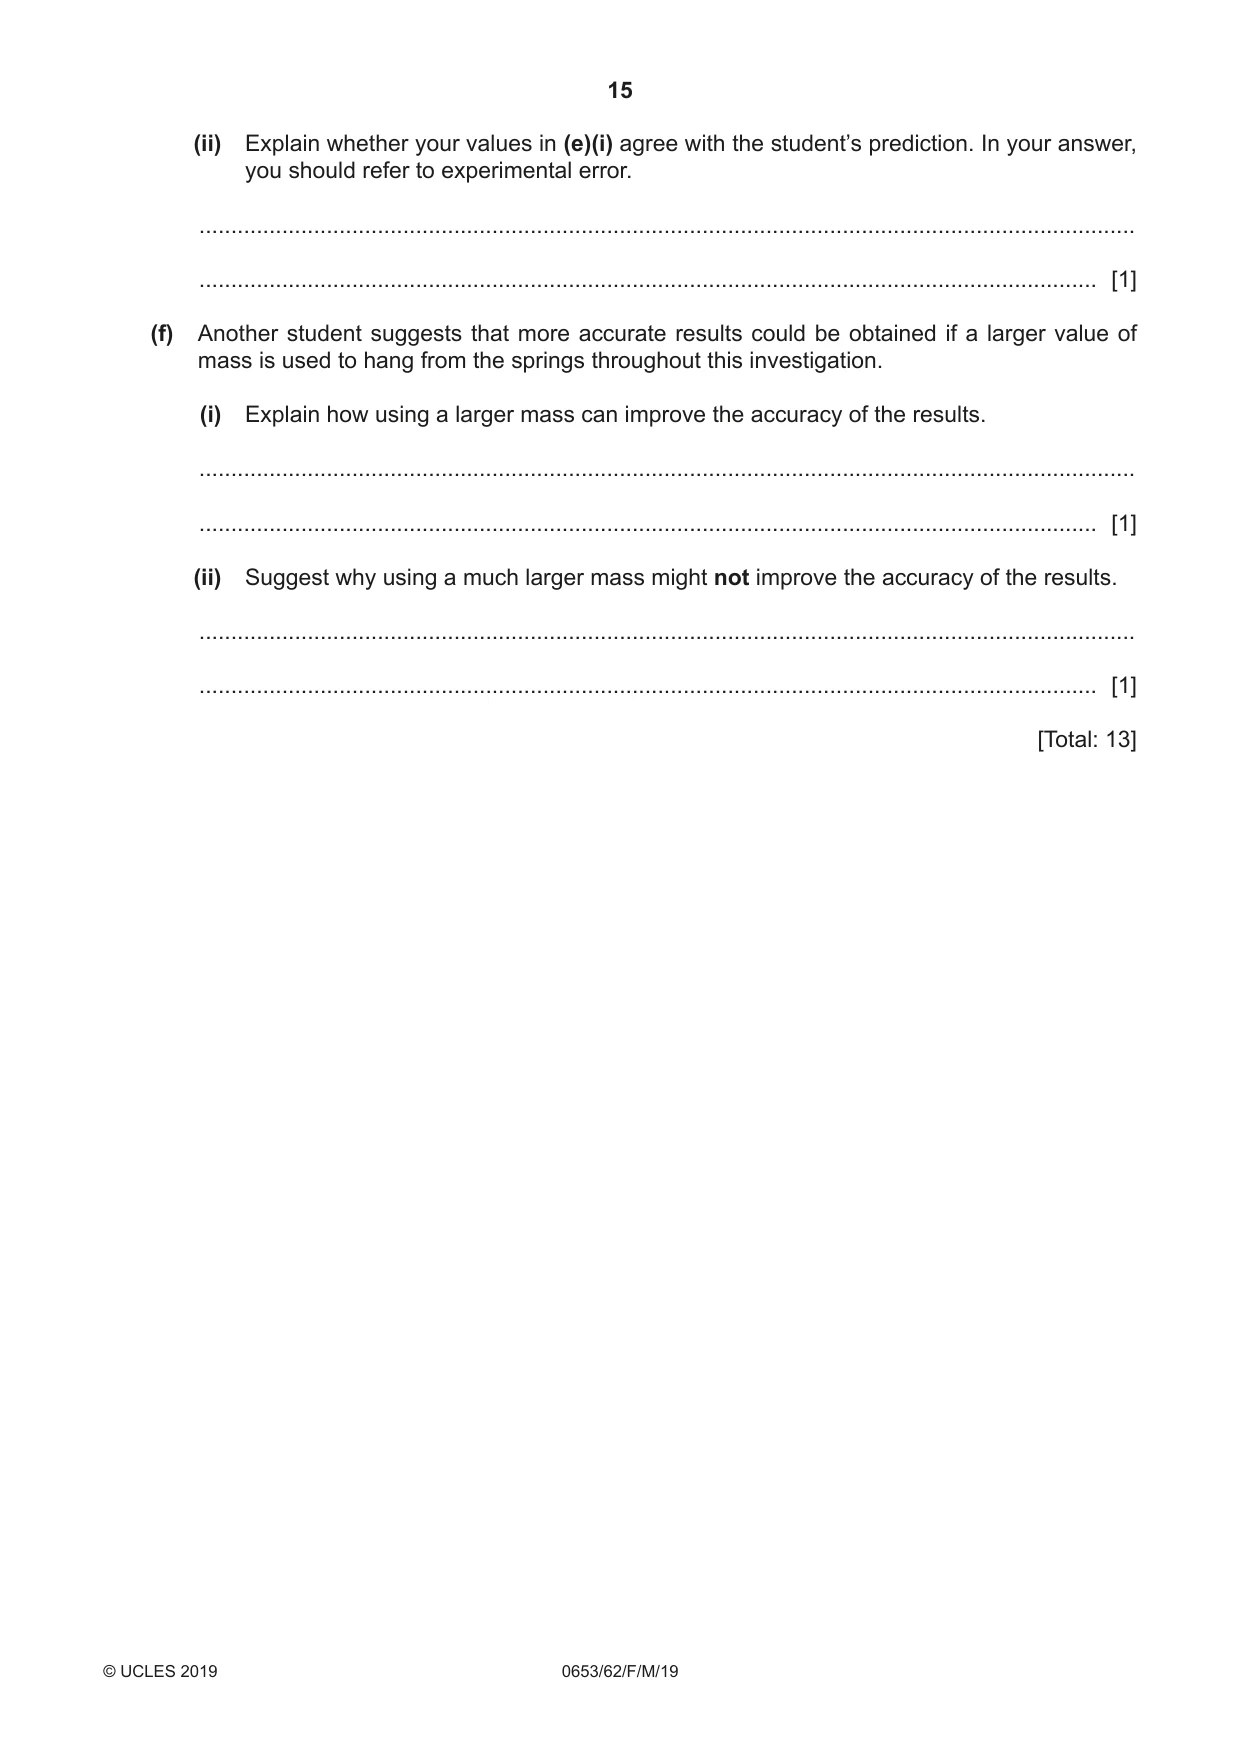
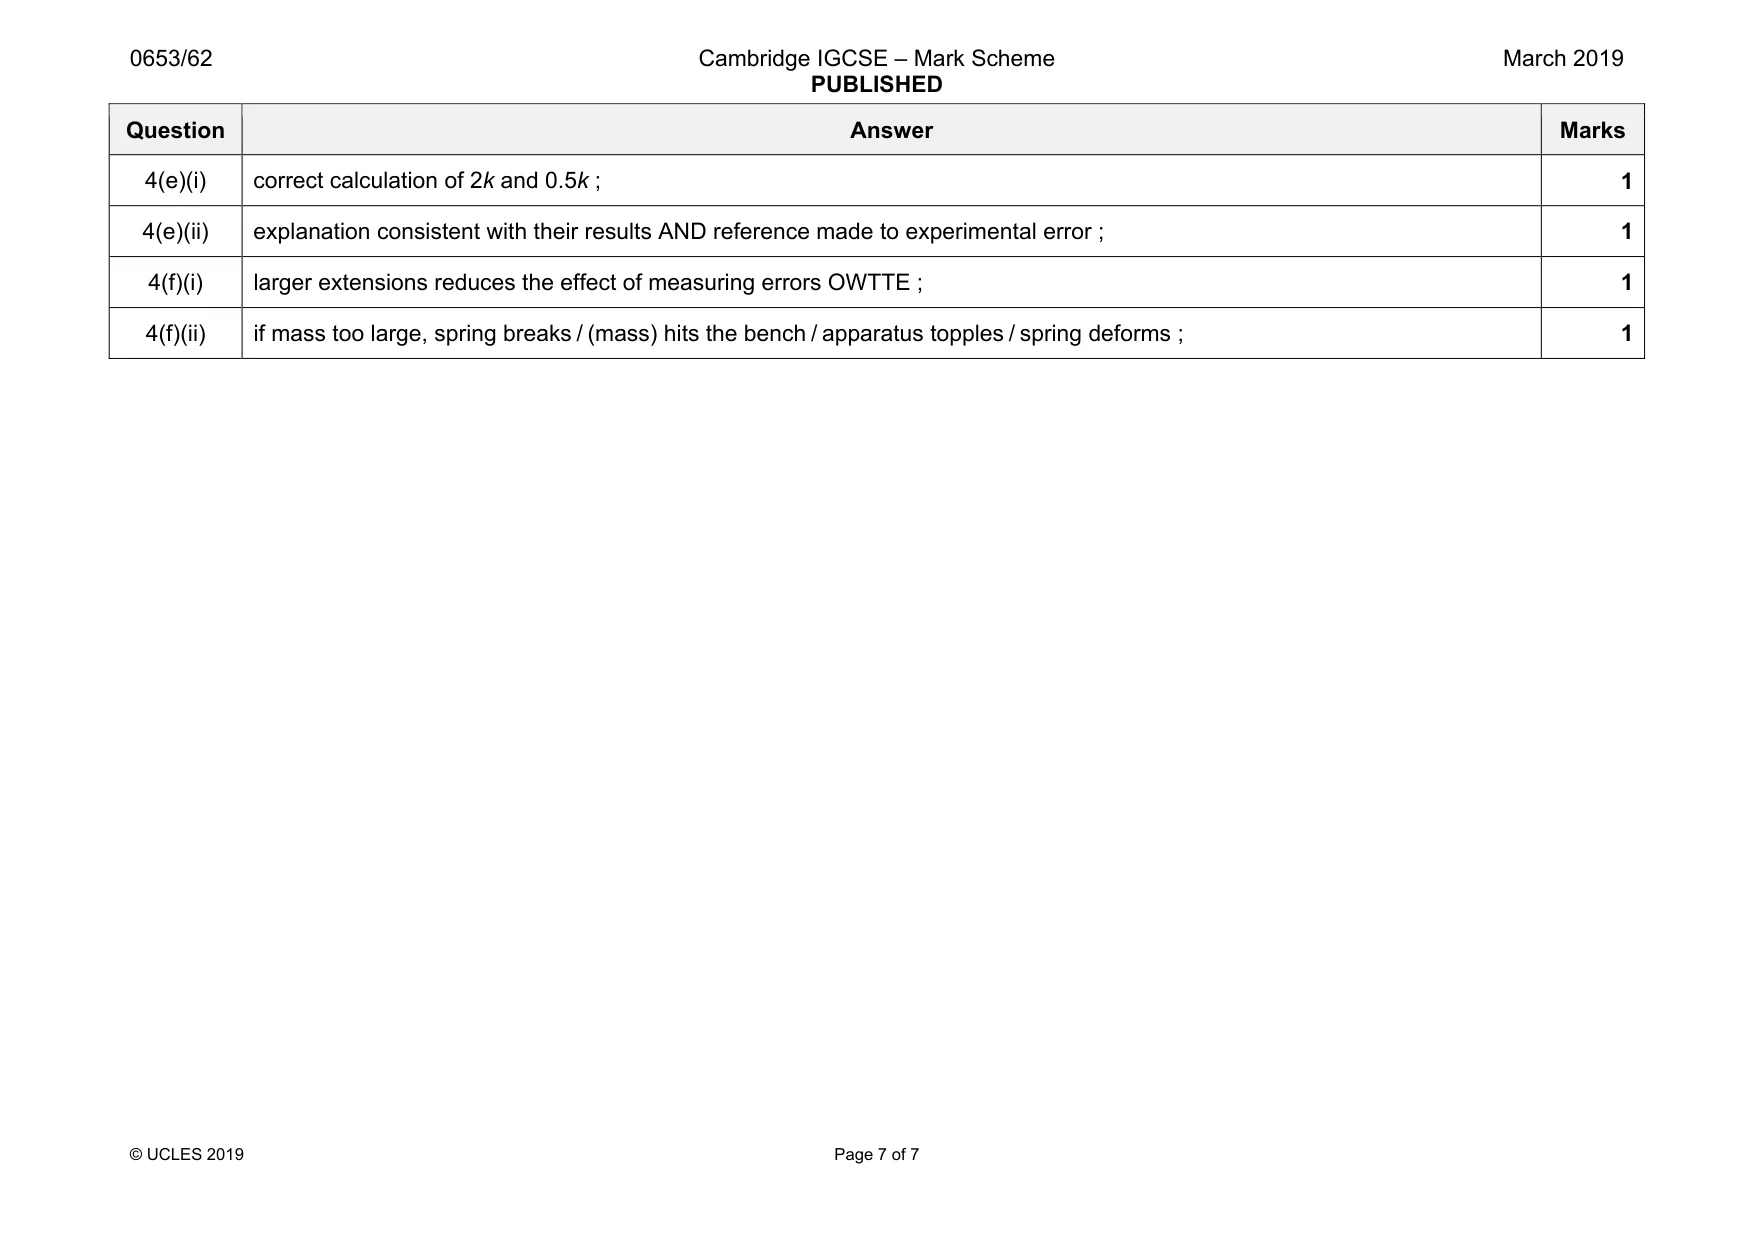
Mark scheme: 4(a)(i) 21 (mm) ; 1 4(a)(ii) took reading perpendicular to ruler / ruler close to spring / use of fiducial aid AVP ; 1 4(b)(i) 112 (mm) ; 1 4(a)(ii) 3.0 N ; 1 4(a)(iii) 0.027 ; 1 4(c)(i) 52 (mm) ; 1 4(c)(ii) 0.058 / 0.0576 ;; 2 4(d) 0.013 (N / mm) ; 1 Question Answer Marks 4(e)(i) correct calculation of 2k and 0.5k ; 1 4(e)(ii) explanation consistent with their results AND reference made to experimental error ; 1 4(f)(i) larger extensions reduces the effect of measuring errors OWTTE ; 1 4(f)(ii) if mass too large, spring breaks / (mass) hits the bench / apparatus topples / spring deforms ; 1
More questions on Physical quantities and measurement techniques
What was in this paper
The subtopics covered by these 4 questions, and how many questions each got. Open one in a new tab to see every Cambridge question on it.
What you needed in this session
Cambridge’s own grade thresholds for 2019 Feb/March, Paper 6 · Variant 2. A higher threshold means an easier paper — the bar moves with how the cohort did.