Cambridge IGCSE Science - Combined 0653 — 2018 Feb/March Paper 6 · Variant 2
0653/62/F/M/18 · 6 questions · 60 marks · ≈68 min
The question paper and its mark scheme, free to read here and free to download. This is Cambridge’s own paper, exactly as it was sat.
Question paper20 pages

Mark scheme7 pages
Answers below. Sit the paper first if you are practising.
Questions as text
Q1 · A student investigates the action of the enzyme amylase on starch
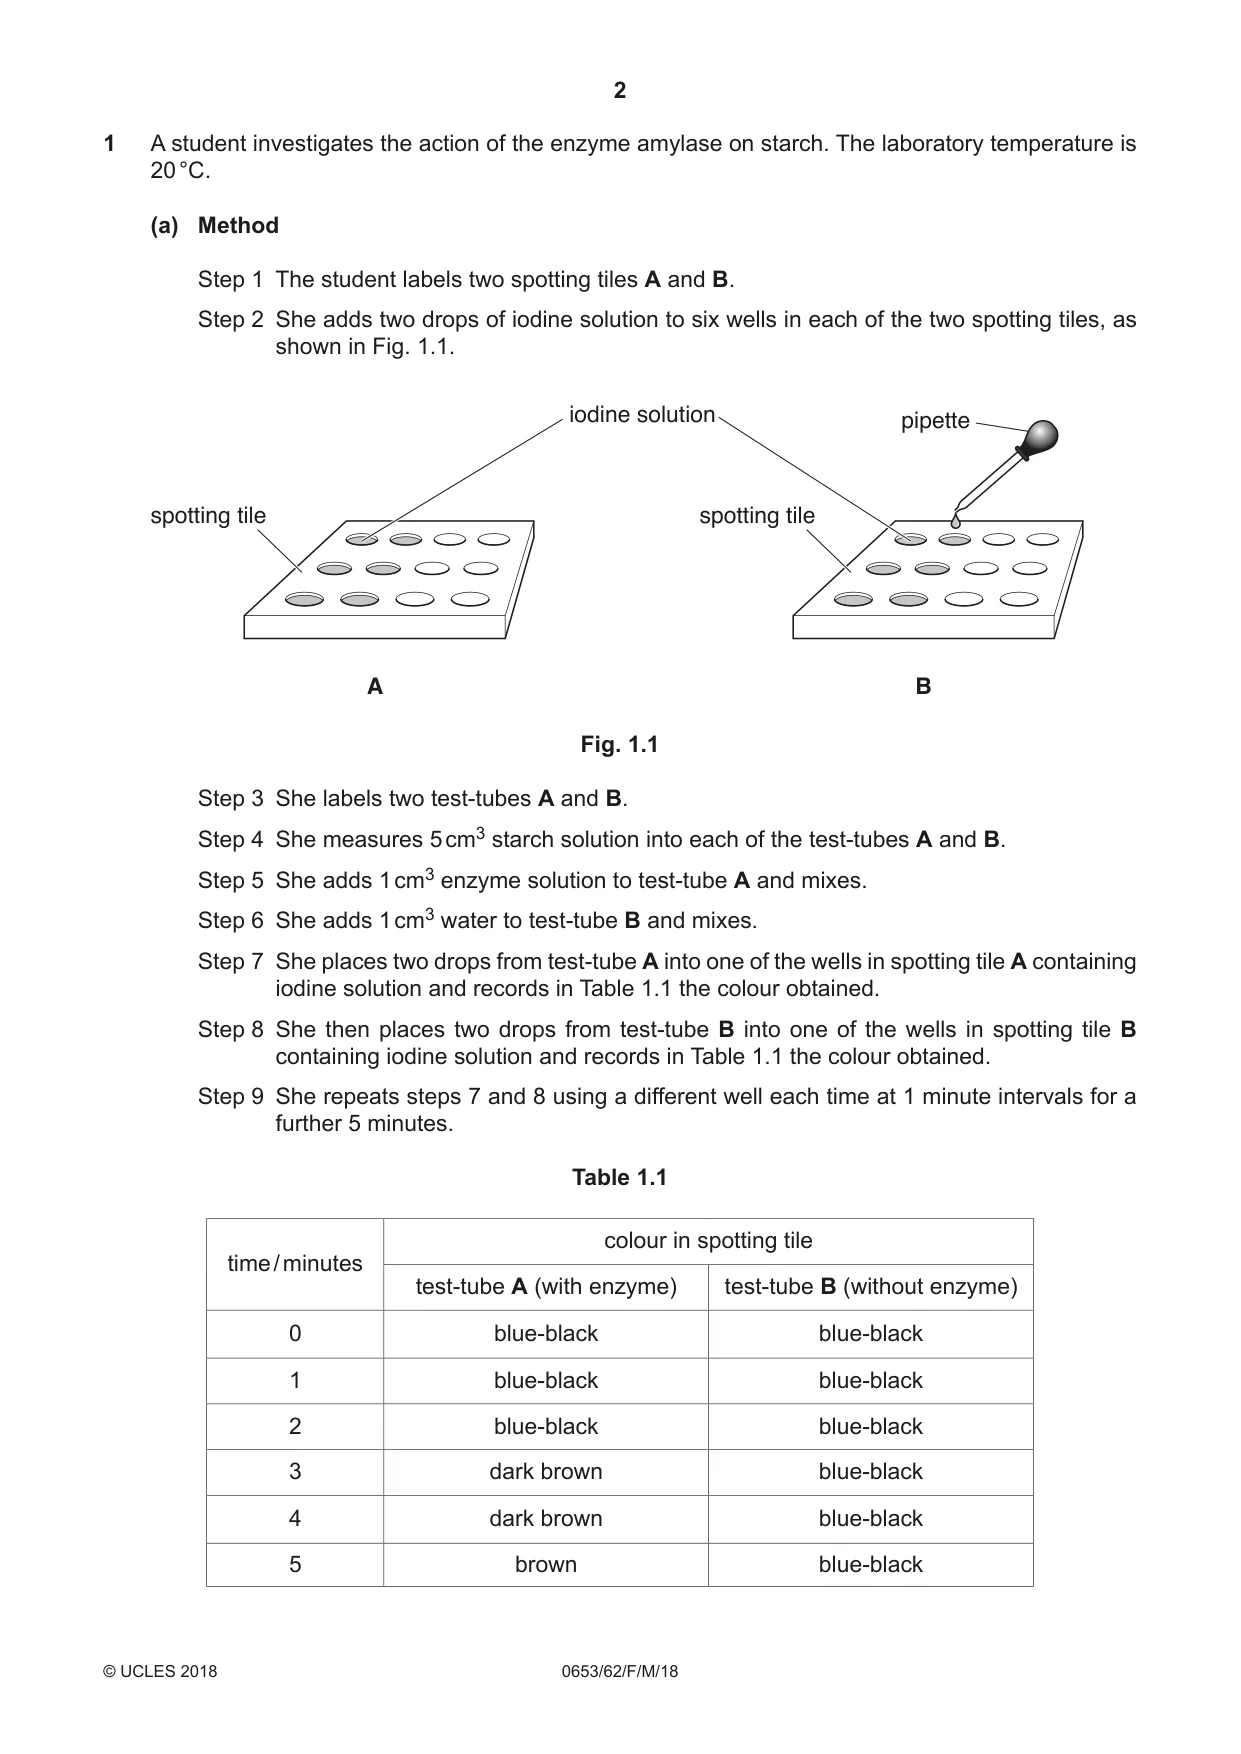
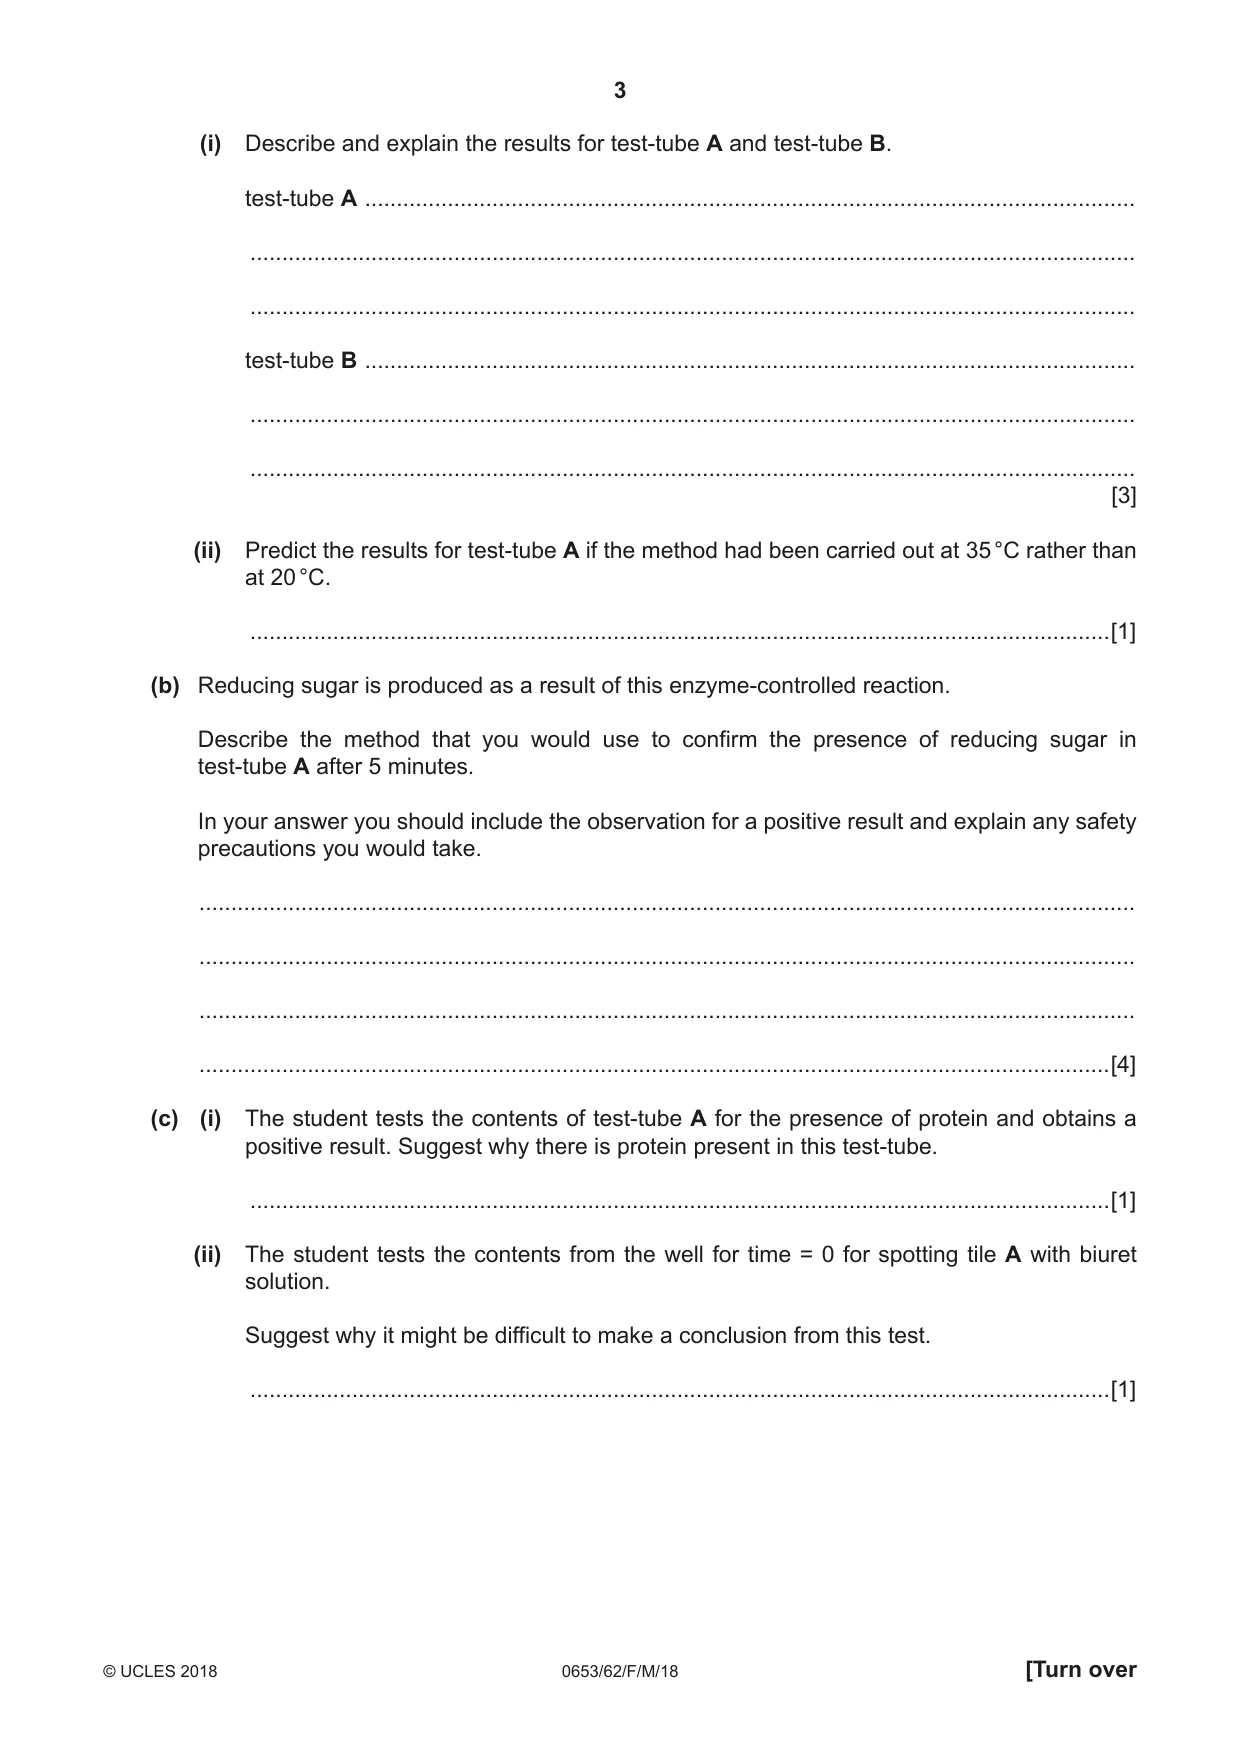
1 A student investigates the action of the enzyme amylase on starch. The laboratory temperature is 20 °C. (a) Method Step 1 The student labels two spotting tiles A and B. Step 2 She adds two drops of iodine solution to six wells in each of the two spotting tiles, as shown in Fig. 1.1. iodine solution pipette spotting tile spotting tile A B Fig. 1.1 Step 3 She labels two test-tubes A and B. Step 4 She measures 5 cm3 starch solution into each of the test-tubes A and B. Step 5 She adds 1 cm3 enzyme solution to test-tube A and mixes. Step 6 She adds 1 cm3 water to test-tube B and mixes. Step 7 She places two drops from test-tube A into one of the wells in spotting tile A containing iodine solution and records in Table 1.1 the colour obtained. Step 8 She then places two drops from test-tube B into one of the wells in spotting tile B containing iodine solution and records in Table 1.1 the colour obtained. Step 9 She repeats steps 7 and 8 using a different well each time at 1 minute intervals for a further 5 minutes. Table 1.1 colour in spotting tile time / minutes test-tube A (with enzyme) test-tube B (without enzyme) 0 blue-black blue-black 1 blue-black blue-black 2 blue-black blue-black 3 dark brown blue-black 4 dark brown blue-black 5 brown blue-black (i) Describe and explain the results for test-tube A and test-tube B. test-tube A ......................................................................................................................... ........................................................................................................................................... ........................................................................................................................................... test-tube B ......................................................................................................................... ........................................................................................................................................... ........................................................................................................................................... [3] (ii) Predict the results for test-tube A if the method had been carried out at 35 °C rather than at 20 °C. .......................................................................................................................................[1] (b) Reducing sugar is produced as a result of this enzyme-controlled reaction. Describe the method that you would use to confirm the presence of reducing sugar in test-tube A after 5 minutes. In your answer you should include the observation for a positive result and explain any safety precautions you would take. ................................................................................................................................................... ................................................................................................................................................... ................................................................................................................................................... ...............................................................................................................................................[4] (c) (i) The student tests the contents of test-tube A for the presence of protein and obtains a positive result. Suggest why there is protein present in this test-tube. .......................................................................................................................................[1] (ii) The student tests the contents from the well for time = 0 for spotting tile A with biuret solution. Suggest why it might be difficult to make a conclusion from this test. .......................................................................................................................................[1]
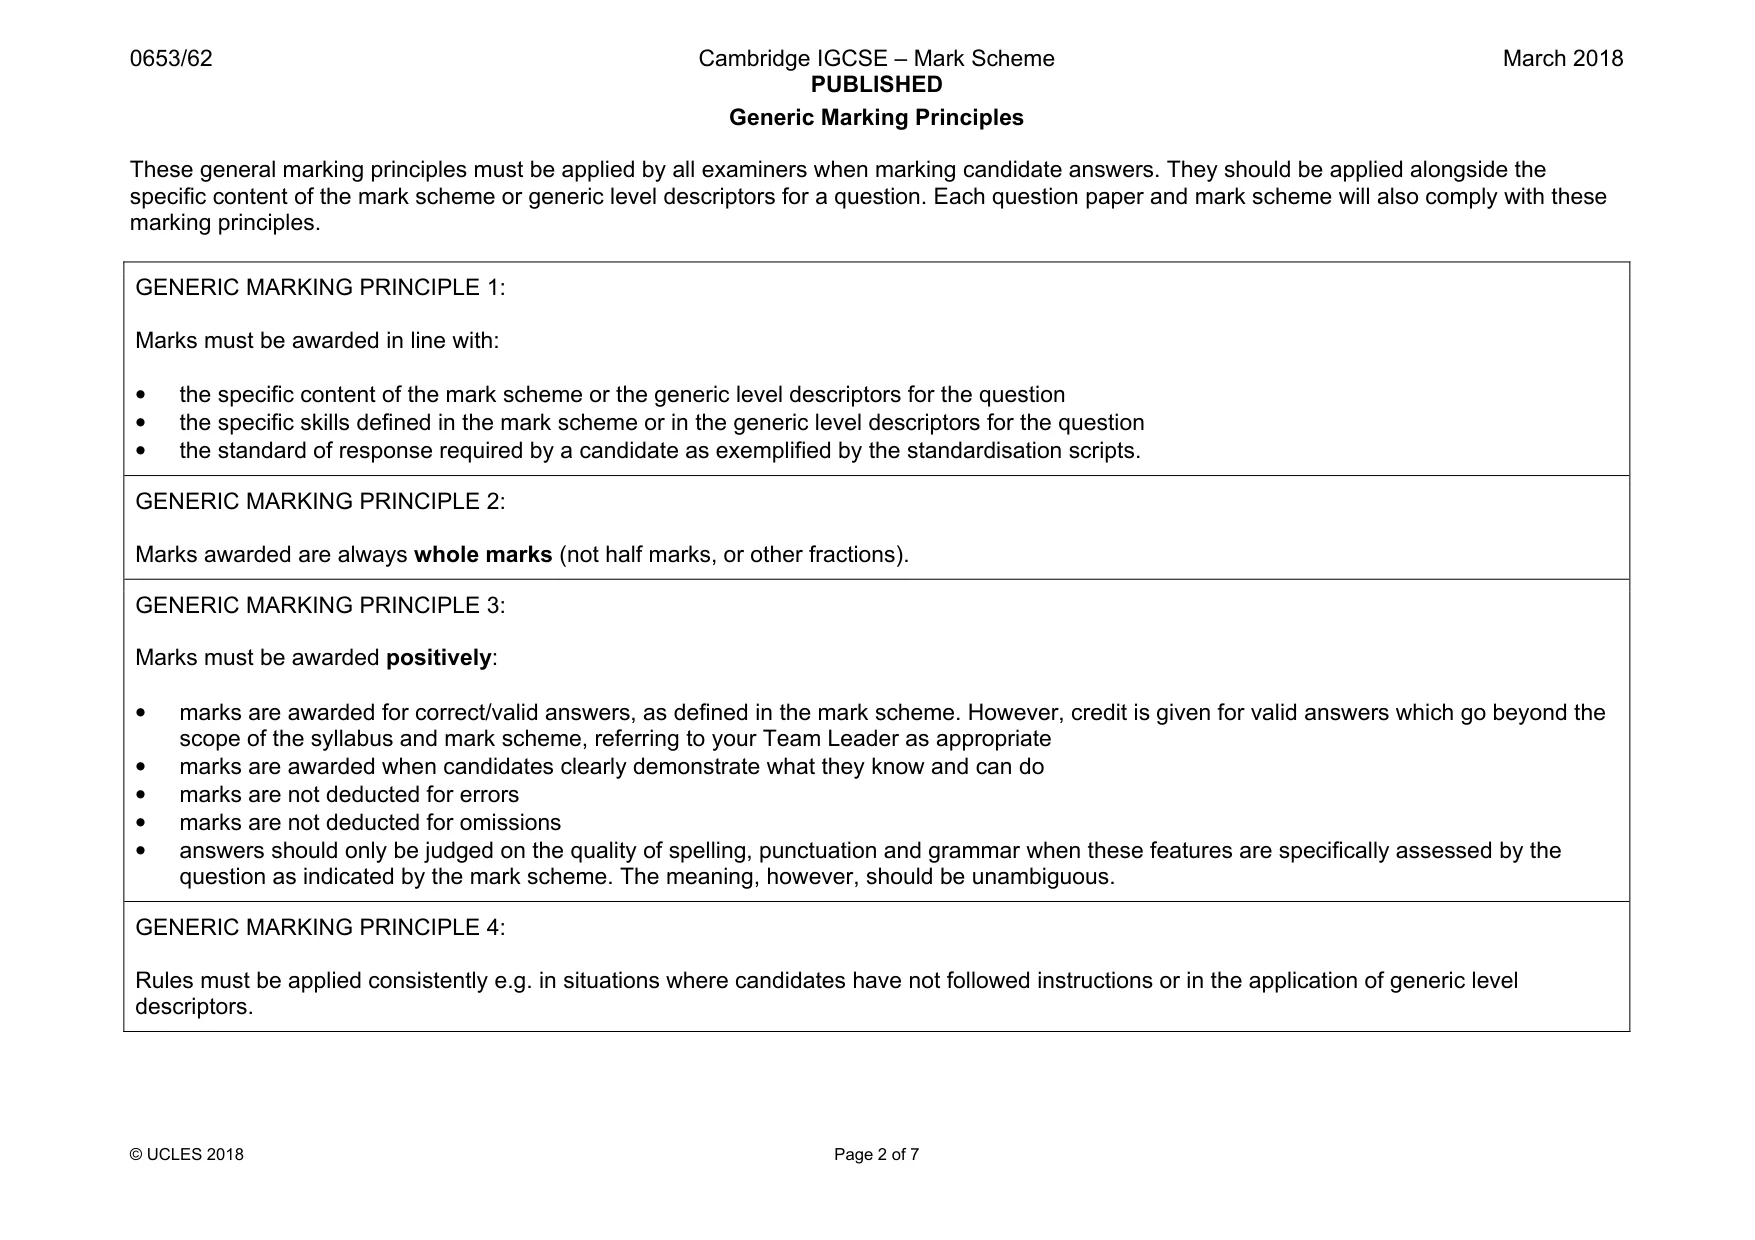
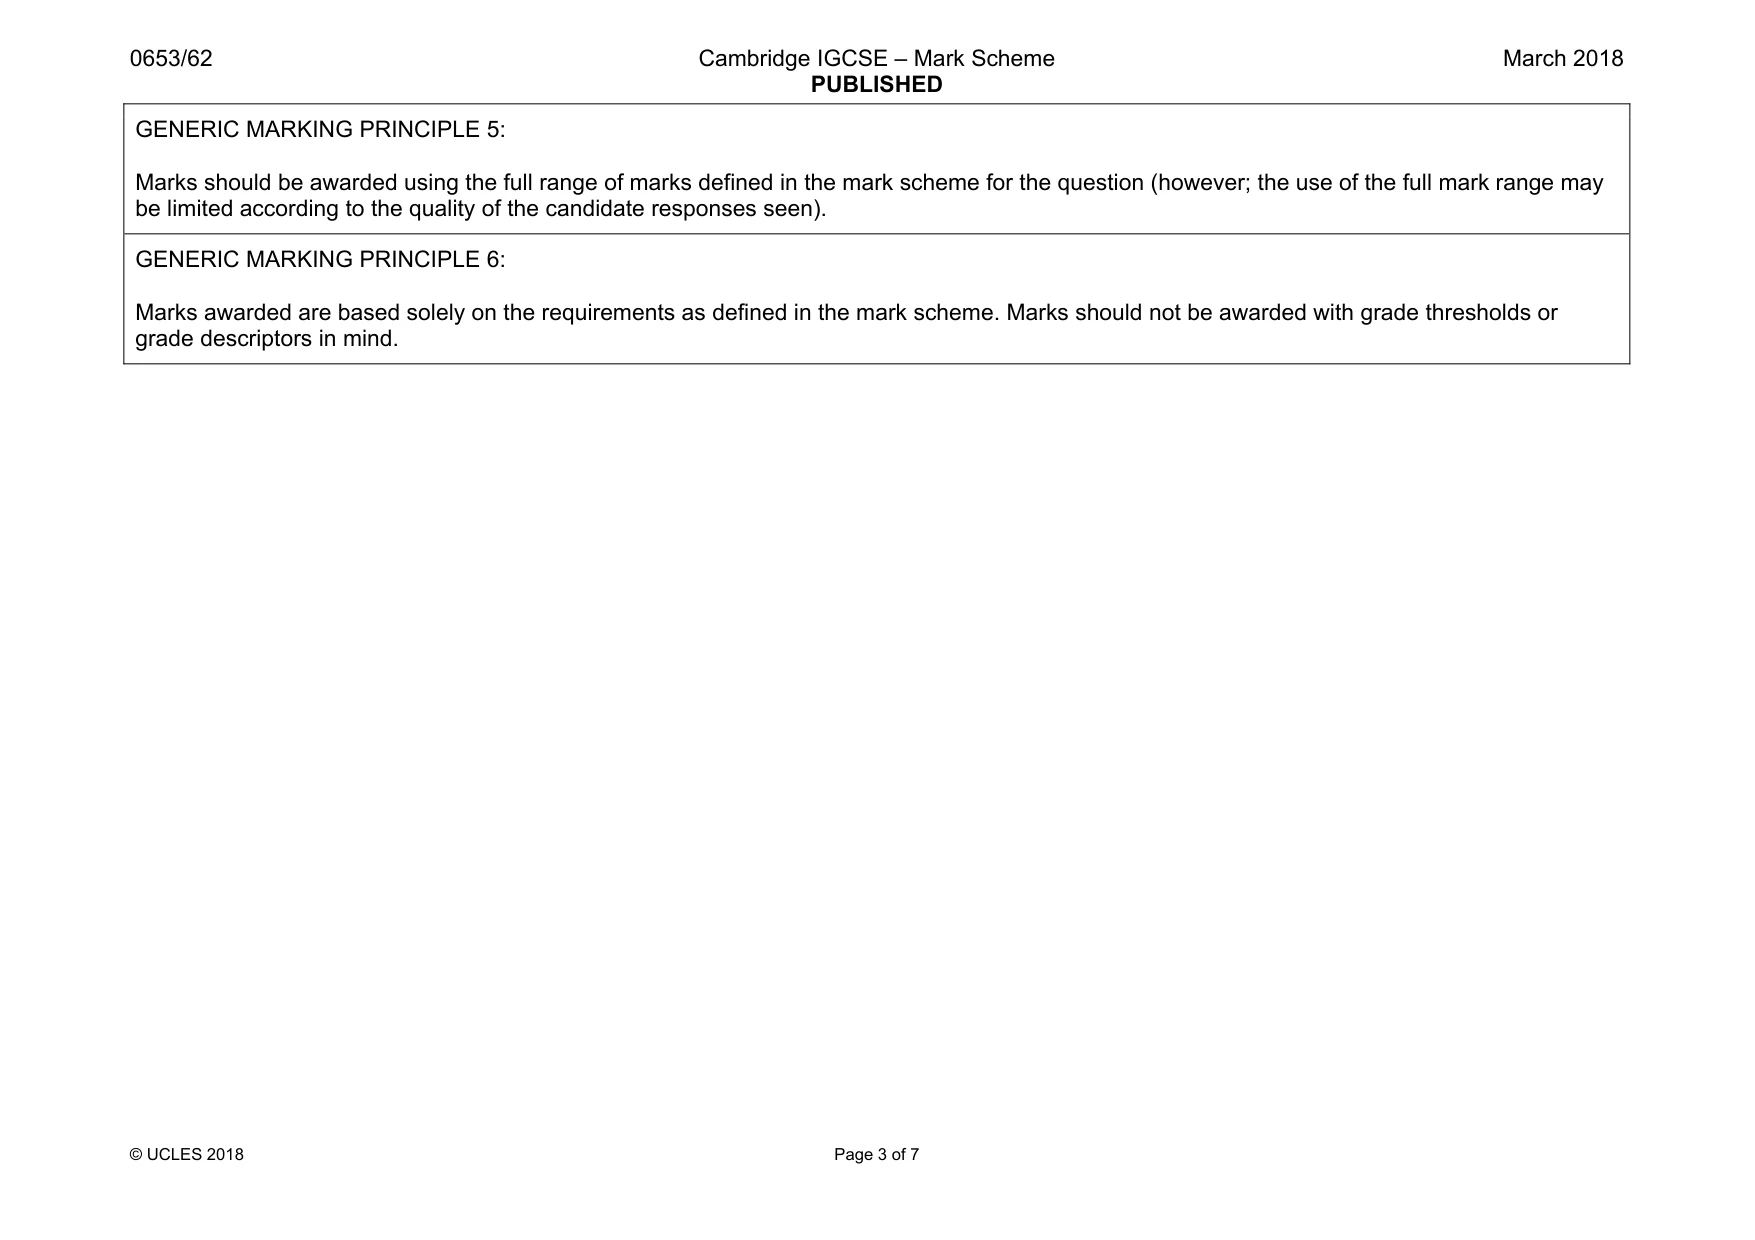
Mark scheme: 1(a)(i) Blue-black indicates starch present (initially); Brown indicates starch breaks down in A; Starch still remains in B / starch not broken down 3 1(a)(ii) Would get brown / starch breaks down faster / AW 1 1(b) Benedicts solution; Heat; Yellow / green / orange / red; Wore goggles because of hot water / chemicals / water bath not Bunsen / gloves / lab coat as iodine stains; AVP 4 1(c)(i) Enzyme / amylase is a protein so could give a positive result; AW 1 1(c)(ii) (blue--black) colour masks test; AW 1
Q2 · A student investigates the effect of varying concentration on the rate of the reaction…
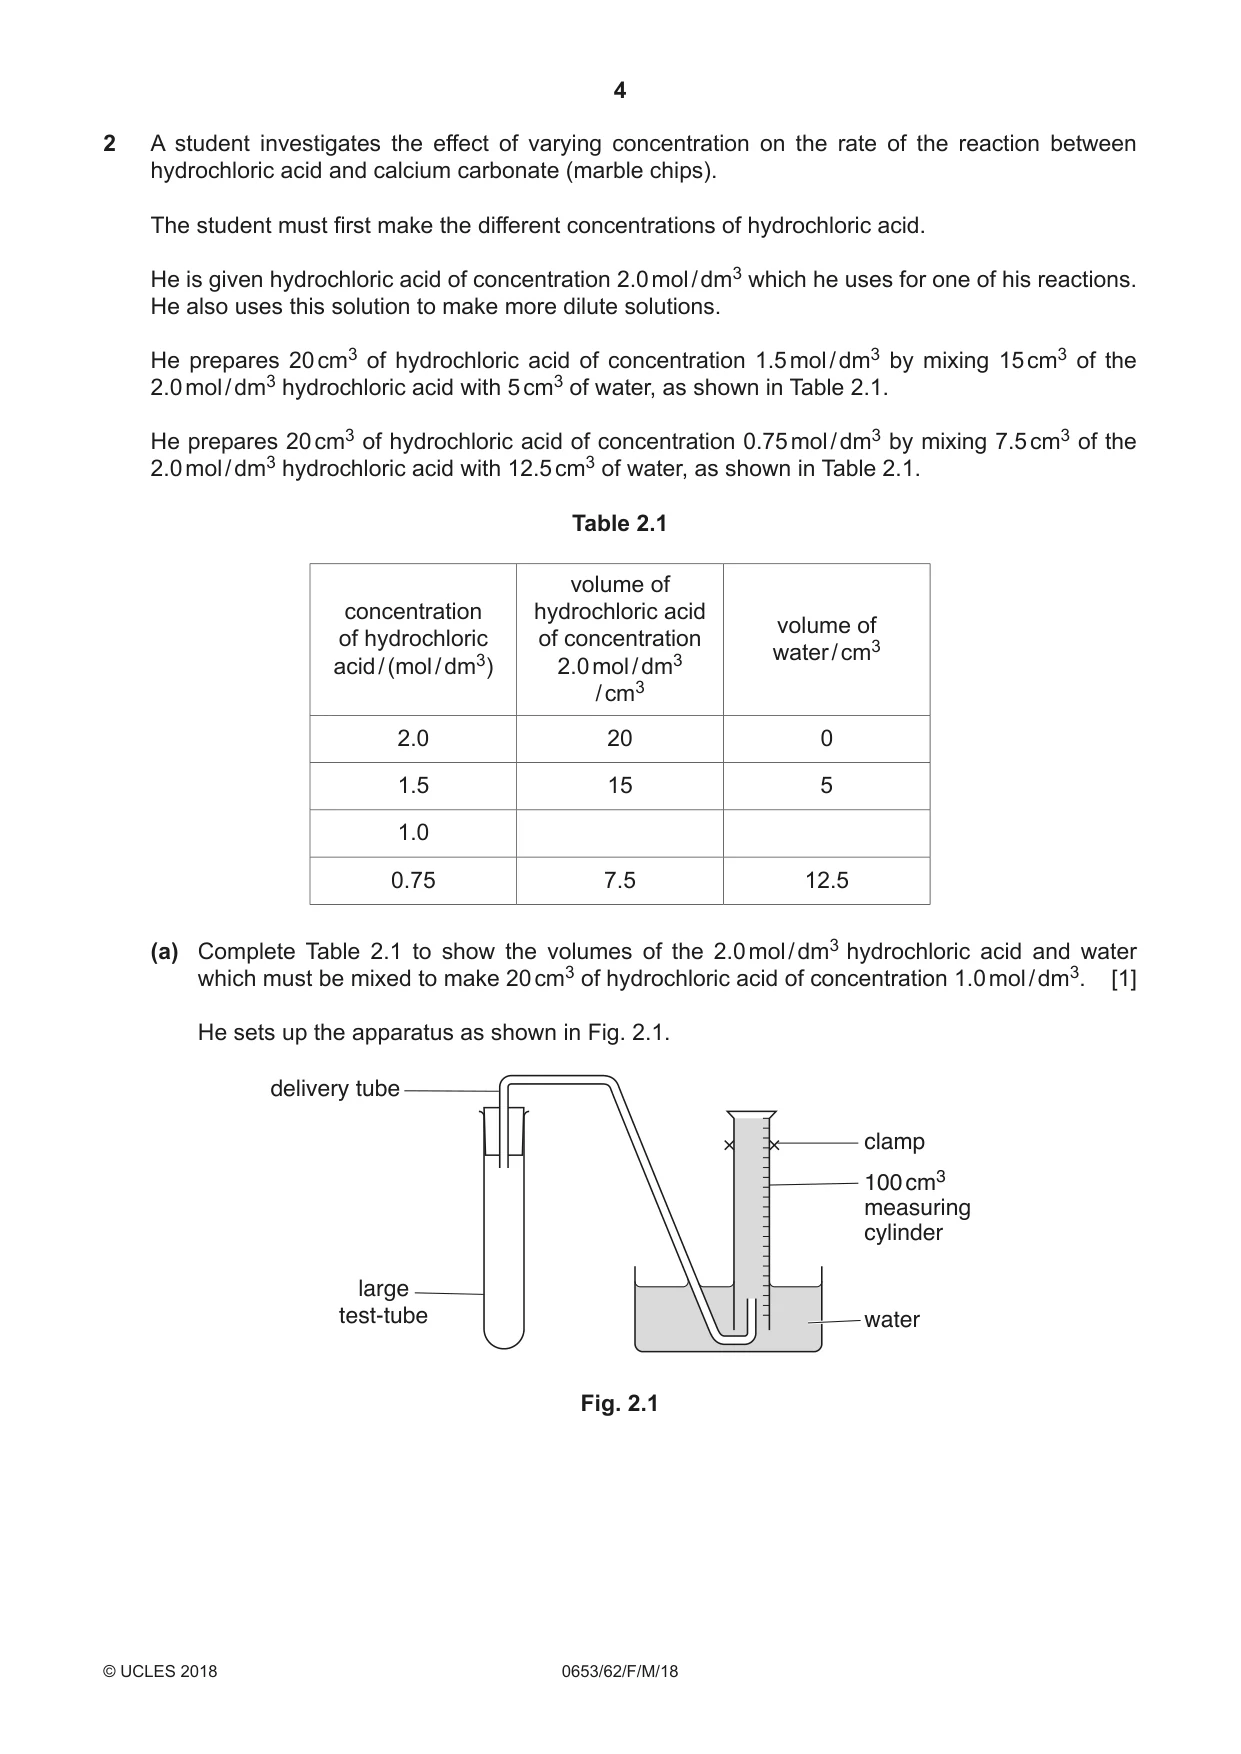
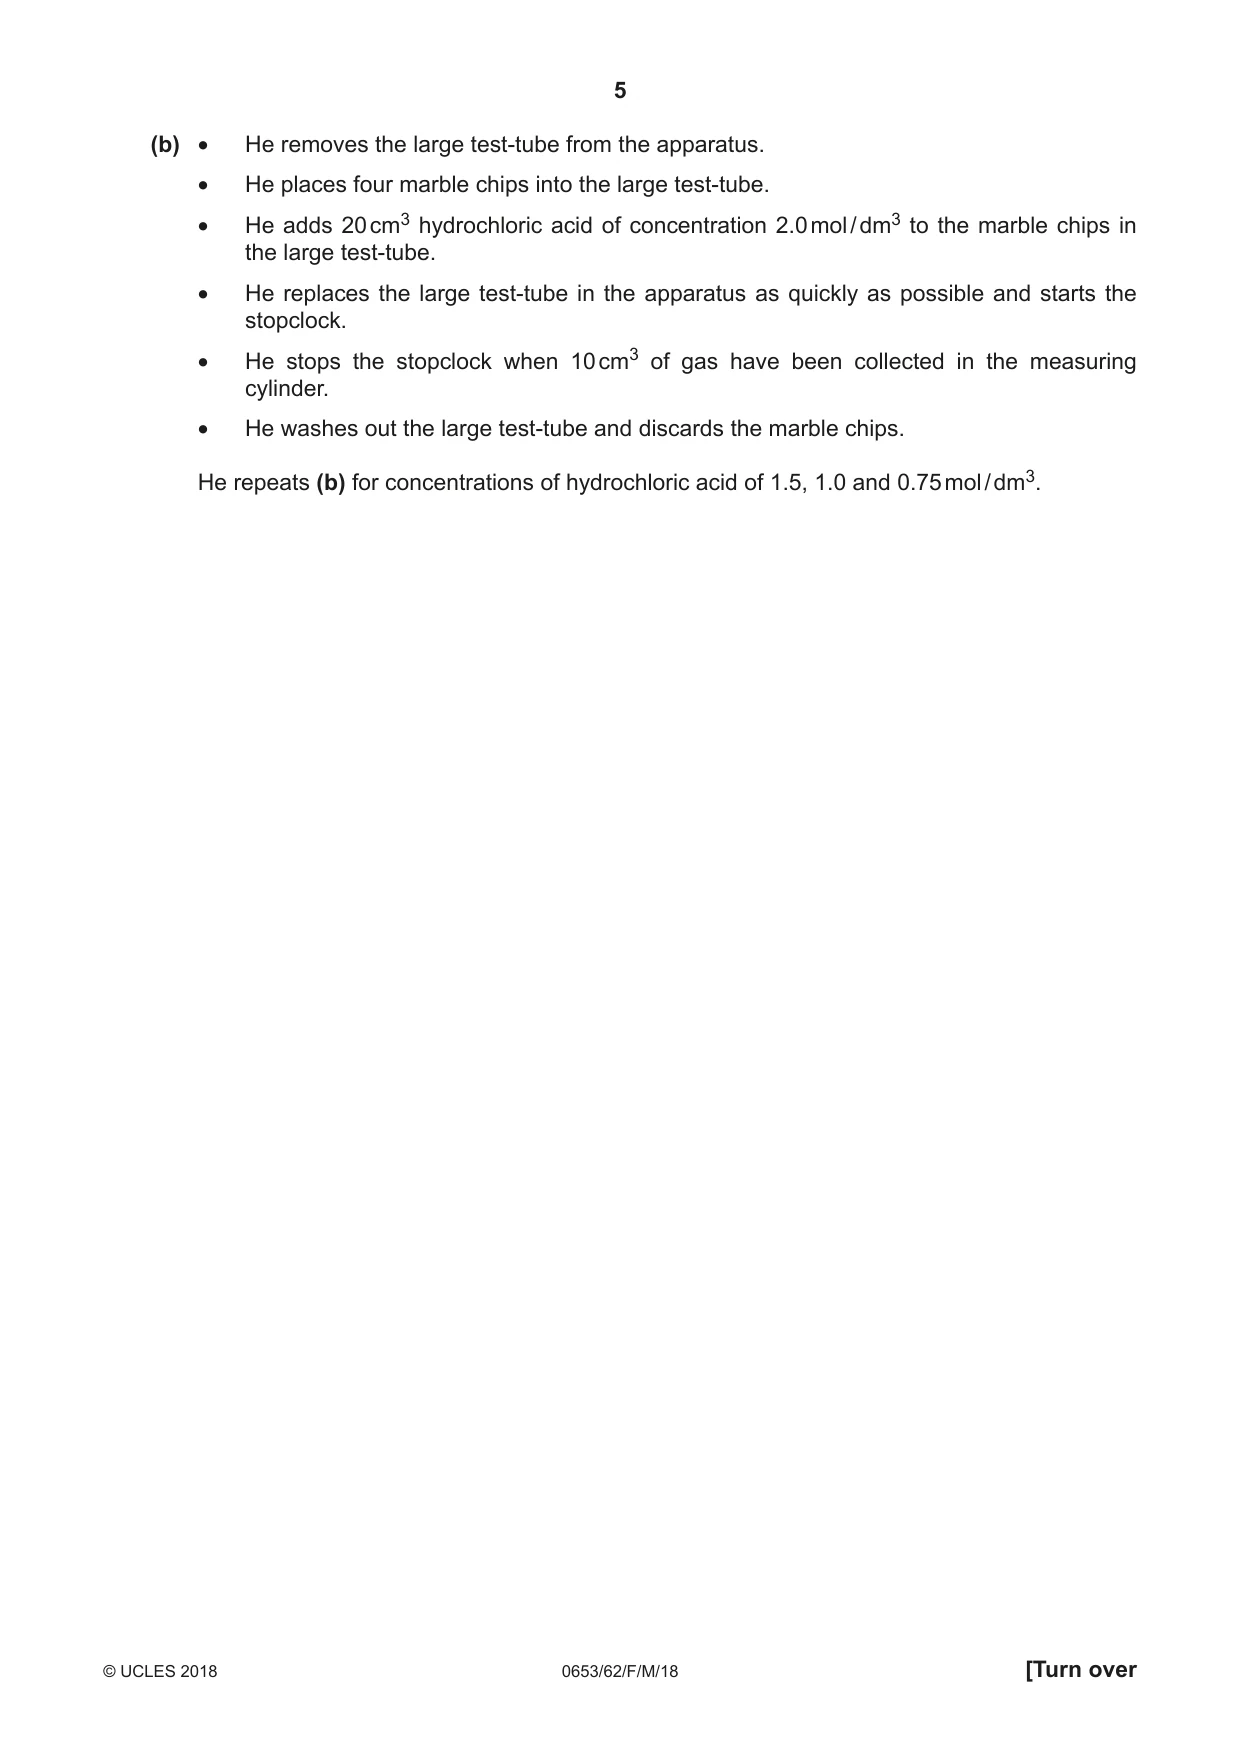
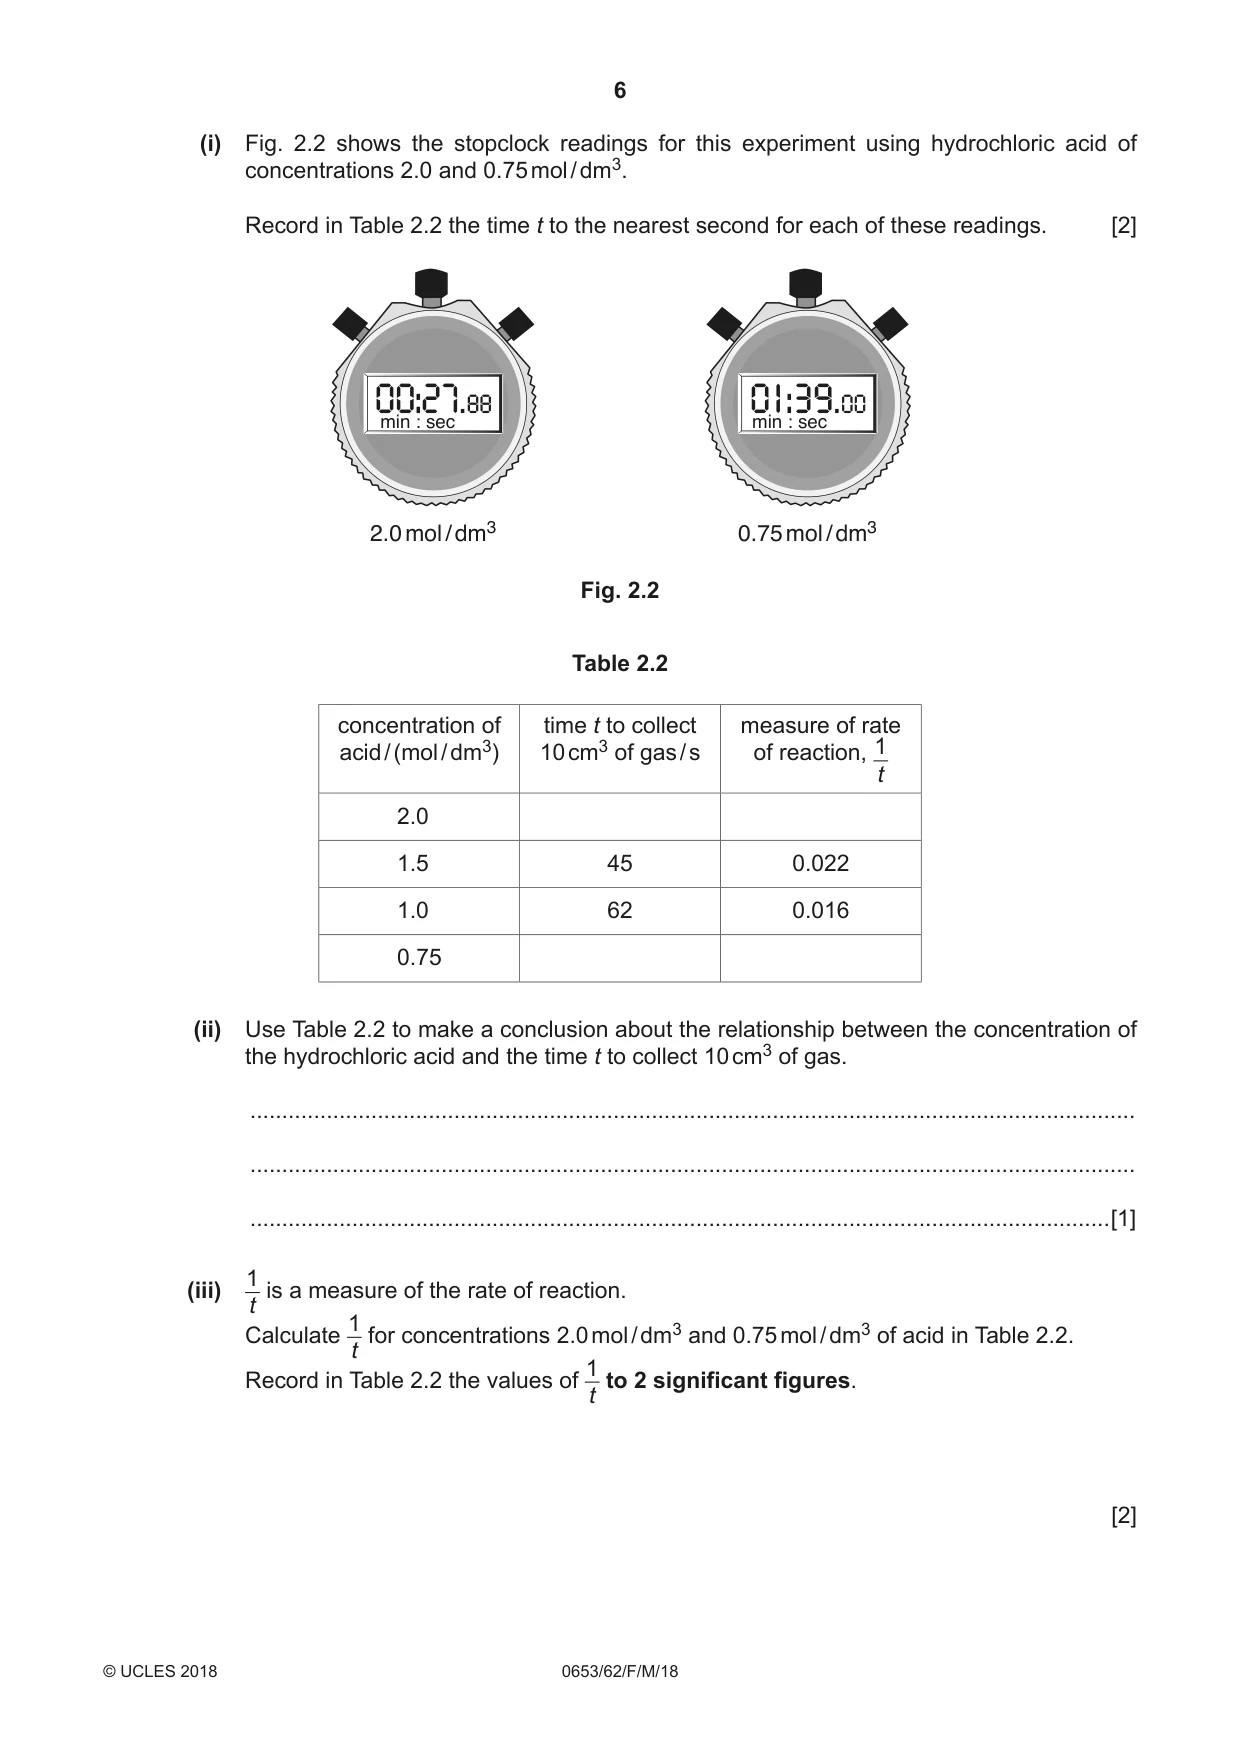
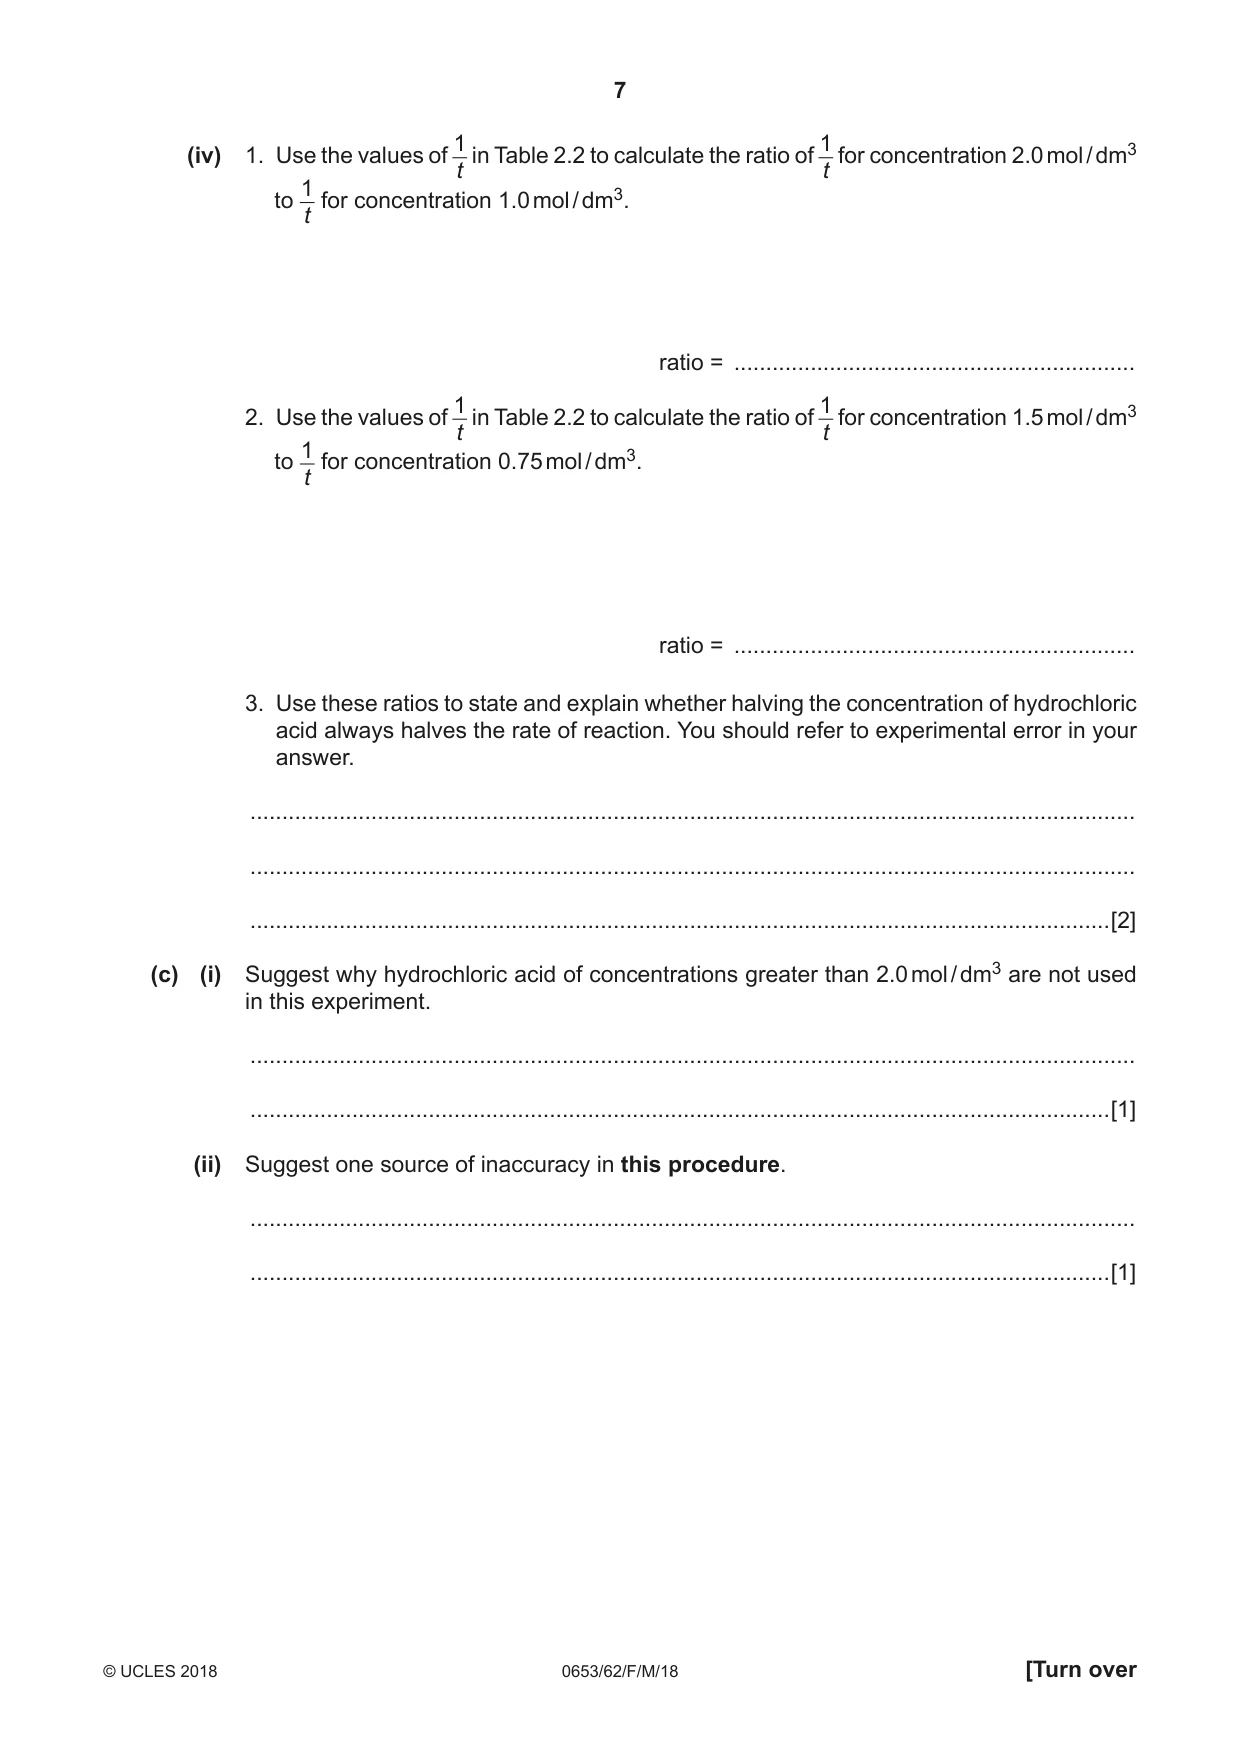
2 A student investigates the effect of varying concentration on the rate of the reaction between hydrochloric acid and calcium carbonate (marble chips). The student must first make the different concentrations of hydrochloric acid. He is given hydrochloric acid of concentration 2.0 mol / dm3 which he uses for one of his reactions. He also uses this solution to make more dilute solutions. He prepares 20 cm3 of hydrochloric acid of concentration 1.5 mol / dm3 by mixing 15 cm3 of the 2.0 mol / dm3 hydrochloric acid with 5 cm3 of water, as shown in Table 2.1. He prepares 20 cm3 of hydrochloric acid of concentration 0.75 mol / dm3 by mixing 7.5 cm3 of the 2.0 mol / dm3 hydrochloric acid with 12.5 cm3 of water, as shown in Table 2.1. Table 2.1 volume of concentration hydrochloric acid volume of of hydrochloric of concentration water / cm3 acid / (mol / dm3) 2.0 mol / dm3 / cm3 2.0 20 0 1.5 15 5 1.0 0.75 7.5 12.5 (a) Complete Table 2.1 to show the volumes of the 2.0 mol / dm3 hydrochloric acid and water which must be mixed to make 20 cm3 of hydrochloric acid of concentration 1.0 mol / dm3. [1] He sets up the apparatus as shown in Fig. 2.1. delivery tube clamp 100 cm3 measuring cylinder large test-tube water Fig. 2.1 (b) • He removes the large test-tube from the apparatus. • He places four marble chips into the large test-tube. • He adds 20 cm3 hydrochloric acid of concentration 2.0 mol / dm3 to the marble chips in the large test-tube. • He replaces the large test-tube in the apparatus as quickly as possible and starts the stopclock. • He stops the stopclock when 10 cm3 of gas have been collected in the measuring cylinder. • He washes out the large test-tube and discards the marble chips. He repeats (b) for concentrations of hydrochloric acid of 1.5, 1.0 and 0.75 mol / dm3. (i) Fig. 2.2 shows the stopclock readings for this experiment using hydrochloric acid of concentrations 2.0 and 0.75 mol / dm3. Record in Table 2.2 the time t to the nearest second for each of these readings. [2] min : sec min : sec 2.0 mol / dm3 0.75 mol / dm3 Fig. 2.2 Table 2.2 concentration of time t to collect measure of rate acid / (mol / dm3) 10 cm3 of gas / s of reaction, 1 t 2.00 1.50 45 0.022 1.00 62 0.016 0.75 (ii) Use Table 2.2 to make a conclusion about the relationship between the concentration of the hydrochloric acid and the time t to collect 10 cm3 of gas. ........................................................................................................................................... ........................................................................................................................................... .......................................................................................................................................[1] 1(iii) is a measure of the rate of reaction. t 1 Calculate for concentrations 2.0 mol / dm3 and 0.75 mol / dm3 of acid in Table 2.2. t 1 Record in Table 2.2 the values of to 2 significant figures. t [2] 1 1 (iv) 1. Use the values of in Table 2.2 to calculate the ratio of for concentration 2.0 mol / dm3 t t 1 to for concentration 1.0 mol / dm3. t ratio = ............................................................... 1 1 2. Use the values of in Table 2.2 to calculate the ratio of for concentration 1.5 mol / dm3 t t 1 to for concentration 0.75 mol / dm3. t ratio = ............................................................... 3. Use these ratios to state and explain whether halving the concentration of hydrochloric acid always halves the rate of reaction. You should refer to experimental error in your answer. ........................................................................................................................................... ........................................................................................................................................... .......................................................................................................................................[2] (c) (i) Suggest why hydrochloric acid of concentrations greater than 2.0 mol / dm3 are not used in this experiment. ........................................................................................................................................... .......................................................................................................................................[1] (ii) Suggest one source of inaccuracy in this procedure. ........................................................................................................................................... .......................................................................................................................................[1]
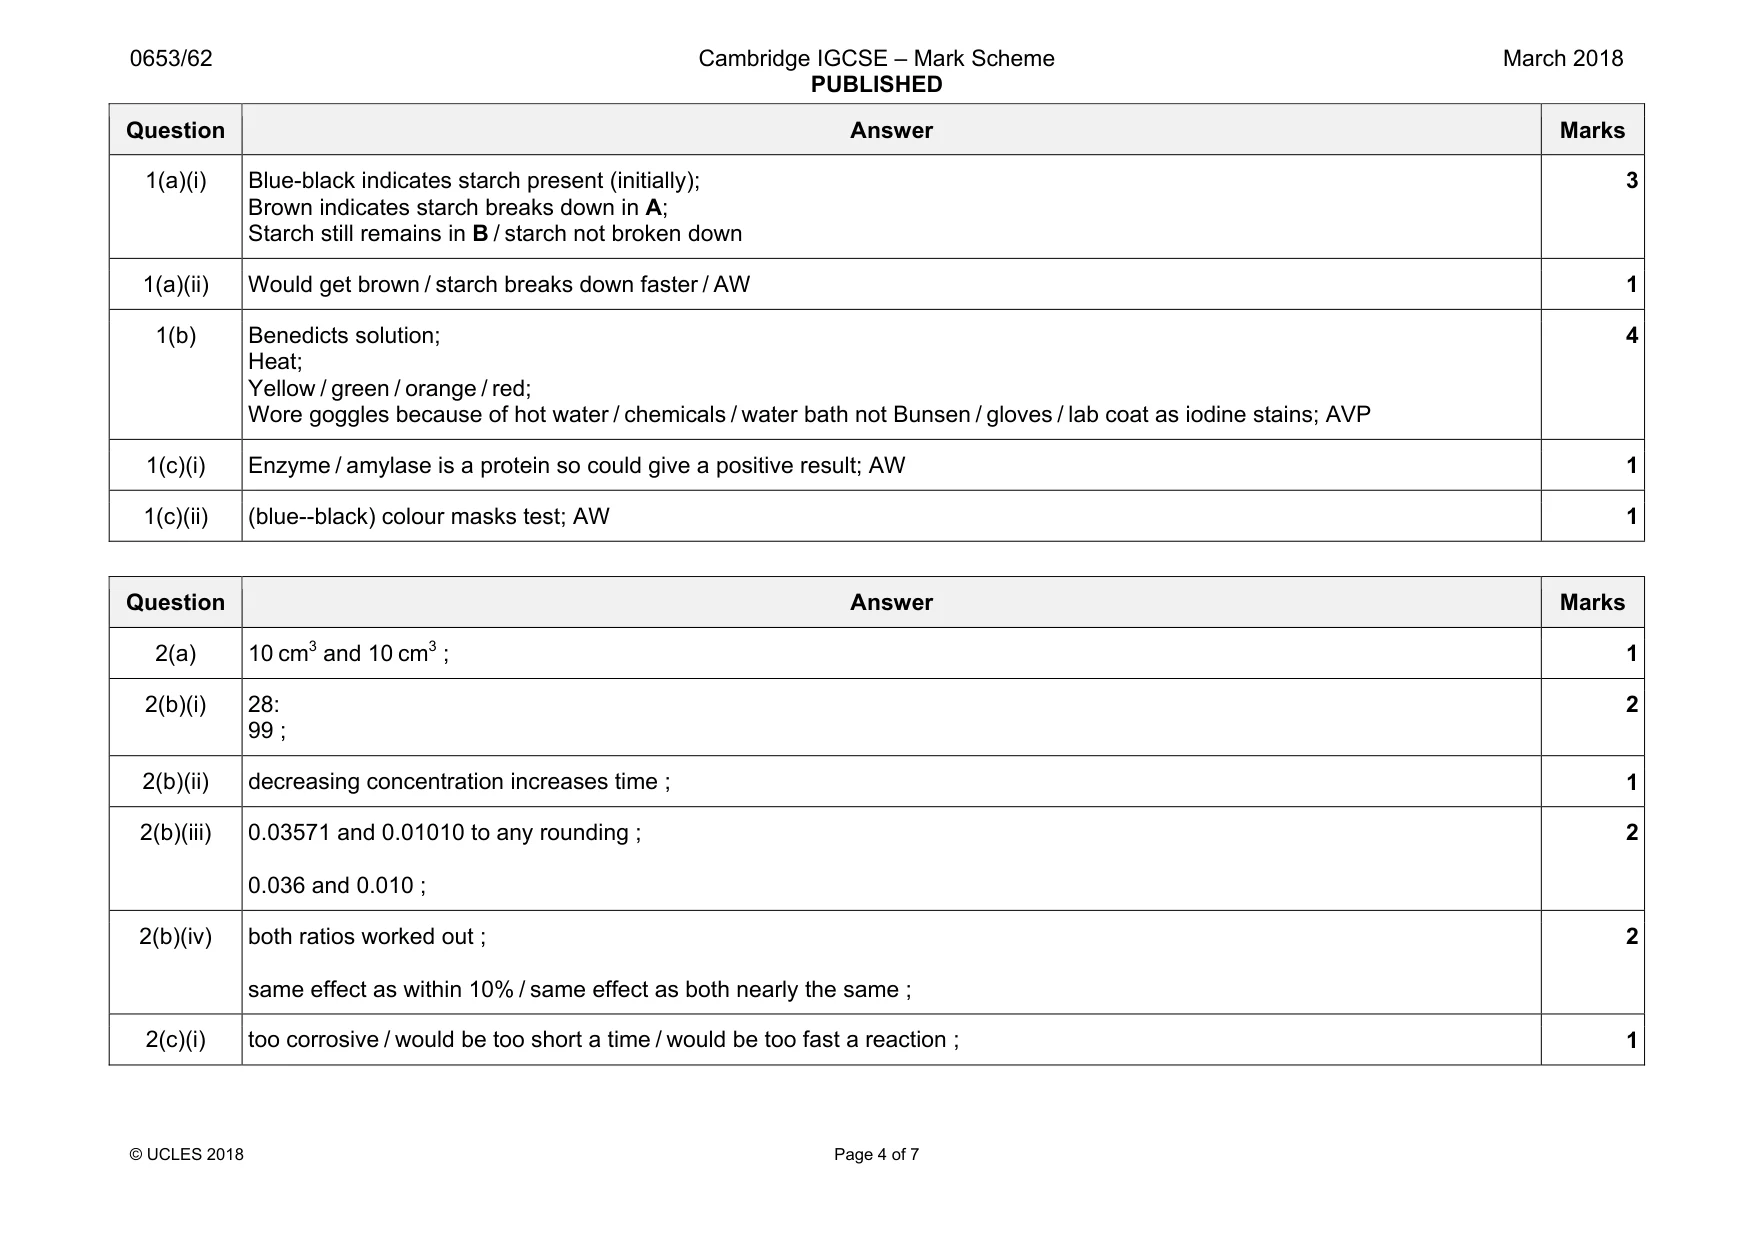
Mark scheme: 2(a) 1 2(b)(i) 28: 99 ; 2 2(b)(ii) decreasing concentration increases time ; 1 2(b)(iii) 0.03571 and 0.01010 to any rounding ; 0.036 and 0.010 ; 2 2(b)(iv) both ratios worked out ; same effect as within 10% / same effect as both nearly the same ; 2 2(c)(i) too corrosive / would be too short a time / would be too fast a reaction ; 1 Question Answer Marks 2(c)(ii) starting stopclock after gas begins to be released / irregular size of marble chips / use of measuring cylinder for dilution exercise ; 1
Q3 · A student measures the electromotive force (voltage) of a power supply
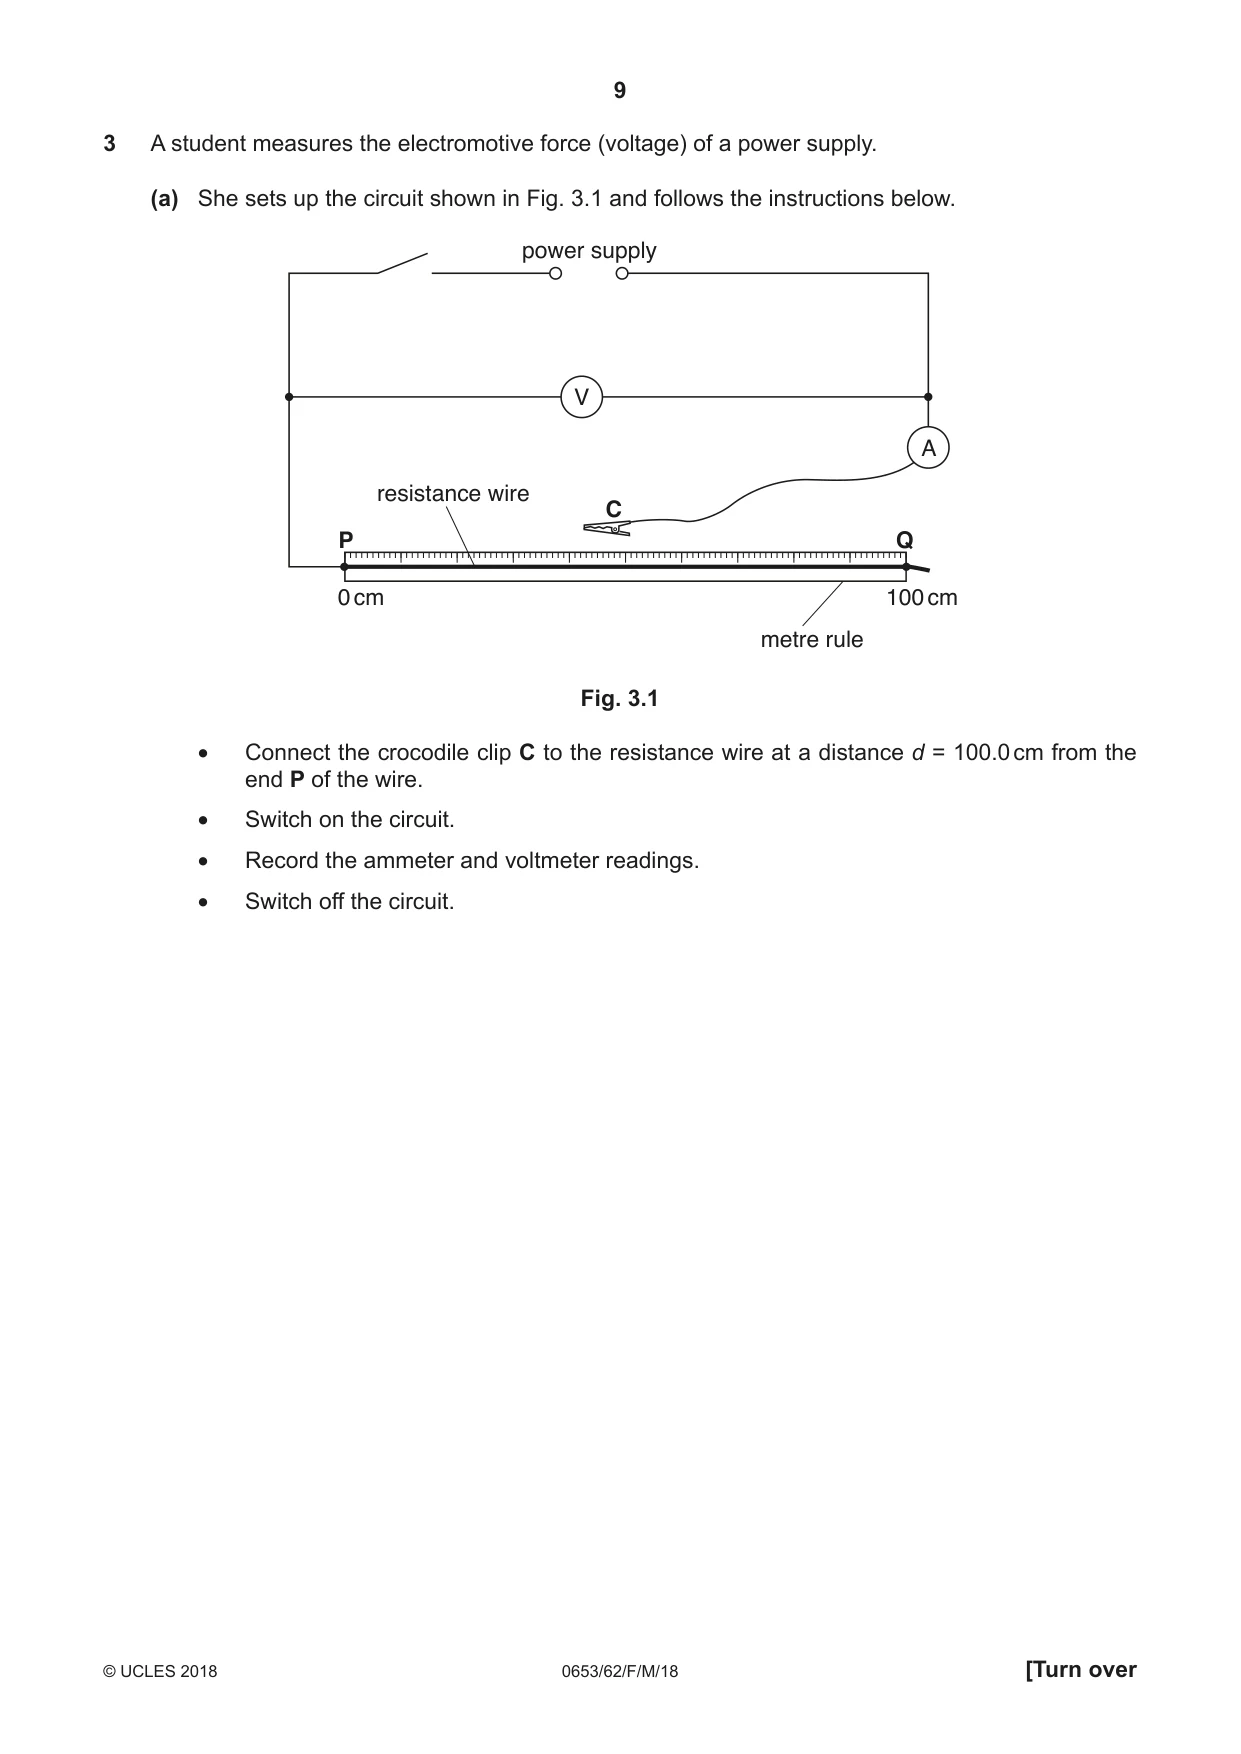
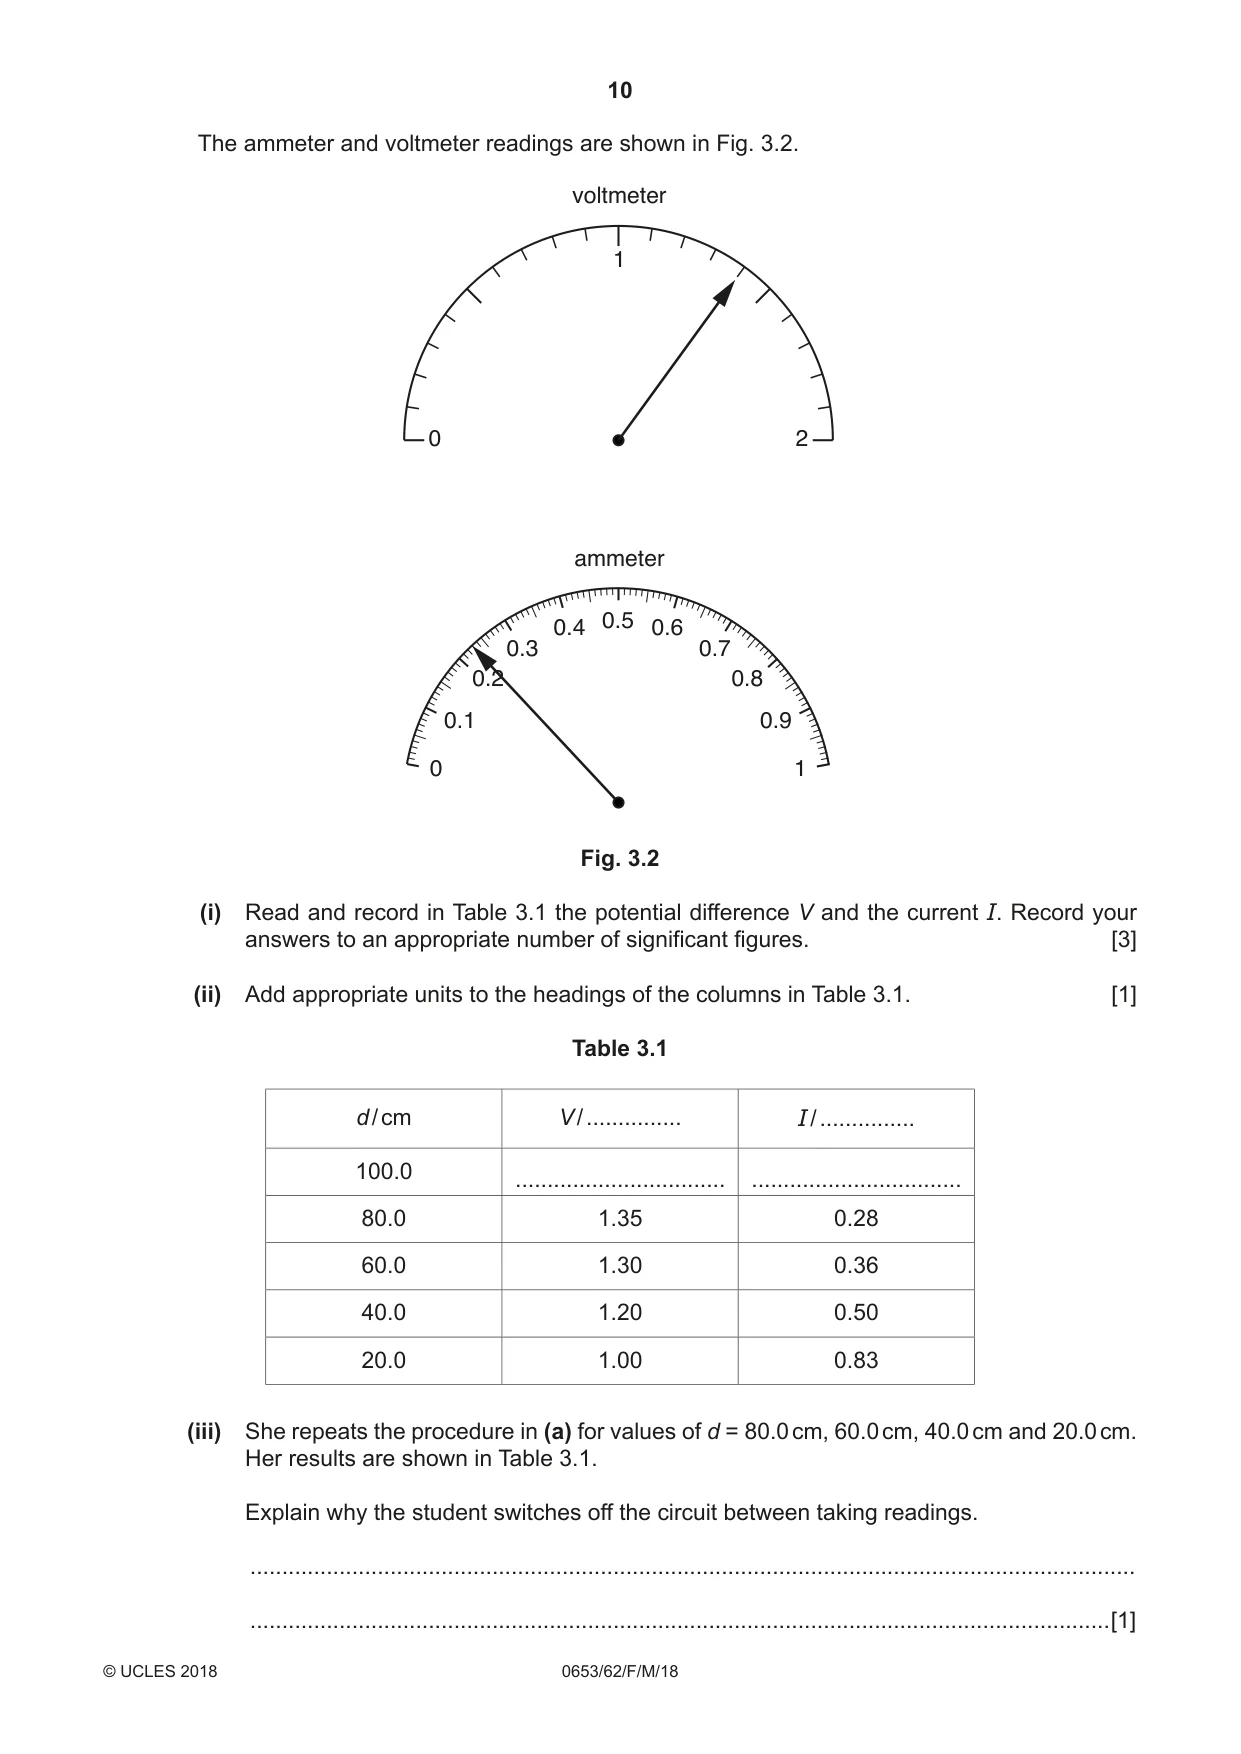
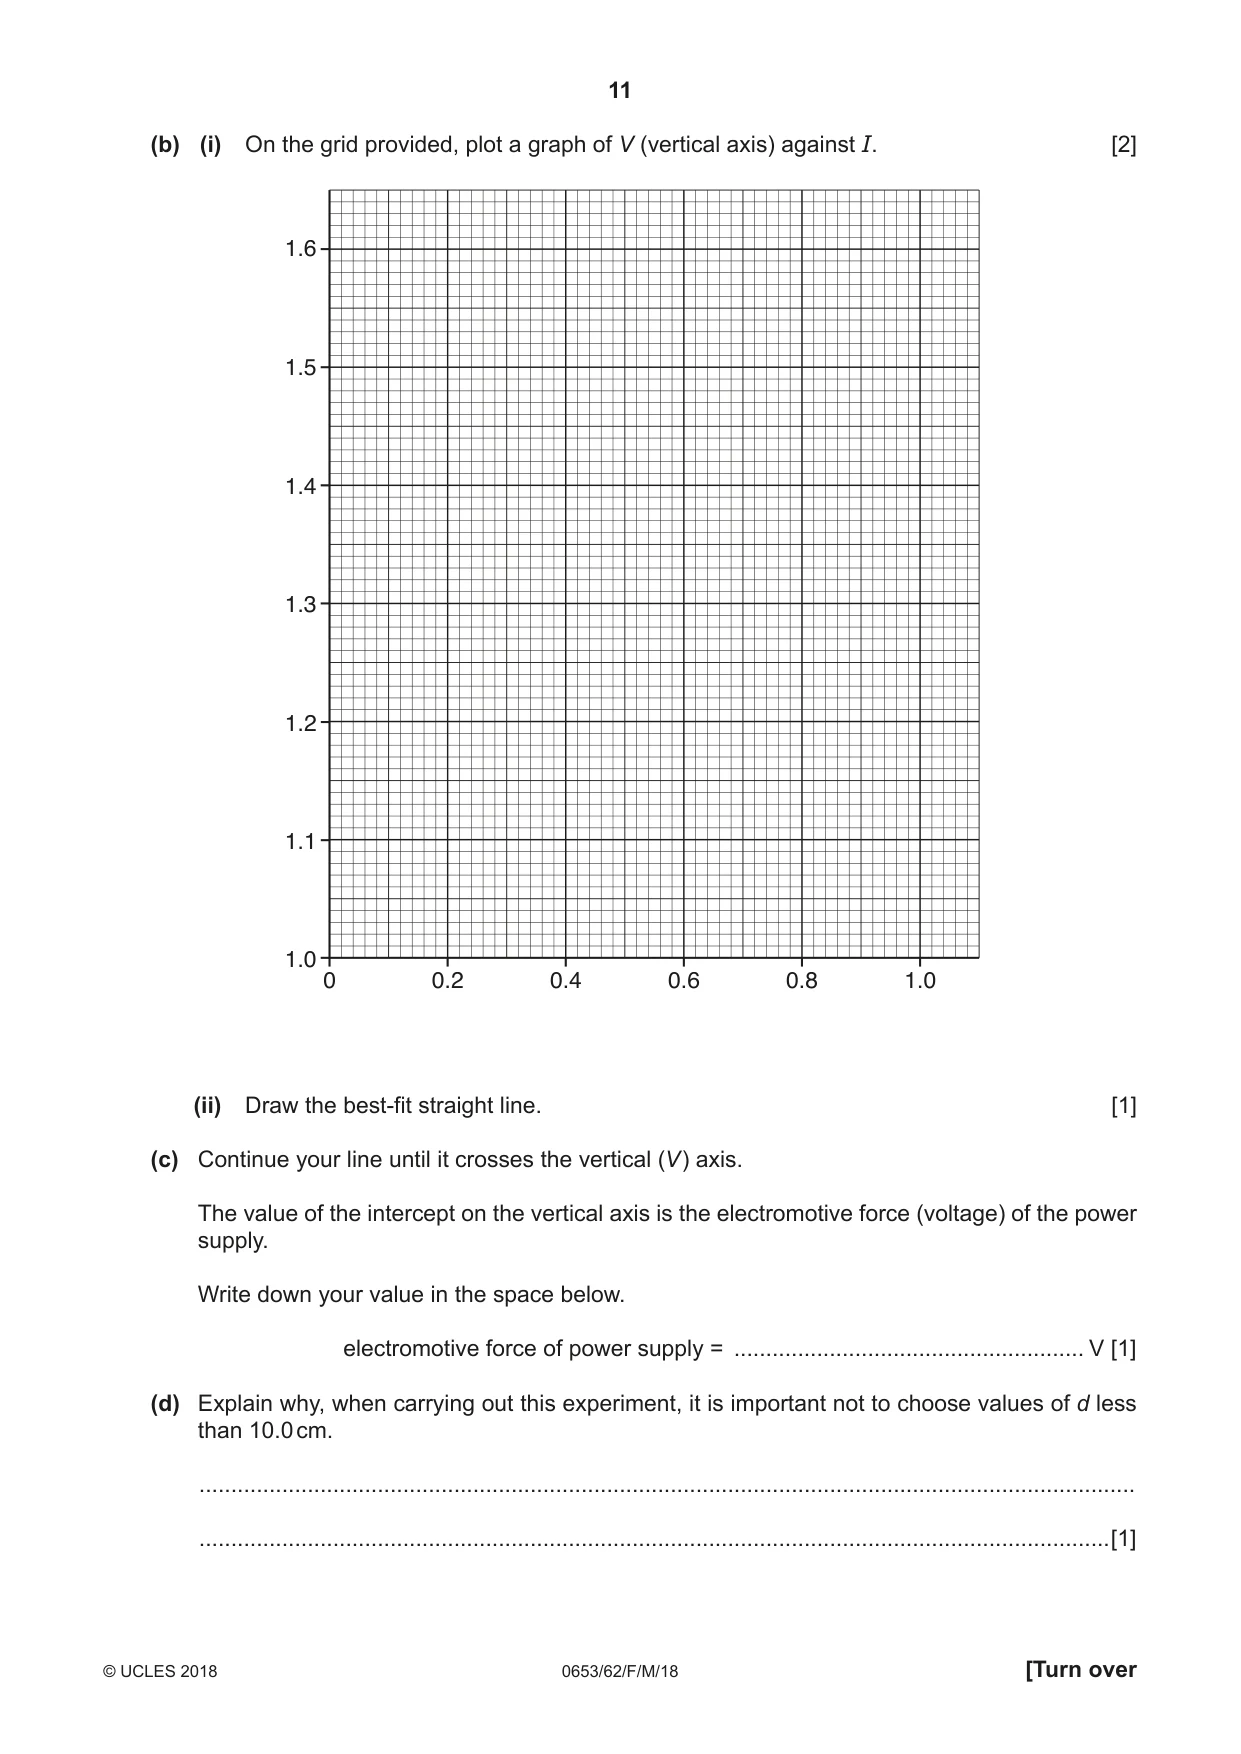
3 A student measures the electromotive force (voltage) of a power supply. (a) She sets up the circuit shown in Fig. 3.1 and follows the instructions below. power supply V A resistance wire C P Q 0 cm 100 cm metre rule Fig. 3.1 • Connect the crocodile clip C to the resistance wire at a distance d = 100.0 cm from the end P of the wire. • Switch on the circuit. • Record the ammeter and voltmeter readings. • Switch off the circuit. The ammeter and voltmeter readings are shown in Fig. 3.2. voltmeter 1 0 2 ammeter 0.5 0.4 0.6 0.3 0.7 0.2 0.8 0.1 0.9 0 1 Fig. 3.2 (i) Read and record in Table 3.1 the potential difference V and the current I. Record your answers to an appropriate number of significant figures. [3] (ii) Add appropriate units to the headings of the columns in Table 3.1. [1] Table 3.1 d / cm V / ............... I / ............... 100.0 ................................. ................................. 80.0 1.35 0.28 60.0 1.30 0.36 40.0 1.20 0.50 20.0 1.00 0.83 (iii) She repeats the procedure in (a) for values of d = 80.0 cm, 60.0 cm, 40.0 cm and 20.0 cm. Her results are shown in Table 3.1. Explain why the student switches off the circuit between taking readings. ........................................................................................................................................... .......................................................................................................................................[1] (b) (i) On the grid provided, plot a graph of V (vertical axis) against I. [2] 1.6 1.5 1.4 1.3 1.2 1.1 1.0 0 0.2 0.4 0.6 0.8 1.0 (ii) Draw the best-fit straight line. [1] (c) Continue your line until it crosses the vertical (V) axis. The value of the intercept on the vertical axis is the electromotive force (voltage) of the power supply. Write down your value in the space below. electromotive force of power supply = ....................................................... V [1] (d) Explain why, when carrying out this experiment, it is important not to choose values of d less than 10.0 cm. ................................................................................................................................................... ...............................................................................................................................................[1]
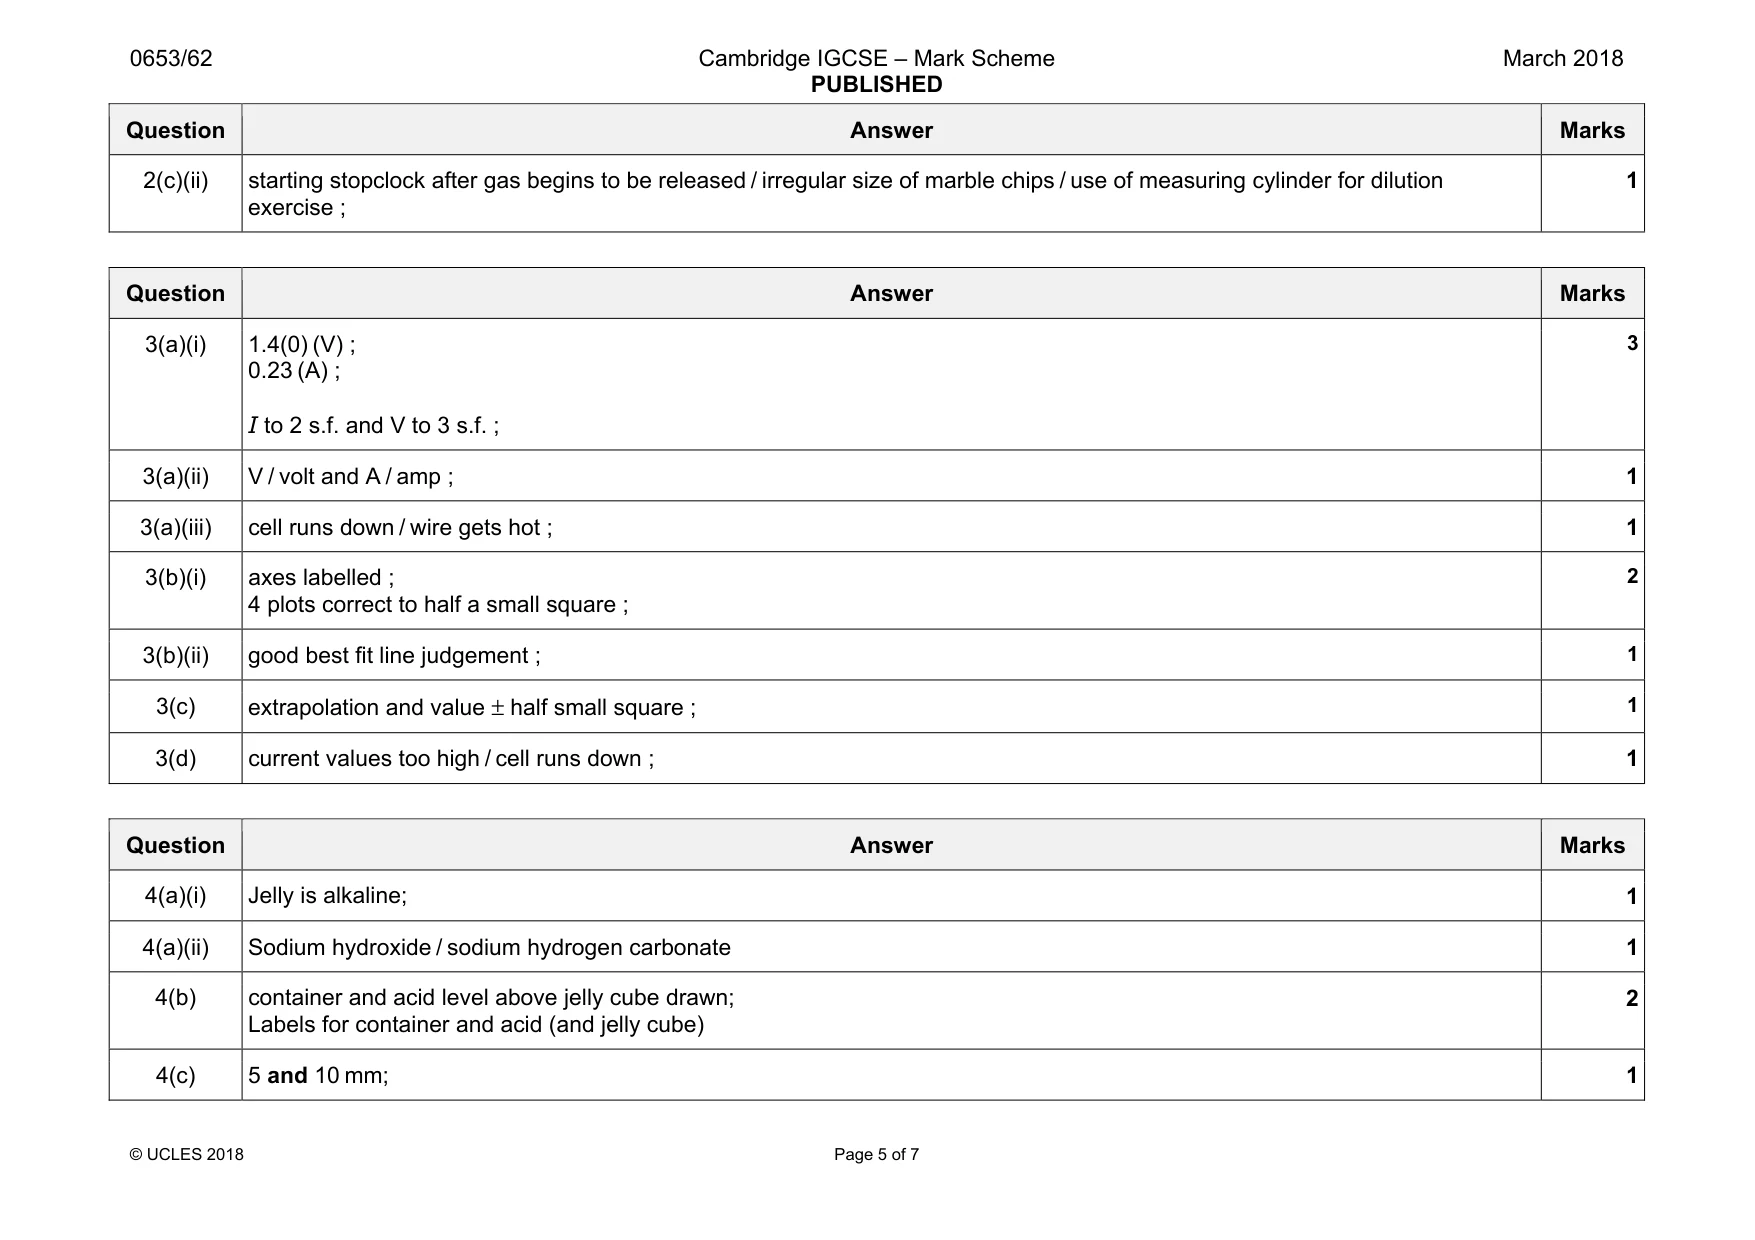
Mark scheme: 3(a)(i) 1.4(0) (V) ; 0.23 (A) ; I to 2 s.f. and V to 3 s.f. ; 3(a)(ii) V / volt and A / amp ; 1 3(a)(iii) cell runs down / wire gets hot ; 1 3(b)(i) axes labelled ; 4 plots correct to half a small square ; 2 3(b)(ii) good best fit line judgement ; 1 3(c) extrapolation and value ± half small square ; 1 3(d) current values too high / cell runs down ; 1
Q4 · A student investigates diffusion in large and small organisms by observing the movement…
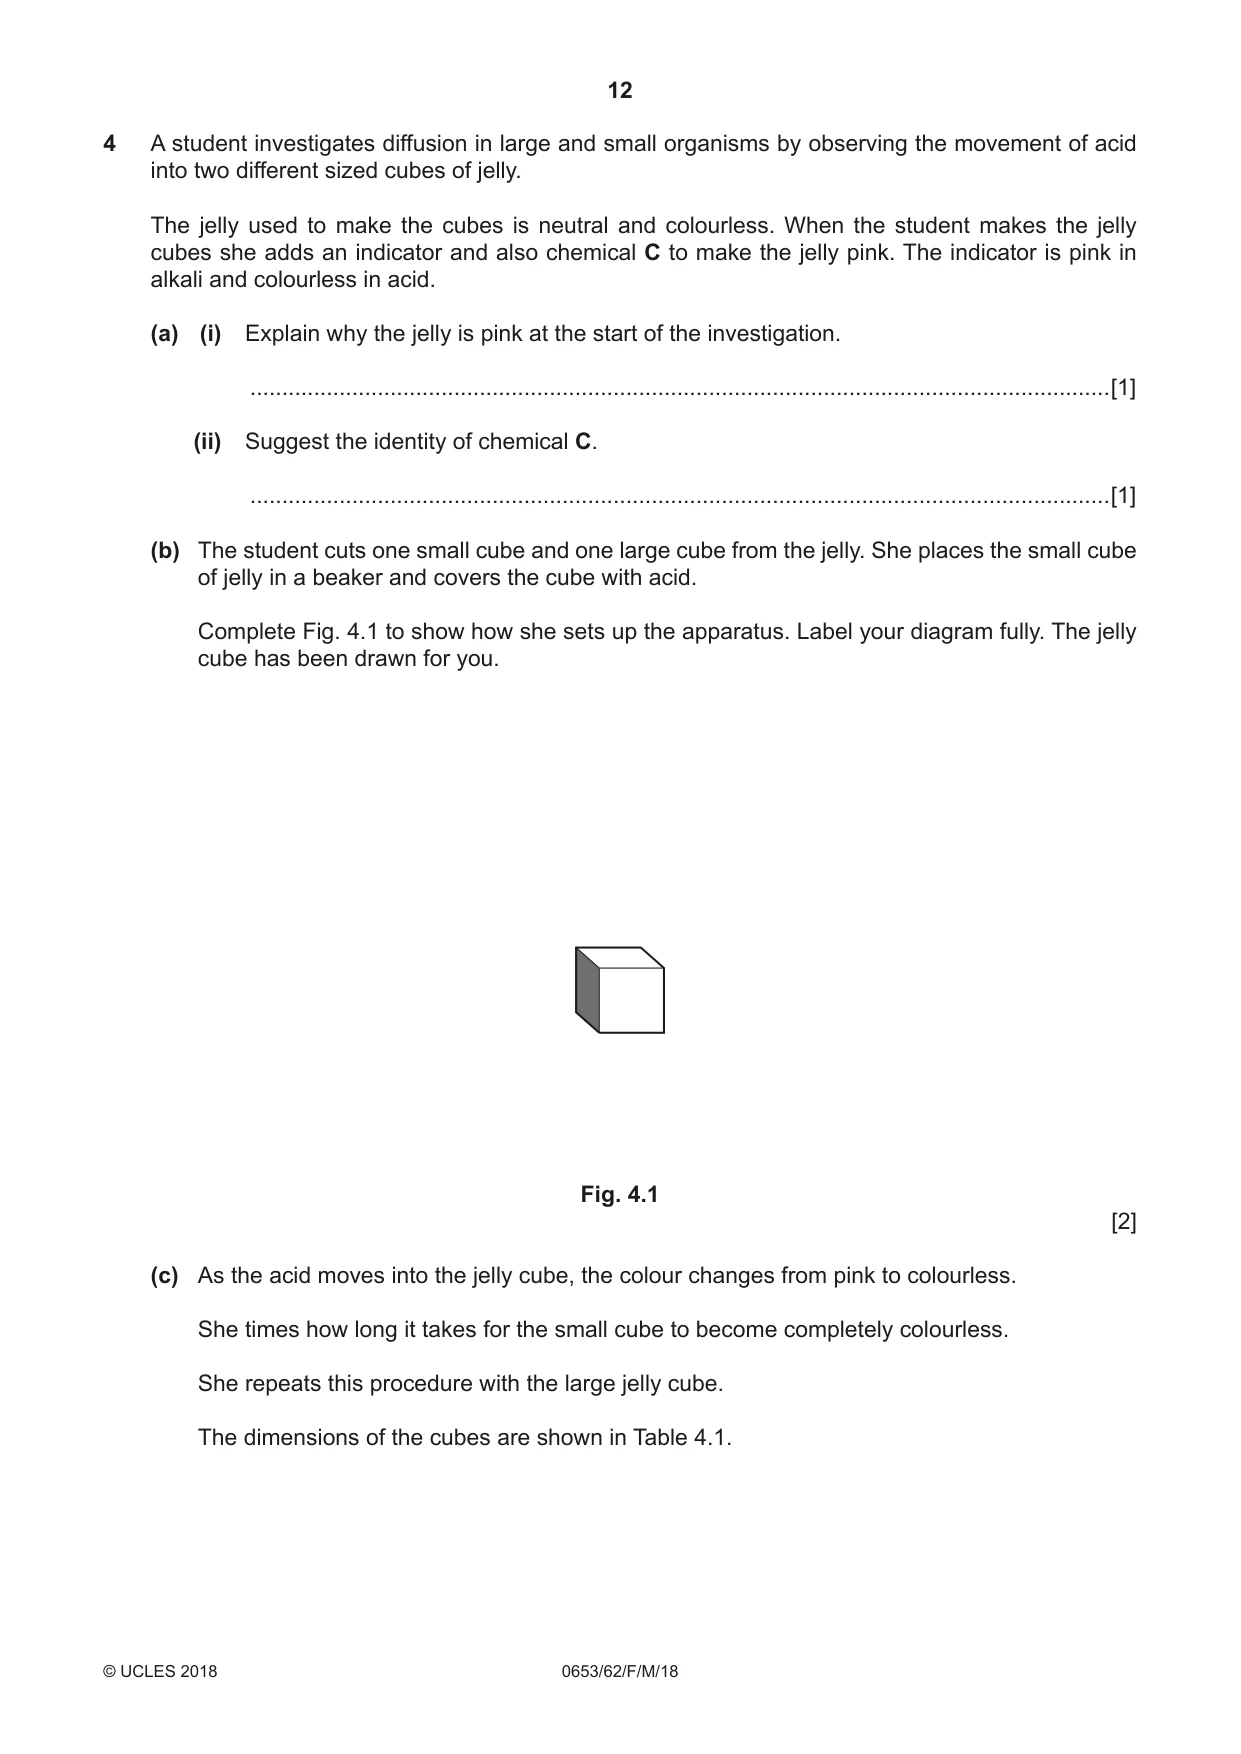
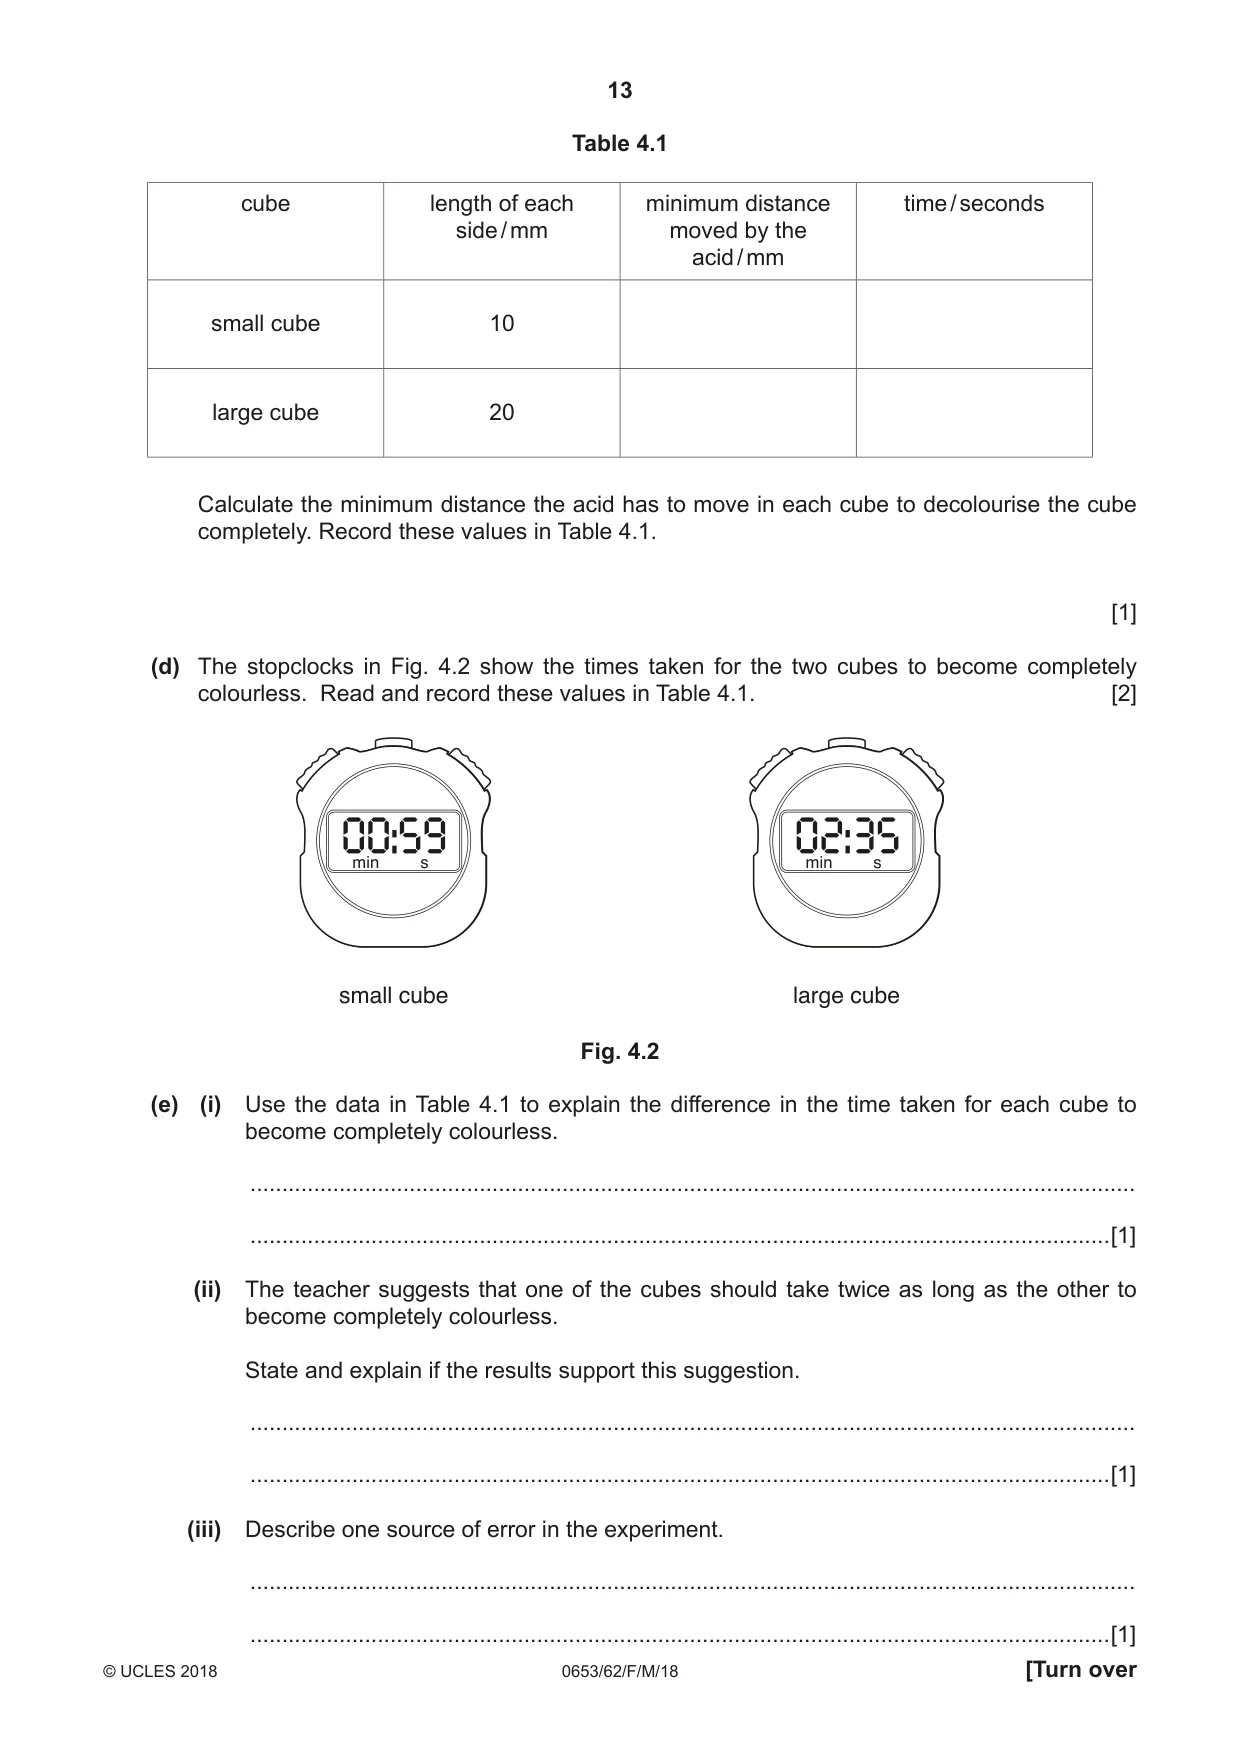
4 A student investigates diffusion in large and small organisms by observing the movement of acid into two different sized cubes of jelly. The jelly used to make the cubes is neutral and colourless. When the student makes the jelly cubes she adds an indicator and also chemical C to make the jelly pink. The indicator is pink in alkali and colourless in acid. (a) (i) Explain why the jelly is pink at the start of the investigation. .......................................................................................................................................[1] (ii) Suggest the identity of chemical C. .......................................................................................................................................[1] (b) The student cuts one small cube and one large cube from the jelly. She places the small cube of jelly in a beaker and covers the cube with acid. Complete Fig. 4.1 to show how she sets up the apparatus. Label your diagram fully. The jelly cube has been drawn for you. Fig. 4.1 [2] (c) As the acid moves into the jelly cube, the colour changes from pink to colourless. She times how long it takes for the small cube to become completely colourless. She repeats this procedure with the large jelly cube. The dimensions of the cubes are shown in Table 4.1. Table 4.1 cube length of each minimum distance time / seconds side / mm moved by the acid / mm small cube 10 large cube 20 Calculate the minimum distance the acid has to move in each cube to decolourise the cube completely. Record these values in Table 4.1. [1] (d) The stopclocks in Fig. 4.2 show the times taken for the two cubes to become completely colourless. Read and record these values in Table 4.1. [2] min s min s small cube large cube Fig. 4.2 (e) (i) Use the data in Table 4.1 to explain the difference in the time taken for each cube to become completely colourless. ........................................................................................................................................... .......................................................................................................................................[1] (ii) The teacher suggests that one of the cubes should take twice as long as the other to become completely colourless. State and explain if the results support this suggestion. ........................................................................................................................................... .......................................................................................................................................[1] (iii) Describe one source of error in the experiment. ........................................................................................................................................... .......................................................................................................................................[1]
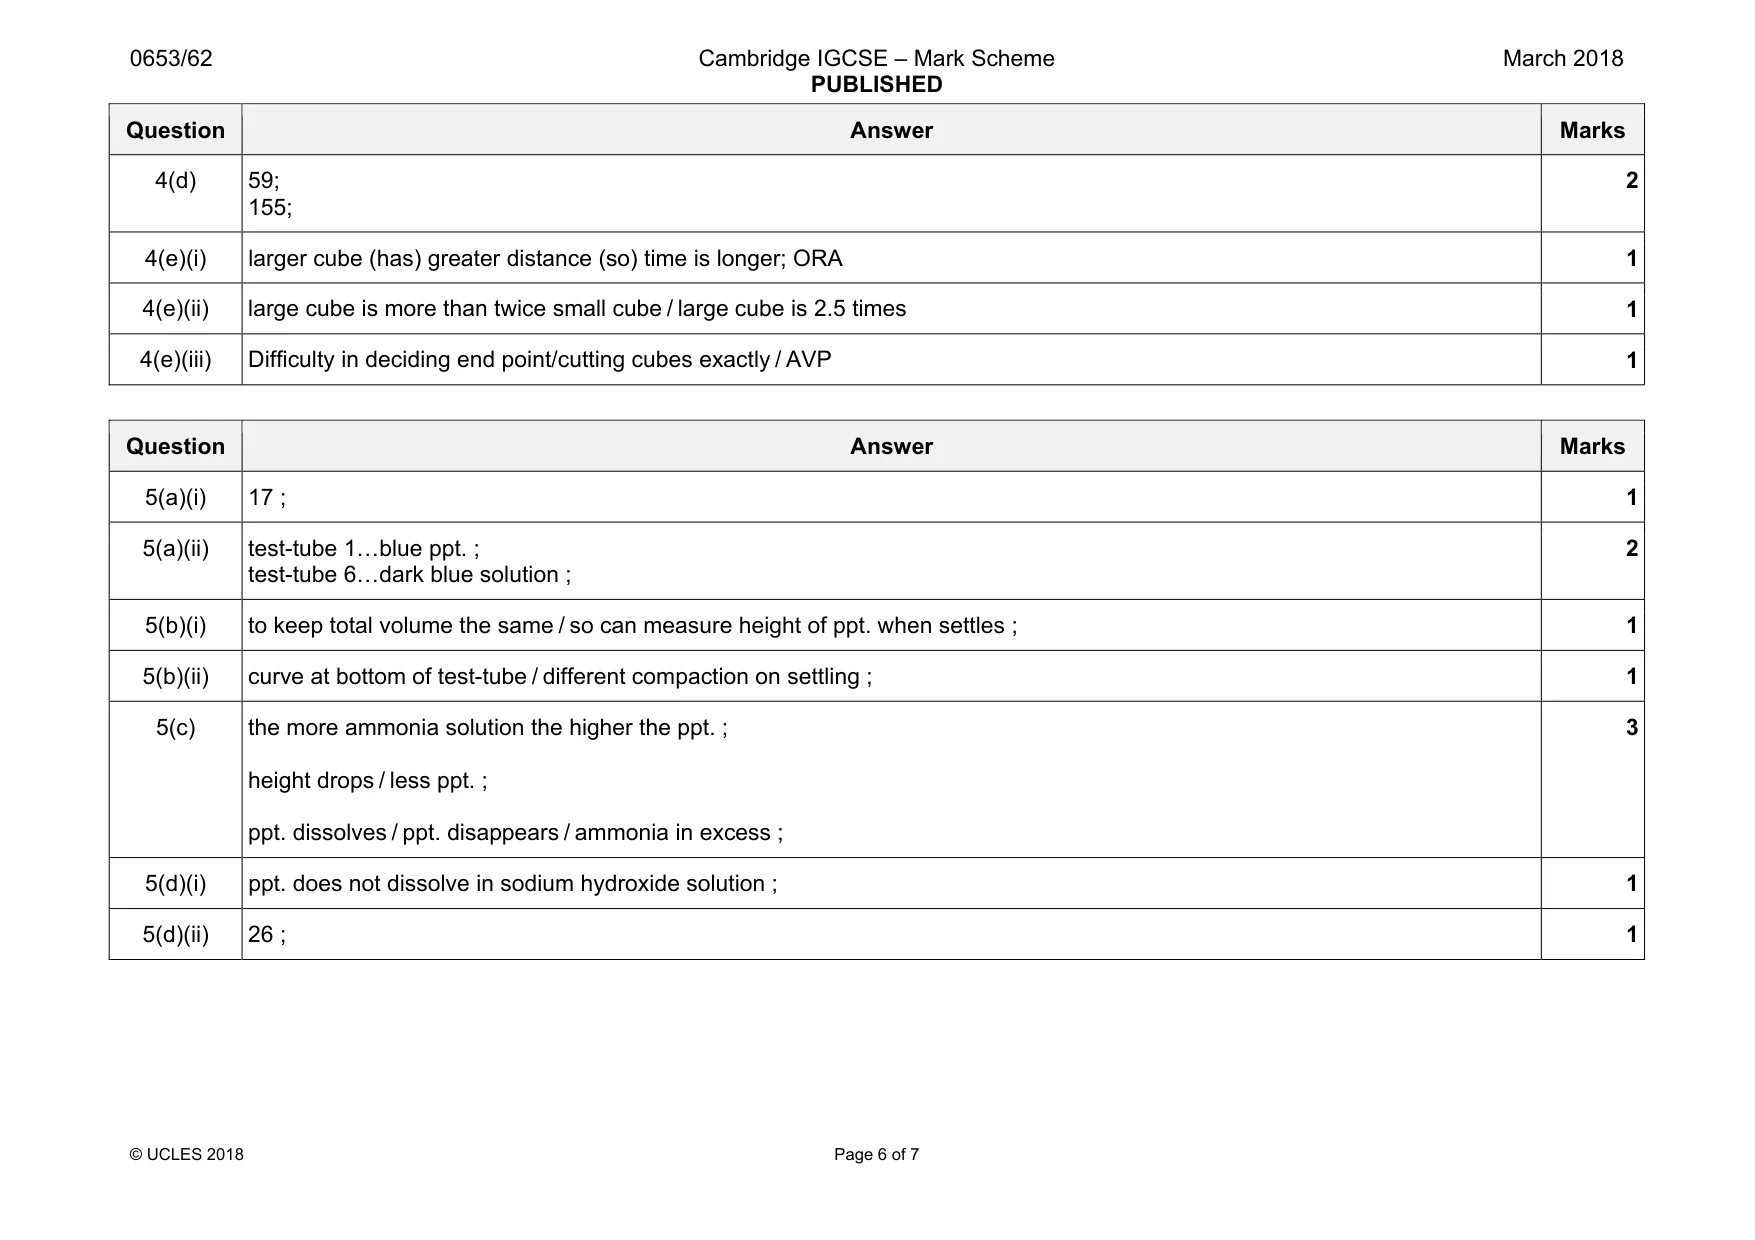
Mark scheme: 4(a)(i) Jelly is alkaline; 1 4(a)(ii) Sodium hydroxide / sodium hydrogen carbonate 1 4(b) container and acid level above jelly cube drawn; Labels for container and acid (and jelly cube) 2 4(c) 5 and 10 mm; 1 Question Answer Marks 4(d) 59; 155; 2 4(e)(i) larger cube (has) greater distance (so) time is longer; ORA 1 4(e)(ii) large cube is more than twice small cube / large cube is 2.5 times 1 4(e)(iii) Difficulty in deciding end point/cutting cubes exactly / AVP 1
Q5 · A student investigates the reaction between H and ammonia solution
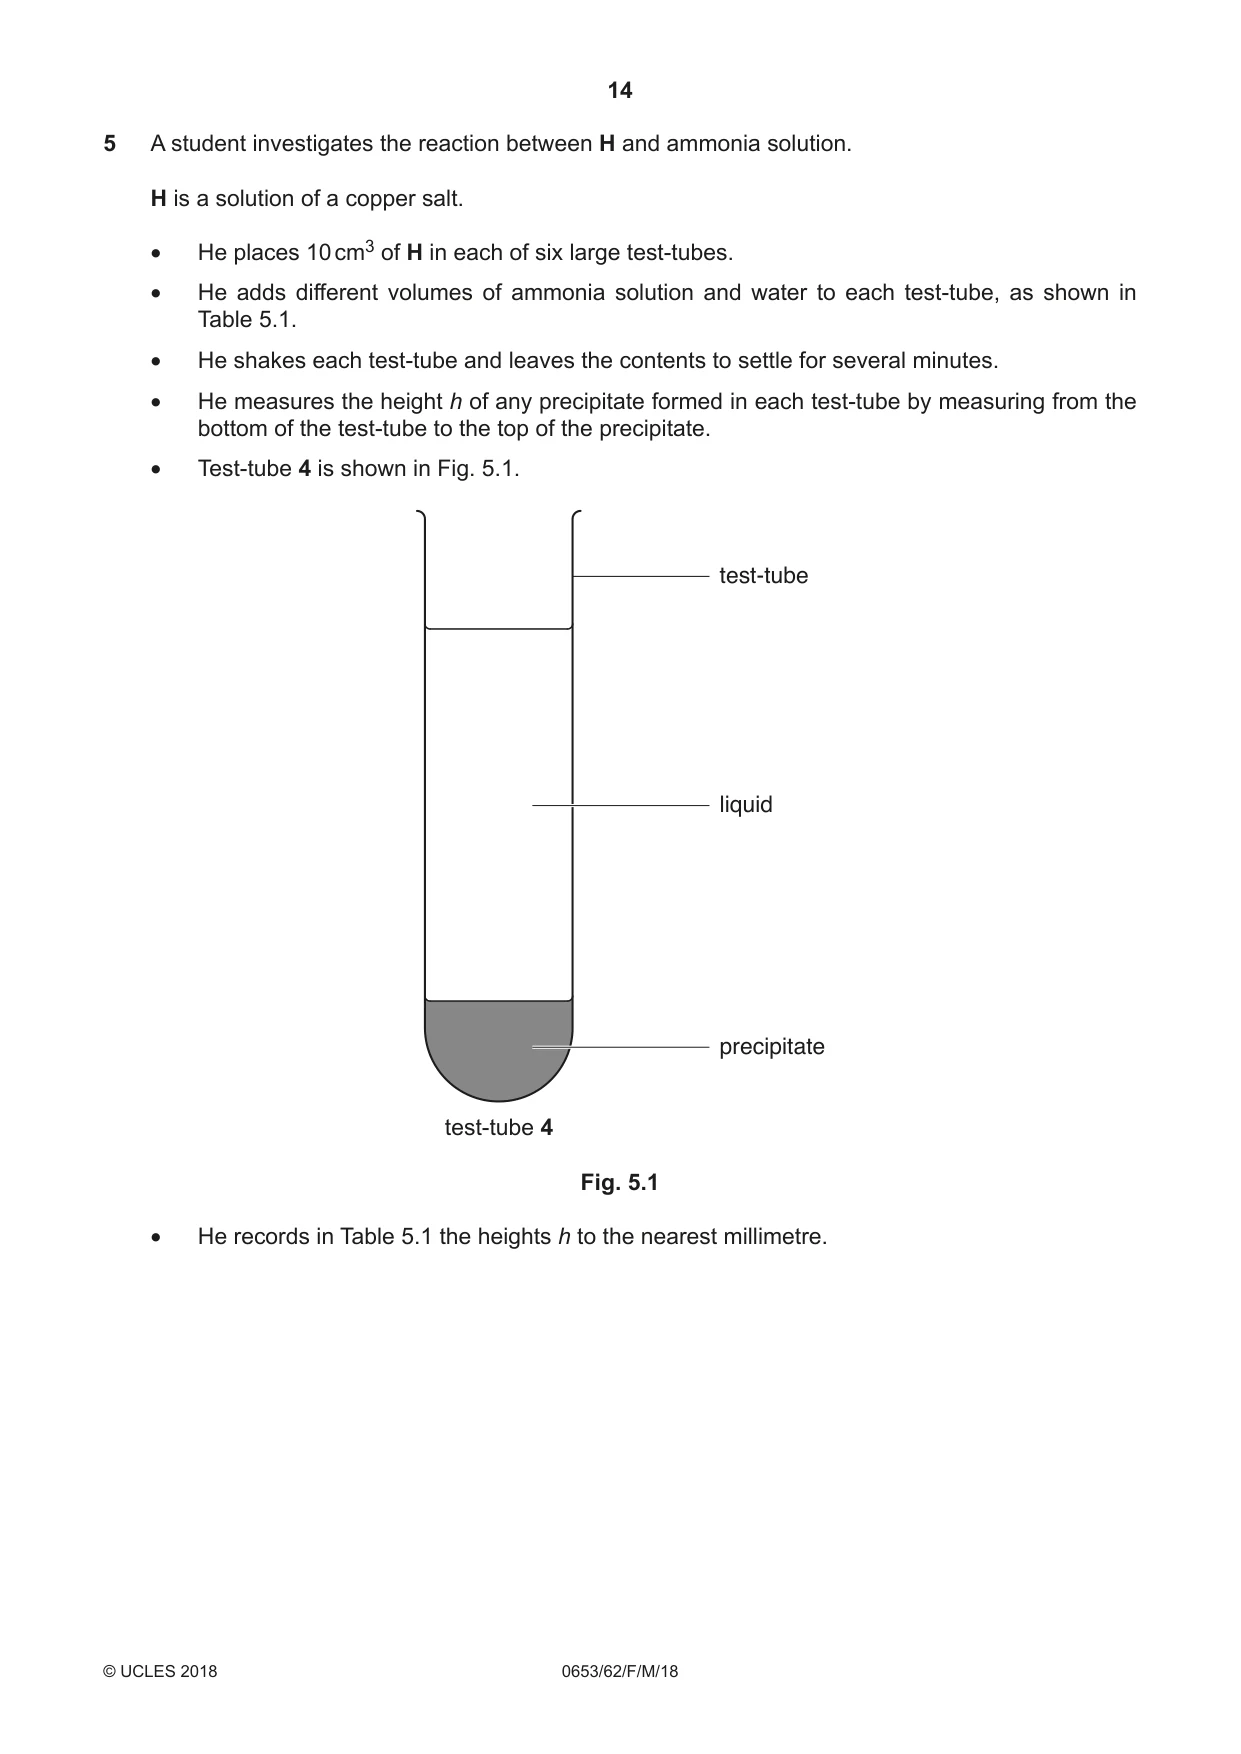
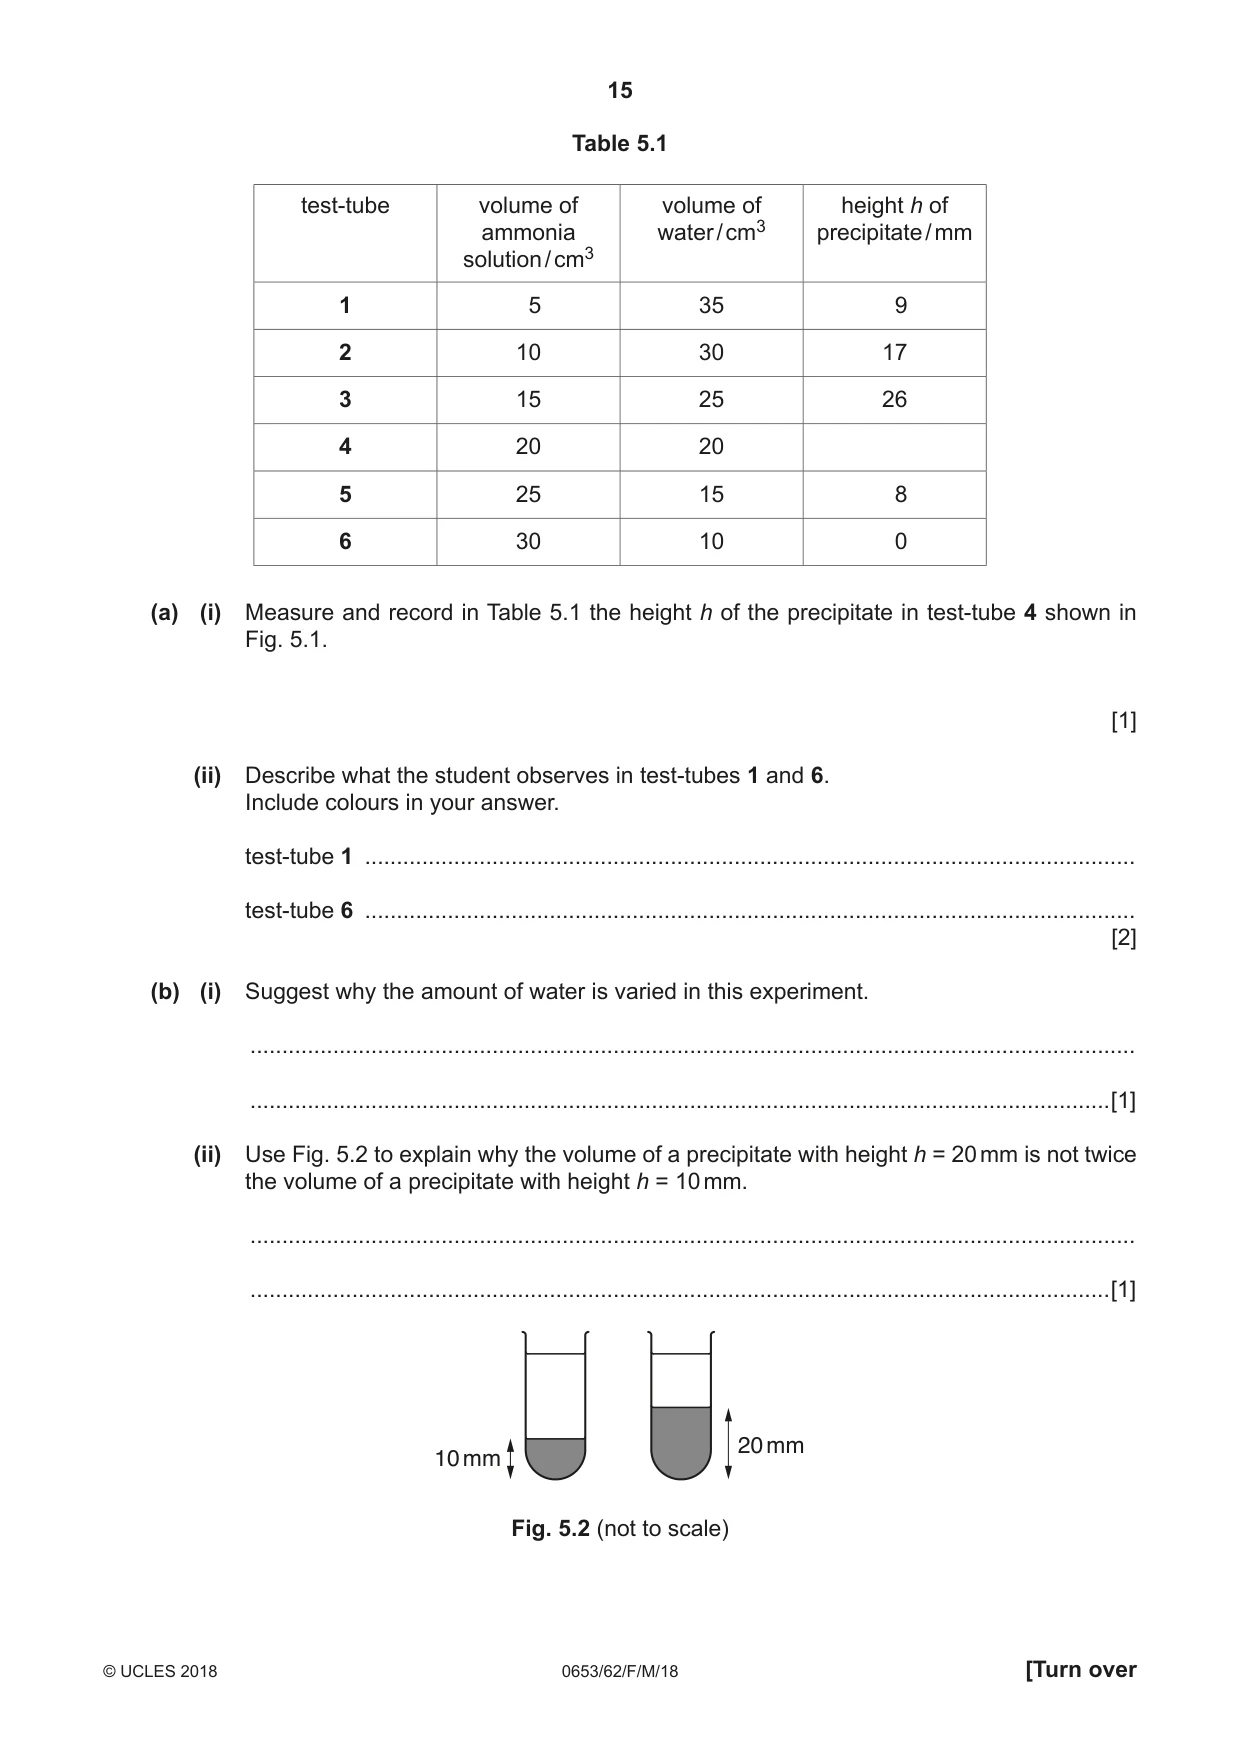
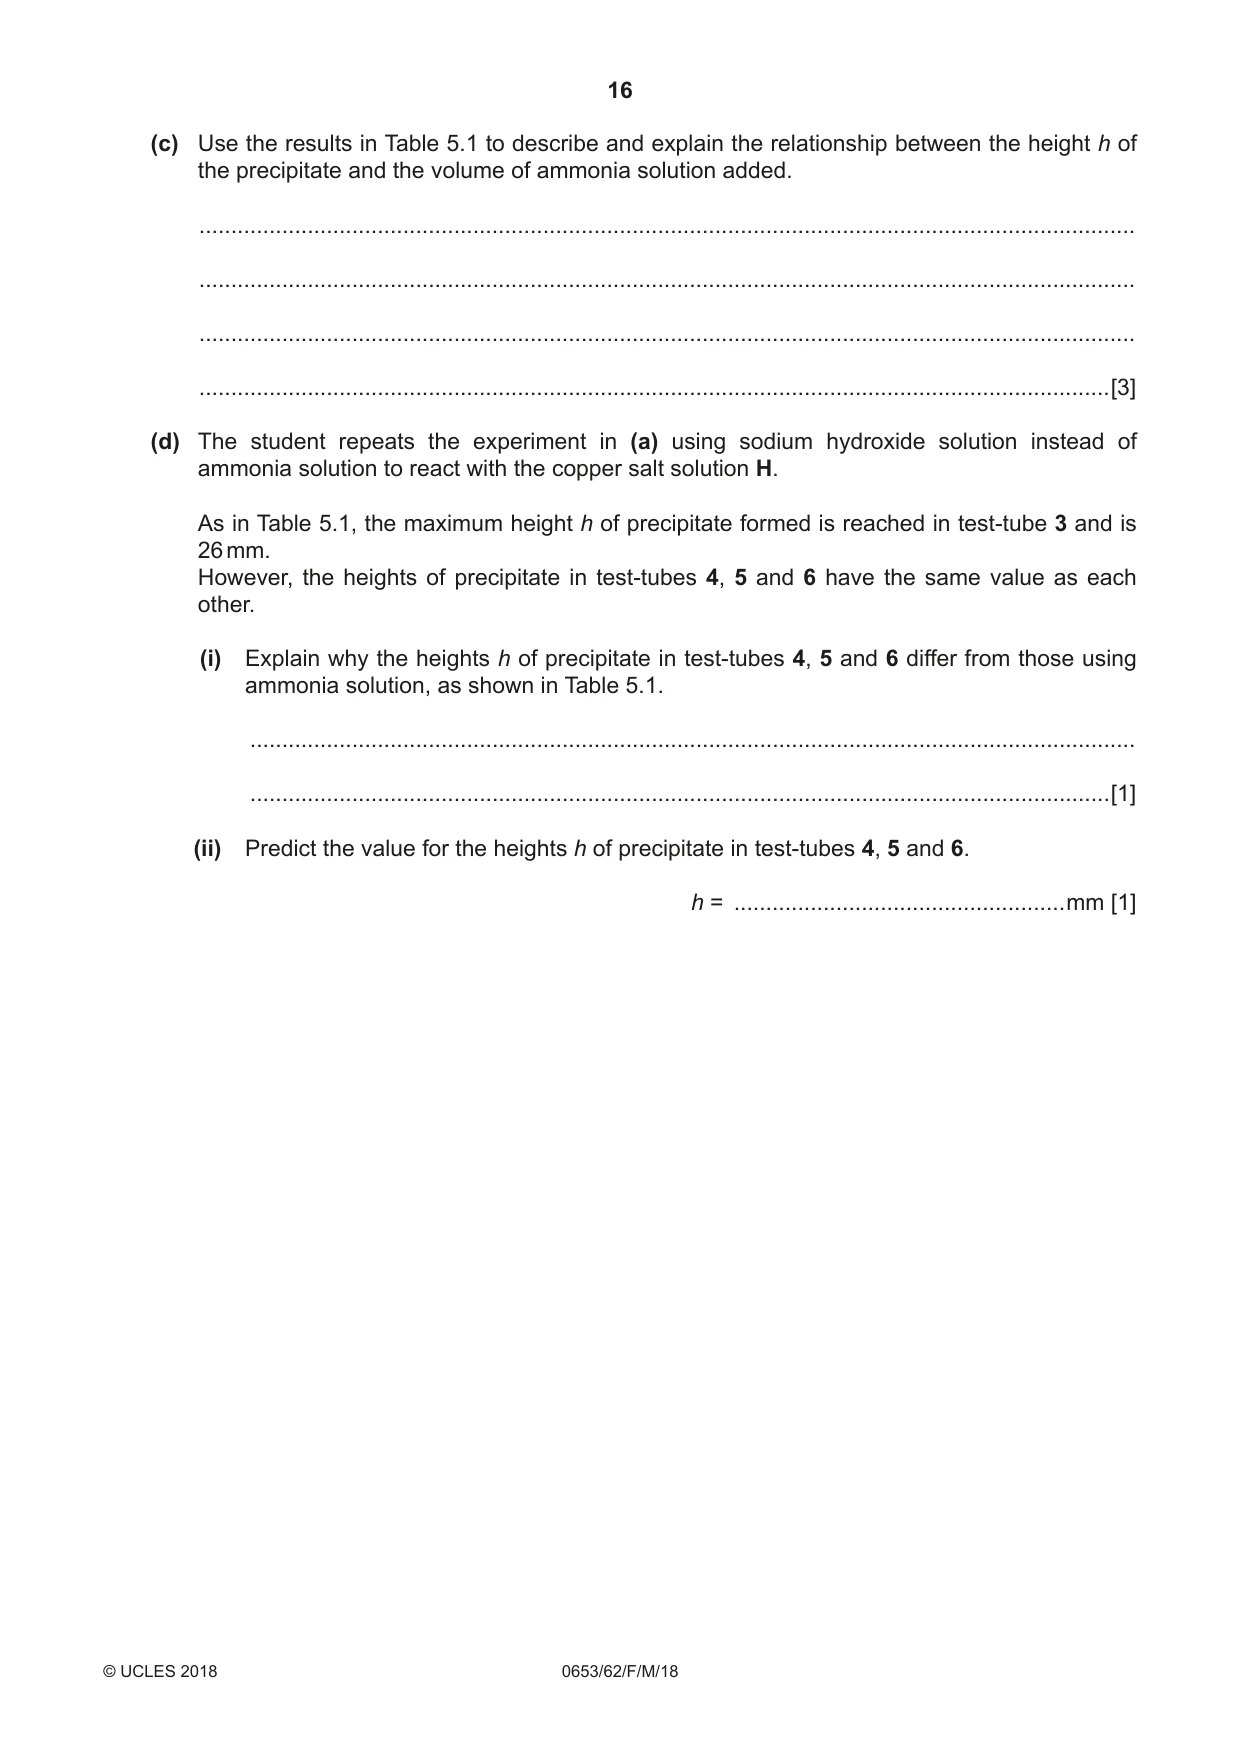
5 A student investigates the reaction between H and ammonia solution. H is a solution of a copper salt. • He places 10 cm3 of H in each of six large test-tubes. • He adds different volumes of ammonia solution and water to each test-tube, as shown in Table 5.1. • He shakes each test-tube and leaves the contents to settle for several minutes. • He measures the height h of any precipitate formed in each test-tube by measuring from the bottom of the test-tube to the top of the precipitate. • Test-tube 4 is shown in Fig. 5.1. test-tube liquid precipitate test-tube 4 Fig. 5.1 • He records in Table 5.1 the heights h to the nearest millimetre. Table 5.1 test-tube volume of volume of height h of ammonia water / cm3 precipitate / mm solution / cm3 1 5 35 9 2 10 30 17 3 15 25 26 4 20 20 5 25 15 8 6 30 10 0 (a) (i) Measure and record in Table 5.1 the height h of the precipitate in test-tube 4 shown in Fig. 5.1. [1] (ii) Describe what the student observes in test-tubes 1 and 6. Include colours in your answer. test-tube 1 ......................................................................................................................... test-tube 6 ......................................................................................................................... [2] (b) (i) Suggest why the amount of water is varied in this experiment. ........................................................................................................................................... .......................................................................................................................................[1] (ii) Use Fig. 5.2 to explain why the volume of a precipitate with height h = 20 mm is not twice the volume of a precipitate with height h = 10 mm. ........................................................................................................................................... .......................................................................................................................................[1] 20 mm 10 mm Fig. 5.2 (not to scale) (c) Use the results in Table 5.1 to describe and explain the relationship between the height h of the precipitate and the volume of ammonia solution added. ................................................................................................................................................... ................................................................................................................................................... ................................................................................................................................................... ...............................................................................................................................................[3] (d) The student repeats the experiment in (a) using sodium hydroxide solution instead of ammonia solution to react with the copper salt solution H. As in Table 5.1, the maximum height h of precipitate formed is reached in test-tube 3 and is 26 mm. However, the heights of precipitate in test-tubes 4, 5 and 6 have the same value as each other. (i) Explain why the heights h of precipitate in test-tubes 4, 5 and 6 differ from those using ammonia solution, as shown in Table 5.1. ........................................................................................................................................... .......................................................................................................................................[1] (ii) Predict the value for the heights h of precipitate in test-tubes 4, 5 and 6. h = ....................................................mm [1]
Mark scheme: 5(a)(i) 17 ; 1 5(a)(ii) test-tube 1«blue ppt. ; test-tube 6«dark blue solution ; 2 5(b)(i) to keep total volume the same / so can measure height of ppt. when settles ; 1 5(b)(ii) curve at bottom of test-tube / different compaction on settling ; 1 5(c) the more ammonia solution the higher the ppt. ; height drops / less ppt. ; ppt. dissolves / ppt. disappears / ammonia in excess ; 3 5(d)(i) ppt. does not dissolve in sodium hydroxide solution ; 1 5(d)(ii) 26 ; 1
Q6 · A student measures the density of modelling clay by two different methods and compares…
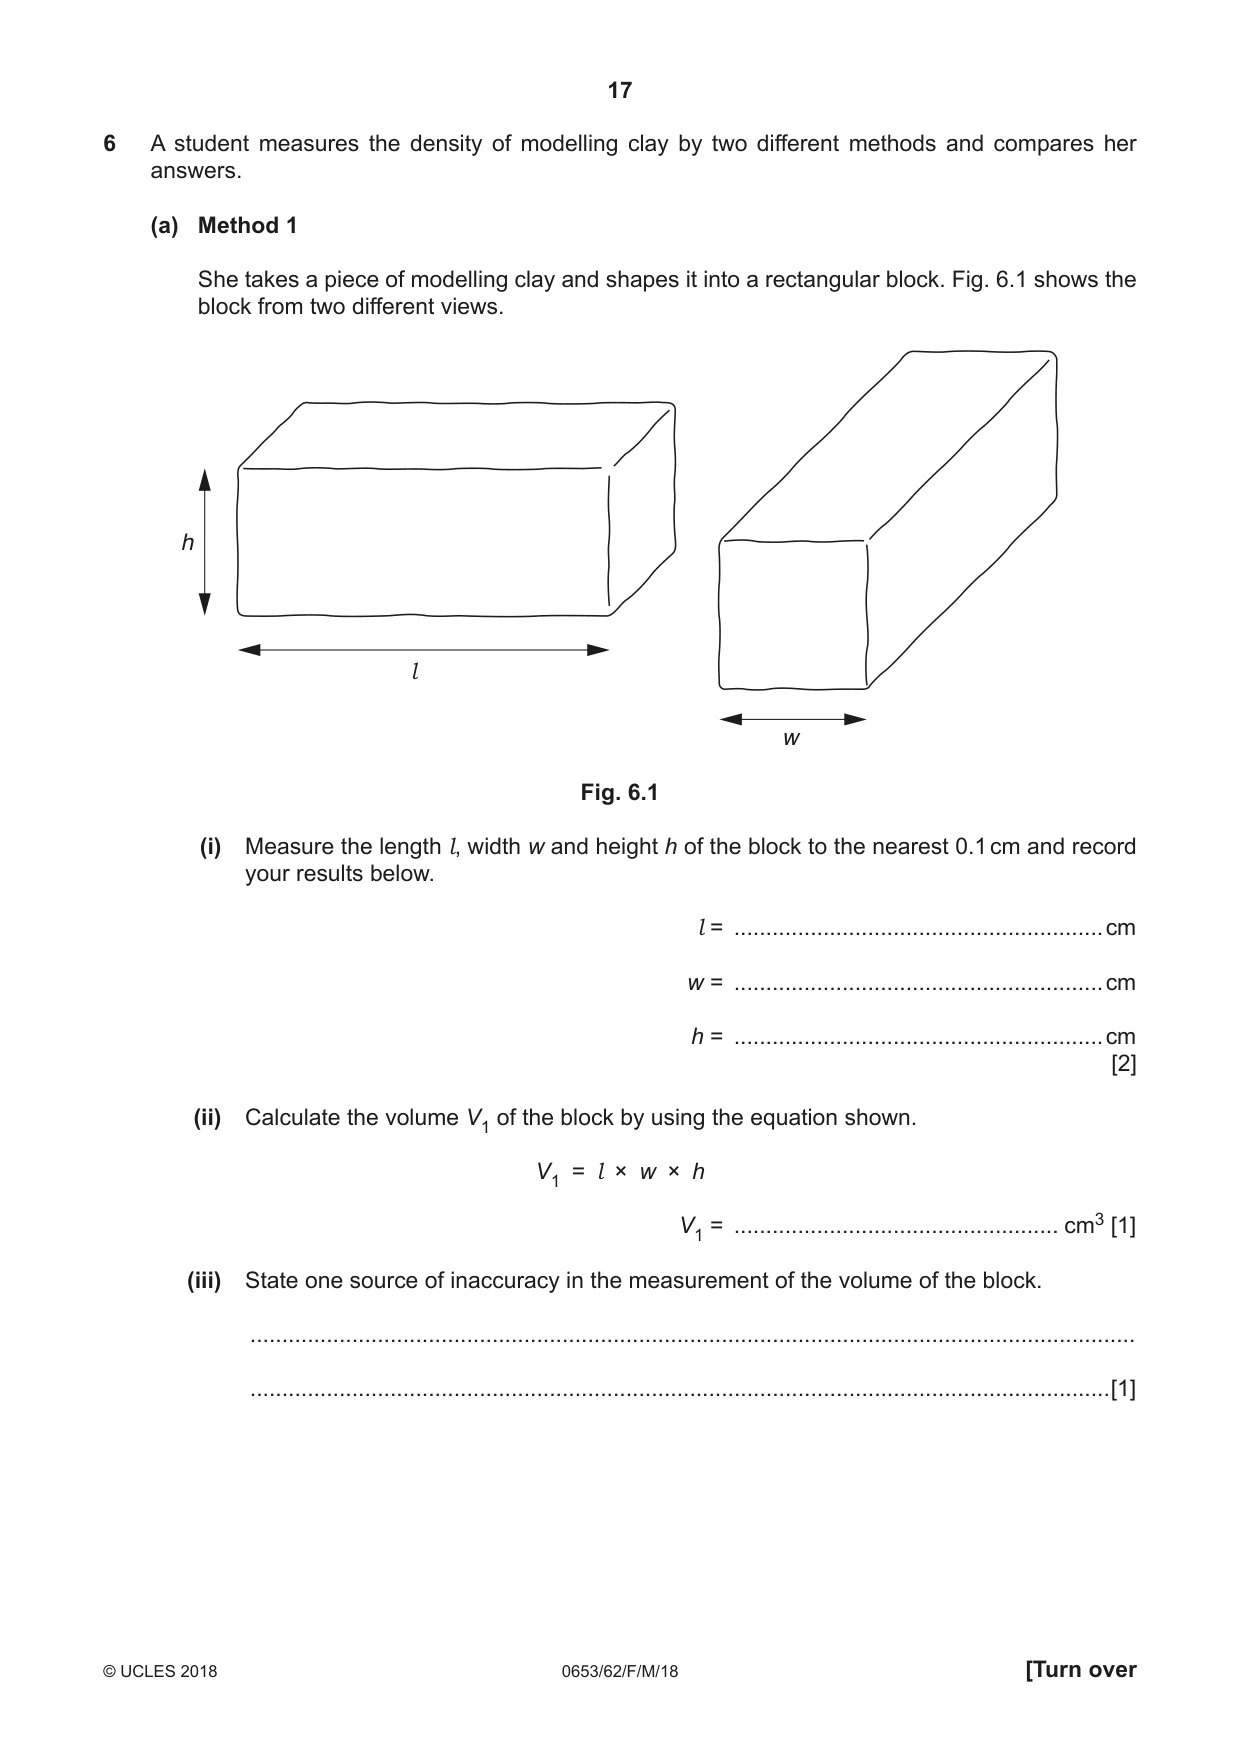
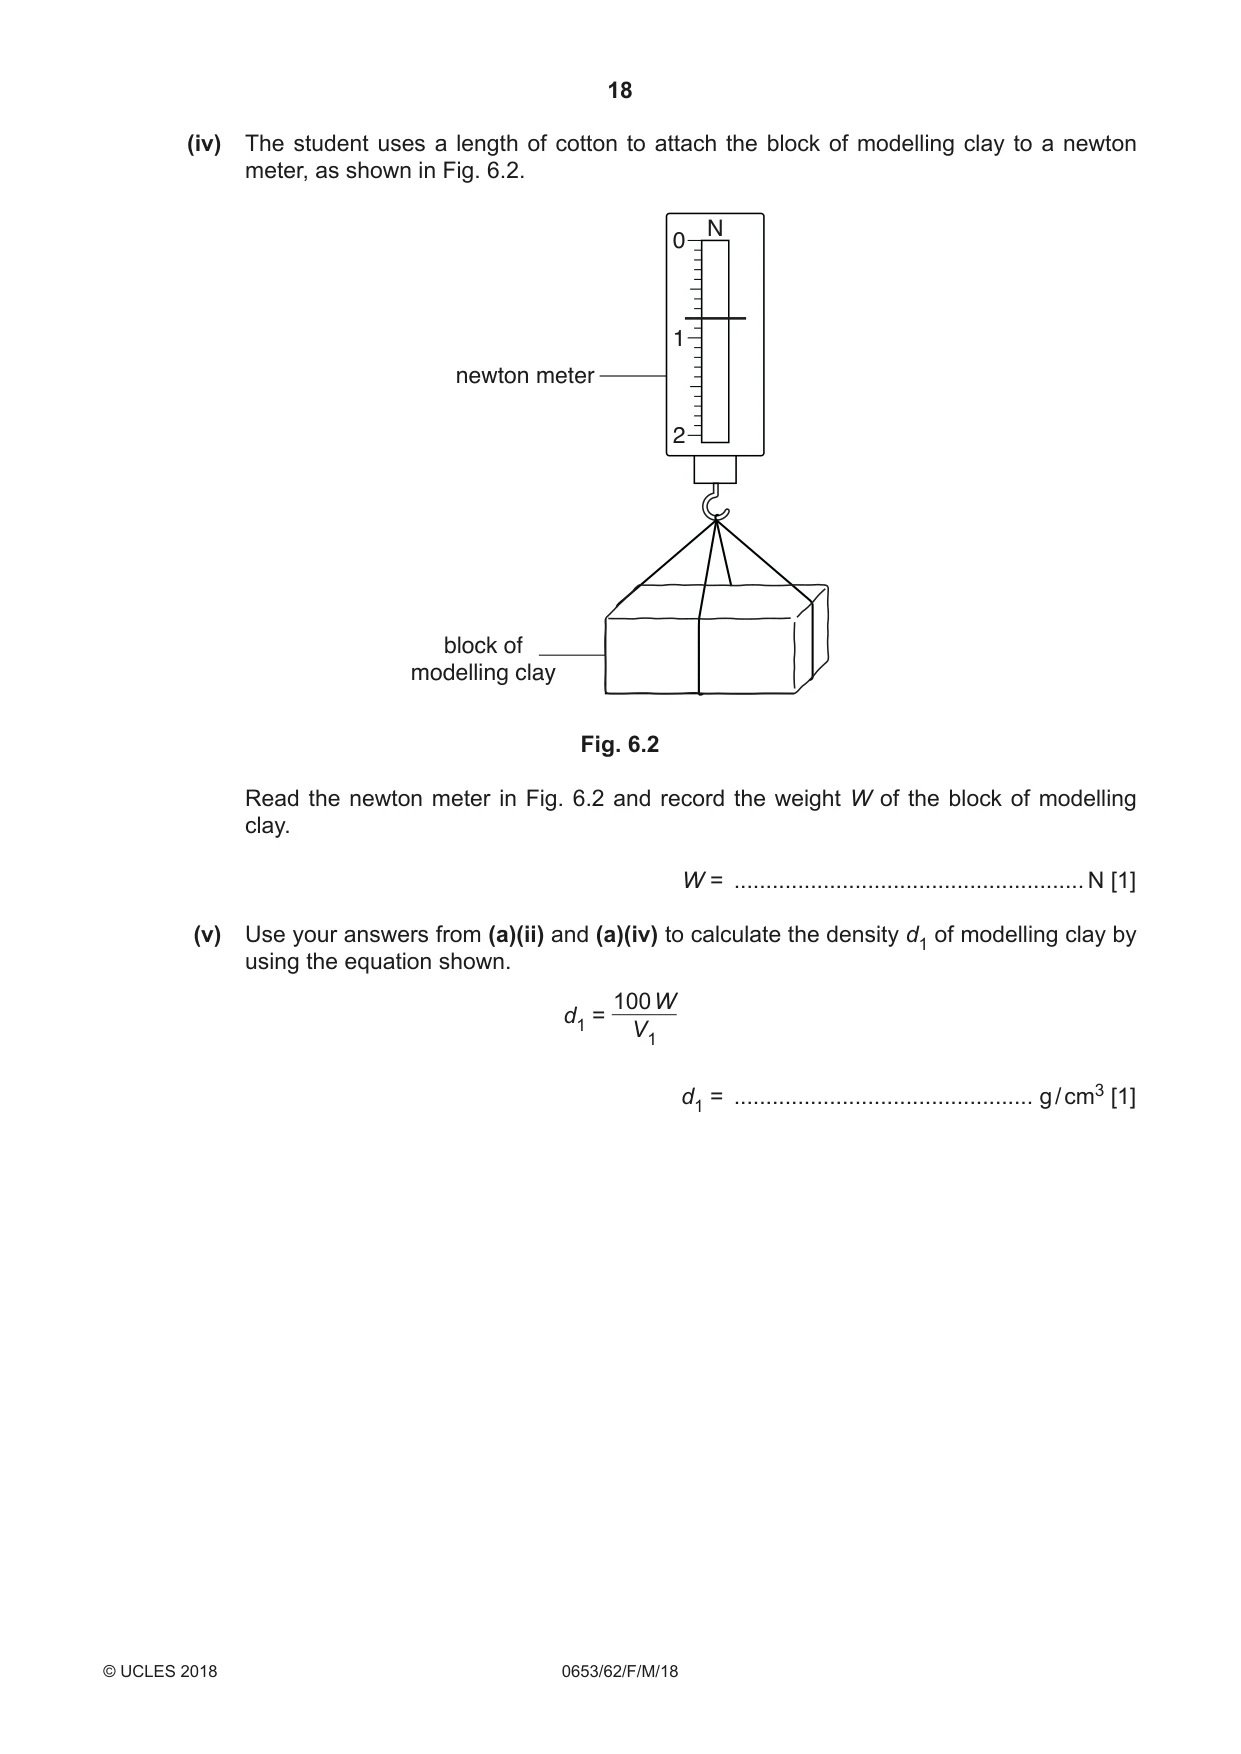
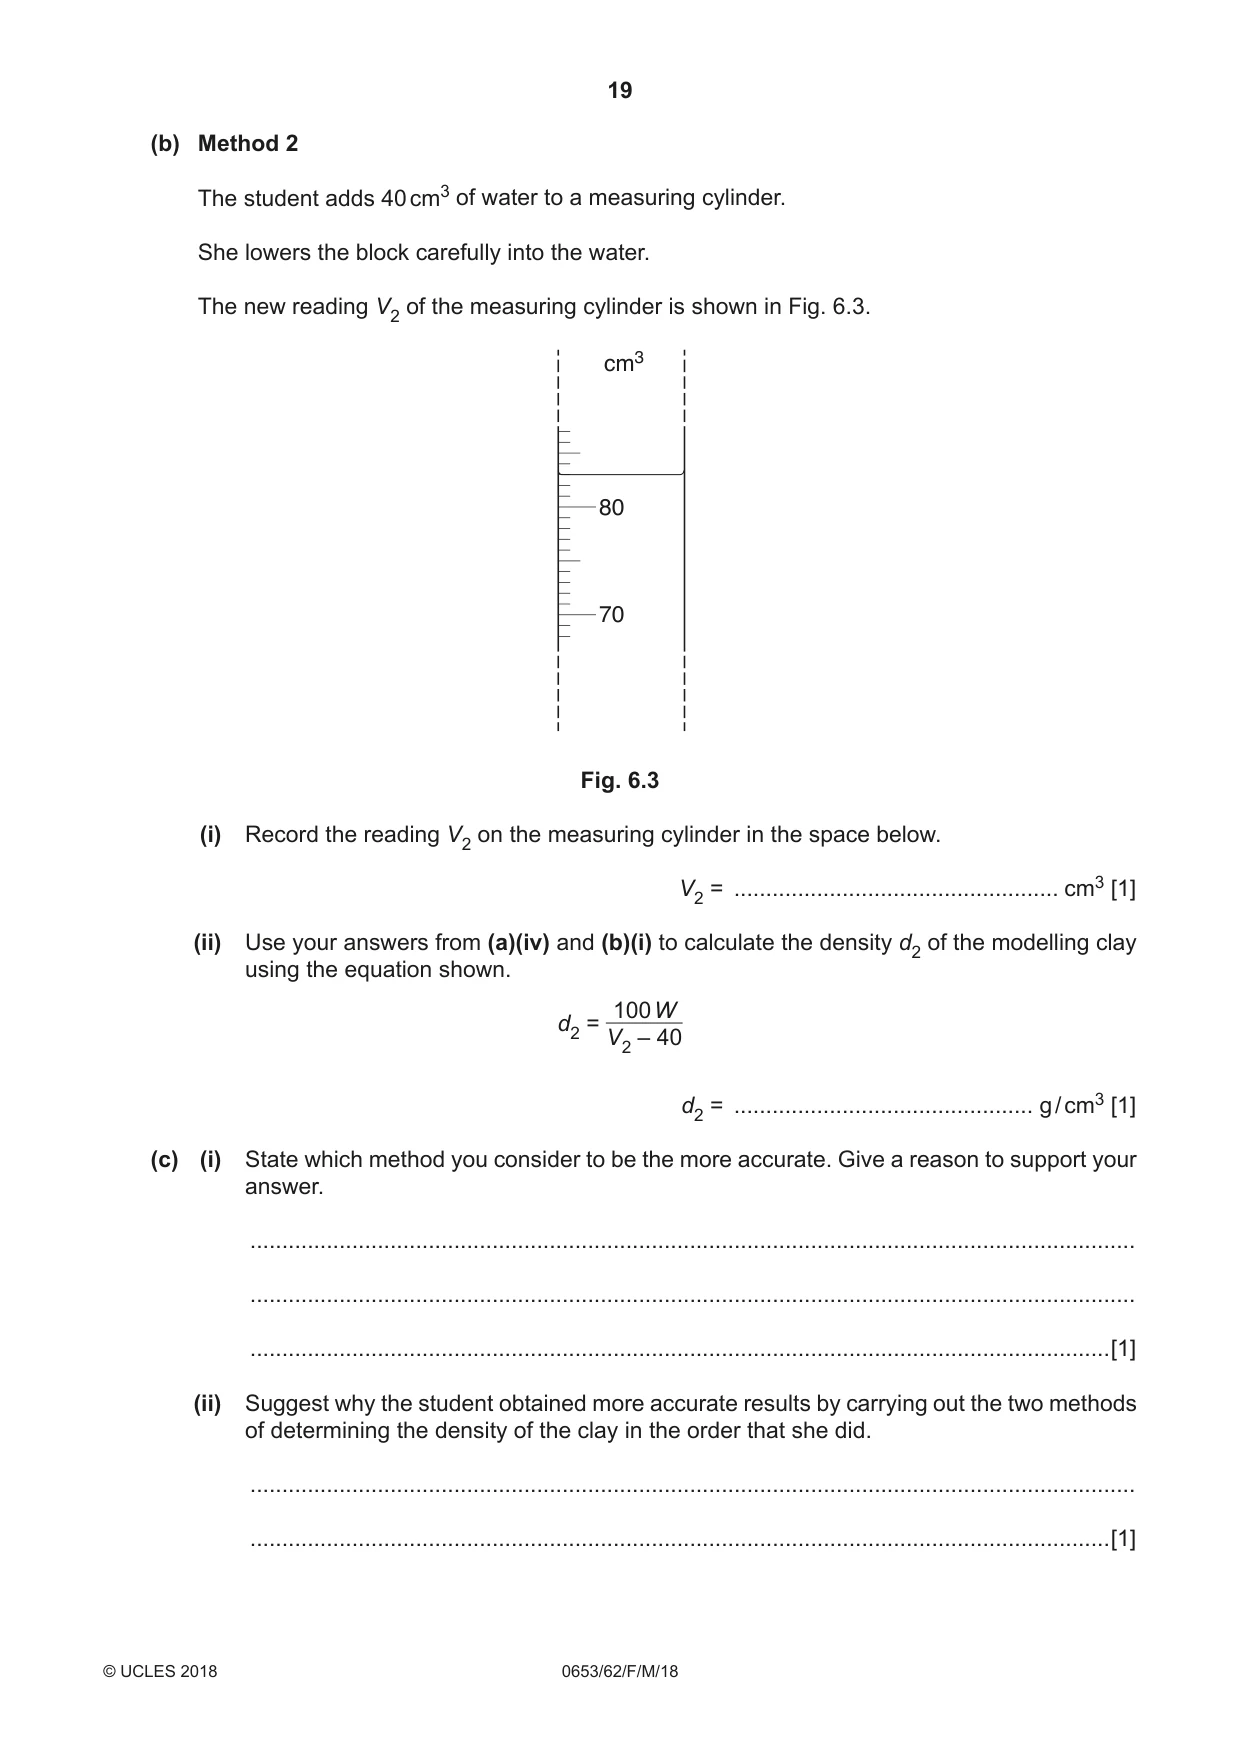
6 A student measures the density of modelling clay by two different methods and compares her answers. (a) Method 1 She takes a piece of modelling clay and shapes it into a rectangular block. Fig. 6.1 shows the block from two different views. h l w Fig. 6.1 (i) Measure the length l, width w and height h of the block to the nearest 0.1 cm and record your results below. l = ..........................................................cm w = ..........................................................cm h = ..........................................................cm [2] (ii) Calculate the volume V1 of the block by using the equation shown. V1 = l × w × h V1 = ................................................... cm3 [1] (iii) State one source of inaccuracy in the measurement of the volume of the block. ........................................................................................................................................... .......................................................................................................................................[1] (iv) The student uses a length of cotton to attach the block of modelling clay to a newton meter, as shown in Fig. 6.2. N 0 1 newton meter 2 block of modelling clay Fig. 6.2 Read the newton meter in Fig. 6.2 and record the weight W of the block of modelling clay. W = ....................................................... N [1] (v) Use your answers from (a)(ii) and (a)(iv) to calculate the density d1 of modelling clay by using the equation shown. 100 W d1 = V1 d1 = ............................................... g / cm3 [1] (b) Method 2 The student adds 40 cm3 of water to a measuring cylinder. She lowers the block carefully into the water. The new reading V2 of the measuring cylinder is shown in Fig. 6.3. cm3 80 70 Fig. 6.3 (i) Record the reading V2 on the measuring cylinder in the space below. V2 = ................................................... cm3 [1] (ii) Use your answers from (a)(iv) and (b)(i) to calculate the density d2 of the modelling clay using the equation shown. 100 W d2 = V2 – 40 d2 = ............................................... g / cm3 [1] (c) (i) State which method you consider to be the more accurate. Give a reason to support your answer. ........................................................................................................................................... ........................................................................................................................................... .......................................................................................................................................[1] (ii) Suggest why the student obtained more accurate results by carrying out the two methods of determining the density of the clay in the order that she did. ........................................................................................................................................... .......................................................................................................................................[1]
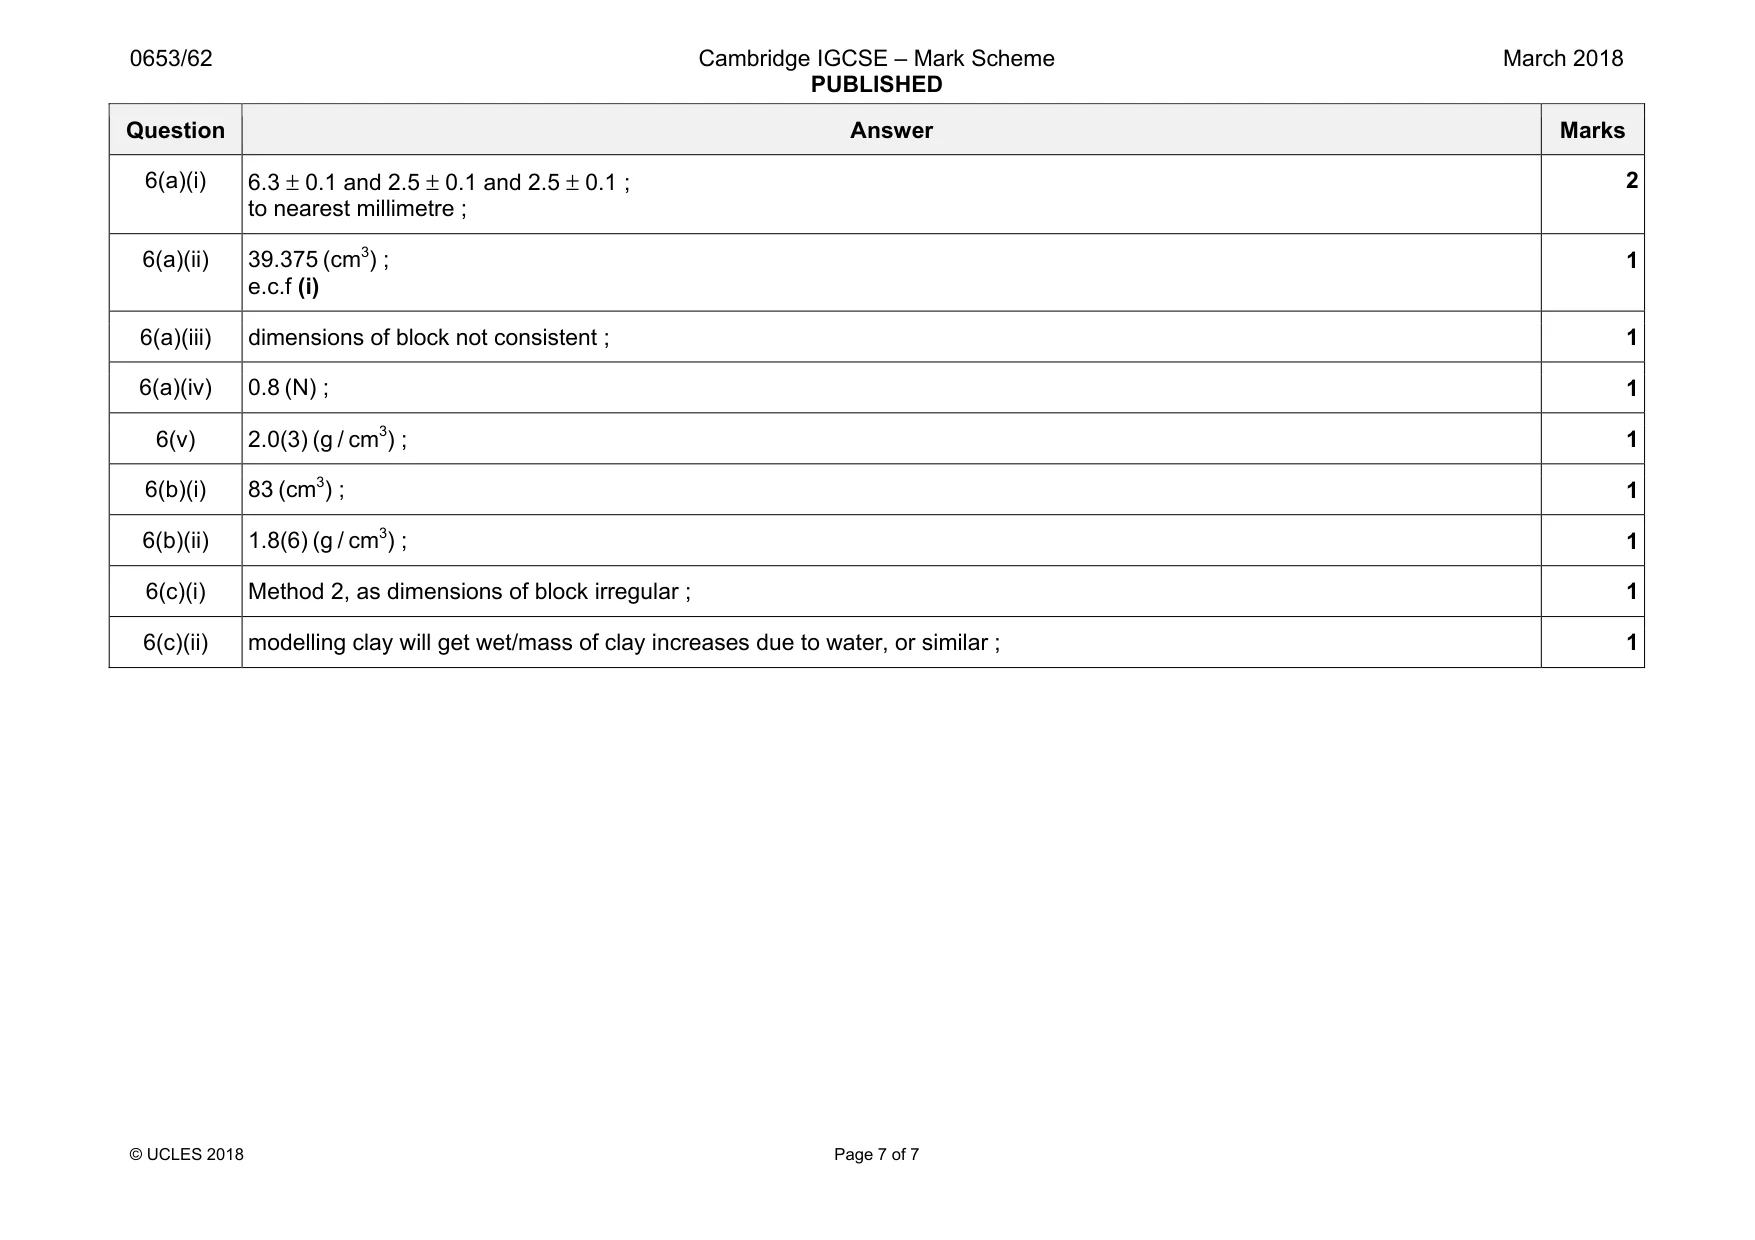
Mark scheme: 6(a)(i) to nearest millimetre ; 2 6(a)(ii) 39.375 (cm3) ; e.c.f (i) 1 6(a)(iii) dimensions of block not consistent ; 1 6(a)(iv) 0.8 (N) ; 1 6(v) 2.0(3) (g / cm3) ; 1 6(b)(i) 83 (cm3) ; 1 6(b)(ii) 1.8(6) (g / cm3) ; 1 6(c)(i) Method 2, as dimensions of block irregular ; 1 6(c)(ii) modelling clay will get wet/mass of clay increases due to water, or similar ; 1
What was in this paper
The subtopics covered by these 6 questions, and how many questions each got. Open one in a new tab to see every Cambridge question on it.
What you needed in this session
Cambridge’s own grade thresholds for 2018 Feb/March, Paper 6 · Variant 2. A higher threshold means an easier paper — the bar moves with how the cohort did.