Cambridge IGCSE Science - Combined 0653 — 2017 Oct/Nov Paper 6 · Variant 2
0653/62/O/N/17 · 6 questions · 60 marks · ≈68 min
The question paper and its mark scheme, free to read here and free to download. This is Cambridge’s own paper, exactly as it was sat.
Question paper20 pages



Mark scheme5 pages
Answers below. Sit the paper first if you are practising.
Questions as text
Q1 · A bean seedling from a seed that has germinated and has started to grow
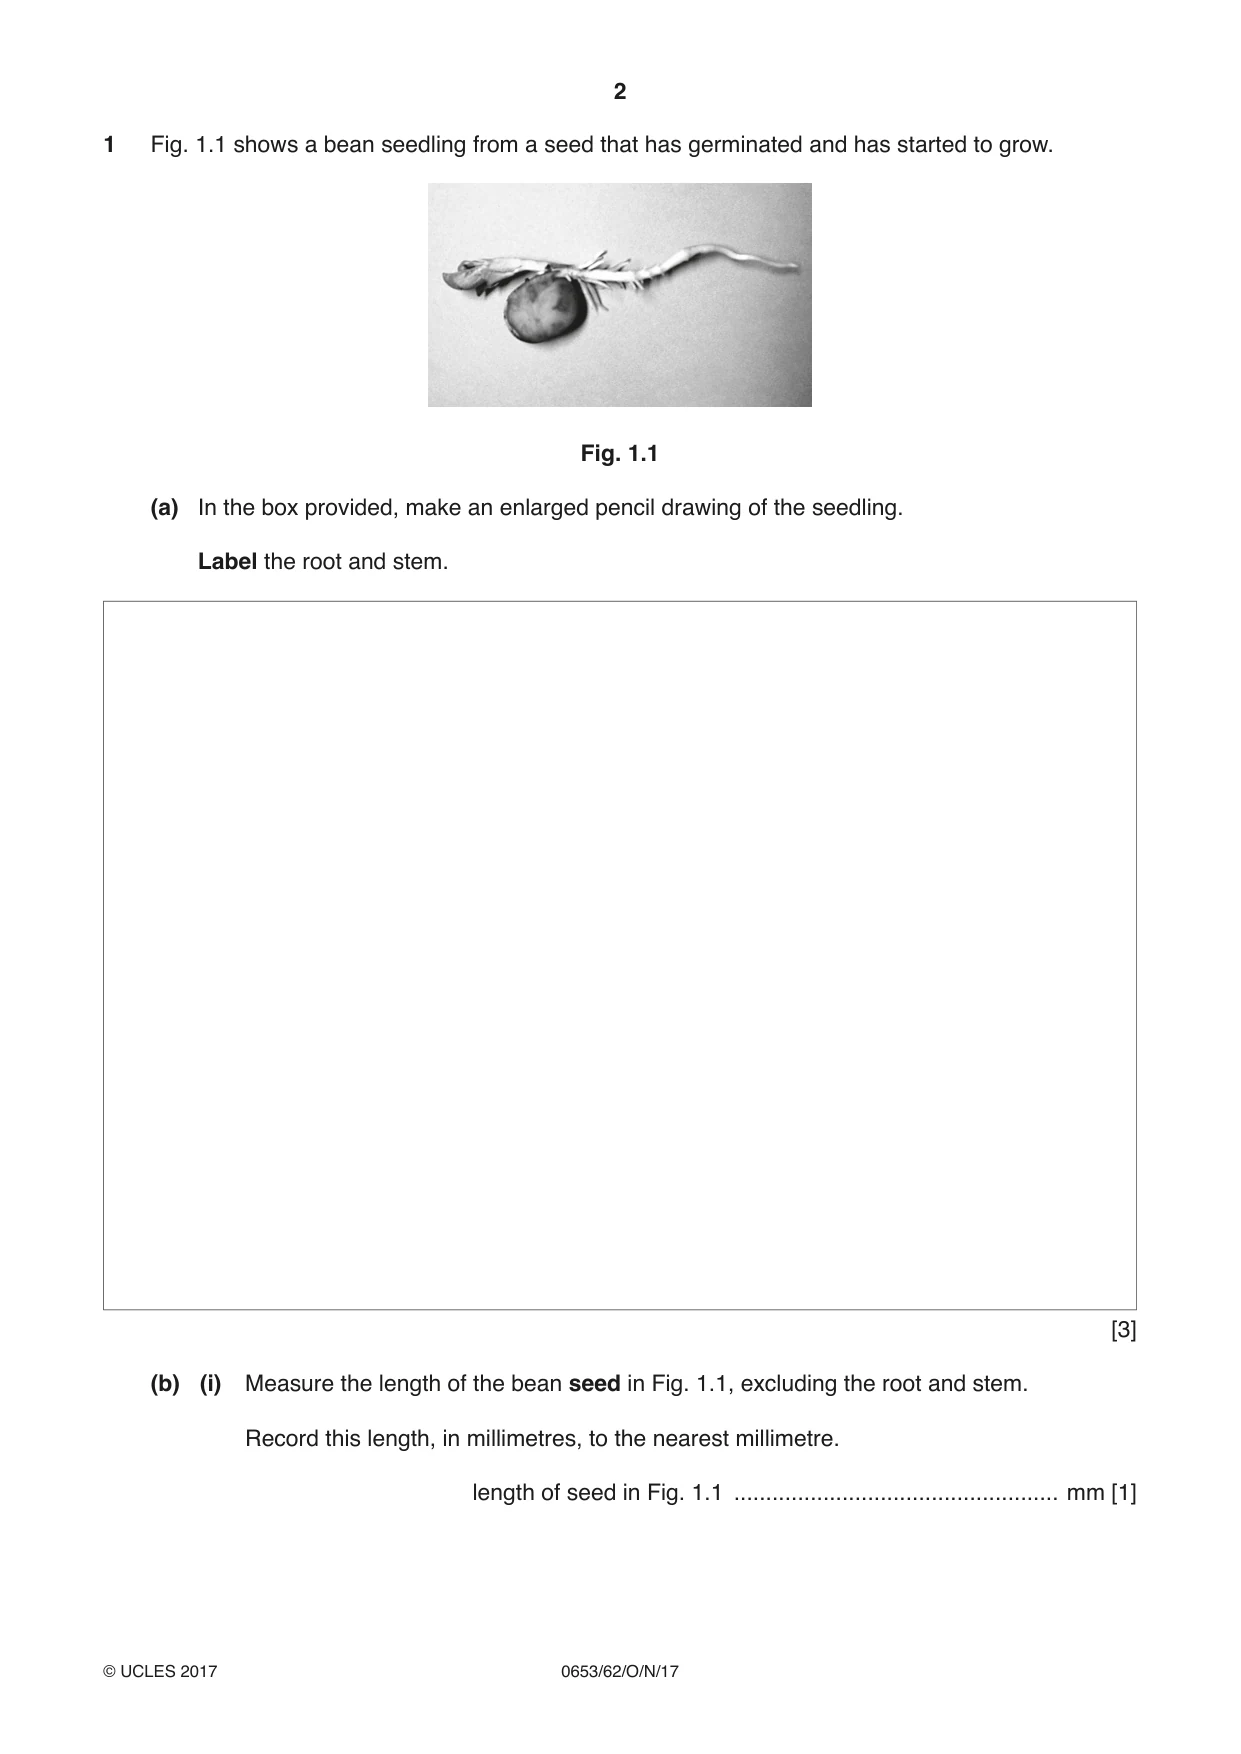
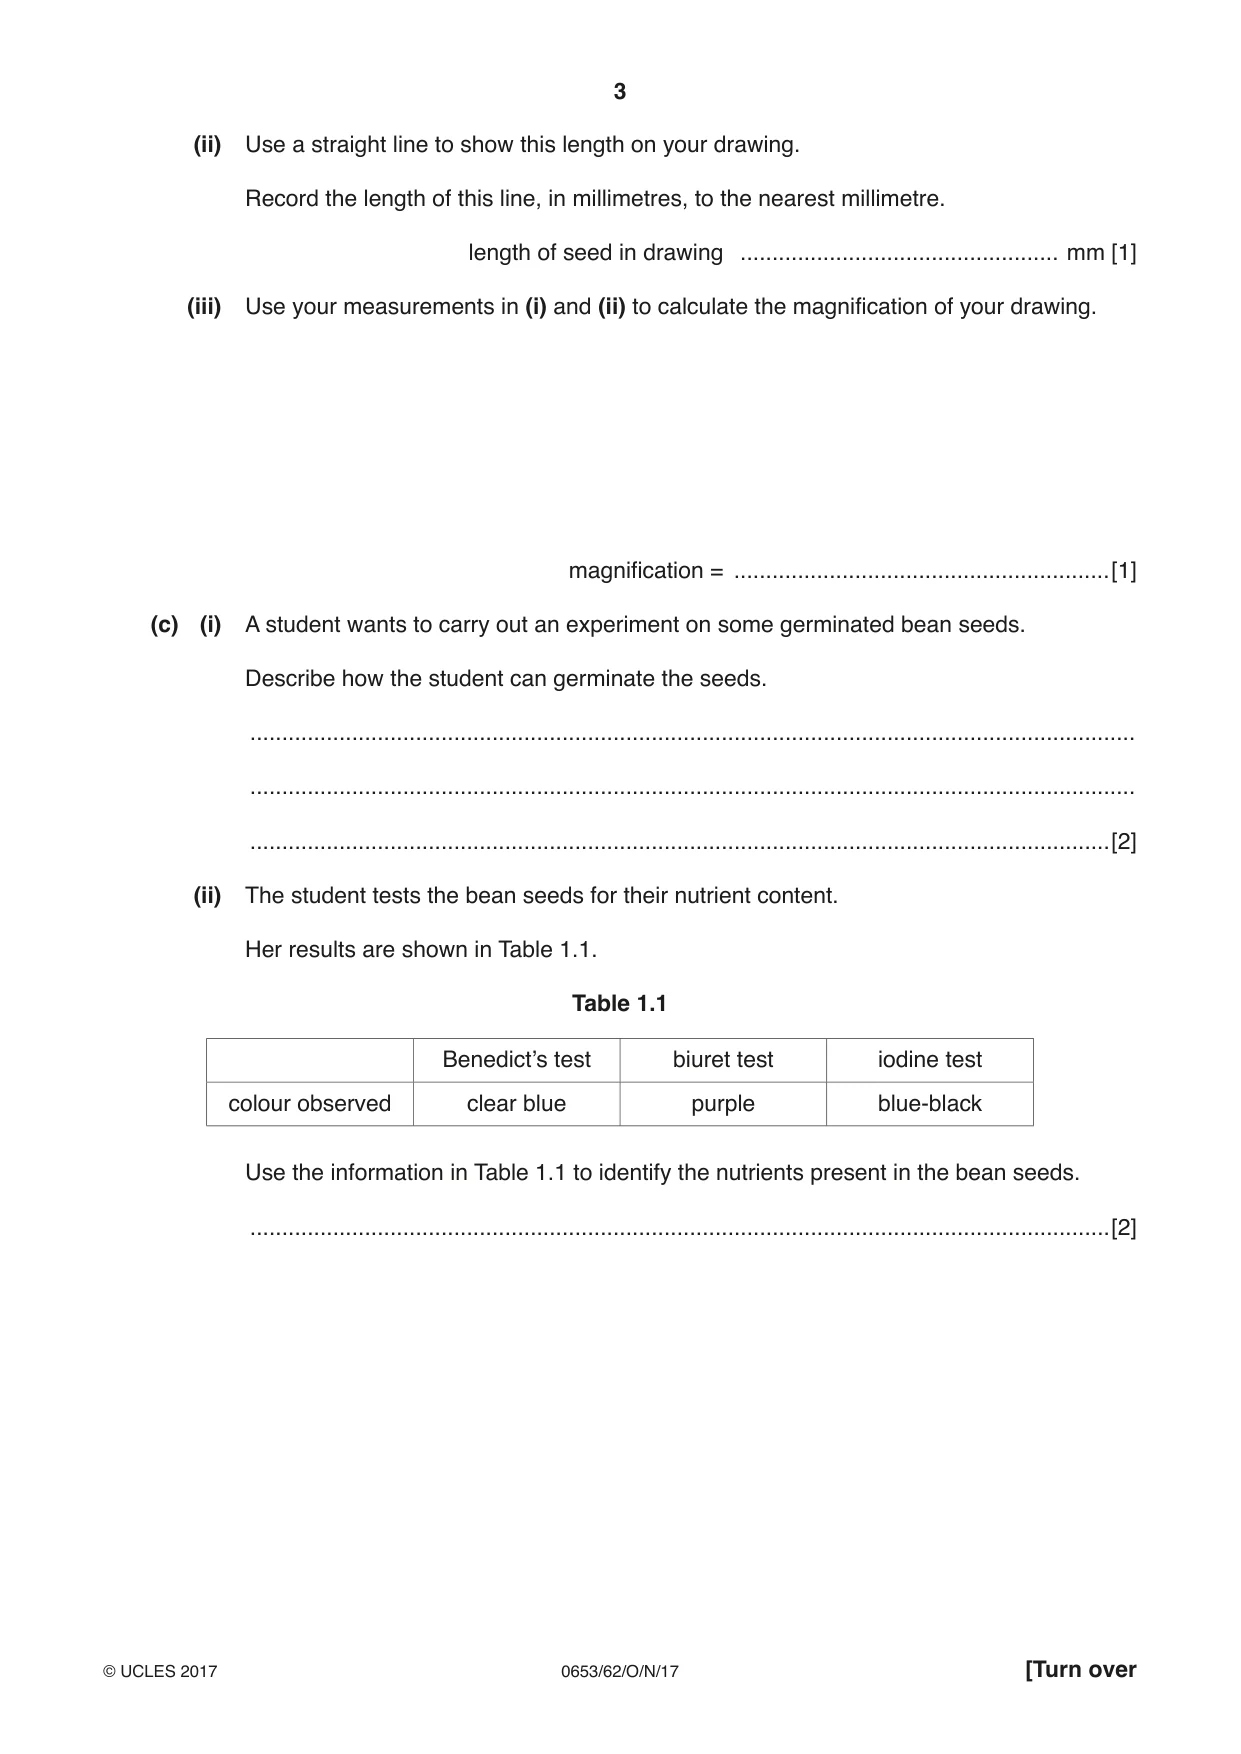
1 Fig. 1.1 shows a bean seedling from a seed that has germinated and has started to grow. Fig. 1.1 (a) In the box provided, make an enlarged pencil drawing of the seedling. Label the root and stem. [3] (b) (i) Measure the length of the bean seed in Fig. 1.1, excluding the root and stem. Record this length, in millimetres, to the nearest millimetre. length of seed in Fig. 1.1 ................................................... mm [1] (ii) Use a straight line to show this length on your drawing. Record the length of this line, in millimetres, to the nearest millimetre. length of seed in drawing .................................................. mm [1] (iii) Use your measurements in (i) and (ii) to calculate the magnification of your drawing. magnification = ...........................................................[1] (c) (i) A student wants to carry out an experiment on some germinated bean seeds. Describe how the student can germinate the seeds. ........................................................................................................................................... ........................................................................................................................................... .......................................................................................................................................[2] (ii) The student tests the bean seeds for their nutrient content. Her results are shown in Table 1.1. Table 1.1 Benedict’s test biuret test iodine test colour observed clear blue purple blue-black Use the information in Table 1.1 to identify the nutrients present in the bean seeds. .......................................................................................................................................[2]
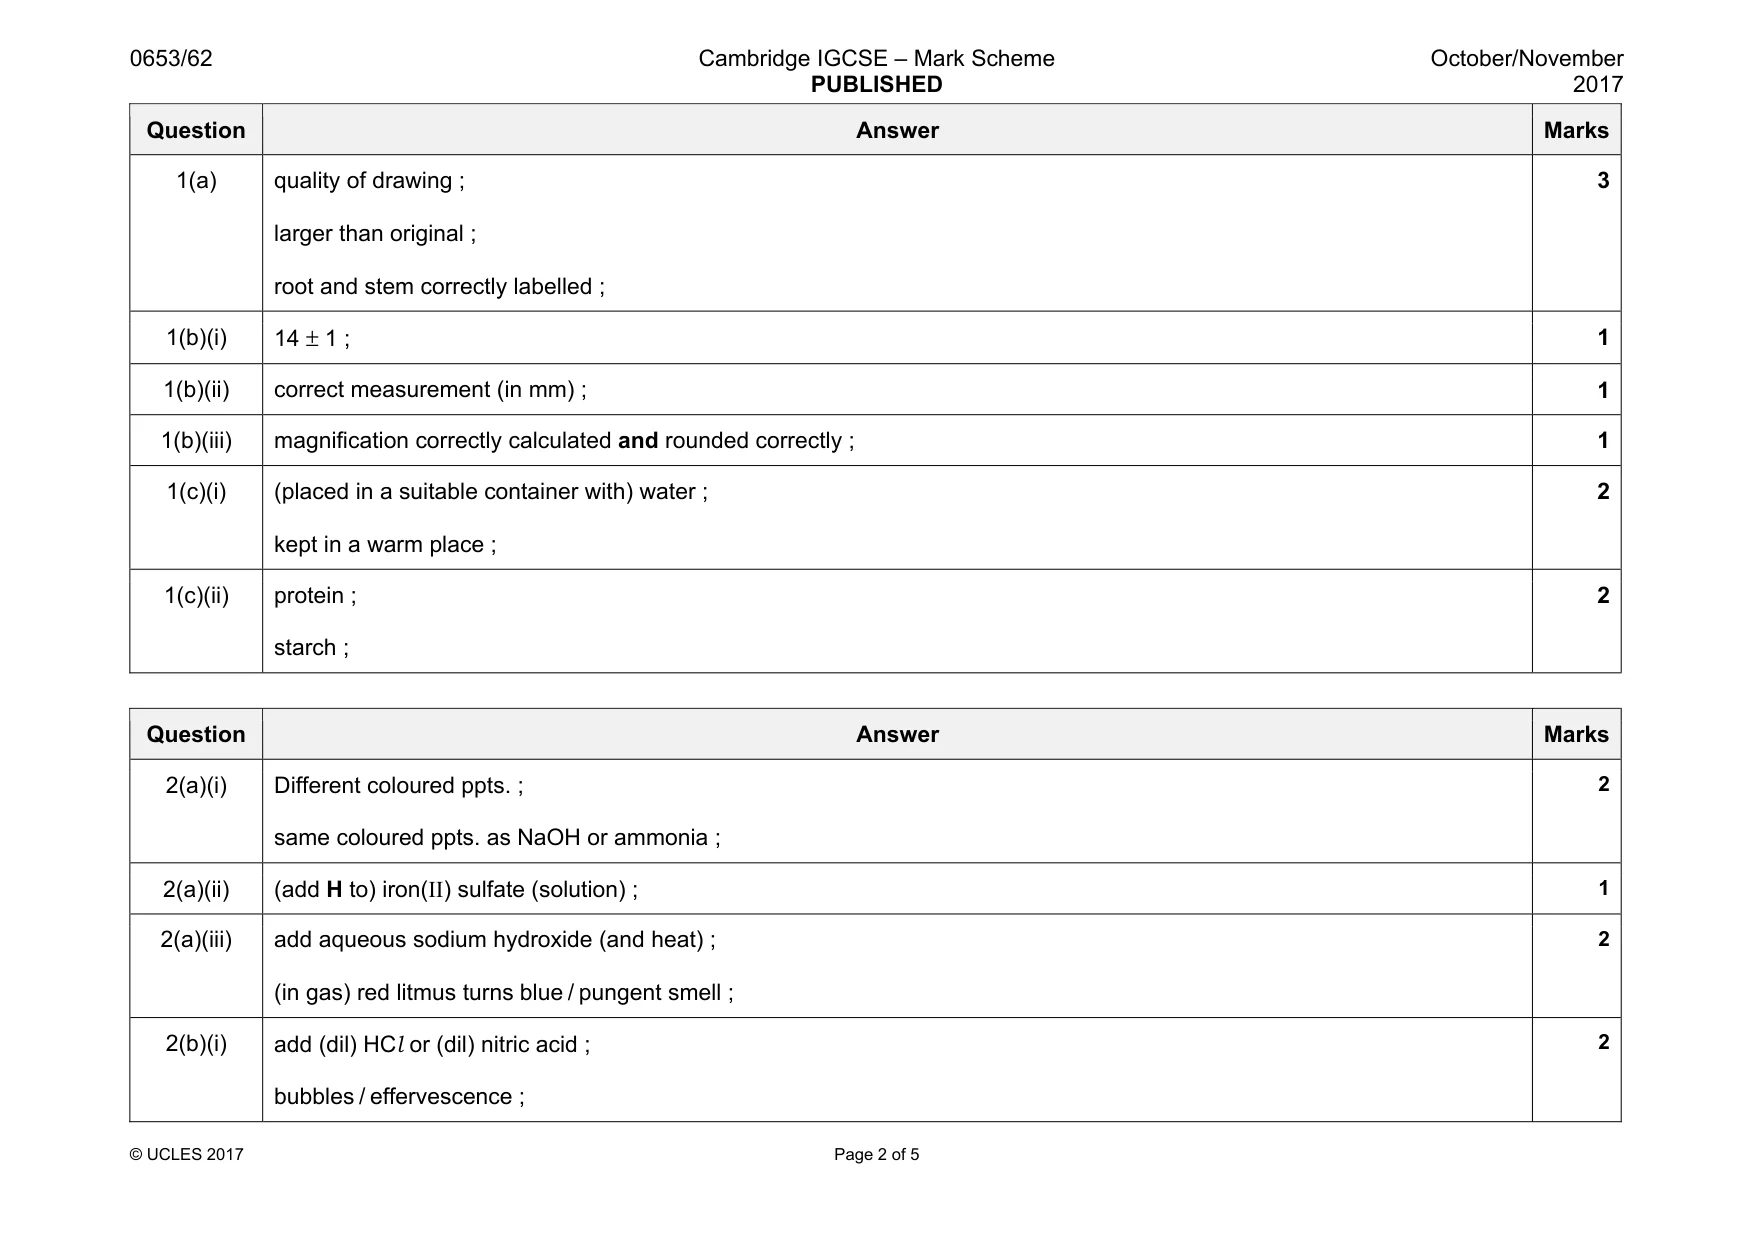
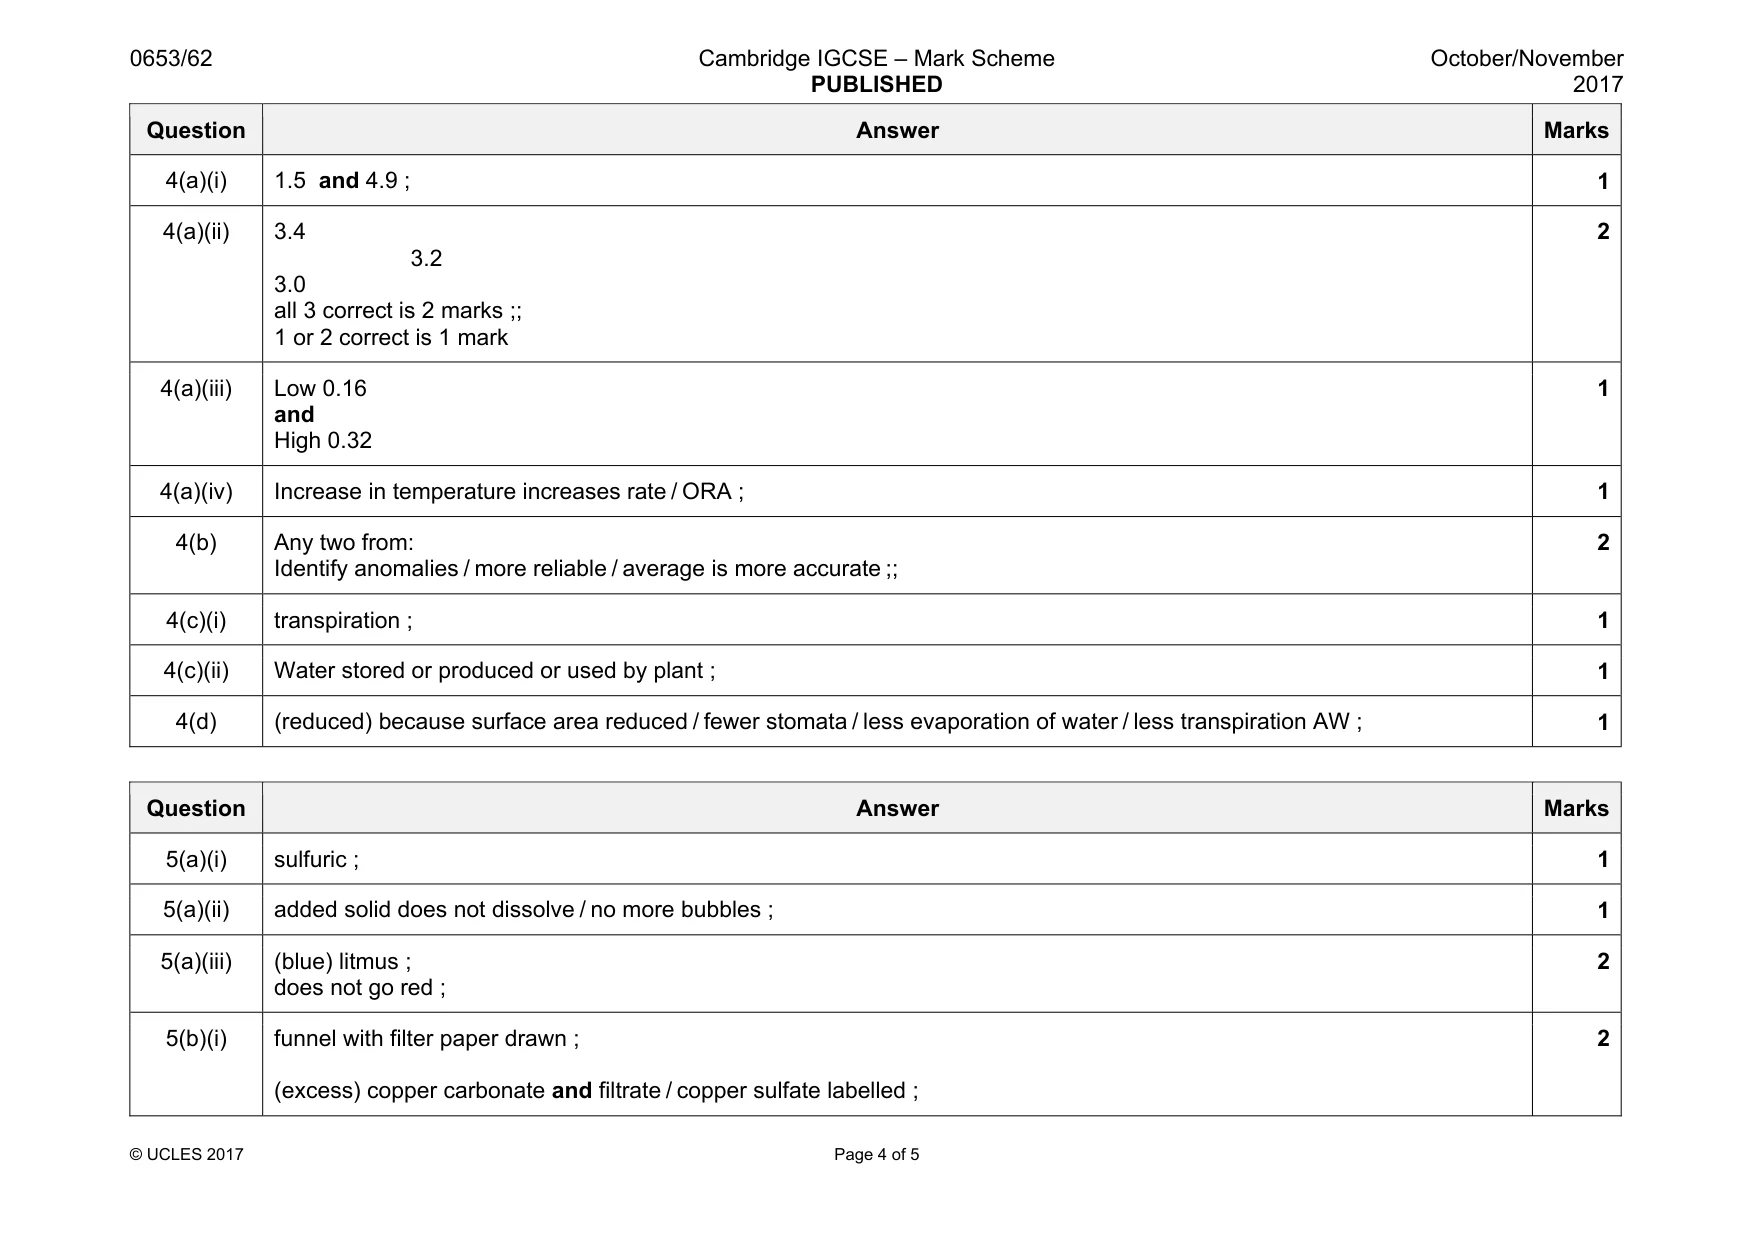
Mark scheme: 1(a) quality of drawing ; larger than original ; root and stem correctly labelled ; 3 1(b)(i) 14 ± 1 ; 1 1(b)(ii) correct measurement (in mm) ; 1 1(b)(iii) magnification correctly calculated and rounded correctly ; 1 1(c)(i) (placed in a suitable container with) water ; kept in a warm place ; 2 1(c)(ii) protein ; starch ; 2
Q2 · A student investigates the reactions of H, a solution of a sodium compound
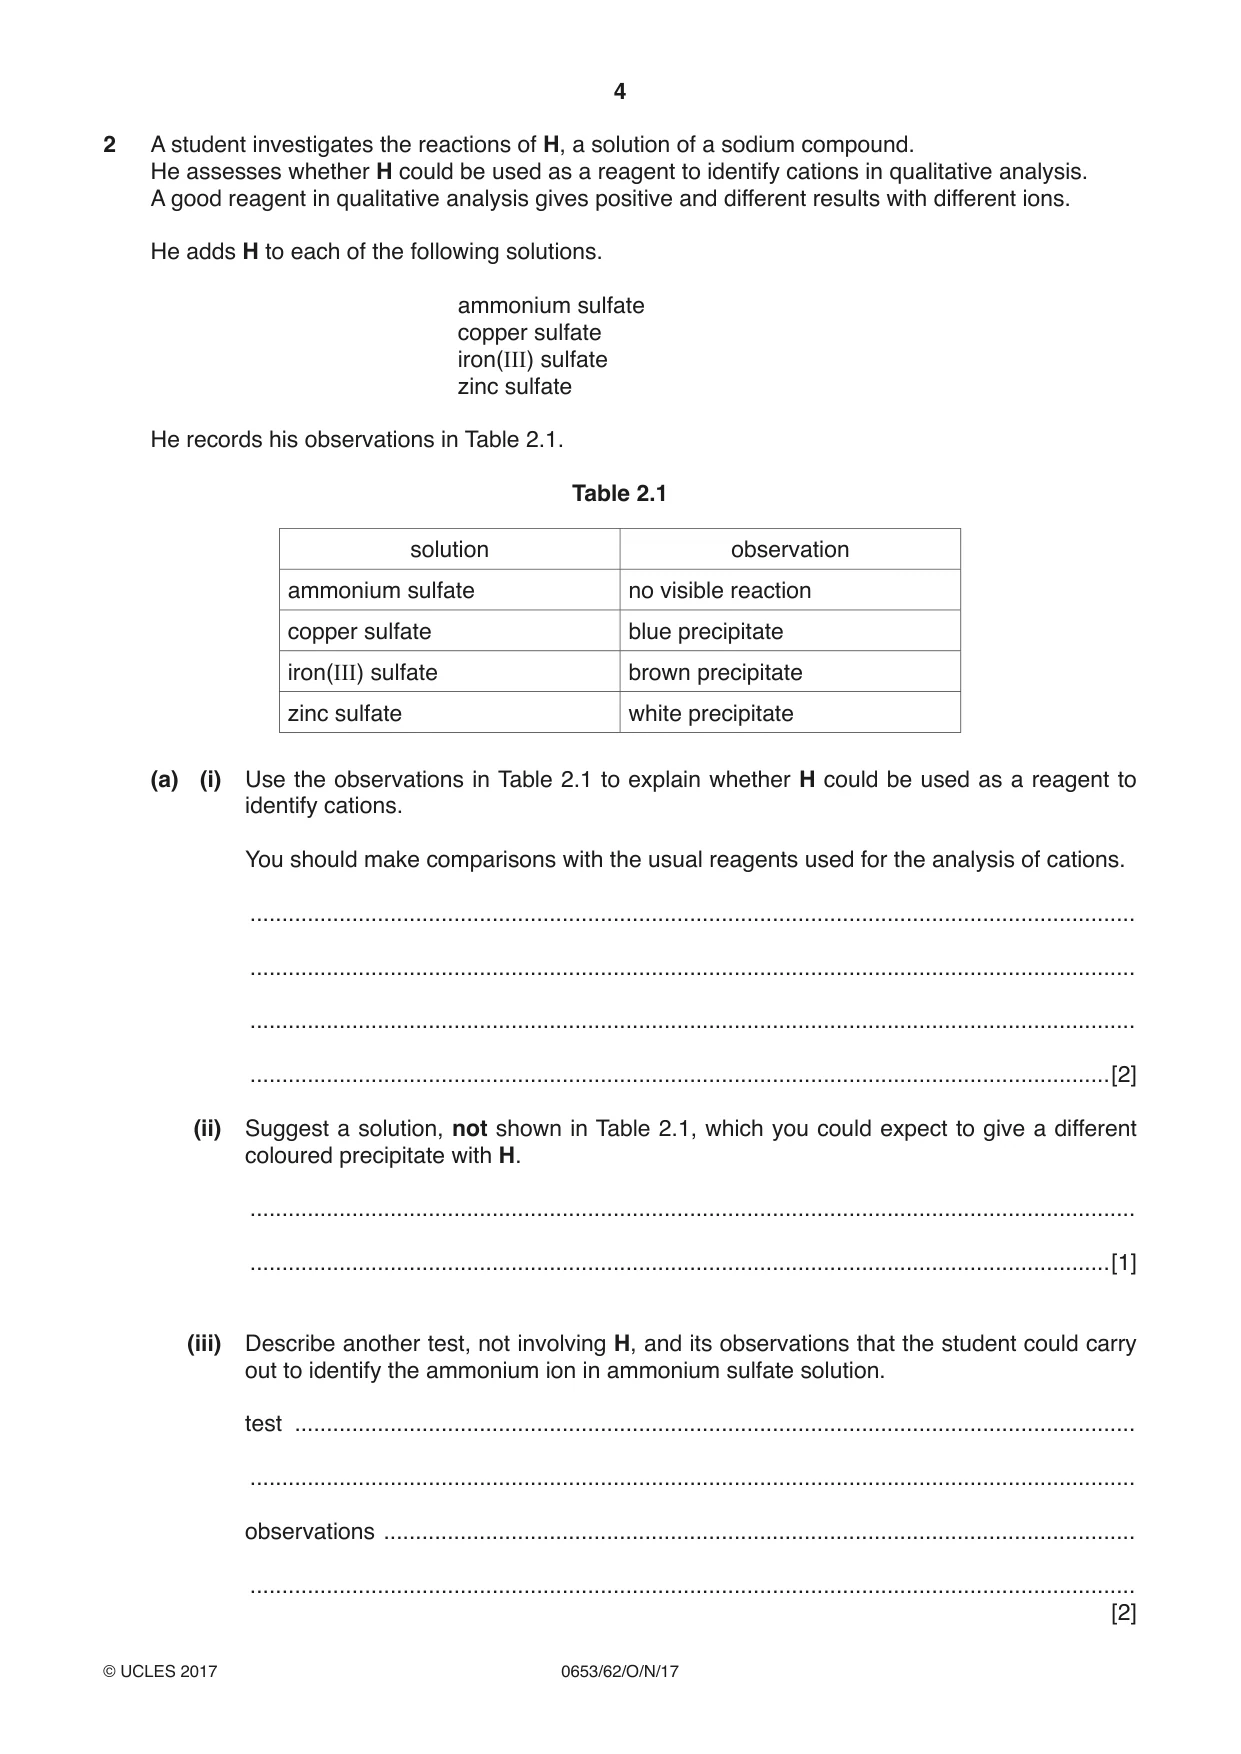
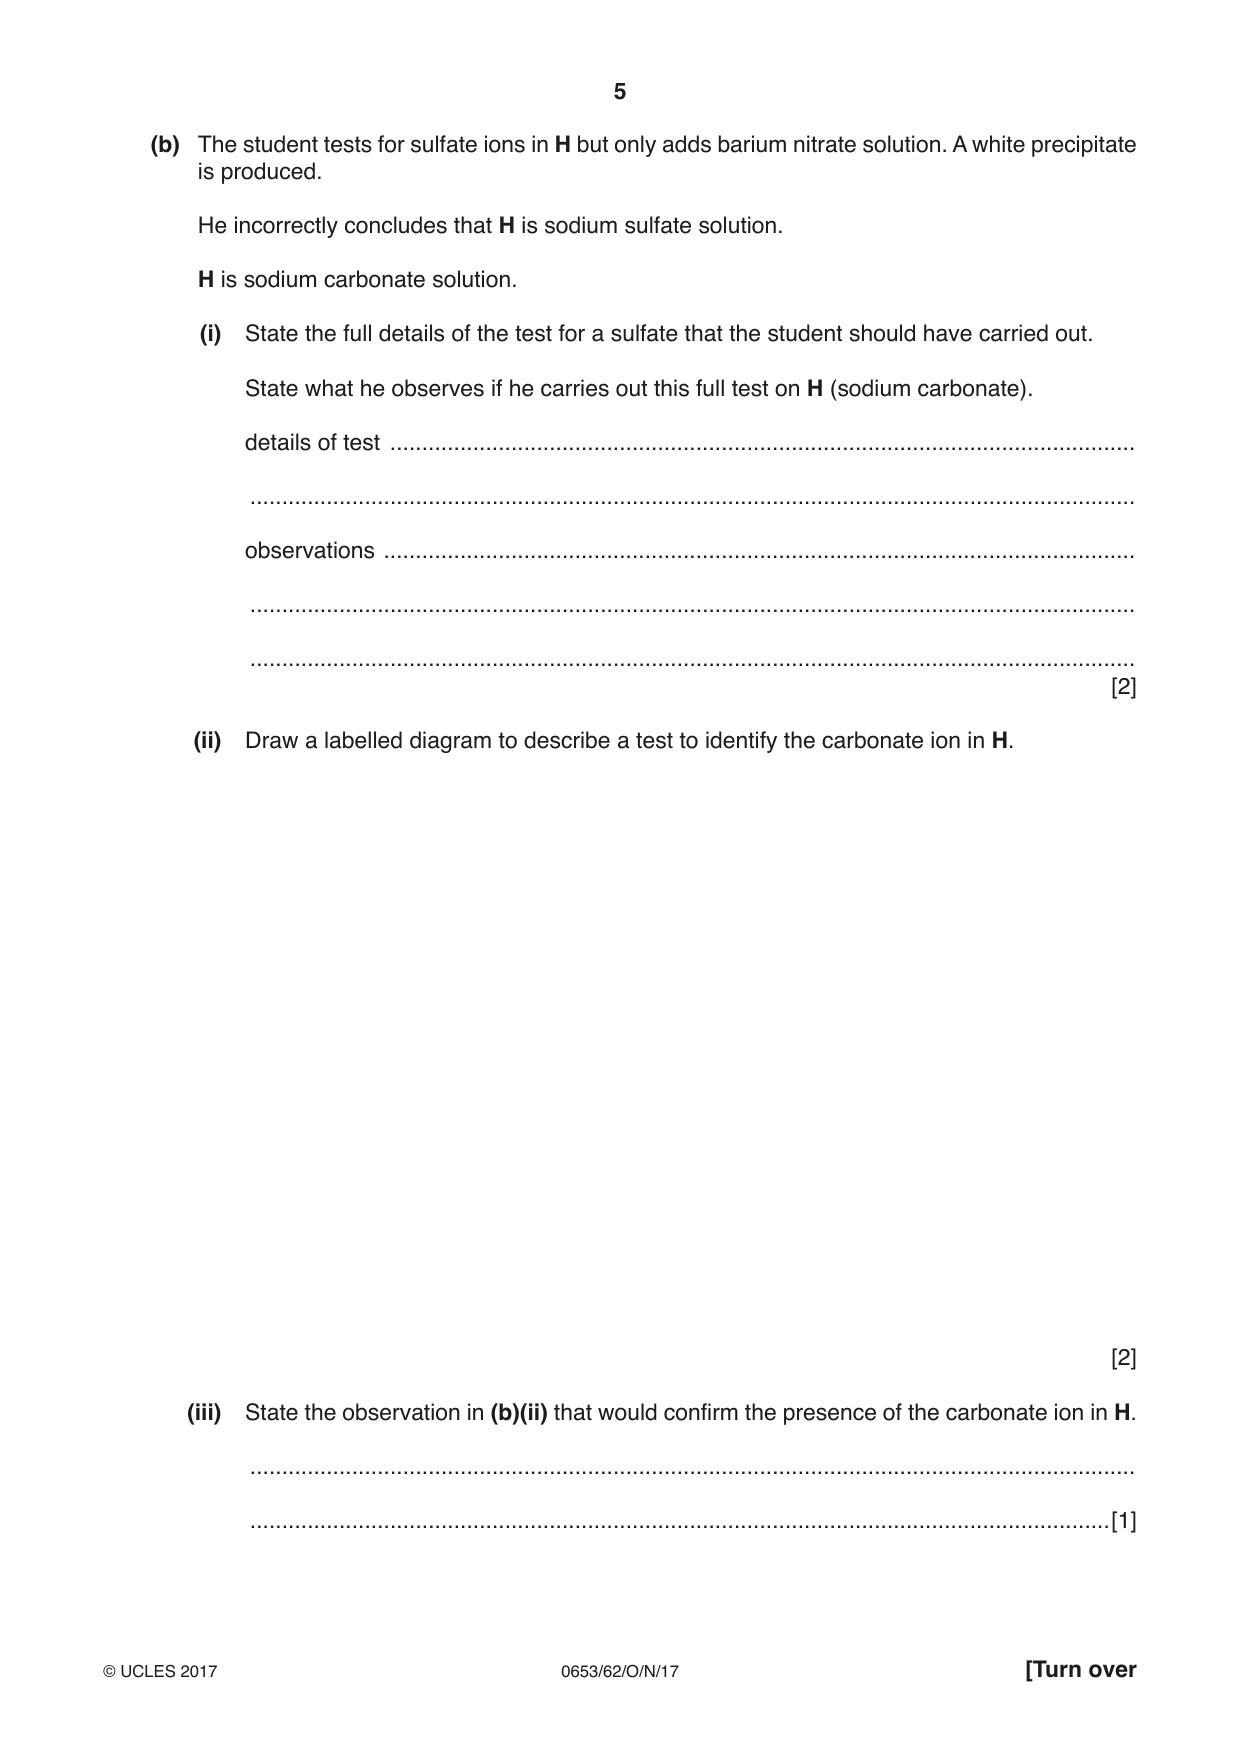
2 A student investigates the reactions of H, a solution of a sodium compound. He assesses whether H could be used as a reagent to identify cations in qualitative analysis. A good reagent in qualitative analysis gives positive and different results with different ions. He adds H to each of the following solutions. ammonium sulfate copper sulfate iron(III) sulfate zinc sulfate He records his observations in Table 2.1. Table 2.1 solution observation ammonium sulfate no visible reaction copper sulfate blue precipitate iron(III) sulfate brown precipitate zinc sulfate white precipitate (a) (i) Use the observations in Table 2.1 to explain whether H could be used as a reagent to identify cations. You should make comparisons with the usual reagents used for the analysis of cations. ........................................................................................................................................... ........................................................................................................................................... ........................................................................................................................................... .......................................................................................................................................[2] (ii) Suggest a solution, not shown in Table 2.1, which you could expect to give a different coloured precipitate with H. ........................................................................................................................................... .......................................................................................................................................[1] (iii) Describe another test, not involving H, and its observations that the student could carry out to identify the ammonium ion in ammonium sulfate solution. test .................................................................................................................................... ........................................................................................................................................... observations ...................................................................................................................... ........................................................................................................................................... [2] (b) The student tests for sulfate ions in H but only adds barium nitrate solution. A white precipitate is produced. He incorrectly concludes that H is sodium sulfate solution. H is sodium carbonate solution. (i) State the full details of the test for a sulfate that the student should have carried out. State what he observes if he carries out this full test on H (sodium carbonate). details of test ..................................................................................................................... ........................................................................................................................................... observations ...................................................................................................................... ........................................................................................................................................... ........................................................................................................................................... [2] (ii) Draw a labelled diagram to describe a test to identify the carbonate ion in H. [2] (iii) State the observation in (b)(ii) that would confirm the presence of the carbonate ion in H. ........................................................................................................................................... .......................................................................................................................................[1]
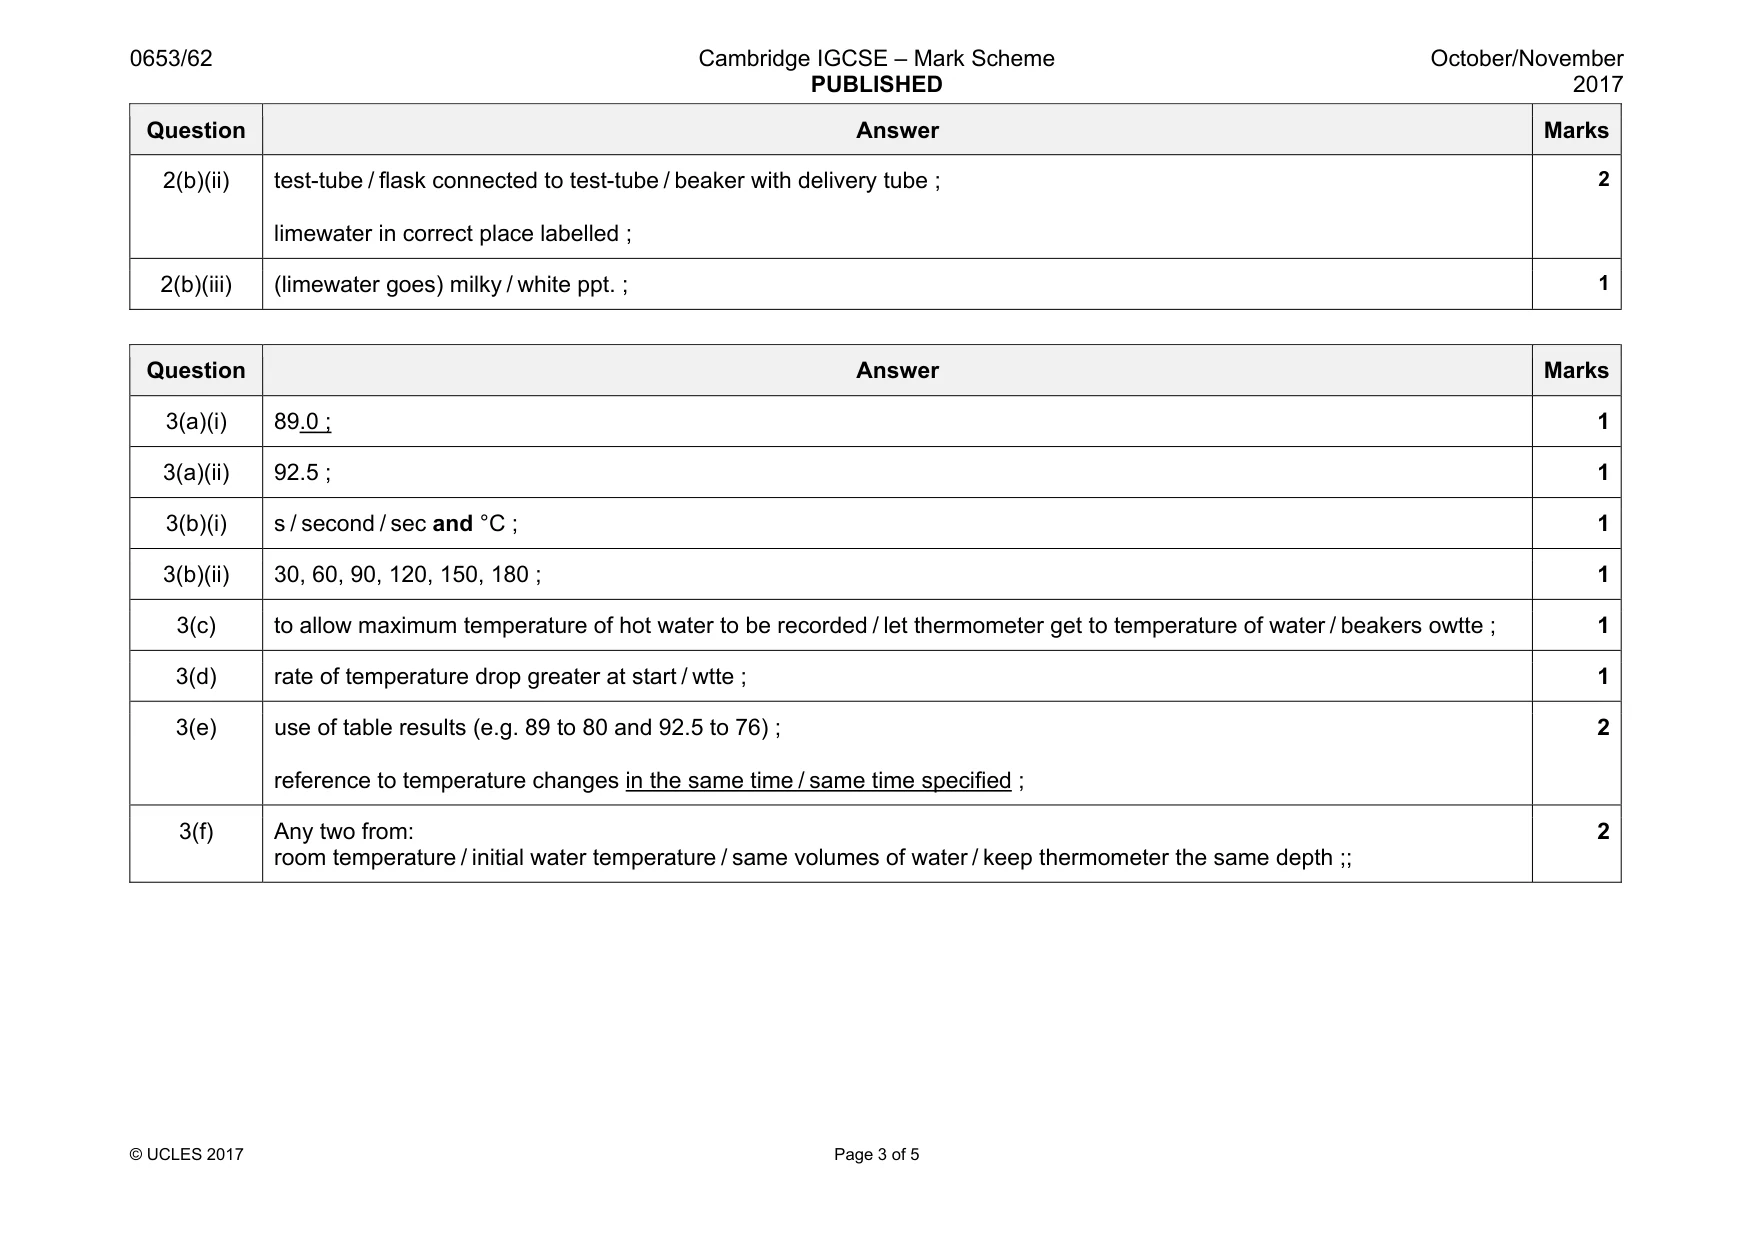
Mark scheme: 2(a)(i) Different coloured ppts. ; same coloured ppts. as NaOH or ammonia ; 2(a)(ii) (add H to) iron(II) sulfate (solution) ; 1 2(a)(iii) add aqueous sodium hydroxide (and heat) ; (in gas) red litmus turns blue / pungent smell ; 2 2(b)(i) add (dil) HCl or (dil) nitric acid ; bubbles / effervescence ; 2 Question Answer Marks 2(b)(ii) test-tube / flask connected to test-tube / beaker with delivery tube ; limewater in correct place labelled ; 2 2(b)(iii) (limewater goes) milky / white ppt. ; 1
Q3 · A student investigates the cooling rates of different volumes of water
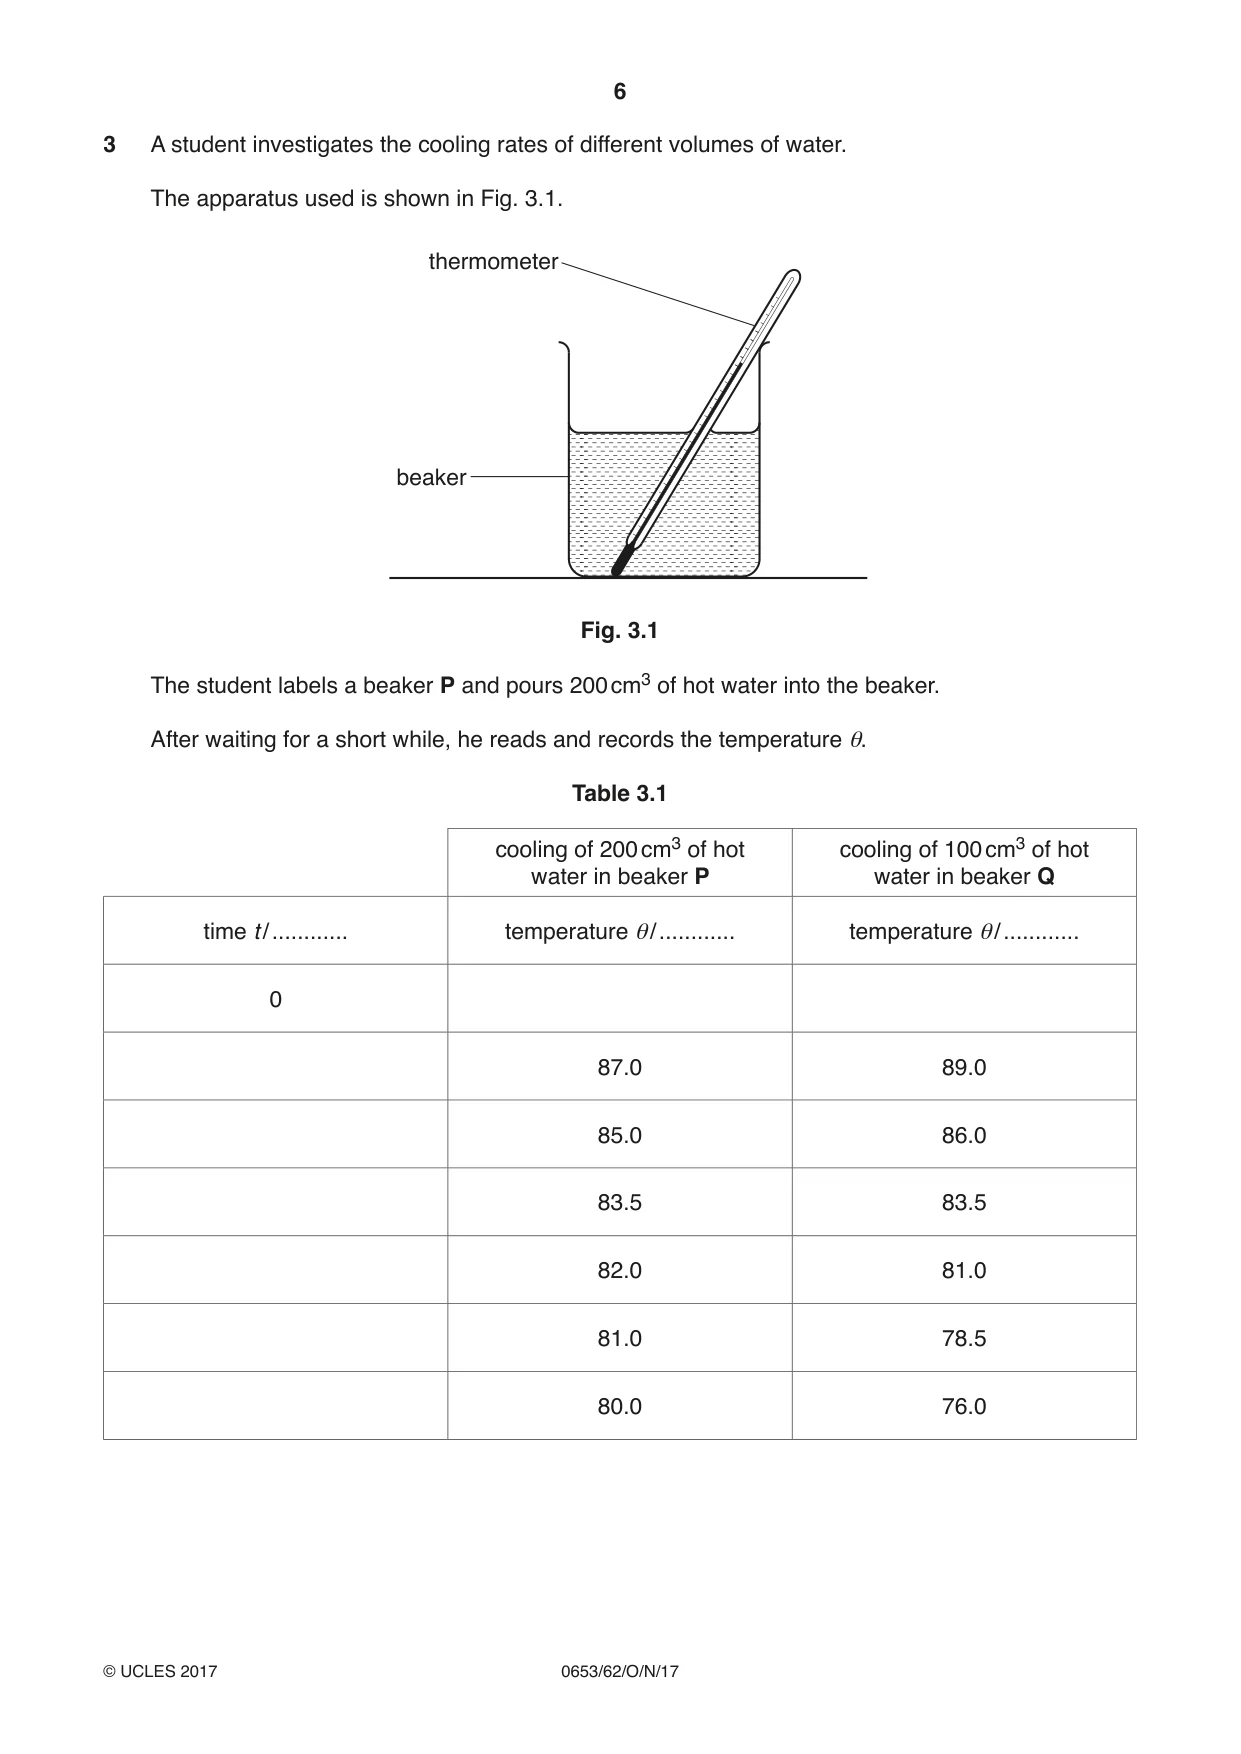
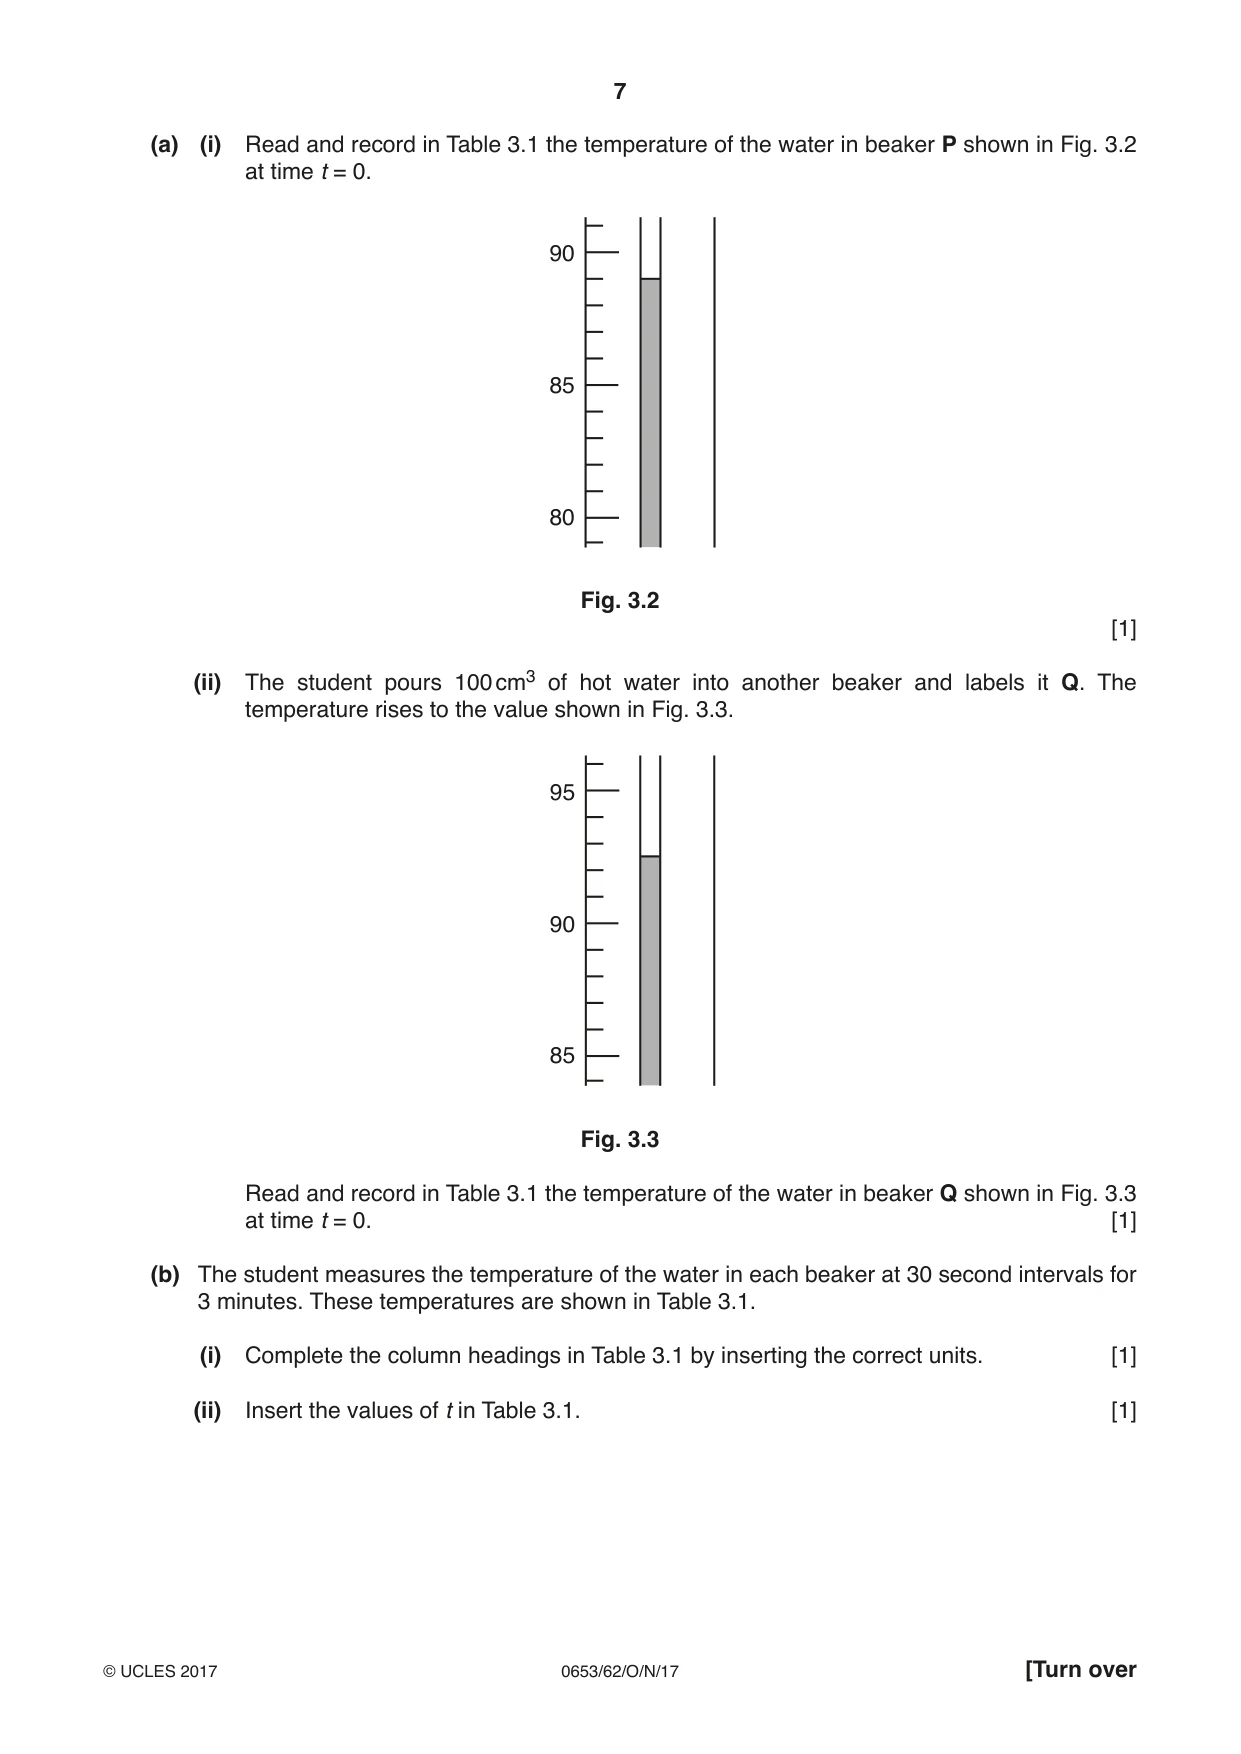
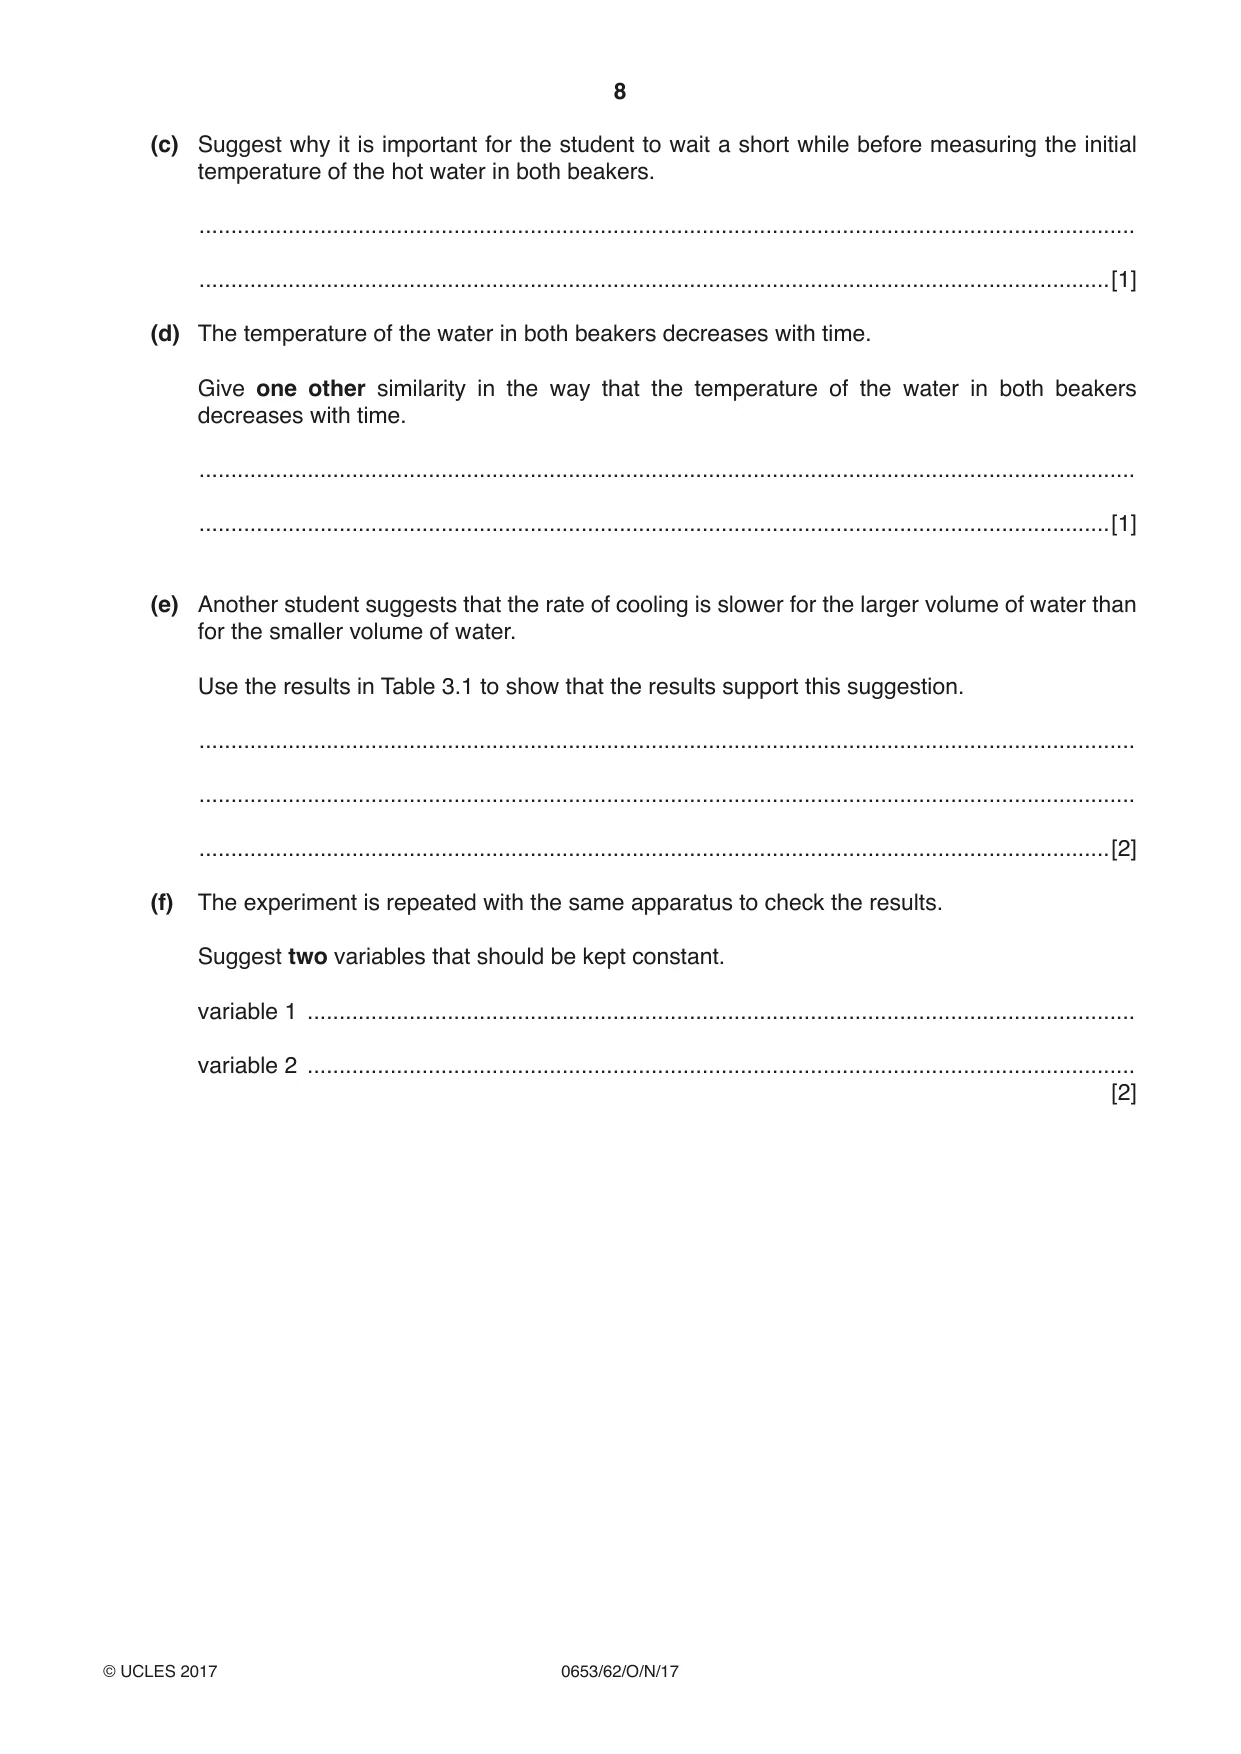
3 A student investigates the cooling rates of different volumes of water. The apparatus used is shown in Fig. 3.1. thermometer beaker Fig. 3.1 The student labels a beaker P and pours 200 cm3 of hot water into the beaker. After waiting for a short while, he reads and records the temperature θ. Table 3.1 cooling of 200 cm3 of hot cooling of 100 cm3 of hot water in beaker P water in beaker Q time t / ............ temperature θ/ ............ temperature θ/ ............ 0 87.0 89.0 85.0 86.0 83.5 83.5 82.0 81.0 81.0 78.5 80.0 76.0 (a) (i) Read and record in Table 3.1 the temperature of the water in beaker P shown in Fig. 3.2 at time t = 0. 90 85 80 Fig. 3.2 [1] (ii) The student pours 100 cm3 of hot water into another beaker and labels it Q. The temperature rises to the value shown in Fig. 3.3. 95 90 85 Fig. 3.3 Read and record in Table 3.1 the temperature of the water in beaker Q shown in Fig. 3.3 at time t = 0. [1] (b) The student measures the temperature of the water in each beaker at 30 second intervals for 3 minutes. These temperatures are shown in Table 3.1. (i) Complete the column headings in Table 3.1 by inserting the correct units. [1] (ii) Insert the values of t in Table 3.1. [1] (c) Suggest why it is important for the student to wait a short while before measuring the initial temperature of the hot water in both beakers. ................................................................................................................................................... ...............................................................................................................................................[1] (d) The temperature of the water in both beakers decreases with time. Give one other similarity in the way that the temperature of the water in both beakers decreases with time. ................................................................................................................................................... ...............................................................................................................................................[1] (e) Another student suggests that the rate of cooling is slower for the larger volume of water than for the smaller volume of water. Use the results in Table 3.1 to show that the results support this suggestion. ................................................................................................................................................... ................................................................................................................................................... ...............................................................................................................................................[2] (f) The experiment is repeated with the same apparatus to check the results. Suggest two variables that should be kept constant. variable 1 .................................................................................................................................. variable 2 .................................................................................................................................. [2] Please turn over for Question 4.
Mark scheme: 3(a)(i) 89.0 ; 1 3(a)(ii) 92.5 ; 1 3(b)(i) s / second / sec and °C ; 1 3(b)(ii) 30, 60, 90, 120, 150, 180 ; 1 3(c) to allow maximum temperature of hot water to be recorded / let thermometer get to temperature of water / beakers owtte ; 1 3(d) rate of temperature drop greater at start / wtte ; 1 3(e) use of table results (e.g. 89 to 80 and 92.5 to 76) ; reference to temperature changes in the same time / same time specified ; 2 3(f) Any two from: room temperature / initial water temperature / same volumes of water / keep thermometer the same depth ;; 2
More questions on Physical quantities and measurement techniques
Q4 · A student investigates the effect of temperature on the movement of water through a plant
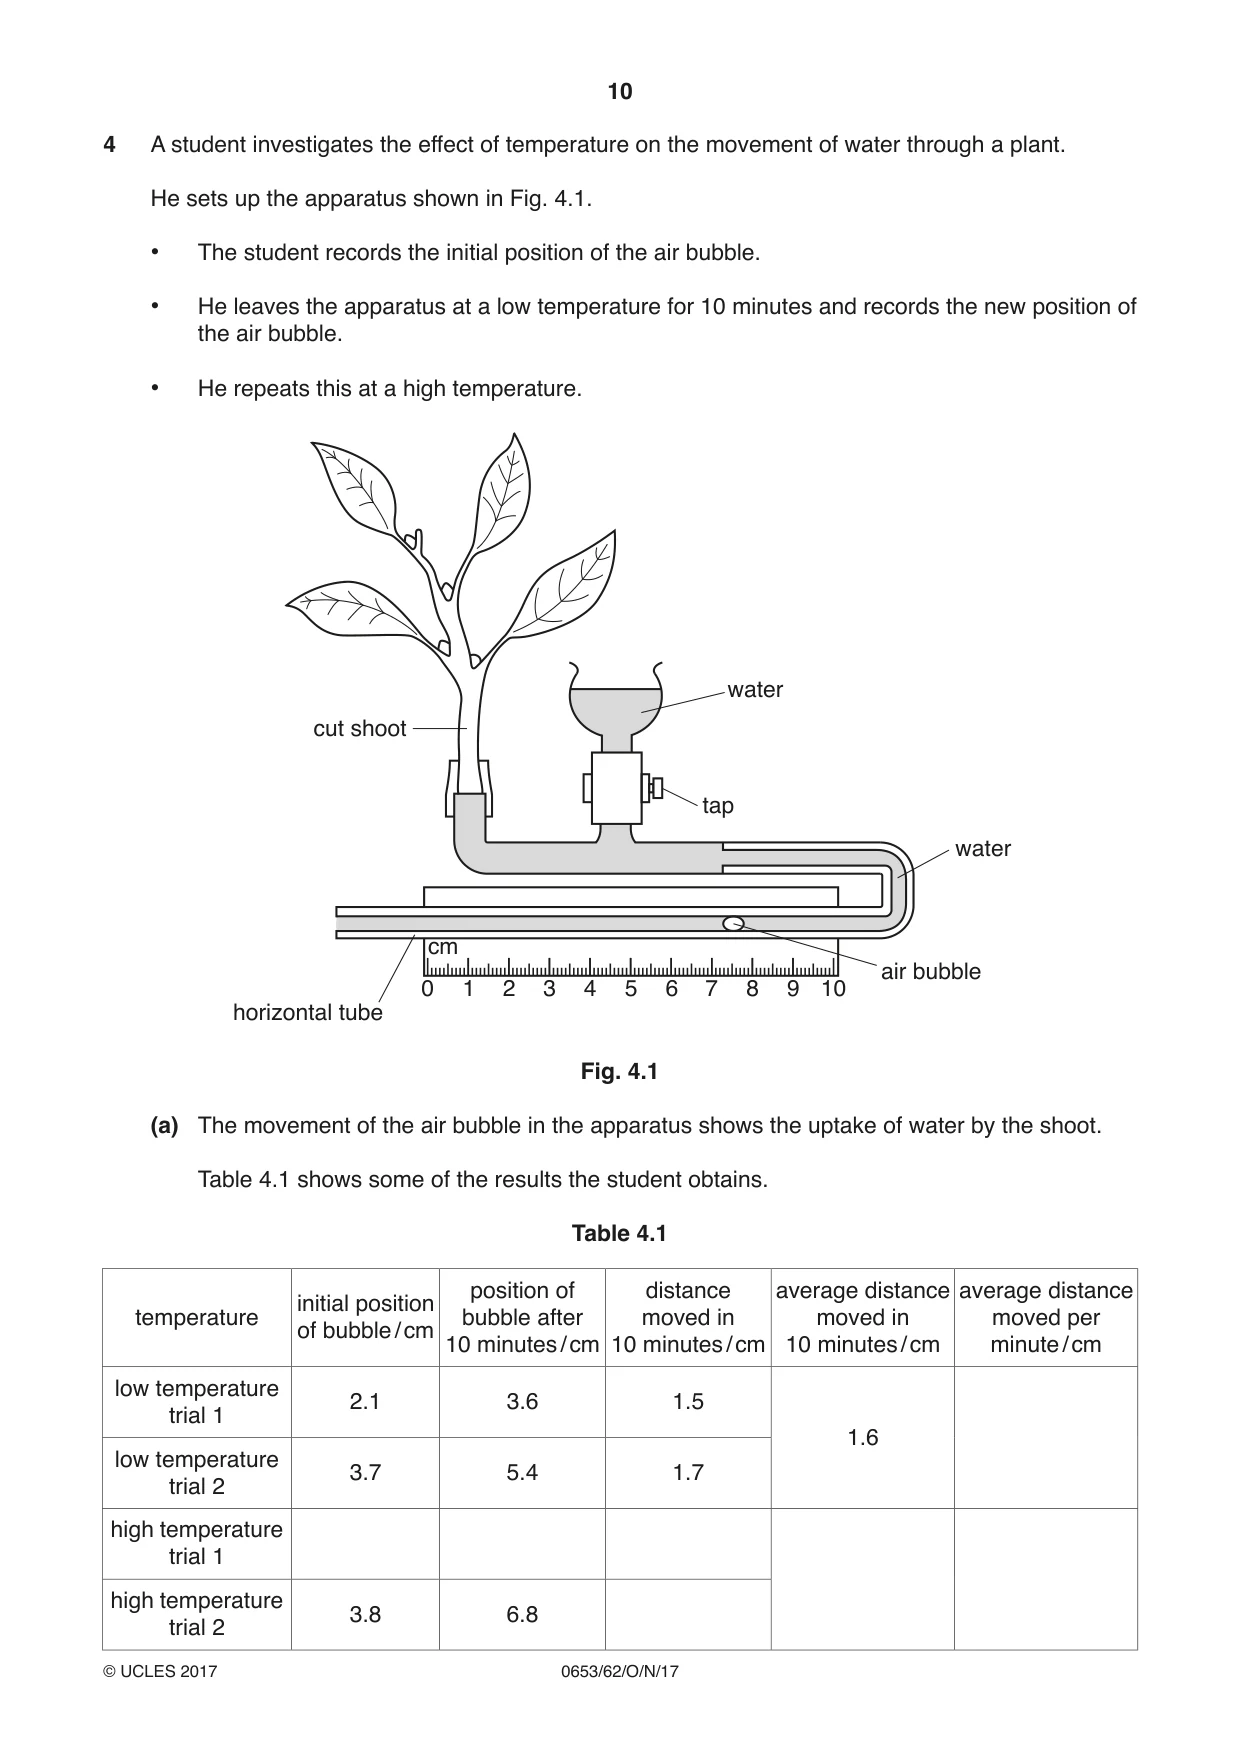
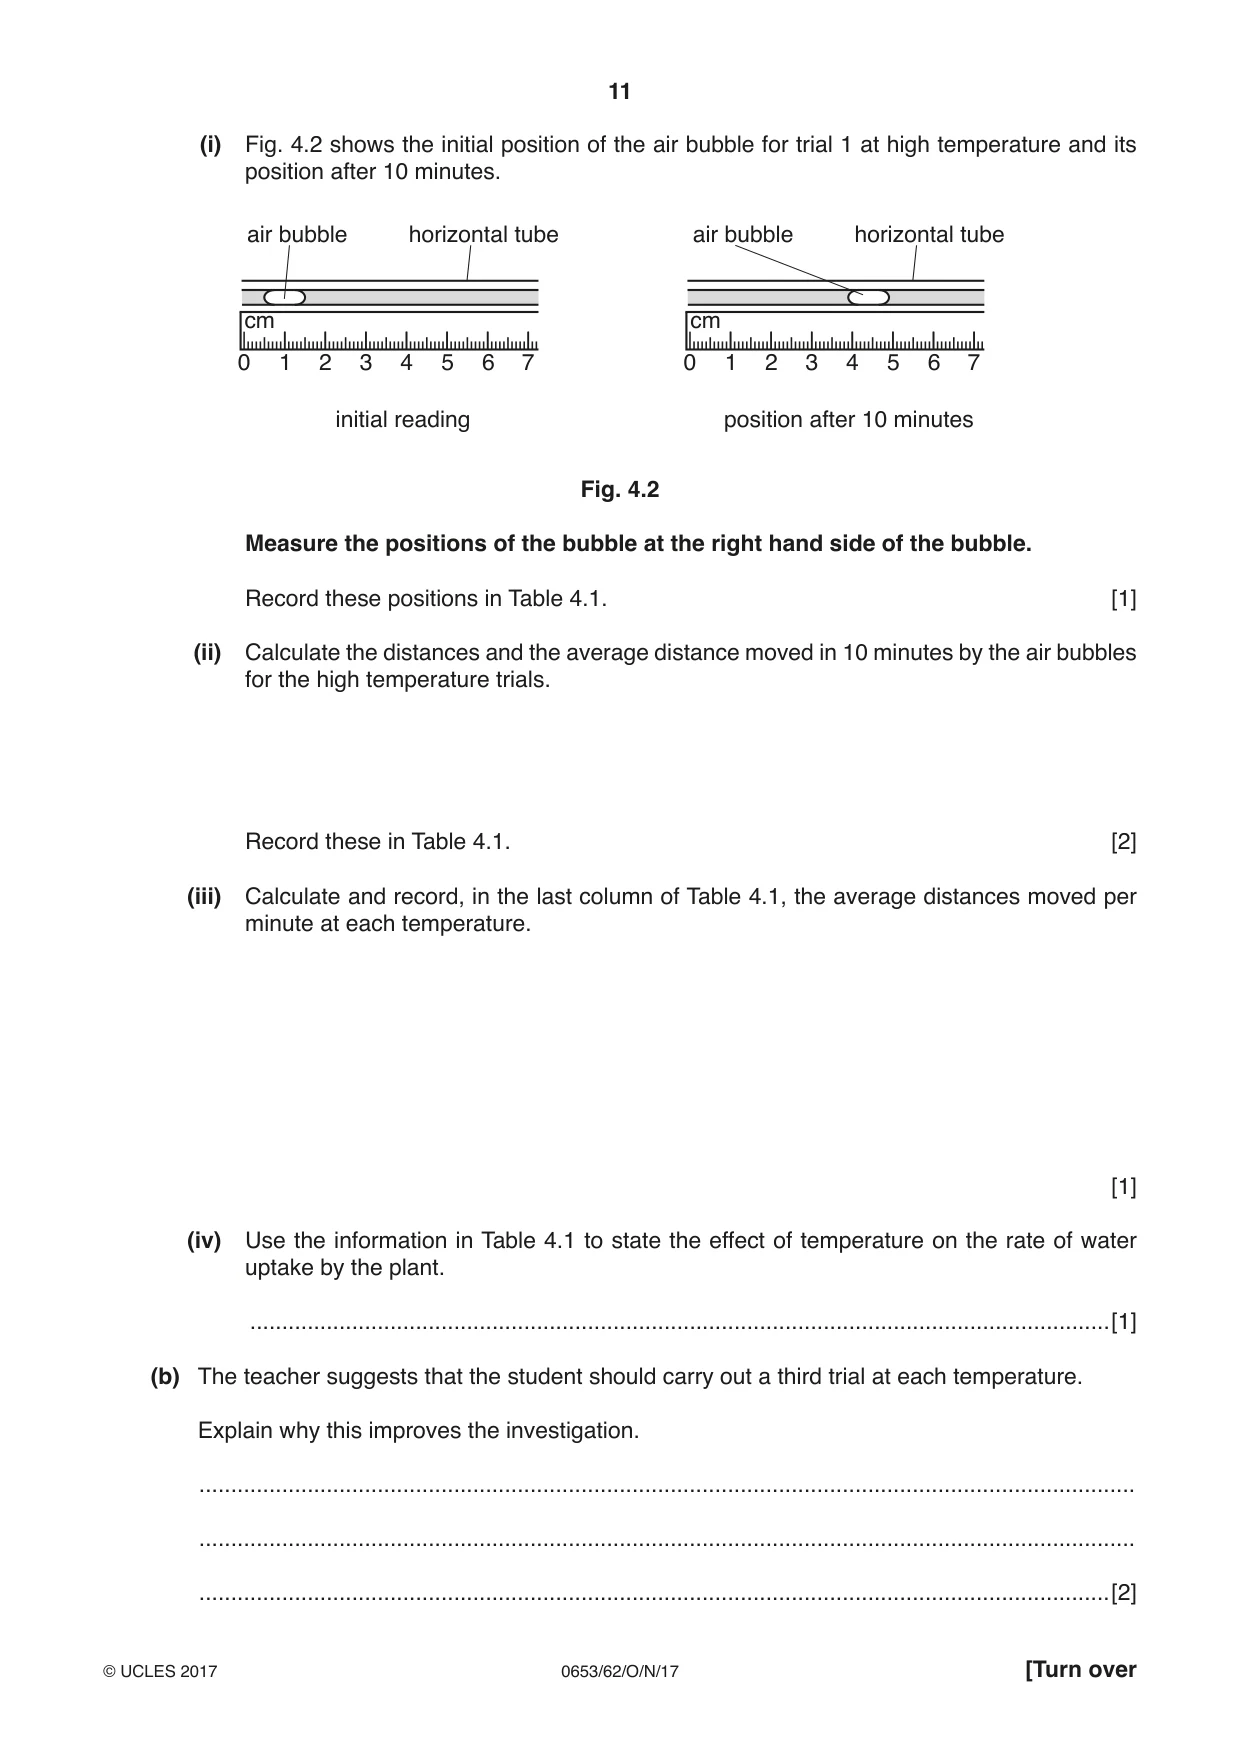
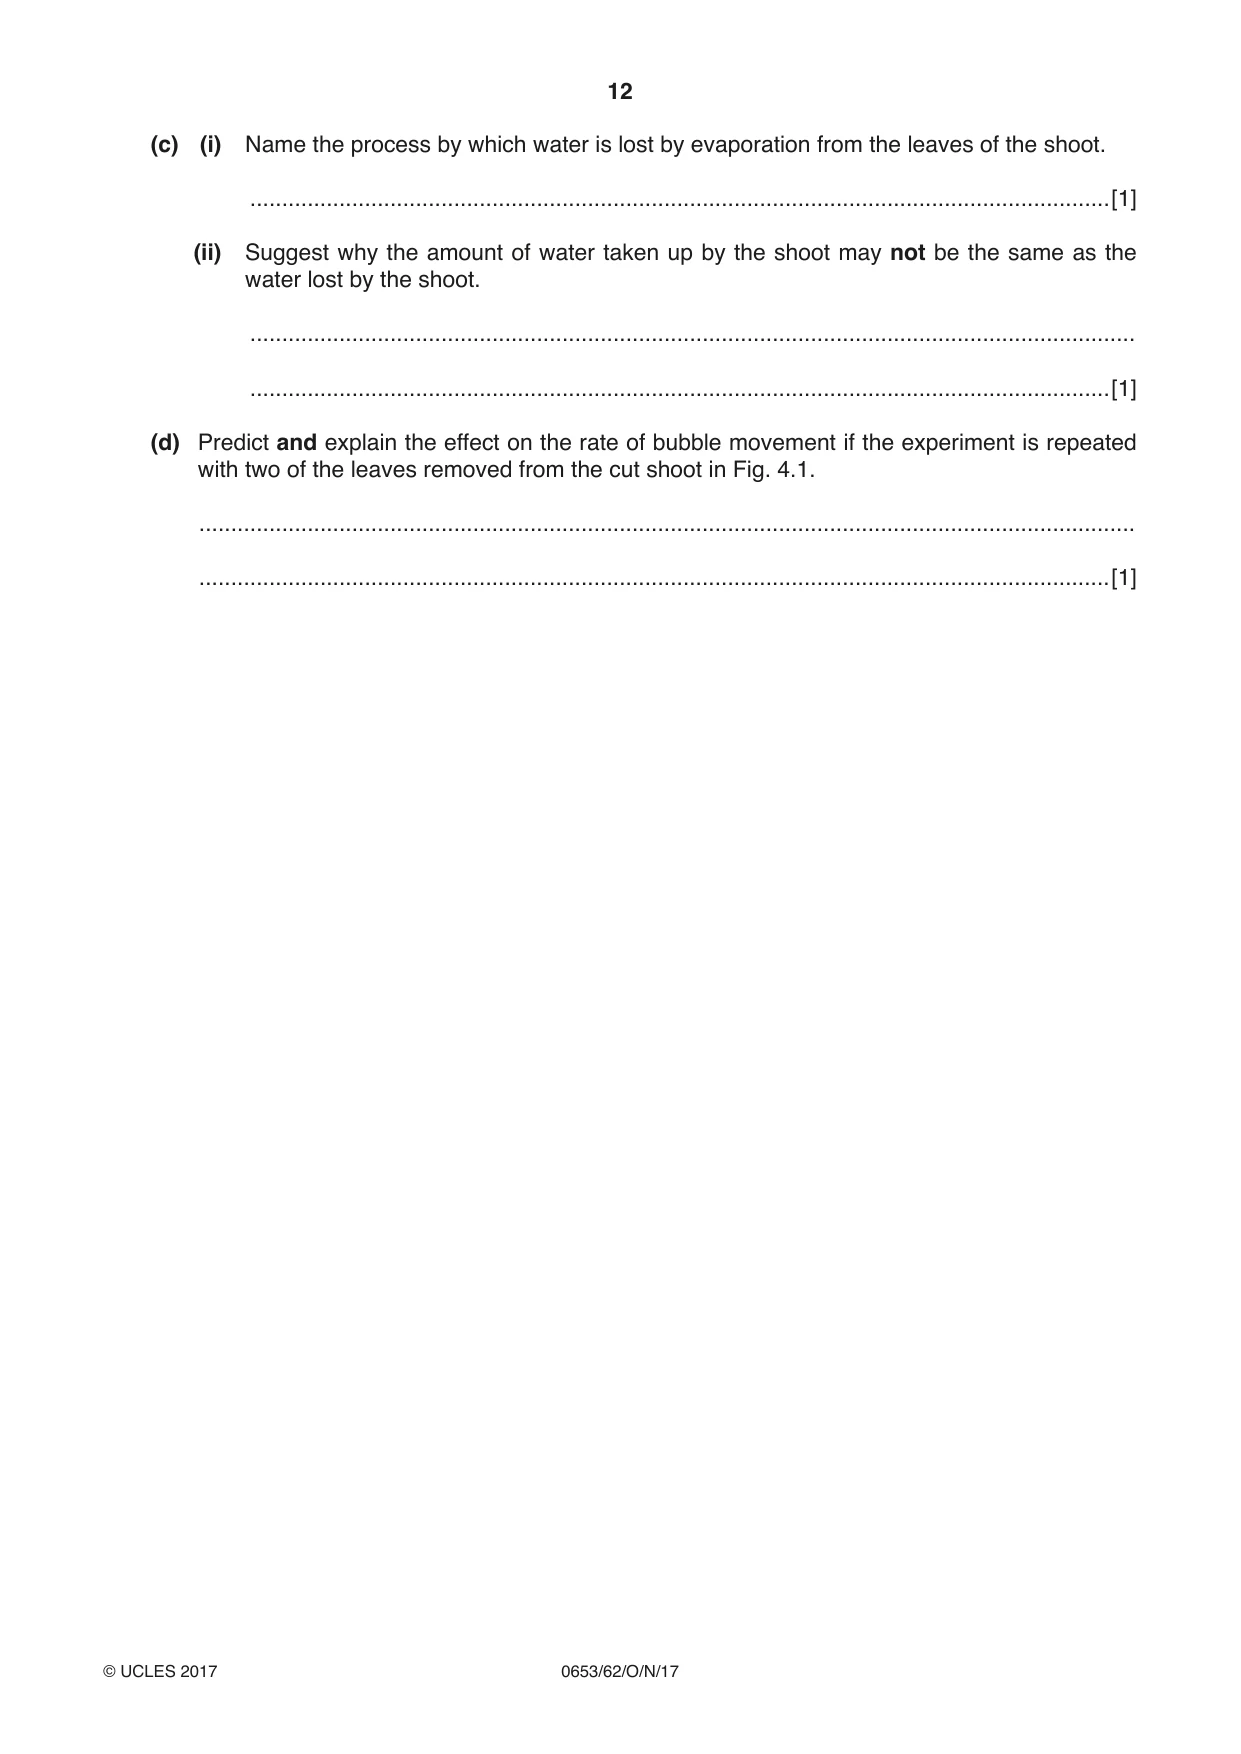
4 A student investigates the effect of temperature on the movement of water through a plant. He sets up the apparatus shown in Fig. 4.1. • The student records the initial position of the air bubble. • He leaves the apparatus at a low temperature for 10 minutes and records the new position of the air bubble. • He repeats this at a high temperature. water cut shoot tap water cm air bubble 0 1 2 3 4 5 6 7 8 9 10 horizontal tube Fig. 4.1 (a) The movement of the air bubble in the apparatus shows the uptake of water by the shoot. Table 4.1 shows some of the results the student obtains. Table 4.1 position of distance average distance average distance initial position temperature bubble after moved in moved in moved per of bubble / cm 10 minutes / cm 10 minutes / cm 10 minutes / cm minute / cm low temperature 2.1 3.6 1.5 trial 1 1.6 low temperature 3.7 5.4 1.7 trial 2 high temperature trial 1 high temperature 3.8 6.8 trial 2 (i) Fig. 4.2 shows the initial position of the air bubble for trial 1 at high temperature and its position after 10 minutes. air bubble horizontal tube air bubble horizontal tube cm cm 0 1 2 3 4 5 6 7 0 1 2 3 4 5 6 7 initial reading position after 10 minutes Fig. 4.2 Measure the positions of the bubble at the right hand side of the bubble. Record these positions in Table 4.1. [1] (ii) Calculate the distances and the average distance moved in 10 minutes by the air bubbles for the high temperature trials. Record these in Table 4.1. [2] (iii) Calculate and record, in the last column of Table 4.1, the average distances moved per minute at each temperature. [1] (iv) Use the information in Table 4.1 to state the effect of temperature on the rate of water uptake by the plant. .......................................................................................................................................[1] (b) The teacher suggests that the student should carry out a third trial at each temperature. Explain why this improves the investigation. ................................................................................................................................................... ................................................................................................................................................... ...............................................................................................................................................[2] (c) (i) Name the process by which water is lost by evaporation from the leaves of the shoot. .......................................................................................................................................[1] (ii) Suggest why the amount of water taken up by the shoot may not be the same as the water lost by the shoot. ........................................................................................................................................... .......................................................................................................................................[1] (d) Predict and explain the effect on the rate of bubble movement if the experiment is repeated with two of the leaves removed from the cut shoot in Fig. 4.1. ................................................................................................................................................... ...............................................................................................................................................[1] Please turn over for Question 5.
Mark scheme: 4(a)(i) 1.5 and 4.9 ; 1 4(a)(ii) 3.4 3.2 3.0 all 3 correct is 2 marks ;; 1 or 2 correct is 1 mark 2 4(a)(iii) Low 0.16 and High 0.32 1 4(a)(iv) Increase in temperature increases rate / ORA ; 1 4(b) Any two from: Identify anomalies / more reliable / average is more accurate ;; 2 4(c)(i) transpiration ; 1 4(c)(ii) Water stored or produced or used by plant ; 1 4(d) (reduced) because surface area reduced / fewer stomata / less evaporation of water / less transpiration AW ; 1
Q5 · Copper sulfate is a salt
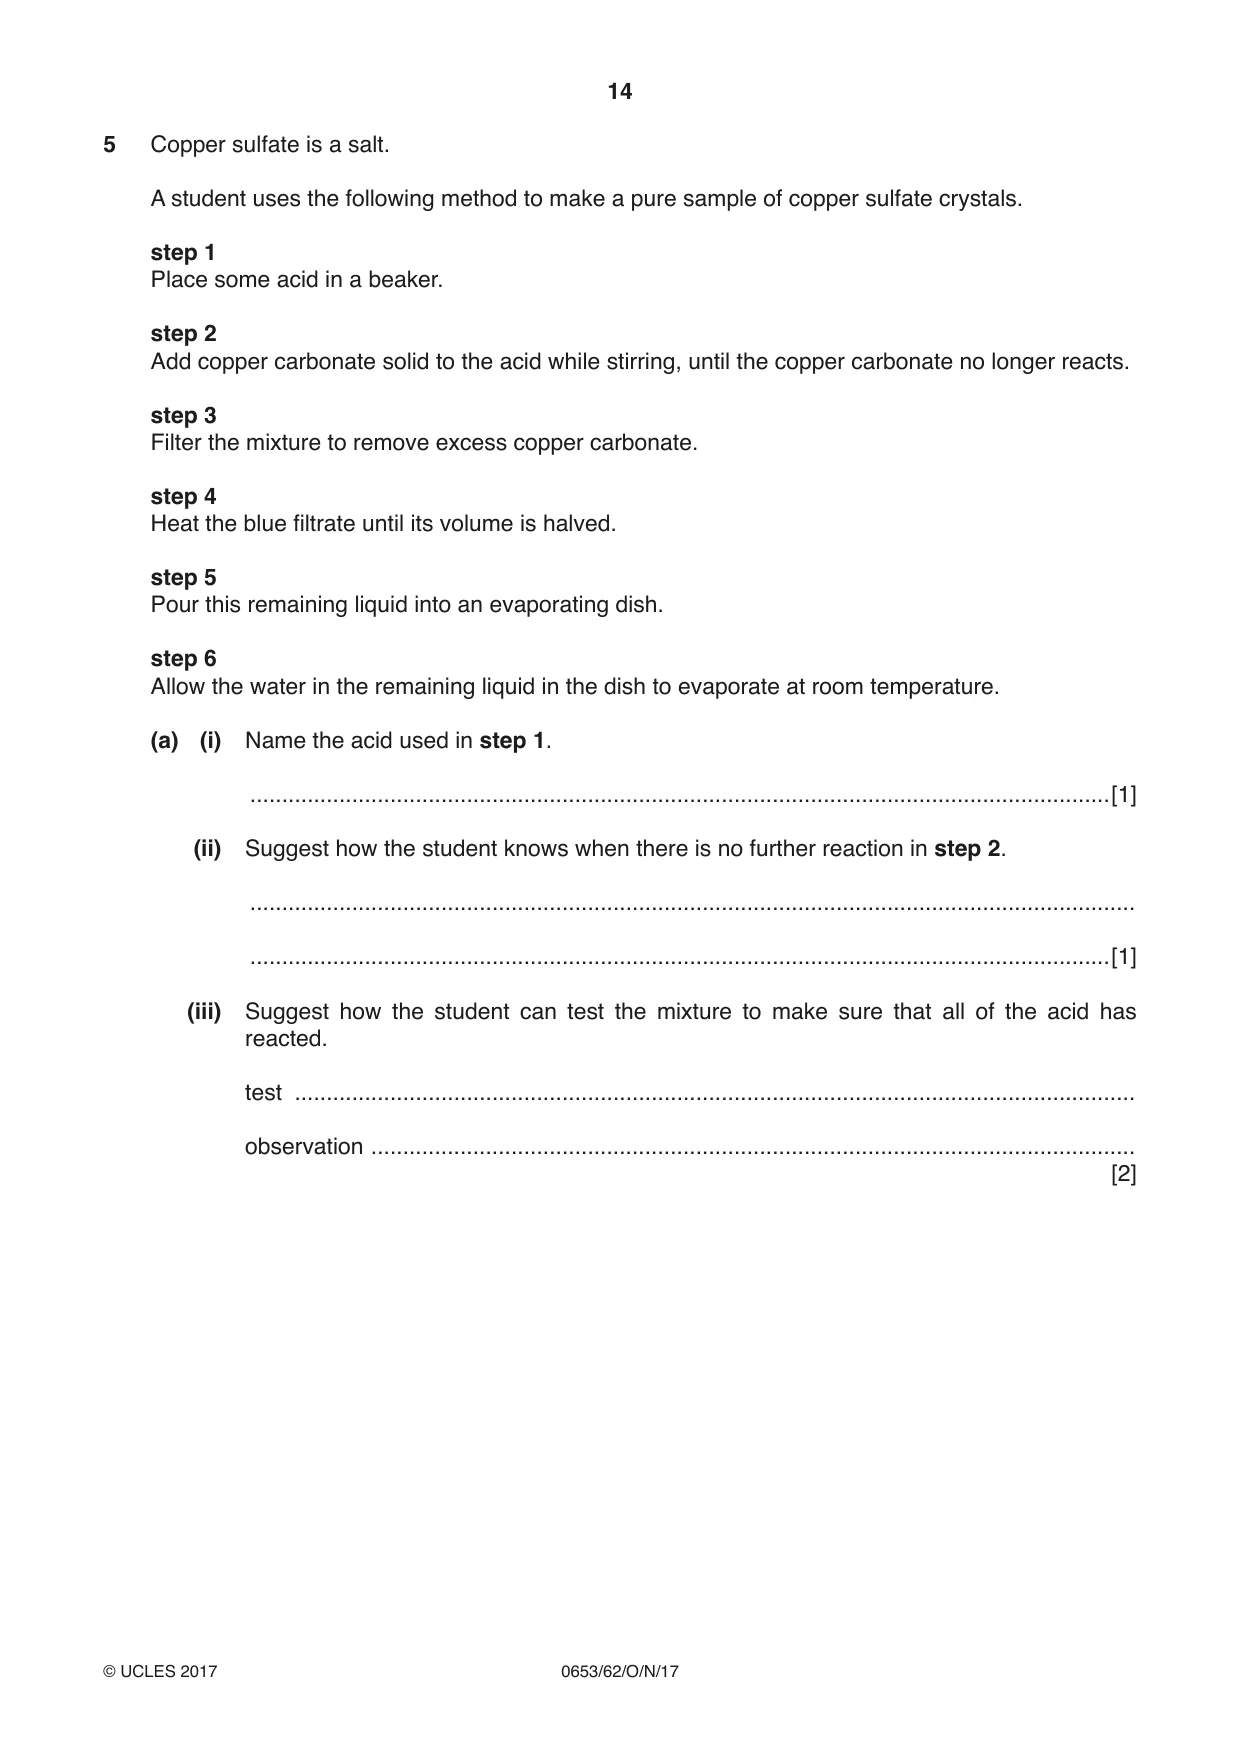
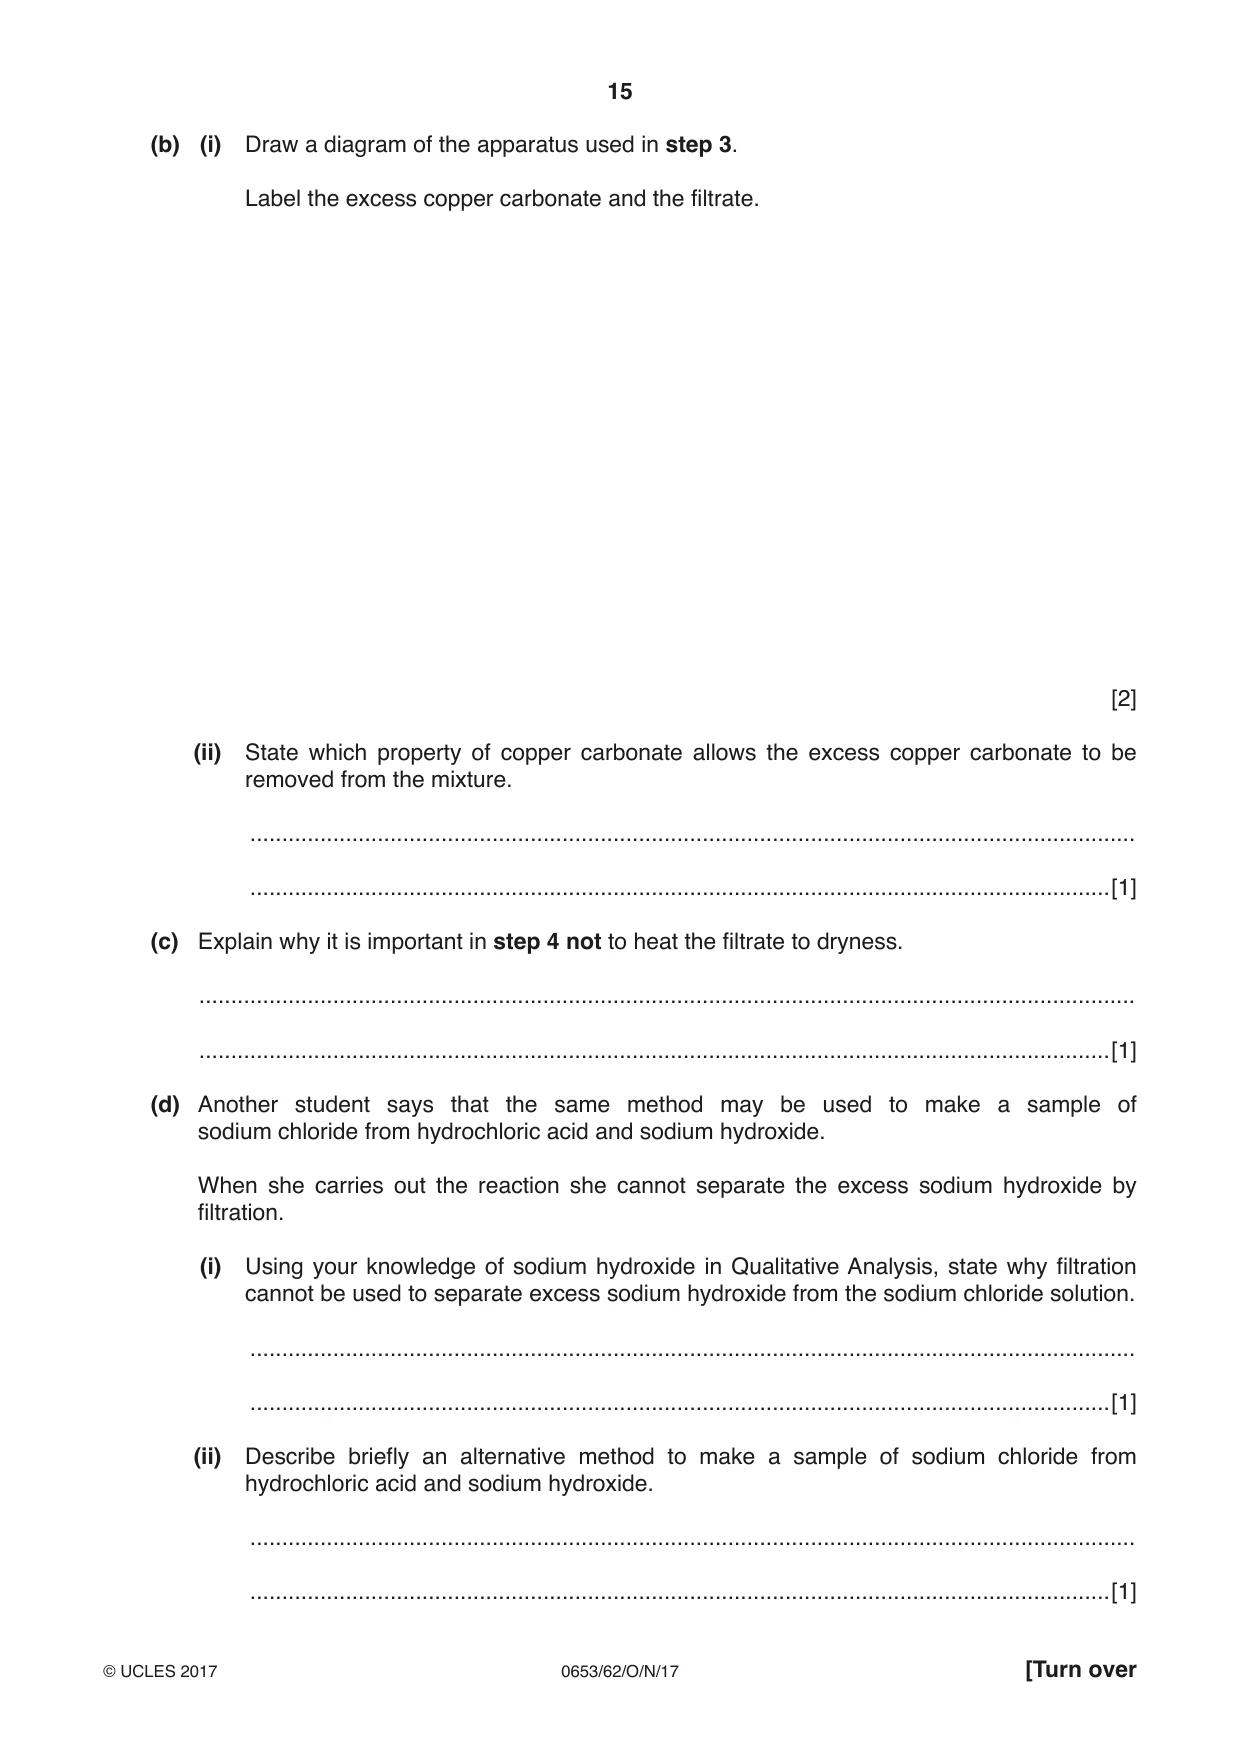
5 Copper sulfate is a salt. A student uses the following method to make a pure sample of copper sulfate crystals. step 1 Place some acid in a beaker. step 2 Add copper carbonate solid to the acid while stirring, until the copper carbonate no longer reacts. step 3 Filter the mixture to remove excess copper carbonate. step 4 Heat the blue filtrate until its volume is halved. step 5 Pour this remaining liquid into an evaporating dish. step 6 Allow the water in the remaining liquid in the dish to evaporate at room temperature. (a) (i) Name the acid used in step 1. .......................................................................................................................................[1] (ii) Suggest how the student knows when there is no further reaction in step 2. ........................................................................................................................................... .......................................................................................................................................[1] (iii) Suggest how the student can test the mixture to make sure that all of the acid has reacted. test .................................................................................................................................... observation ........................................................................................................................ [2] (b) (i) Draw a diagram of the apparatus used in step 3. Label the excess copper carbonate and the filtrate. [2] (ii) State which property of copper carbonate allows the excess copper carbonate to be removed from the mixture. ........................................................................................................................................... .......................................................................................................................................[1] (c) Explain why it is important in step 4 not to heat the filtrate to dryness. ................................................................................................................................................... ...............................................................................................................................................[1] (d) Another student says that the same method may be used to make a sample of sodium chloride from hydrochloric acid and sodium hydroxide. When she carries out the reaction she cannot separate the excess sodium hydroxide by filtration. (i) Using your knowledge of sodium hydroxide in Qualitative Analysis, state why filtration cannot be used to separate excess sodium hydroxide from the sodium chloride solution. ........................................................................................................................................... .......................................................................................................................................[1] (ii) Describe briefly an alternative method to make a sample of sodium chloride from hydrochloric acid and sodium hydroxide. ........................................................................................................................................... .......................................................................................................................................[1]
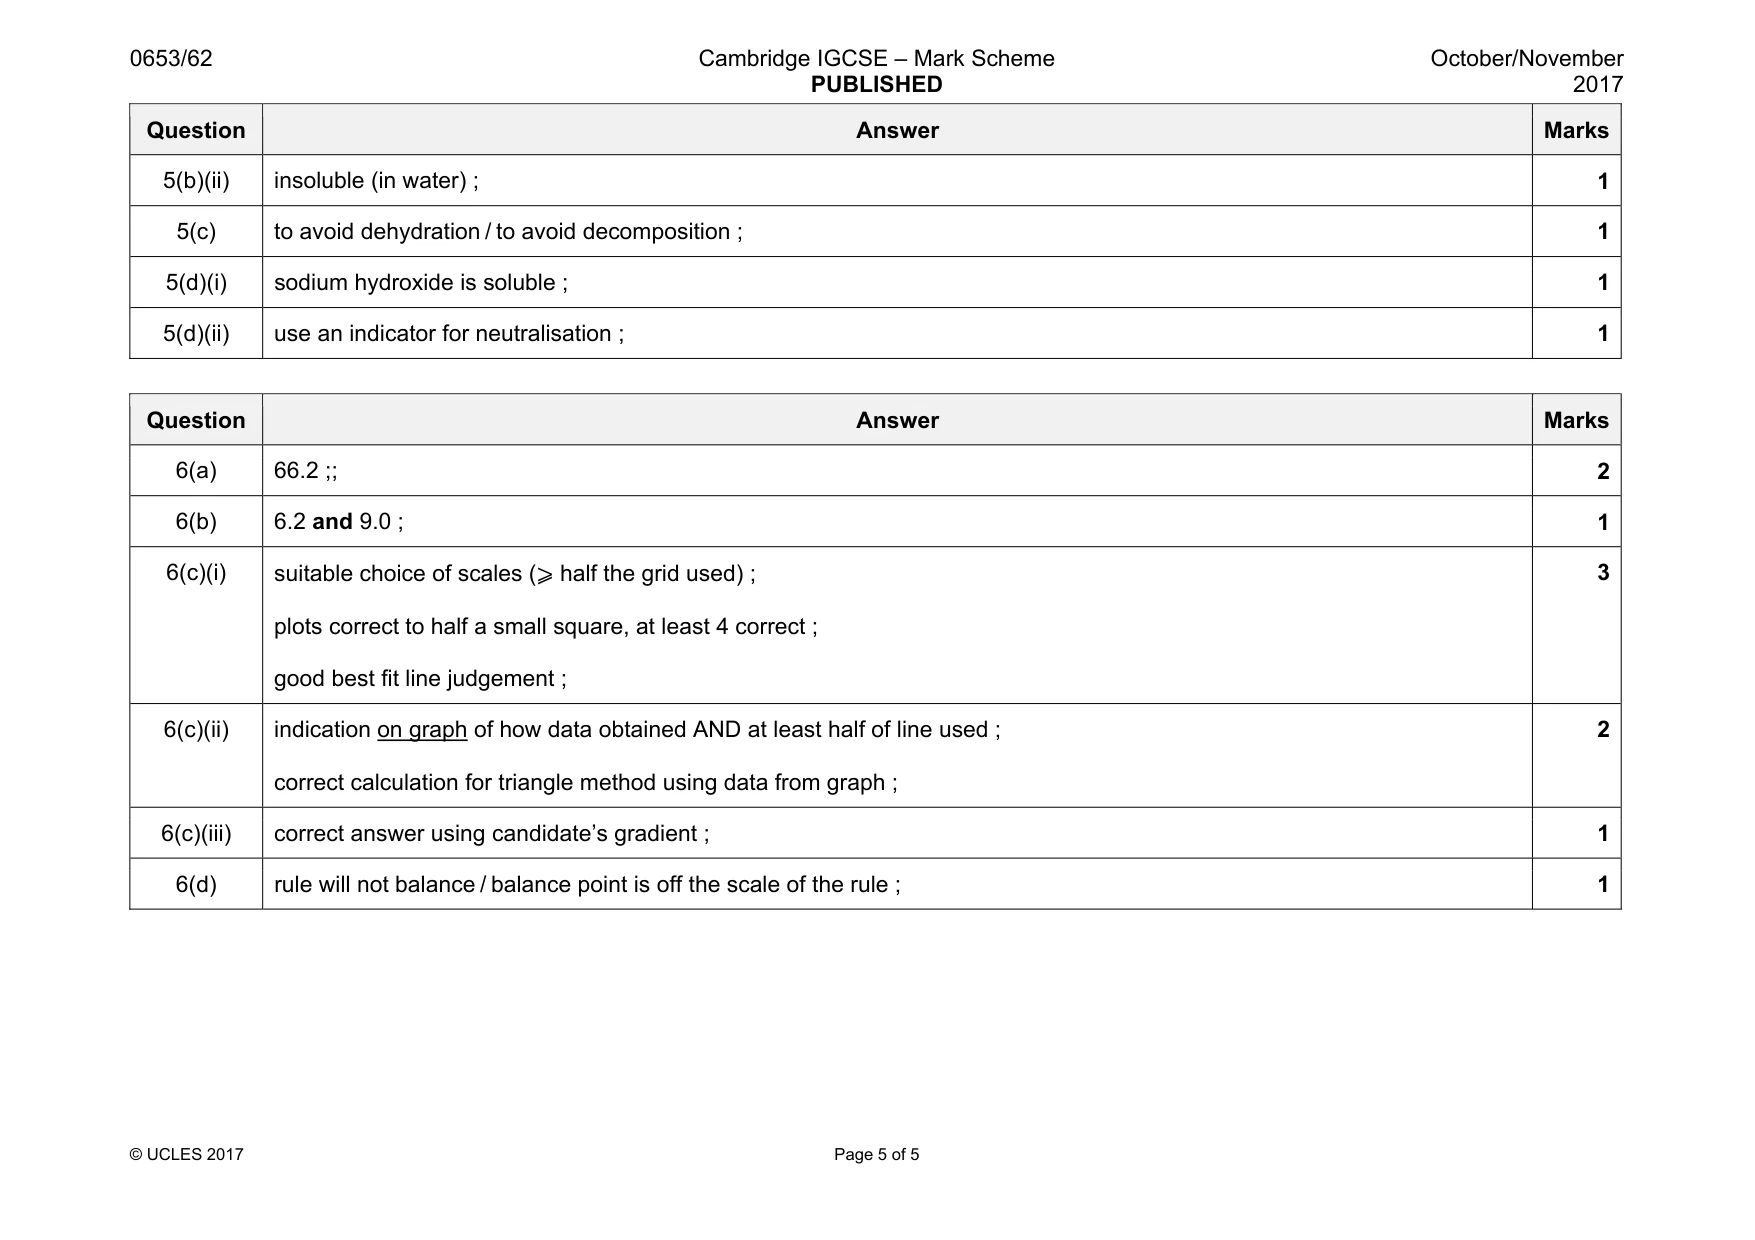
Mark scheme: 5(a)(i) sulfuric ; 1 5(a)(ii) added solid does not dissolve / no more bubbles ; 1 5(a)(iii) (blue) litmus ; does not go red ; 2 5(b)(i) funnel with filter paper drawn ; (excess) copper carbonate and filtrate / copper sulfate labelled ; 2 Question Answer Marks 5(b)(ii) insoluble (in water) ; 1 5(c) to avoid dehydration / to avoid decomposition ; 1 5(d)(i) sodium hydroxide is soluble ; 1 5(d)(ii) use an indicator for neutralisation ; 1
Q6 · A student measures the mass of a metre rule using a balancing method
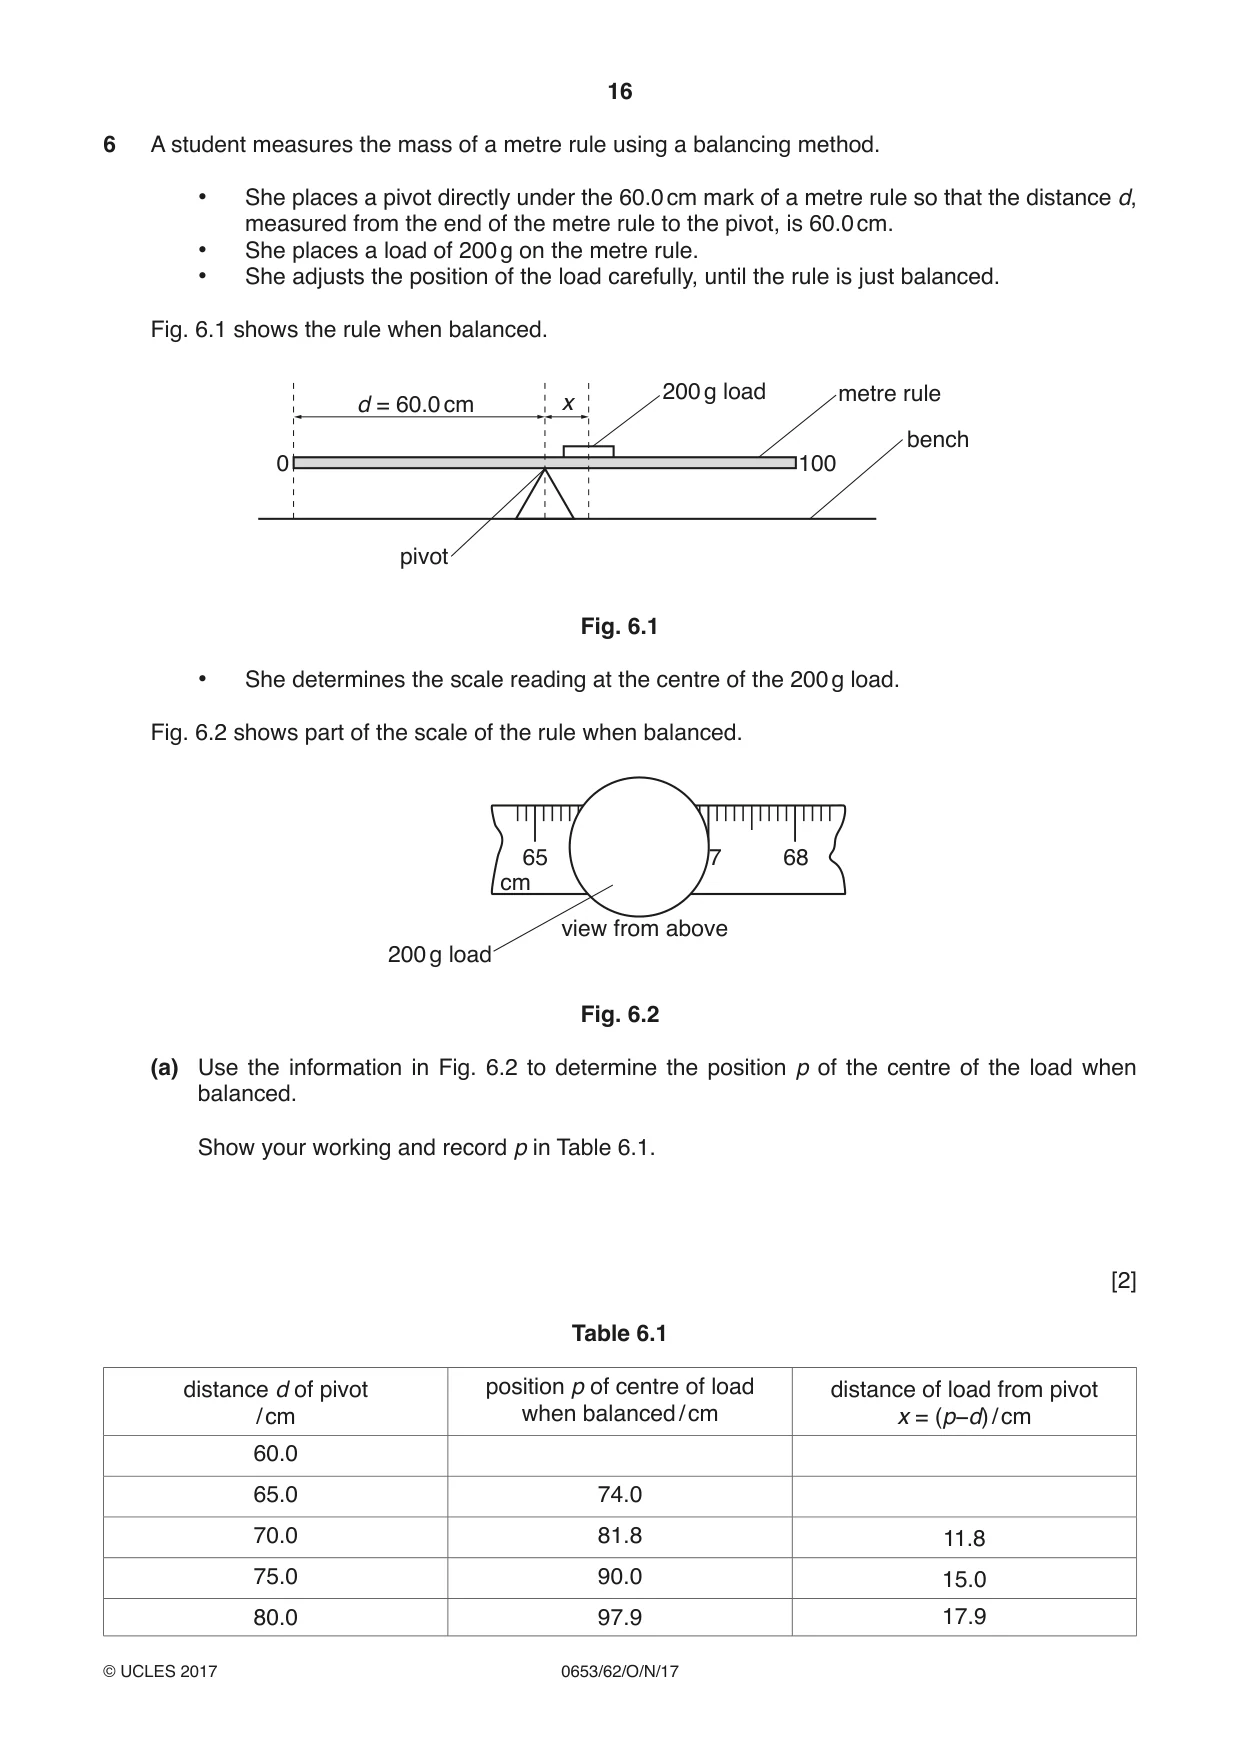
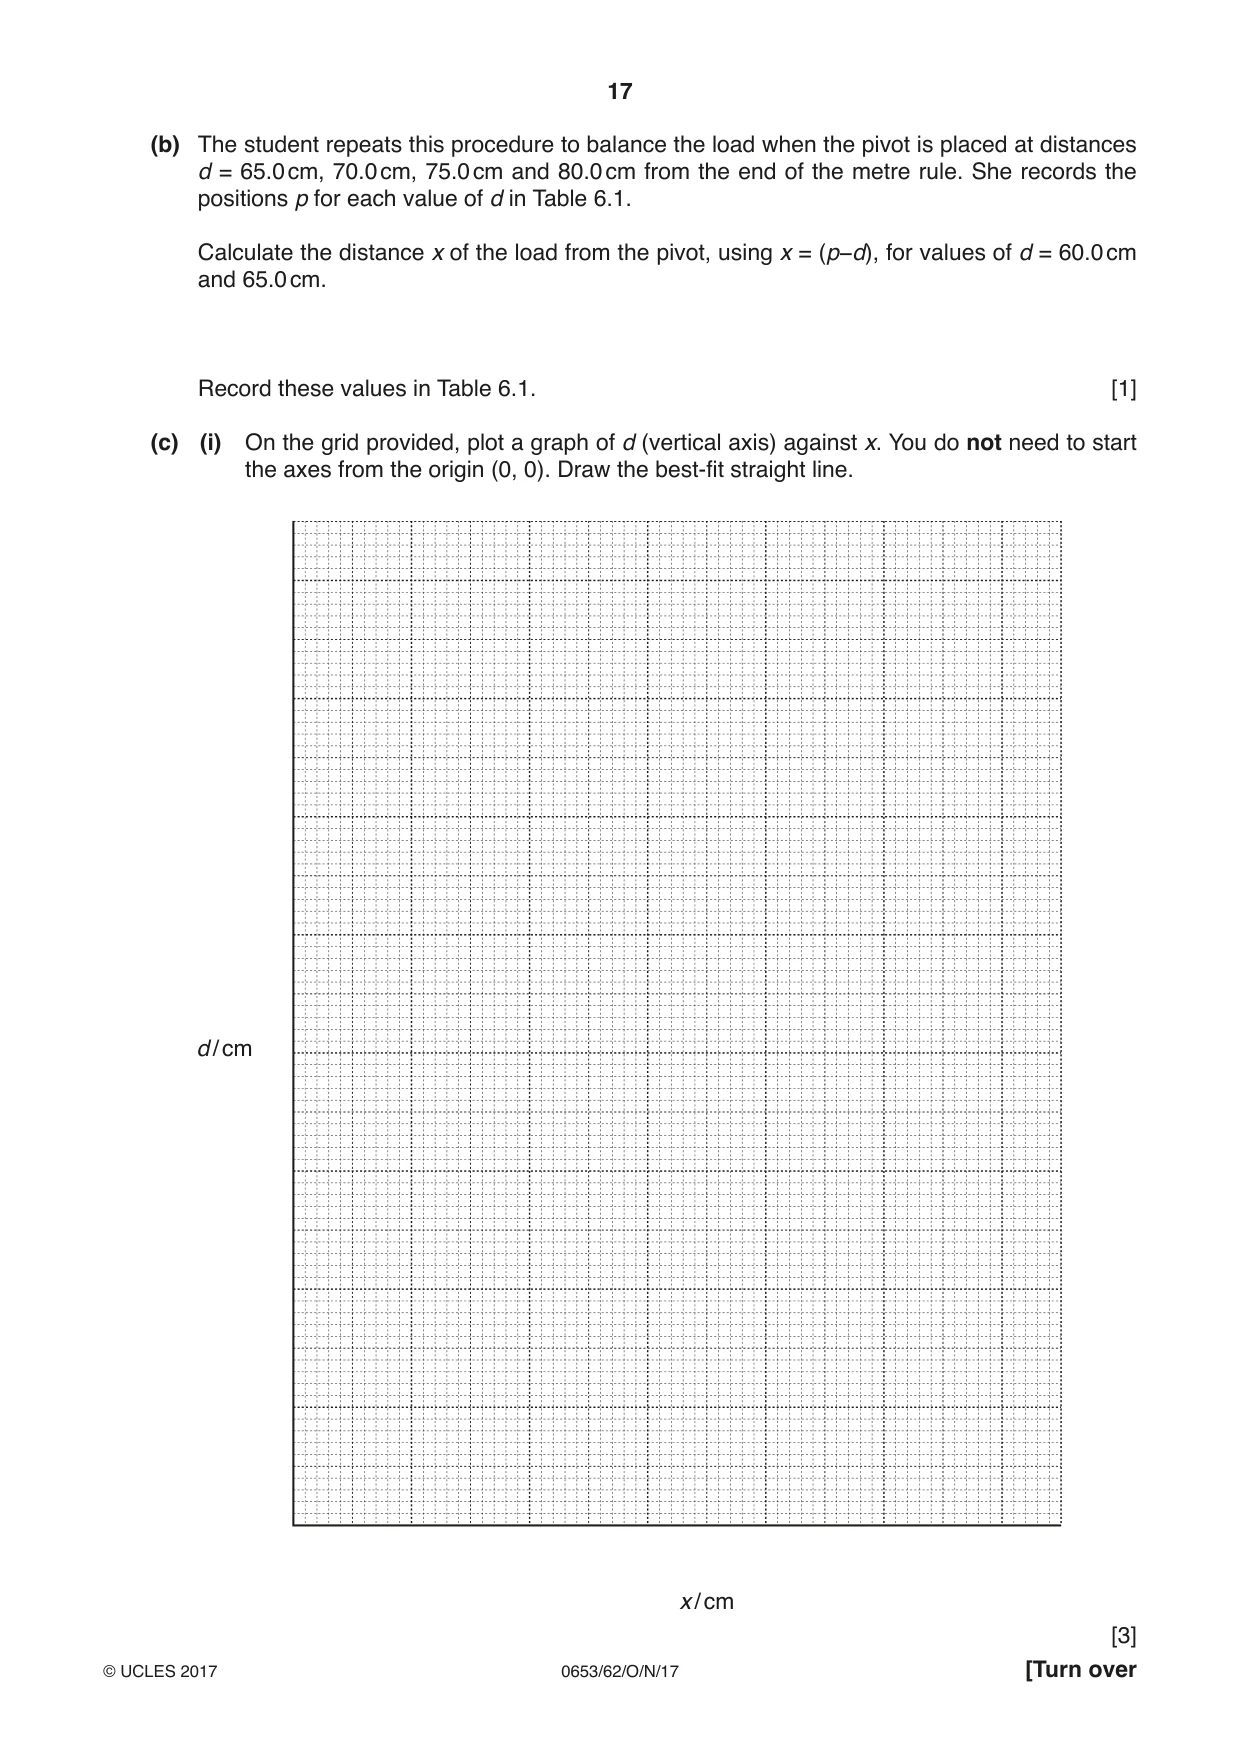
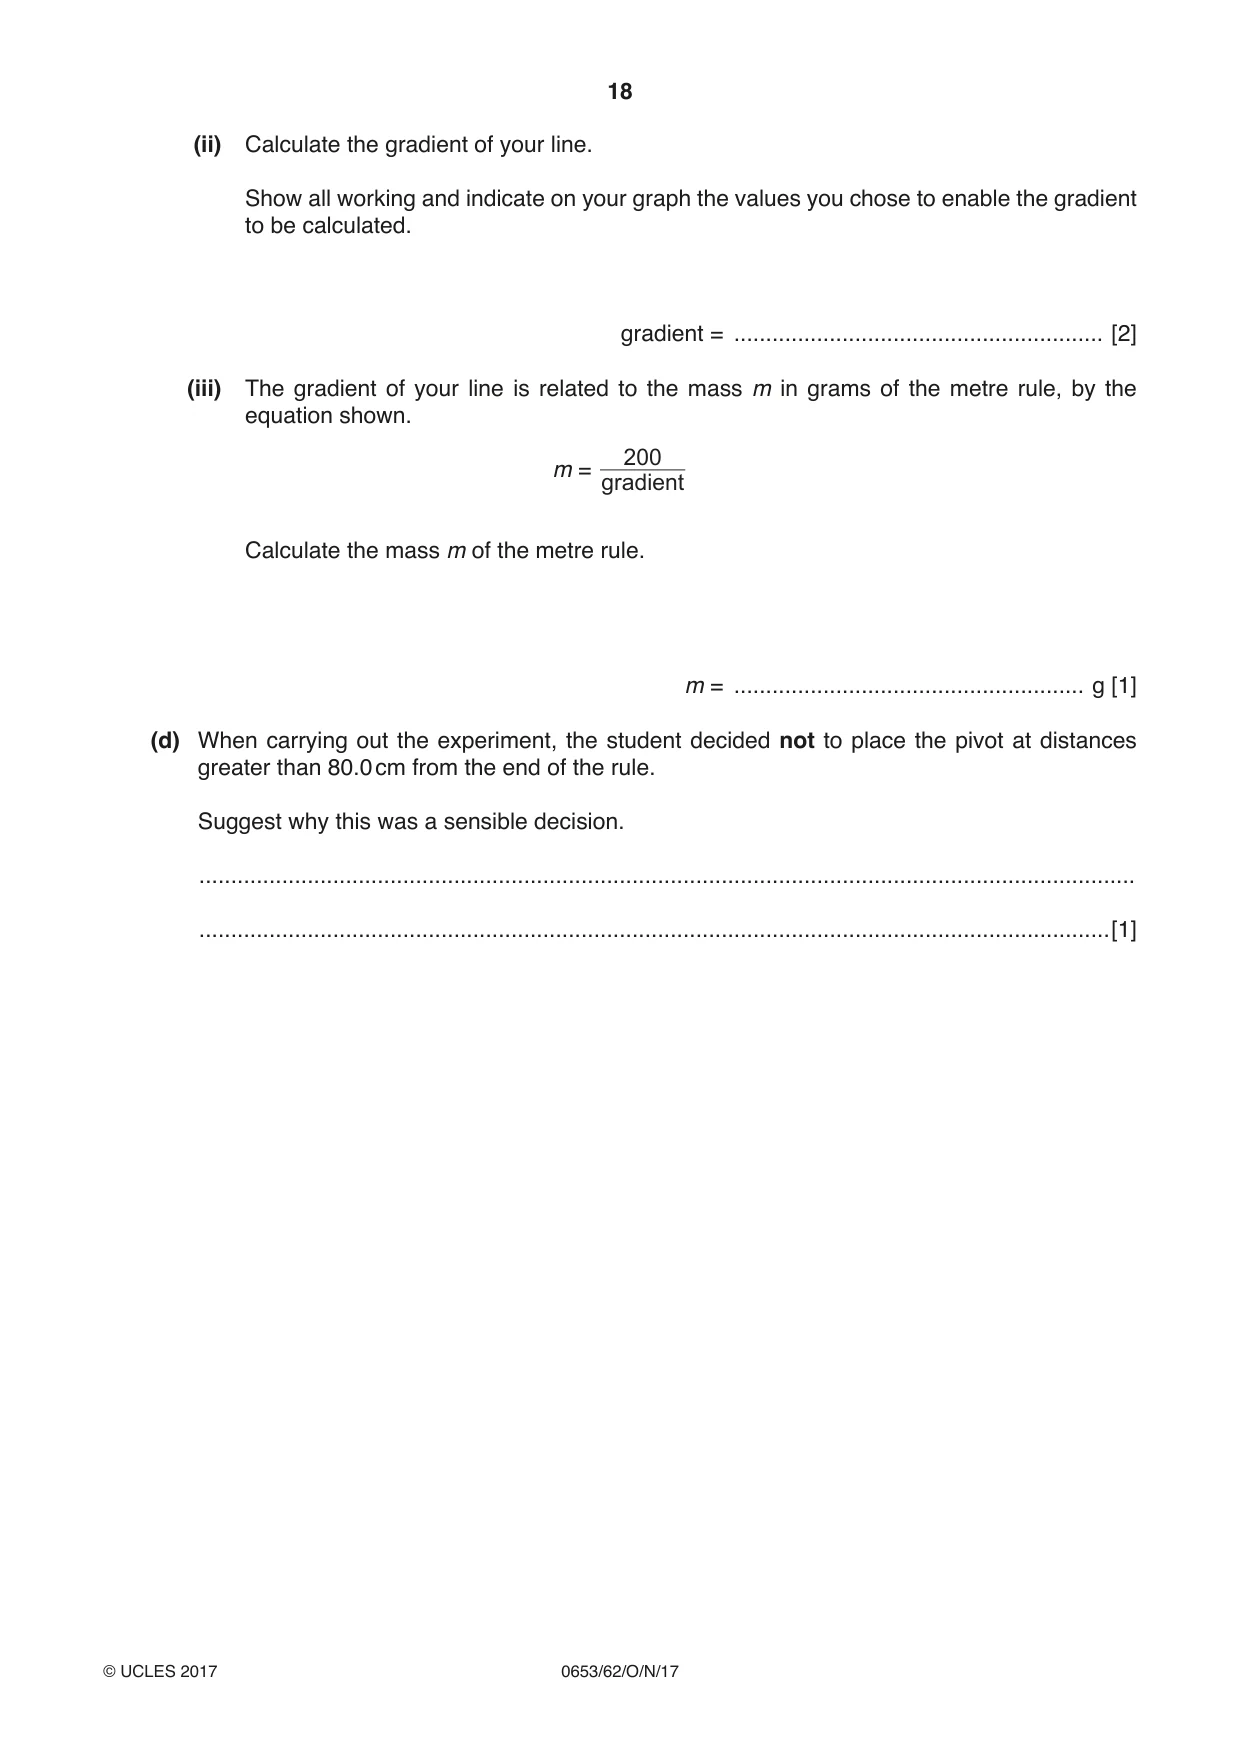
6 A student measures the mass of a metre rule using a balancing method. • She places a pivot directly under the 60.0 cm mark of a metre rule so that the distance d, measured from the end of the metre rule to the pivot, is 60.0 cm. • She places a load of 200 g on the metre rule. • She adjusts the position of the load carefully, until the rule is just balanced. Fig. 6.1 shows the rule when balanced. 200 g load metre rule d = 60.0 cm x bench 0 100 pivot Fig. 6.1 • She determines the scale reading at the centre of the 200 g load. Fig. 6.2 shows part of the scale of the rule when balanced. 65 66 67 68 cm view from above 200 g load Fig. 6.2 (a) Use the information in Fig. 6.2 to determine the position p of the centre of the load when balanced. Show your working and record p in Table 6.1. [2] Table 6.1 distance d of pivot position p of centre of load distance of load from pivot / cm when balanced / cm x = (p−d) / cm 60.0 65.0 74.0 70.0 81.8 11.8 75.0 90.0 15.0 80.0 97.9 17.9 (b) The student repeats this procedure to balance the load when the pivot is placed at distances d = 65.0 cm, 70.0 cm, 75.0 cm and 80.0 cm from the end of the metre rule. She records the positions p for each value of d in Table 6.1. Calculate the distance x of the load from the pivot, using x = (p−d), for values of d = 60.0 cm and 65.0 cm. Record these values in Table 6.1. [1] (c) (i) On the grid provided, plot a graph of d (vertical axis) against x. You do not need to start the axes from the origin (0, 0). Draw the best-fit straight line. d / cm x / cm [3] (ii) Calculate the gradient of your line. Show all working and indicate on your graph the values you chose to enable the gradient to be calculated. gradient = .......................................................... [2] (iii) The gradient of your line is related to the mass m in grams of the metre rule, by the equation shown. 200 m = gradient Calculate the mass m of the metre rule. m = ....................................................... g [1] (d) When carrying out the experiment, the student decided not to place the pivot at distances greater than 80.0 cm from the end of the rule. Suggest why this was a sensible decision. ................................................................................................................................................... ...............................................................................................................................................[1]
Mark scheme: 6(a) 66.2 ;; 2 6(b) 6.2 and 9.0 ; 1 6(c)(i) suitable choice of scales (⩾ half the grid used) ; plots correct to half a small square, at least 4 correct ; good best fit line judgement ; 3 6(c)(ii) indication on graph of how data obtained AND at least half of line used ; correct calculation for triangle method using data from graph ; 2 6(c)(iii) correct answer using candidate’s gradient ; 1 6(d) rule will not balance / balance point is off the scale of the rule ; 1
What was in this paper
The subtopics covered by these 6 questions, and how many questions each got. Open one in a new tab to see every Cambridge question on it.
What you needed in this session
Cambridge’s own grade thresholds for 2017 Oct/Nov, Paper 6 · Variant 2. A higher threshold means an easier paper — the bar moves with how the cohort did.