Cambridge IGCSE Science - Combined 0653 — 2017 May/June Paper 5 · Variant 1
0653/51/M/J/17 · 3 questions · 30 marks · ≈34 min
The question paper and its mark scheme, free to read here and free to download. This is Cambridge’s own paper, exactly as it was sat.
Question paper8 pages

Mark scheme4 pages
Answers below. Sit the paper first if you are practising.
Questions as text
Q1 · You are going to investigate the nutrient content of banana, chickpea and egg white
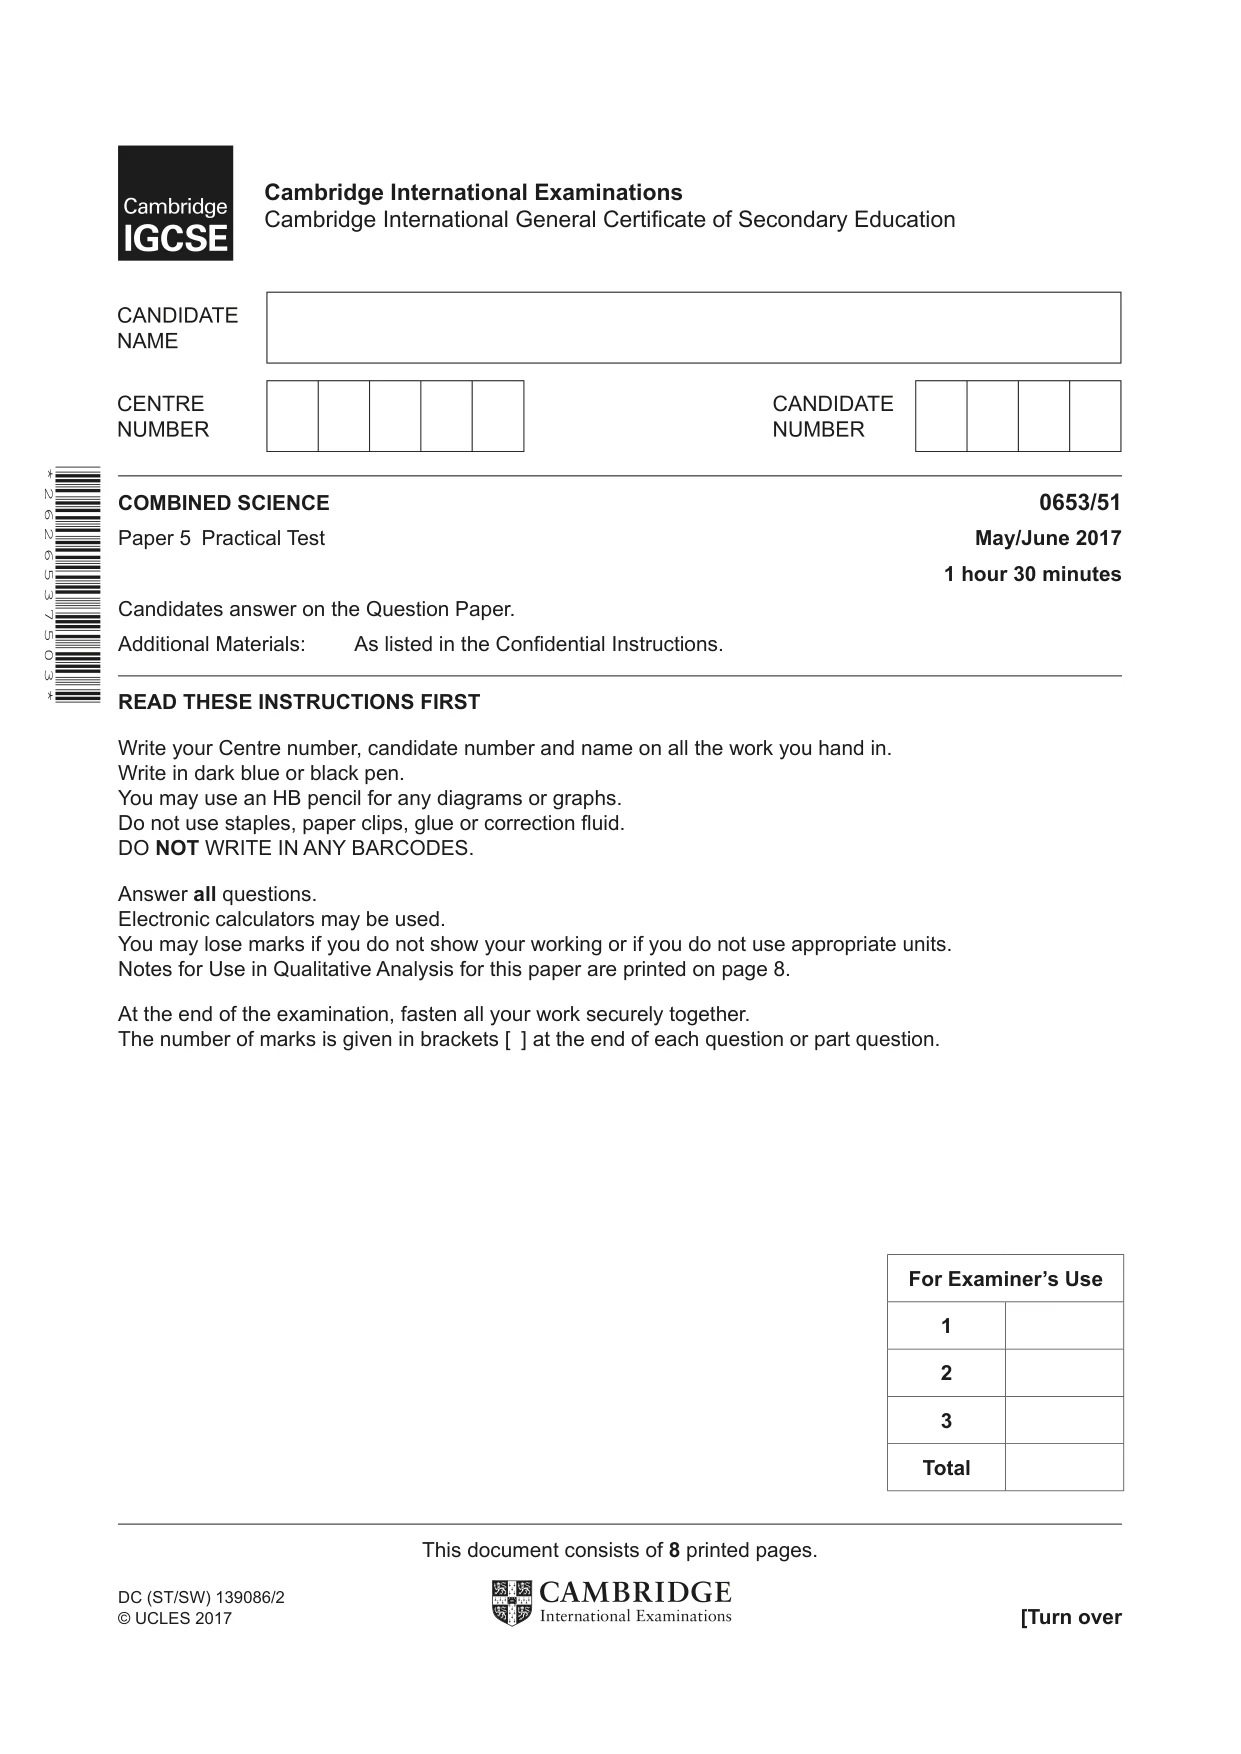
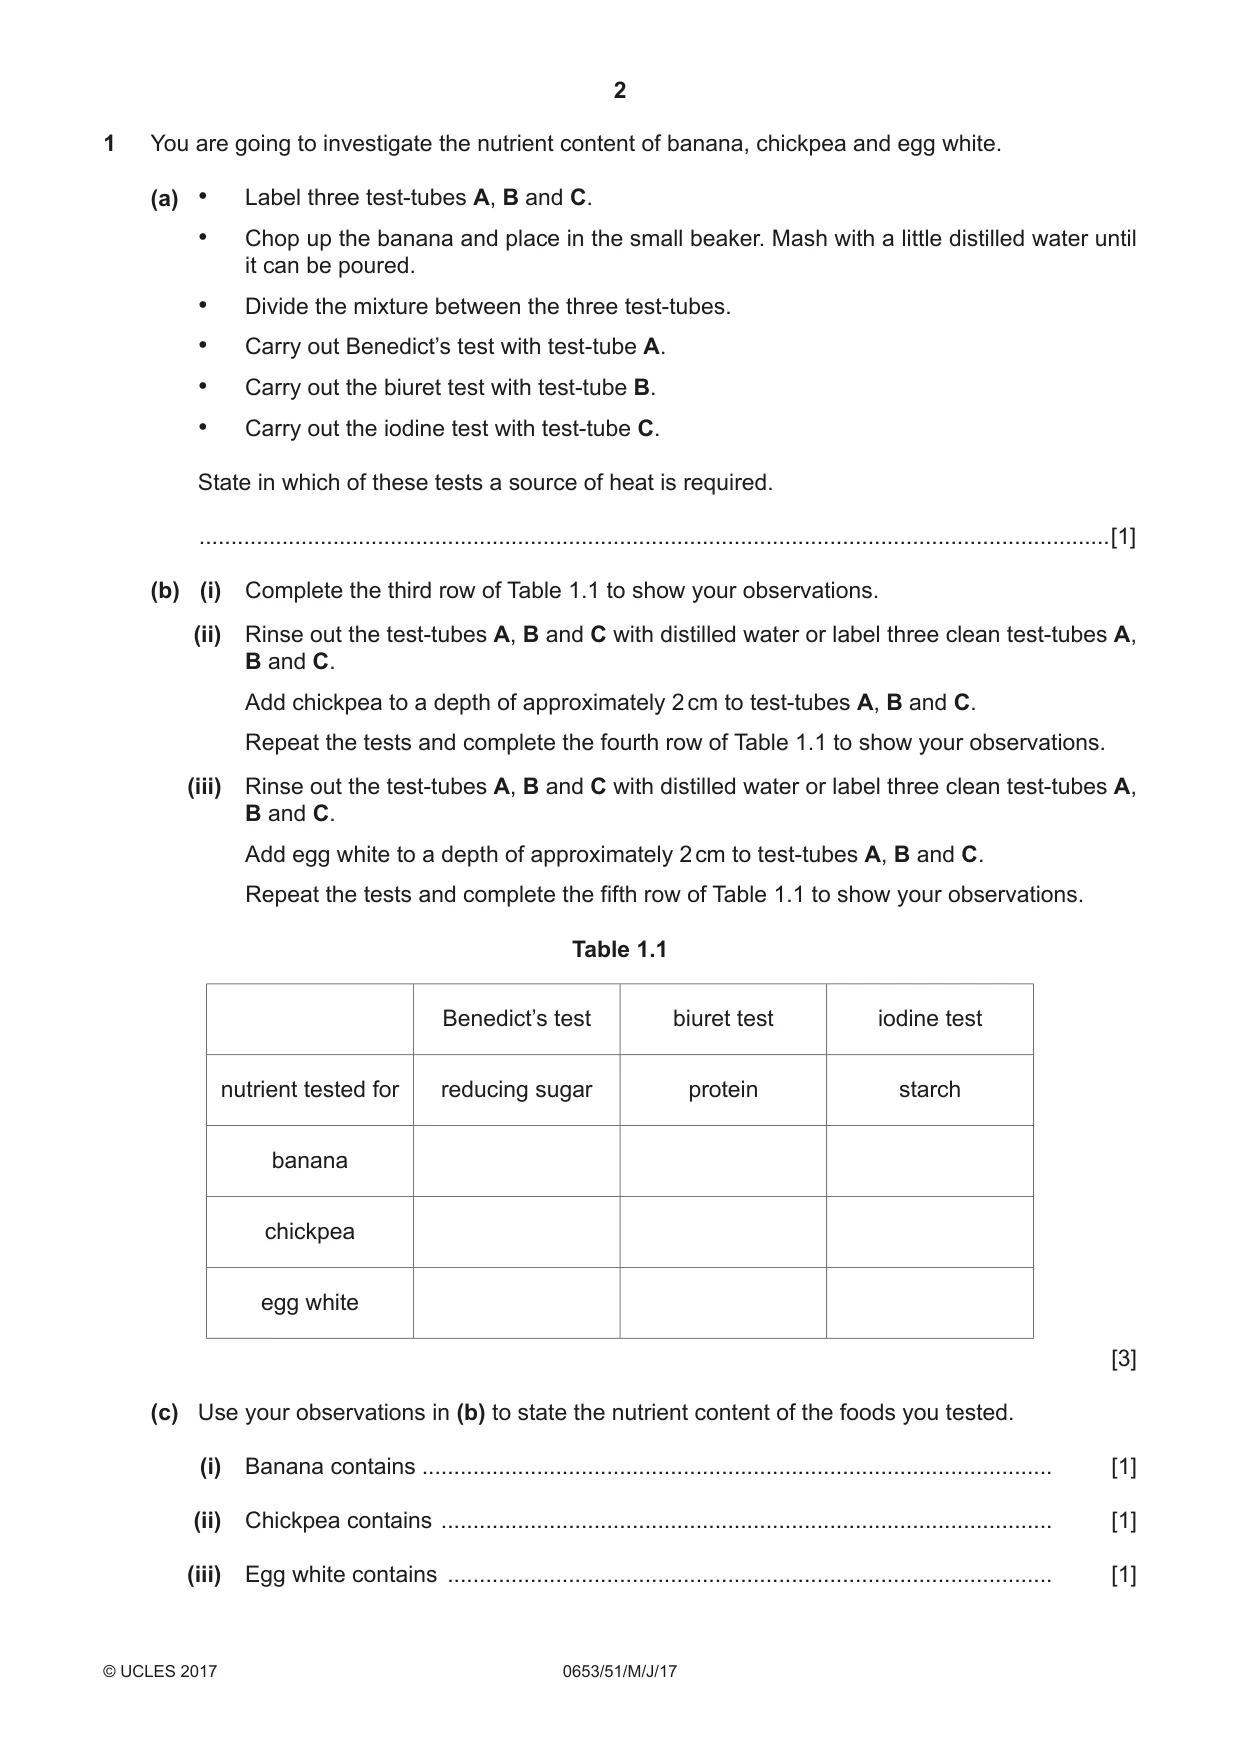
1 You are going to investigate the nutrient content of banana, chickpea and egg white. (a) • Label three test-tubes A, B and C. • Chop up the banana and place in the small beaker. Mash with a little distilled water until it can be poured. • Divide the mixture between the three test-tubes. • Carry out Benedict’s test with test-tube A. • Carry out the biuret test with test-tube B. • Carry out the iodine test with test-tube C. State in which of these tests a source of heat is required. ...............................................................................................................................................[1] (b) (i) Complete the third row of Table 1.1 to show your observations. (ii) Rinse out the test-tubes A, B and C with distilled water or label three clean test-tubes A, B and C. Add chickpea to a depth of approximately 2 cm to test-tubes A, B and C. Repeat the tests and complete the fourth row of Table 1.1 to show your observations. (iii) Rinse out the test-tubes A, B and C with distilled water or label three clean test-tubes A, B and C. Add egg white to a depth of approximately 2 cm to test-tubes A, B and C. Repeat the tests and complete the fifth row of Table 1.1 to show your observations. Table 1.1 Benedict’s test biuret test iodine test nutrient tested for reducing sugar protein starch banana chickpea egg white [3] (c) Use your observations in (b) to state the nutrient content of the foods you tested. (i) Banana contains ................................................................................................... [1] (ii) Chickpea contains ................................................................................................ [1] (iii) Egg white contains ............................................................................................... [1] (d) Describe how you can test for the presence of fat in egg white. method ...................................................................................................................................... ................................................................................................................................................... ................................................................................................................................................... observation for positive result ................................................................................................... ................................................................................................................................................... [3]
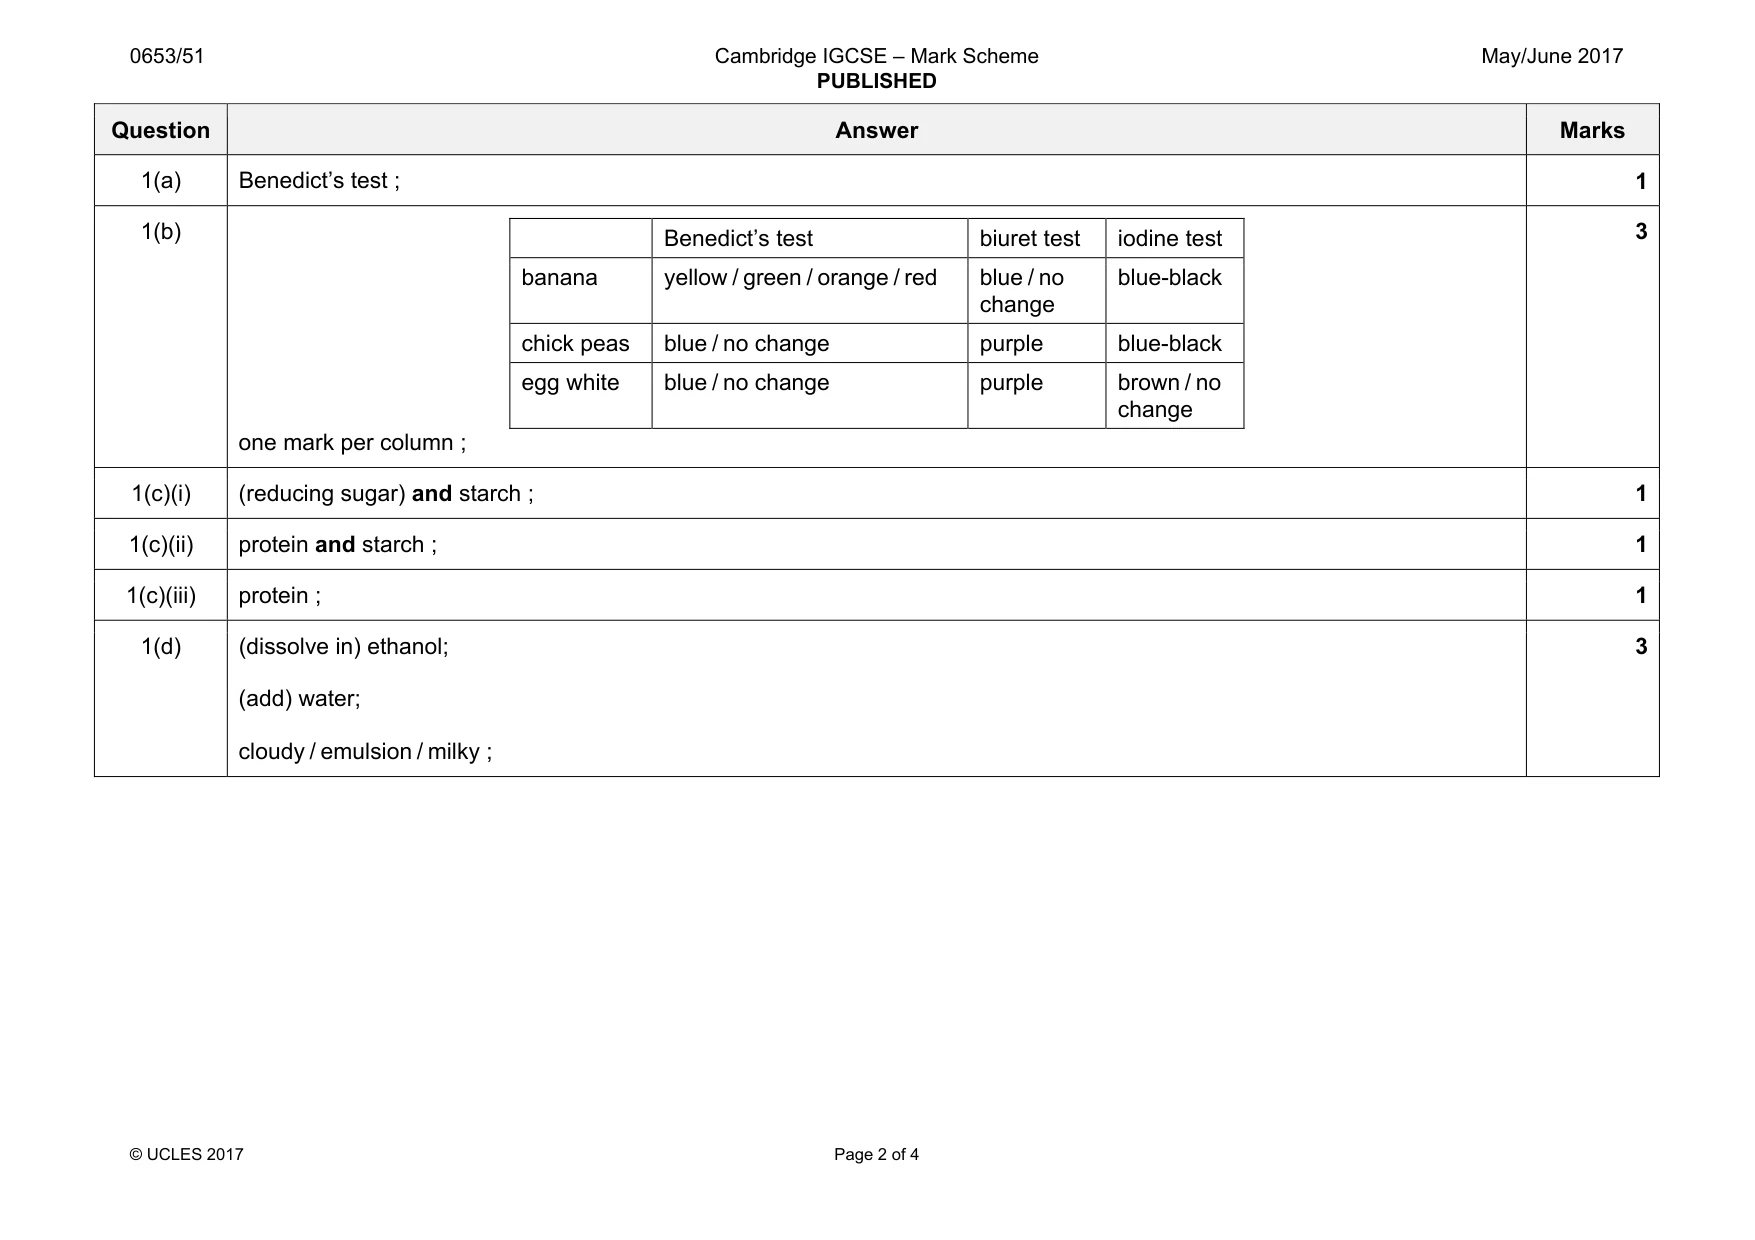
Mark scheme: 1(a) Benedict’s test ; 1 1(b) Benedict’s test biuret test iodine test banana yellow / green / orange / red blue / no change blue-black chick peas blue / no change purple blue-black egg white blue / no change purple brown / no change one mark per column ; 3 1(c)(i) (reducing sugar) and starch ; 1 1(c)(ii) protein and starch ; 1 1(c)(iii) protein ; 1 1(d) (dissolve in) ethanol; (add) water; cloudy / emulsion / milky ; 3
Q2 · Notes for use in Qualitative Analysis for this question are printed on page 8
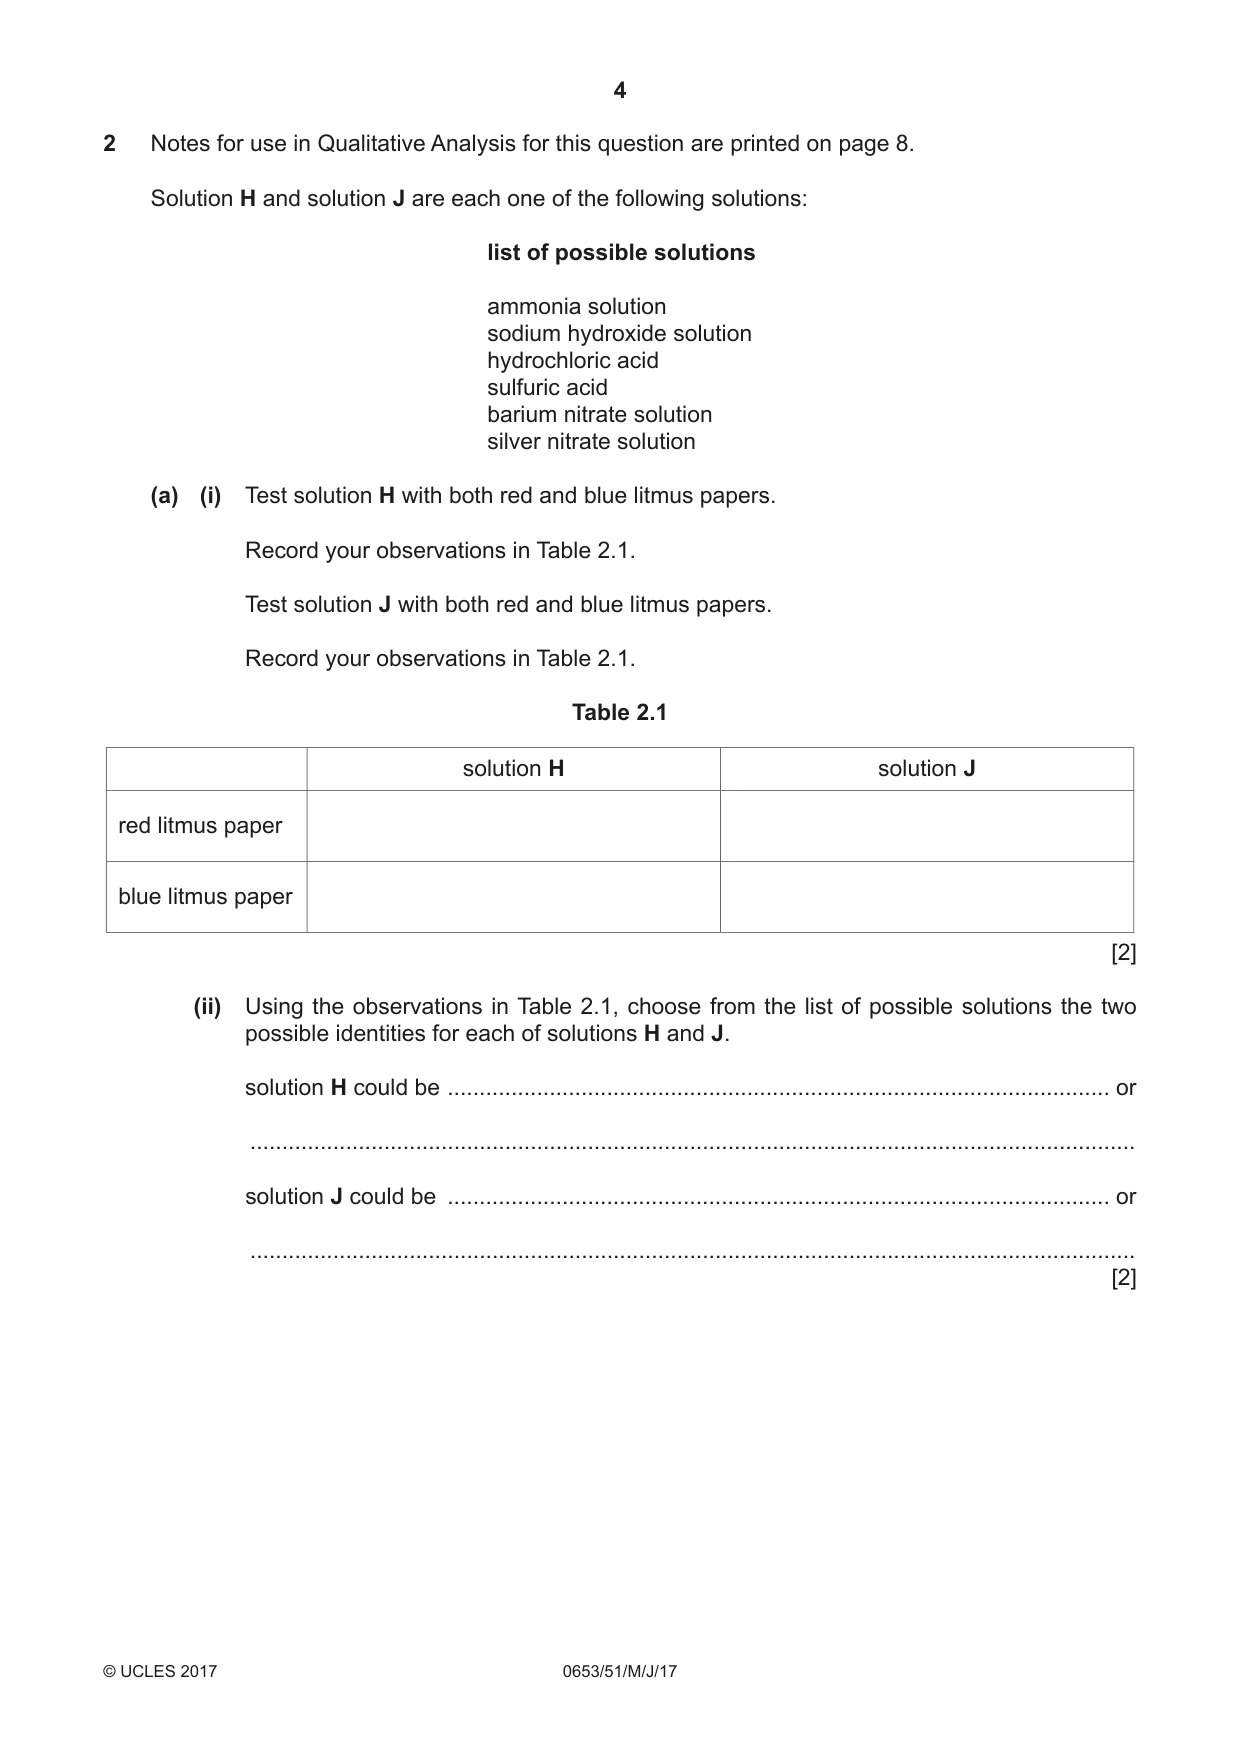
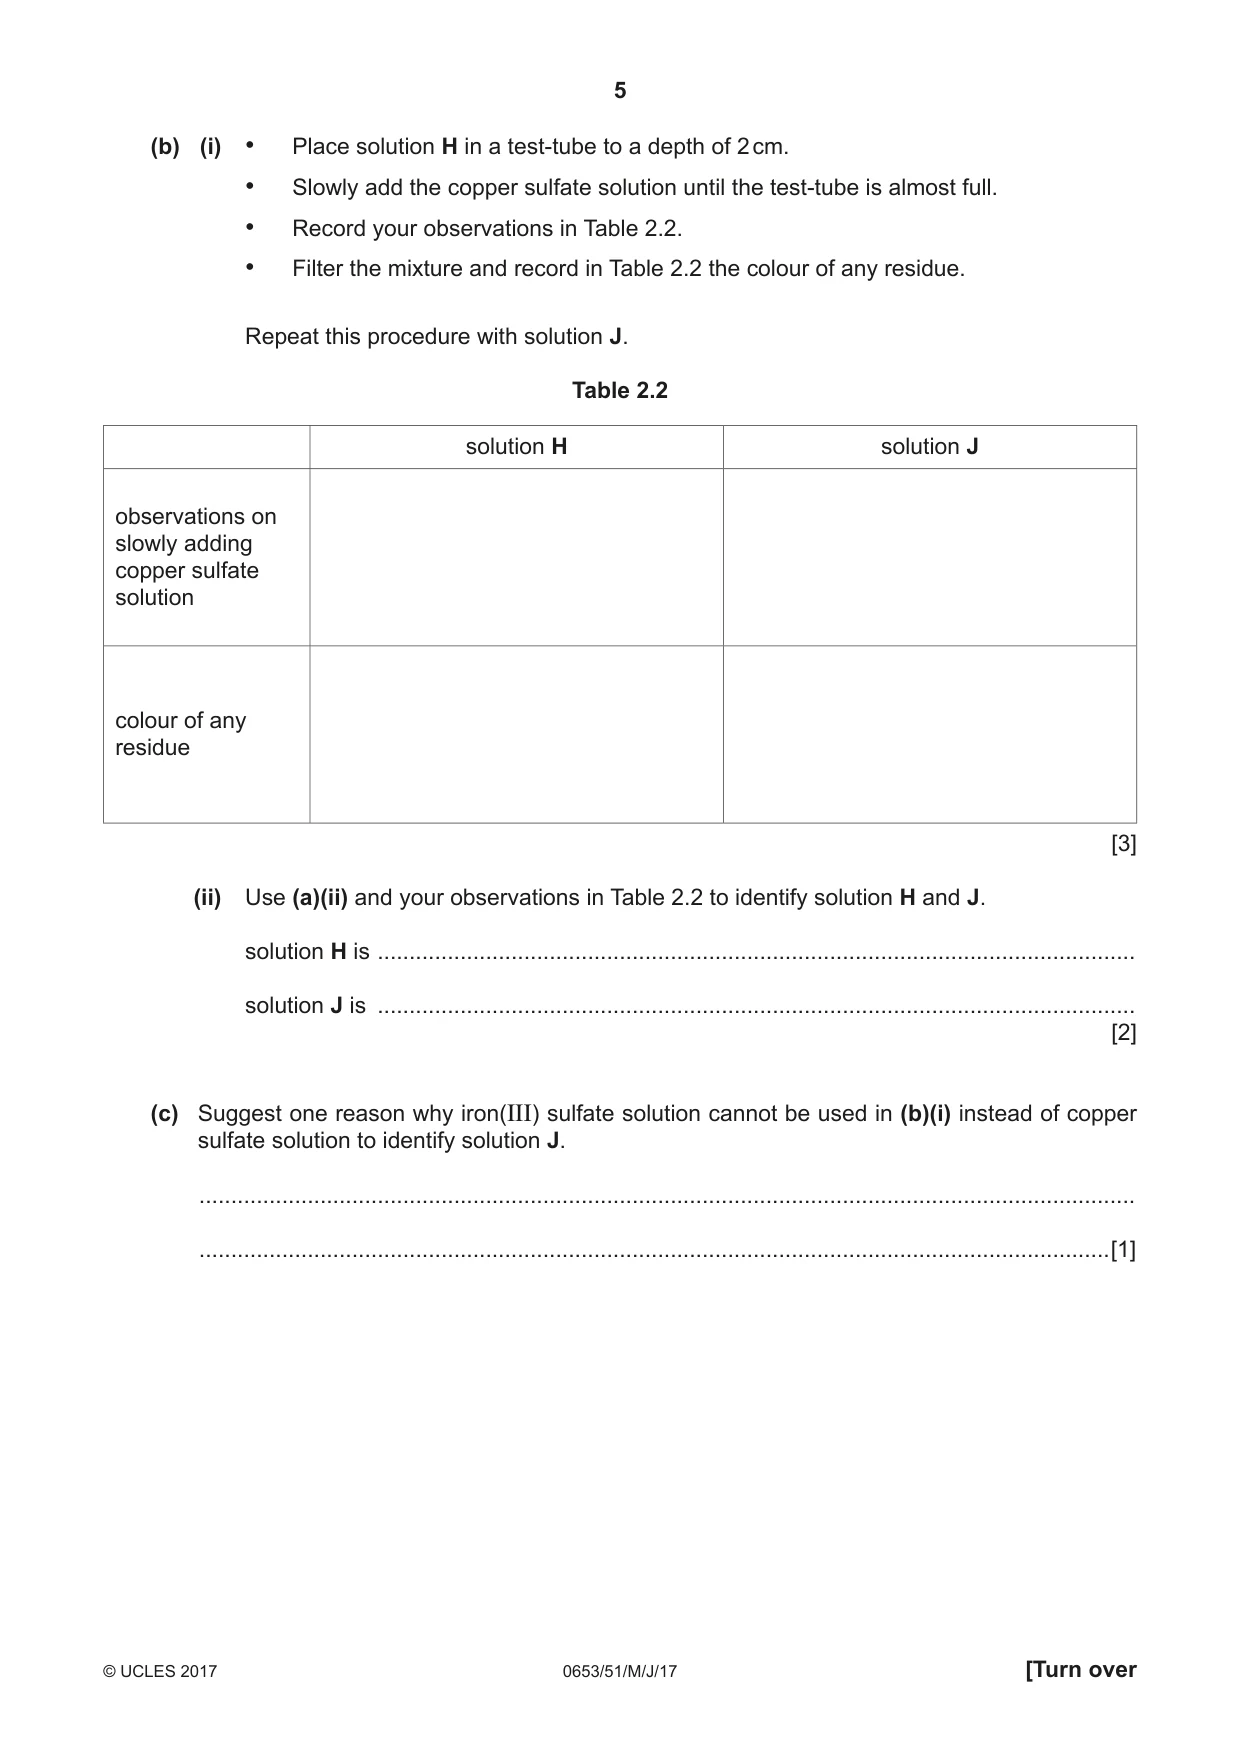
2 Notes for use in Qualitative Analysis for this question are printed on page 8. Solution H and solution J are each one of the following solutions: list of possible solutions ammonia solution sodium hydroxide solution hydrochloric acid sulfuric acid barium nitrate solution silver nitrate solution (a) (i) Test solution H with both red and blue litmus papers. Record your observations in Table 2.1. Test solution J with both red and blue litmus papers. Record your observations in Table 2.1. Table 2.1 solution H solution J red litmus paper blue litmus paper [2] (ii) Using the observations in Table 2.1, choose from the list of possible solutions the two possible identities for each of solutions H and J. solution H could be ........................................................................................................ or ........................................................................................................................................... solution J could be ........................................................................................................ or ........................................................................................................................................... [2] (b) (i) • Place solution H in a test-tube to a depth of 2 cm. • Slowly add the copper sulfate solution until the test-tube is almost full. • Record your observations in Table 2.2. • Filter the mixture and record in Table 2.2 the colour of any residue. Repeat this procedure with solution J. Table 2.2 solution H solution J observations on slowly adding copper sulfate solution colour of any residue [3] (ii) Use (a)(ii) and your observations in Table 2.2 to identify solution H and J. solution H is ....................................................................................................................... solution J is ....................................................................................................................... [2] (c) Suggest one reason why iron(III) sulfate solution cannot be used in (b)(i) instead of copper sulfate solution to identify solution J. ................................................................................................................................................... ...............................................................................................................................................[1]
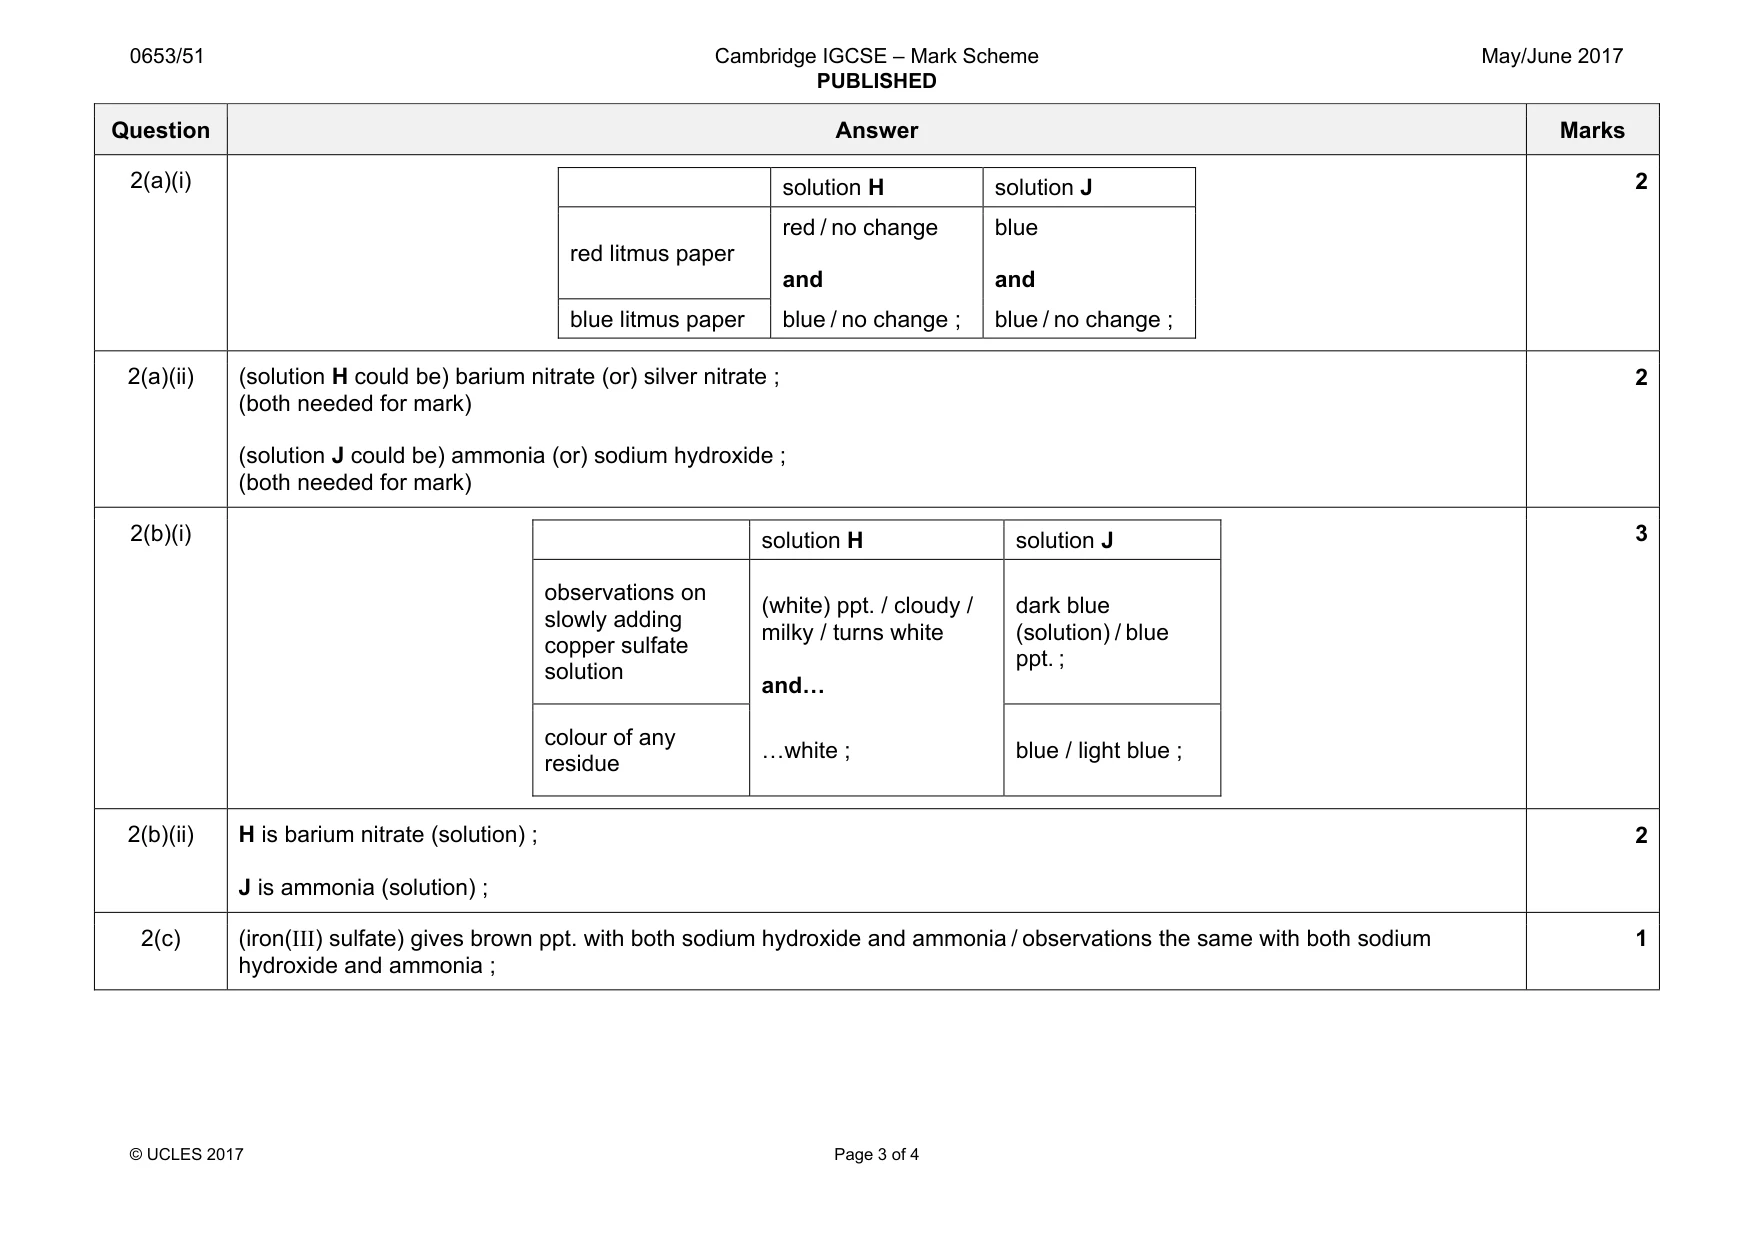
Mark scheme: 2(a)(i) solution H solution J red litmus paper red / no change and blue and blue litmus paper blue / no change ; blue / no change ; 2 2(a)(ii) (solution H could be) barium nitrate (or) silver nitrate ; (both needed for mark) (solution J could be) ammonia (or) sodium hydroxide ; (both needed for mark) 2 2(b)(i) solution H solution J observations on slowly adding copper sulfate solution (white) ppt. / cloudy / milky / turns white and« dark blue (solution) / blue ppt. ; colour of any residue «white ; blue / light blue ; 3 2(b)(ii) H is barium nitrate (solution) ; J is ammonia (solution) ; 2 2(c) (iron(III) sulfate) gives brown ppt. with both sodium hydroxide and ammonia / observations the same with both sodium hydroxide and ammonia ; 1
Q3 · You are going to investigate how the resistance of a metal wire depends upon its length
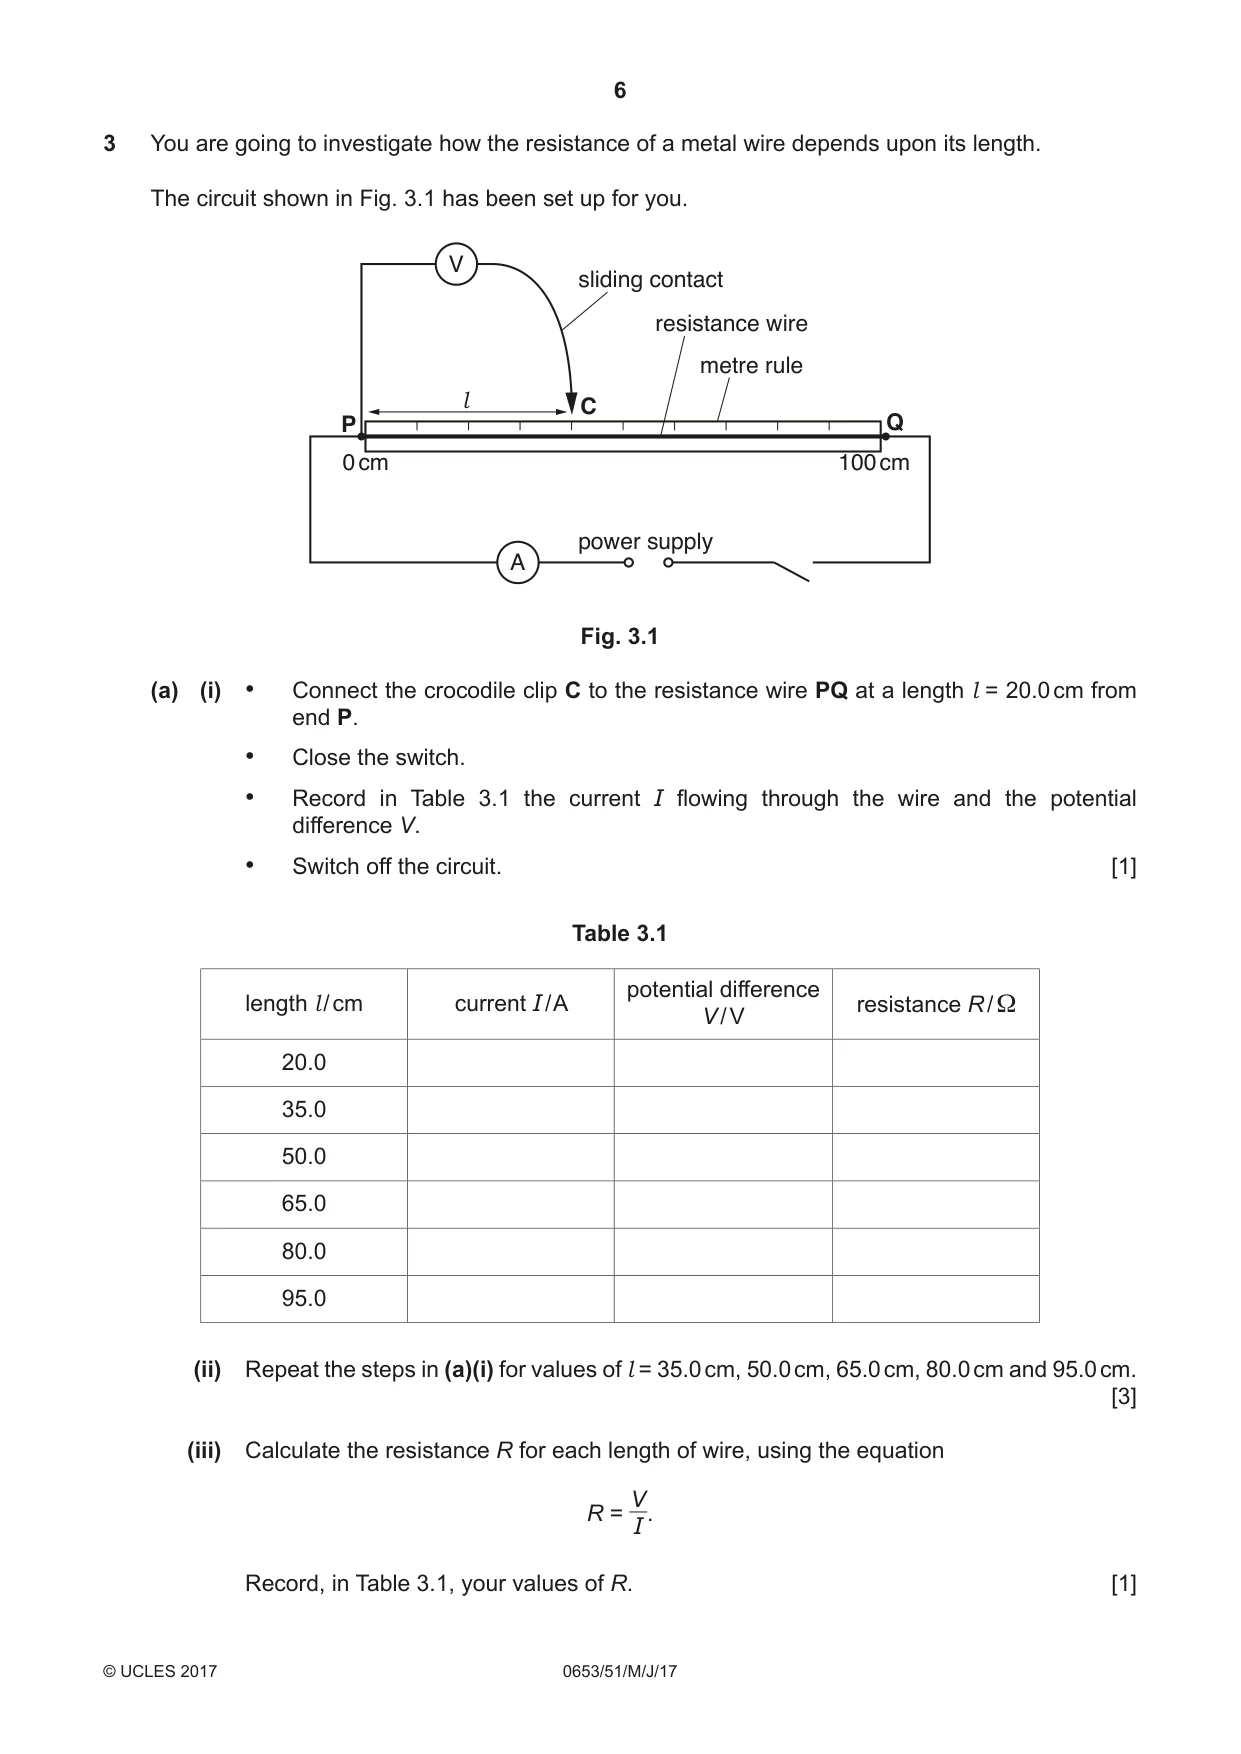
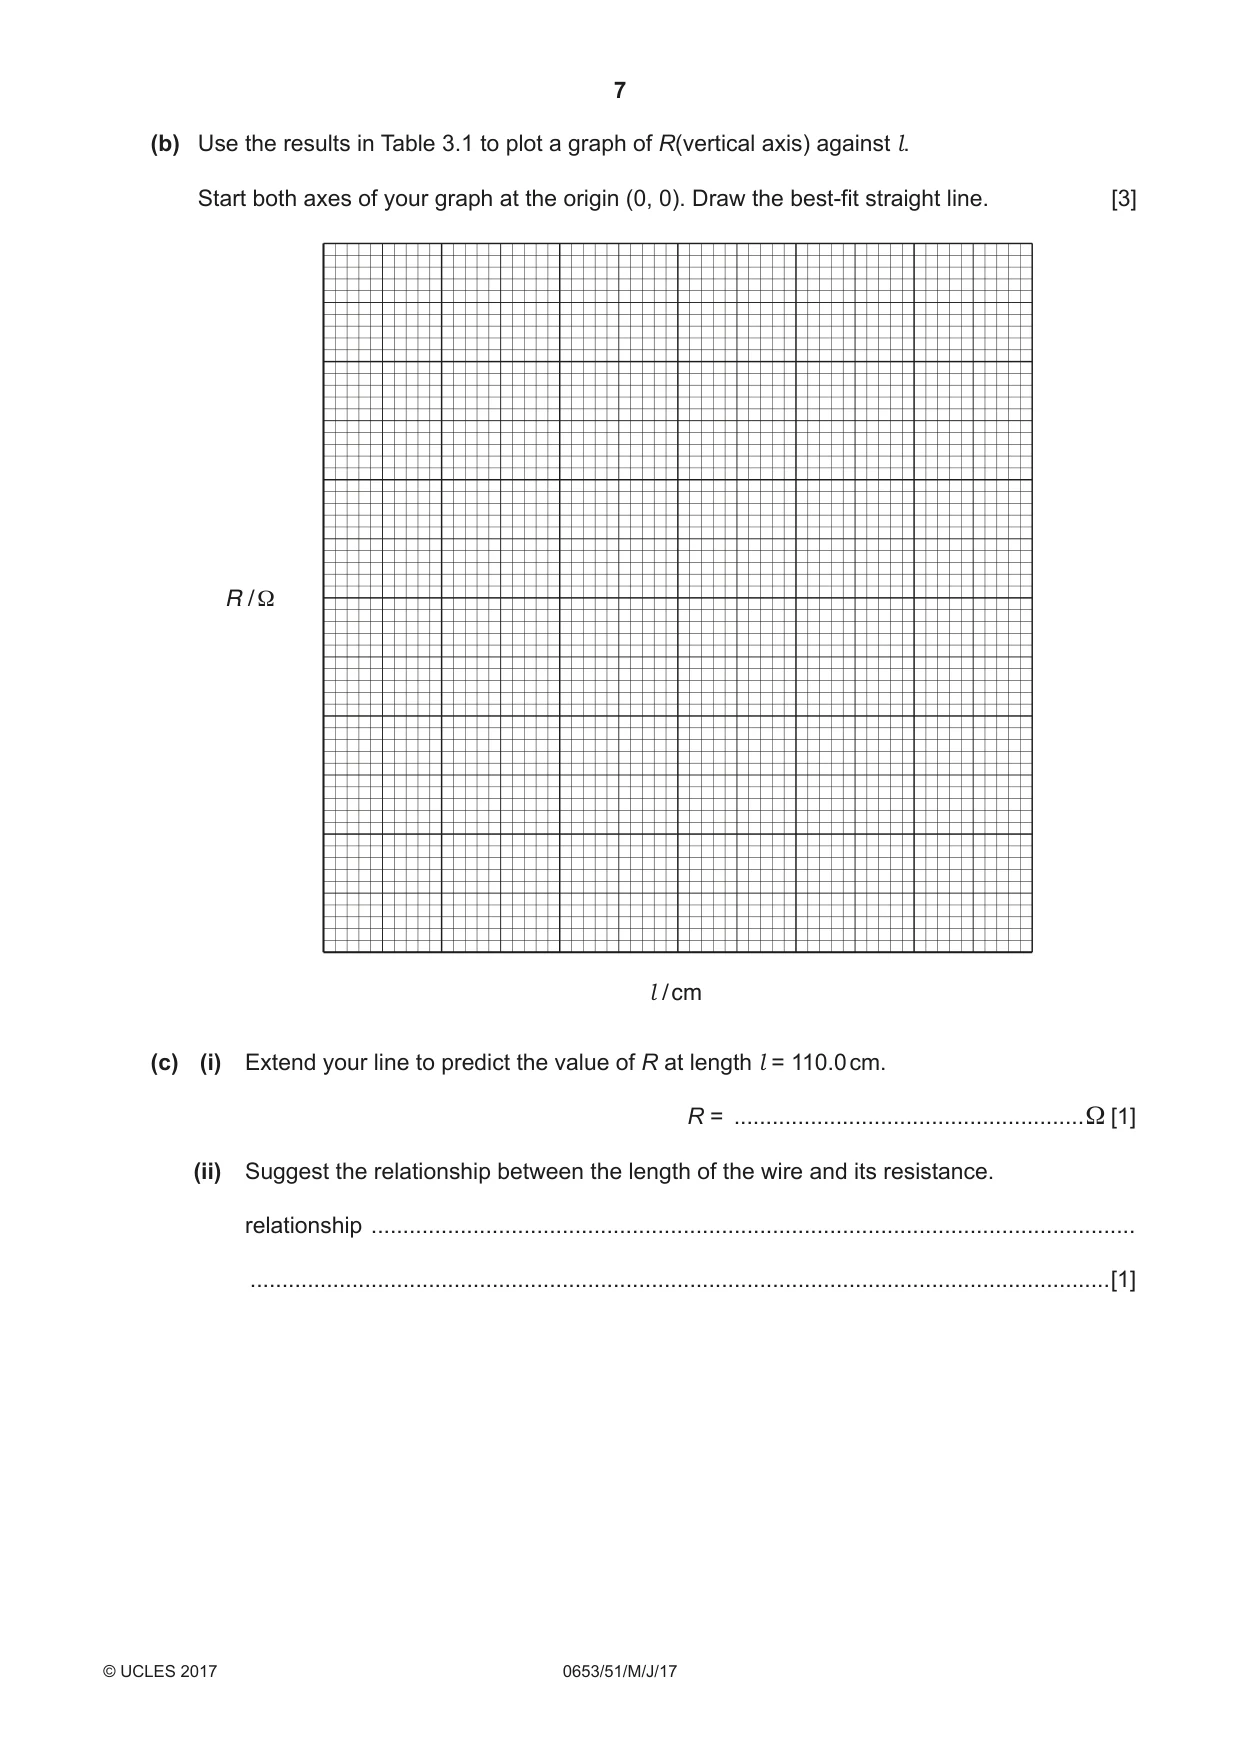
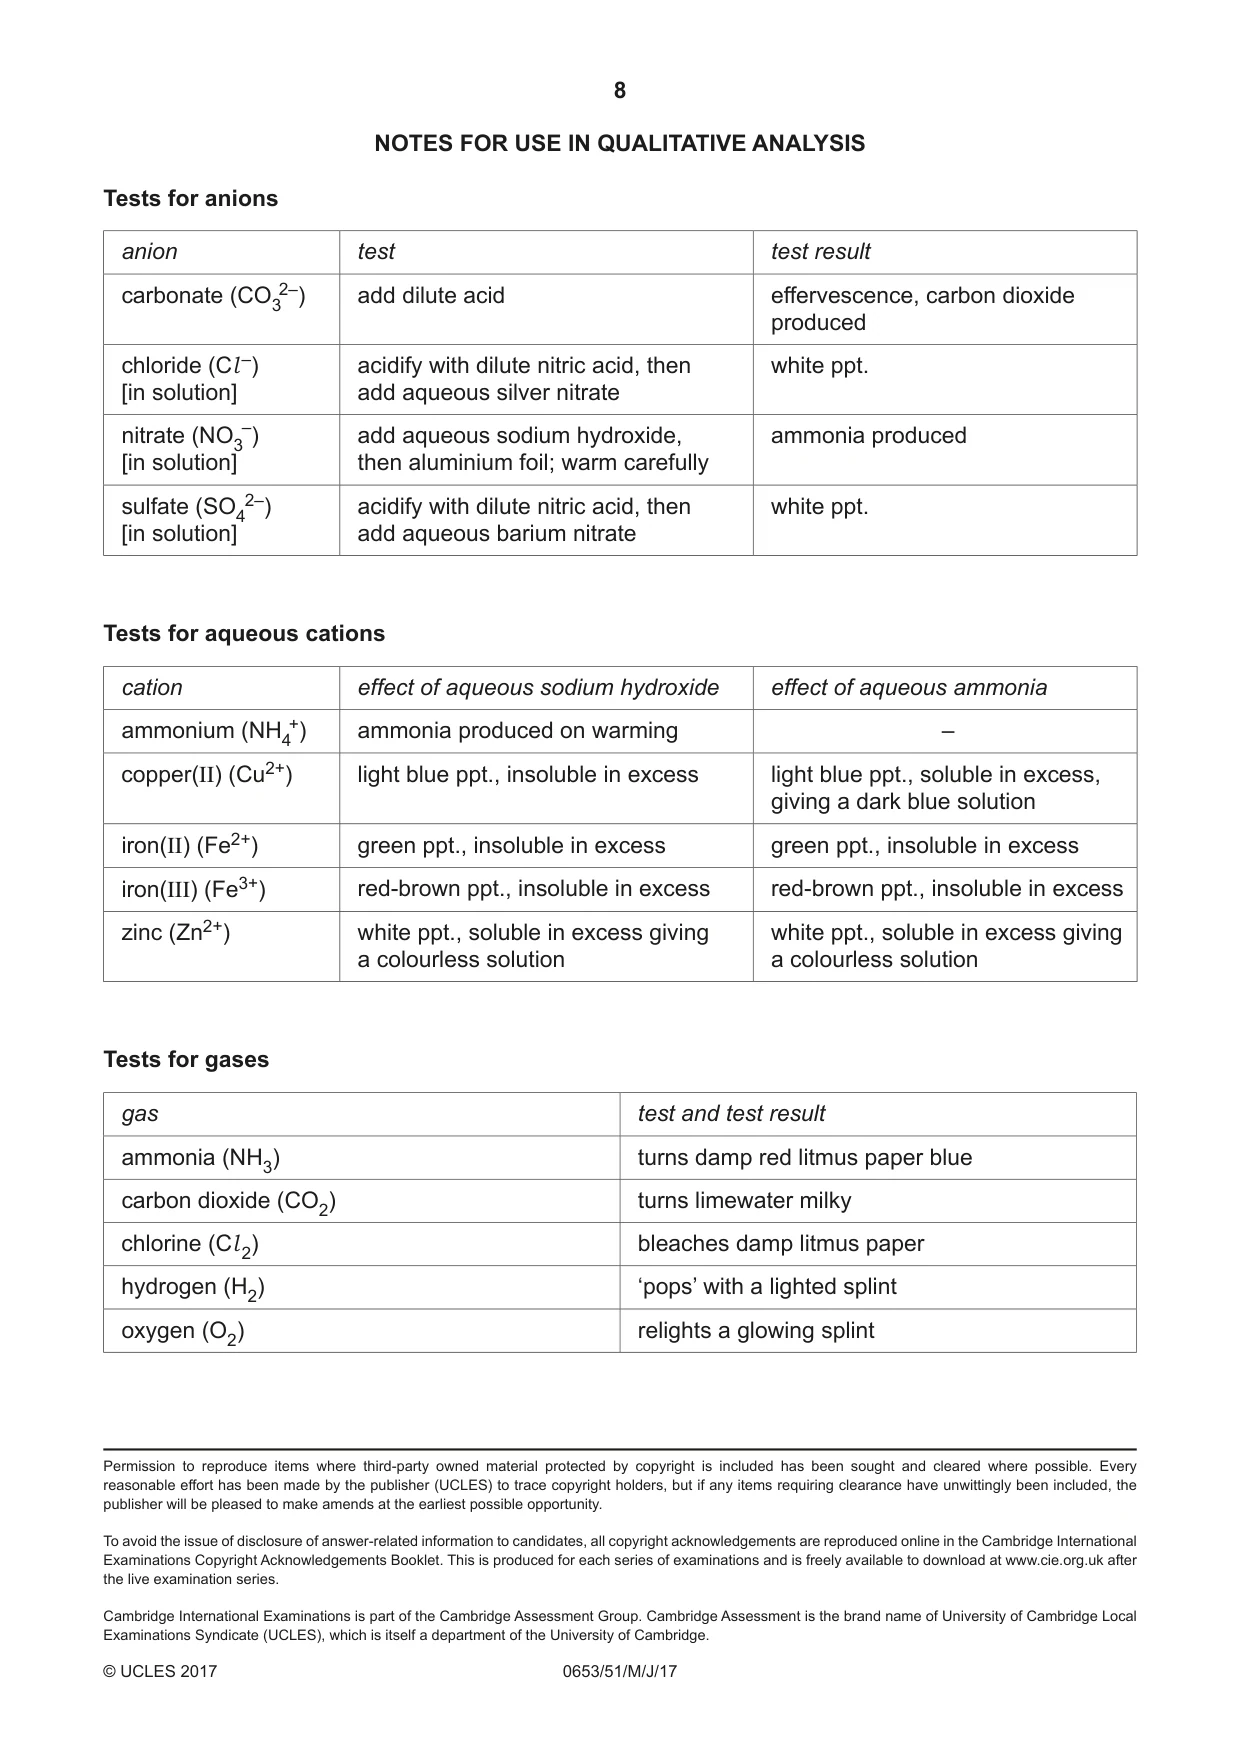
3 You are going to investigate how the resistance of a metal wire depends upon its length. The circuit shown in Fig. 3.1 has been set up for you. V sliding contact resistance wire metre rule l C P Q 0 cm 100 cm power supply A Fig. 3.1 (a) (i) • Connect the crocodile clip C to the resistance wire PQ at a length l = 20.0 cm from end P. • Close the switch. • Record in Table 3.1 the current I flowing through the wire and the potential difference V. • Switch off the circuit. [1] Table 3.1 potential difference length l / cm current I / A resistance R / Ω V / V 20.0 35.0 50.0 65.0 80.0 95.0 (ii) Repeat the steps in (a)(i) for values of l = 35.0 cm, 50.0 cm, 65.0 cm, 80.0 cm and 95.0 cm. [3] (iii) Calculate the resistance R for each length of wire, using the equation V R = . I Record, in Table 3.1, your values of R. [1] (b) Use the results in Table 3.1 to plot a graph of R(vertical axis) against l. Start both axes of your graph at the origin (0, 0). Draw the best-fit straight line. [3] R / Ω l / cm (c) (i) Extend your line to predict the value of R at length l = 110.0 cm. R = .......................................................Ω [1] (ii) Suggest the relationship between the length of the wire and its resistance. relationship ........................................................................................................................ .......................................................................................................................................[1] NOTES FOR USE IN QUALITATIVE ANALYSIS Tests for anions anion test test result carbonate (CO32–) add dilute acid effervescence, carbon dioxide produced chloride (Cl –) acidify with dilute nitric acid, then white ppt. [in solution] add aqueous silver nitrate nitrate (NO3–) add aqueous sodium hydroxide, ammonia produced [in solution] then aluminium foil; warm carefully sulfate (SO42–) acidify with dilute nitric acid, then white ppt. [in solution] add aqueous barium nitrate Tests for aqueous cations cation effect of aqueous sodium hydroxide effect of aqueous ammonia ammonium (NH4+) ammonia produced on warming – copper(II) (Cu2+) light blue ppt., insoluble in excess light blue ppt., soluble in excess, giving a dark blue solution iron(II) (Fe2+) green ppt., insoluble in excess green ppt., insoluble in excess iron(III) (Fe3+) red-brown ppt., insoluble in excess red-brown ppt., insoluble in excess zinc (Zn2+) white ppt., soluble in excess giving white ppt., soluble in excess giving a colourless solution a colourless solution Tests for gases gas test and test result ammonia (NH3) turns damp red litmus paper blue carbon dioxide (CO2) turns limewater milky chlorine (Cl 2) bleaches damp litmus paper hydrogen (H2) ‘pops’ with a lighted splint oxygen (O2) relights a glowing splint
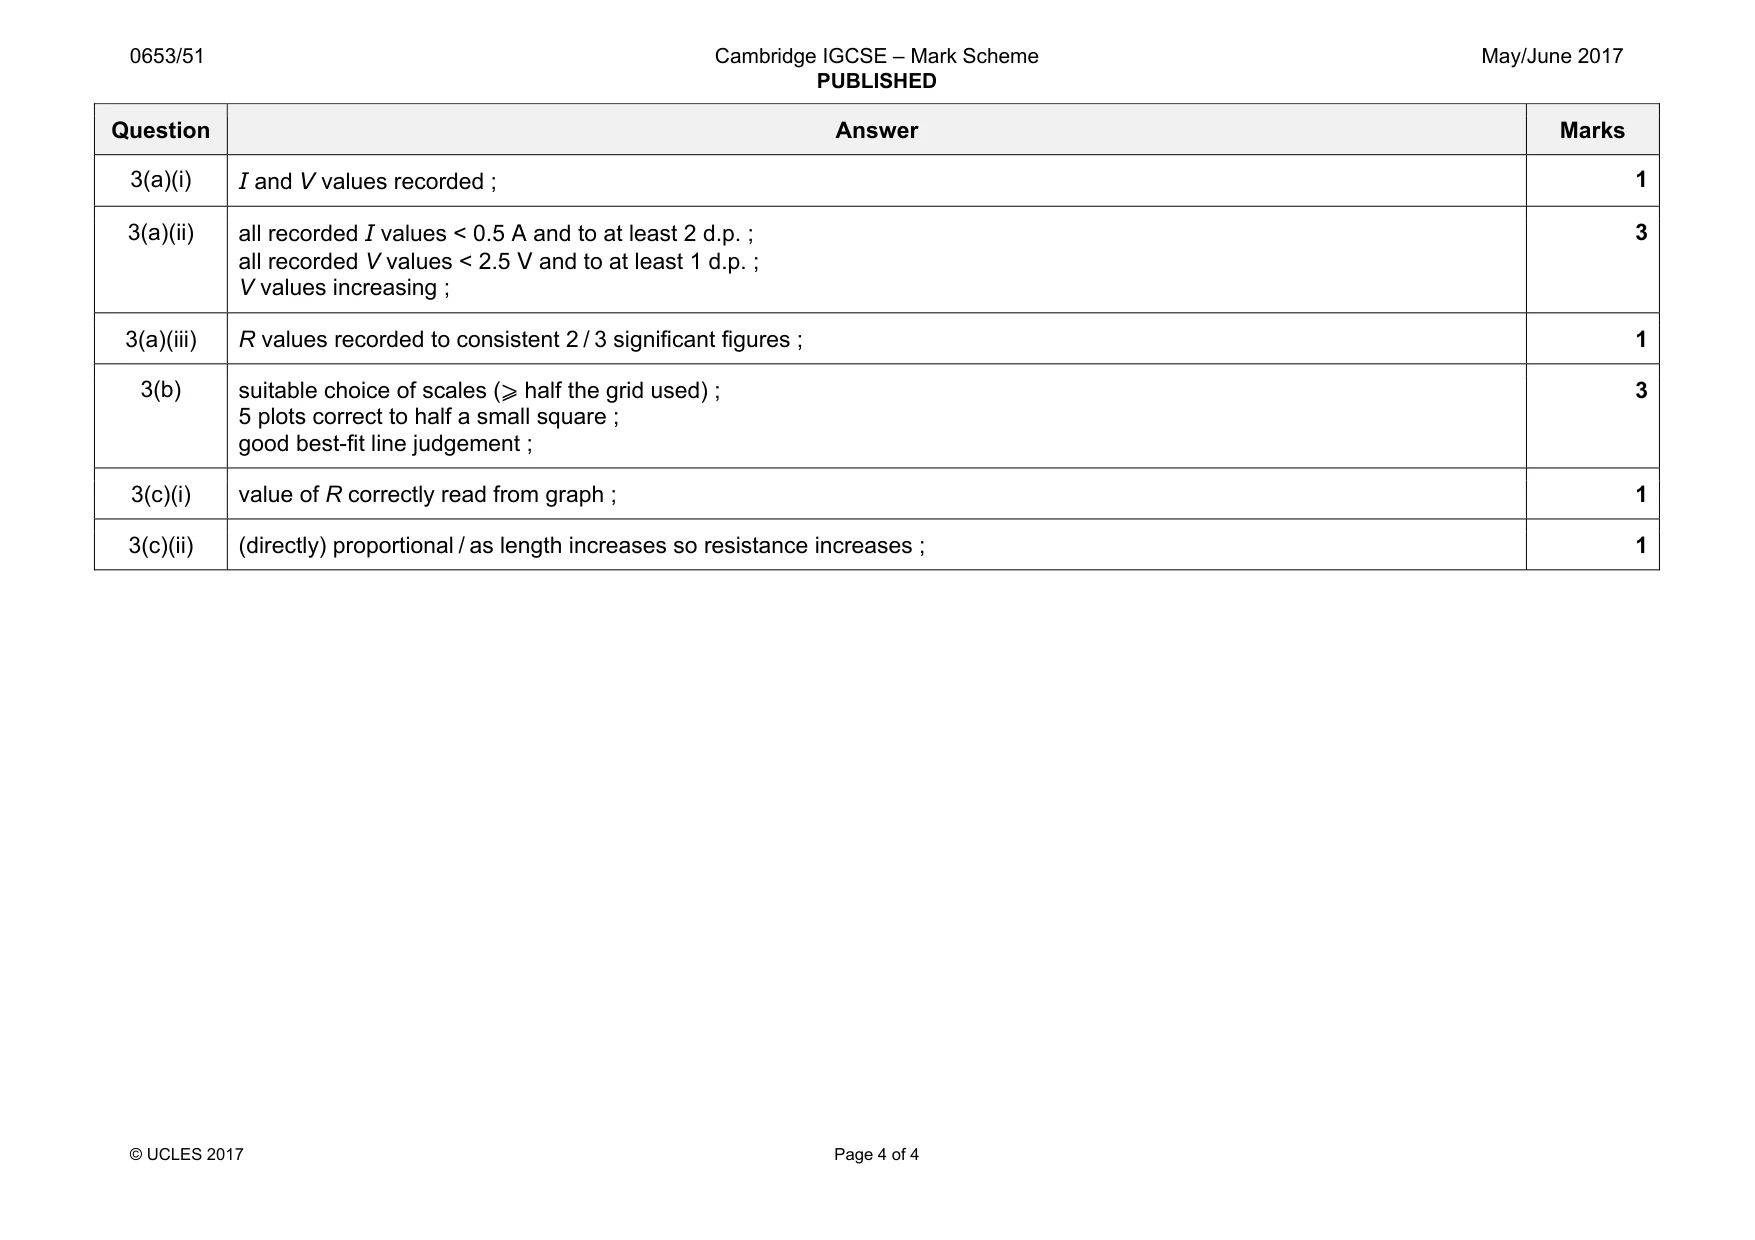
Mark scheme: 3(a)(i) 1 3(a)(ii) all recorded I values < 0.5 A and to at least 2 d.p. ; all recorded V values < 2.5 V and to at least 1 d.p. ; V values increasing ; 3 3(a)(iii) R values recorded to consistent 2 / 3 significant figures ; 1 3(b) suitable choice of scales (⩾ half the grid used) ; 5 plots correct to half a small square ; good best-fit line judgement ; 3 3(c)(i) value of R correctly read from graph ; 1 3(c)(ii) (directly) proportional / as length increases so resistance increases ; 1
What was in this paper
The subtopics covered by these 3 questions, and how many questions each got. Open one in a new tab to see every Cambridge question on it.
What you needed in this session
Cambridge’s own grade thresholds for 2017 May/June, Paper 5 · Variant 1. A higher threshold means an easier paper — the bar moves with how the cohort did.