Cambridge IGCSE Science - Combined 0653 — 2017 Feb/March Paper 6 · Variant 2
0653/62/F/M/17 · 6 questions · 60 marks · ≈68 min
The question paper and its mark scheme, free to read here and free to download. This is Cambridge’s own paper, exactly as it was sat.
Question paper20 pages


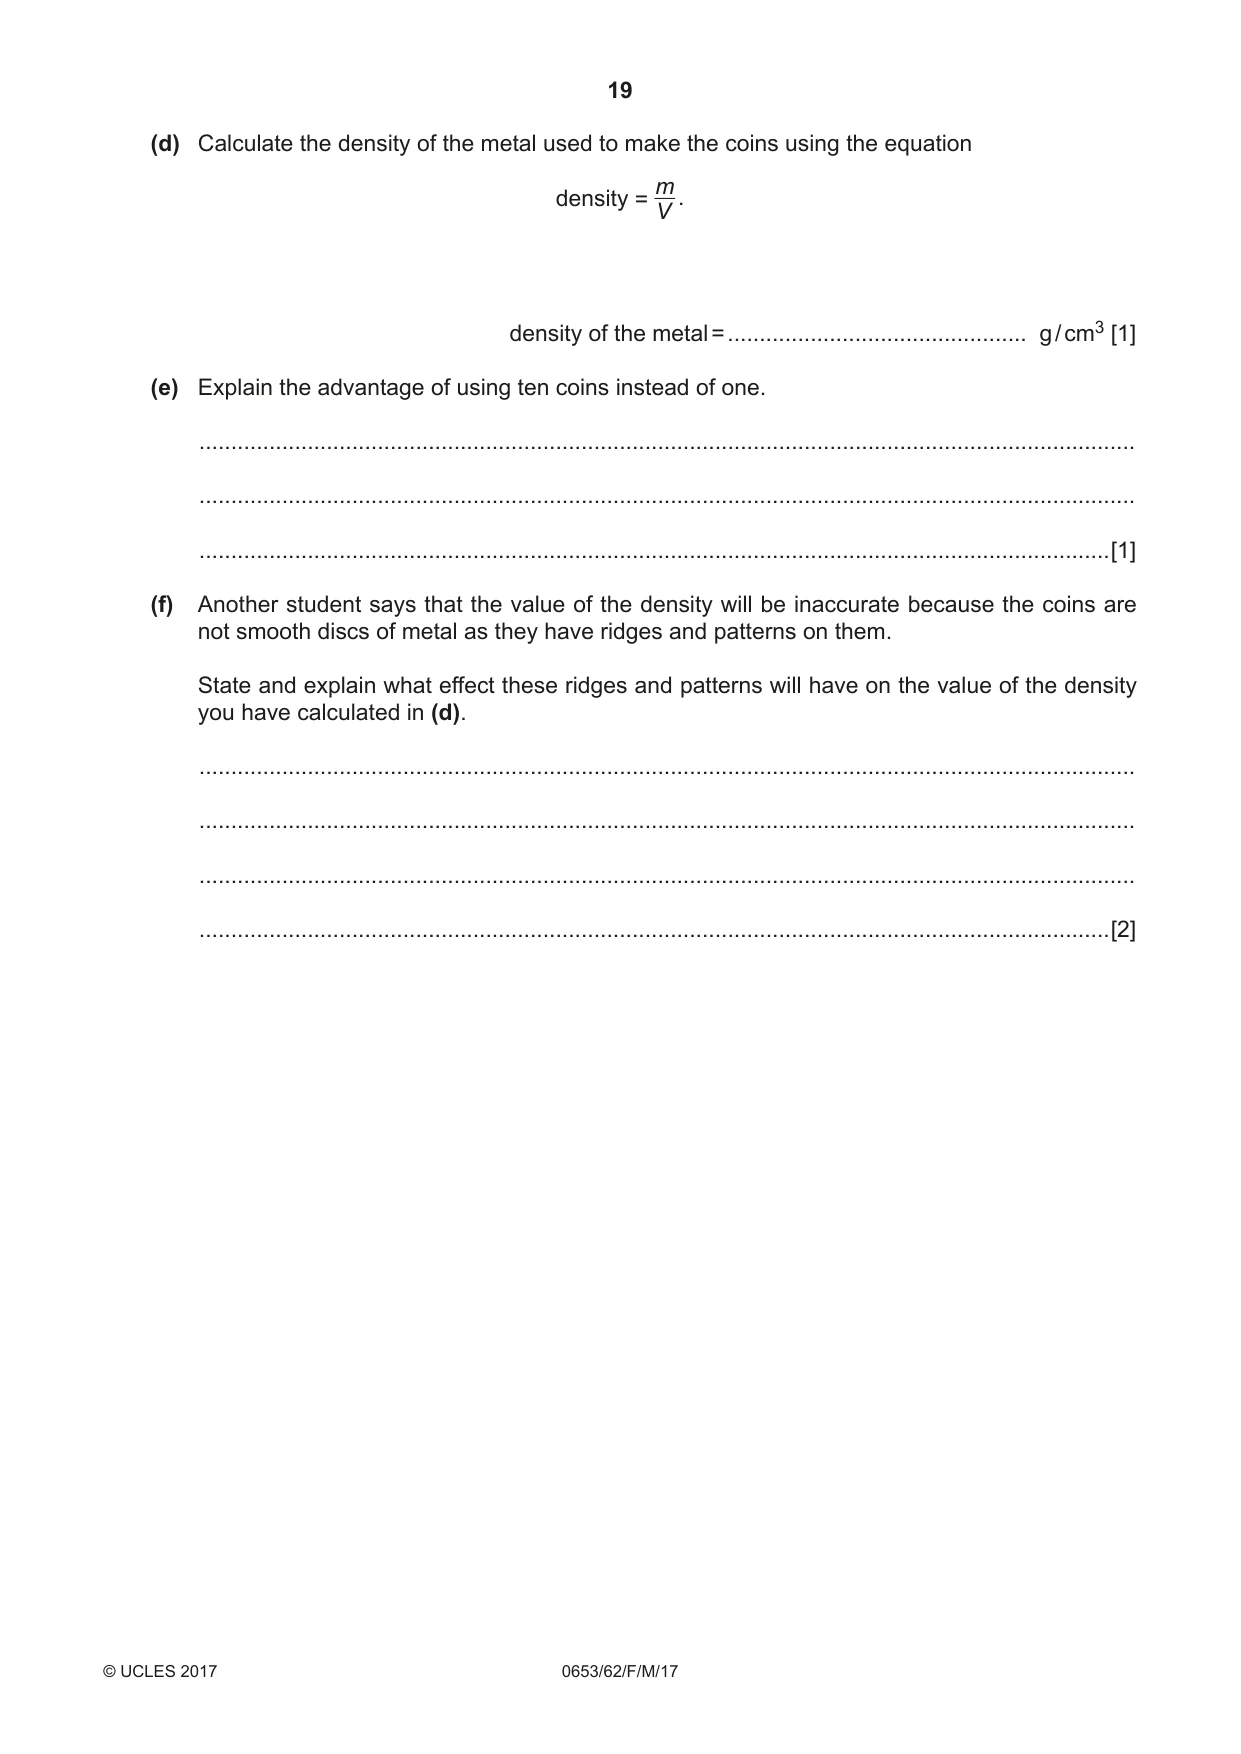
Mark scheme7 pages
Answers below. Sit the paper first if you are practising.
Questions as text
Q1 · A student investigates the nutrient content of two solutions, A and B
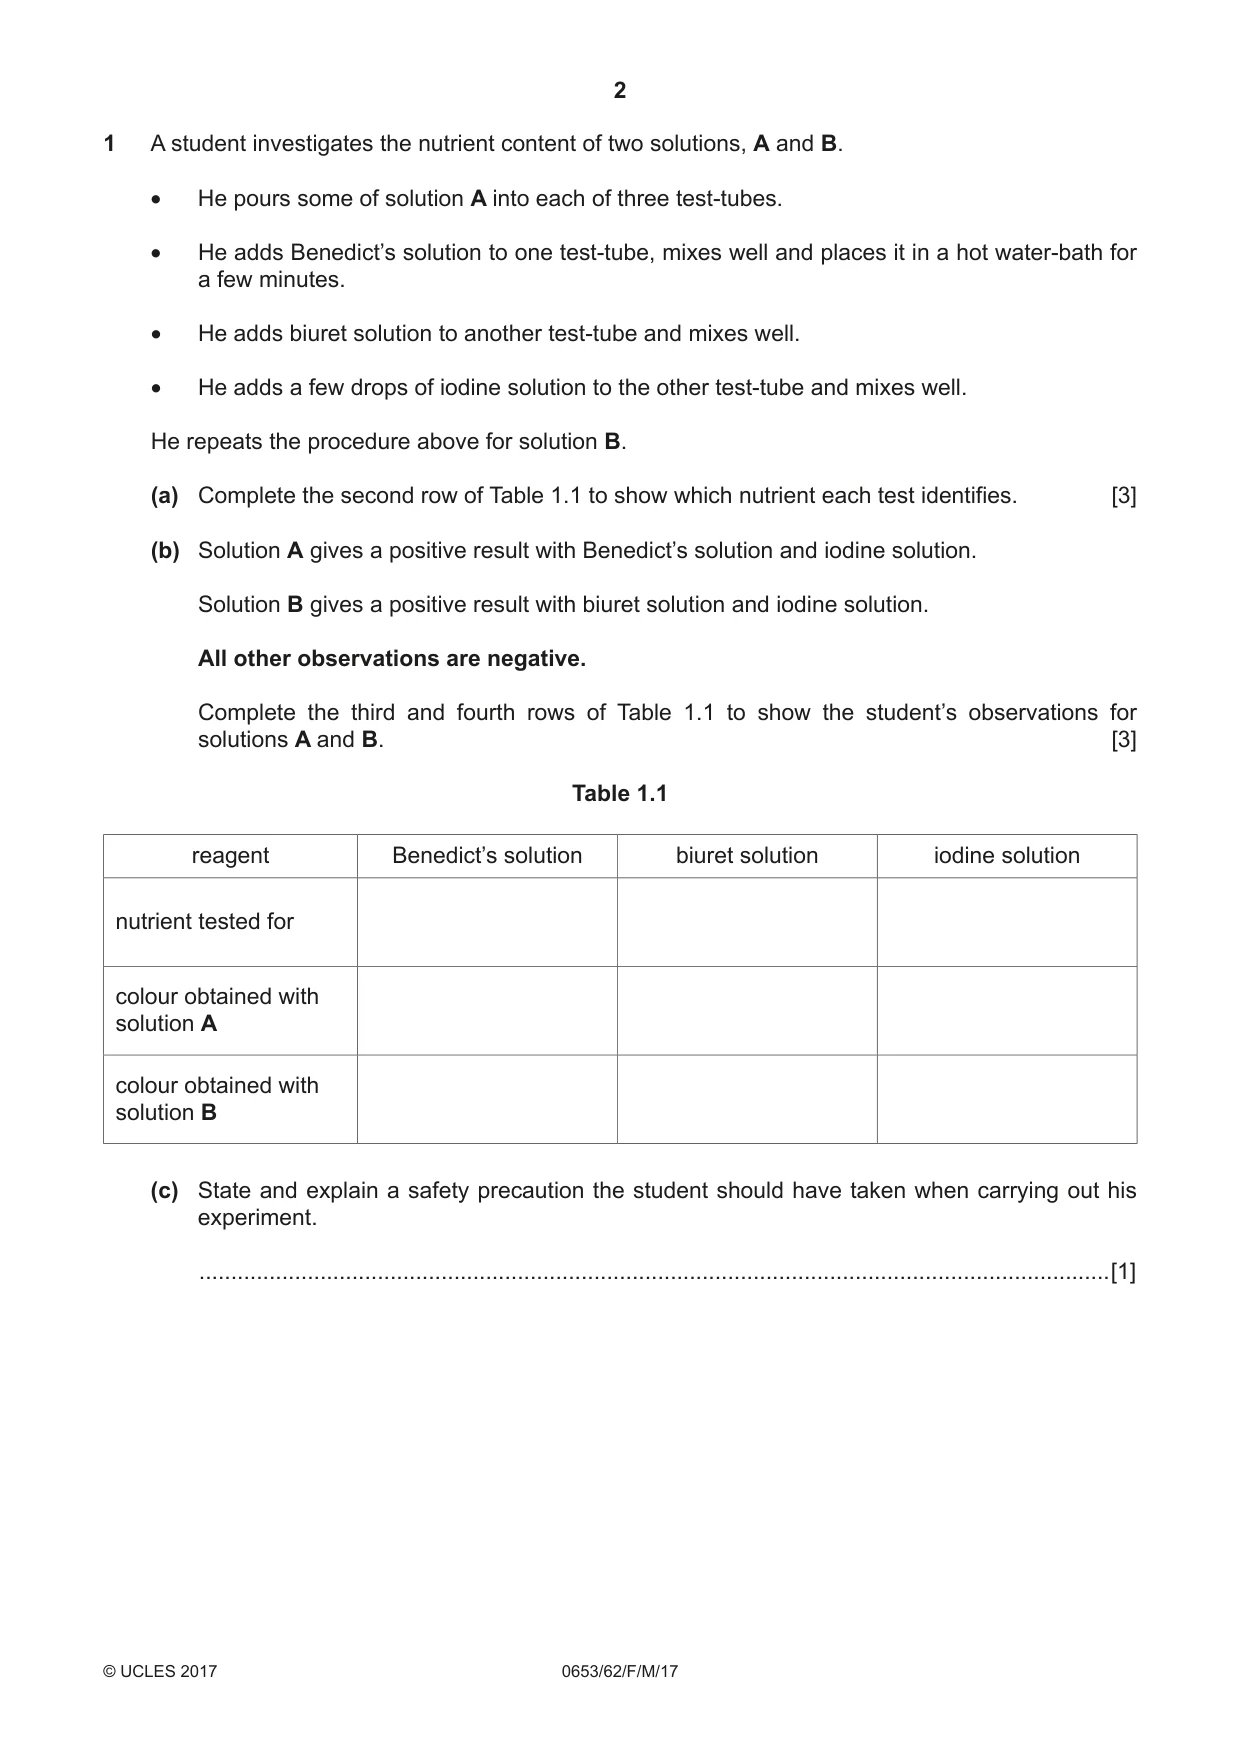
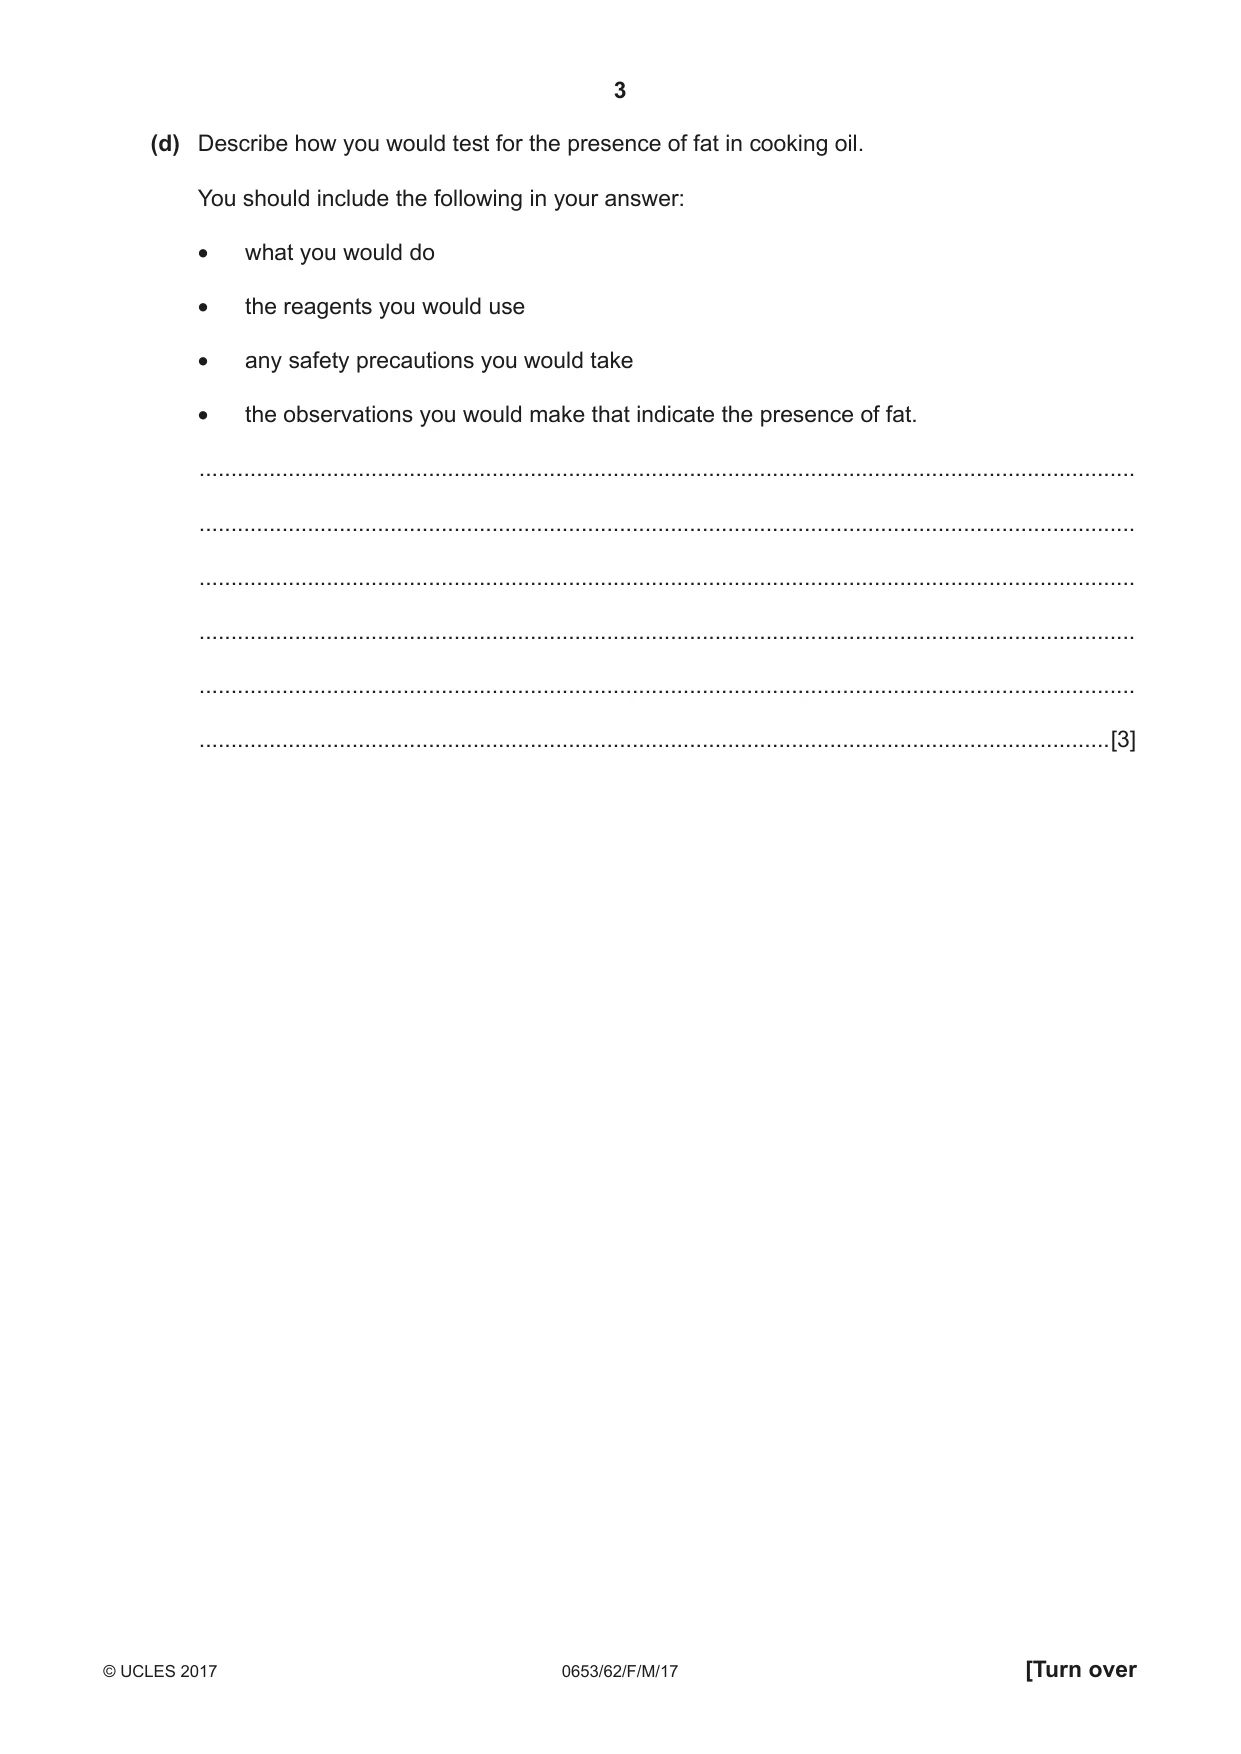
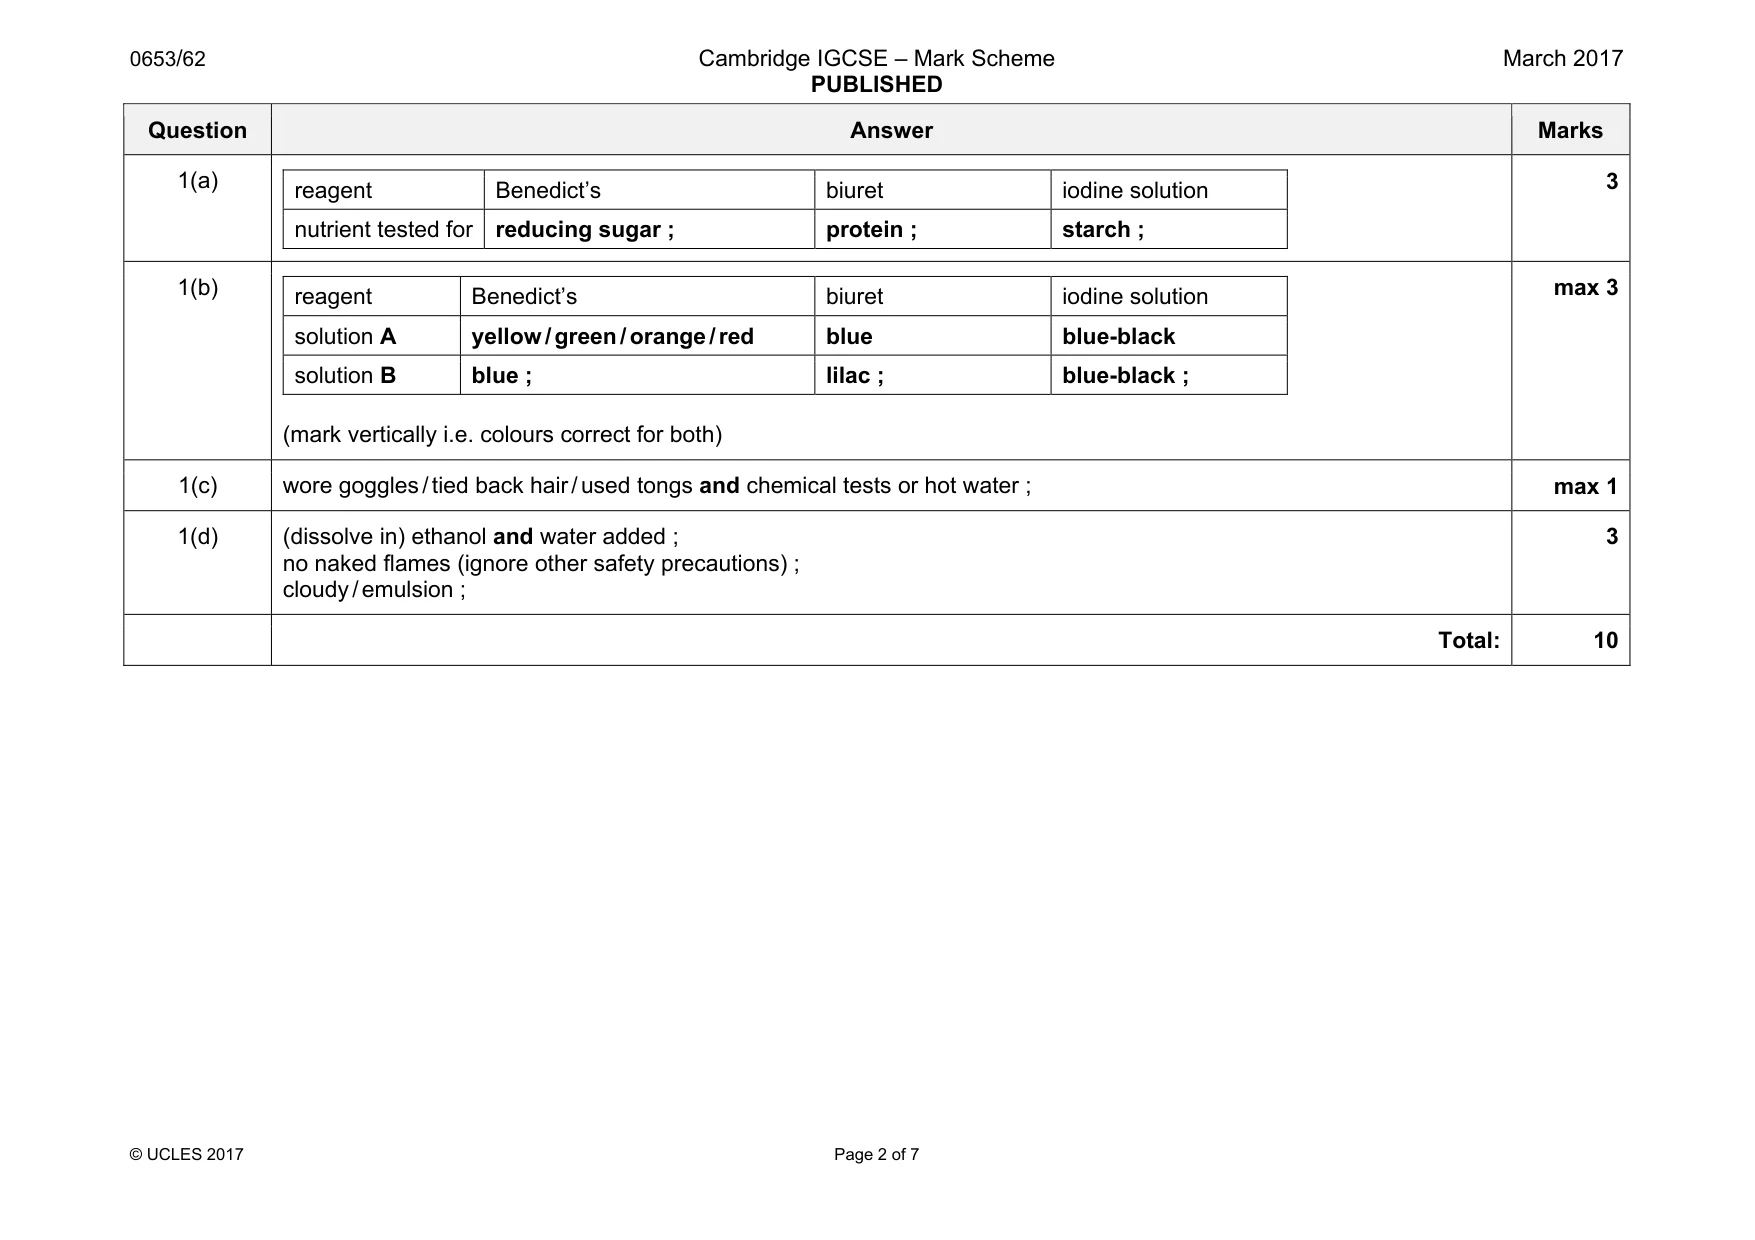
1 A student investigates the nutrient content of two solutions, A and B. • He pours some of solution A into each of three test-tubes. • He adds Benedict’s solution to one test-tube, mixes well and places it in a hot water-bath for a few minutes. • He adds biuret solution to another test-tube and mixes well. • He adds a few drops of iodine solution to the other test-tube and mixes well. He repeats the procedure above for solution B. (a) Complete the second row of Table 1.1 to show which nutrient each test identifies. [3] (b) Solution A gives a positive result with Benedict’s solution and iodine solution. Solution B gives a positive result with biuret solution and iodine solution. All other observations are negative. Complete the third and fourth rows of Table 1.1 to show the student’s observations for solutions A and B. [3] Table 1.1 reagent Benedict’s solution biuret solution iodine solution nutrient tested for colour obtained with solution A colour obtained with solution B (c) State and explain a safety precaution the student should have taken when carrying out his experiment. ...............................................................................................................................................[1] (d) Describe how you would test for the presence of fat in cooking oil. You should include the following in your answer: • what you would do • the reagents you would use • any safety precautions you would take • the observations you would make that indicate the presence of fat. ................................................................................................................................................... ................................................................................................................................................... ................................................................................................................................................... ................................................................................................................................................... ................................................................................................................................................... ...............................................................................................................................................[3]
Mark scheme: 1(a) reagent Benedict’s biuret iodine solution nutrient tested for reducing sugar ; protein ; starch ; 3 1(b) reagent Benedict’s biuret iodine solution solution A yellow / green / orange / red blue blue-black solution B blue ; lilac ; blue-black ; (mark vertically i.e. colours correct for both) max 3 1(c) wore goggles / tied back hair / used tongs and chemical tests or hot water ; max 1 1(d) (dissolve in) ethanol and water added ; no naked flames (ignore other safety precautions) ; cloudy / emulsion ; 3 Total: 10
Q2 · Solid H is a mixture of a black metal oxide and a white salt
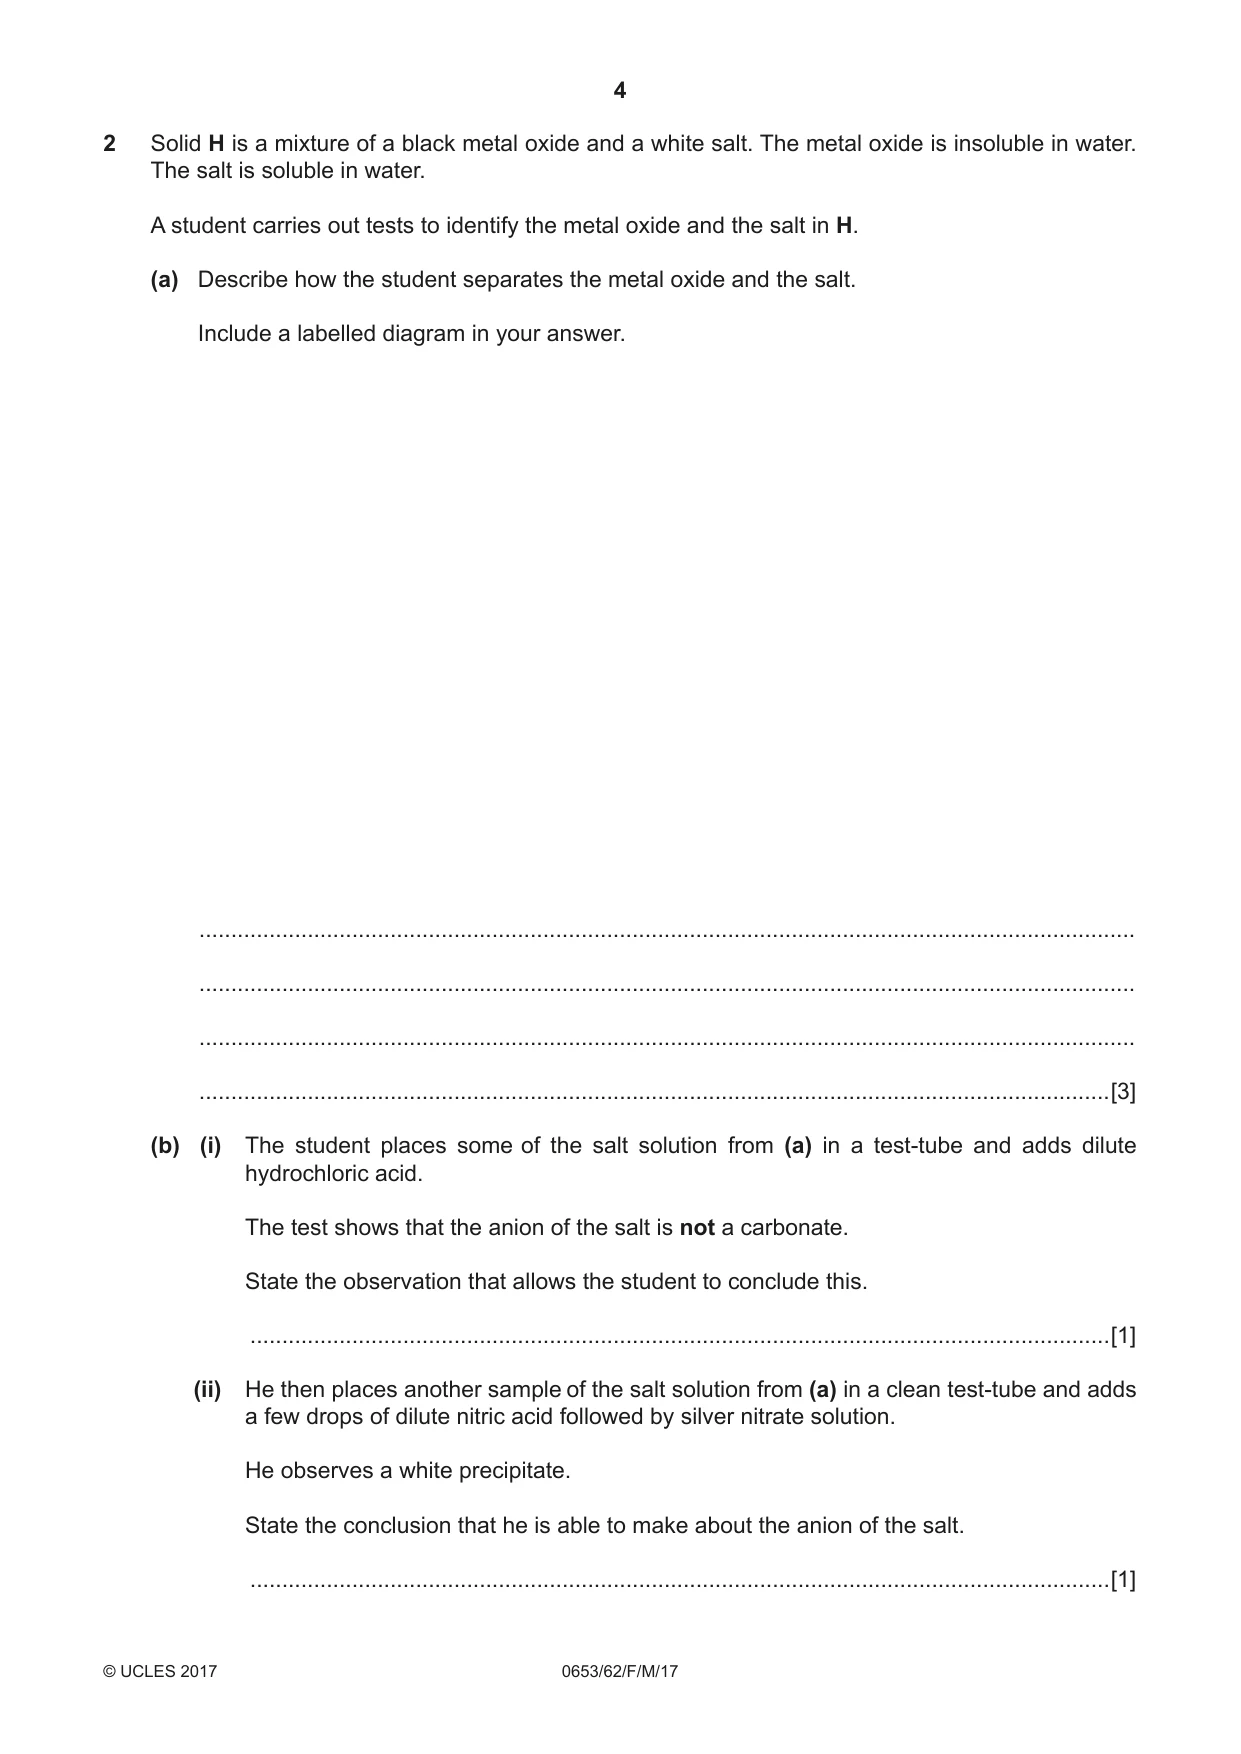
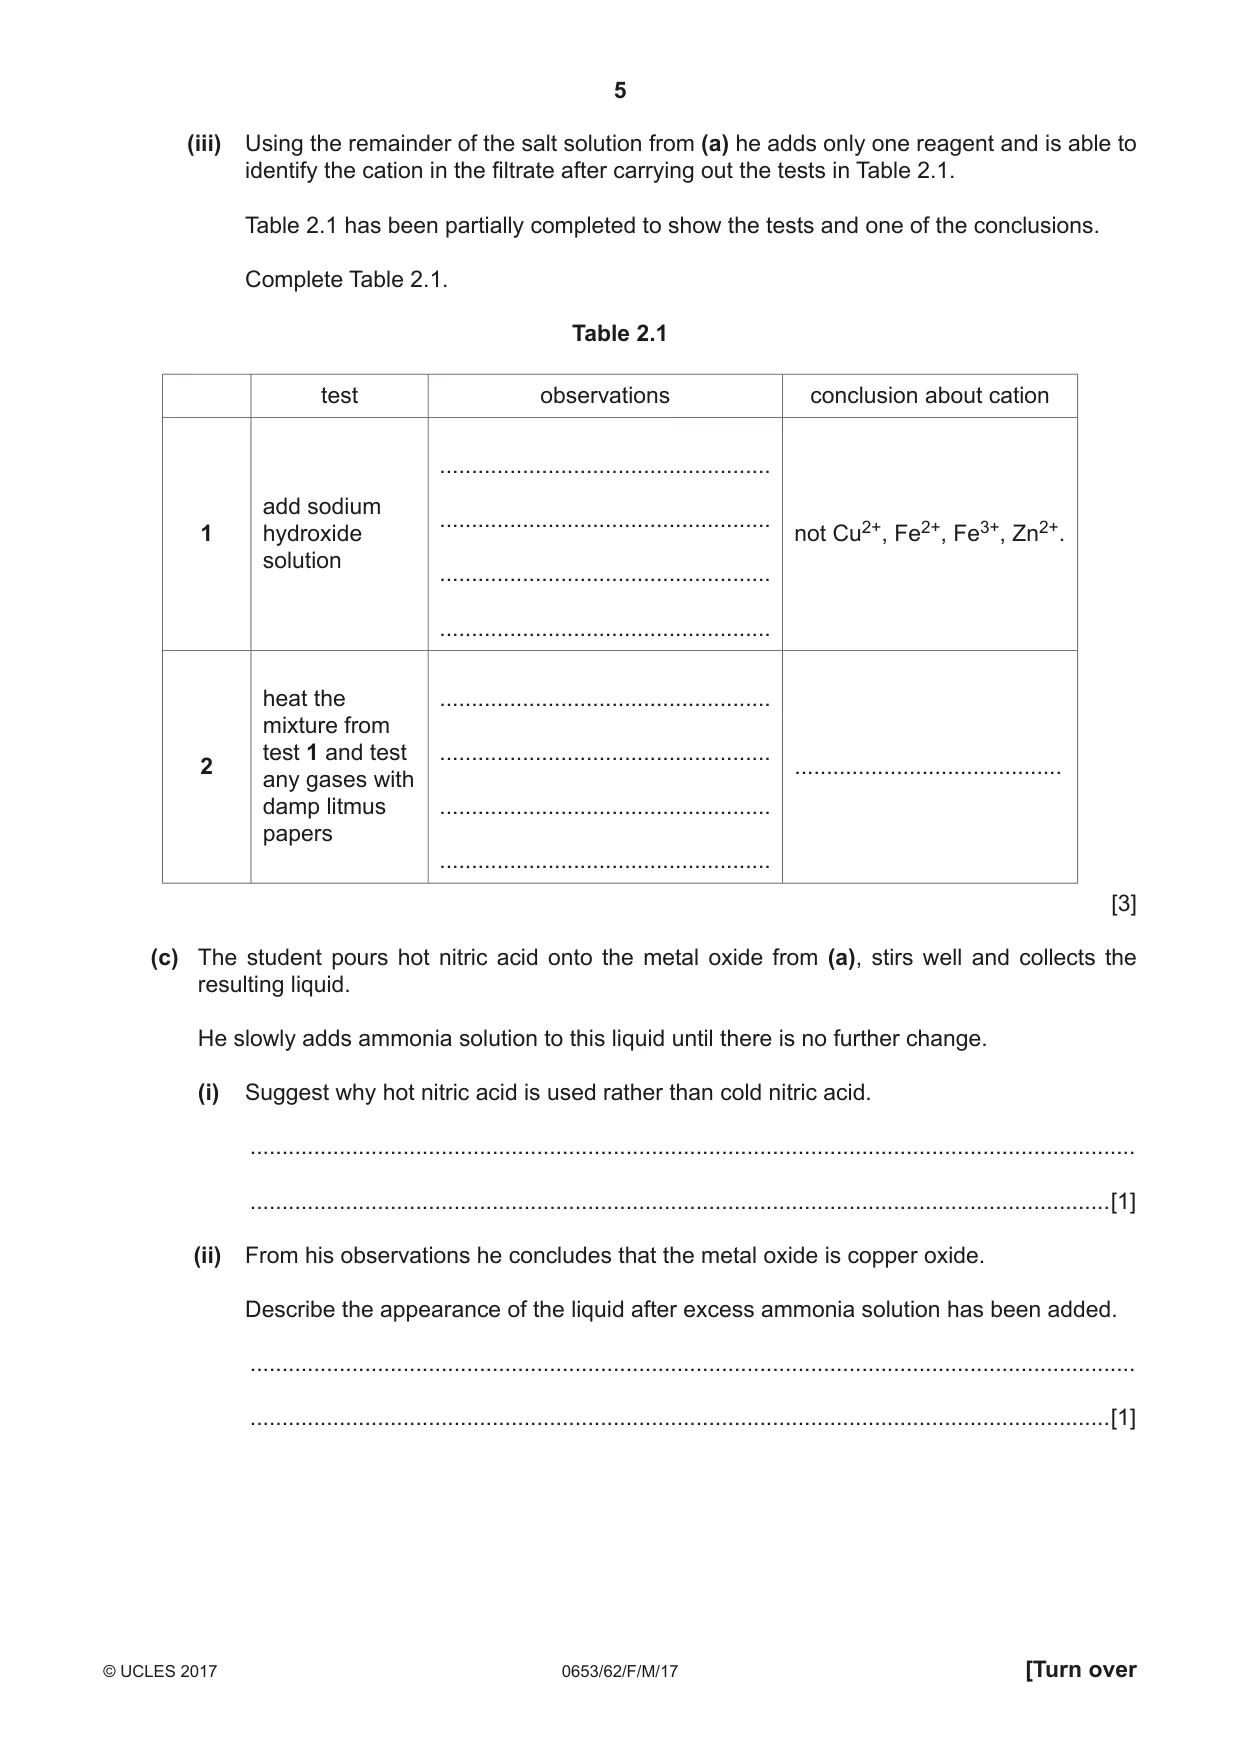
2 Solid H is a mixture of a black metal oxide and a white salt. The metal oxide is insoluble in water. The salt is soluble in water. A student carries out tests to identify the metal oxide and the salt in H. (a) Describe how the student separates the metal oxide and the salt. Include a labelled diagram in your answer. ................................................................................................................................................... ................................................................................................................................................... ................................................................................................................................................... ...............................................................................................................................................[3] (b) (i) The student places some of the salt solution from (a) in a test-tube and adds dilute hydrochloric acid. The test shows that the anion of the salt is not a carbonate. State the observation that allows the student to conclude this. .......................................................................................................................................[1] (ii) He then places another sample of the salt solution from (a) in a clean test-tube and adds a few drops of dilute nitric acid followed by silver nitrate solution. He observes a white precipitate. State the conclusion that he is able to make about the anion of the salt. .......................................................................................................................................[1] (iii) Using the remainder of the salt solution from (a) he adds only one reagent and is able to identify the cation in the filtrate after carrying out the tests in Table 2.1. Table 2.1 has been partially completed to show the tests and one of the conclusions. Complete Table 2.1. Table 2.1 test observations conclusion about cation .................................................... add sodium .................................................... 1 hydroxide not Cu2+, Fe2+, Fe3+, Zn2+. solution .................................................... .................................................... heat the .................................................... mixture from test 1 and test .................................................... 2 .......................................... any gases with damp litmus .................................................... papers .................................................... [3] (c) The student pours hot nitric acid onto the metal oxide from (a), stirs well and collects the resulting liquid. He slowly adds ammonia solution to this liquid until there is no further change. (i) Suggest why hot nitric acid is used rather than cold nitric acid. ........................................................................................................................................... .......................................................................................................................................[1] (ii) From his observations he concludes that the metal oxide is copper oxide. Describe the appearance of the liquid after excess ammonia solution has been added. ........................................................................................................................................... .......................................................................................................................................[1]
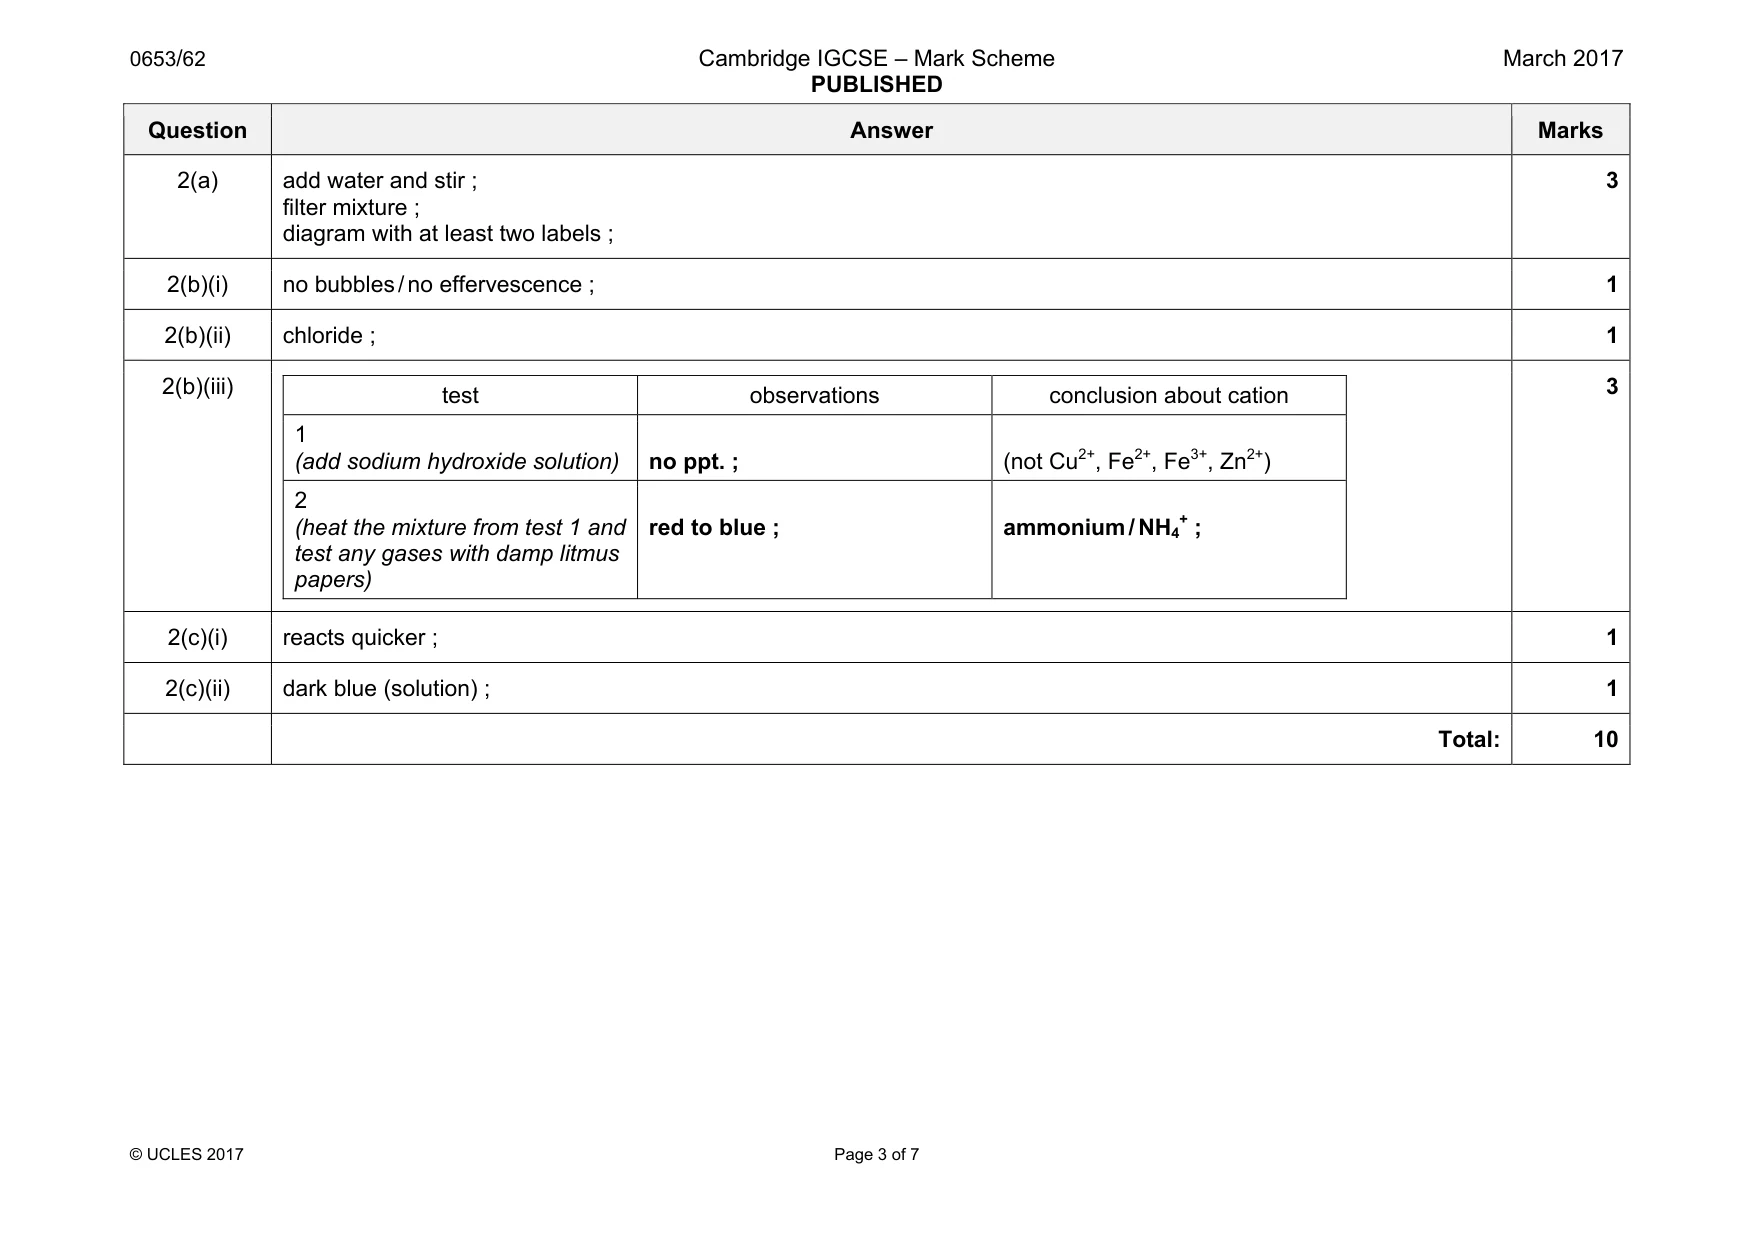
Mark scheme: 2(a) add water and stir ; filter mixture ; diagram with at least two labels ; 3 2(b)(i) no bubbles / no effervescence ; 1 2(b)(ii) chloride ; 1 2(b)(iii) test observations conclusion about cation 1 (add sodium hydroxide solution) no ppt. ; (not Cu2+, Fe2+, Fe3+, Zn2+) 2 (heat the mixture from test 1 and test any gases with damp litmus papers) red to blue ; ammonium / NH4 + ; 3 2(c)(i) reacts quicker ; 1 2(c)(ii) dark blue (solution) ; 1 Total: 10
Q3 · A student investigates the resistance of lamps connected in series and in parallel
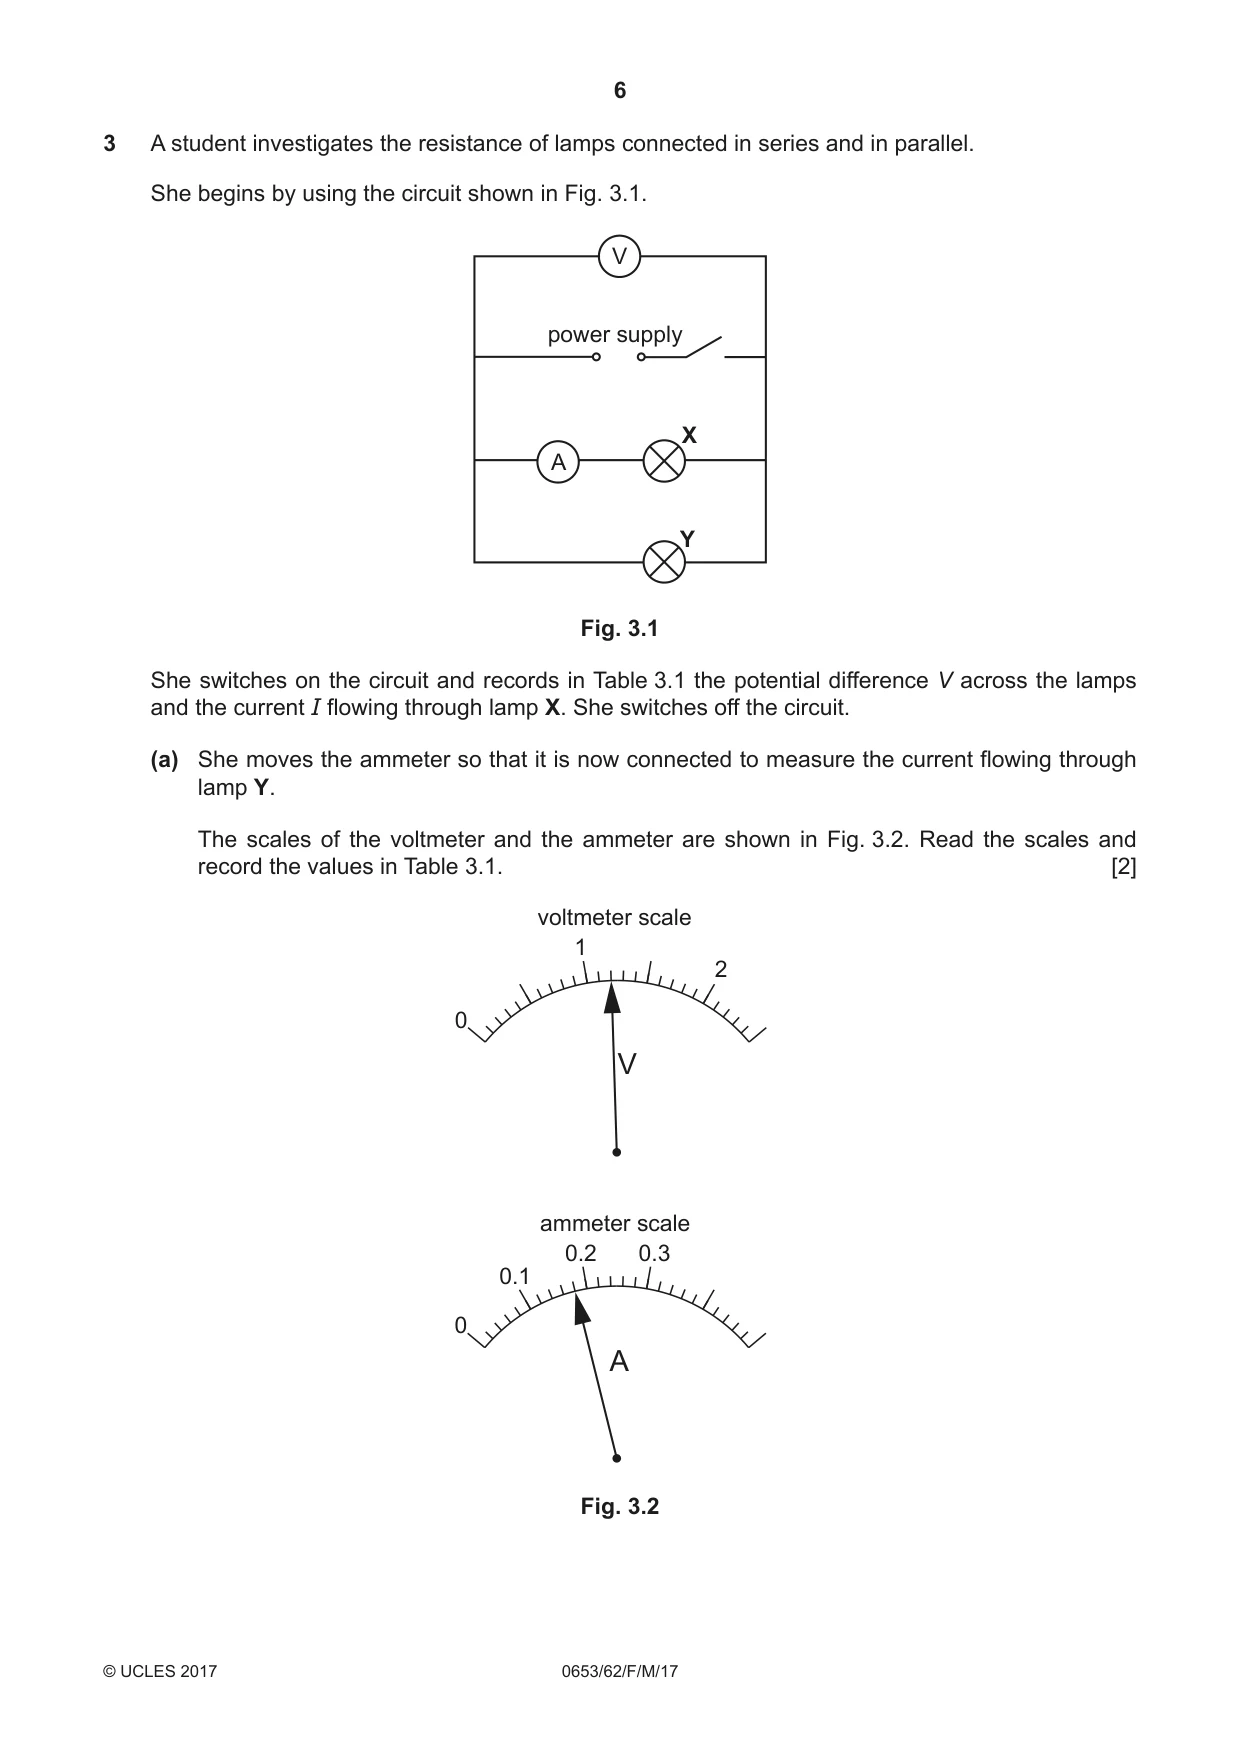
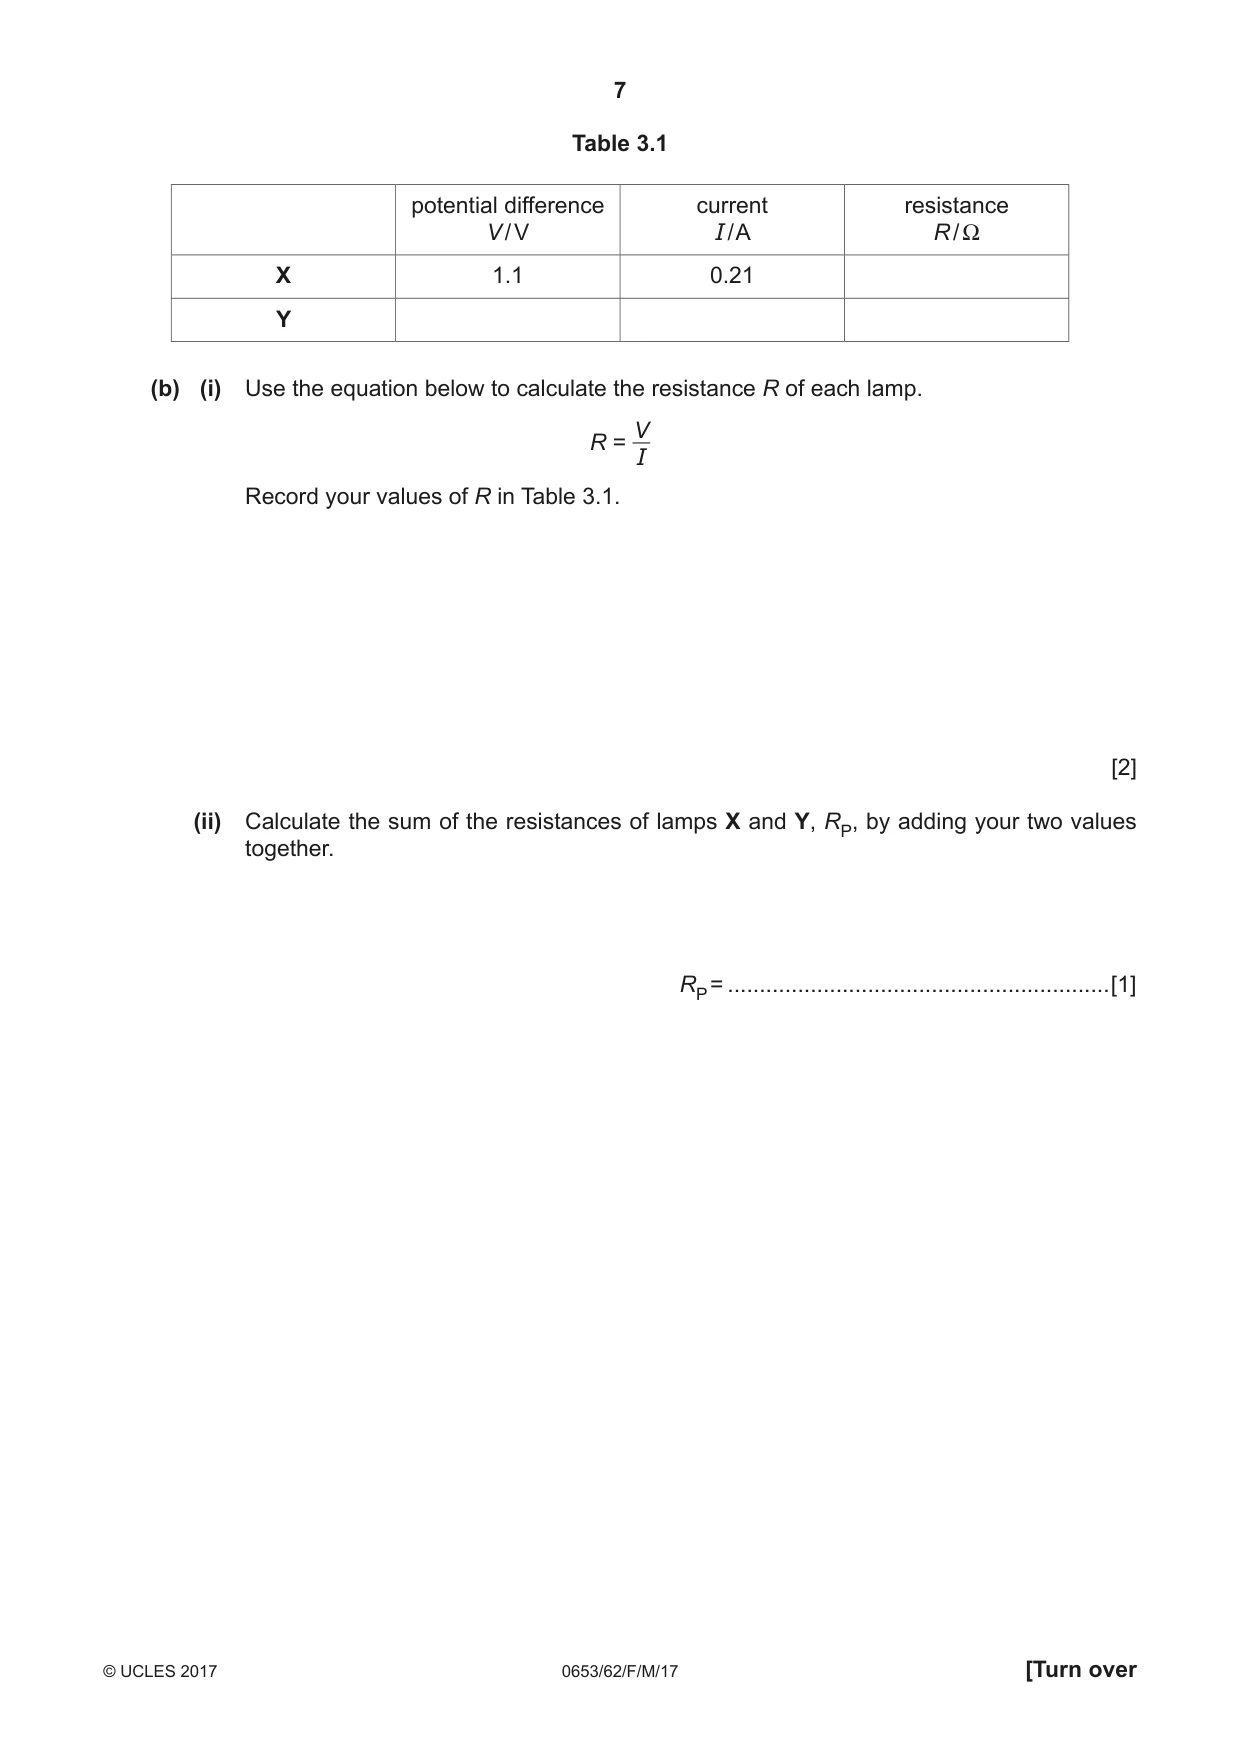
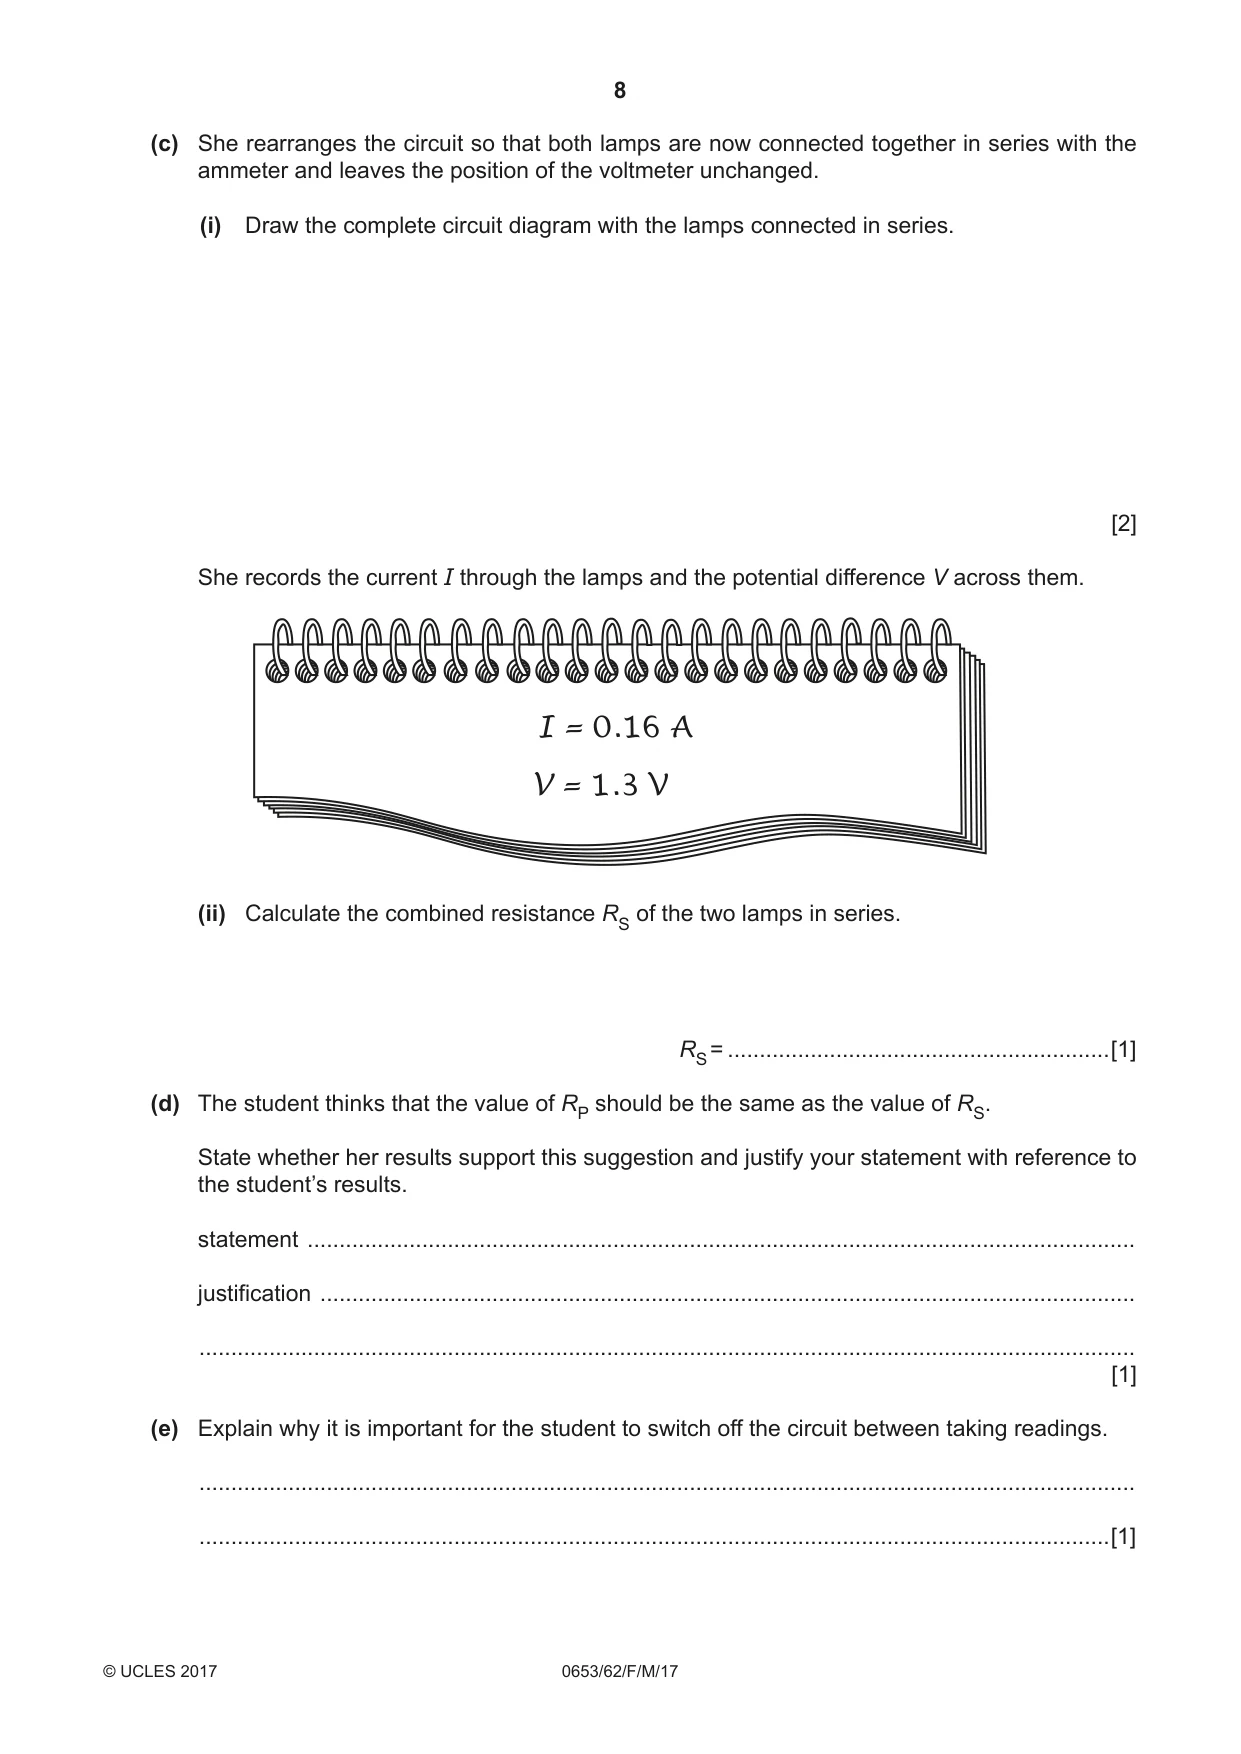
3 A student investigates the resistance of lamps connected in series and in parallel. She begins by using the circuit shown in Fig. 3.1. V power supply X A Y Fig. 3.1 She switches on the circuit and records in Table 3.1 the potential difference V across the lamps and the current I flowing through lamp X. She switches off the circuit. (a) She moves the ammeter so that it is now connected to measure the current flowing through lamp Y. The scales of the voltmeter and the ammeter are shown in Fig. 3.2. Read the scales and record the values in Table 3.1. [2] voltmeter scale 1 2 0 V ammeter scale 0.2 0.3 0.1 0 A Fig. 3.2 Table 3.1 potential difference current resistance V / V I / A R / Ω X 1.1 0.21 Y (b) (i) Use the equation below to calculate the resistance R of each lamp. V R = I Record your values of R in Table 3.1. [2] (ii) Calculate the sum of the resistances of lamps X and Y, RP, by adding your two values together. RP = ............................................................[1] (c) She rearranges the circuit so that both lamps are now connected together in series with the ammeter and leaves the position of the voltmeter unchanged. (i) Draw the complete circuit diagram with the lamps connected in series. [2] She records the current I through the lamps and the potential difference V across them. I = 0.16 A V = 1.3 V (ii) Calculate the combined resistance RS of the two lamps in series. RS = ............................................................[1] (d) The student thinks that the value of RP should be the same as the value of RS. State whether her results support this suggestion and justify your statement with reference to the student’s results. statement .................................................................................................................................. justification ................................................................................................................................ ................................................................................................................................................... [1] (e) Explain why it is important for the student to switch off the circuit between taking readings. ................................................................................................................................................... ...............................................................................................................................................[1] Please turn over for Question 4.
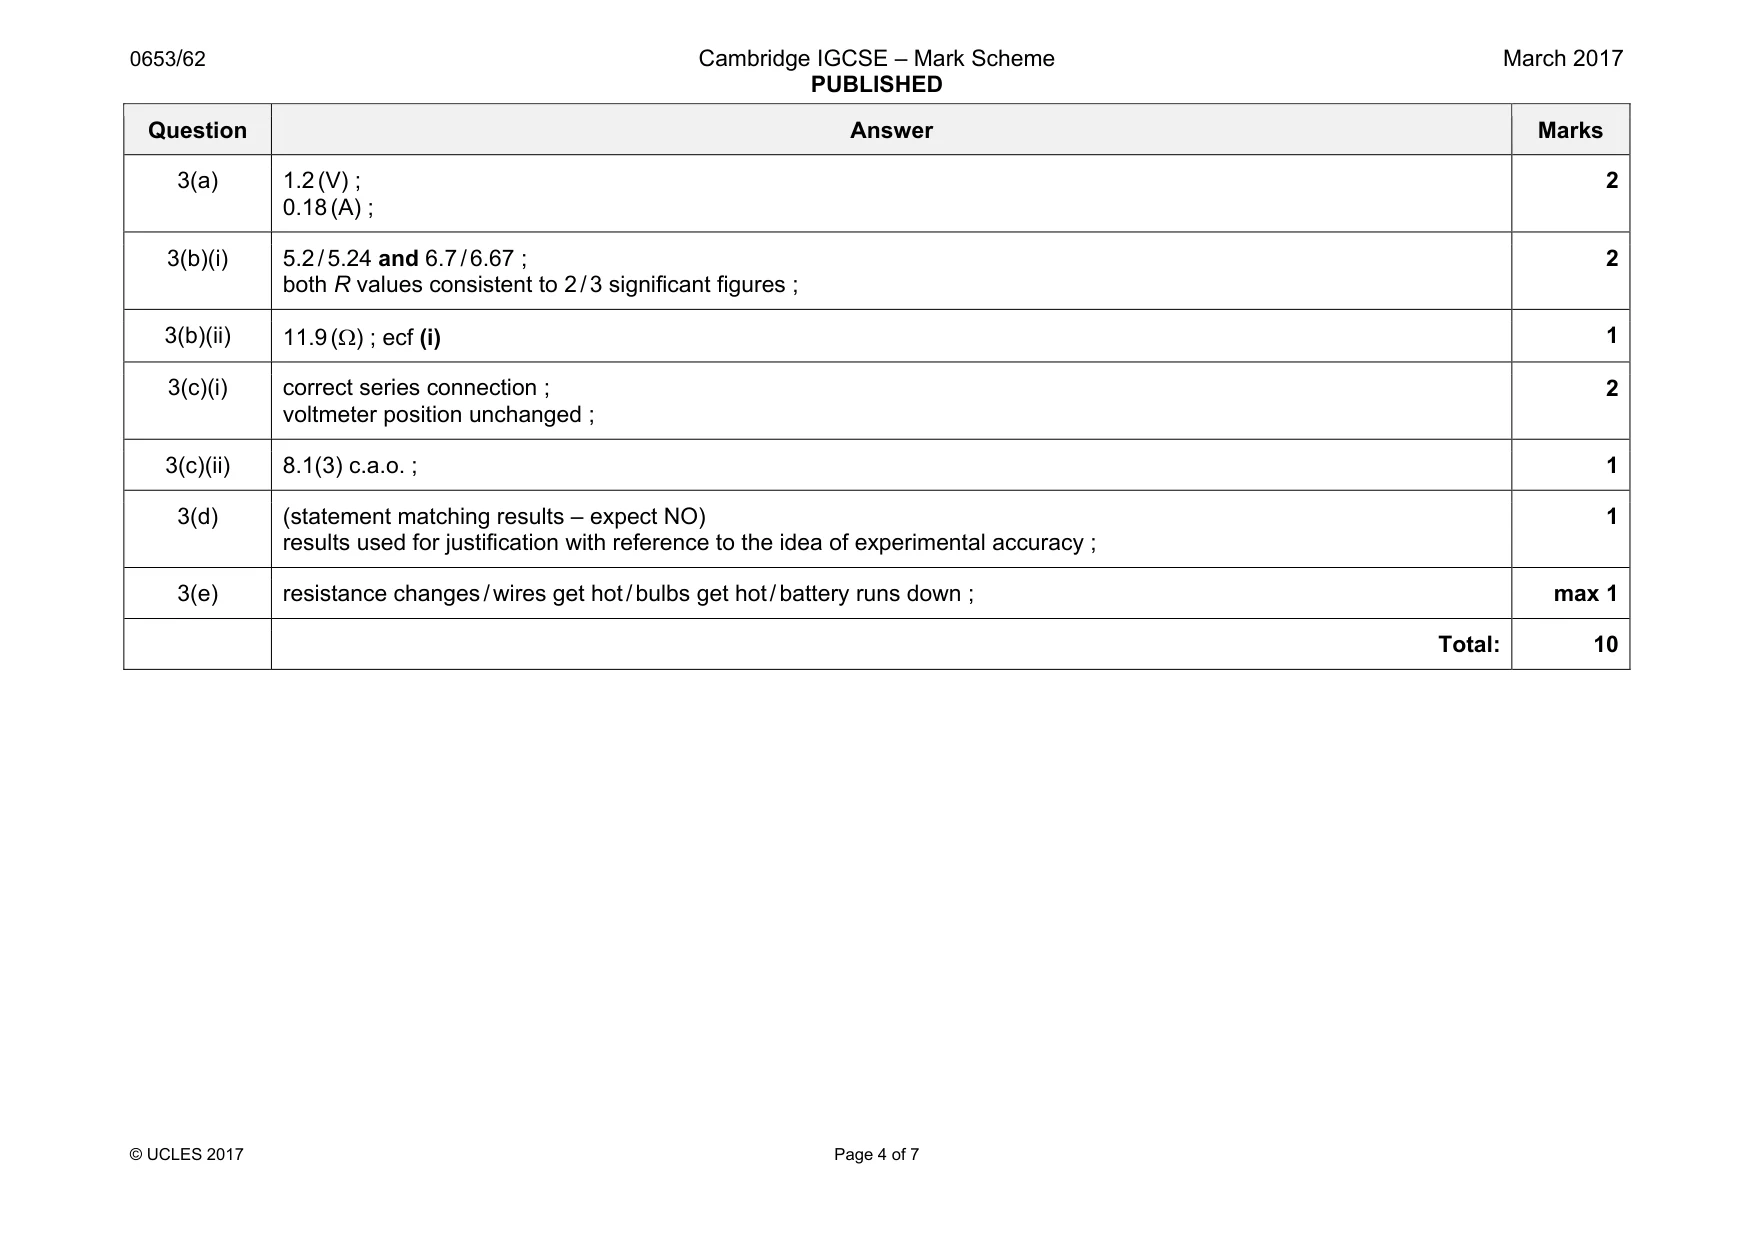
Mark scheme: 3(a) 1.2 (V) ; 0.18 (A) ; 2 3(b)(i) 5.2 / 5.24 and 6.7 / 6.67 ; both R values consistent to 2 / 3 significant figures ; 2 3(b)(ii) 11.9 (Ω) ; ecf (i) 1 3(c)(i) correct series connection ; voltmeter position unchanged ; 2 3(c)(ii) 8.1(3) c.a.o. ; 1 3(d) (statement matching results – expect NO) results used for justification with reference to the idea of experimental accuracy ; 1 3(e) resistance changes / wires get hot / bulbs get hot / battery runs down ; max 1 Total: 10
Q4 · A student investigates the effect of exercise on pulse rate
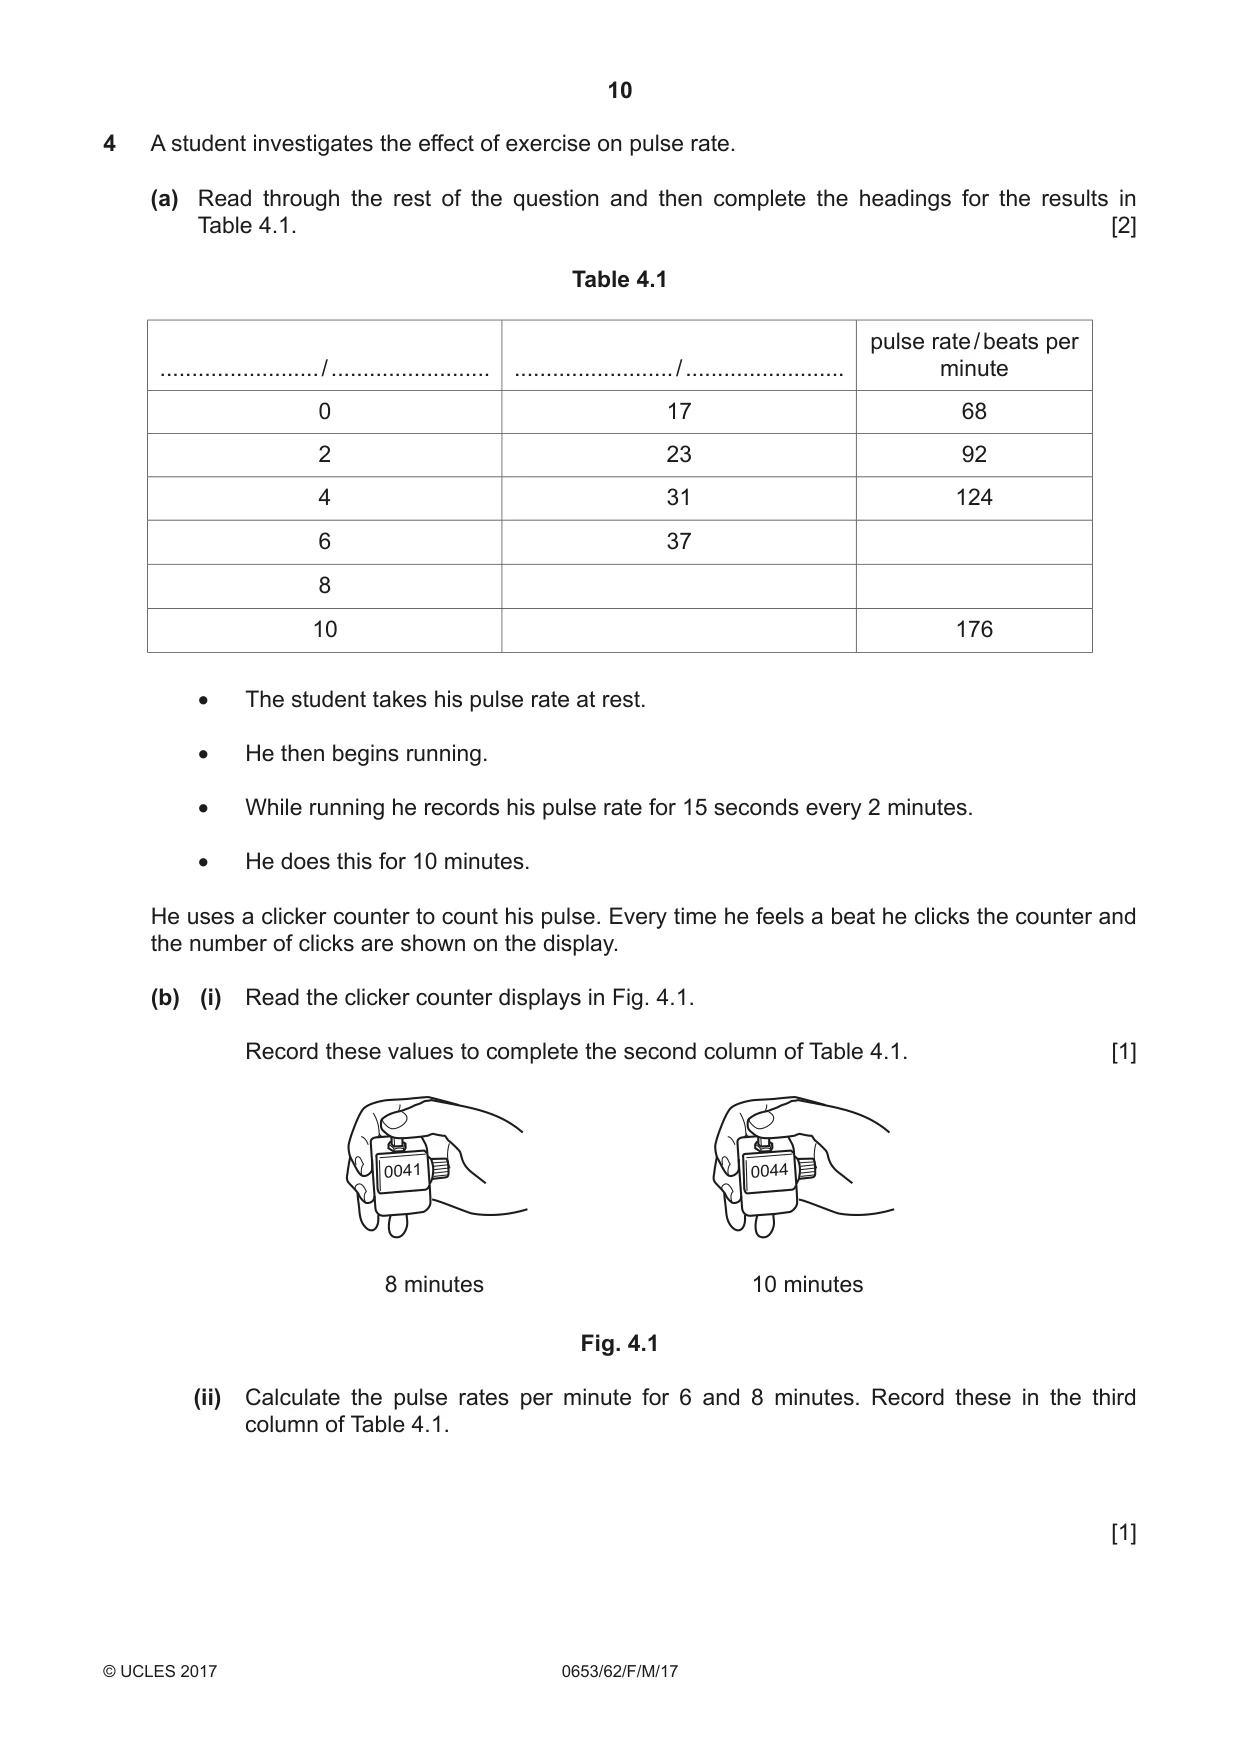
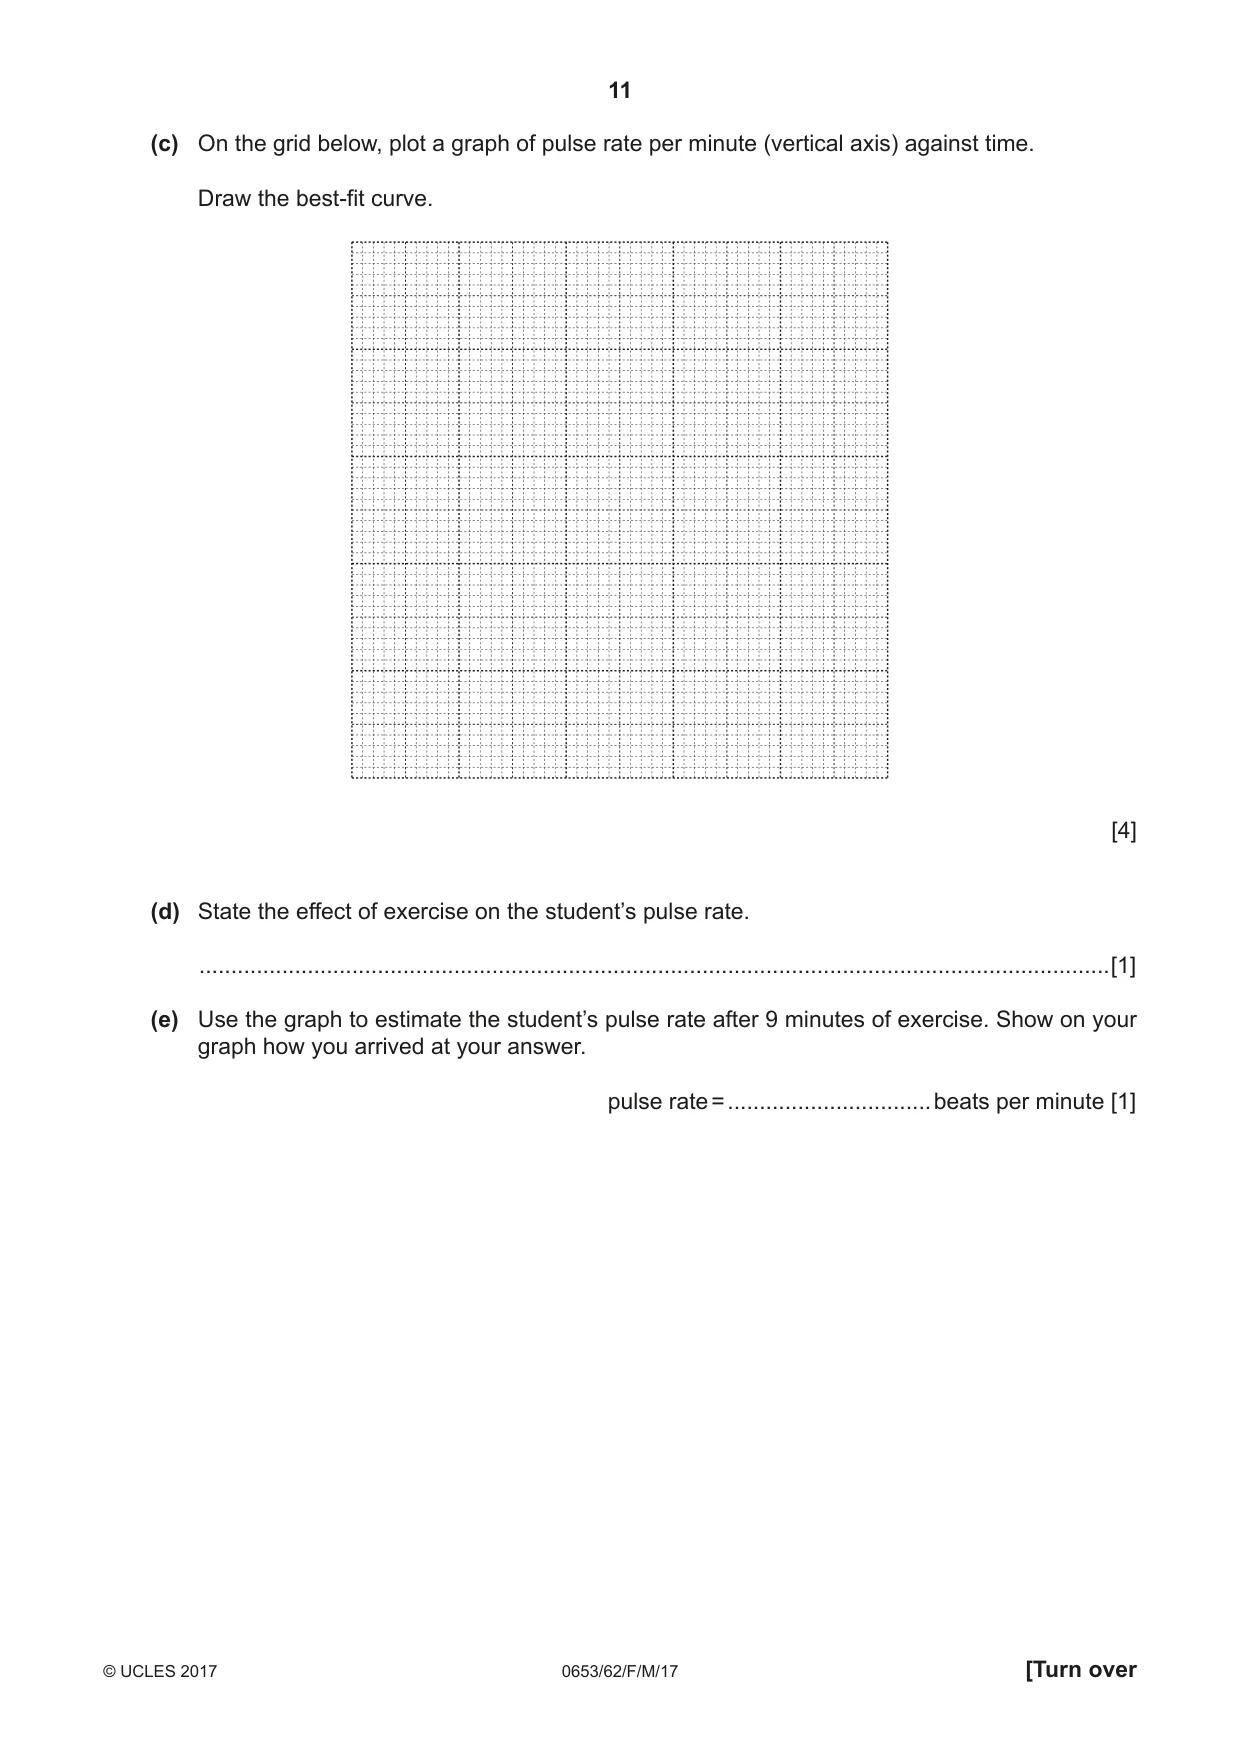
4 A student investigates the effect of exercise on pulse rate. (a) Read through the rest of the question and then complete the headings for the results in Table 4.1. [2] Table 4.1 pulse rate / beats per ......................... / ......................... ......................... / ......................... minute 0 17 68 2 23 92 4 31 124 6 37 8 10 176 • The student takes his pulse rate at rest. • He then begins running. • While running he records his pulse rate for 15 seconds every 2 minutes. • He does this for 10 minutes. He uses a clicker counter to count his pulse. Every time he feels a beat he clicks the counter and the number of clicks are shown on the display. (b) (i) Read the clicker counter displays in Fig. 4.1. Record these values to complete the second column of Table 4.1. [1] 0041 0044 8 minutes 10 minutes Fig. 4.1 (ii) Calculate the pulse rates per minute for 6 and 8 minutes. Record these in the third column of Table 4.1. [1] (c) On the grid below, plot a graph of pulse rate per minute (vertical axis) against time. Draw the best-fit curve. [4] (d) State the effect of exercise on the student’s pulse rate. ...............................................................................................................................................[1] (e) Use the graph to estimate the student’s pulse rate after 9 minutes of exercise. Show on your graph how you arrived at your answer. pulse rate = ................................beats per minute [1]
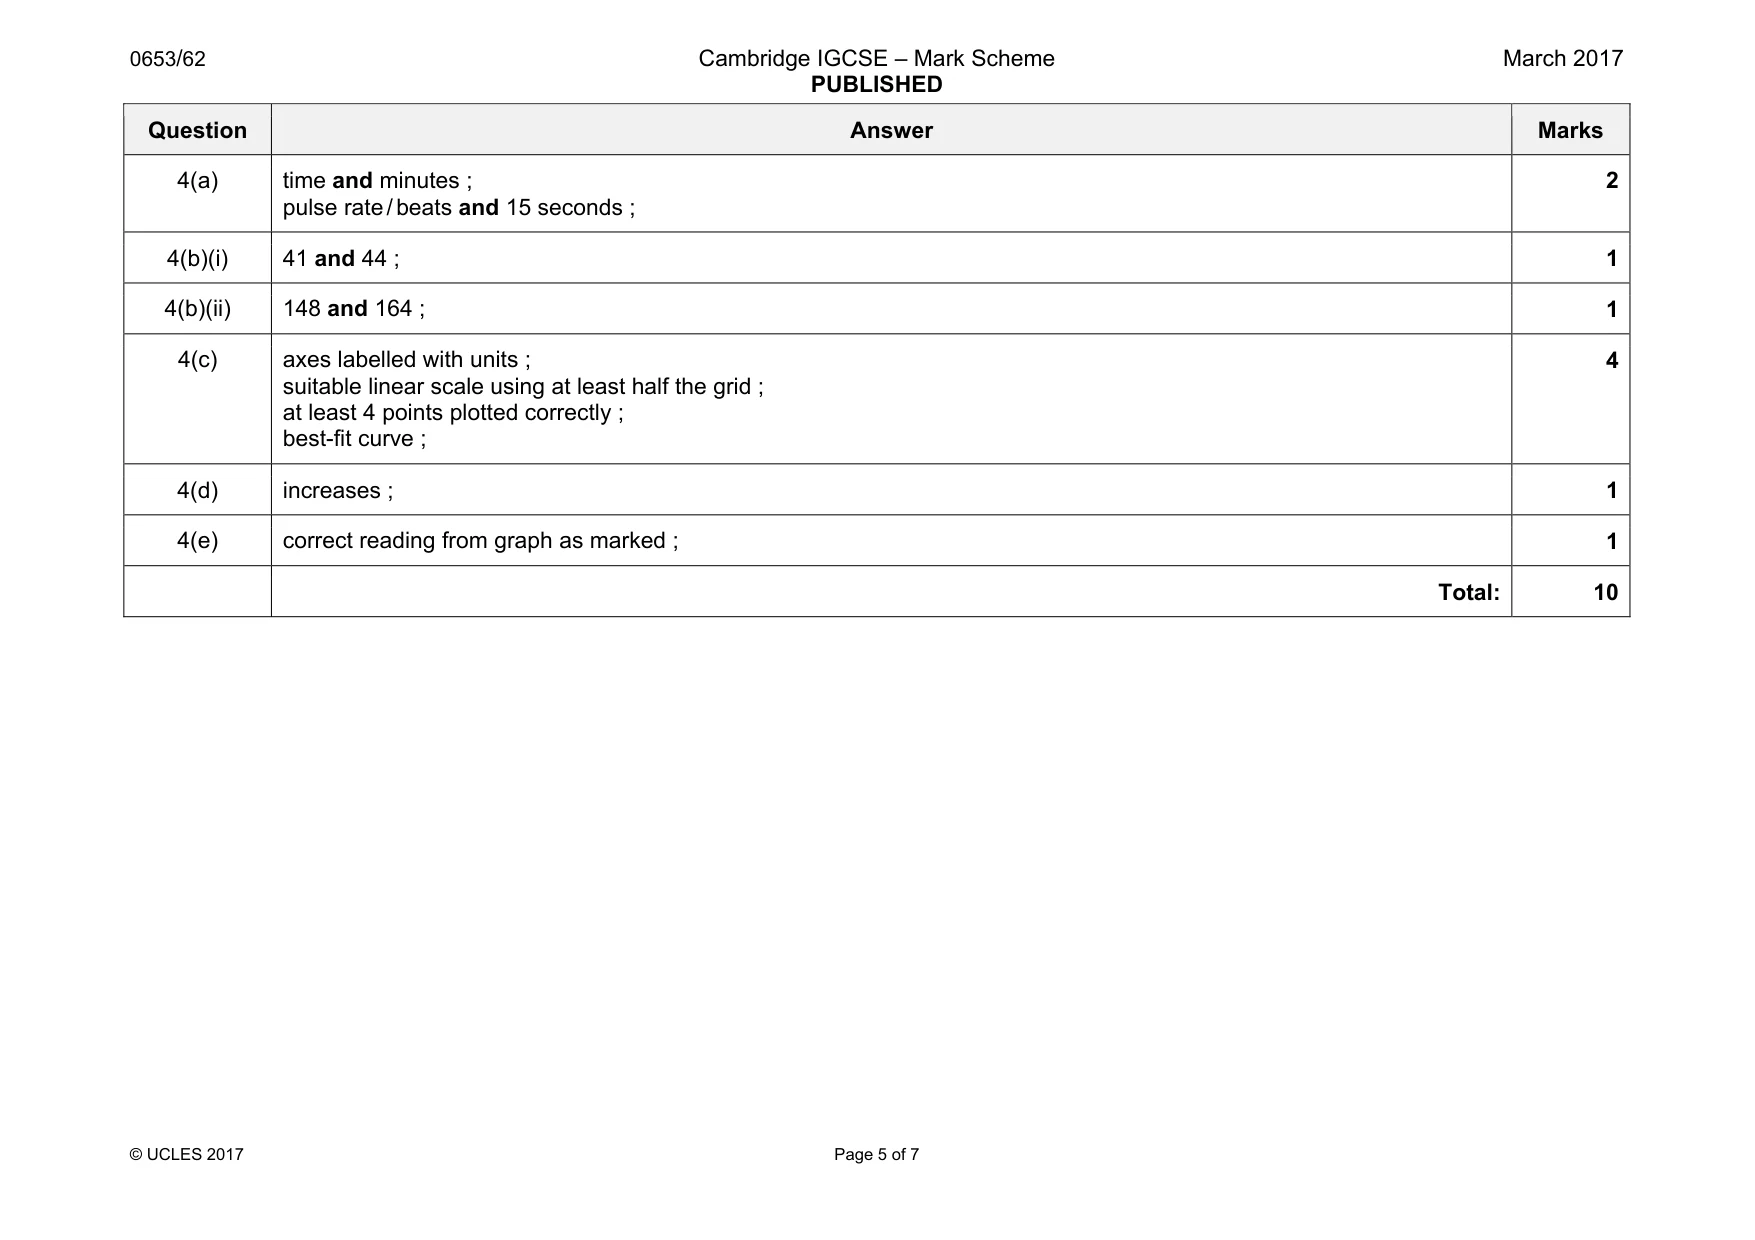
Mark scheme: 4(a) time and minutes ; pulse rate / beats and 15 seconds ; 2 4(b)(i) 41 and 44 ; 1 4(b)(ii) 148 and 164 ; 1 4(c) axes labelled with units ; suitable linear scale using at least half the grid ; at least 4 points plotted correctly ; best-fit curve ; 4 4(d) increases ; 1 4(e) correct reading from graph as marked ; 1 Total: 10
Q5 · A student is going to investigate the rate of reaction between a metal and an acid
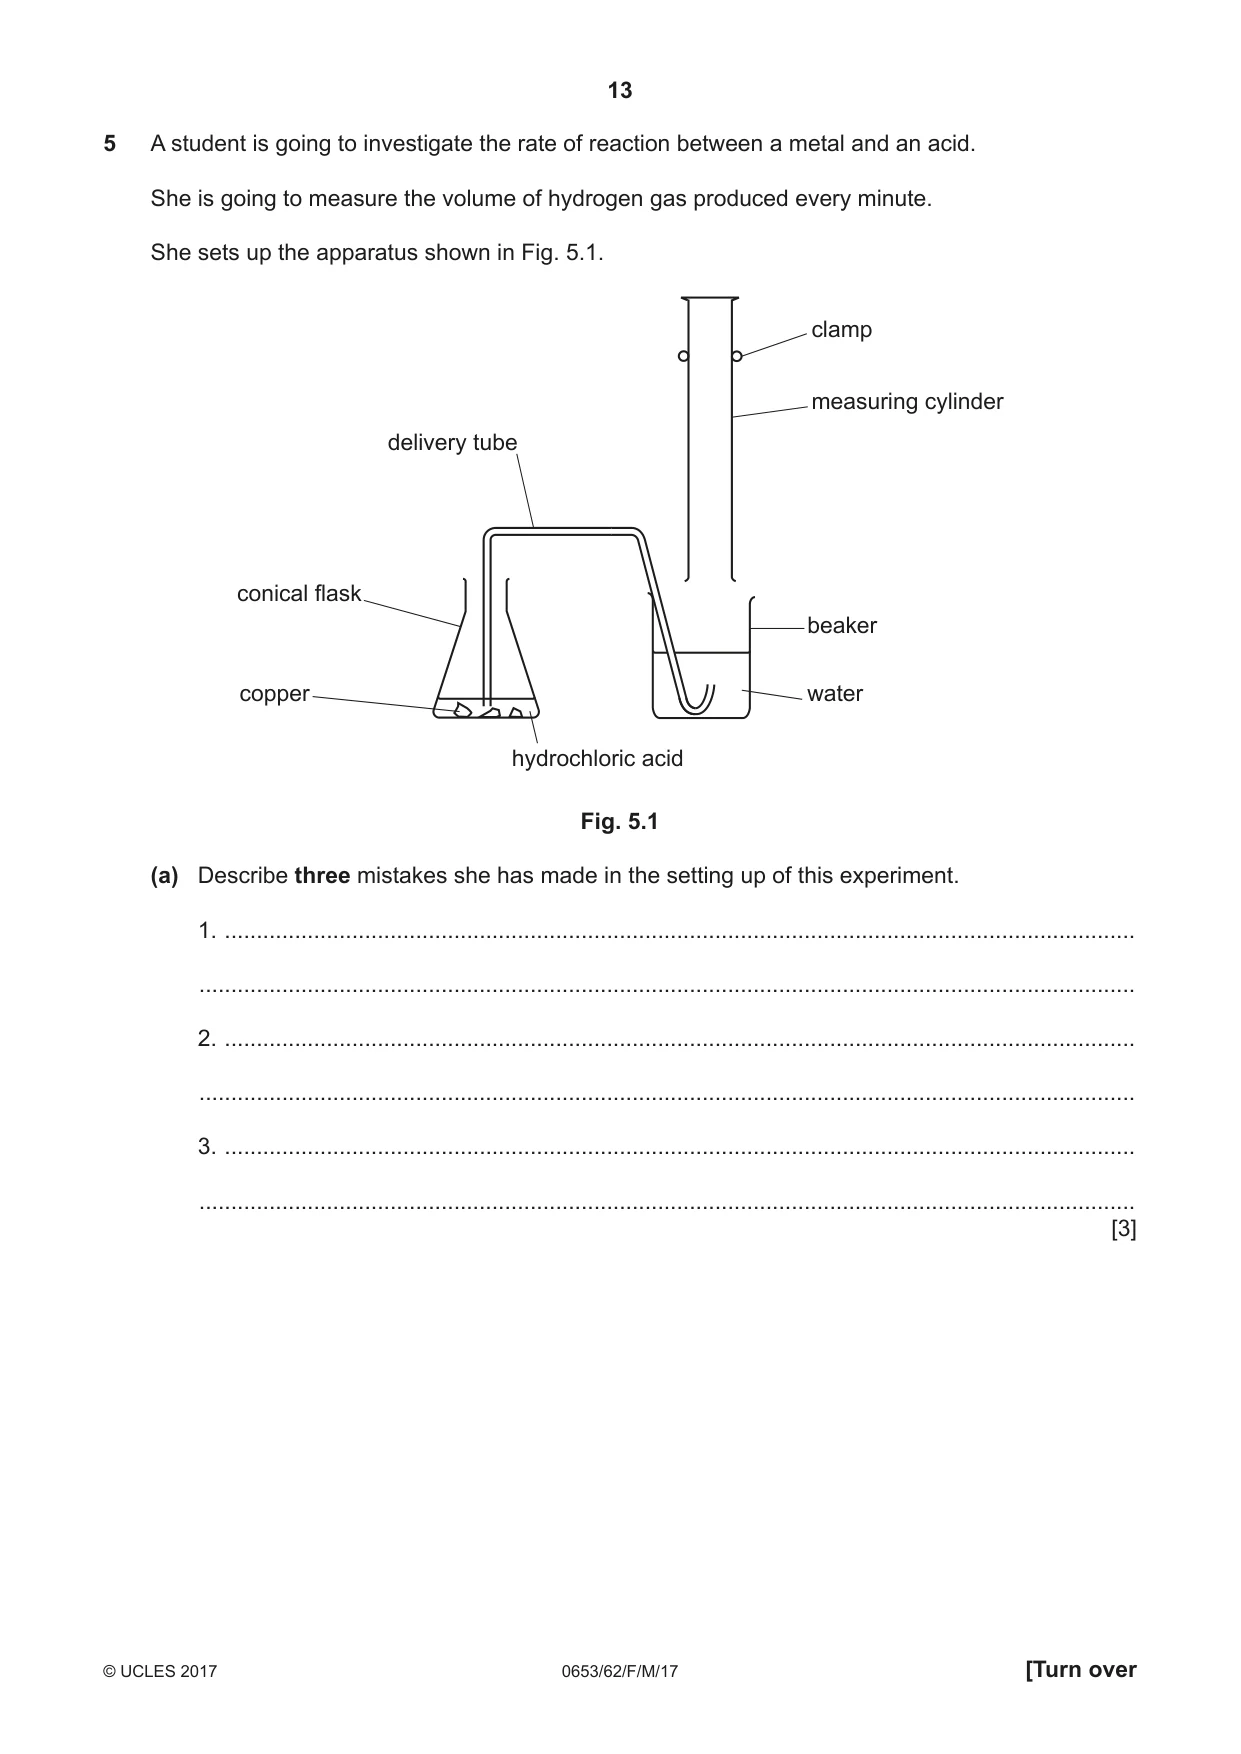
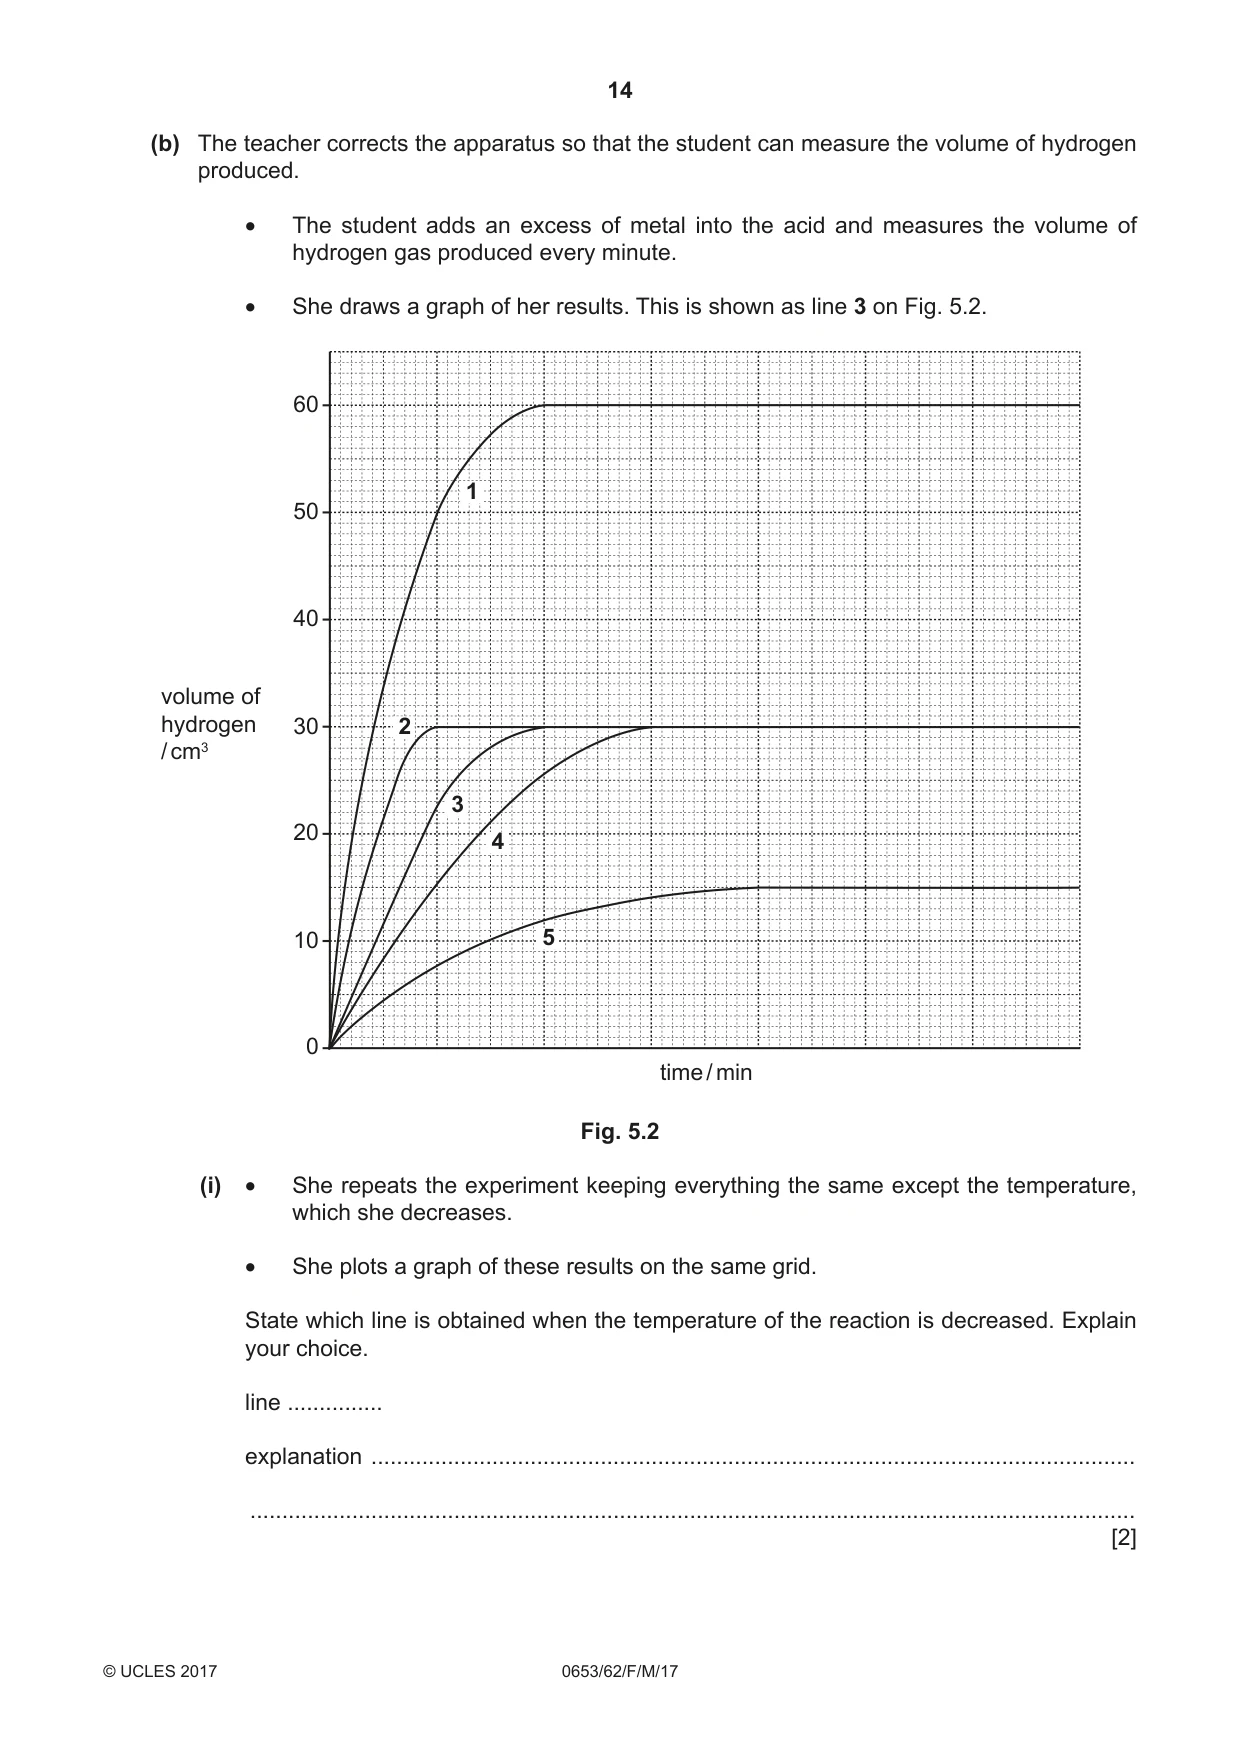
5 A student is going to investigate the rate of reaction between a metal and an acid. She is going to measure the volume of hydrogen gas produced every minute. She sets up the apparatus shown in Fig. 5.1. clamp measuring cylinder delivery tube conical flask beaker copper water hydrochloric acid Fig. 5.1 (a) Describe three mistakes she has made in the setting up of this experiment. 1. ............................................................................................................................................... ................................................................................................................................................... 2. ............................................................................................................................................... ................................................................................................................................................... 3. ............................................................................................................................................... ................................................................................................................................................... [3] (b) The teacher corrects the apparatus so that the student can measure the volume of hydrogen produced. • The student adds an excess of metal into the acid and measures the volume of hydrogen gas produced every minute. • She draws a graph of her results. This is shown as line 3 on Fig. 5.2. 60 1 50 40 volume of hydrogen 30 2 / cm3 3 20 4 10 5 0 time / min Fig. 5.2 (i) • She repeats the experiment keeping everything the same except the temperature, which she decreases. • She plots a graph of these results on the same grid. State which line is obtained when the temperature of the reaction is decreased. Explain your choice. line ............... explanation ........................................................................................................................ ........................................................................................................................................... [2] (ii) She repeats the experiment again but this time doubles the concentration of the acid while keeping everything else the same as the original experiment. She plots a graph of these results on the same grid. State which line is obtained when the concentration of the acid is doubled. Explain your choice. line ............... explanation ........................................................................................................................ ........................................................................................................................................... [2] (c) She repeats the experiment again but this time the metal is ground into a fine powder while keeping everything else the same as the original experiment. Suggest what happens to the total volume of hydrogen gas produced. Explain your answer. volume of gas produced ........................................................................................................... explanation ............................................................................................................................... ................................................................................................................................................... [1] (d) At the end of the experiment a solution remains in the conical flask. The solution contains a dissolved salt. Describe how she can obtain a sample of the salt from the solution. You may include a labelled diagram in your answer. ................................................................................................................................................... ................................................................................................................................................... ...............................................................................................................................................[1] (e) Describe how she can test the gas to show it is hydrogen. Remember to include the result of the test in your answer. ................................................................................................................................................... ...............................................................................................................................................[1]
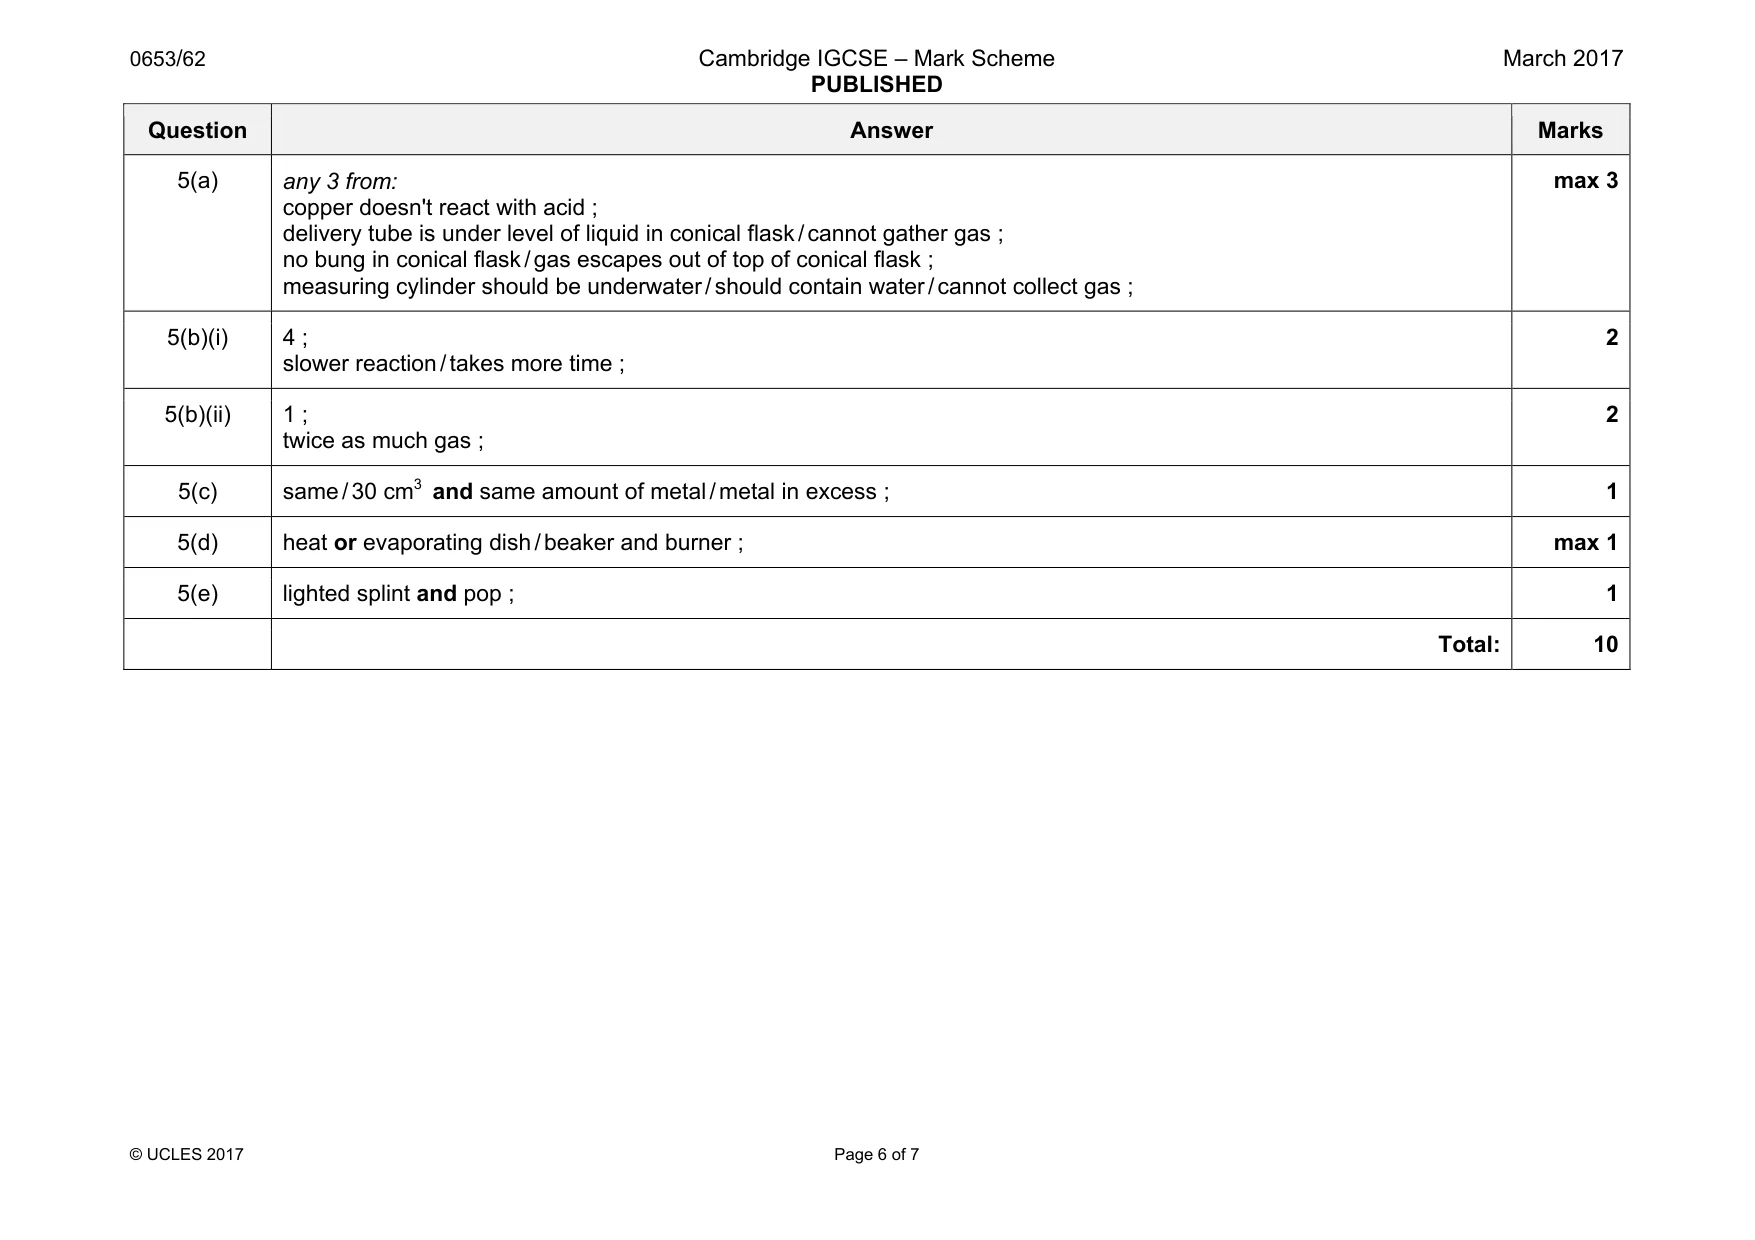
Mark scheme: 5(a) any 3 from: copper doesn't react with acid ; delivery tube is under level of liquid in conical flask / cannot gather gas ; no bung in conical flask / gas escapes out of top of conical flask ; measuring cylinder should be underwater / should contain water / cannot collect gas ; max 3 5(b)(i) 4 ; slower reaction / takes more time ; 2 5(b)(ii) 1 ; twice as much gas ; 2 5(c) same / 30 cm3 and same amount of metal / metal in excess ; 1 5(d) heat or evaporating dish / beaker and burner ; max 1 5(e) lighted splint and pop ; 1 Total: 10
Q6 · A student performs an experiment to find out the density of the metal used to make a coin
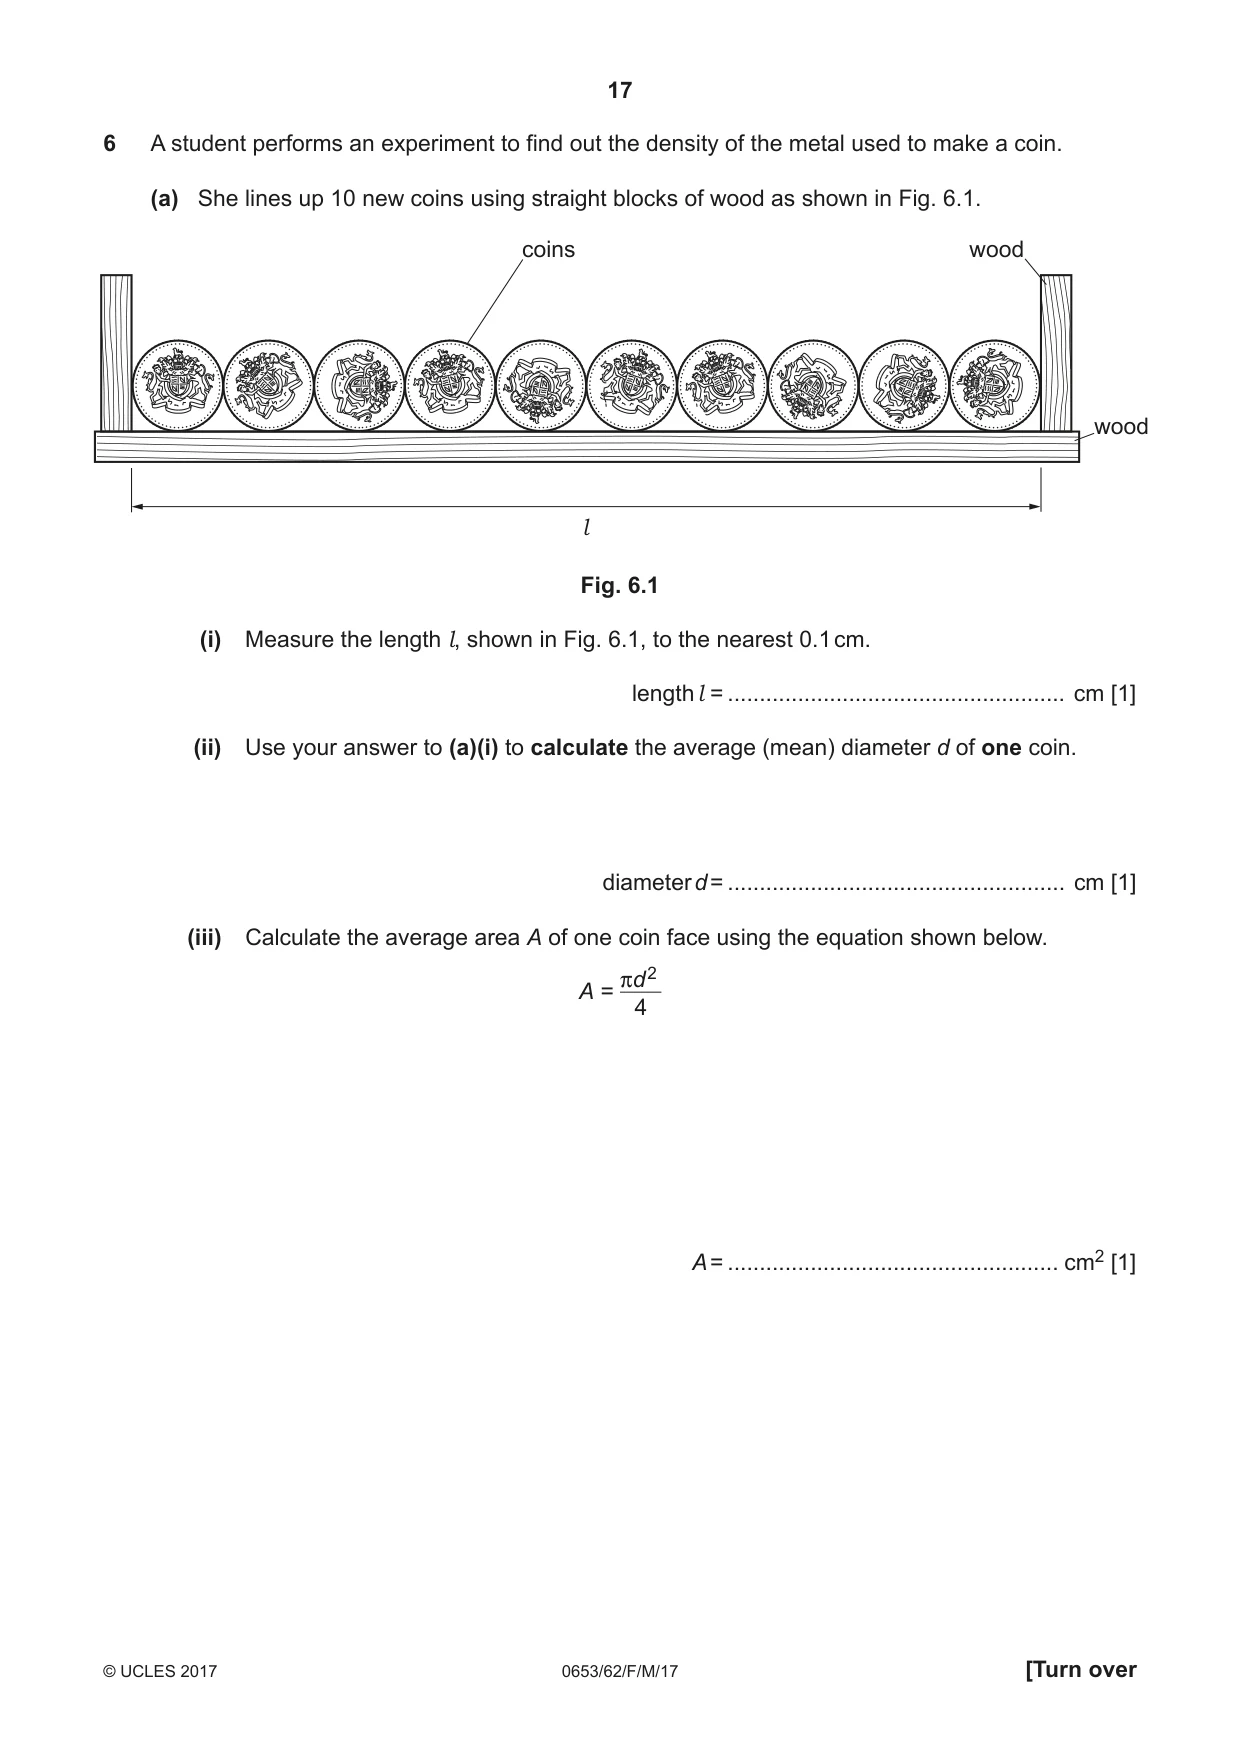
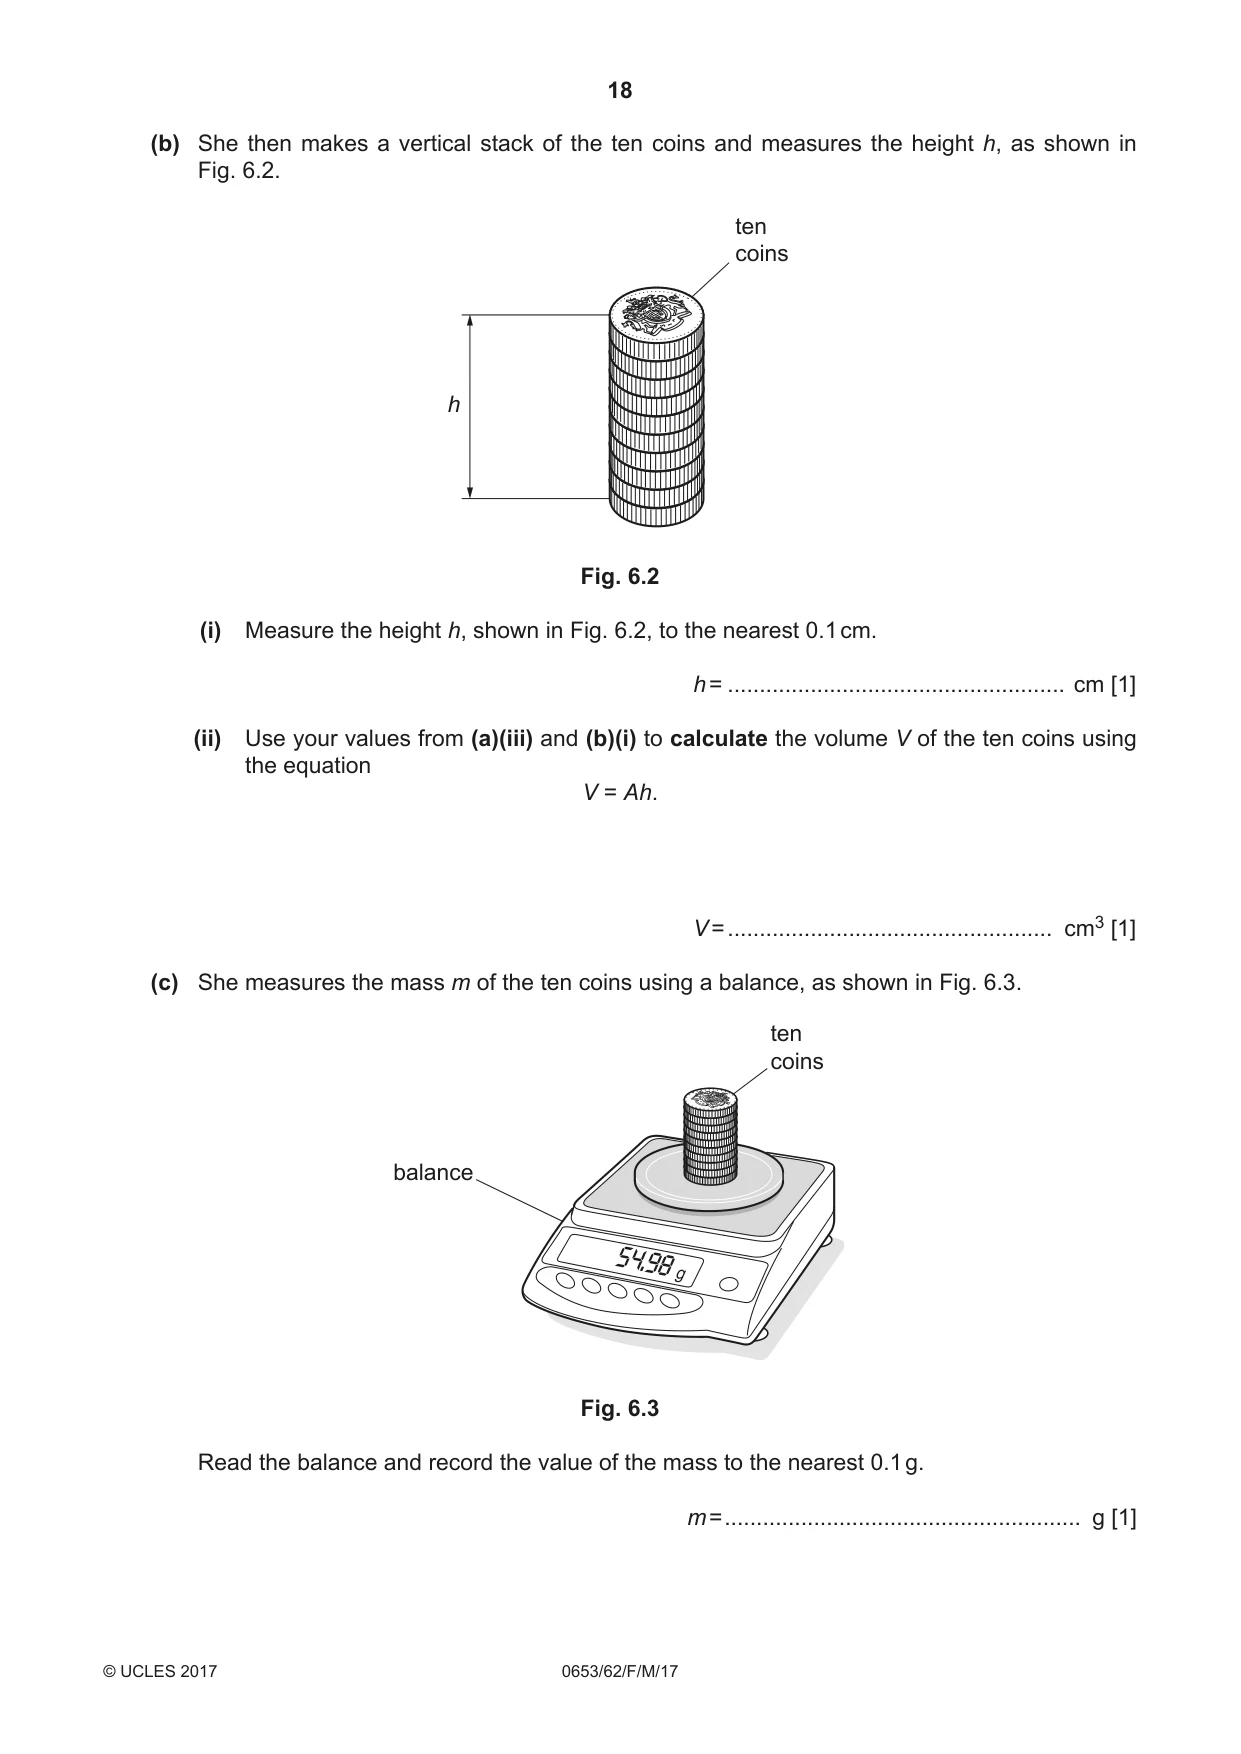
6 A student performs an experiment to find out the density of the metal used to make a coin. (a) She lines up 10 new coins using straight blocks of wood as shown in Fig. 6.1. coins wood wood l Fig. 6.1 (i) Measure the length l, shown in Fig. 6.1, to the nearest 0.1 cm. length l = ..................................................... cm [1] (ii) Use your answer to (a)(i) to calculate the average (mean) diameter d of one coin. diameter d = ..................................................... cm [1] (iii) Calculate the average area A of one coin face using the equation shown below. πd2 A = 4 A = .................................................... cm2 [1] (b) She then makes a vertical stack of the ten coins and measures the height h, as shown in Fig. 6.2. ten coins h Fig. 6.2 (i) Measure the height h, shown in Fig. 6.2, to the nearest 0.1 cm. h = ..................................................... cm [1] (ii) Use your values from (a)(iii) and (b)(i) to calculate the volume V of the ten coins using the equation V = Ah. V = ................................................... cm3 [1] (c) She measures the mass m of the ten coins using a balance, as shown in Fig. 6.3. ten coins balance Fig. 6.3 Read the balance and record the value of the mass to the nearest 0.1 g. m = ........................................................ g [1] (d) Calculate the density of the metal used to make the coins using the equation m density = . V density of the metal = ............................................... g / cm3 [1] (e) Explain the advantage of using ten coins instead of one. ................................................................................................................................................... ................................................................................................................................................... ...............................................................................................................................................[1] (f) Another student says that the value of the density will be inaccurate because the coins are not smooth discs of metal as they have ridges and patterns on them. State and explain what effect these ridges and patterns will have on the value of the density you have calculated in (d). ................................................................................................................................................... ................................................................................................................................................... ................................................................................................................................................... ...............................................................................................................................................[2]
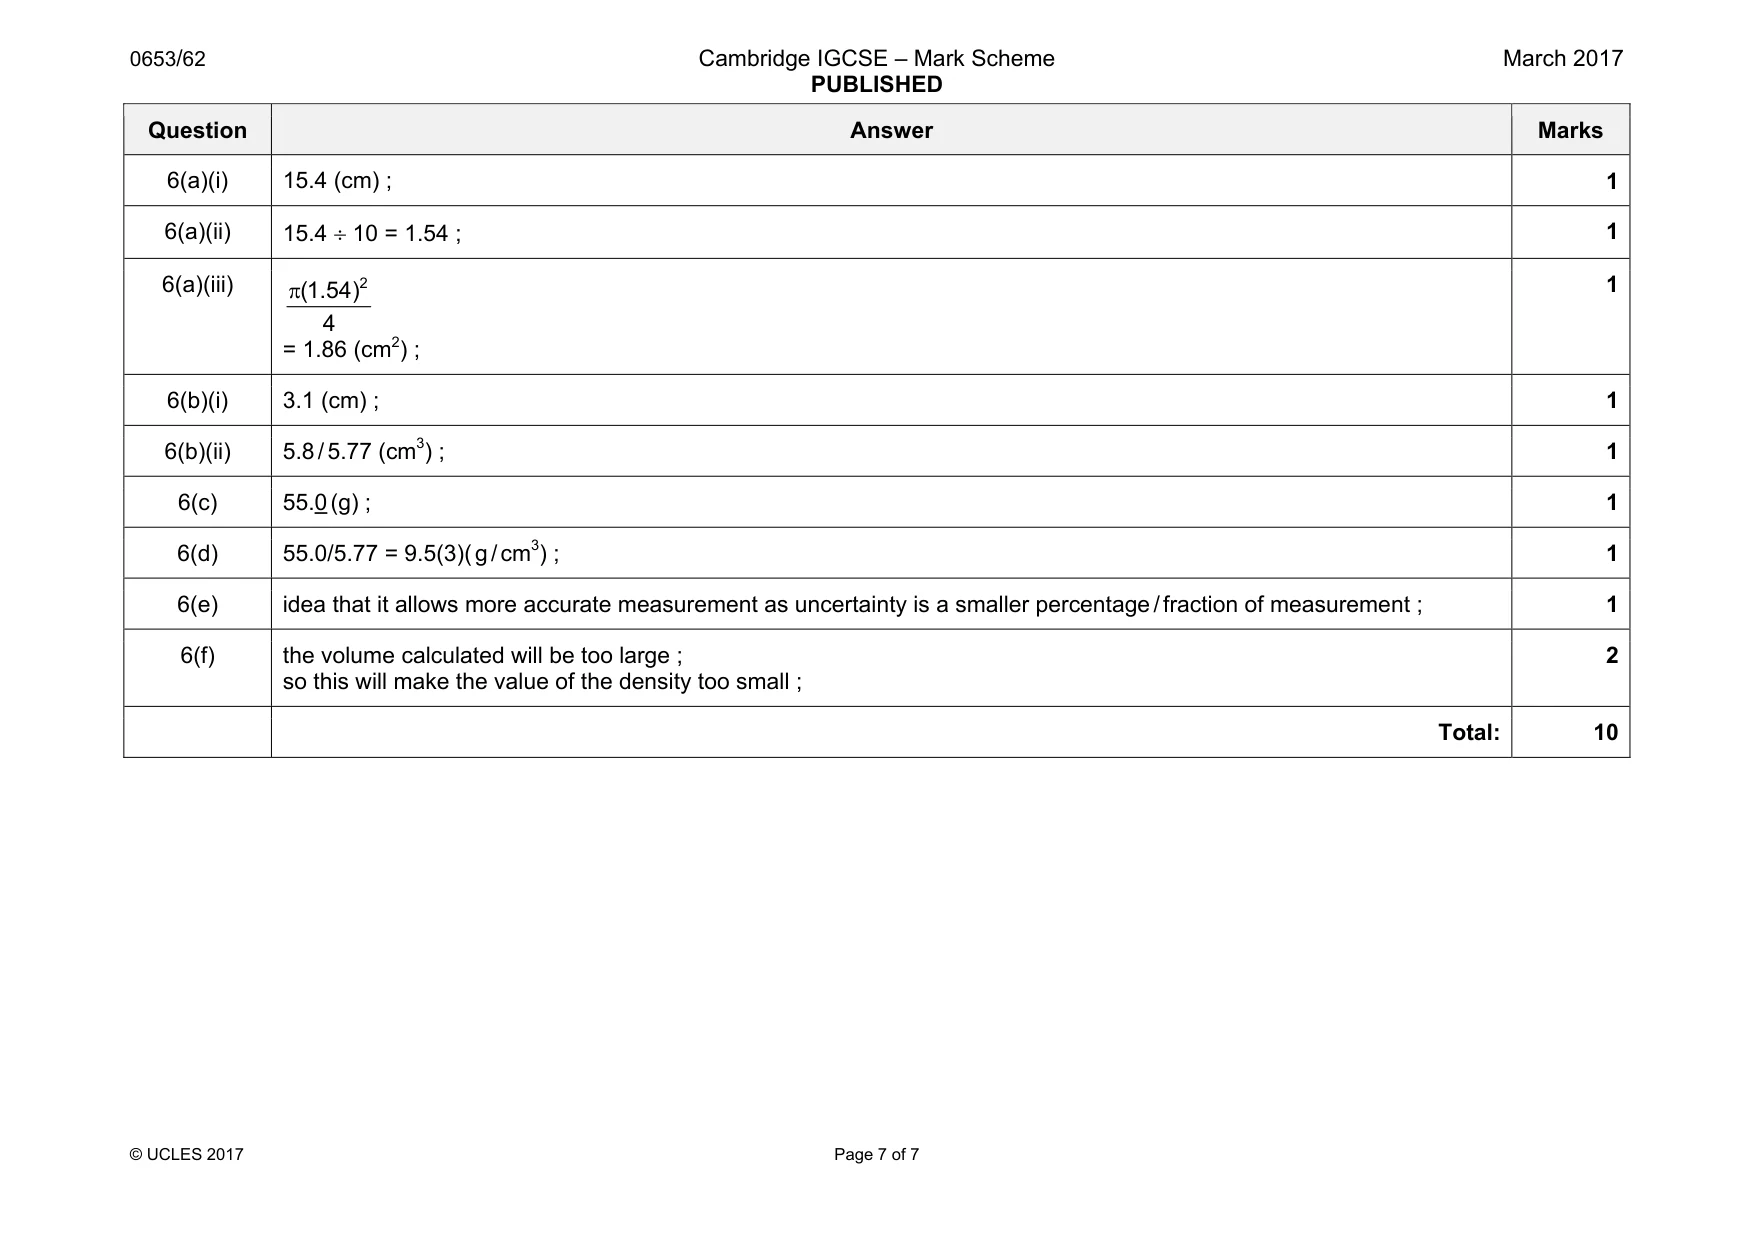
Mark scheme: 6(a)(i) 15.4 (cm) ; 1 6(a)(ii) 15.4 ÷ 10 = 1.54 ; 1 6(a)(iii) 2 (1.54) 4 π = 1.86 (cm2) ; 1 6(b)(i) 3.1 (cm) ; 1 6(b)(ii) 5.8 / 5.77 (cm3) ; 1 6(c) 55.0 (g) ; 1 6(d) 55.0/5.77 = 9.5(3)( g / cm3) ; 1 6(e) idea that it allows more accurate measurement as uncertainty is a smaller percentage / fraction of measurement ; 1 6(f) the volume calculated will be too large ; so this will make the value of the density too small ; 2 Total: 10
What was in this paper
The subtopics covered by these 6 questions, and how many questions each got. Open one in a new tab to see every Cambridge question on it.
What you needed in this session
Cambridge’s own grade thresholds for 2017 Feb/March, Paper 6 · Variant 2. A higher threshold means an easier paper — the bar moves with how the cohort did.