Cambridge IGCSE Science - Combined 0653 — 2010 May/June Paper 5 · Variant 1
0653/51/M/J/10 · 30 marks · ≈34 min
The question paper and its mark scheme, free to read here and free to download. This is Cambridge’s own paper, exactly as it was sat.
Question paper12 pages



Mark scheme3 pages
Answers below. Sit the paper first if you are practising.
Paper as text
Question paper, page 1
This document consists of 9 printed pages and 3 blank pages. IB10 06_0653_51/2RP © UCLES 2010 [Turn over *7828333977* For Examiner's Use 1 2 3 Total UNIVERSITY OF CAMBRIDGE INTERNATIONAL EXAMINATIONS International General Certificate of Secondary Education COMBINED SCIENCE 0653/51 Paper 5 Practical Test May/June 2010 1 hour 30 minutes Candidates answer on the Question Paper. Additional Materials: As listed in Instructions to Supervisors. READ THESE INSTRUCTIONS FIRST Write your Centre number, candidate number and name on all the work you hand in. Write in dark blue or black pen. You may use a pencil for any diagrams, graphs or rough working. Do not use staples, paper clips, highlighters, glue or correction fluid. DO NOT WRITE IN ANY BARCODES. Answer all questions. Chemistry practical notes for this paper are printed on page 12. At the end of the examination, fasten all your work securely together. The number of marks is given in brackets [ ] at the end of each question or part question. www.XtremePapers.com
Question paper, page 2
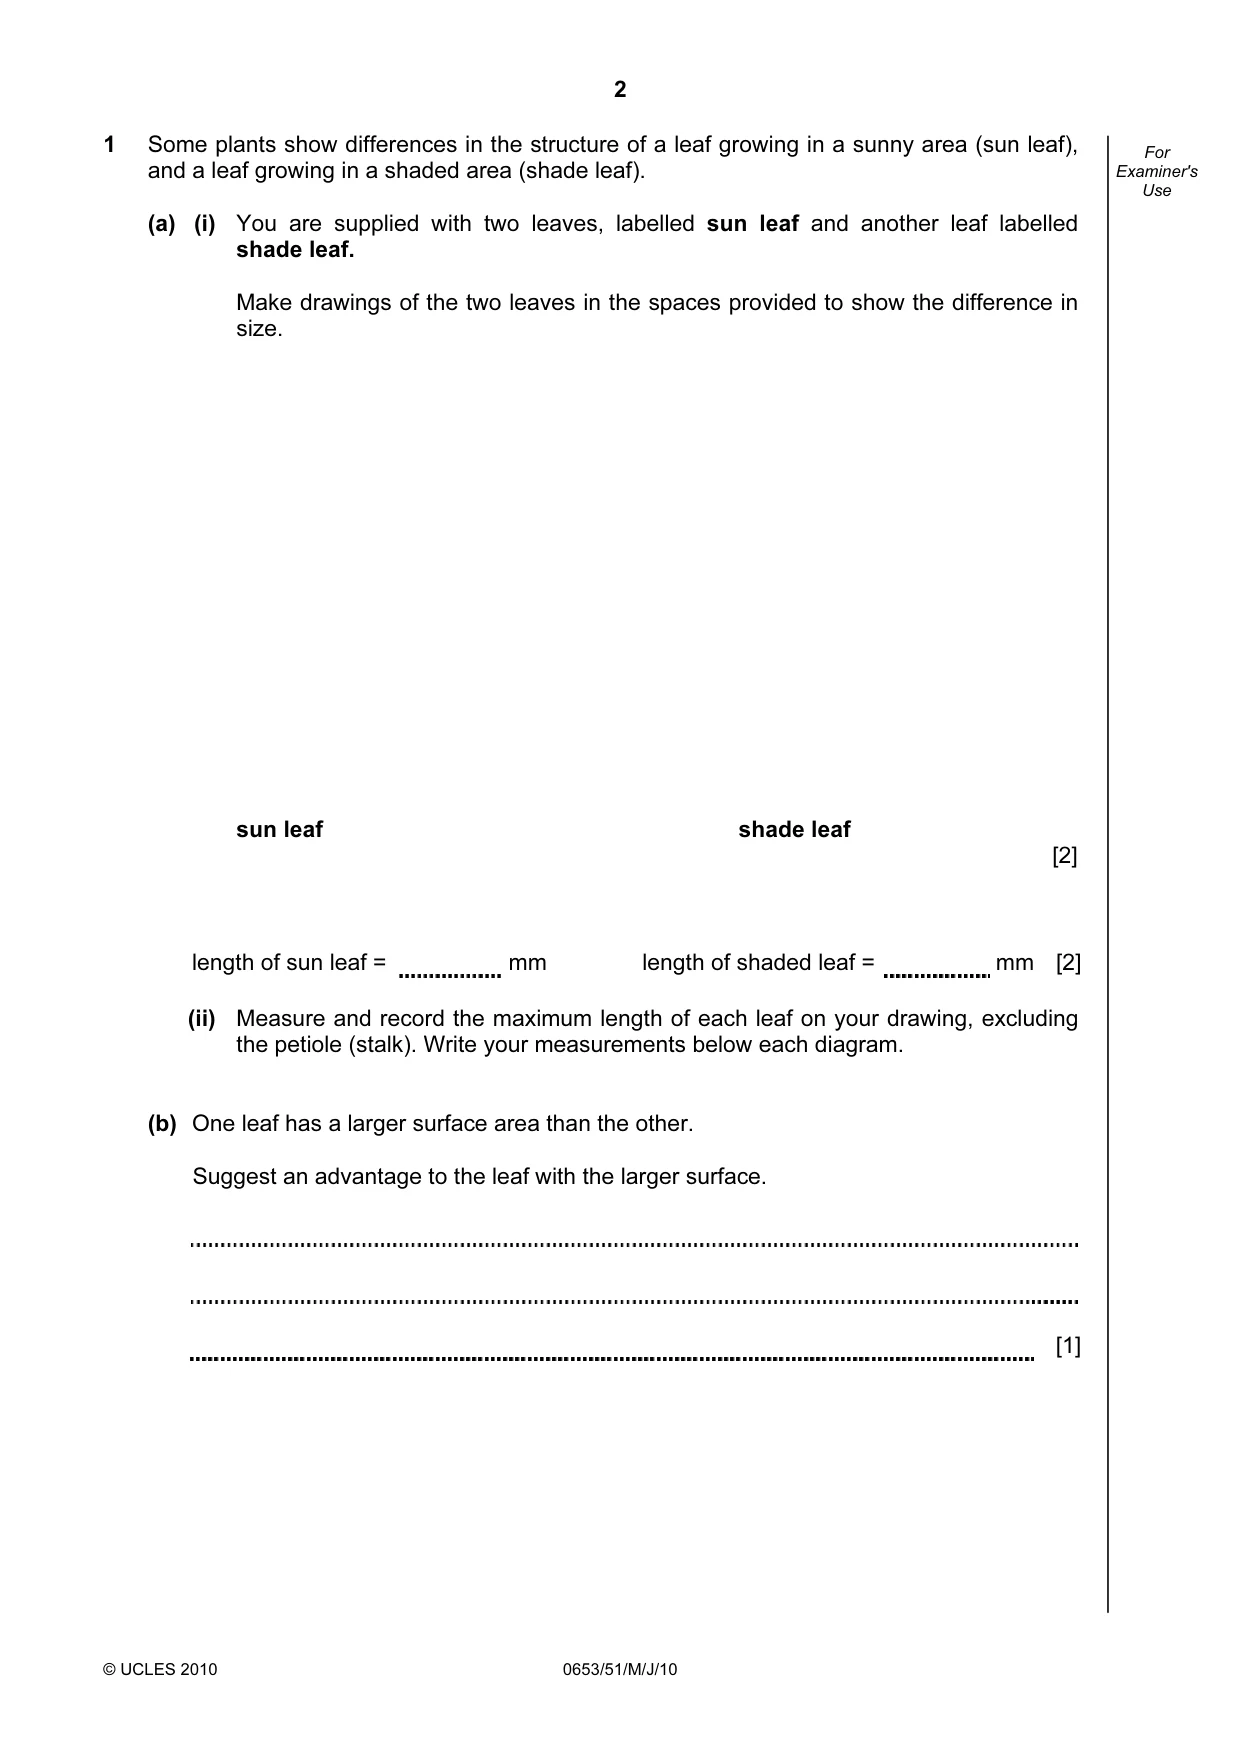
2 © UCLES 2010 0653/51/M/J/10 For Examiner's Use 1 Some plants show differences in the structure of a leaf growing in a sunny area (sun leaf), and a leaf growing in a shaded area (shade leaf). (a) (i) You are supplied with two leaves, labelled sun leaf and another leaf labelled shade leaf. Make drawings of the two leaves in the spaces provided to show the difference in size. sun leaf shade leaf [2] length of sun leaf = mm length of shaded leaf = mm [2] (ii) Measure and record the maximum length of each leaf on your drawing, excluding the petiole (stalk). Write your measurements below each diagram. (b) One leaf has a larger surface area than the other. Suggest an advantage to the leaf with the larger surface. [1]
Question paper, page 3
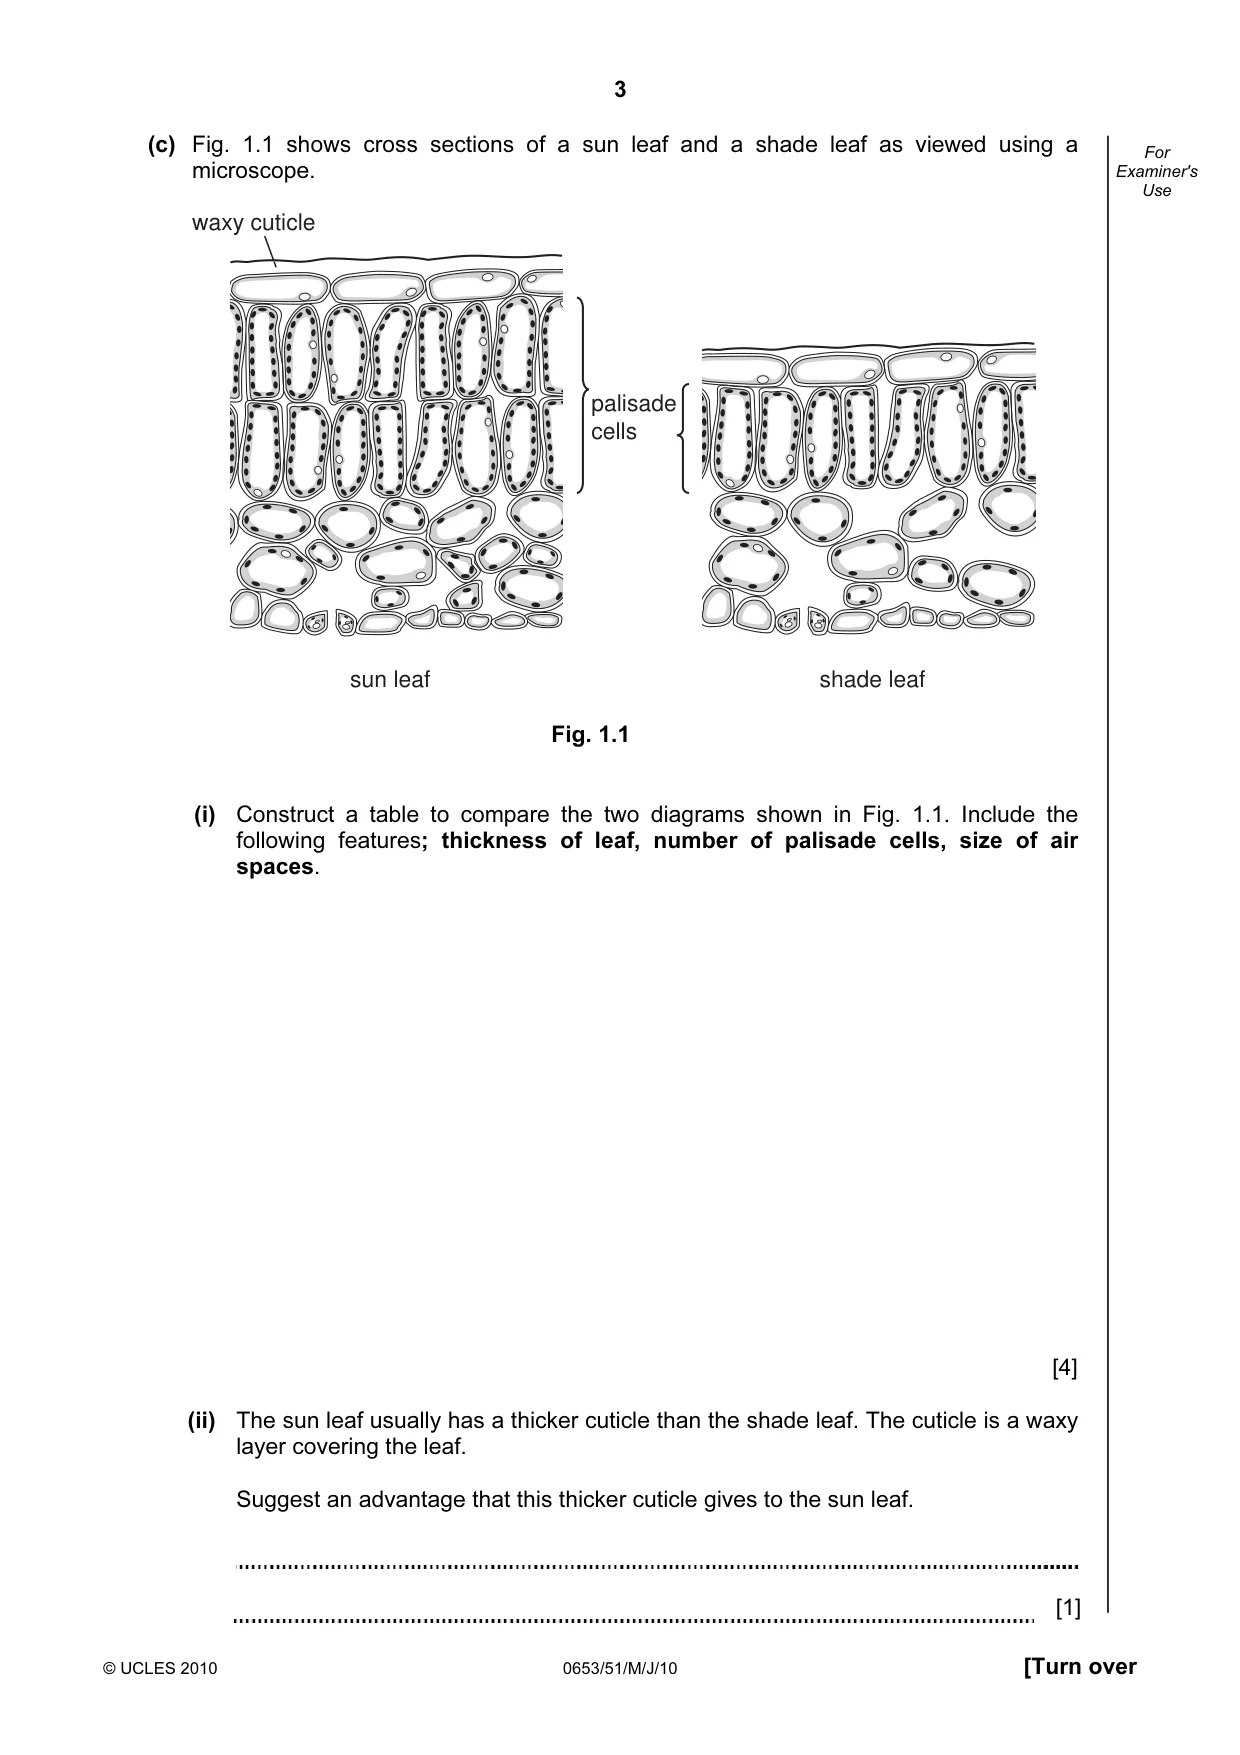
3 © UCLES 2010 0653/51/M/J/10 [Turn over For Examiner's Use (c) Fig. 1.1 shows cross sections of a sun leaf and a shade leaf as viewed using a microscope. sun leaf shade leaf waxy cuticle palisade cells Fig. 1.1 (i) Construct a table to compare the two diagrams shown in Fig. 1.1. Include the following features; thickness of leaf, number of palisade cells, size of air spaces. [4] (ii) The sun leaf usually has a thicker cuticle than the shade leaf. The cuticle is a waxy layer covering the leaf. Suggest an advantage that this thicker cuticle gives to the sun leaf. [1]
Question paper, page 4
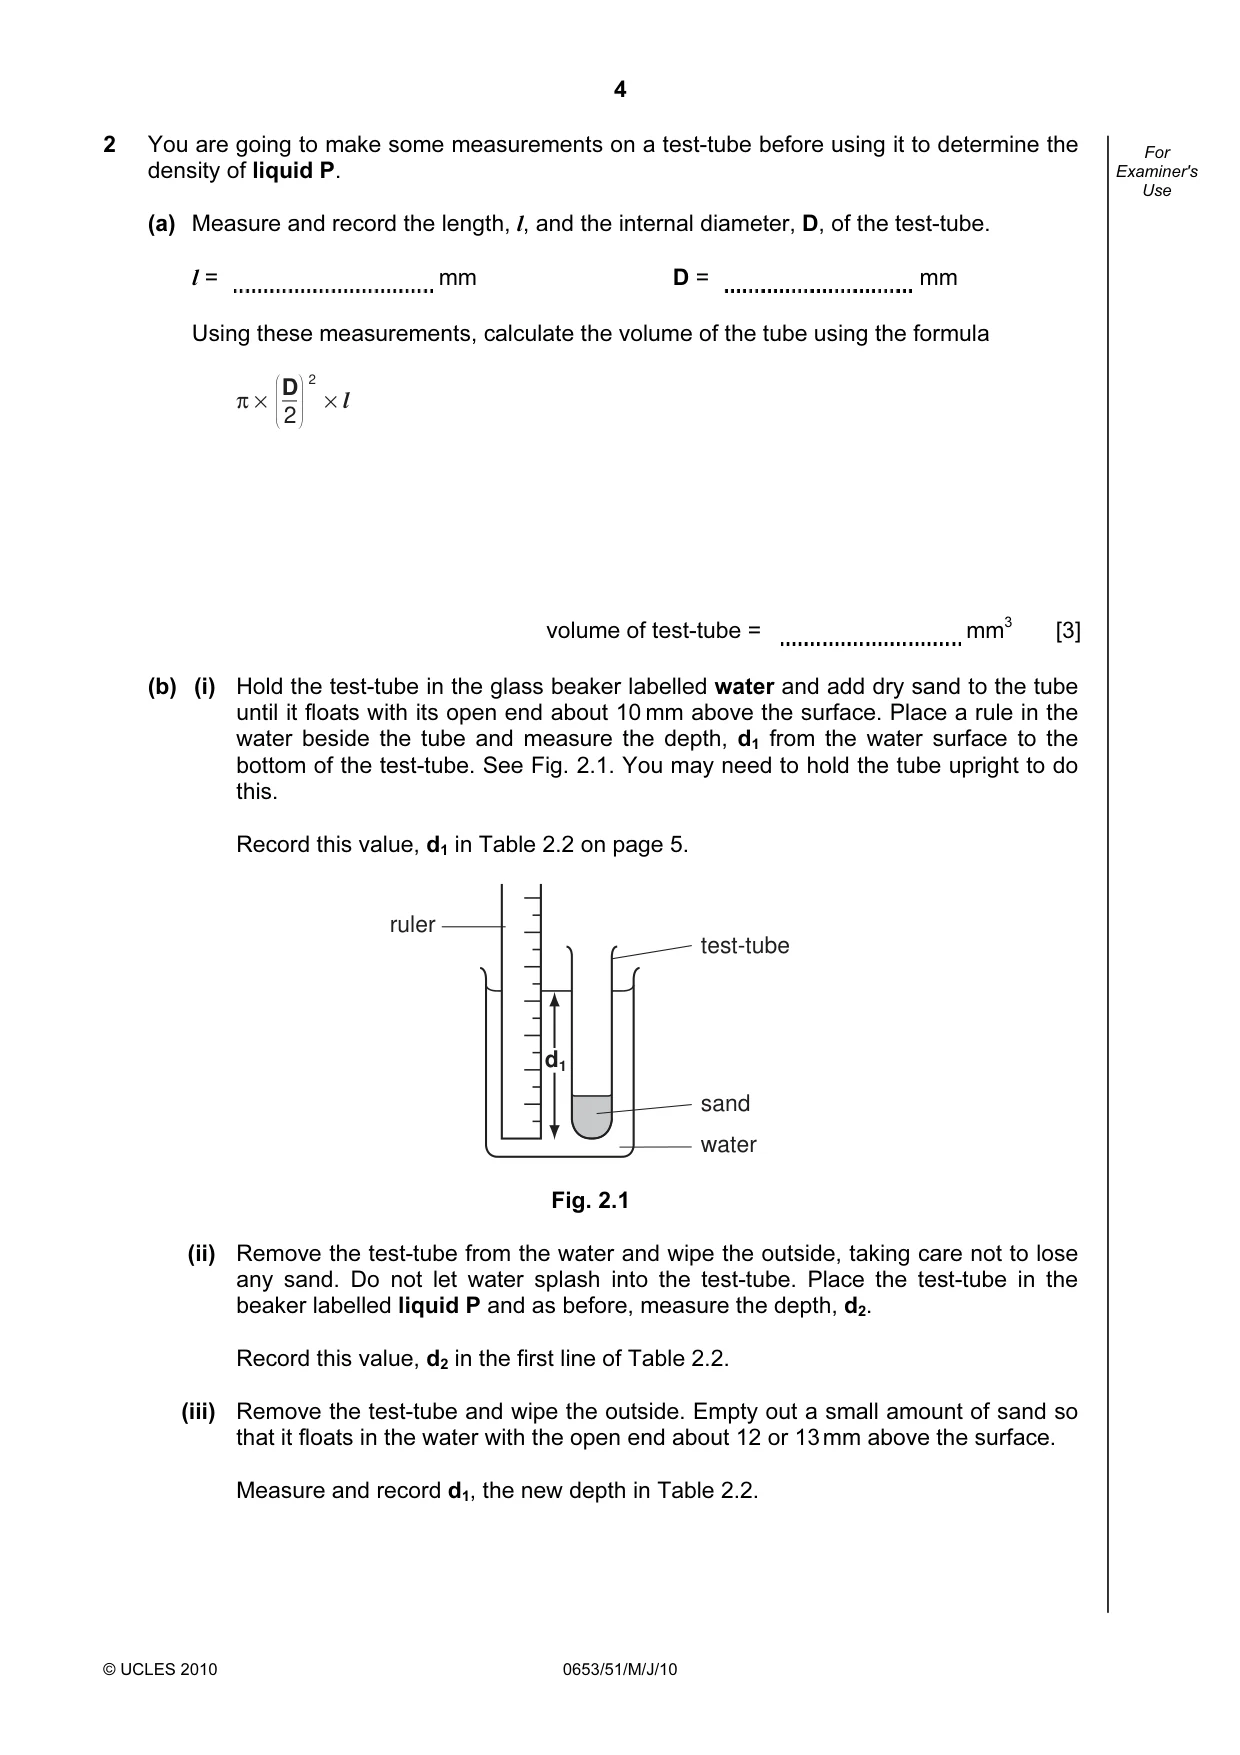
4 © UCLES 2010 0653/51/M/J/10 For Examiner's Use 2 You are going to make some measurements on a test-tube before using it to determine the density of liquid P. (a) Measure and record the length, l, and the internal diameter, D, of the test-tube. l = mm D = mm Using these measurements, calculate the volume of the tube using the formula D 2 π × × l 2 volume of test-tube = mm3 [3] (b) (i) Hold the test-tube in the glass beaker labelled water and add dry sand to the tube until it floats with its open end about 10 mm above the surface. Place a rule in the water beside the tube and measure the depth, d1 from the water surface to the bottom of the test-tube. See Fig. 2.1. You may need to hold the tube upright to do this. Record this value, d1 in Table 2.2 on page 5. ruler test-tube sand water d1 Fig. 2.1 (ii) Remove the test-tube from the water and wipe the outside, taking care not to lose any sand. Do not let water splash into the test-tube. Place the test-tube in the beaker labelled liquid P and as before, measure the depth, d2. Record this value, d2 in the first line of Table 2.2. (iii) Remove the test-tube and wipe the outside. Empty out a small amount of sand so that it floats in the water with the open end about 12 or 13 mm above the surface. Measure and record d1, the new depth in Table 2.2.
Question paper, page 5
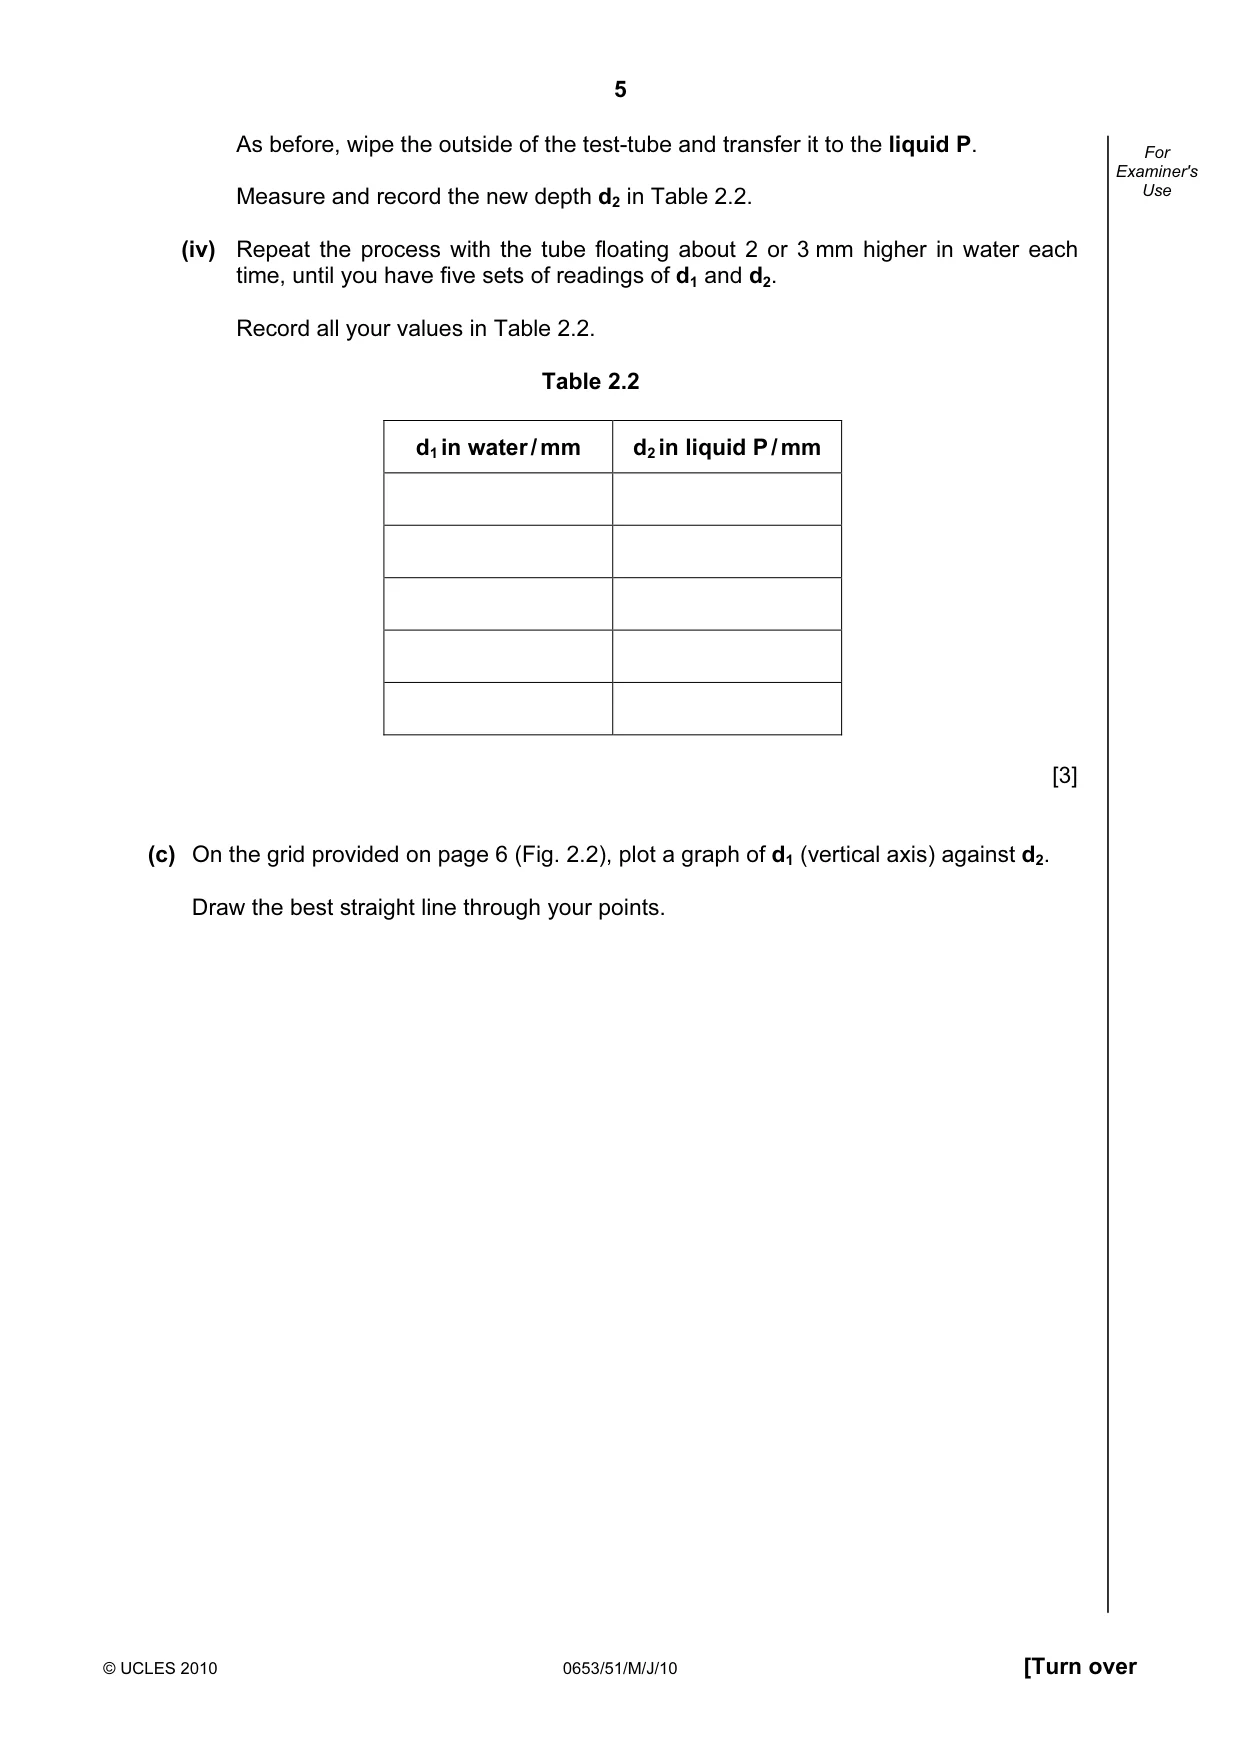
5 © UCLES 2010 0653/51/M/J/10 [Turn over For Examiner's Use As before, wipe the outside of the test-tube and transfer it to the liquid P. Measure and record the new depth d2 in Table 2.2. (iv) Repeat the process with the tube floating about 2 or 3 mm higher in water each time, until you have five sets of readings of d1 and d2. Record all your values in Table 2.2. Table 2.2 d1 in water / mm d2 in liquid P / mm [3] (c) On the grid provided on page 6 (Fig. 2.2), plot a graph of d1 (vertical axis) against d2. Draw the best straight line through your points.
Question paper, page 6
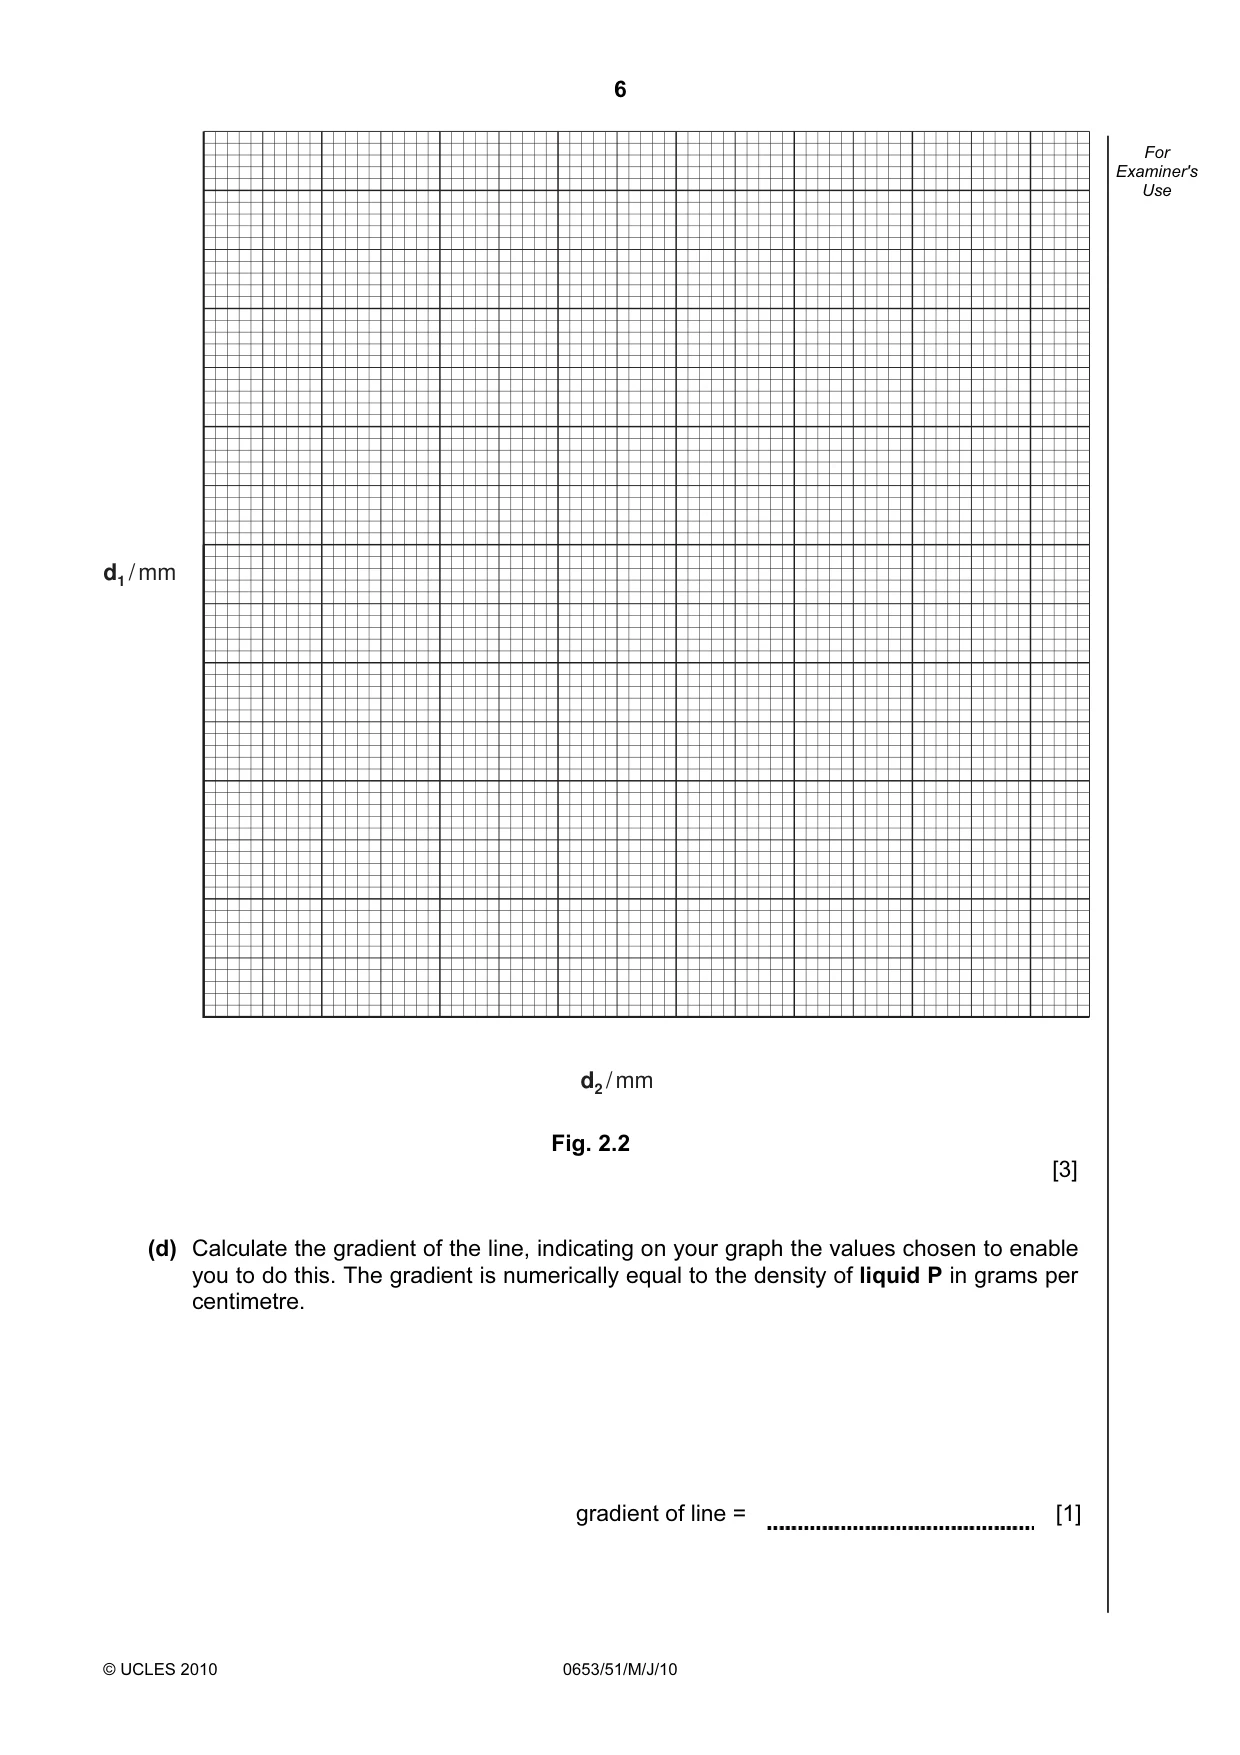
6 © UCLES 2010 0653/51/M/J/10 For Examiner's Use d2 / mm d1 / mm Fig. 2.2 [3] (d) Calculate the gradient of the line, indicating on your graph the values chosen to enable you to do this. The gradient is numerically equal to the density of liquid P in grams per centimetre. gradient of line = [1]
Question paper, page 7
7 © UCLES 2010 0653/51/M/J/10 [Turn over BLANK PAGE Please turn over for Question 3.
Question paper, page 8
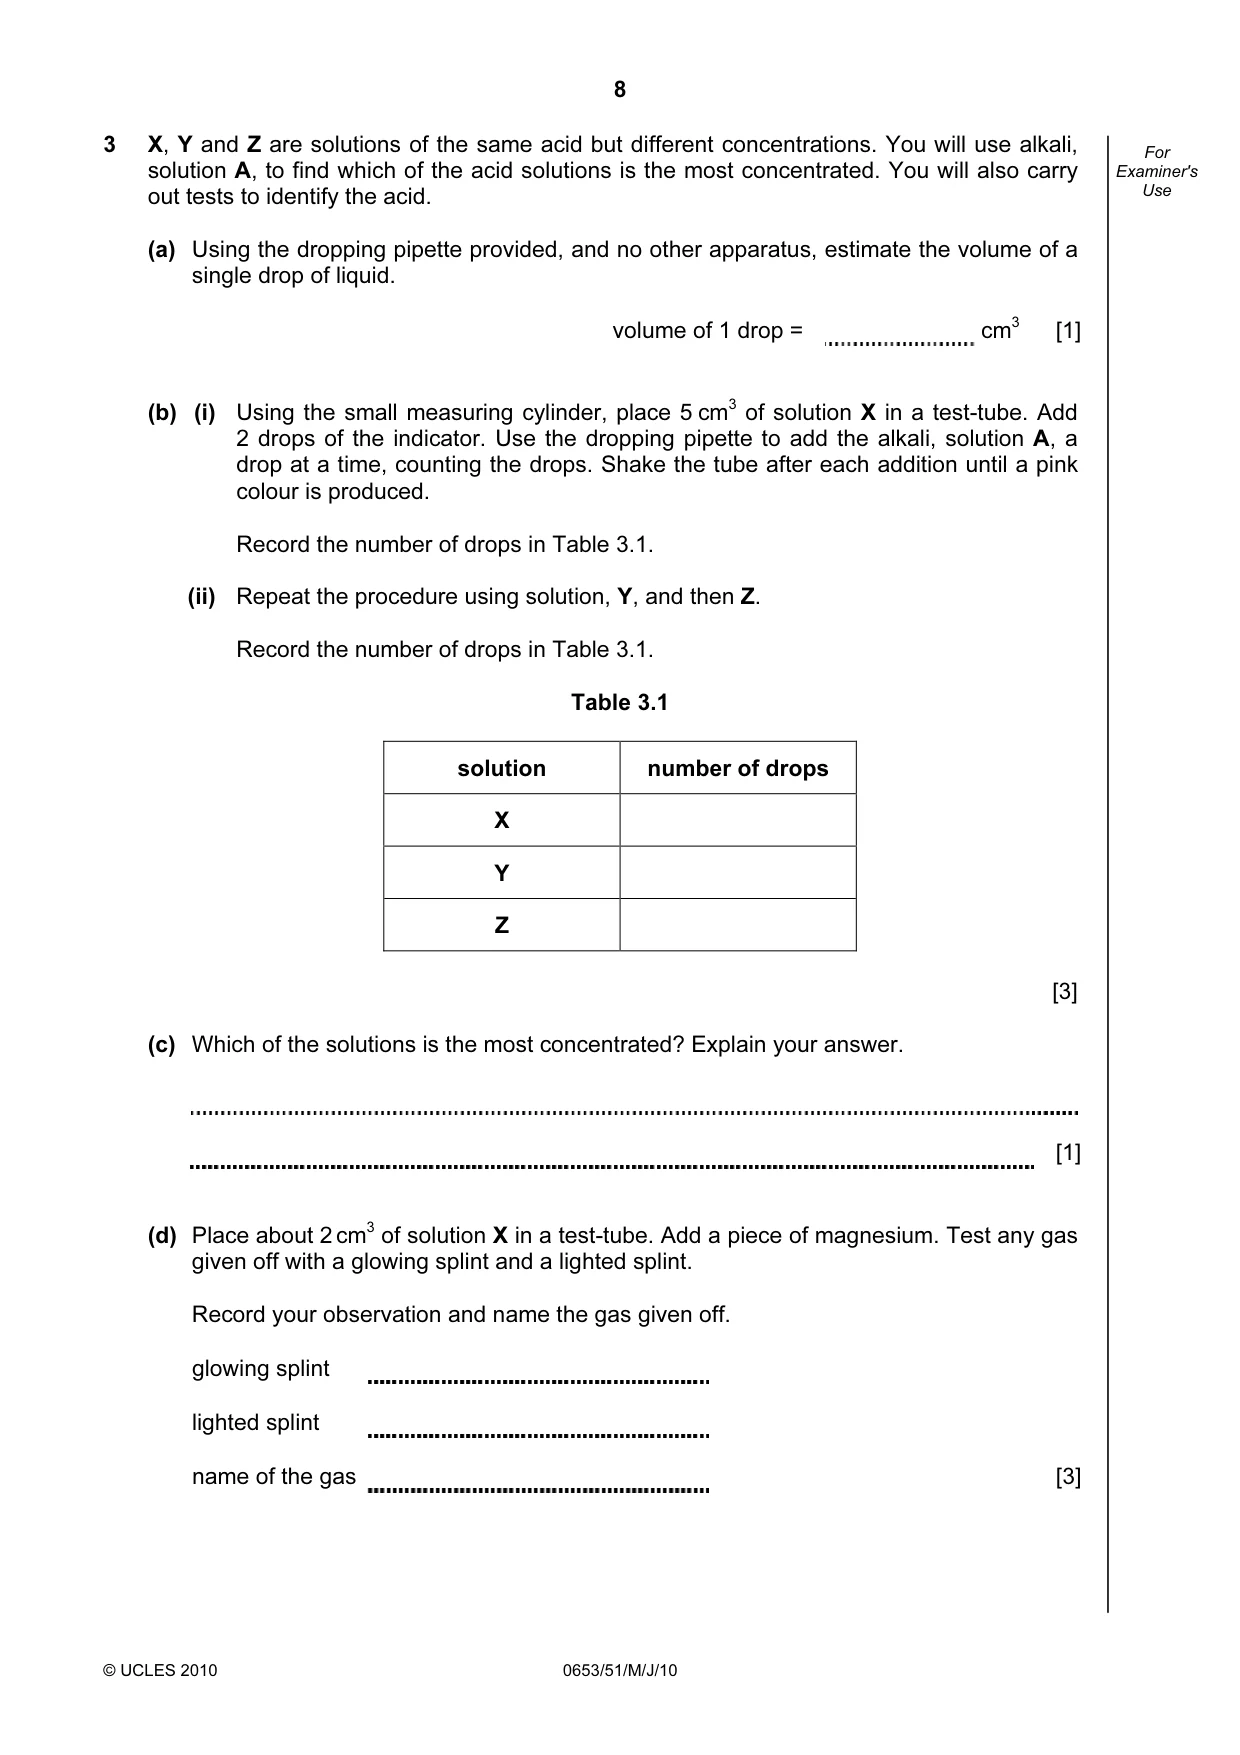
8 © UCLES 2010 0653/51/M/J/10 For Examiner's Use 3 X, Y and Z are solutions of the same acid but different concentrations. You will use alkali, solution A, to find which of the acid solutions is the most concentrated. You will also carry out tests to identify the acid. (a) Using the dropping pipette provided, and no other apparatus, estimate the volume of a single drop of liquid. volume of 1 drop = cm3 [1] (b) (i) Using the small measuring cylinder, place 5 cm3 of solution X in a test-tube. Add 2 drops of the indicator. Use the dropping pipette to add the alkali, solution A, a drop at a time, counting the drops. Shake the tube after each addition until a pink colour is produced. Record the number of drops in Table 3.1. (ii) Repeat the procedure using solution, Y, and then Z. Record the number of drops in Table 3.1. Table 3.1 solution number of drops X Y Z [3] (c) Which of the solutions is the most concentrated? Explain your answer. [1] (d) Place about 2 cm3 of solution X in a test-tube. Add a piece of magnesium. Test any gas given off with a glowing splint and a lighted splint. Record your observation and name the gas given off. glowing splint lighted splint name of the gas [3]
Question paper, page 9
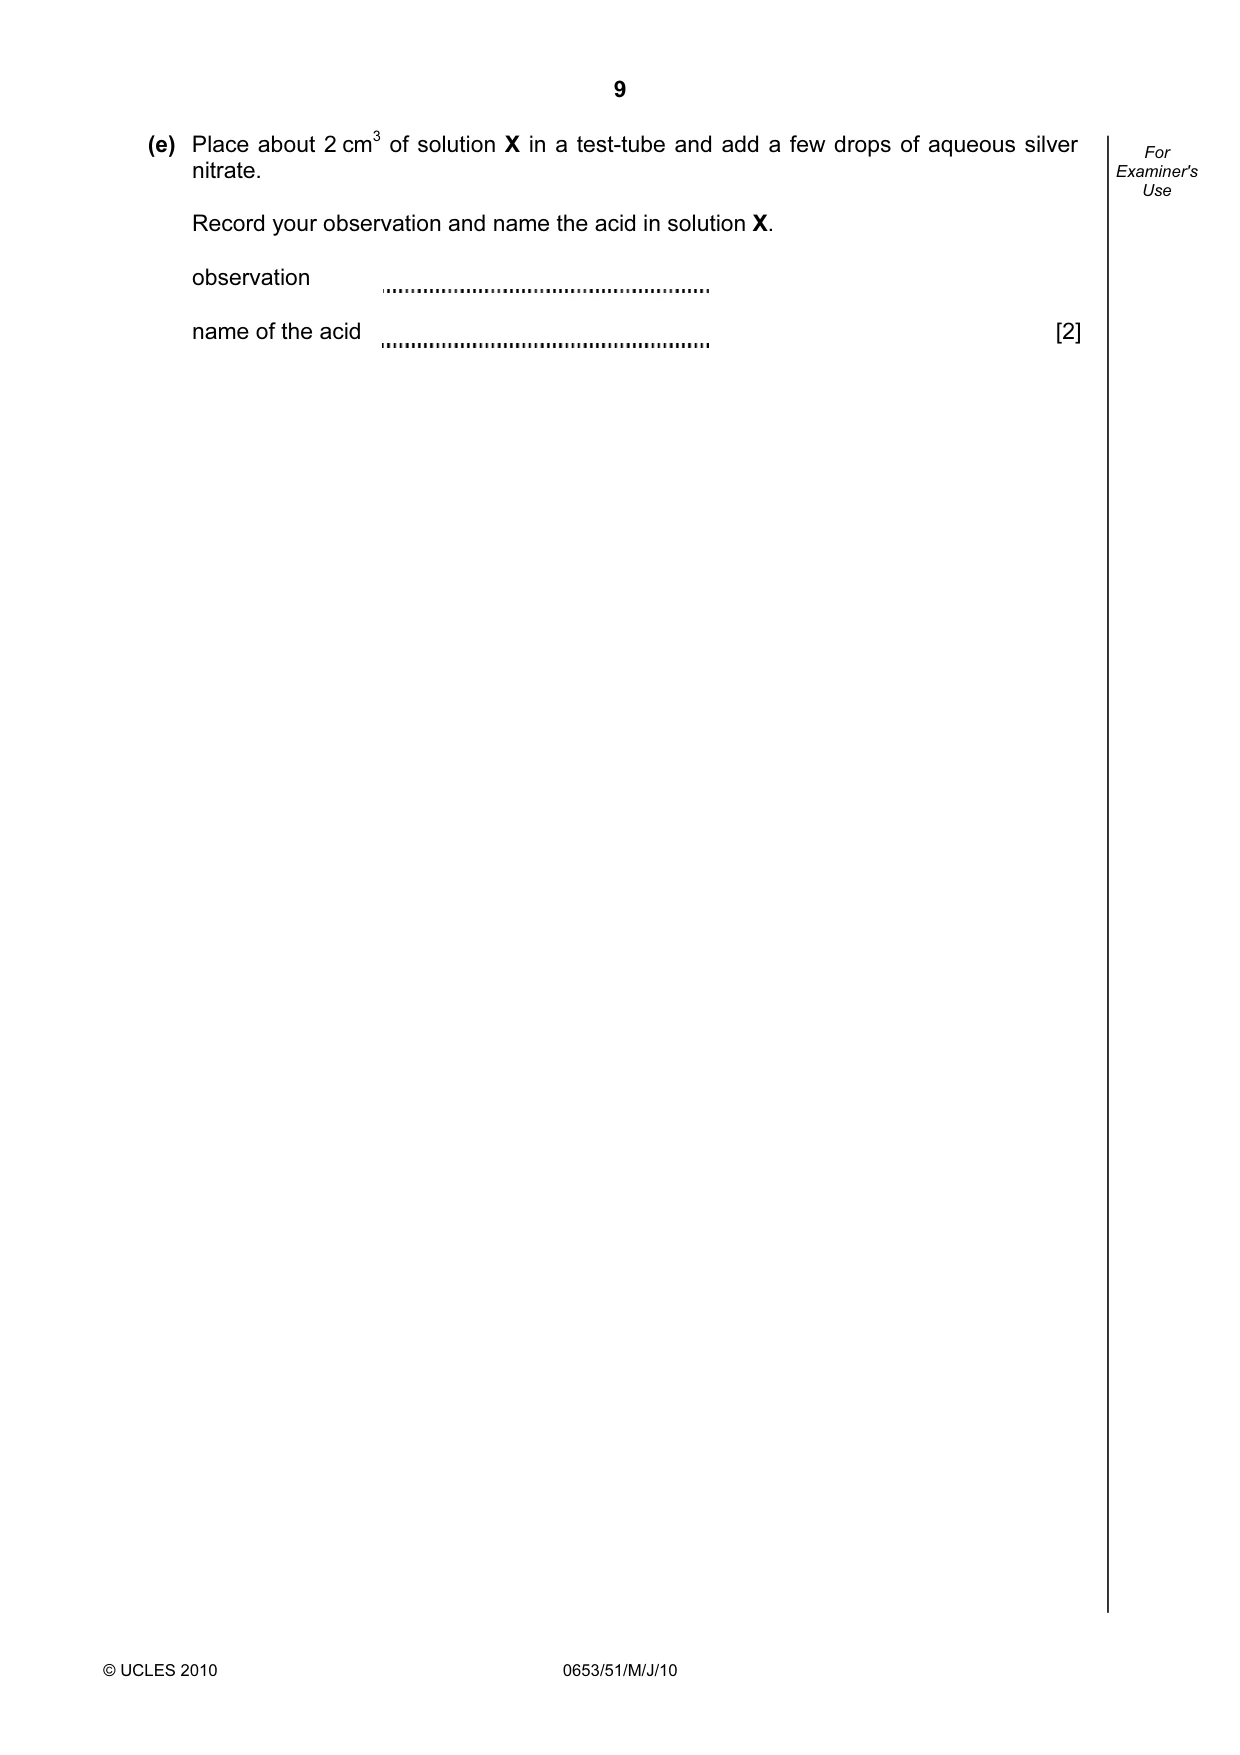
9 © UCLES 2010 0653/51/M/J/10 For Examiner's Use (e) Place about 2 cm3 of solution X in a test-tube and add a few drops of aqueous silver nitrate. Record your observation and name the acid in solution X. observation name of the acid [2]
Question paper, page 10
10 © UCLES 2010 0653/51/M/J/10 BLANK PAGE
Question paper, page 11
11 © UCLES 2010 0653/51/M/J/10 BLANK PAGE
Question paper, page 12
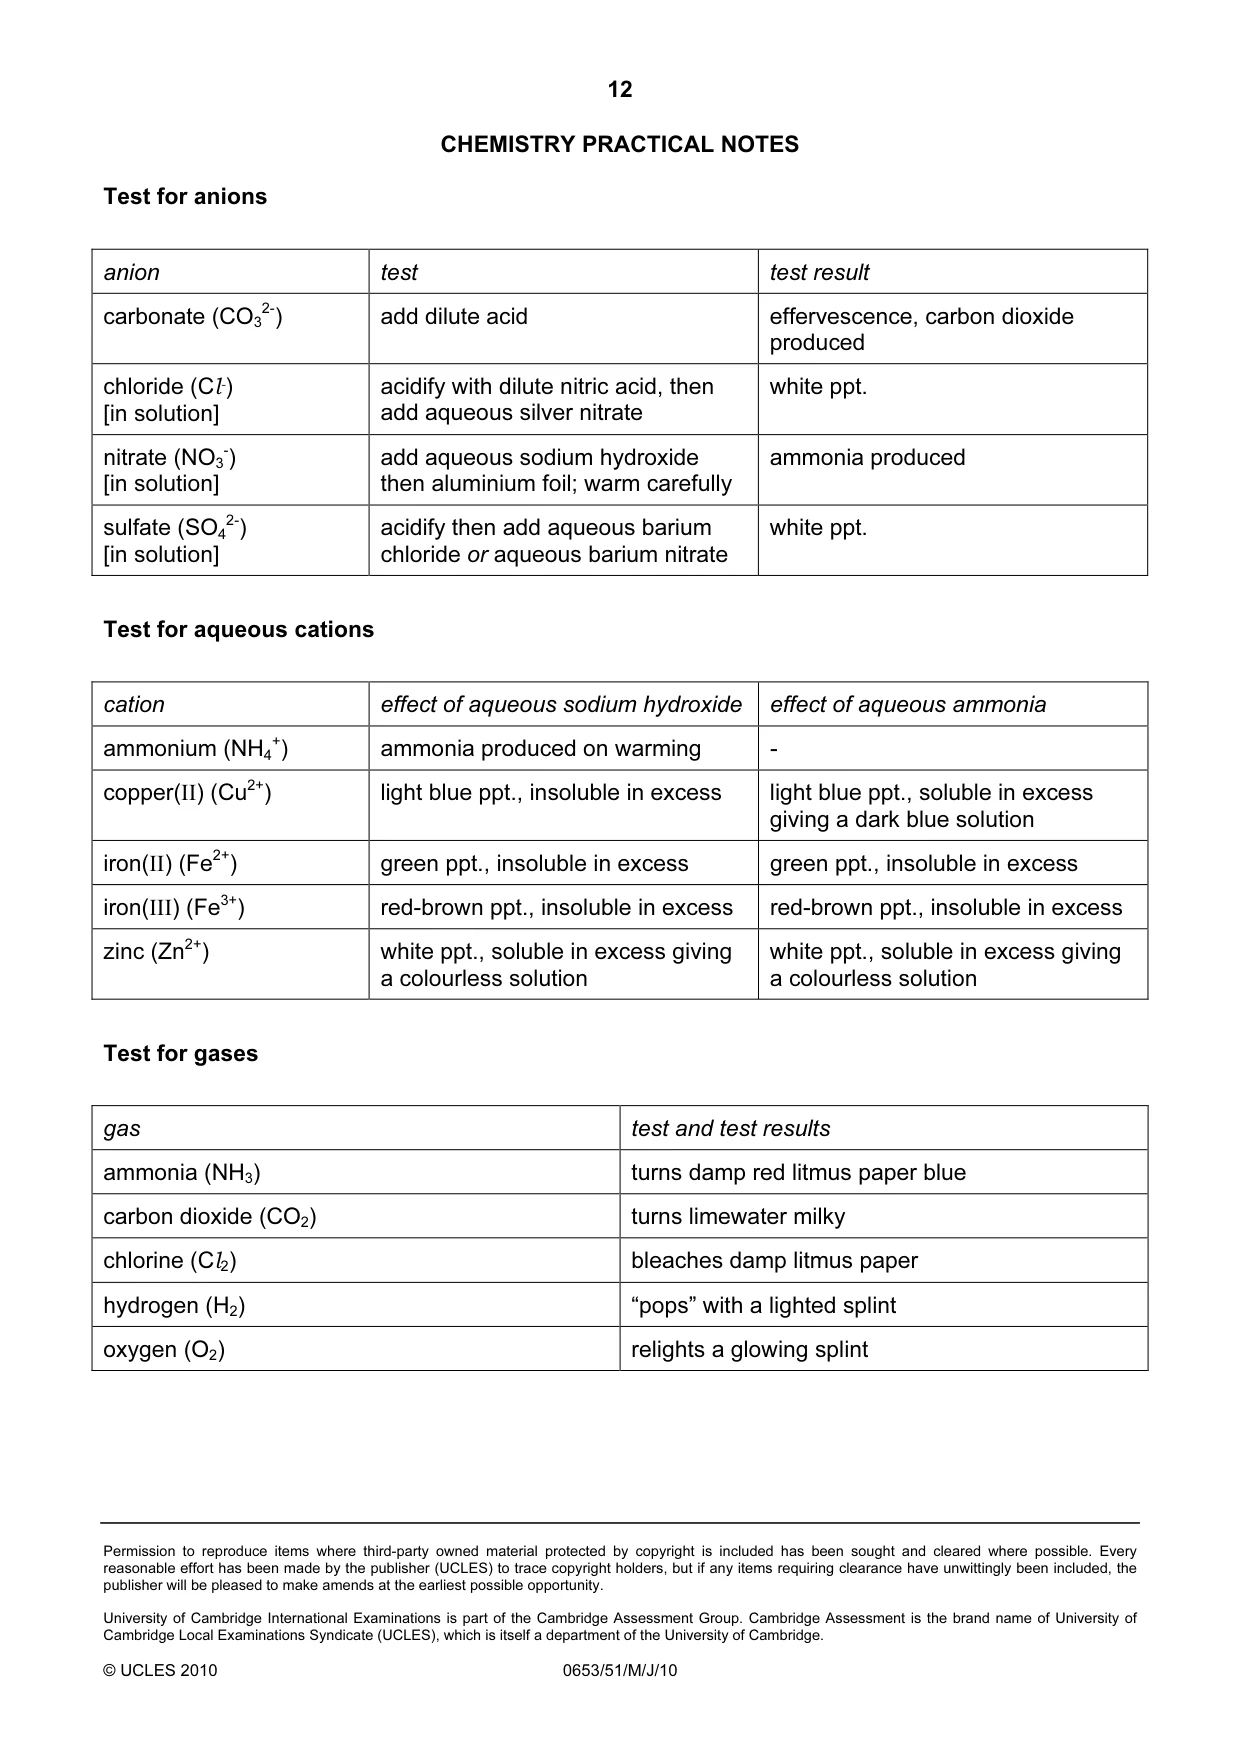
12 Permission to reproduce items where third-party owned material protected by copyright is included has been sought and cleared where possible. Every reasonable effort has been made by the publisher (UCLES) to trace copyright holders, but if any items requiring clearance have unwittingly been included, the publisher will be pleased to make amends at the earliest possible opportunity. University of Cambridge International Examinations is part of the Cambridge Assessment Group. Cambridge Assessment is the brand name of University of Cambridge Local Examinations Syndicate (UCLES), which is itself a department of the University of Cambridge. © UCLES 2010 0653/51/M/J/10 CHEMISTRY PRACTICAL NOTES Test for anions anion test test result carbonate (CO3 2-) add dilute acid effervescence, carbon dioxide produced chloride (Cl-) [in solution] acidify with dilute nitric acid, then add aqueous silver nitrate white ppt. nitrate (NO3 -) [in solution] add aqueous sodium hydroxide then aluminium foil; warm carefully ammonia produced sulfate (SO4 2-) [in solution] acidify then add aqueous barium chloride or aqueous barium nitrate white ppt. Test for aqueous cations cation effect of aqueous sodium hydroxide effect of aqueous ammonia ammonium (NH4 +) ammonia produced on warming - copper(II) (Cu2+) light blue ppt., insoluble in excess light blue ppt., soluble in excess giving a dark blue solution iron(II) (Fe2+) green ppt., insoluble in excess green ppt., insoluble in excess iron(III) (Fe3+) red-brown ppt., insoluble in excess red-brown ppt., insoluble in excess zinc (Zn2+) white ppt., soluble in excess giving a colourless solution white ppt., soluble in excess giving a colourless solution Test for gases gas test and test results ammonia (NH3) turns damp red litmus paper blue carbon dioxide (CO2) turns limewater milky chlorine (Cl2) bleaches damp litmus paper hydrogen (H2) “pops” with a lighted splint oxygen (O2) relights a glowing splint
Mark scheme, page 1
UNIVERSITY OF CAMBRIDGE INTERNATIONAL EXAMINATIONS International General Certificate of Secondary Education MARK SCHEME for the May/June 2010 question paper for the guidance of teachers 0653 COMBINED SCIENCE 0653/51 Paper 51 (Practical Test), maximum raw mark 30 This mark scheme is published as an aid to teachers and candidates, to indicate the requirements of the examination. It shows the basis on which Examiners were instructed to award marks. It does not indicate the details of the discussions that took place at an Examiners’ meeting before marking began, which would have considered the acceptability of alternative answers. Mark schemes must be read in conjunction with the question papers and the report on the examination. • CIE will not enter into discussions or correspondence in connection with these mark schemes. CIE is publishing the mark schemes for the May/June 2010 question papers for most IGCSE, GCE Advanced Level and Advanced Subsidiary Level syllabuses and some Ordinary Level syllabuses. www.XtremePapers.com
Mark scheme, page 2
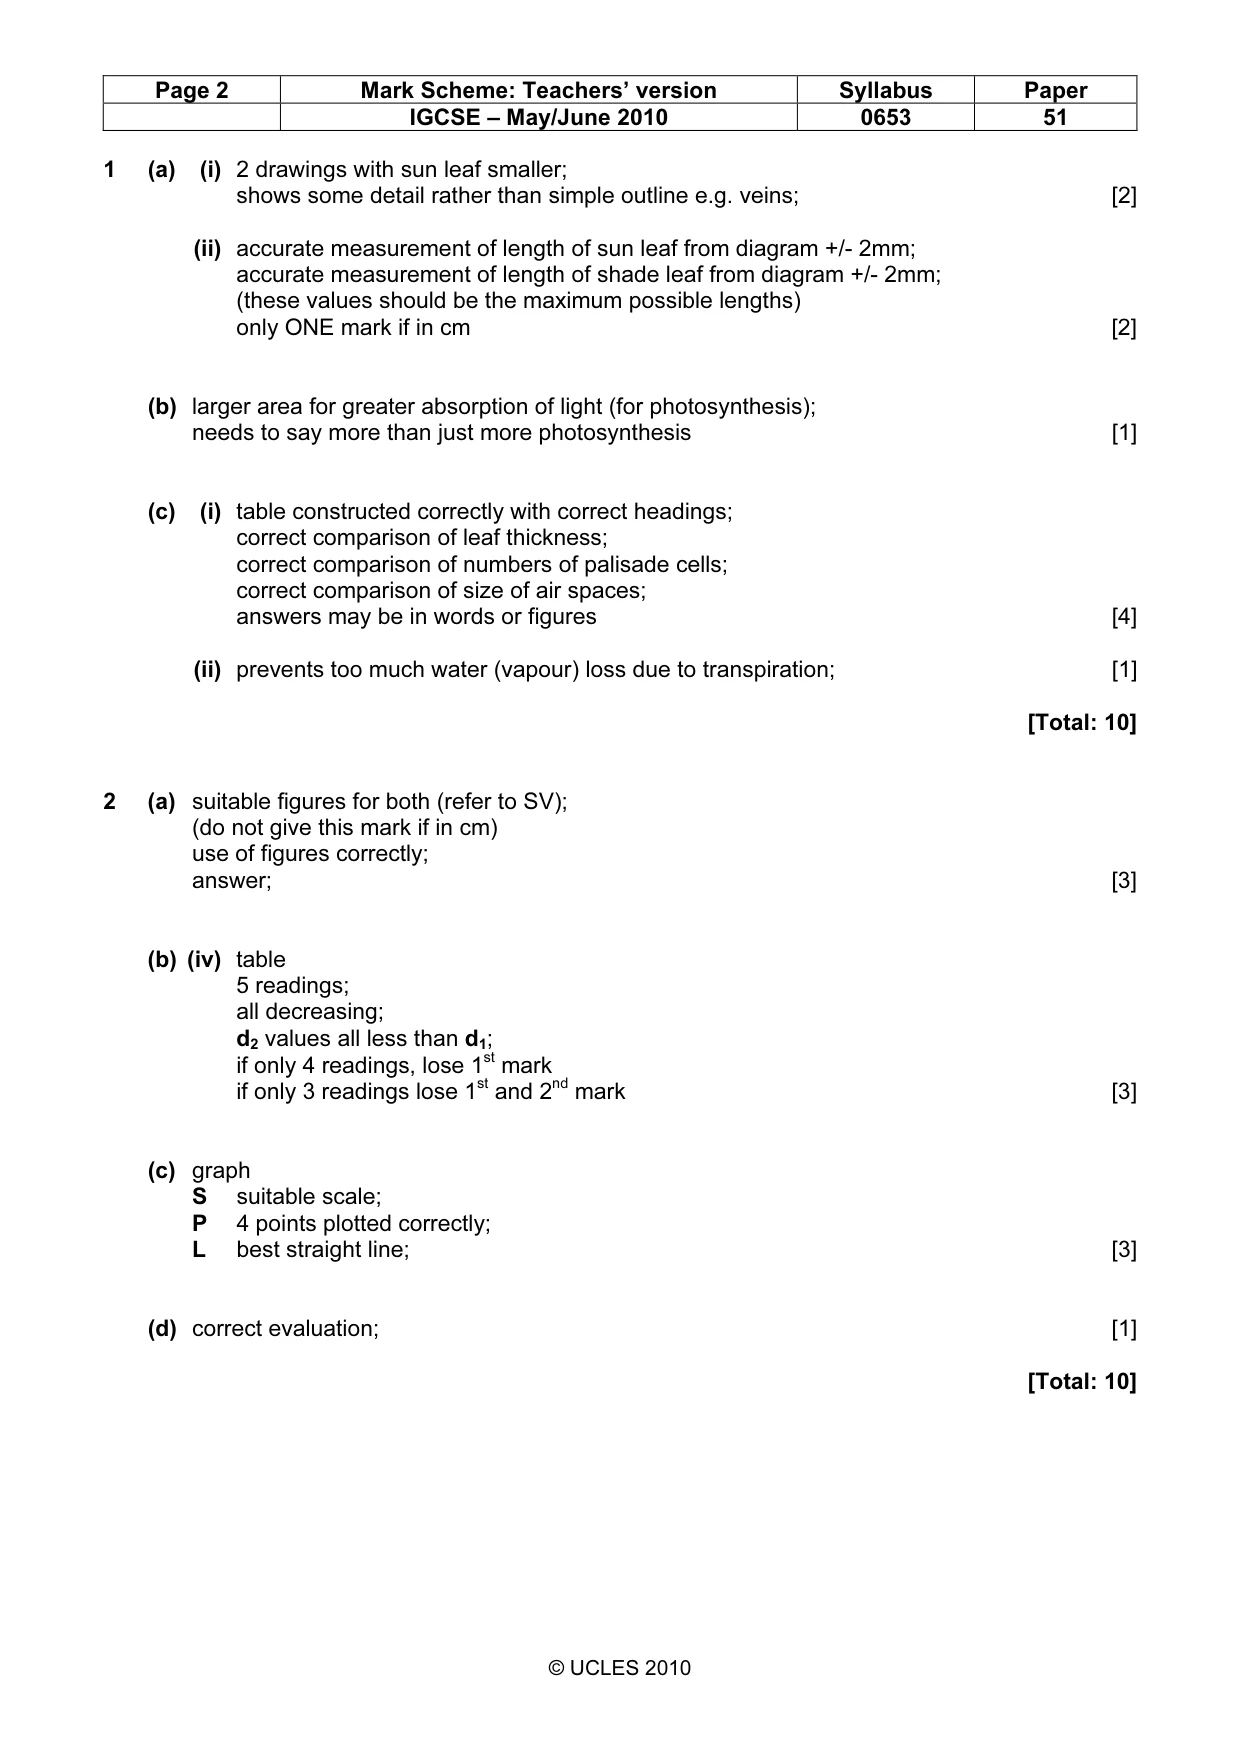
Page 2 Mark Scheme: Teachers’ version Syllabus Paper IGCSE – May/June 2010 0653 51 © UCLES 2010 1 (a) (i) 2 drawings with sun leaf smaller; shows some detail rather than simple outline e.g. veins; [2] (ii) accurate measurement of length of sun leaf from diagram +/- 2mm; accurate measurement of length of shade leaf from diagram +/- 2mm; (these values should be the maximum possible lengths) only ONE mark if in cm [2] (b) larger area for greater absorption of light (for photosynthesis); needs to say more than just more photosynthesis [1] (c) (i) table constructed correctly with correct headings; correct comparison of leaf thickness; correct comparison of numbers of palisade cells; correct comparison of size of air spaces; answers may be in words or figures [4] (ii) prevents too much water (vapour) loss due to transpiration; [1] [Total: 10] 2 (a) suitable figures for both (refer to SV); (do not give this mark if in cm) use of figures correctly; answer; [3] (b) (iv) table 5 readings; all decreasing; d2 values all less than d1; if only 4 readings, lose 1st mark if only 3 readings lose 1st and 2nd mark [3] (c) graph S suitable scale; P 4 points plotted correctly; L best straight line; [3] (d) correct evaluation; [1] [Total: 10]
Mark scheme, page 3
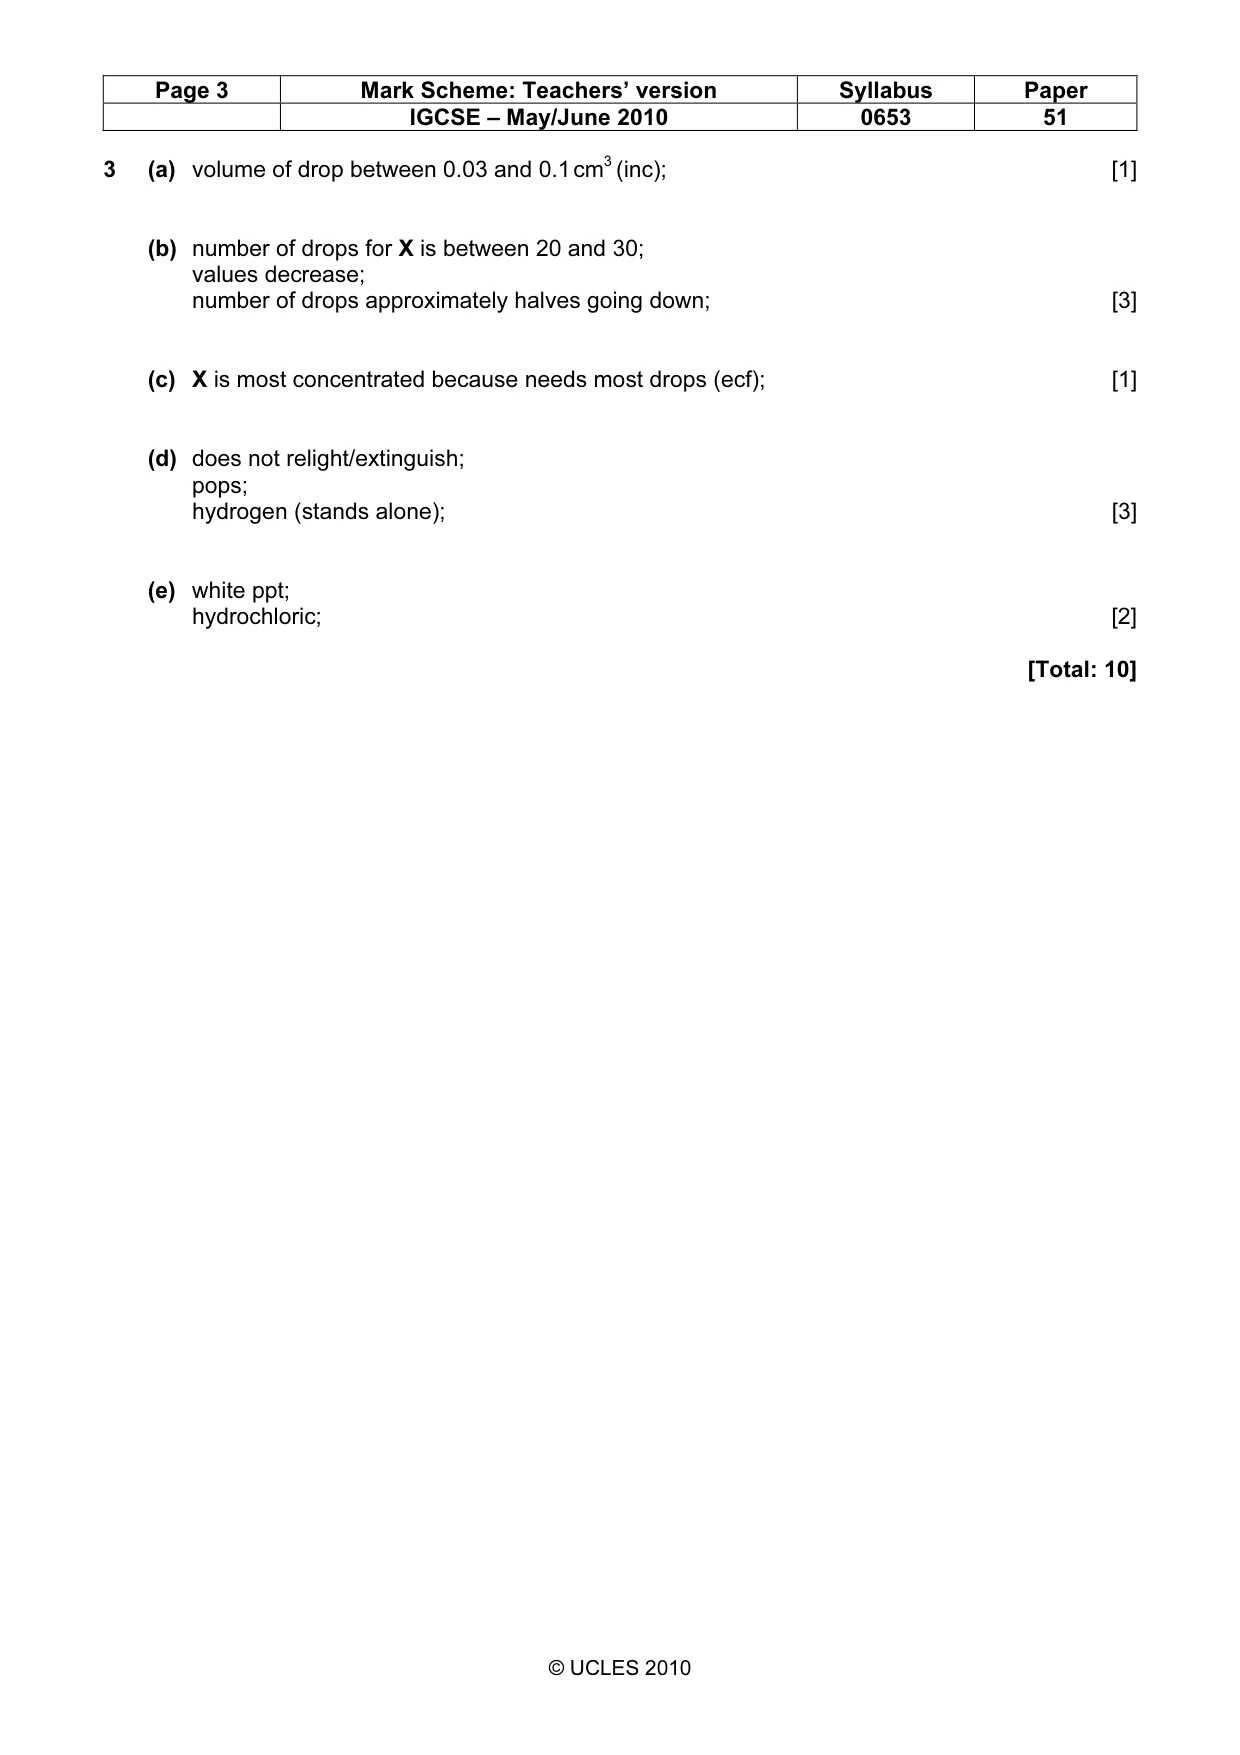
Page 3 Mark Scheme: Teachers’ version Syllabus Paper IGCSE – May/June 2010 0653 51 © UCLES 2010 3 (a) volume of drop between 0.03 and 0.1 cm3 (inc); [1] (b) number of drops for X is between 20 and 30; values decrease; number of drops approximately halves going down; [3] (c) X is most concentrated because needs most drops (ecf); [1] (d) does not relight/extinguish; pops; hydrogen (stands alone); [3] (e) white ppt; hydrochloric; [2] [Total: 10]
What you needed in this session
Cambridge’s own grade thresholds for 2010 May/June, Paper 5 · Variant 1. A higher threshold means an easier paper — the bar moves with how the cohort did.