Cambridge IGCSE Science - Combined 0653 — 2004 Oct/Nov Paper 6 · Variant 1
0653/61/O/N/04
The question paper and its mark scheme, free to read here and free to download. This is Cambridge’s own paper, exactly as it was sat.
Question paper16 pages

Mark scheme6 pages
Answers below. Sit the paper first if you are practising.
Paper as text
Question paper, page 1
This document consists of 15 printed pages and 1 blank page. SP (SM/GR) S65709/4 © UCLES 2004 [Turn over UNIVERSITY OF CAMBRIDGE INTERNATIONAL EXAMINATIONS International General Certificate of Secondary Education COMBINED SCIENCE 0653/06 CO-ORDINATED SCIENCES 0654/06 Paper 6 Alternative to Practical October/November 2004 1 hour Candidates answer on the Question Paper. No Additional Materials are required. READ THESE INSTRUCTIONS FIRST Write your Centre number, candidate number and name on all the work you hand in. Write in dark blue or black pen in the spaces provided on the Question Paper. You may use a soft pencil for any diagrams, graphs or rough working. Do not use staples, paper clips, highlighters, glue or correction fluid. Answer all questions. At the end of the examination, fasten all your work securely together. The number of marks is given in brackets [ ] at the end of each question or part question. Centre Number Candidate Number Name If you have been given a label, look at the details. If any details are incorrect or missing, please fill in your correct details in the space given at the top of this page. Stick your personal label here, if provided. For Examiner’s Use 1 2 3 4 5 6 Total www.XtremePapers.com
Question paper, page 3
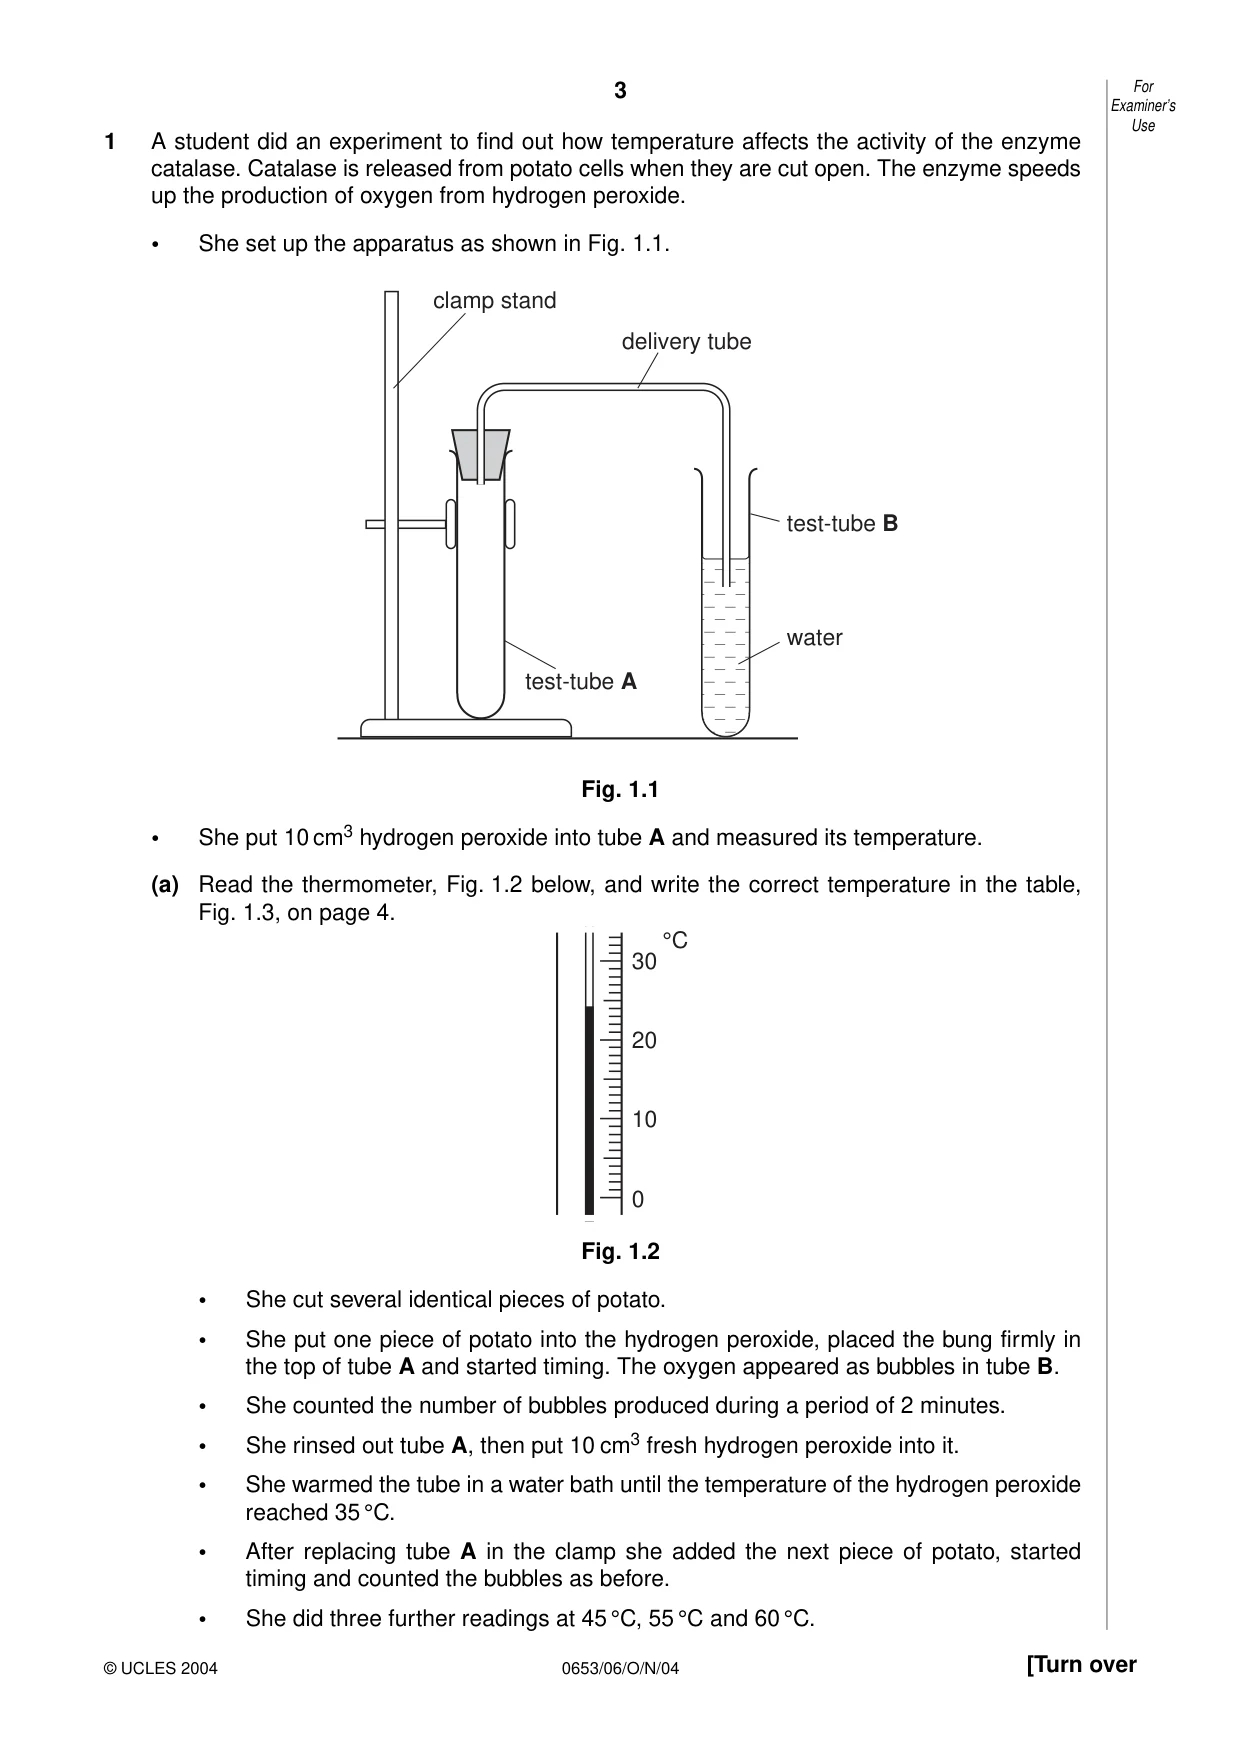
3 0653/06/O/N/04 [Turn over 1 A student did an experiment to find out how temperature affects the activity of the enzyme catalase. Catalase is released from potato cells when they are cut open. The enzyme speeds up the production of oxygen from hydrogen peroxide. • She set up the apparatus as shown in Fig. 1.1. Fig. 1.1 • She put 10 cm3 hydrogen peroxide into tube A and measured its temperature. (a) Read the thermometer, Fig. 1.2 below, and write the correct temperature in the table, Fig. 1.3, on page 4. Fig. 1.2 • She cut several identical pieces of potato. • She put one piece of potato into the hydrogen peroxide, placed the bung firmly in the top of tube A and started timing. The oxygen appeared as bubbles in tube B. • She counted the number of bubbles produced during a period of 2 minutes. • She rinsed out tube A, then put 10 cm3 fresh hydrogen peroxide into it. • She warmed the tube in a water bath until the temperature of the hydrogen peroxide reached 35 °C. • After replacing tube A in the clamp she added the next piece of potato, started timing and counted the bubbles as before. • She did three further readings at 45 °C, 55 °C and 60 °C. 0 10 20 30 °C test-tube B test-tube A water delivery tube clamp stand For Examiner’s Use © UCLES 2004
Question paper, page 4
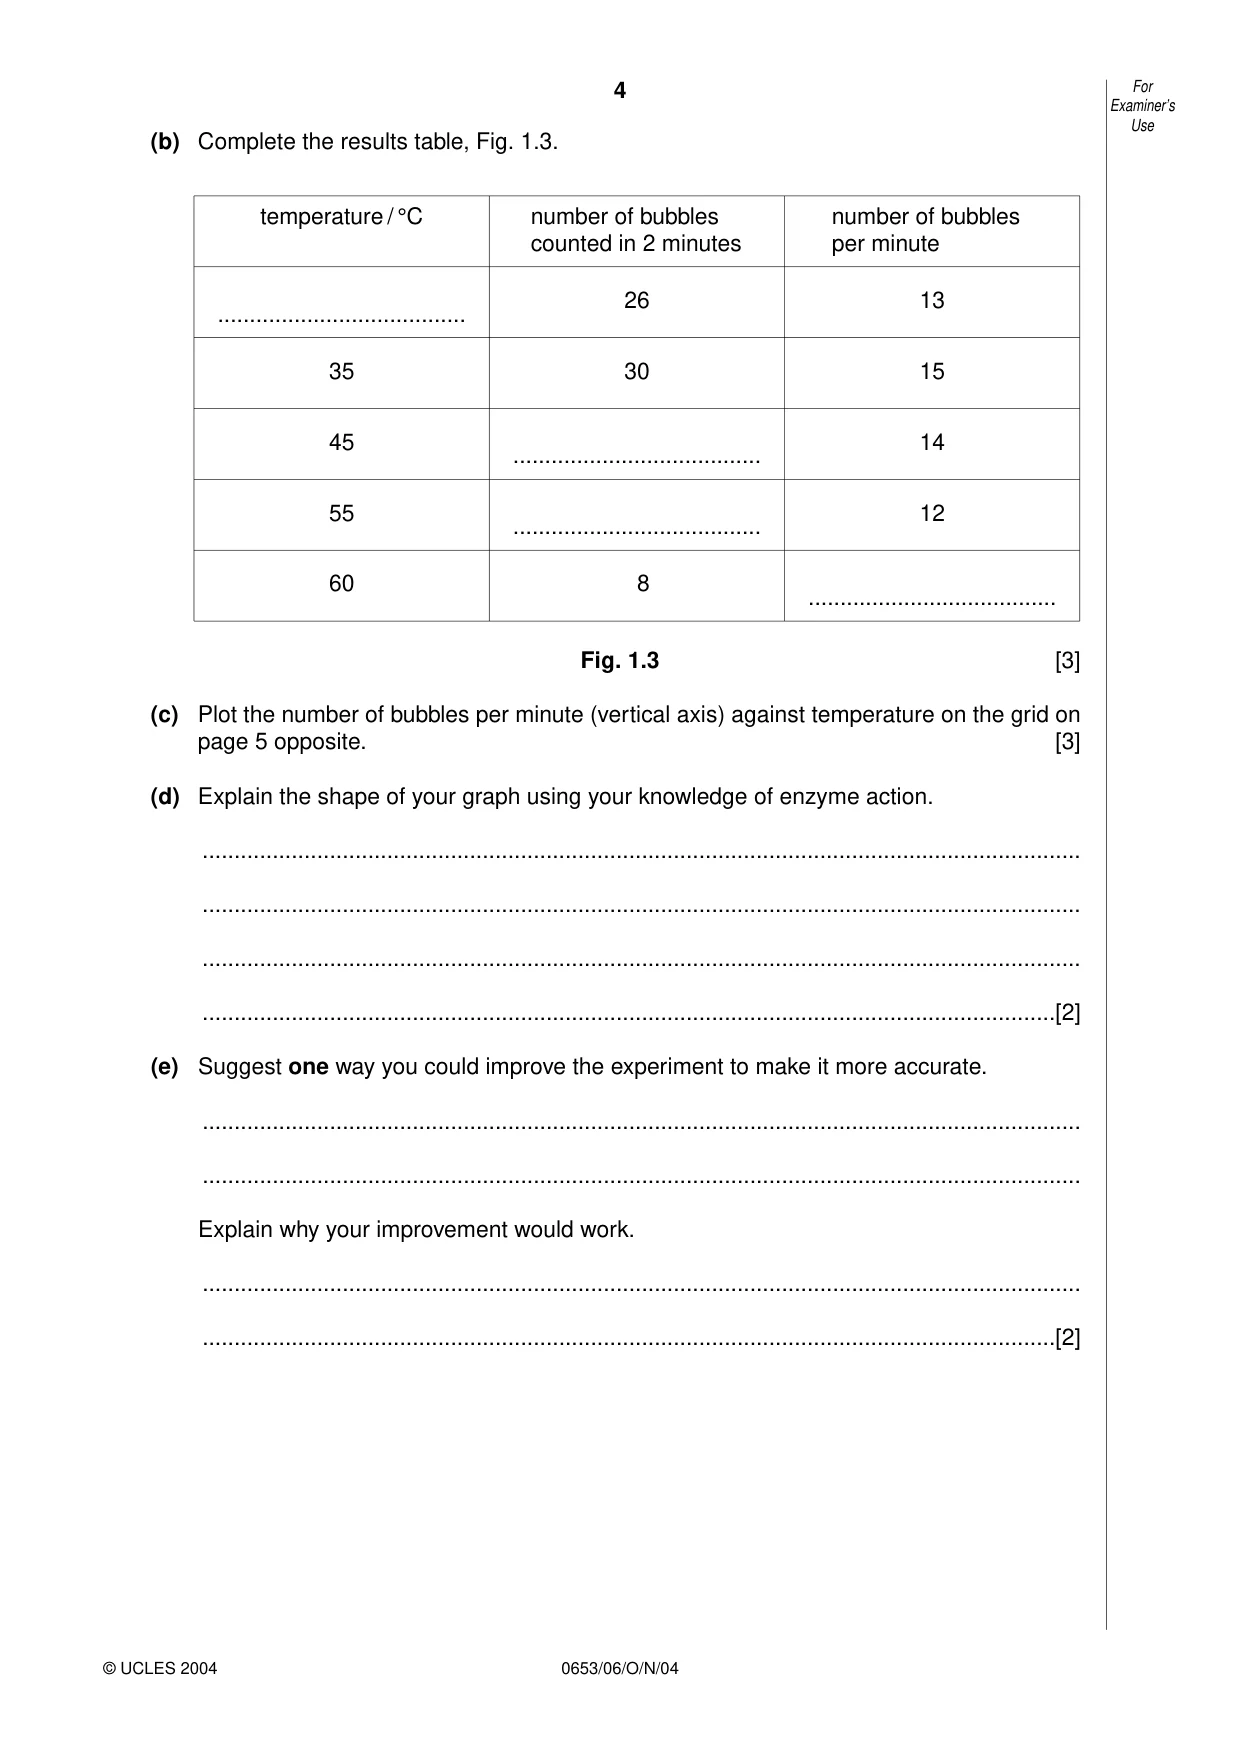
4 0653/06/O/N/04 (b) Complete the results table, Fig. 1.3. Fig. 1.3 [3] (c) Plot the number of bubbles per minute (vertical axis) against temperature on the grid on page 5 opposite. [3] (d) Explain the shape of your graph using your knowledge of enzyme action. … … … …[2] (e) Suggest one way you could improve the experiment to make it more accurate. … … Explain why your improvement would work. … …[2] For Examiner’s Use © UCLES 2004 temperature / °C … … … … 35 26 13 15 14 12 30 45 55 60 8 number of bubbles counted in 2 minutes number of bubbles per minute
Question paper, page 5
5 0653/06/O/N/04 [Turn over For Examiner’s Use © UCLES 2004
Question paper, page 6
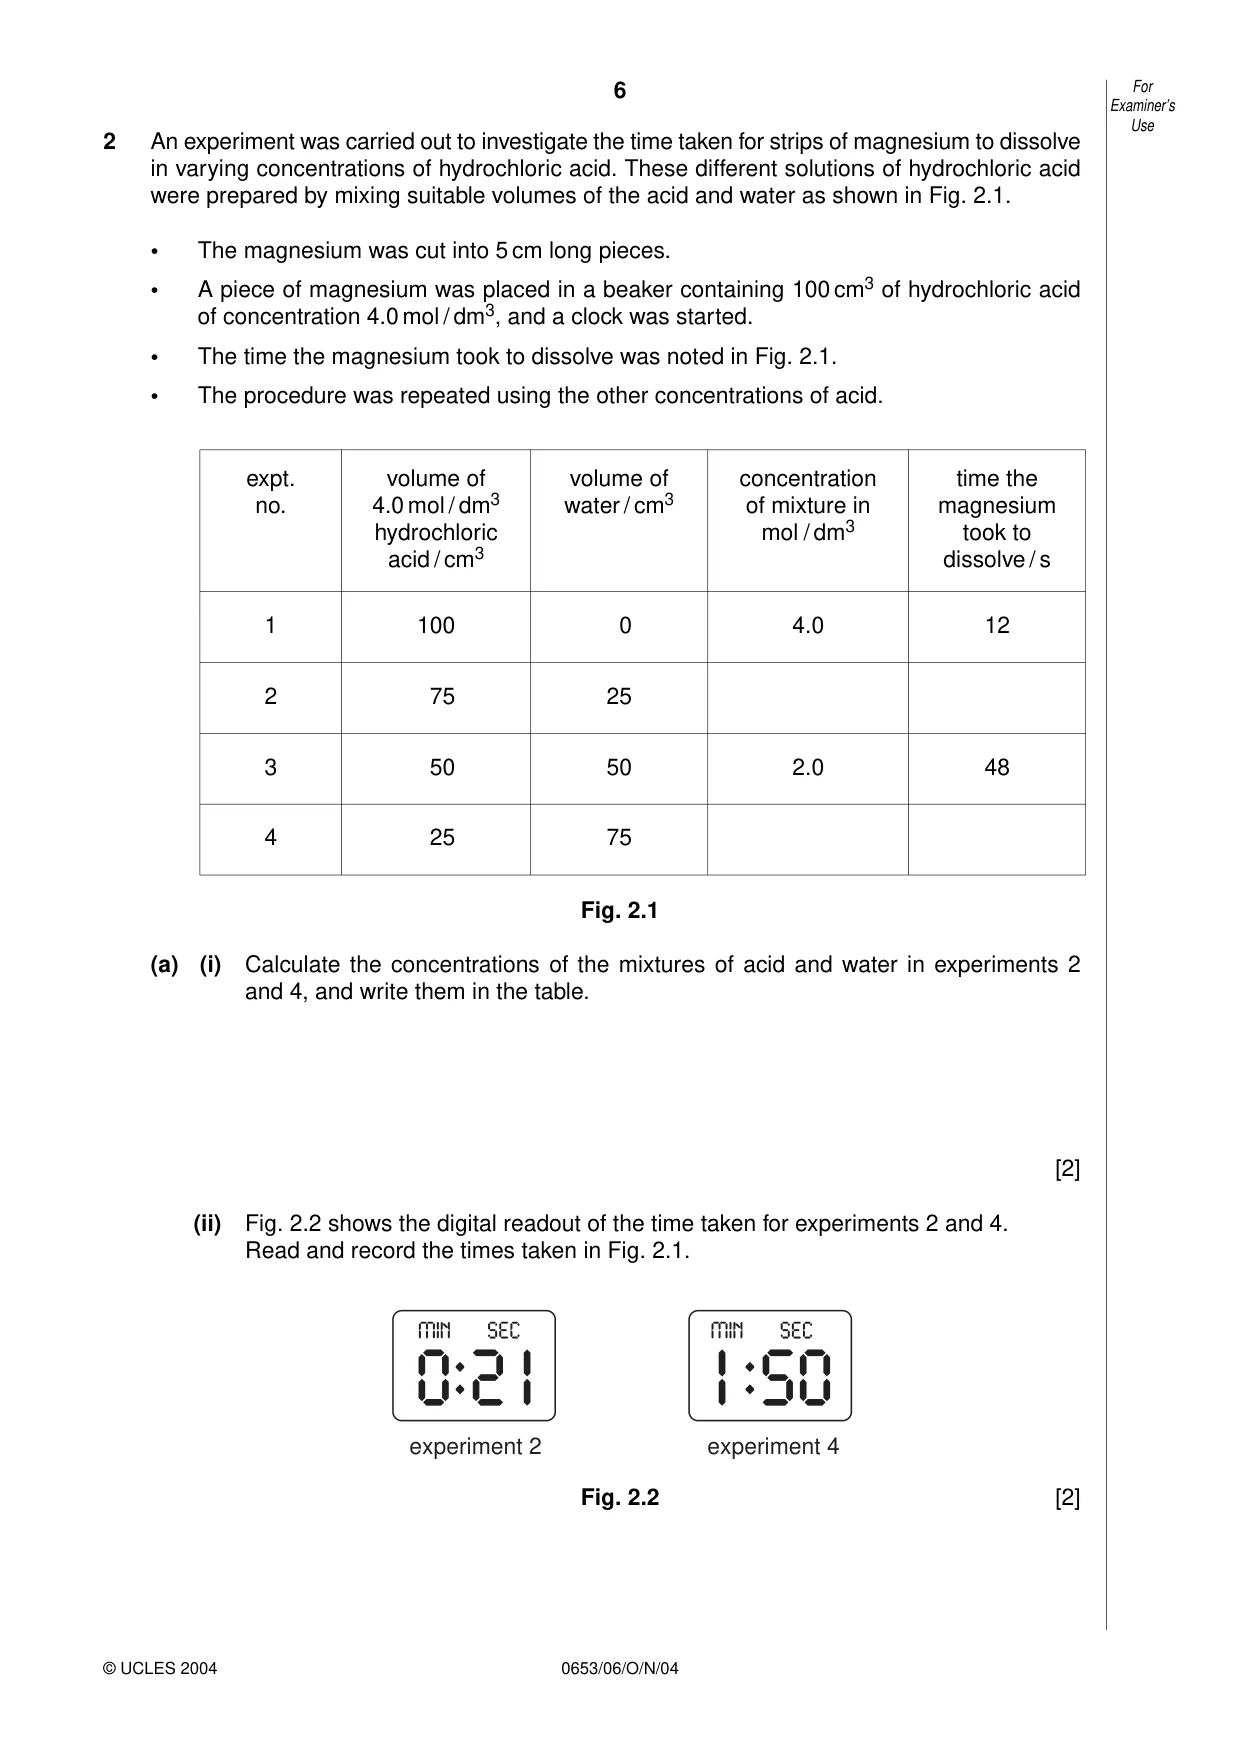
6 0653/06/O/N/04 2 An experiment was carried out to investigate the time taken for strips of magnesium to dissolve in varying concentrations of hydrochloric acid. These different solutions of hydrochloric acid were prepared by mixing suitable volumes of the acid and water as shown in Fig. 2.1. • The magnesium was cut into 5 cm long pieces. • A piece of magnesium was placed in a beaker containing 100 cm3 of hydrochloric acid of concentration 4.0 mol / dm3, and a clock was started. • The time the magnesium took to dissolve was noted in Fig. 2.1. • The procedure was repeated using the other concentrations of acid. Fig. 2.1 (a) (i) Calculate the concentrations of the mixtures of acid and water in experiments 2 and 4, and write them in the table. [2] (ii) Fig. 2.2 shows the digital readout of the time taken for experiments 2 and 4. Read and record the times taken in Fig. 2.1. Fig. 2.2 [2] experiment 2 experiment 4 For Examiner’s Use © UCLES 2004 expt. no. 1 100 0 4.0 12 48 2.0 25 50 75 75 50 25 2 3 4 volume of 4.0 mol / dm3 hydrochloric acid / cm3 volume of water / cm3 concentration of mixture in mol / dm3 time the magnesium took to dissolve / s
Question paper, page 7
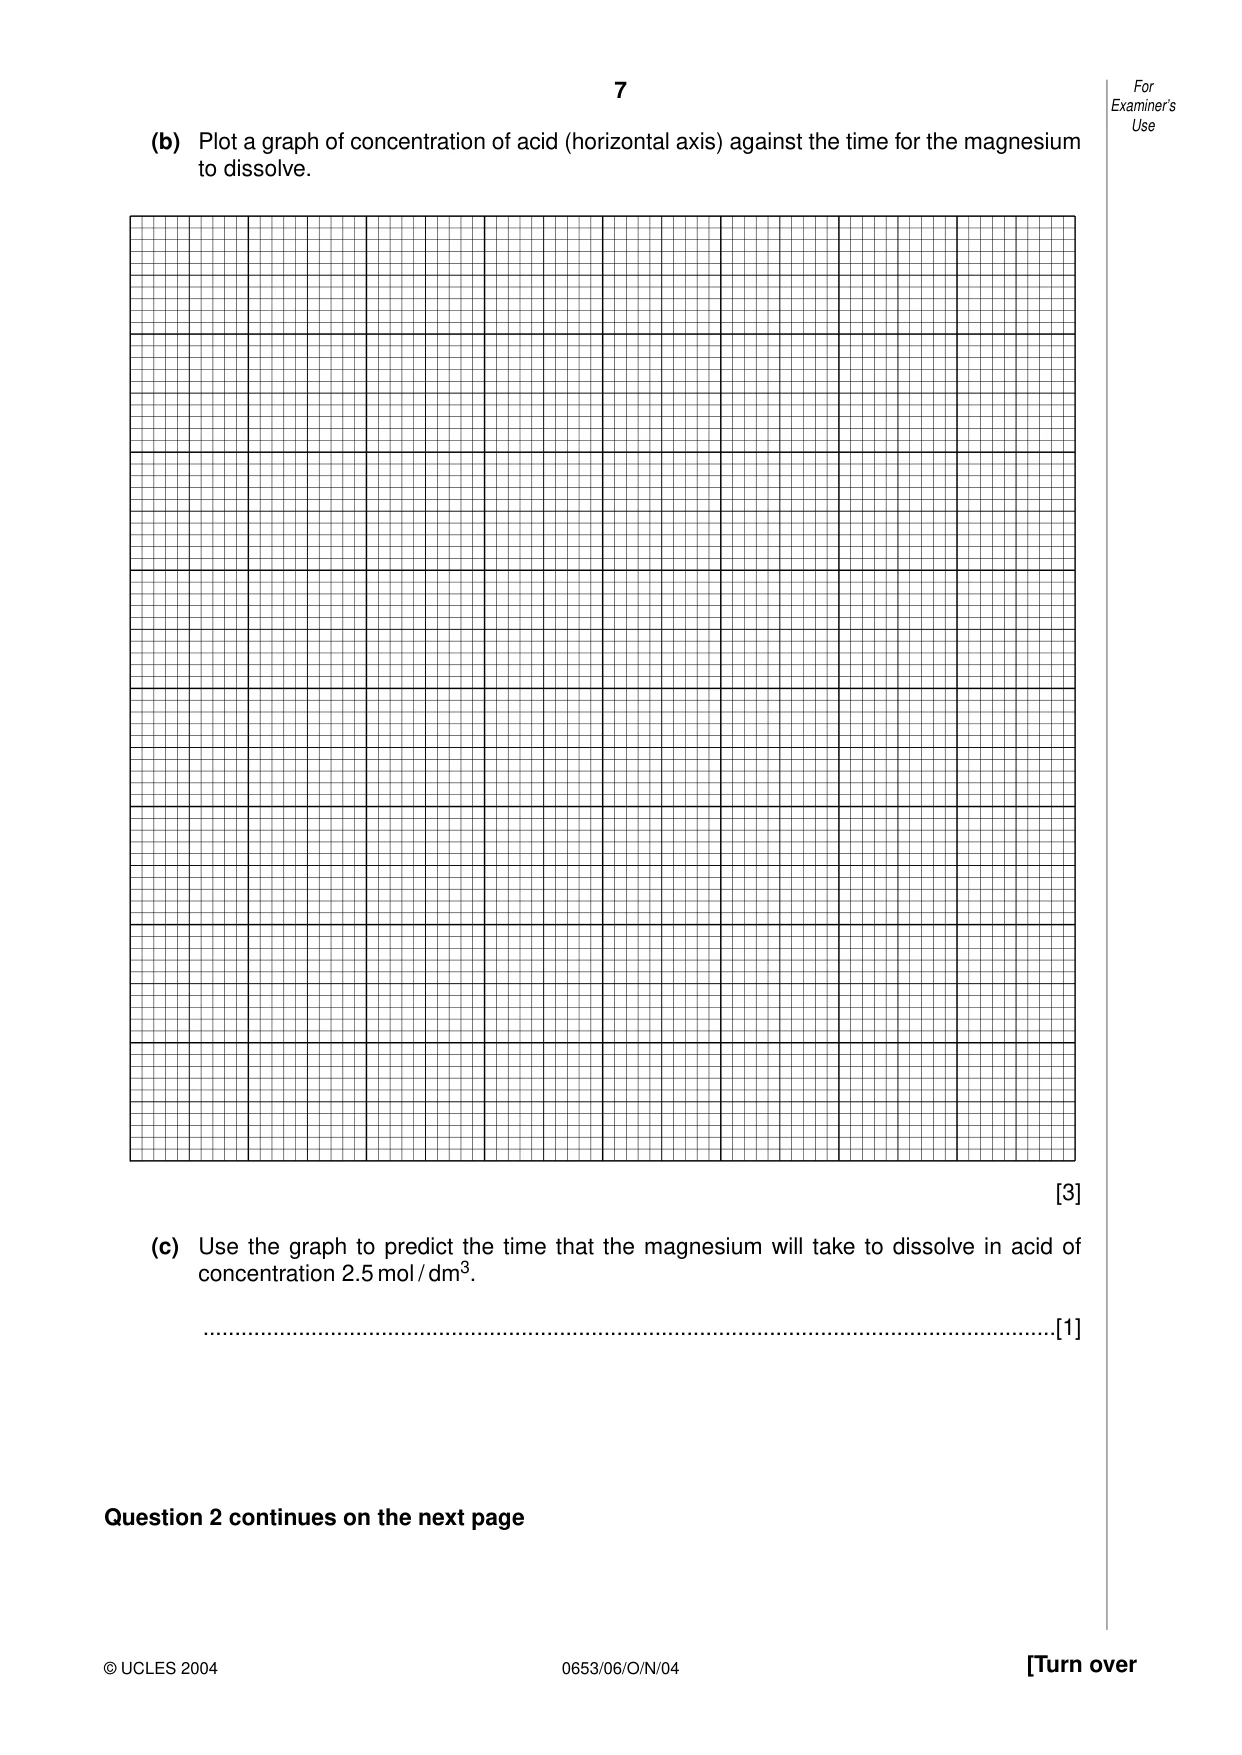
7 0653/06/O/N/04 [Turn over (b) Plot a graph of concentration of acid (horizontal axis) against the time for the magnesium to dissolve. [3] (c) Use the graph to predict the time that the magnesium will take to dissolve in acid of concentration 2.5 mol / dm3. …[1] Question 2 continues on the next page For Examiner’s Use © UCLES 2004
Question paper, page 8
8 0653/06/O/N/04 (d) A student read in a book that 0.1 g of magnesium produces 100 cm3 of hydrogen when it dissolves in acid. Draw a diagram of the apparatus you would use to test this statement. [2] For Examiner’s Use © UCLES 2004
Question paper, page 9
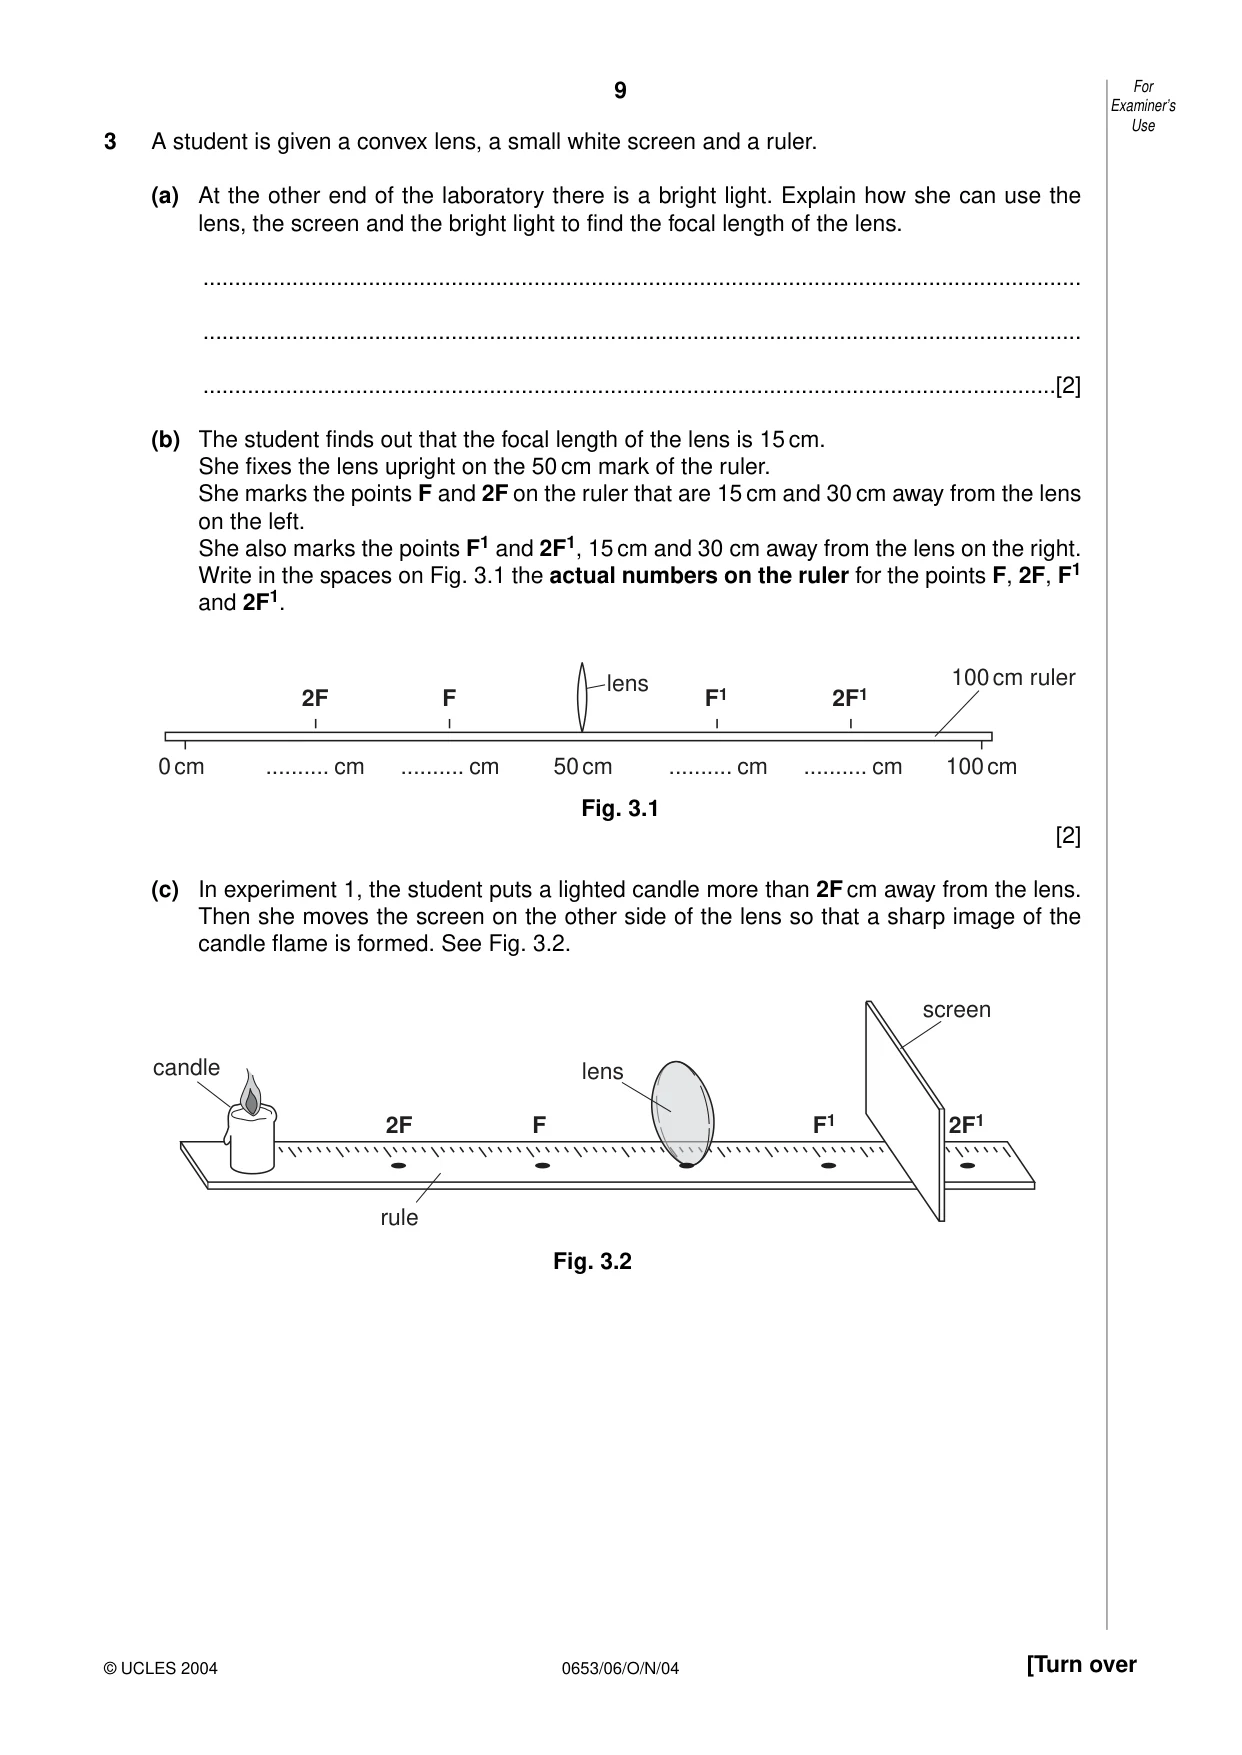
9 0653/06/O/N/04 [Turn over 3 A student is given a convex lens, a small white screen and a ruler. (a) At the other end of the laboratory there is a bright light. Explain how she can use the lens, the screen and the bright light to find the focal length of the lens. … … …[2] (b) The student finds out that the focal length of the lens is 15 cm. She fixes the lens upright on the 50 cm mark of the ruler. She marks the points F and 2F on the ruler that are 15 cm and 30 cm away from the lens on the left. She also marks the points F1 and 2F1, 15 cm and 30 cm away from the lens on the right. Write in the spaces on Fig. 3.1 the actual numbers on the ruler for the points F, 2F, F1 and 2F1. Fig. 3.1 [2] (c) In experiment 1, the student puts a lighted candle more than 2F cm away from the lens. Then she moves the screen on the other side of the lens so that a sharp image of the candle flame is formed. See Fig. 3.2. Fig. 3.2 lens rule screen candle 2F F F1 2F1 0 cm 100 cm 50 cm … cm 2F F lens 100 cm ruler F1 2F1 … cm … cm … cm For Examiner’s Use © UCLES 2004
Question paper, page 10
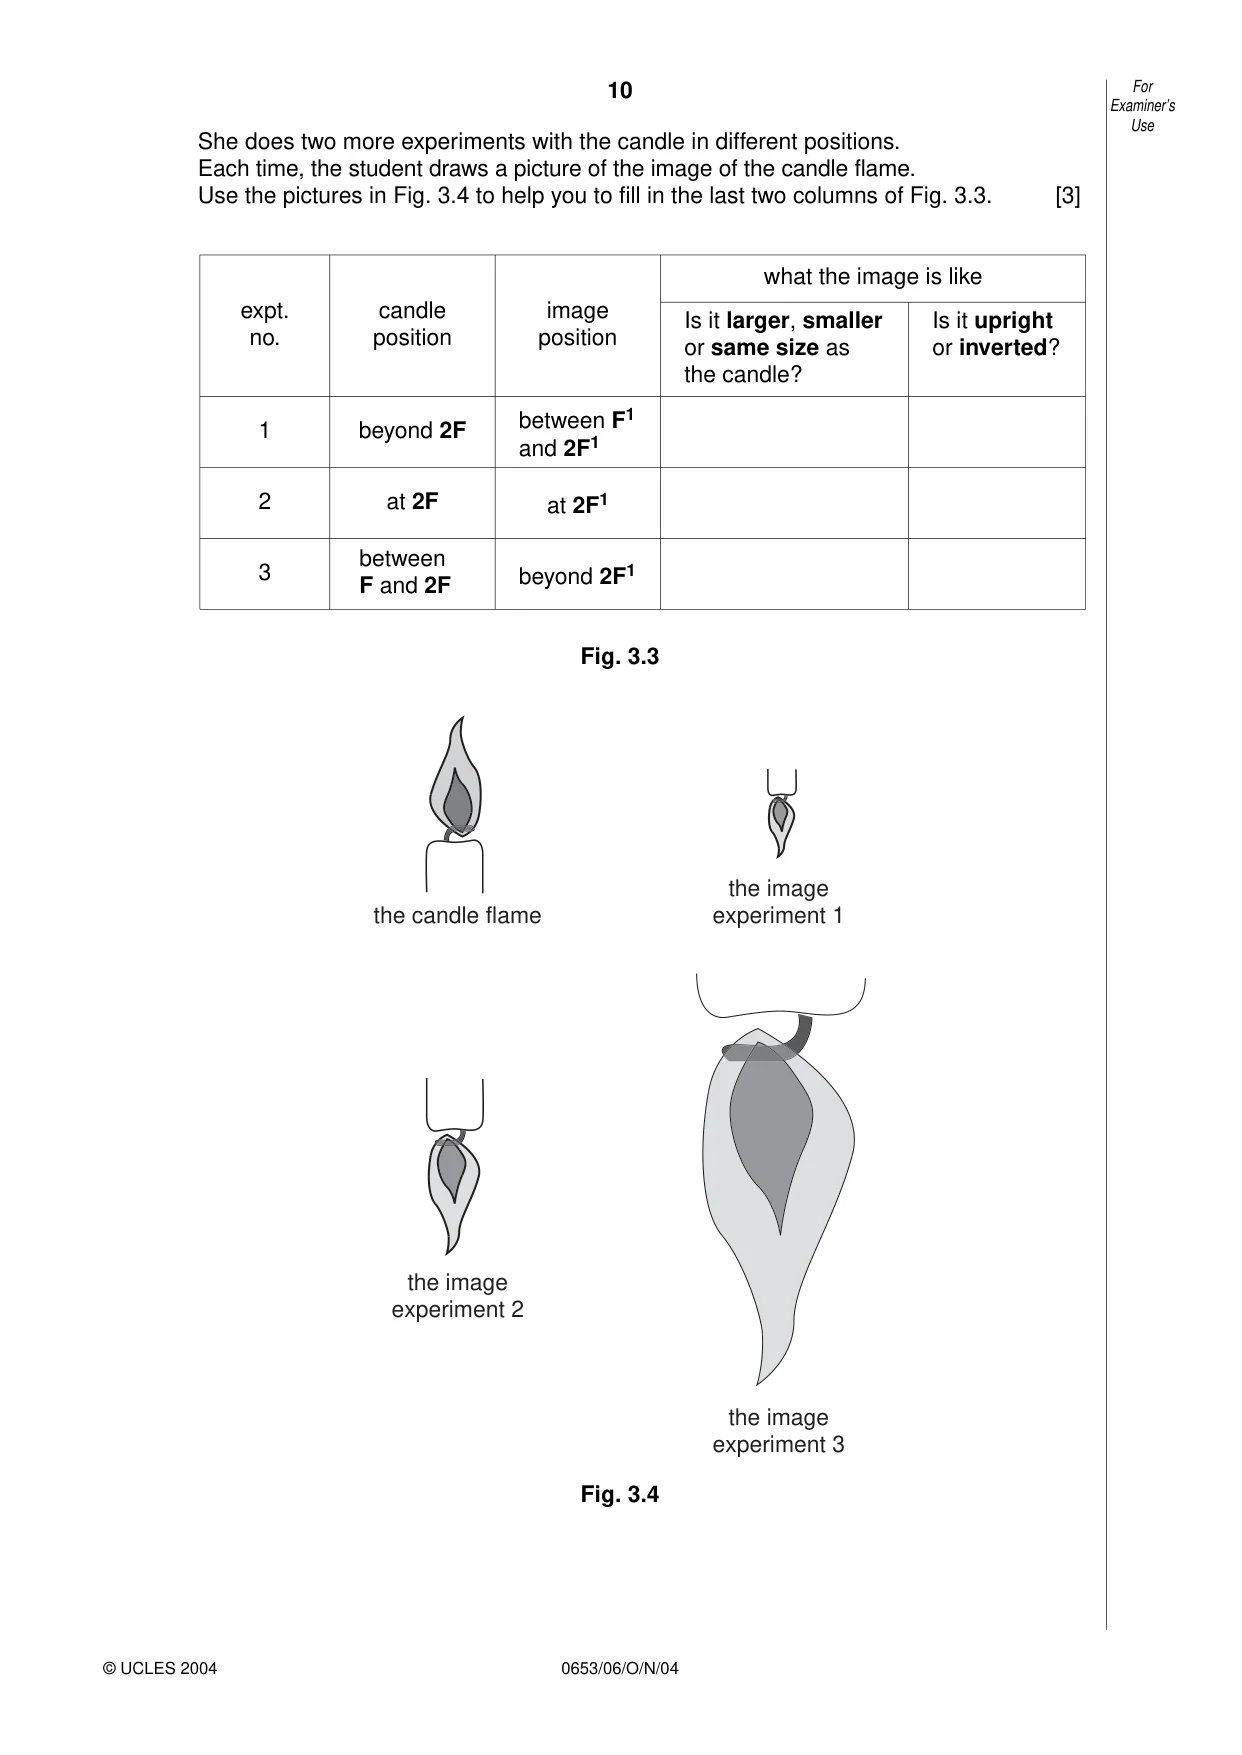
10 0653/06/O/N/04 She does two more experiments with the candle in different positions. Each time, the student draws a picture of the image of the candle flame. Use the pictures in Fig. 3.4 to help you to fill in the last two columns of Fig. 3.3. [3] Fig. 3.3 Fig. 3.4 the candle flame the image experiment 1 the image experiment 2 the image experiment 3 For Examiner’s Use © UCLES 2004 expt. no. 1 beyond 2F between F1 and 2F1 at 2F1 beyond 2F1 at 2F between F and 2F 2 3 candle position image position Is it larger, smaller or same size as the candle? Is it upright or inverted? what the image is like
Question paper, page 11
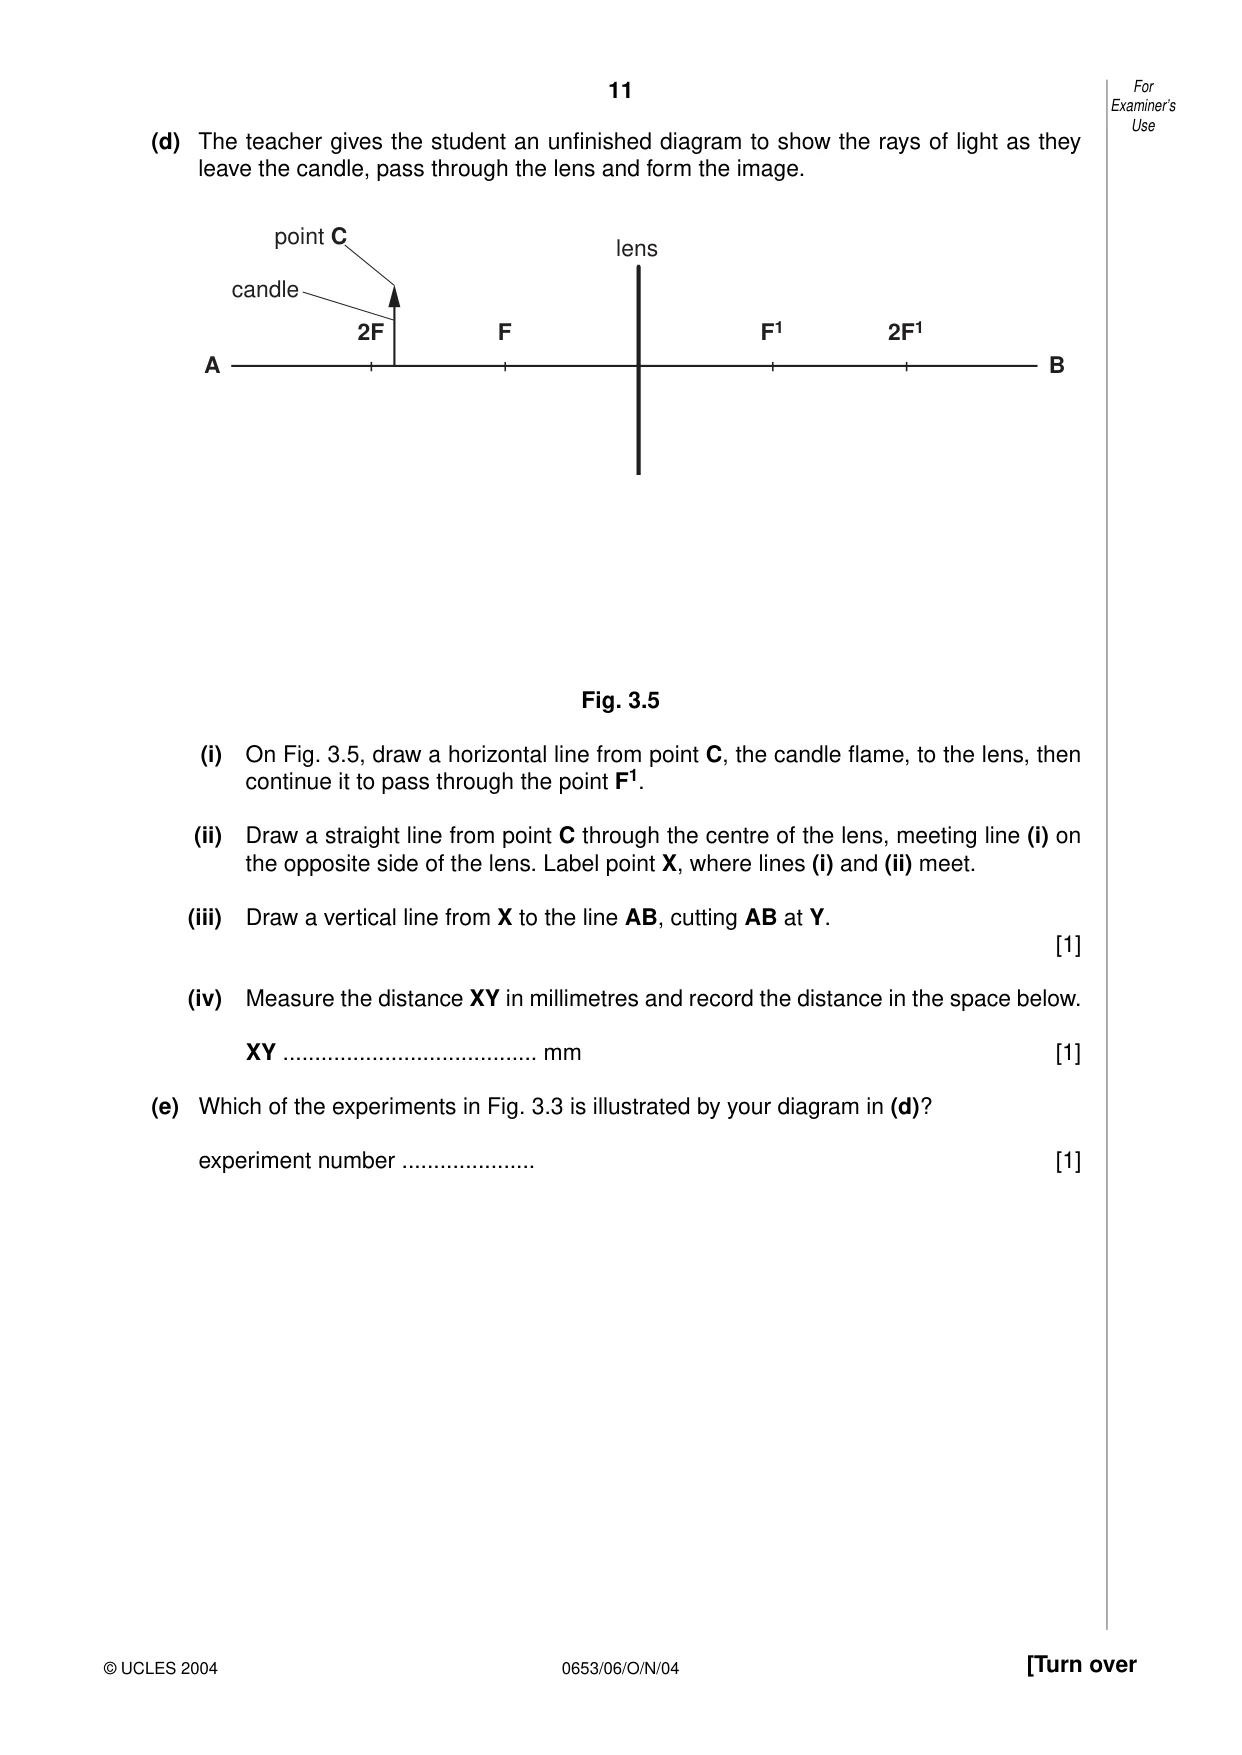
11 0653/06/O/N/04 [Turn over (d) The teacher gives the student an unfinished diagram to show the rays of light as they leave the candle, pass through the lens and form the image. Fig. 3.5 (i) On Fig. 3.5, draw a horizontal line from point C, the candle flame, to the lens, then continue it to pass through the point F1. (ii) Draw a straight line from point C through the centre of the lens, meeting line (i) on the opposite side of the lens. Label point X, where lines (i) and (ii) meet. (iii) Draw a vertical line from X to the line AB, cutting AB at Y. [1] (iv) Measure the distance XY in millimetres and record the distance in the space below. XY … mm [1] (e) Which of the experiments in Fig. 3.3 is illustrated by your diagram in (d)? experiment number … [1] A B 2F F lens F1 2F1 point C candle For Examiner’s Use © UCLES 2004
Question paper, page 12
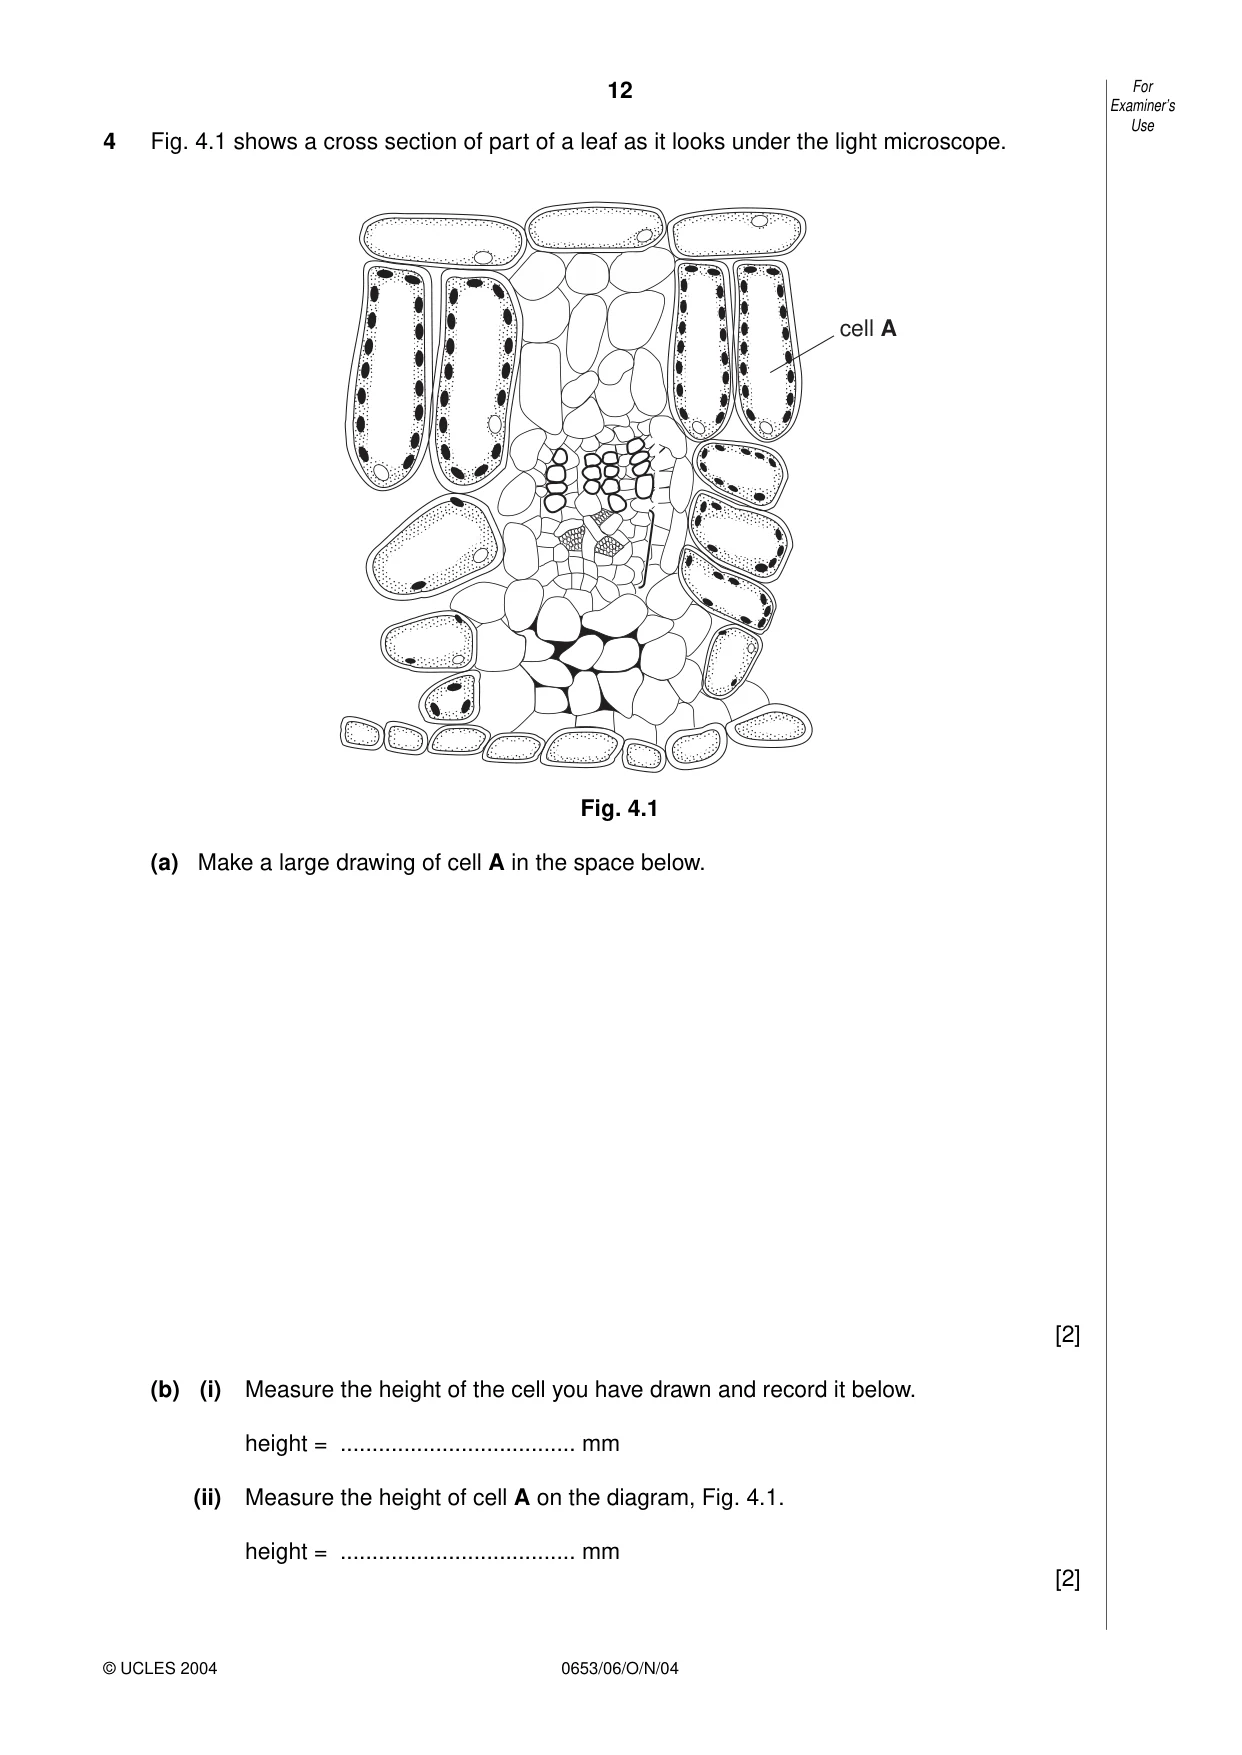
12 0653/06/O/N/04 4 Fig. 4.1 shows a cross section of part of a leaf as it looks under the light microscope. Fig. 4.1 (a) Make a large drawing of cell A in the space below. [2] (b) (i) Measure the height of the cell you have drawn and record it below. height = … mm (ii) Measure the height of cell A on the diagram, Fig. 4.1. height = … mm [2] cell A For Examiner’s Use © UCLES 2004
Question paper, page 13
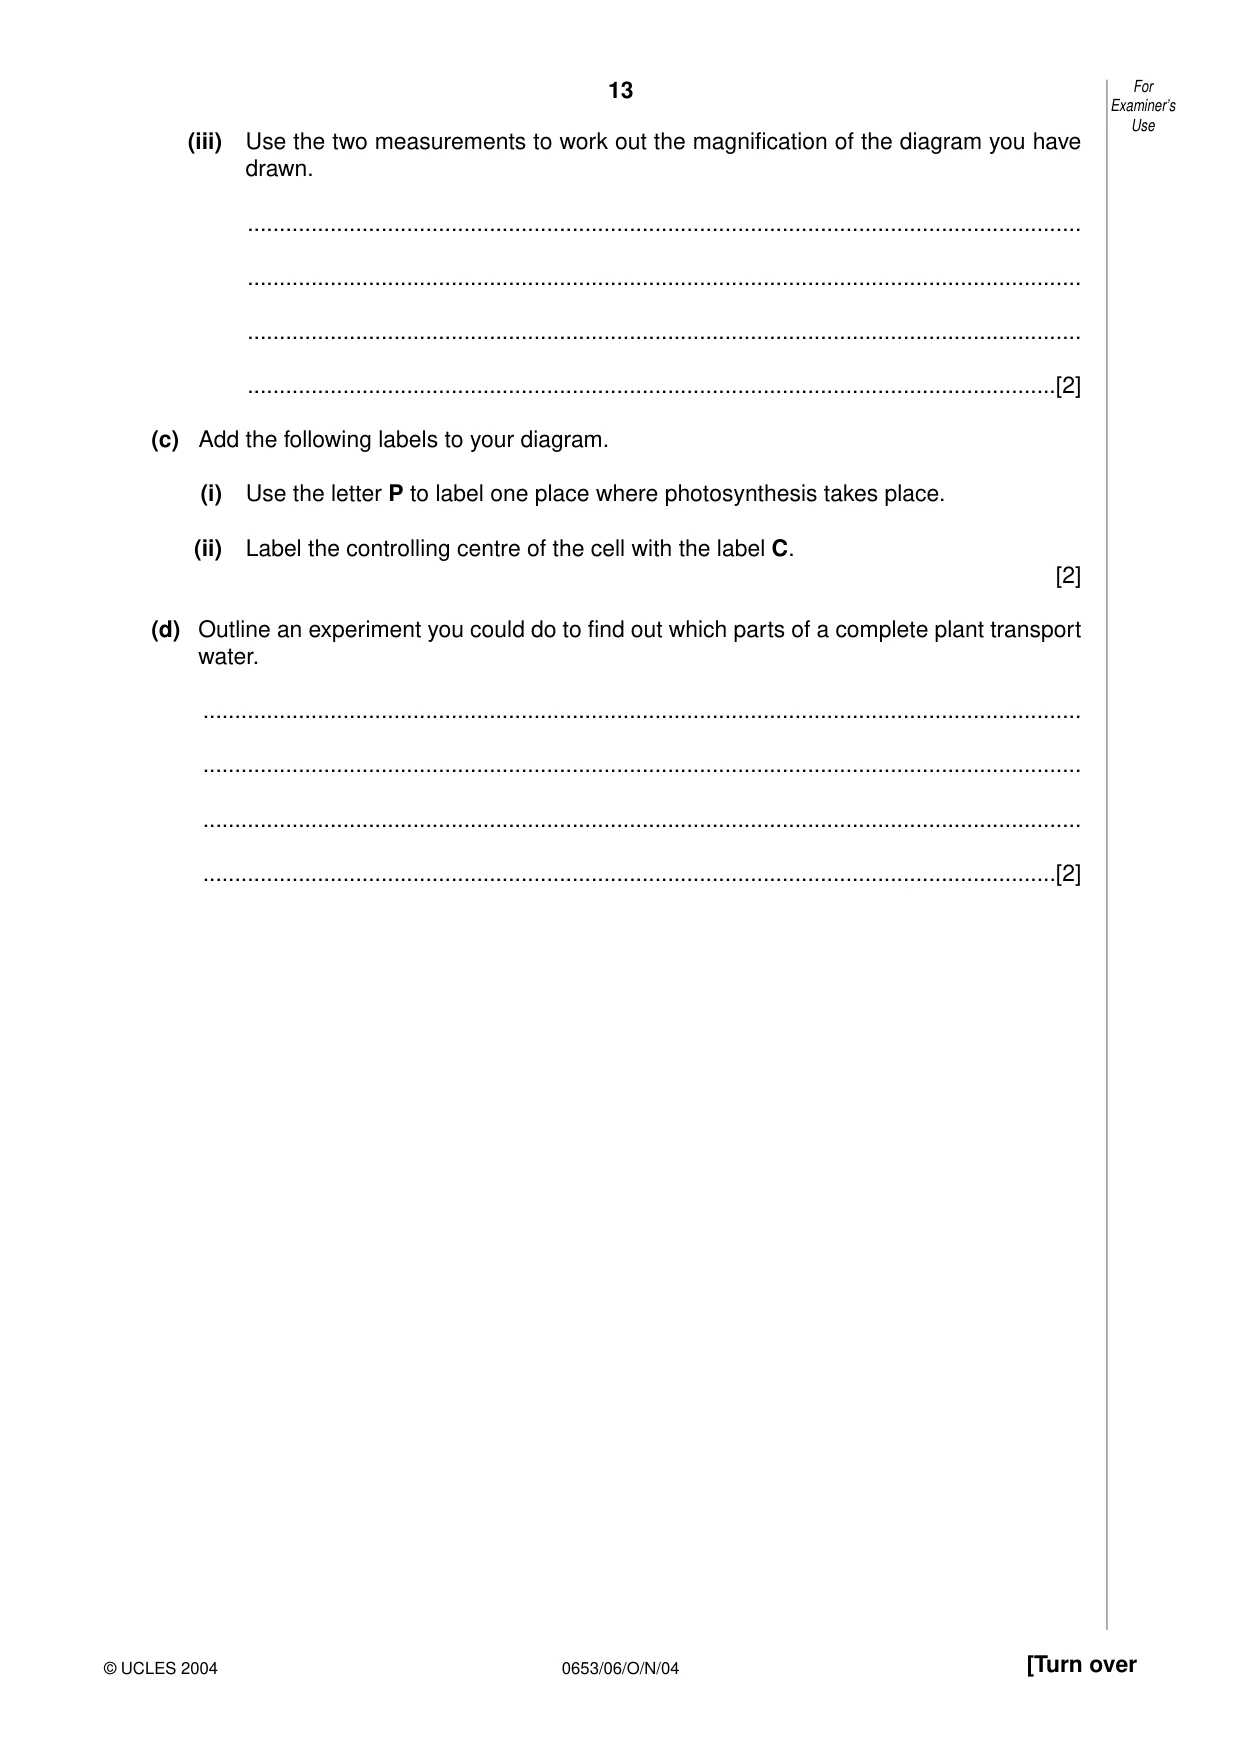
13 0653/06/O/N/04 [Turn over (iii) Use the two measurements to work out the magnification of the diagram you have drawn. … … … …[2] (c) Add the following labels to your diagram. (i) Use the letter P to label one place where photosynthesis takes place. (ii) Label the controlling centre of the cell with the label C. [2] (d) Outline an experiment you could do to find out which parts of a complete plant transport water. … … … …[2] For Examiner’s Use © UCLES 2004
Question paper, page 14
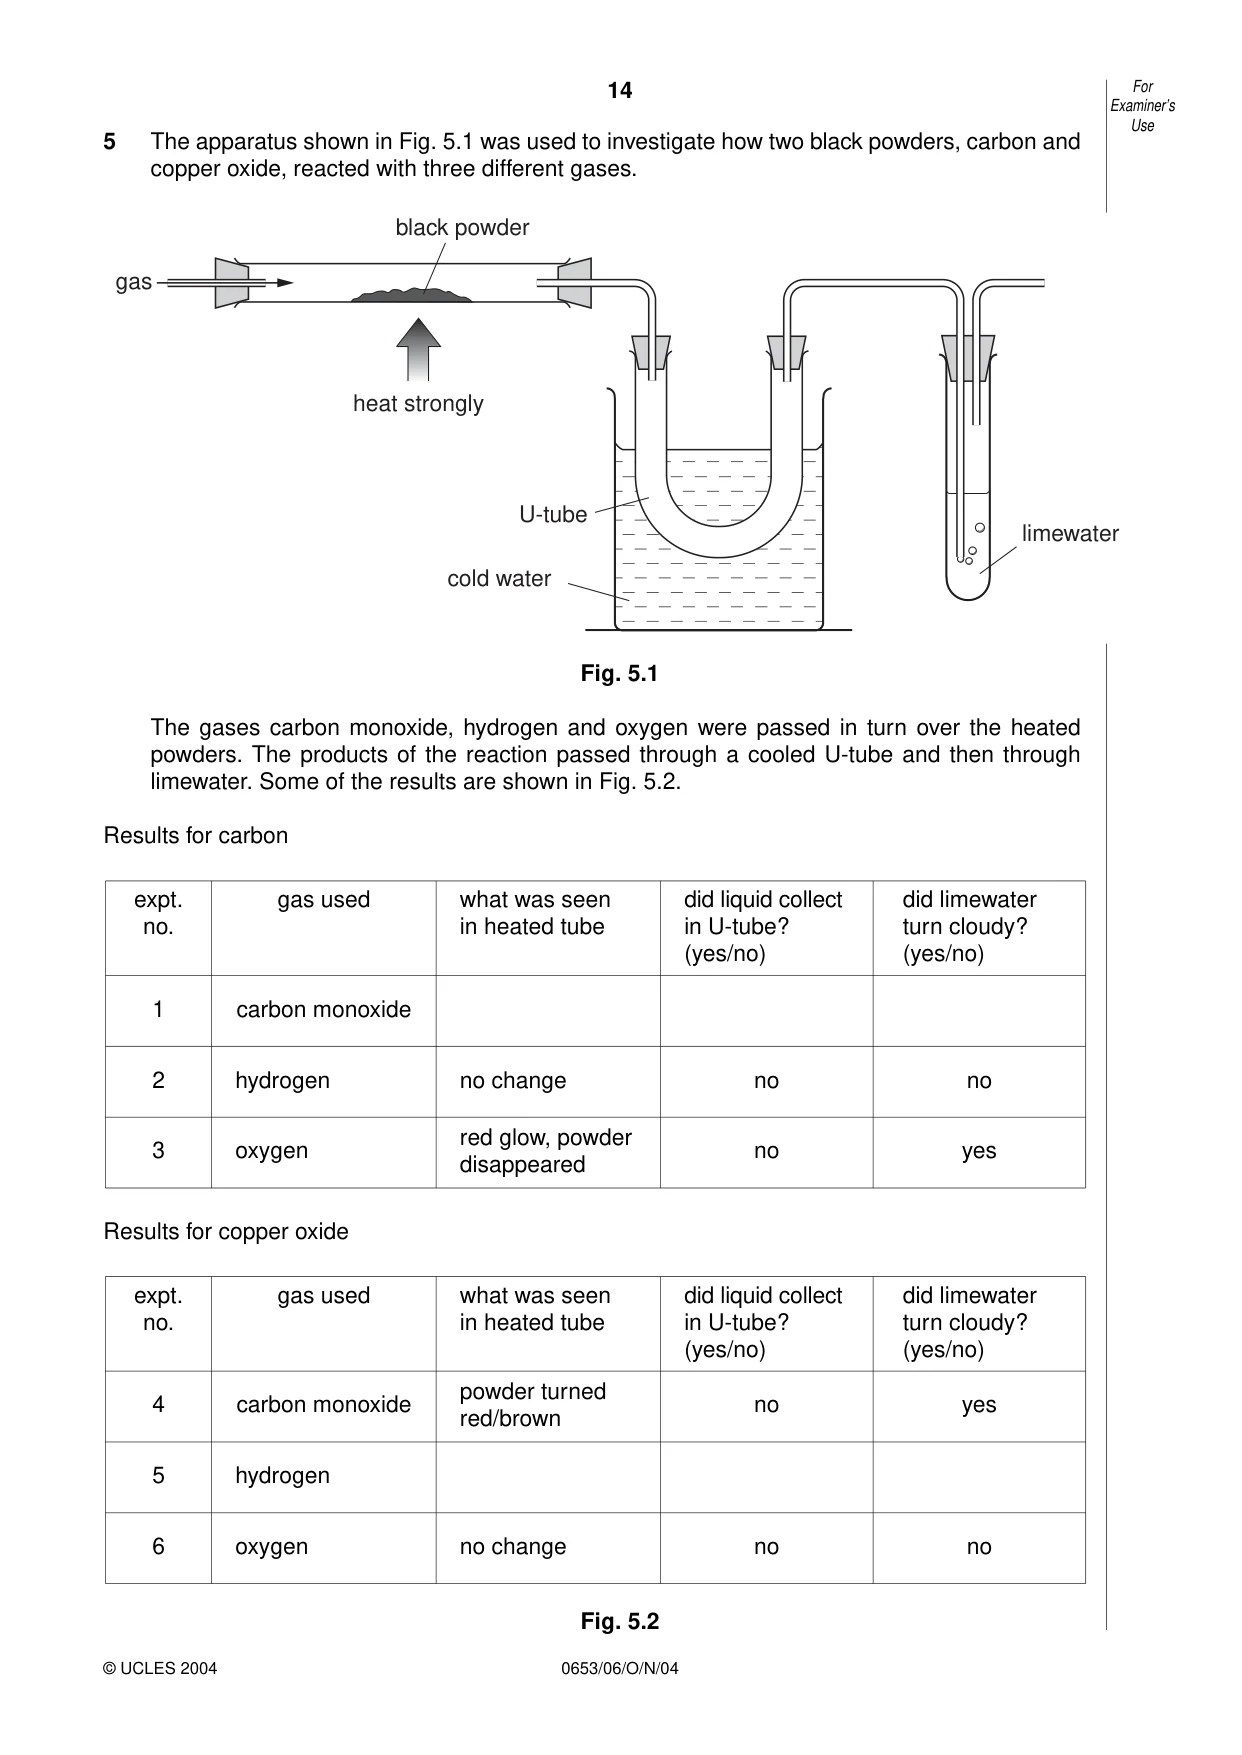
14 0653/06/O/N/04 5 The apparatus shown in Fig. 5.1 was used to investigate how two black powders, carbon and copper oxide, reacted with three different gases. Fig. 5.1 The gases carbon monoxide, hydrogen and oxygen were passed in turn over the heated powders. The products of the reaction passed through a cooled U-tube and then through limewater. Some of the results are shown in Fig. 5.2. Results for carbon Results for copper oxide Fig. 5.2 For Examiner’s Use © UCLES 2004 limewater cold water U-tube heat strongly gas black powder expt. no. 1 2 3 gas used carbon monoxide hydrogen no change no no no yes oxygen red glow, powder disappeared what was seen in heated tube did liquid collect in U-tube? (yes/no) did limewater turn cloudy? (yes/no) expt. no. 4 5 6 gas used carbon monoxide powder turned red/brown hydrogen no change no no no yes oxygen what was seen in heated tube did liquid collect in U-tube? (yes/no) did limewater turn cloudy? (yes/no)
Question paper, page 15
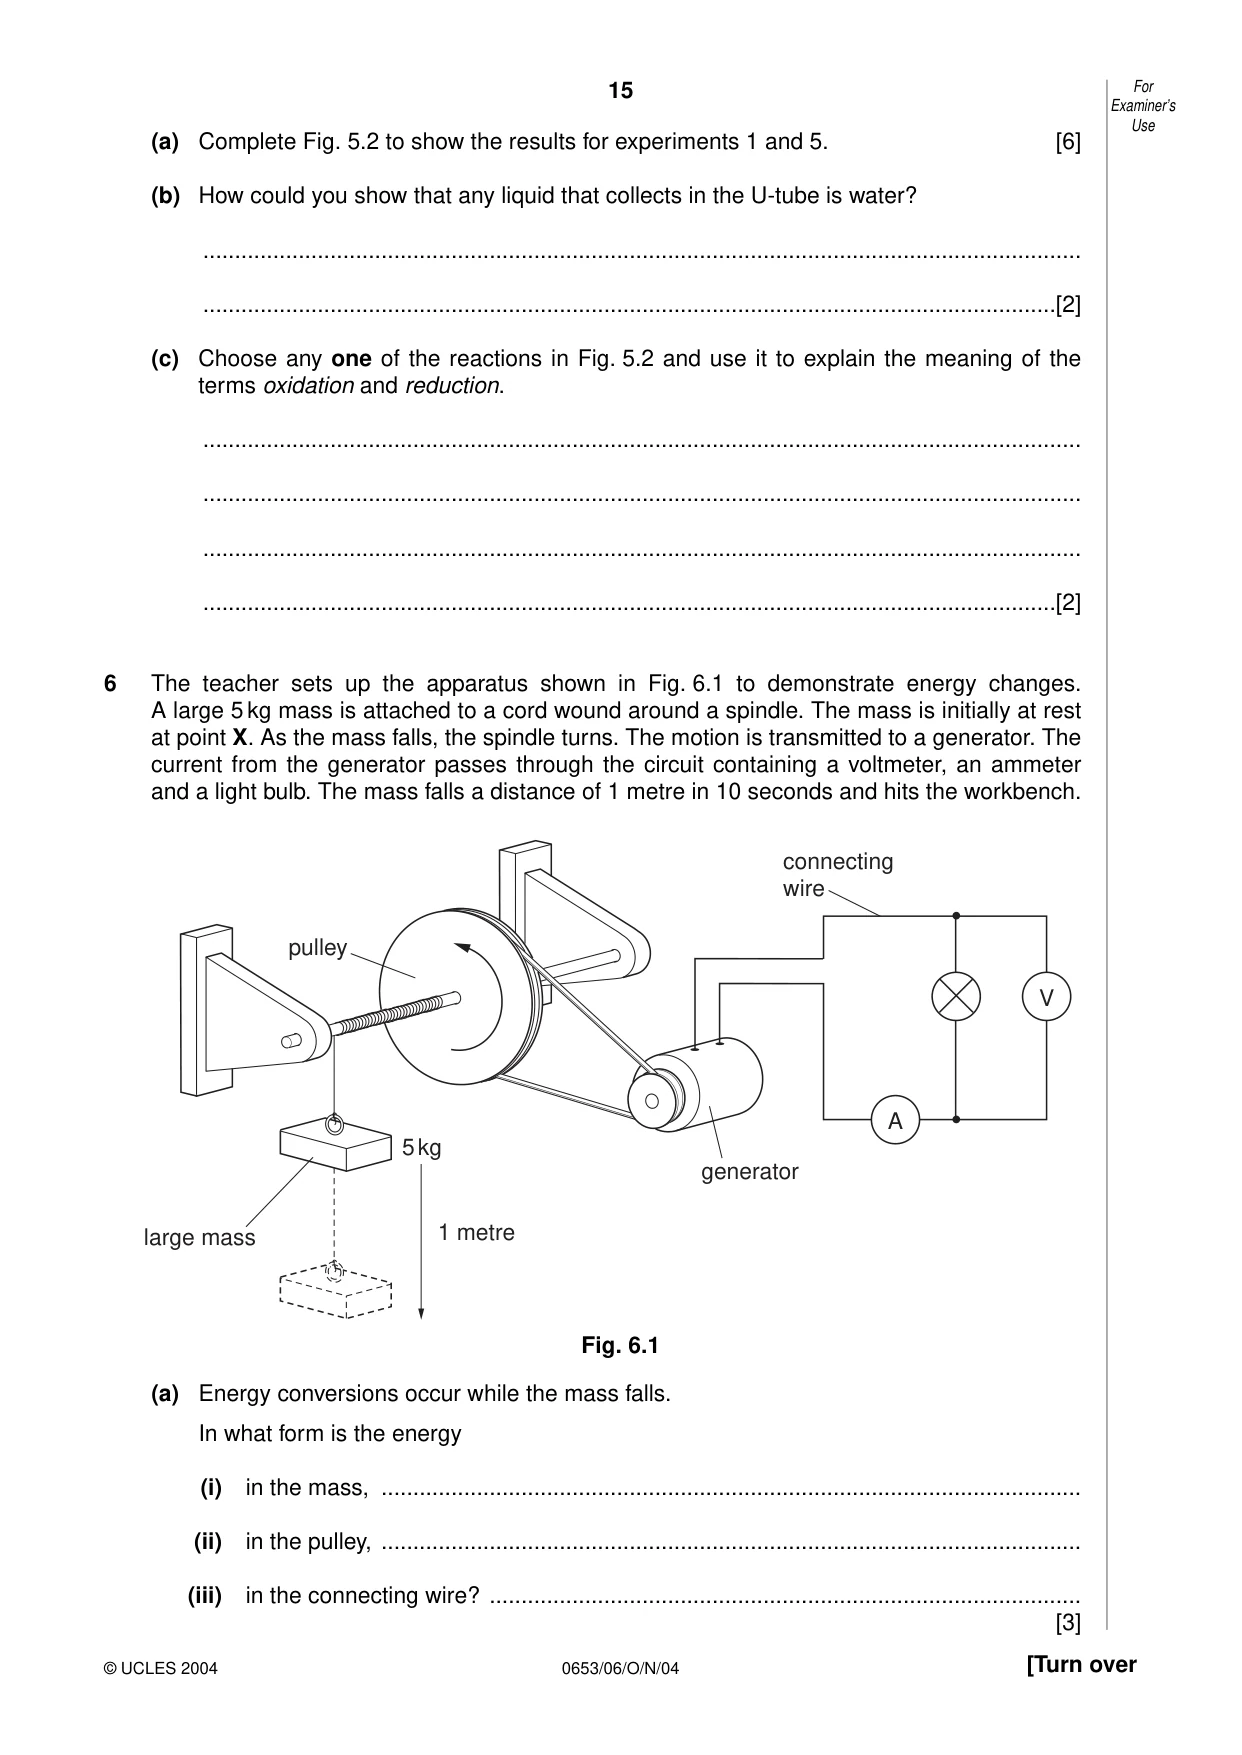
15 0653/06/O/N/04 [Turn over (a) Complete Fig. 5.2 to show the results for experiments 1 and 5. [6] (b) How could you show that any liquid that collects in the U-tube is water? … …[2] (c) Choose any one of the reactions in Fig. 5.2 and use it to explain the meaning of the terms oxidation and reduction. … … … …[2] 6 The teacher sets up the apparatus shown in Fig. 6.1 to demonstrate energy changes. A large 5 kg mass is attached to a cord wound around a spindle. The mass is initially at rest at point X. As the mass falls, the spindle turns. The motion is transmitted to a generator. The current from the generator passes through the circuit containing a voltmeter, an ammeter and a light bulb. The mass falls a distance of 1 metre in 10 seconds and hits the workbench. Fig. 6.1 (a) Energy conversions occur while the mass falls. In what form is the energy (i) in the mass, … (ii) in the pulley, … (iii) in the connecting wire? … [3] A generator large mass 5 kg 1 metre pulley connecting wire V For Examiner’s Use © UCLES 2004
Question paper, page 16
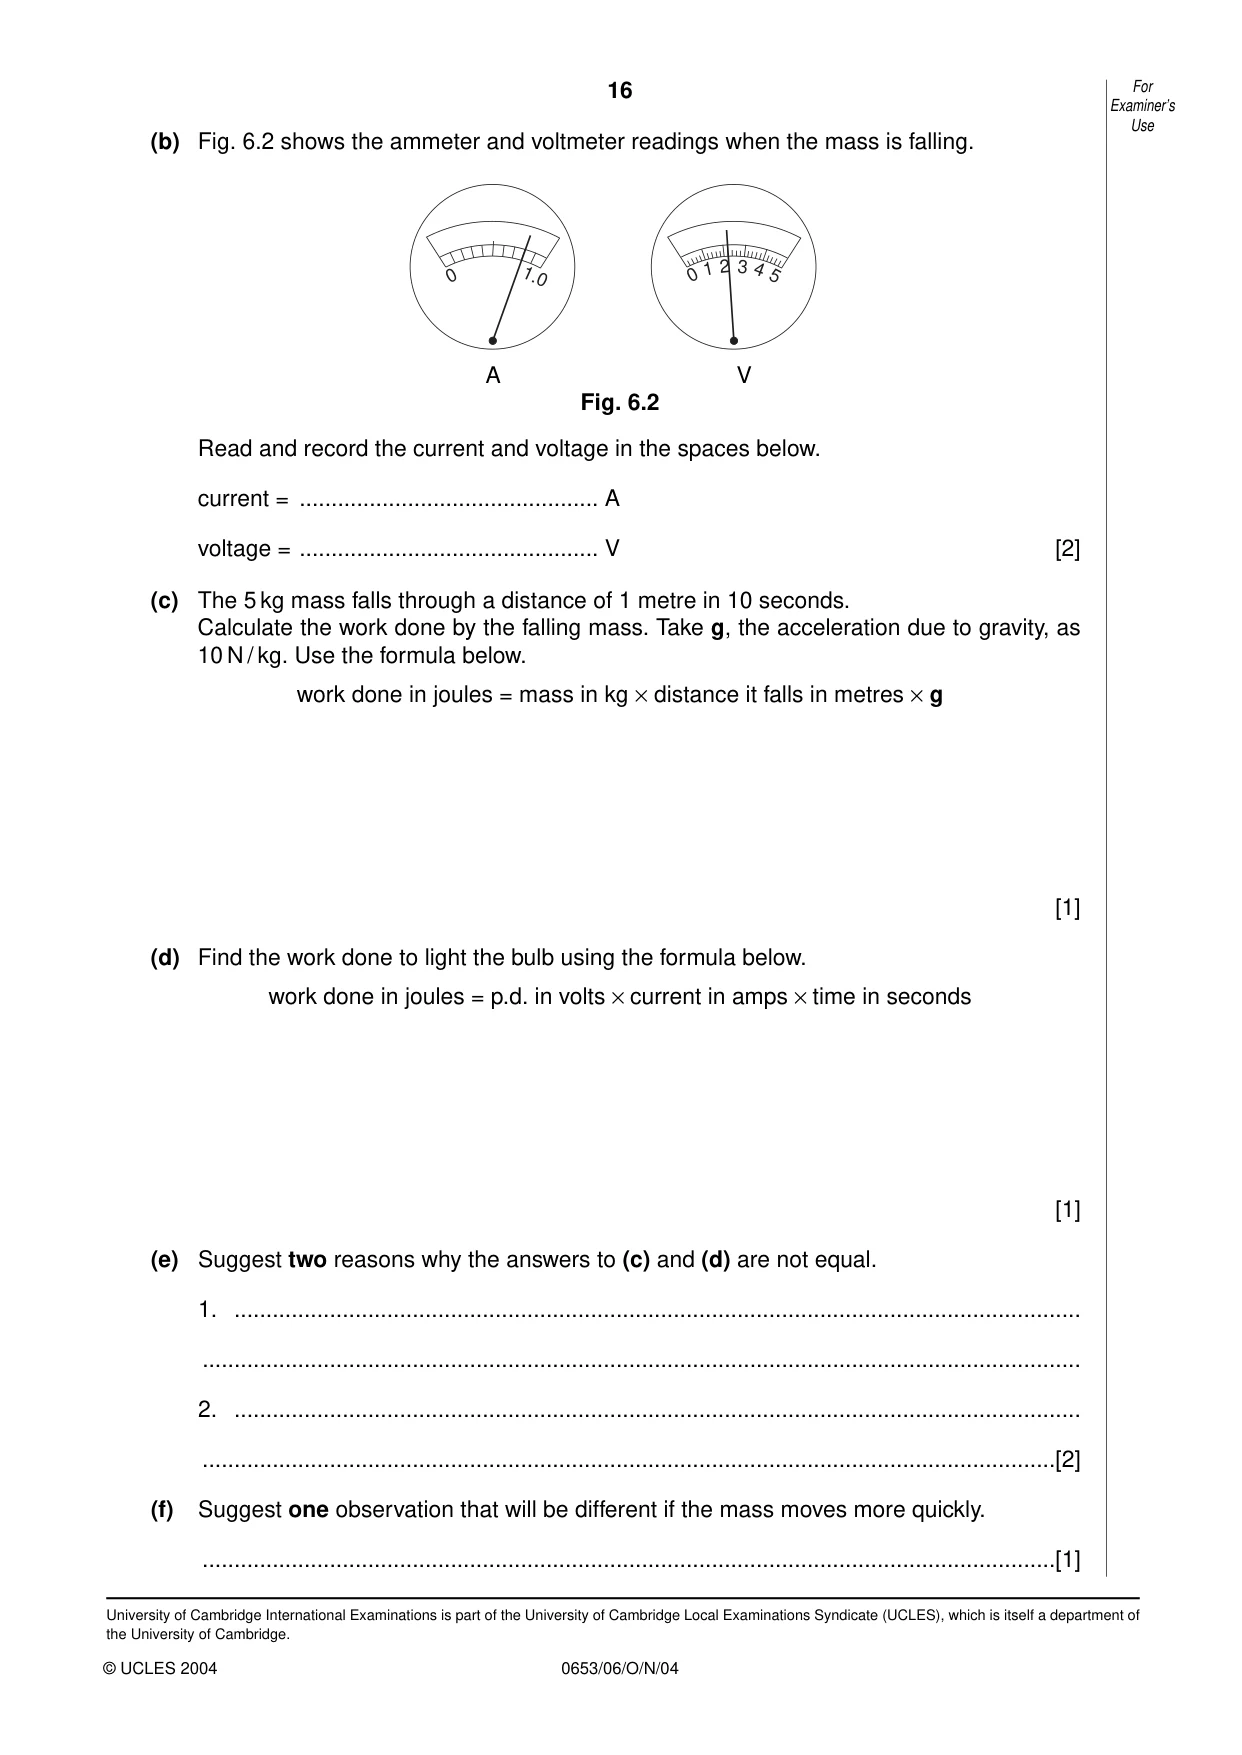
16 0653/06/O/N/04 (b) Fig. 6.2 shows the ammeter and voltmeter readings when the mass is falling. A V Fig. 6.2 Read and record the current and voltage in the spaces below. current = … A voltage = … V [2] (c) The 5 kg mass falls through a distance of 1 metre in 10 seconds. Calculate the work done by the falling mass. Take g, the acceleration due to gravity, as 10 N / kg. Use the formula below. work done in joules = mass in kg × distance it falls in metres × g [1] (d) Find the work done to light the bulb using the formula below. work done in joules = p.d. in volts × current in amps × time in seconds [1] (e) Suggest two reasons why the answers to (c) and (d) are not equal. 1. … … 2. … …[2] (f) Suggest one observation that will be different if the mass moves more quickly. …[1] 0 1.0 0 1 2 3 4 5 For Examiner’s Use © UCLES 2004 University of Cambridge International Examinations is part of the University of Cambridge Local Examinations Syndicate (UCLES), which is itself a department of the University of Cambridge.
Mark scheme, page 1
UNIVERSITY OF CAMBRIDGE INTERNATIONAL EXAMINATIONS International General Certificate of Secondary Education MARK SCHEME for the November 2004 question paper 0653/0654 COMBINED SCIENCE/CO-ORDINATED SCIENCES 0653/06, 0654/06 Paper 6 (Alternative to Practical), maximum raw mark 60 This mark scheme is published as an aid to teachers and students, to indicate the requirements of the examination. It shows the basis on which Examiners were initially instructed to award marks. It does not indicate the details of the discussions that took place at an Examiners’ meeting before marking began. Any substantial changes to the mark scheme that arose from these discussions will be recorded in the published Report on the Examination. All Examiners are instructed that alternative correct answers and unexpected approaches in candidates’ scripts must be given marks that fairly reflect the relevant knowledge and skills demonstrated. Mark schemes must be read in conjunction with the question papers and the Report on the Examination. • CIE will not enter into discussion or correspondence in connection with these mark schemes. CIE is publishing the mark schemes for the November 2004 question papers for most IGCSE and GCE Advanced Level syllabuses. www.XtremePapers.com
Mark scheme, page 2
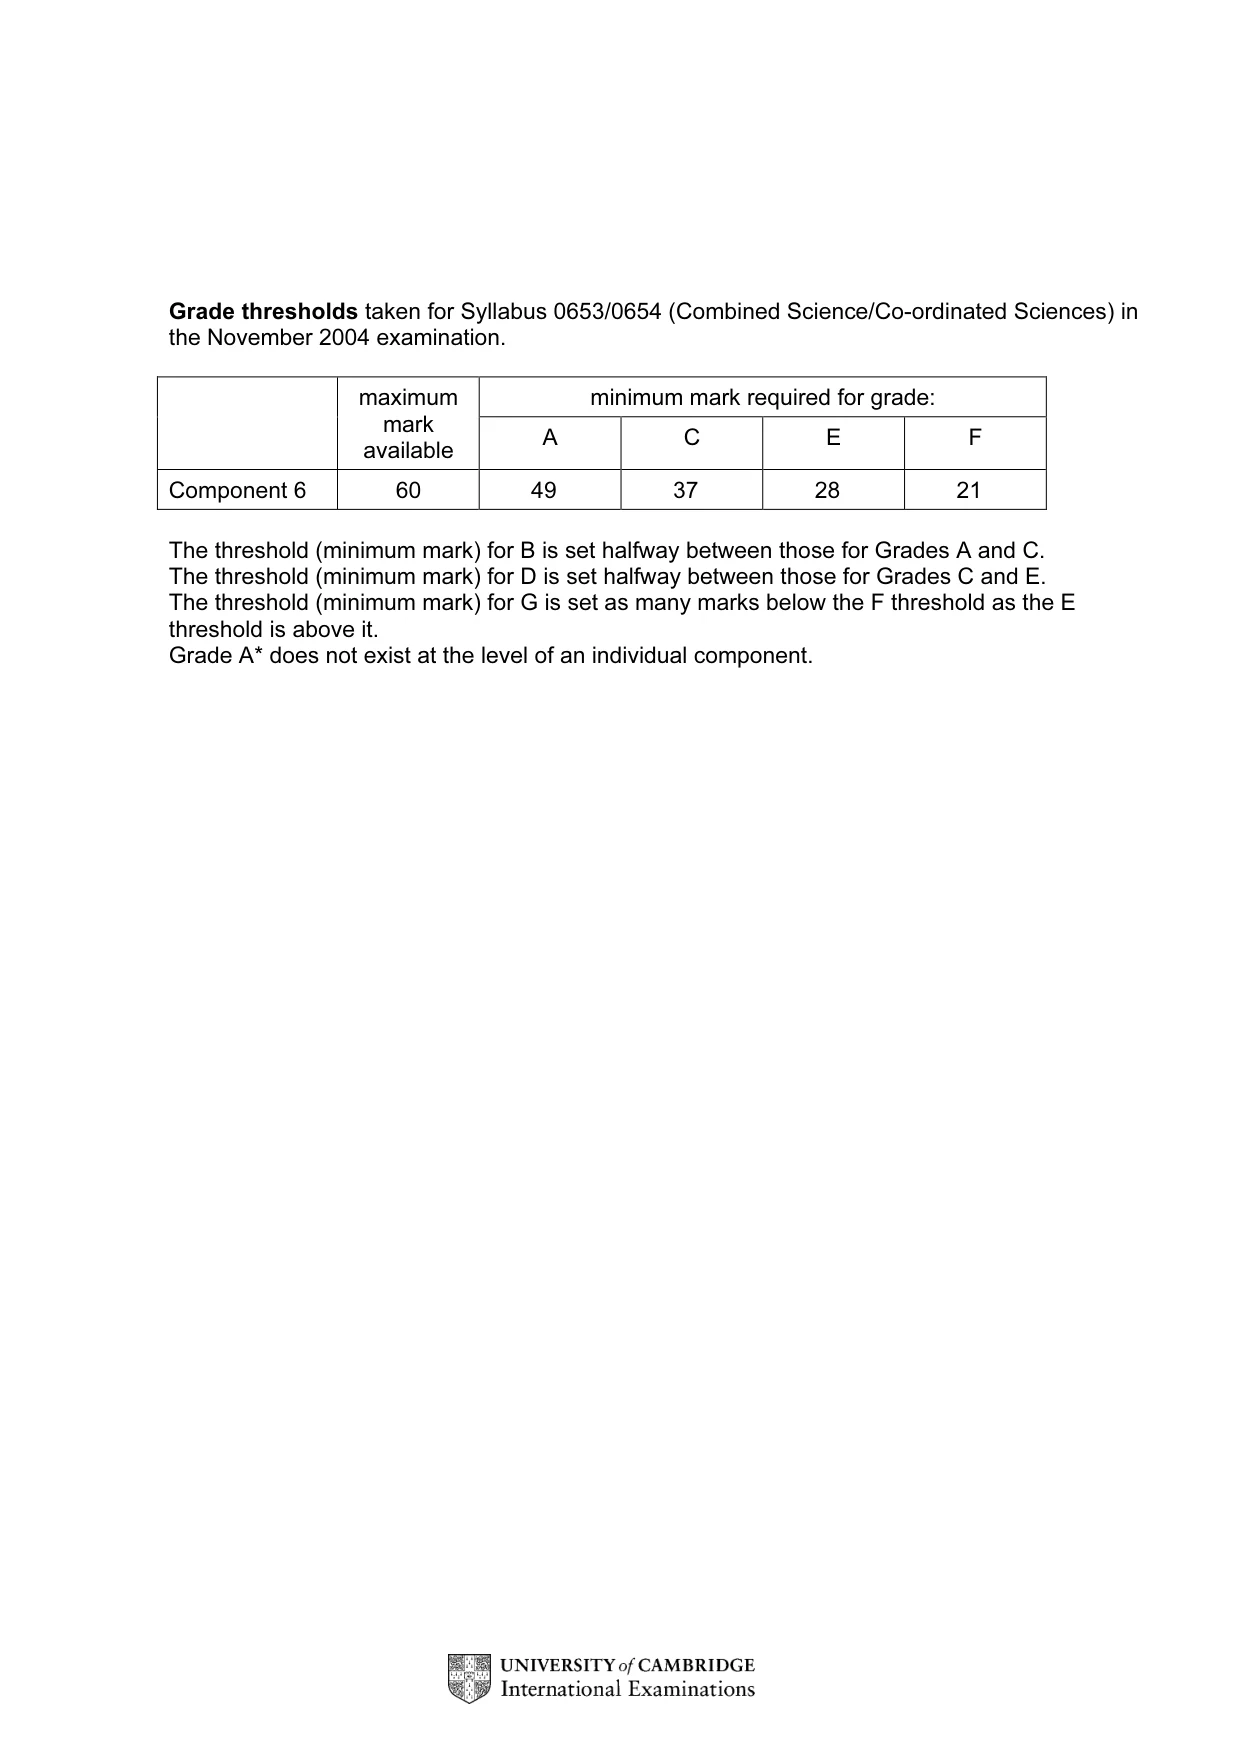
Grade thresholds taken for Syllabus 0653/0654 (Combined Science/Co-ordinated Sciences) in the November 2004 examination. minimum mark required for grade: maximum mark available A C E F Component 6 60 49 37 28 21 The threshold (minimum mark) for B is set halfway between those for Grades A and C. The threshold (minimum mark) for D is set halfway between those for Grades C and E. The threshold (minimum mark) for G is set as many marks below the F threshold as the E threshold is above it. Grade A* does not exist at the level of an individual component.
Mark scheme, page 3
November 2004 INTERNATIONAL GCSE MARK SCHEME MAXIMUM MARK: 60 SYLLABUS/COMPONENT: 0653/06, 0654/06 COMBINED SCIENCE/CO-ORDINATED SCIENCES Paper 6 (Alternative to Practical)
Mark scheme, page 4
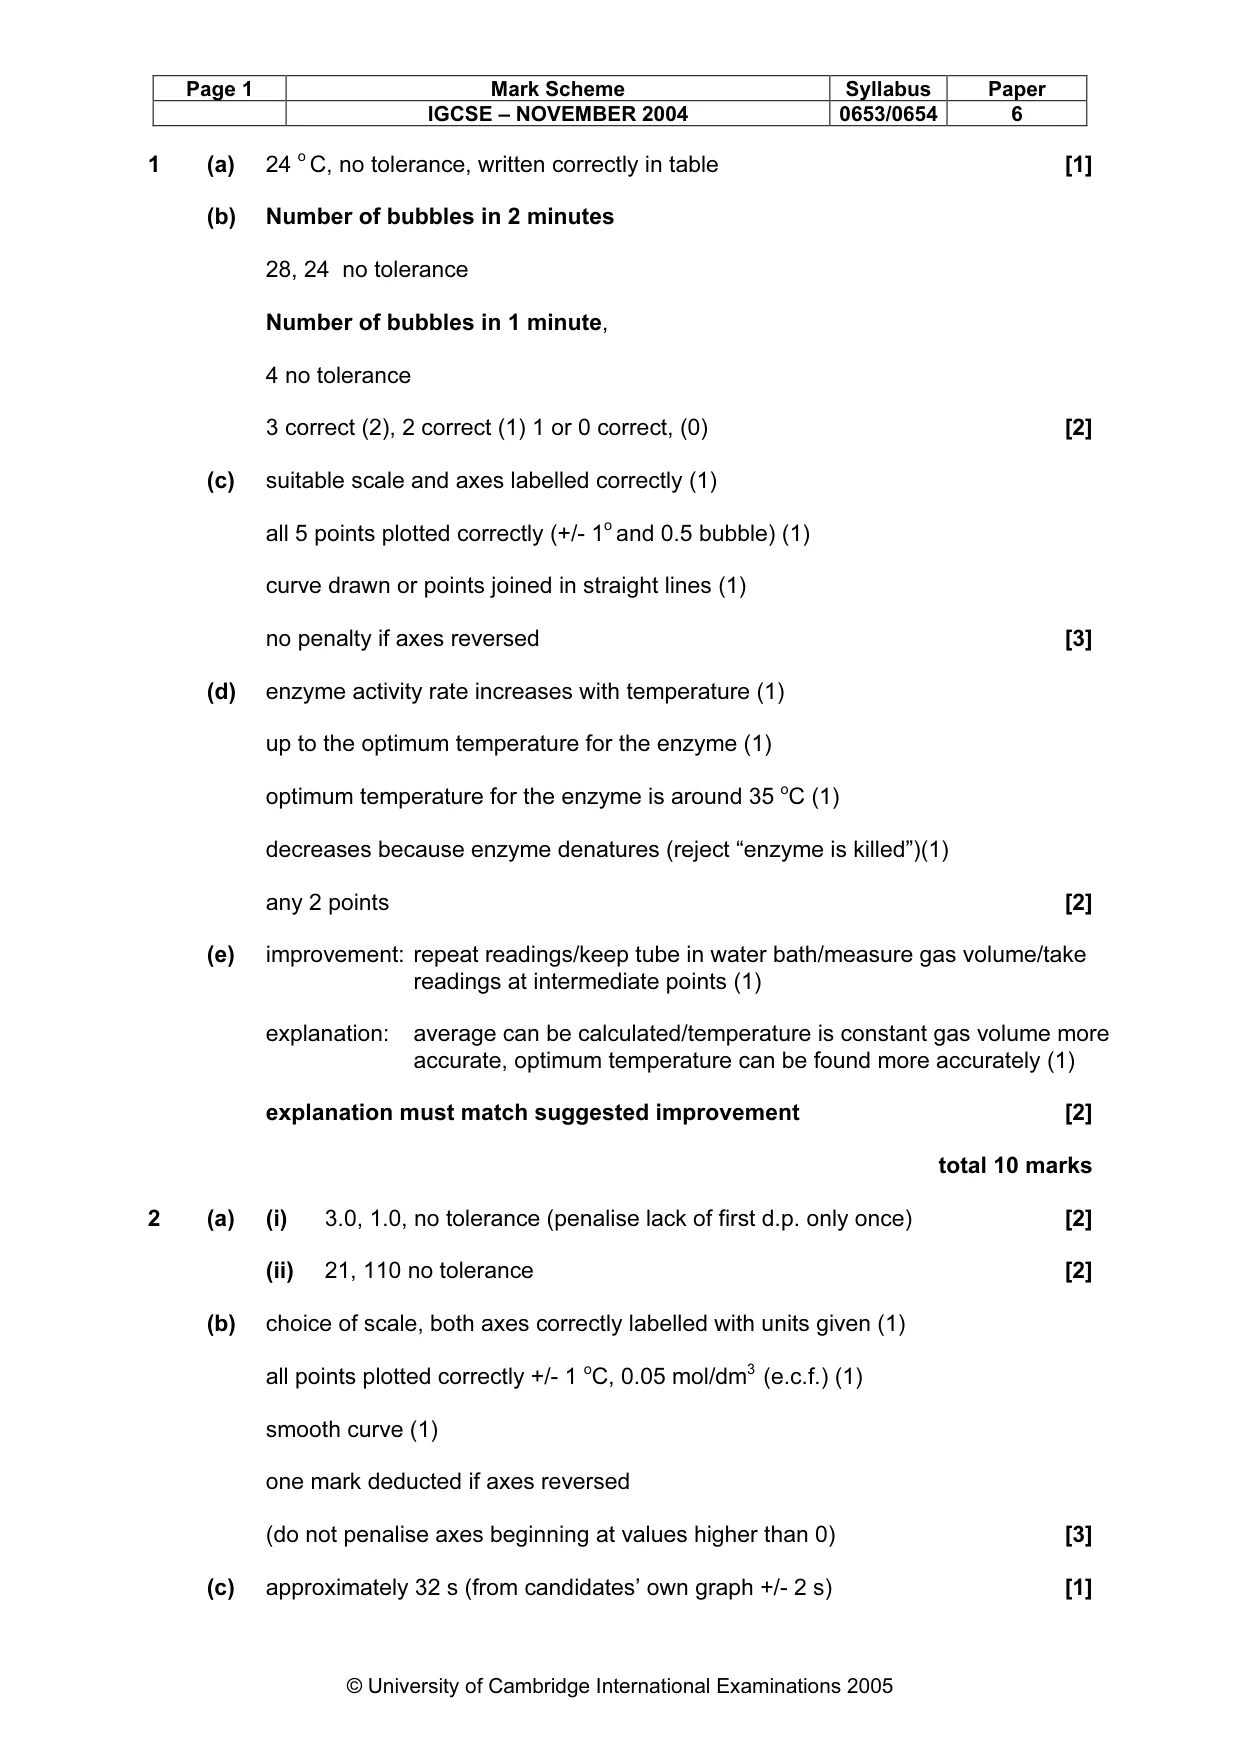
Page 1 Mark Scheme Syllabus Paper IGCSE – NOVEMBER 2004 0653/0654 6 © University of Cambridge International Examinations 2005 1 (a) 24 o C, no tolerance, written correctly in table [1] (b) Number of bubbles in 2 minutes 28, 24 no tolerance Number of bubbles in 1 minute, 4 no tolerance 3 correct (2), 2 correct (1) 1 or 0 correct, (0) [2] (c) suitable scale and axes labelled correctly (1) all 5 points plotted correctly (+/- 1o and 0.5 bubble) (1) curve drawn or points joined in straight lines (1) no penalty if axes reversed [3] (d) enzyme activity rate increases with temperature (1) up to the optimum temperature for the enzyme (1) optimum temperature for the enzyme is around 35 oC (1) decreases because enzyme denatures (reject “enzyme is killed”)(1) any 2 points [2] (e) improvement: repeat readings/keep tube in water bath/measure gas volume/take readings at intermediate points (1) explanation: average can be calculated/temperature is constant gas volume more accurate, optimum temperature can be found more accurately (1) explanation must match suggested improvement [2] total 10 marks 2 (a) (i) 3.0, 1.0, no tolerance (penalise lack of first d.p. only once) [2] (ii) 21, 110 no tolerance [2] (b) choice of scale, both axes correctly labelled with units given (1) all points plotted correctly +/- 1 oC, 0.05 mol/dm3 (e.c.f.) (1) smooth curve (1) one mark deducted if axes reversed (do not penalise axes beginning at values higher than 0) [3] (c) approximately 32 s (from candidates’ own graph +/- 2 s) [1]
Mark scheme, page 5
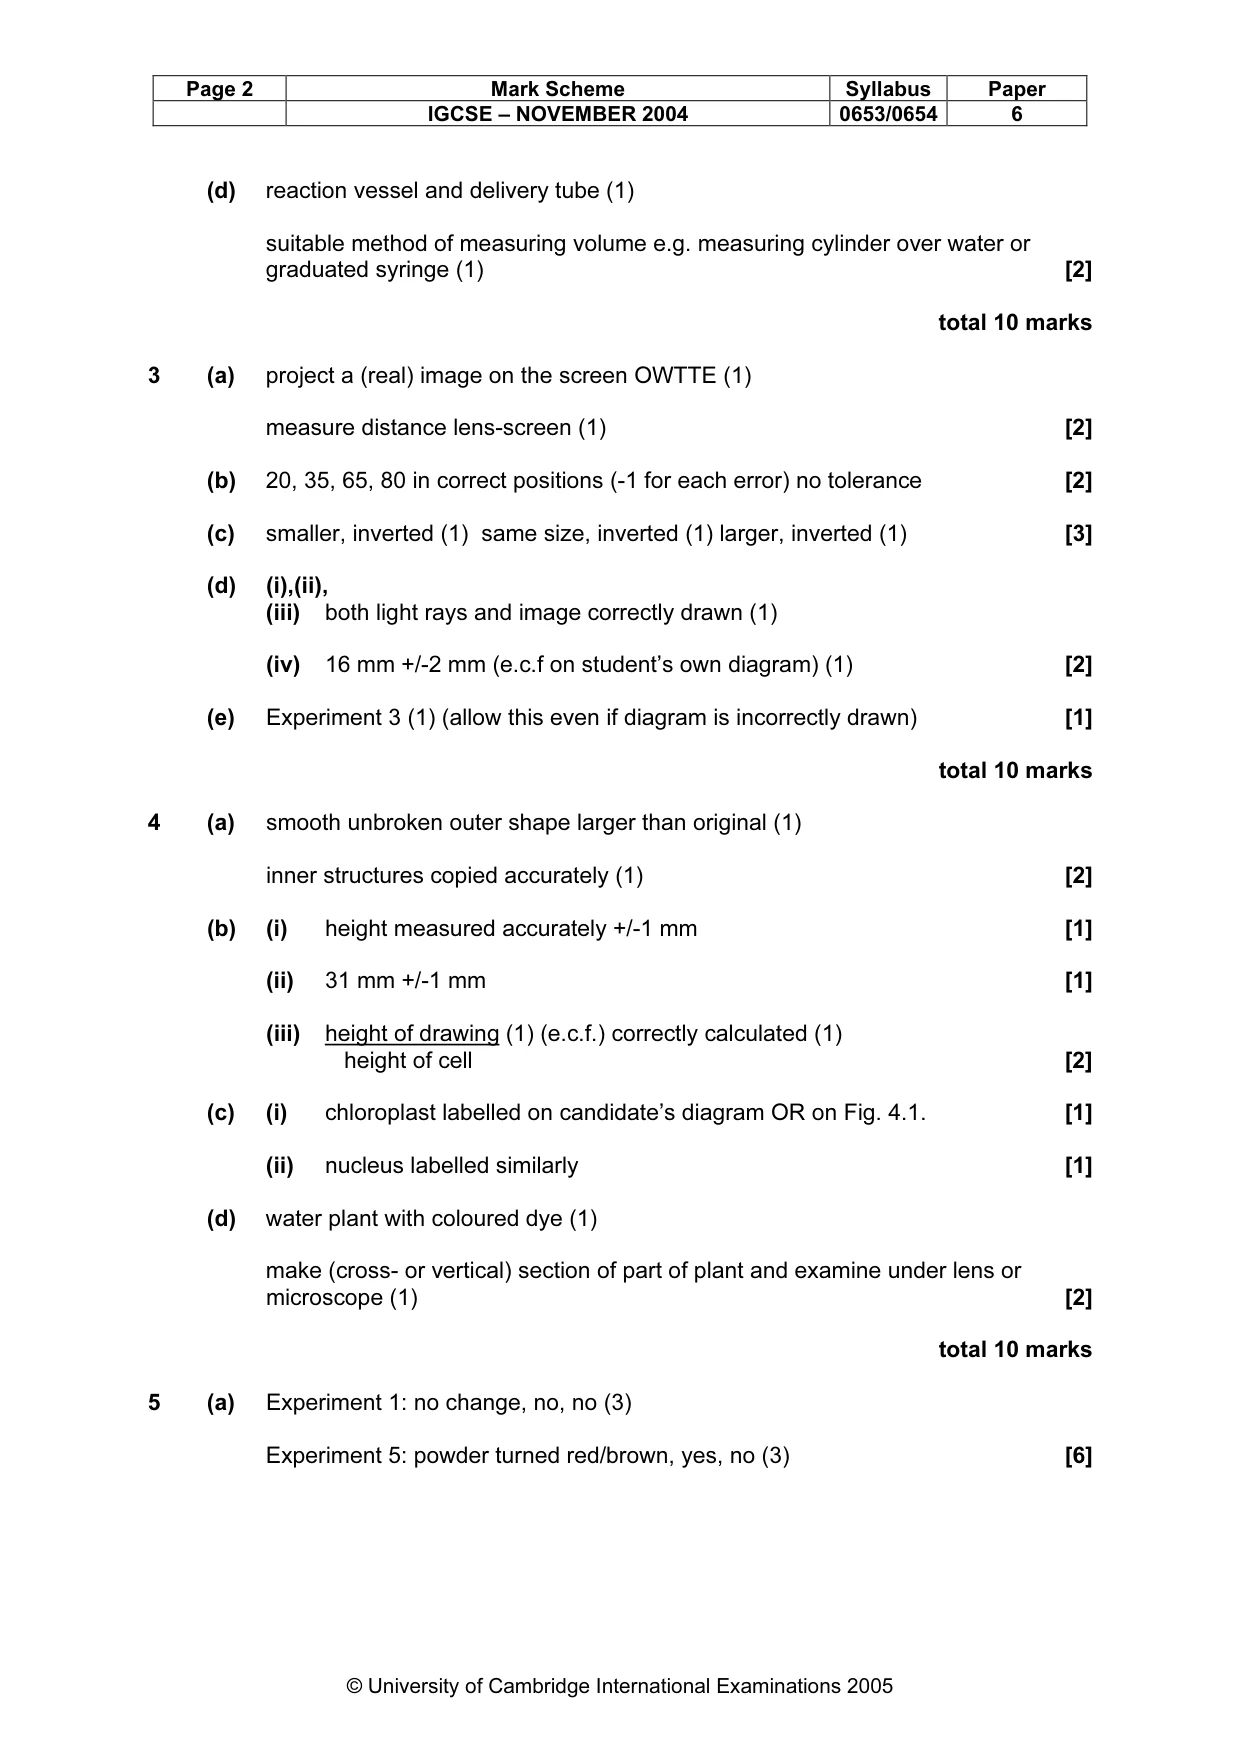
Page 2 Mark Scheme Syllabus Paper IGCSE – NOVEMBER 2004 0653/0654 6 © University of Cambridge International Examinations 2005 (d) reaction vessel and delivery tube (1) suitable method of measuring volume e.g. measuring cylinder over water or graduated syringe (1) [2] total 10 marks 3 (a) project a (real) image on the screen OWTTE (1) measure distance lens-screen (1) [2] (b) 20, 35, 65, 80 in correct positions (-1 for each error) no tolerance [2] (c) smaller, inverted (1) same size, inverted (1) larger, inverted (1) [3] (d) (i),(ii), (iii) both light rays and image correctly drawn (1) (iv) 16 mm +/-2 mm (e.c.f on student’s own diagram) (1) [2] (e) Experiment 3 (1) (allow this even if diagram is incorrectly drawn) [1] total 10 marks 4 (a) smooth unbroken outer shape larger than original (1) inner structures copied accurately (1) [2] (b) (i) height measured accurately +/-1 mm [1] (ii) 31 mm +/-1 mm [1] (iii) height of drawing (1) (e.c.f.) correctly calculated (1) height of cell [2] (c) (i) chloroplast labelled on candidate’s diagram OR on Fig. 4.1. [1] (ii) nucleus labelled similarly [1] (d) water plant with coloured dye (1) make (cross- or vertical) section of part of plant and examine under lens or microscope (1) [2] total 10 marks 5 (a) Experiment 1: no change, no, no (3) Experiment 5: powder turned red/brown, yes, no (3) [6]
Mark scheme, page 6
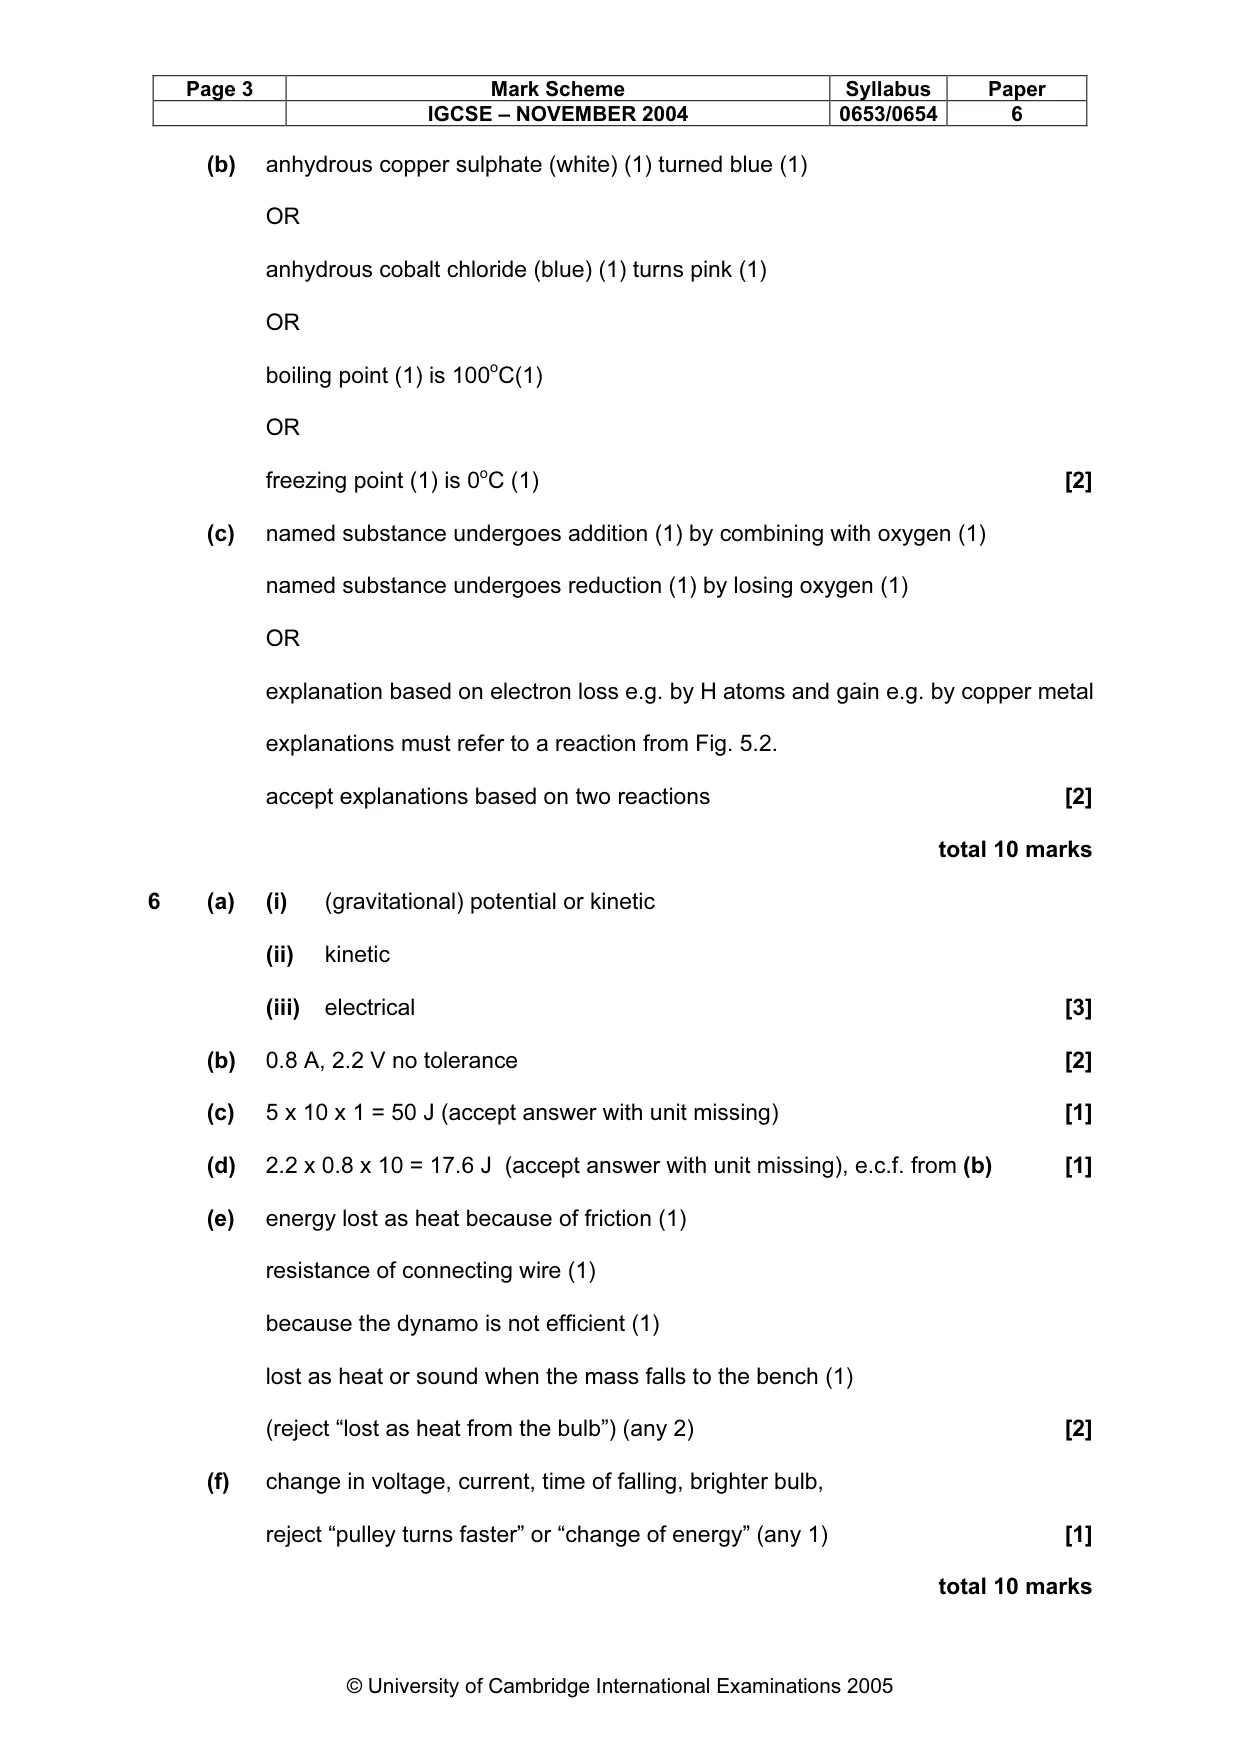
Page 3 Mark Scheme Syllabus Paper IGCSE – NOVEMBER 2004 0653/0654 6 © University of Cambridge International Examinations 2005 (b) anhydrous copper sulphate (white) (1) turned blue (1) OR anhydrous cobalt chloride (blue) (1) turns pink (1) OR boiling point (1) is 100oC(1) OR freezing point (1) is 0oC (1) [2] (c) named substance undergoes addition (1) by combining with oxygen (1) named substance undergoes reduction (1) by losing oxygen (1) OR explanation based on electron loss e.g. by H atoms and gain e.g. by copper metal explanations must refer to a reaction from Fig. 5.2. accept explanations based on two reactions [2] total 10 marks 6 (a) (i) (gravitational) potential or kinetic (ii) kinetic (iii) electrical [3] (b) 0.8 A, 2.2 V no tolerance [2] (c) 5 x 10 x 1 = 50 J (accept answer with unit missing) [1] (d) 2.2 x 0.8 x 10 = 17.6 J (accept answer with unit missing), e.c.f. from (b) [1] (e) energy lost as heat because of friction (1) resistance of connecting wire (1) because the dynamo is not efficient (1) lost as heat or sound when the mass falls to the bench (1) (reject “lost as heat from the bulb”) (any 2) [2] (f) change in voltage, current, time of falling, brighter bulb, reject “pulley turns faster” or “change of energy” (any 1) [1] total 10 marks