Cambridge IGCSE Physics 0625 — 2022 Oct/Nov Paper 5 · Variant 3
0625/53/O/N/22 · 4 questions · 40 marks · ≈45 min
The question paper and its mark scheme, free to read here and free to download. This is Cambridge’s own paper, exactly as it was sat.
Question paper16 pages



Mark scheme8 pages
Answers below. Sit the paper first if you are practising.
Questions as text
Q1 · In this experiment, you will investigate the dimensions of a boiling tube
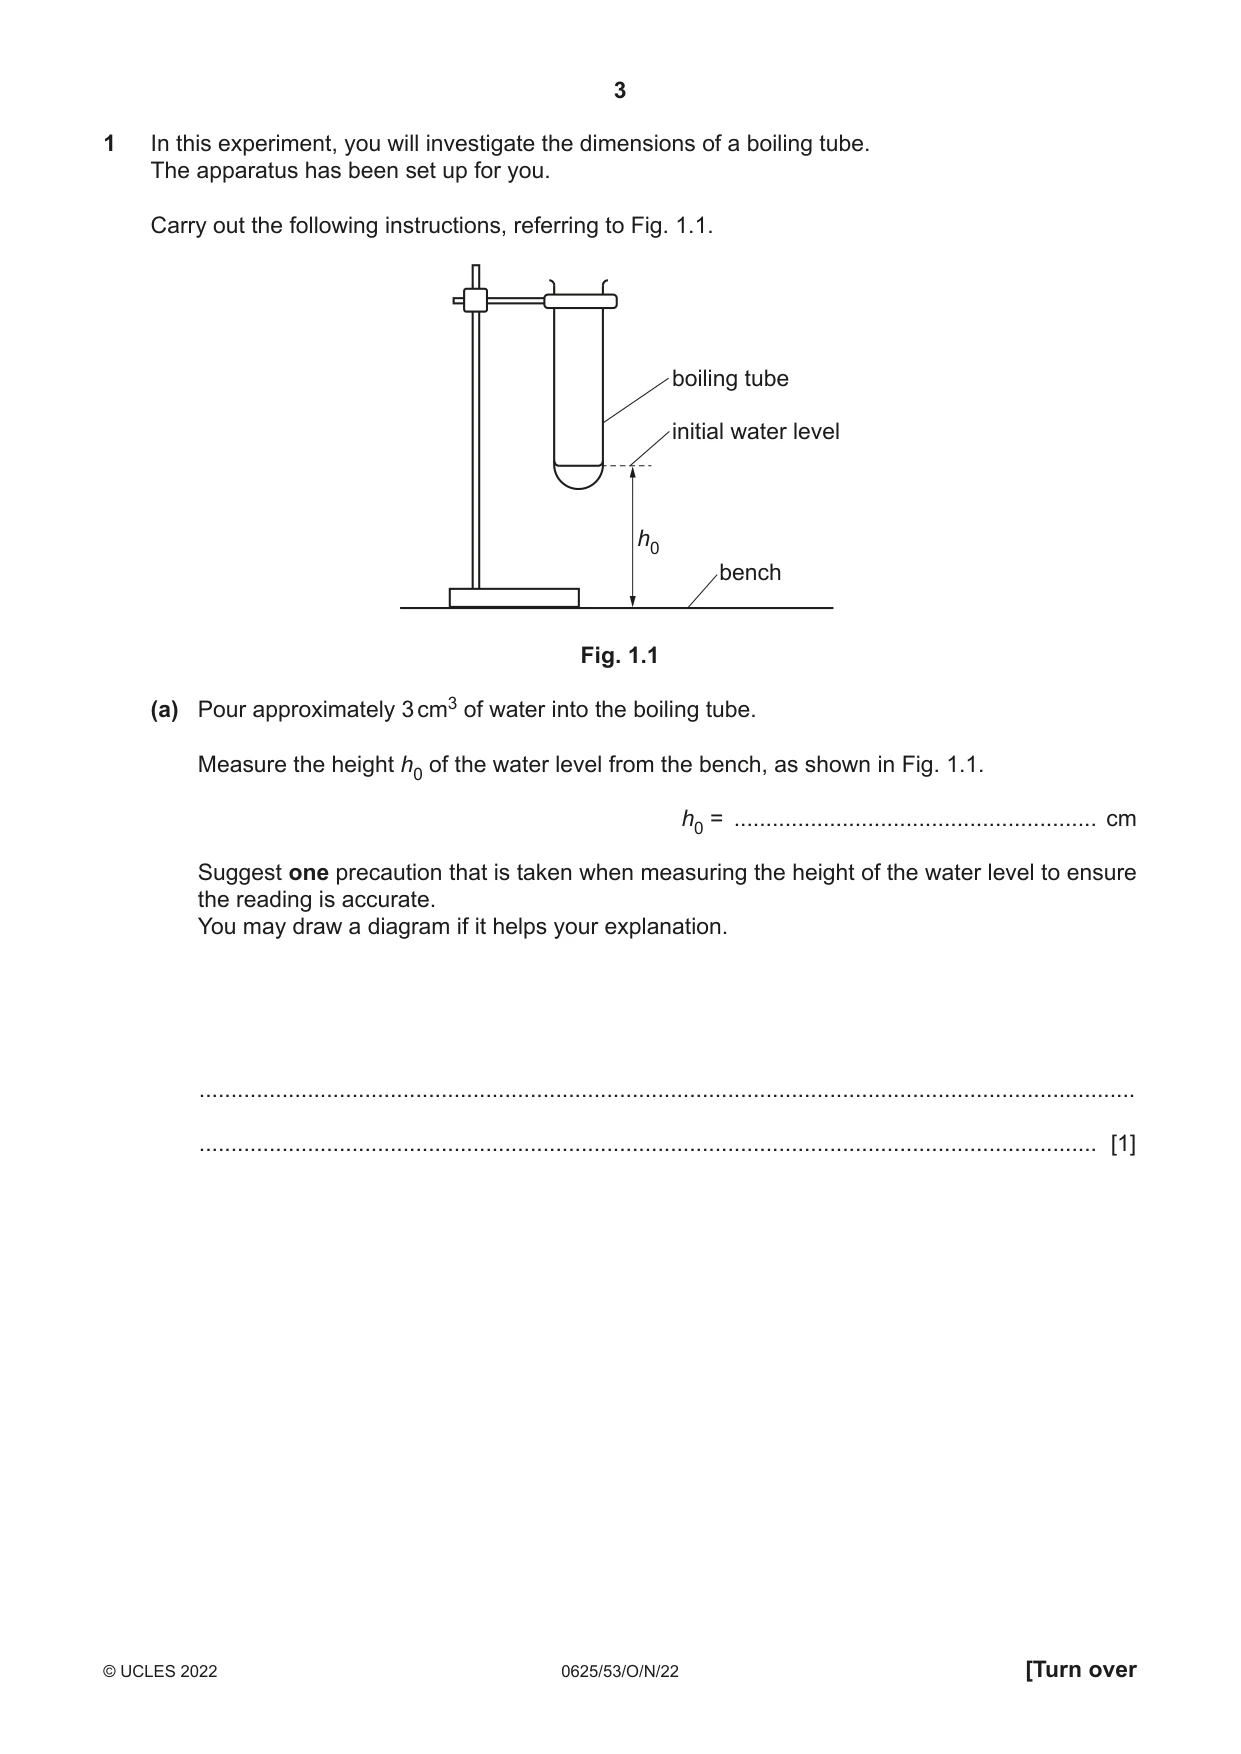
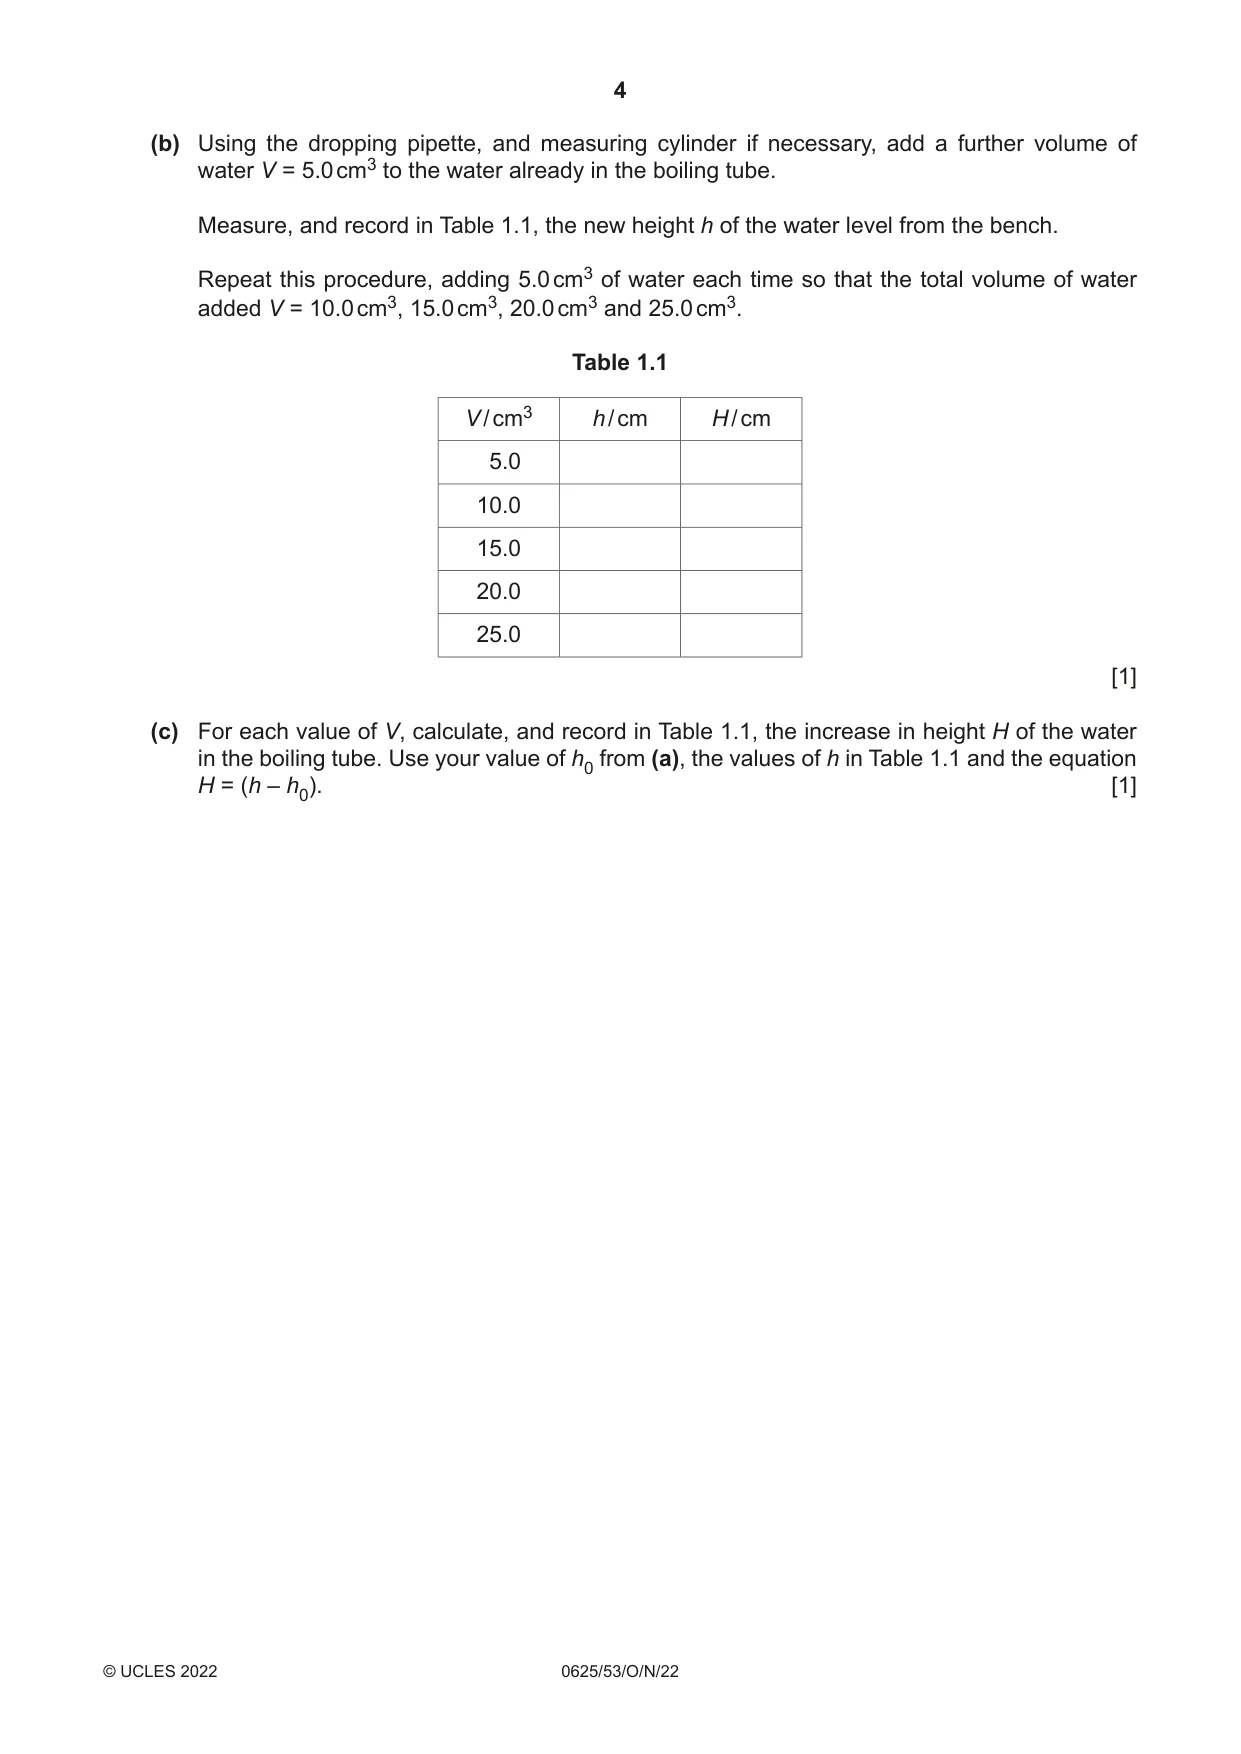
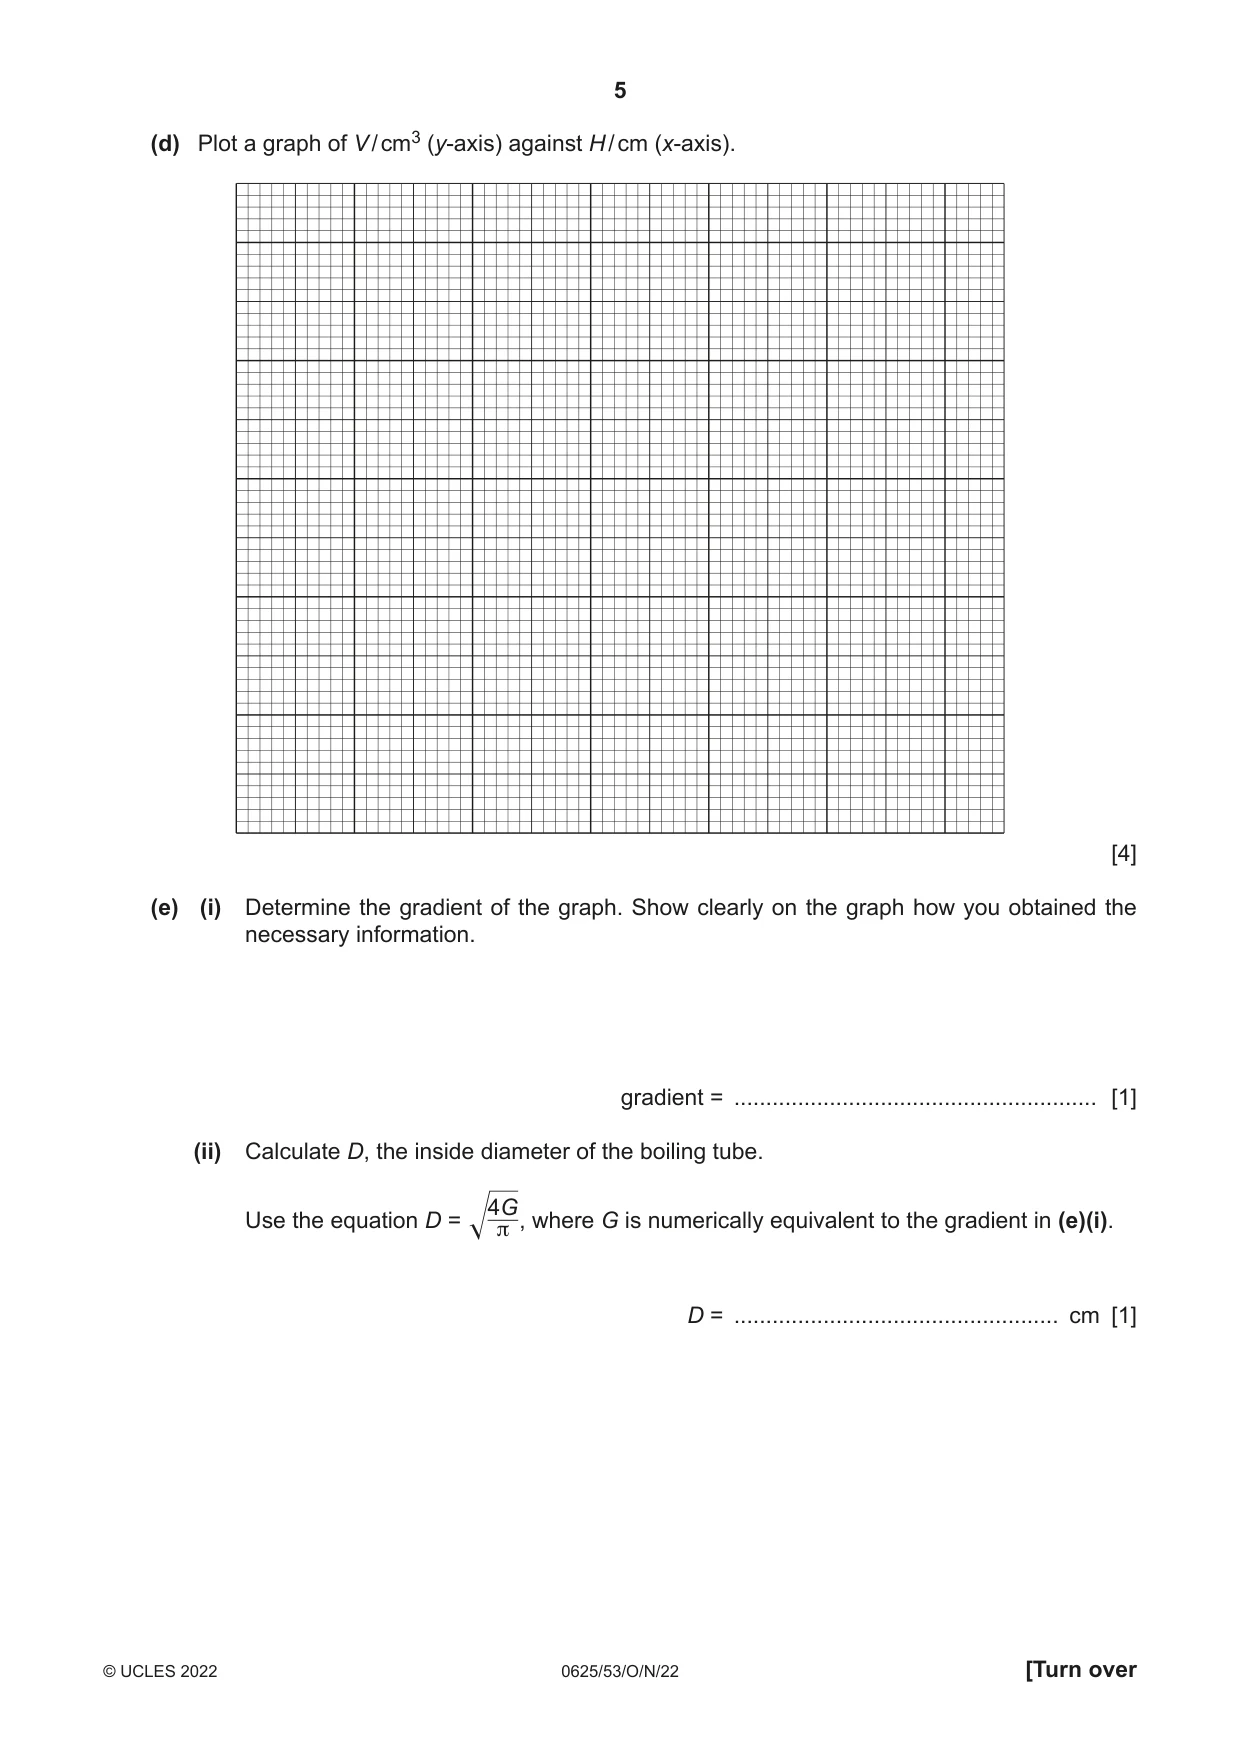
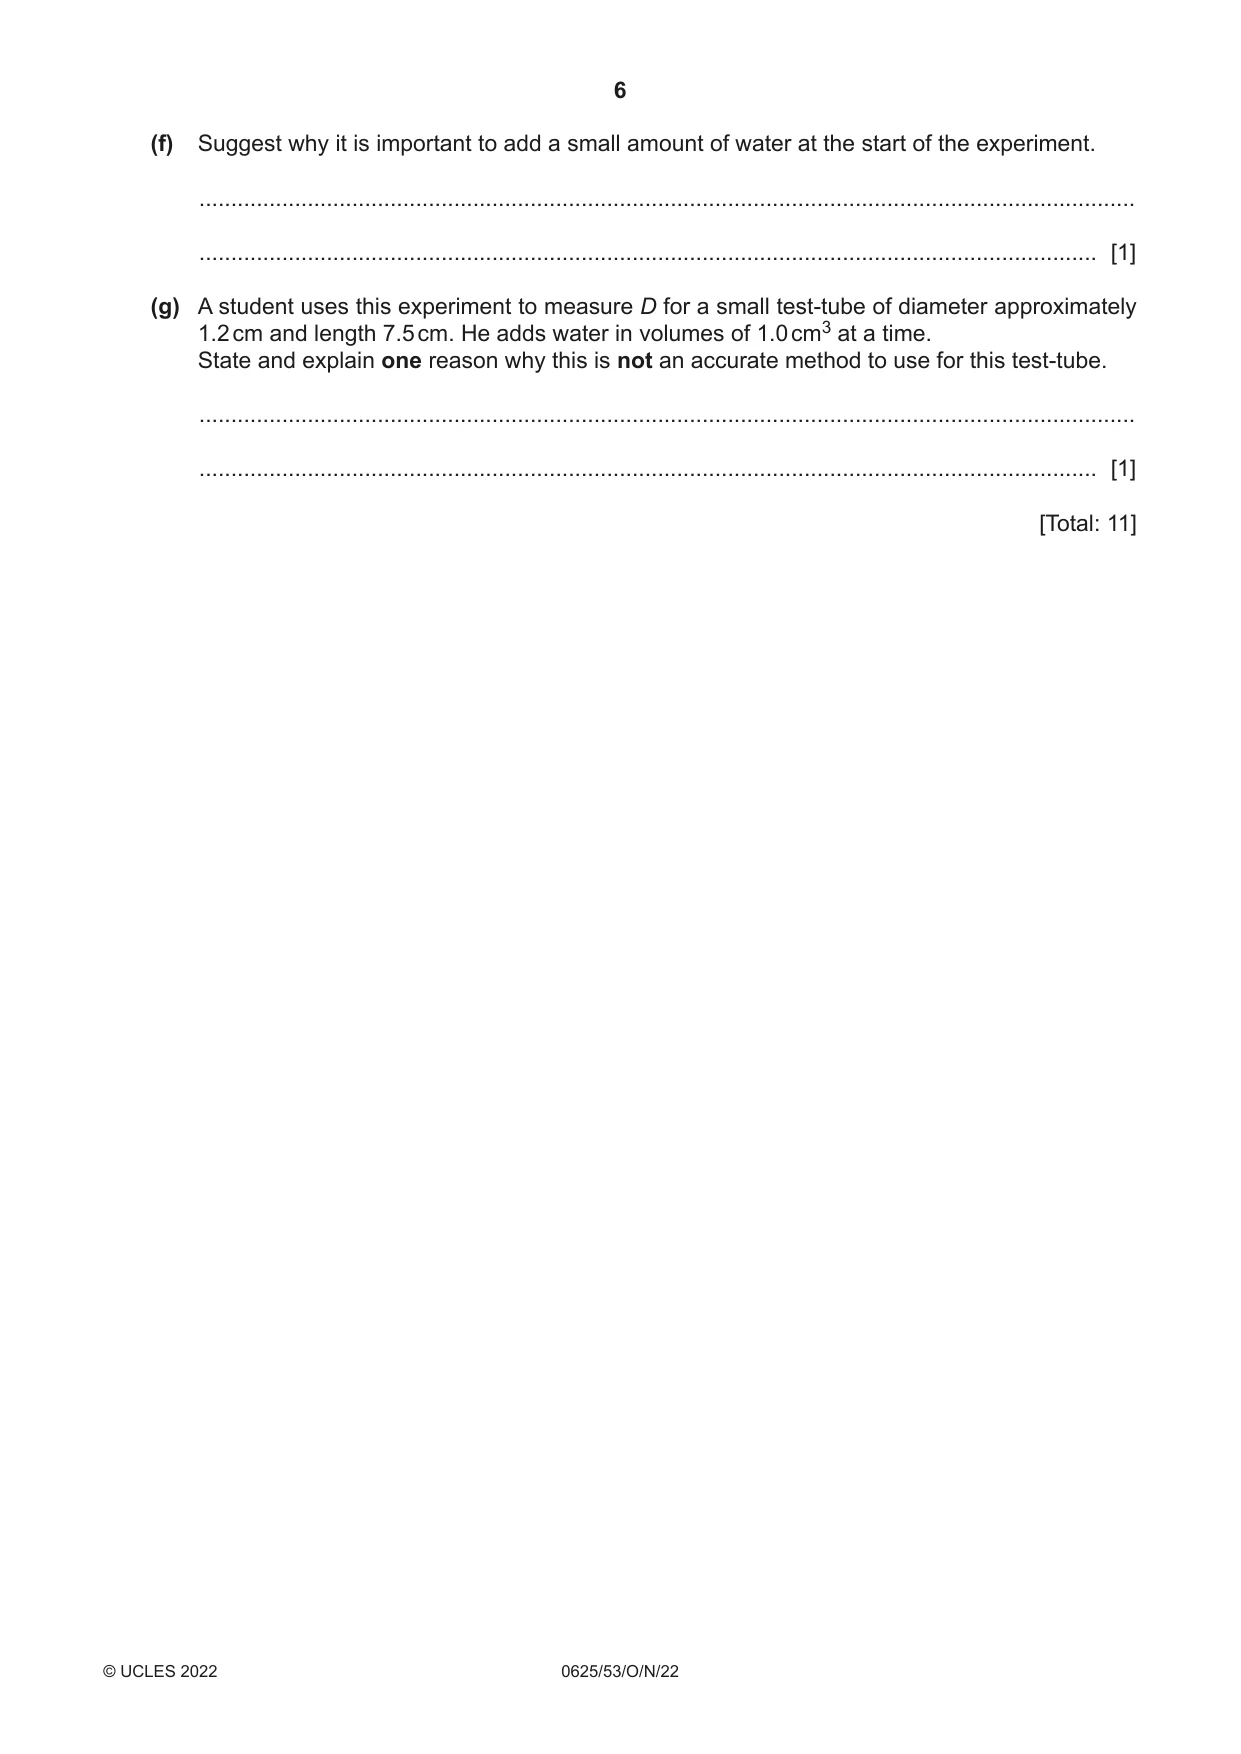
1 In this experiment, you will investigate the dimensions of a boiling tube. The apparatus has been set up for you. Carry out the following instructions, referring to Fig. 1.1. boiling tube initial water level h0 bench Fig. 1.1 (a) Pour approximately 3 cm3 of water into the boiling tube. Measure the height h0 of the water level from the bench, as shown in Fig. 1.1. h0 = ......................................................... cm Suggest one precaution that is taken when measuring the height of the water level to ensure the reading is accurate. You may draw a diagram if it helps your explanation. ................................................................................................................................................... ............................................................................................................................................. [1] (b) Using the dropping pipette, and measuring cylinder if necessary, add a further volume of water V = 5.0 cm3 to the water already in the boiling tube. Measure, and record in Table 1.1, the new height h of the water level from the bench. Repeat this procedure, adding 5.0 cm3 of water each time so that the total volume of water added V = 10.0 cm3, 15.0 cm3, 20.0 cm3 and 25.0 cm3. Table 1.1 V / cm3 h / cm H / cm 5.0 10.0 15.0 20.0 25.0 [1] (c) For each value of V, calculate, and record in Table 1.1, the increase in height H of the water in the boiling tube. Use your value of h0 from (a), the values of h in Table 1.1 and the equation H = (h – h0). [1] (d) Plot a graph of V / cm3 (y-axis) against H / cm (x-axis). [4] (e) (i) Determine the gradient of the graph. Show clearly on the graph how you obtained the necessary information. gradient = ......................................................... [1] (ii) Calculate D, the inside diameter of the boiling tube. 4G Use the equation D = , where G is numerically equivalent to the gradient in (e)(i). π D = ................................................... cm [1] (f) Suggest why it is important to add a small amount of water at the start of the experiment. ................................................................................................................................................... ............................................................................................................................................. [1] (g) A student uses this experiment to measure D for a small test-tube of diameter approximately 1.2 cm and length 7.5 cm. He adds water in volumes of 1.0 cm3 at a time. State and explain one reason why this is not an accurate method to use for this test-tube. ................................................................................................................................................... ............................................................................................................................................. [1] [Total: 11]
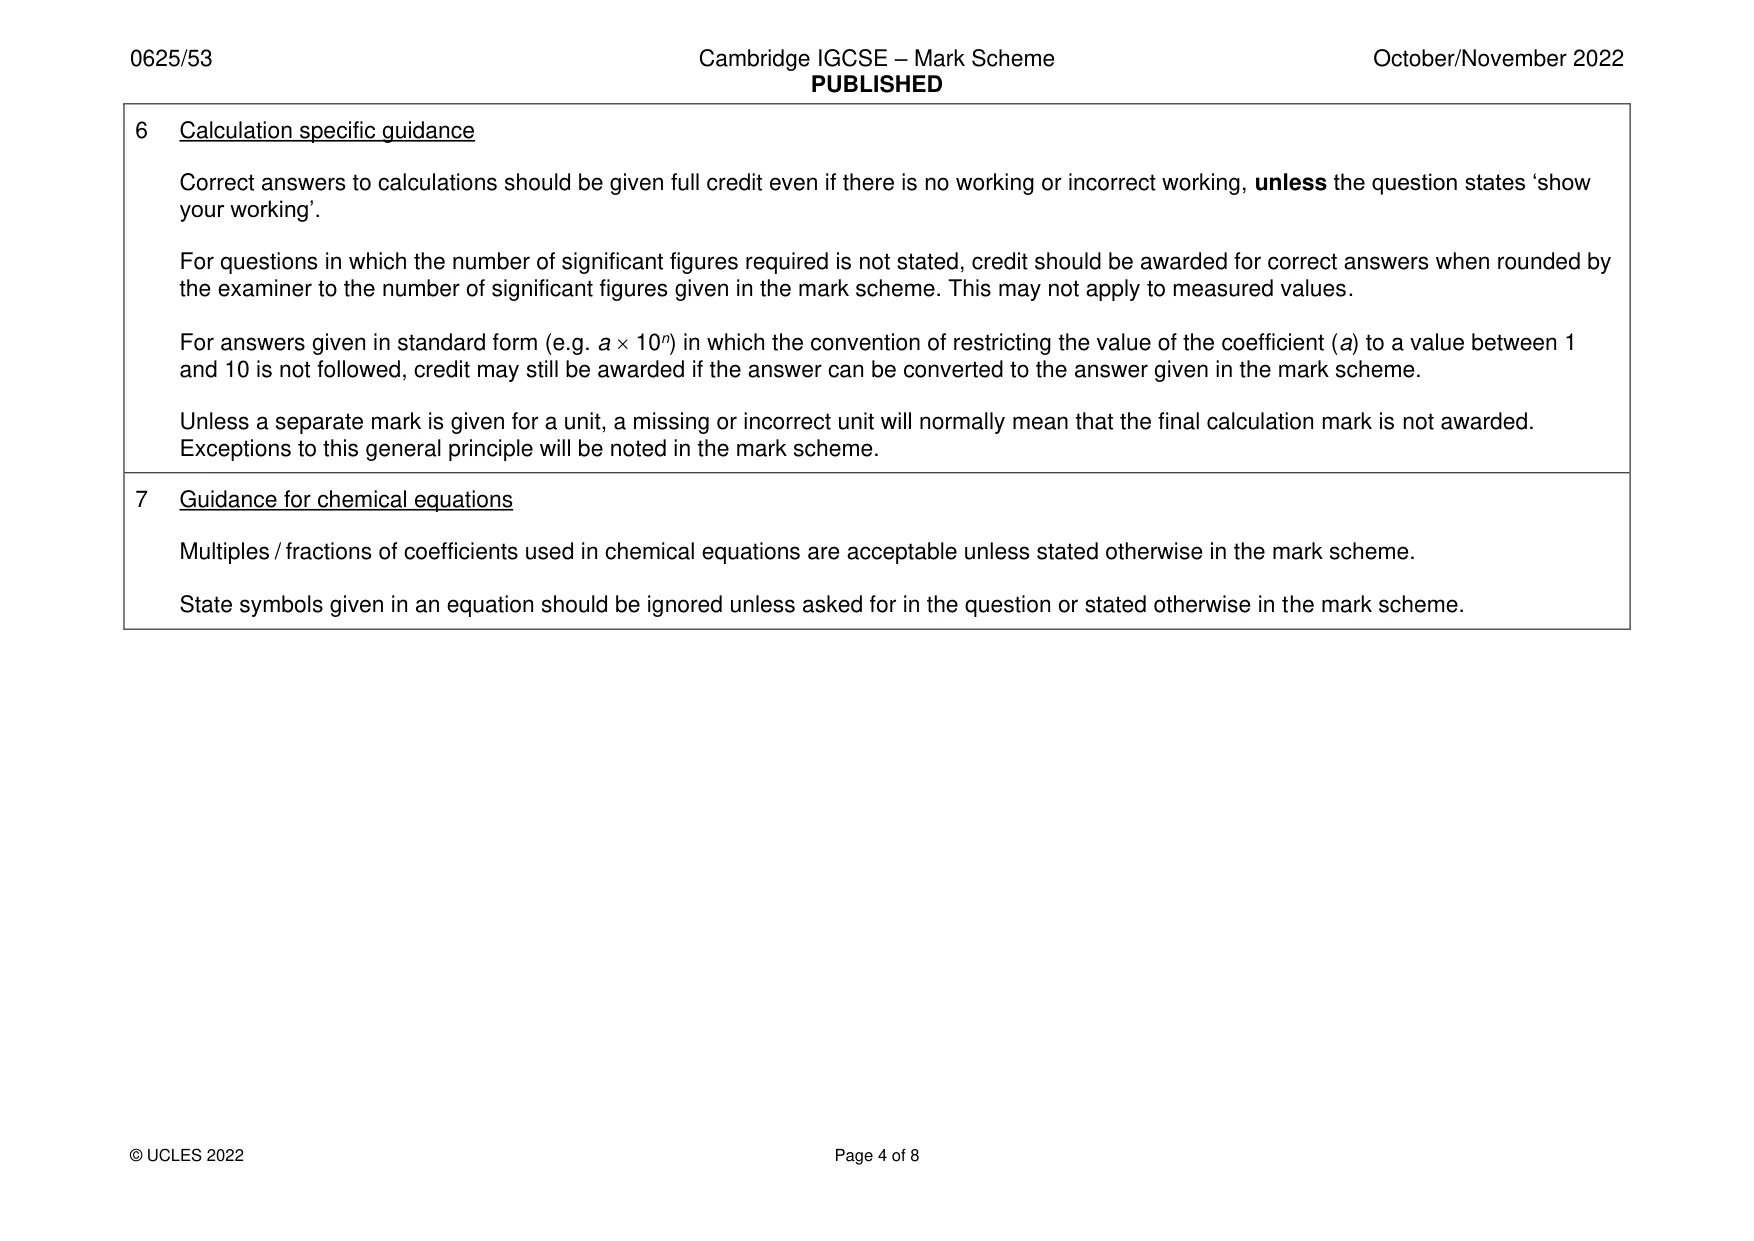
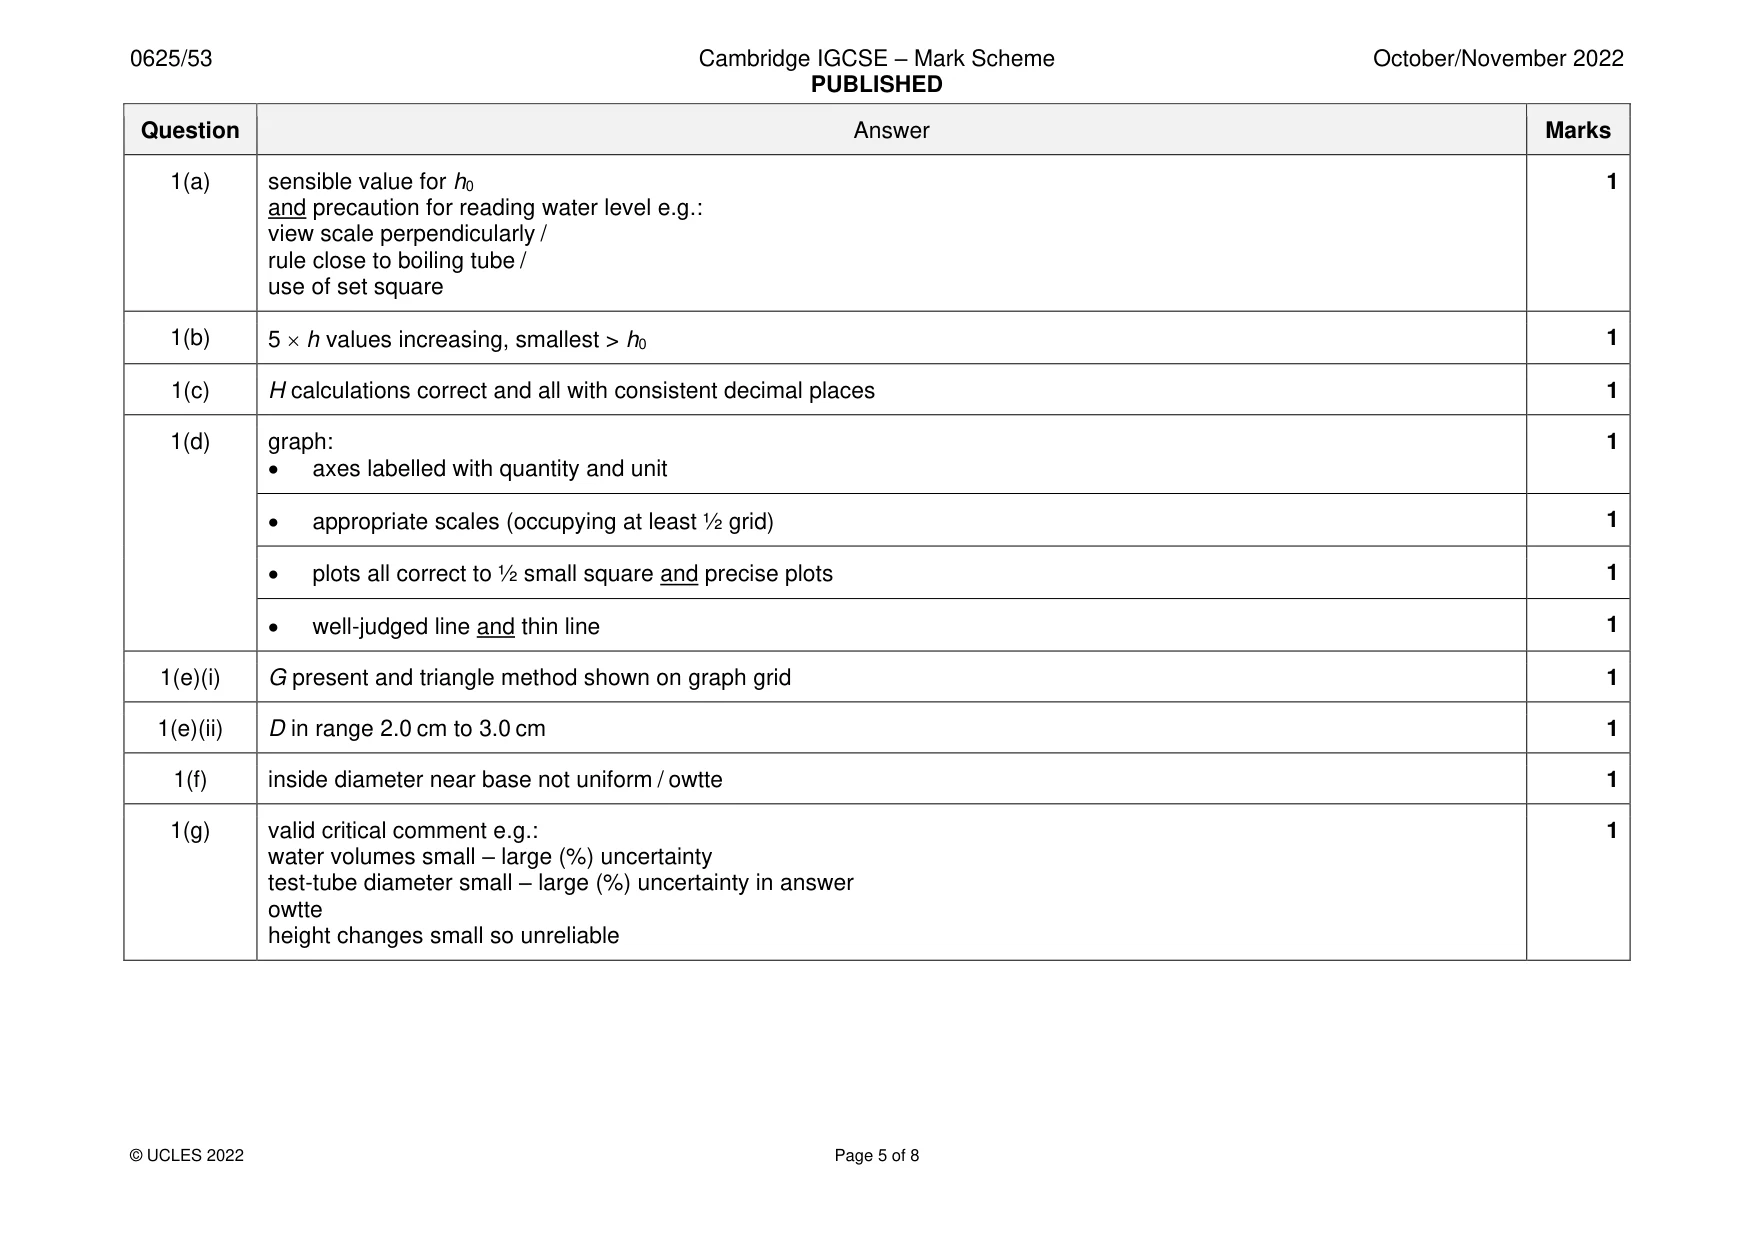
Mark scheme: Question Answer Marks 1(a) sensible value for h0 1 and precaution for reading water level e.g.: view scale perpendicularly / rule close to boiling tube / use of set square 1(b) 5 h values increasing, smallest > h0 1 1(c) H calculations correct and all with consistent decimal places 1 1(d) graph: 1 • axes labelled with quantity and unit • appropriate scales (occupying at least ½ grid) 1 • plots all correct to ½ small square and precise plots 1 • well-judged line and thin line 1 1(e)(i) G present and triangle method shown on graph grid 1 1(e)(ii) D in range 2.0 cm to 3.0 cm 1 1(f) inside diameter near base not uniform / owtte 1 1(g) valid critical comment e.g.: 1 water volumes small – large (%) uncertainty test-tube diameter small – large (%) uncertainty in answer owtte height changes small so unreliable
More questions on Physical quantities and measurement techniques
Q2 · In this experiment, you will investigate the effect of the colour of the outside surface…
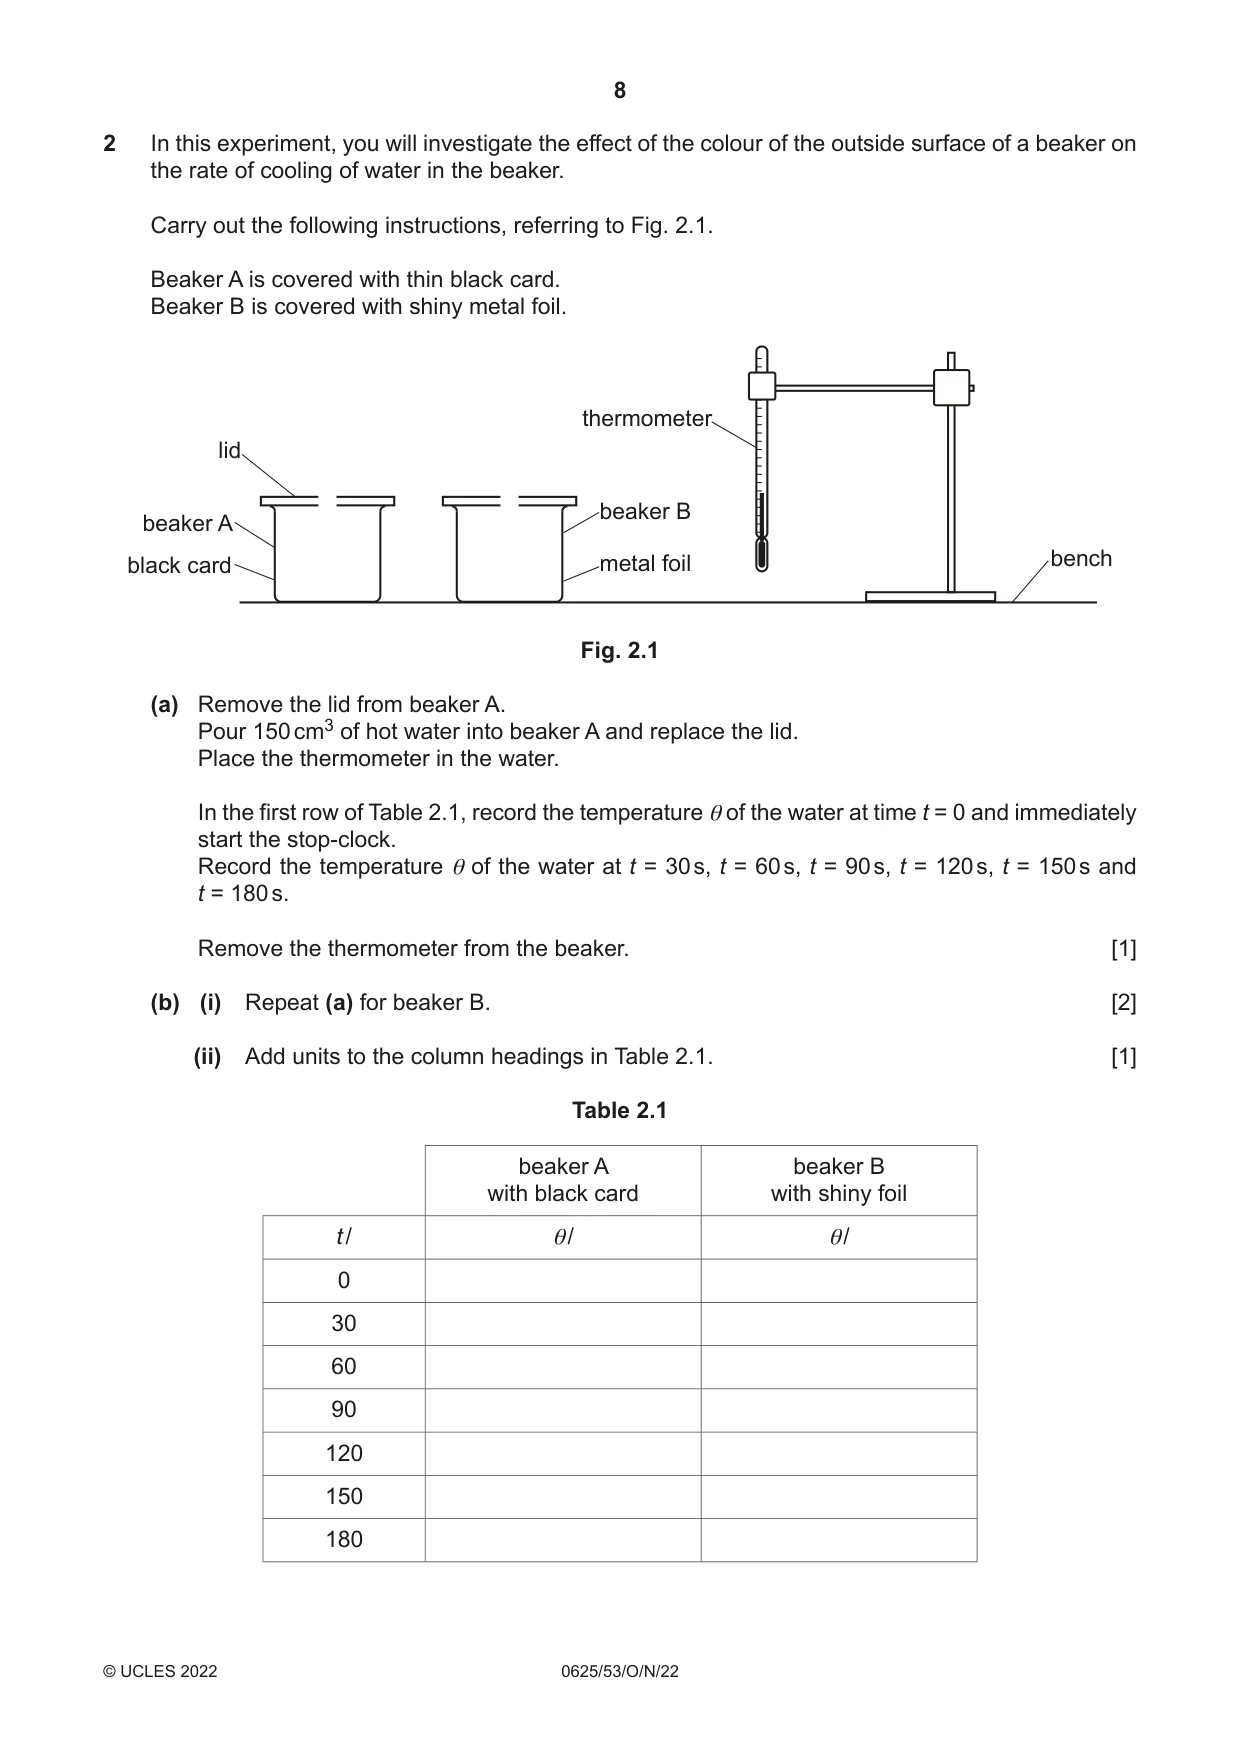
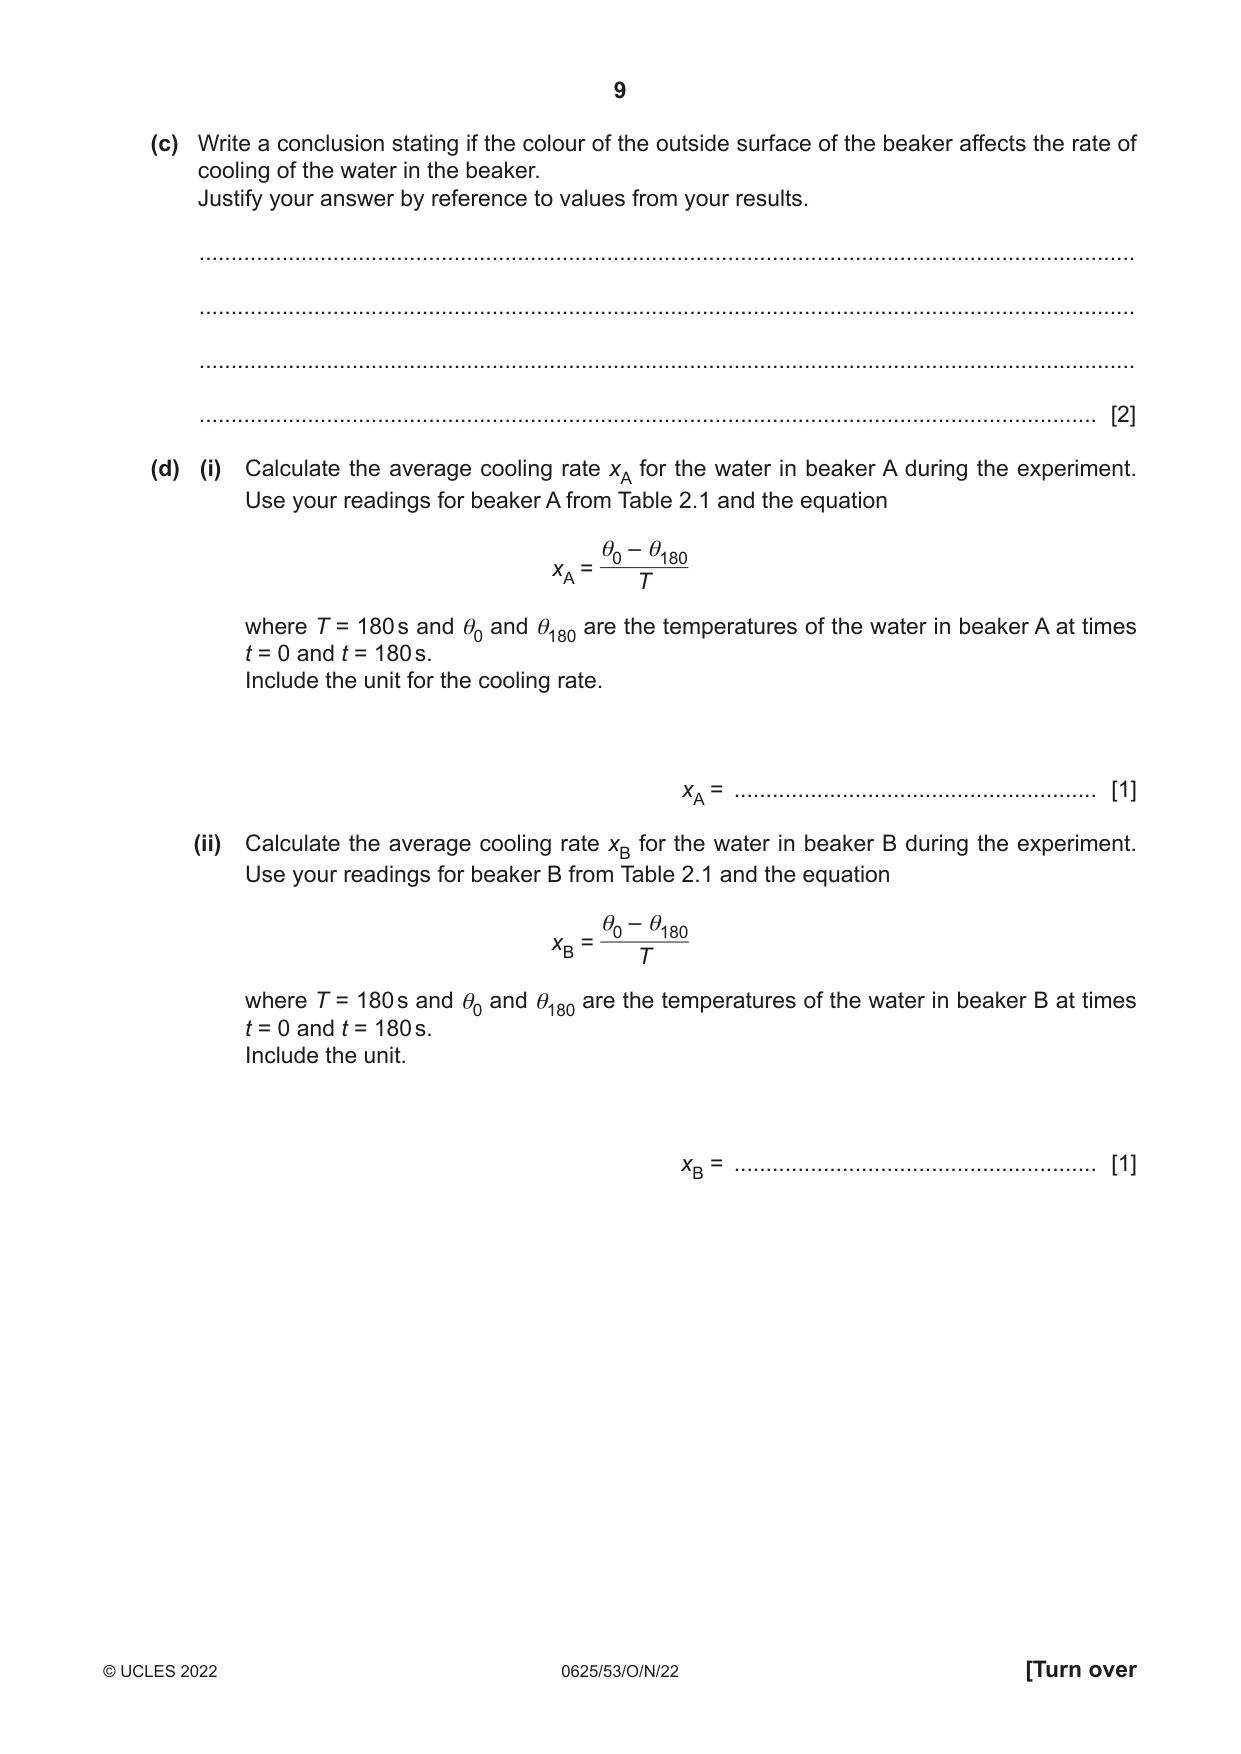
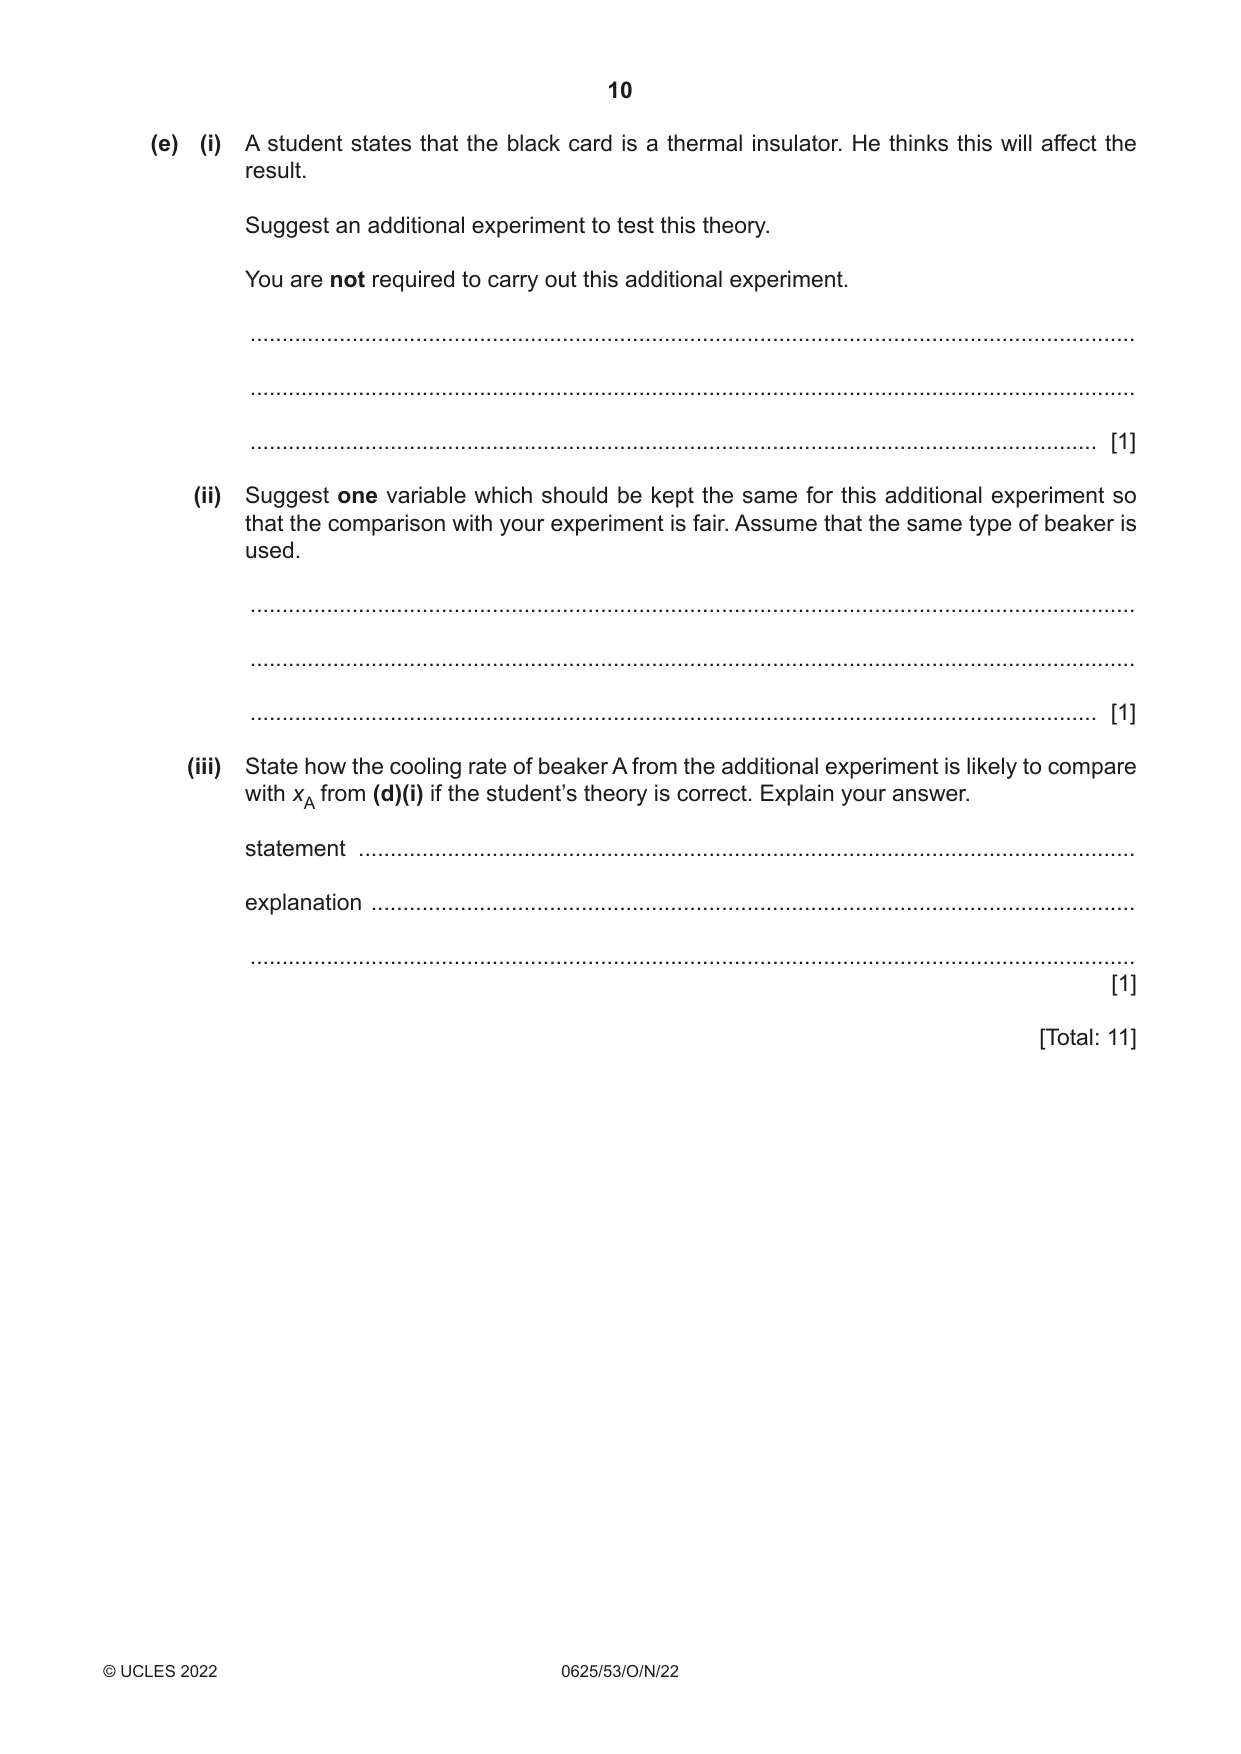
2 In this experiment, you will investigate the effect of the colour of the outside surface of a beaker on the rate of cooling of water in the beaker. Carry out the following instructions, referring to Fig. 2.1. Beaker A is covered with thin black card. Beaker B is covered with shiny metal foil. thermometer lid beaker B beaker A black card metal foil bench Fig. 2.1 (a) Remove the lid from beaker A. Pour 150 cm3 of hot water into beaker A and replace the lid. Place the thermometer in the water. In the first row of Table 2.1, record the temperature θ of the water at time t = 0 and immediately start the stop-clock. Record the temperature θ of the water at t = 30 s, t = 60 s, t = 90 s, t = 120 s, t = 150 s and t = 180 s. Remove the thermometer from the beaker. [1] (b) (i) Repeat (a) for beaker B. [2] (ii) Add units to the column headings in Table 2.1. [1] Table 2.1 beaker A beaker B with black card with shiny foil t / θ/ θ/ 0 30 60 90 120 150 180 (c) Write a conclusion stating if the colour of the outside surface of the beaker affects the rate of cooling of the water in the beaker. Justify your answer by reference to values from your results. ................................................................................................................................................... ................................................................................................................................................... ................................................................................................................................................... ............................................................................................................................................. [2] (d) (i) Calculate the average cooling rate xA for the water in beaker A during the experiment. Use your readings for beaker A from Table 2.1 and the equation θ0 – θ180 xA = T where T = 180 s and θ0 and θ180 are the temperatures of the water in beaker A at times t = 0 and t = 180 s. Include the unit for the cooling rate. xA = ......................................................... [1] (ii) Calculate the average cooling rate xB for the water in beaker B during the experiment. Use your readings for beaker B from Table 2.1 and the equation θ0 – θ180 xB = T where T = 180 s and θ0 and θ180 are the temperatures of the water in beaker B at times t = 0 and t = 180 s. Include the unit. xB = ......................................................... [1] (e) (i) A student states that the black card is a thermal insulator. He thinks this will affect the result. Suggest an additional experiment to test this theory. You are not required to carry out this additional experiment. ........................................................................................................................................... ........................................................................................................................................... ..................................................................................................................................... [1] (ii) Suggest one variable which should be kept the same for this additional experiment so that the comparison with your experiment is fair. Assume that the same type of beaker is used. ........................................................................................................................................... ........................................................................................................................................... ..................................................................................................................................... [1] (iii) State how the cooling rate of beaker A from the additional experiment is likely to compare with xA from (d)(i) if the student’s theory is correct. Explain your answer. statement .......................................................................................................................... explanation ........................................................................................................................ ........................................................................................................................................... [1] [Total: 11]
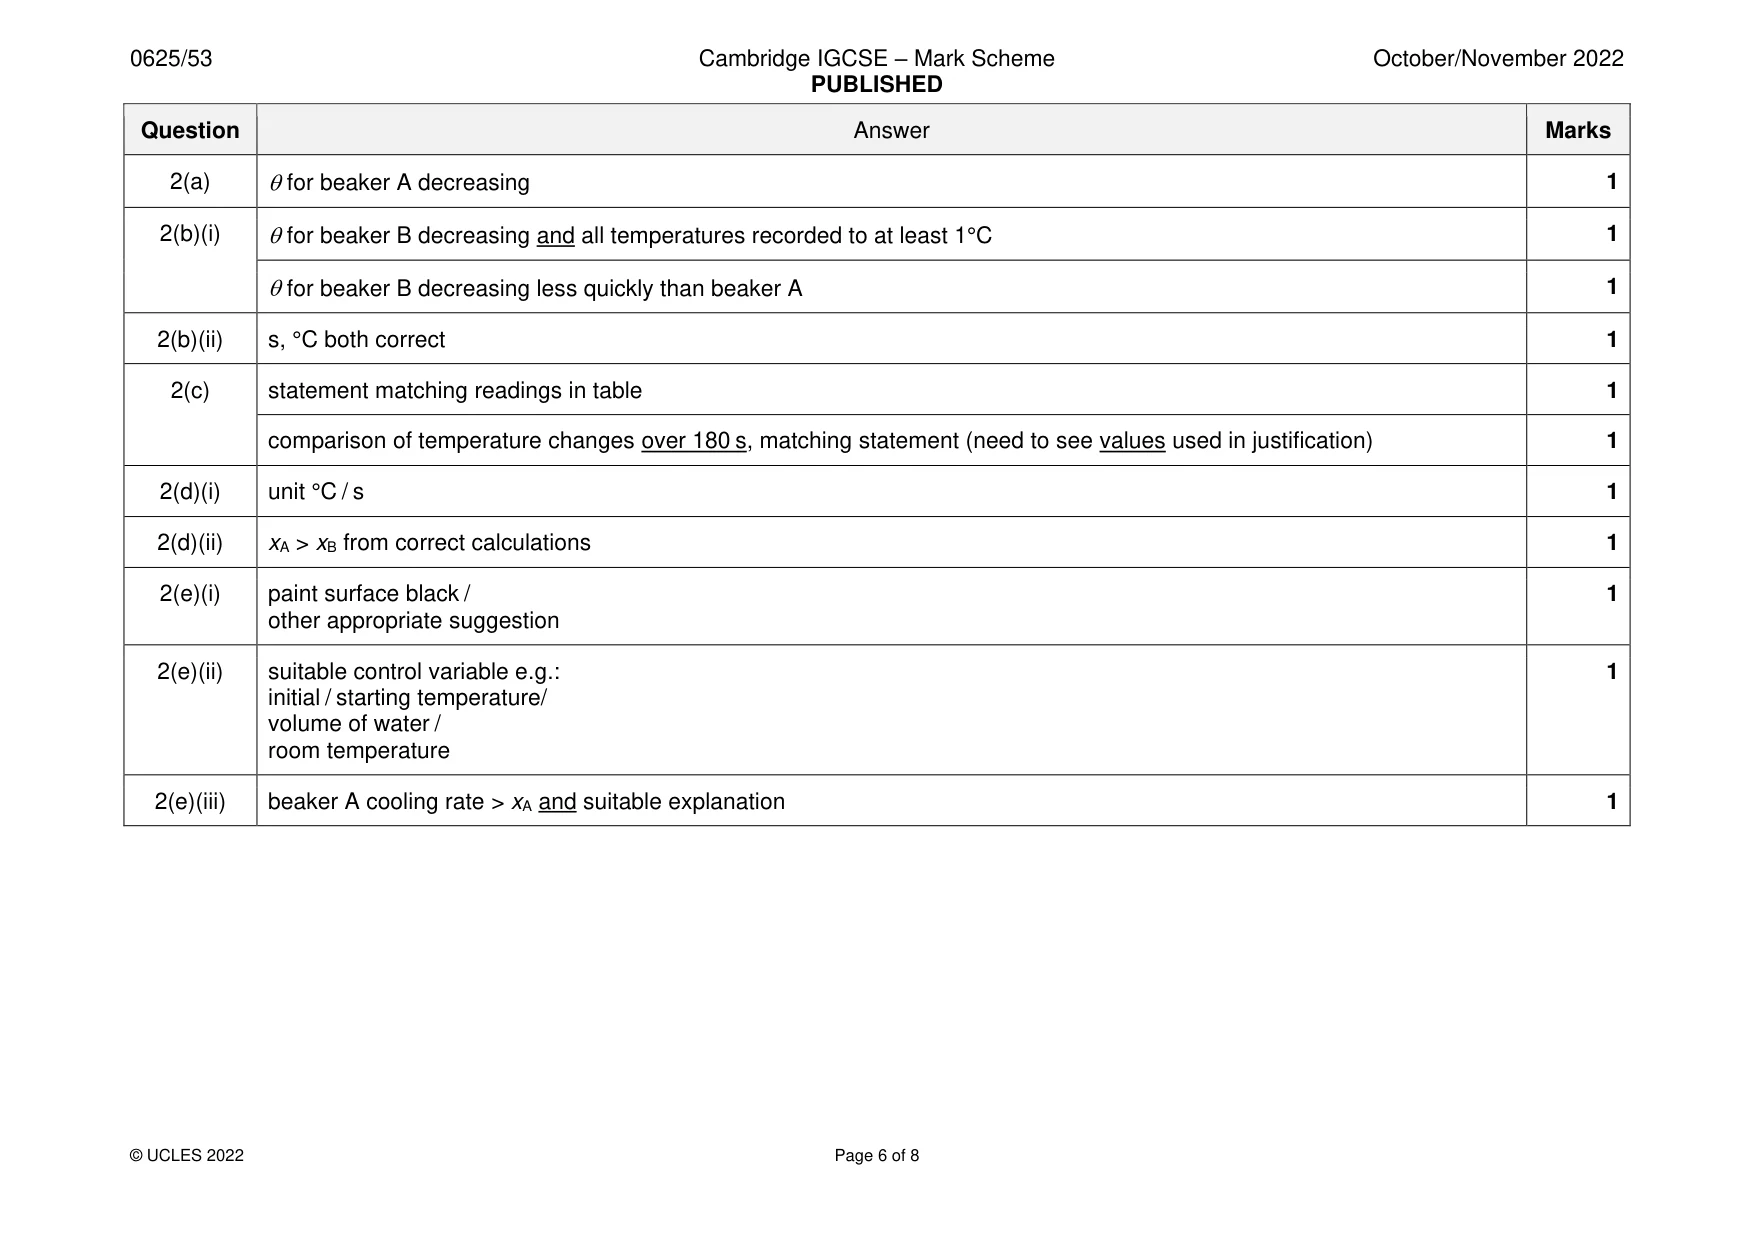
Mark scheme: 2(a) for beaker A decreasing 1 2(b)(i) for beaker B decreasing and all temperatures recorded to at least 1°C 1 for beaker B decreasing less quickly than beaker A 1 2(b)(ii) s, °C both correct 1 2(c) statement matching readings in table 1 comparison of temperature changes over 180 s, matching statement (need to see values used in justification) 1 2(d)(i) unit °C / s 1 2(d)(ii) xA > xB from correct calculations 1 2(e)(i) paint surface black / 1 other appropriate suggestion 2(e)(ii) suitable control variable e.g.: 1 initial / starting temperature/ volume of water / room temperature 2(e)(iii) beaker A cooling rate > xA and suitable explanation 1
Q3 · In this experiment, you will investigate circuits containing resistors in parallel
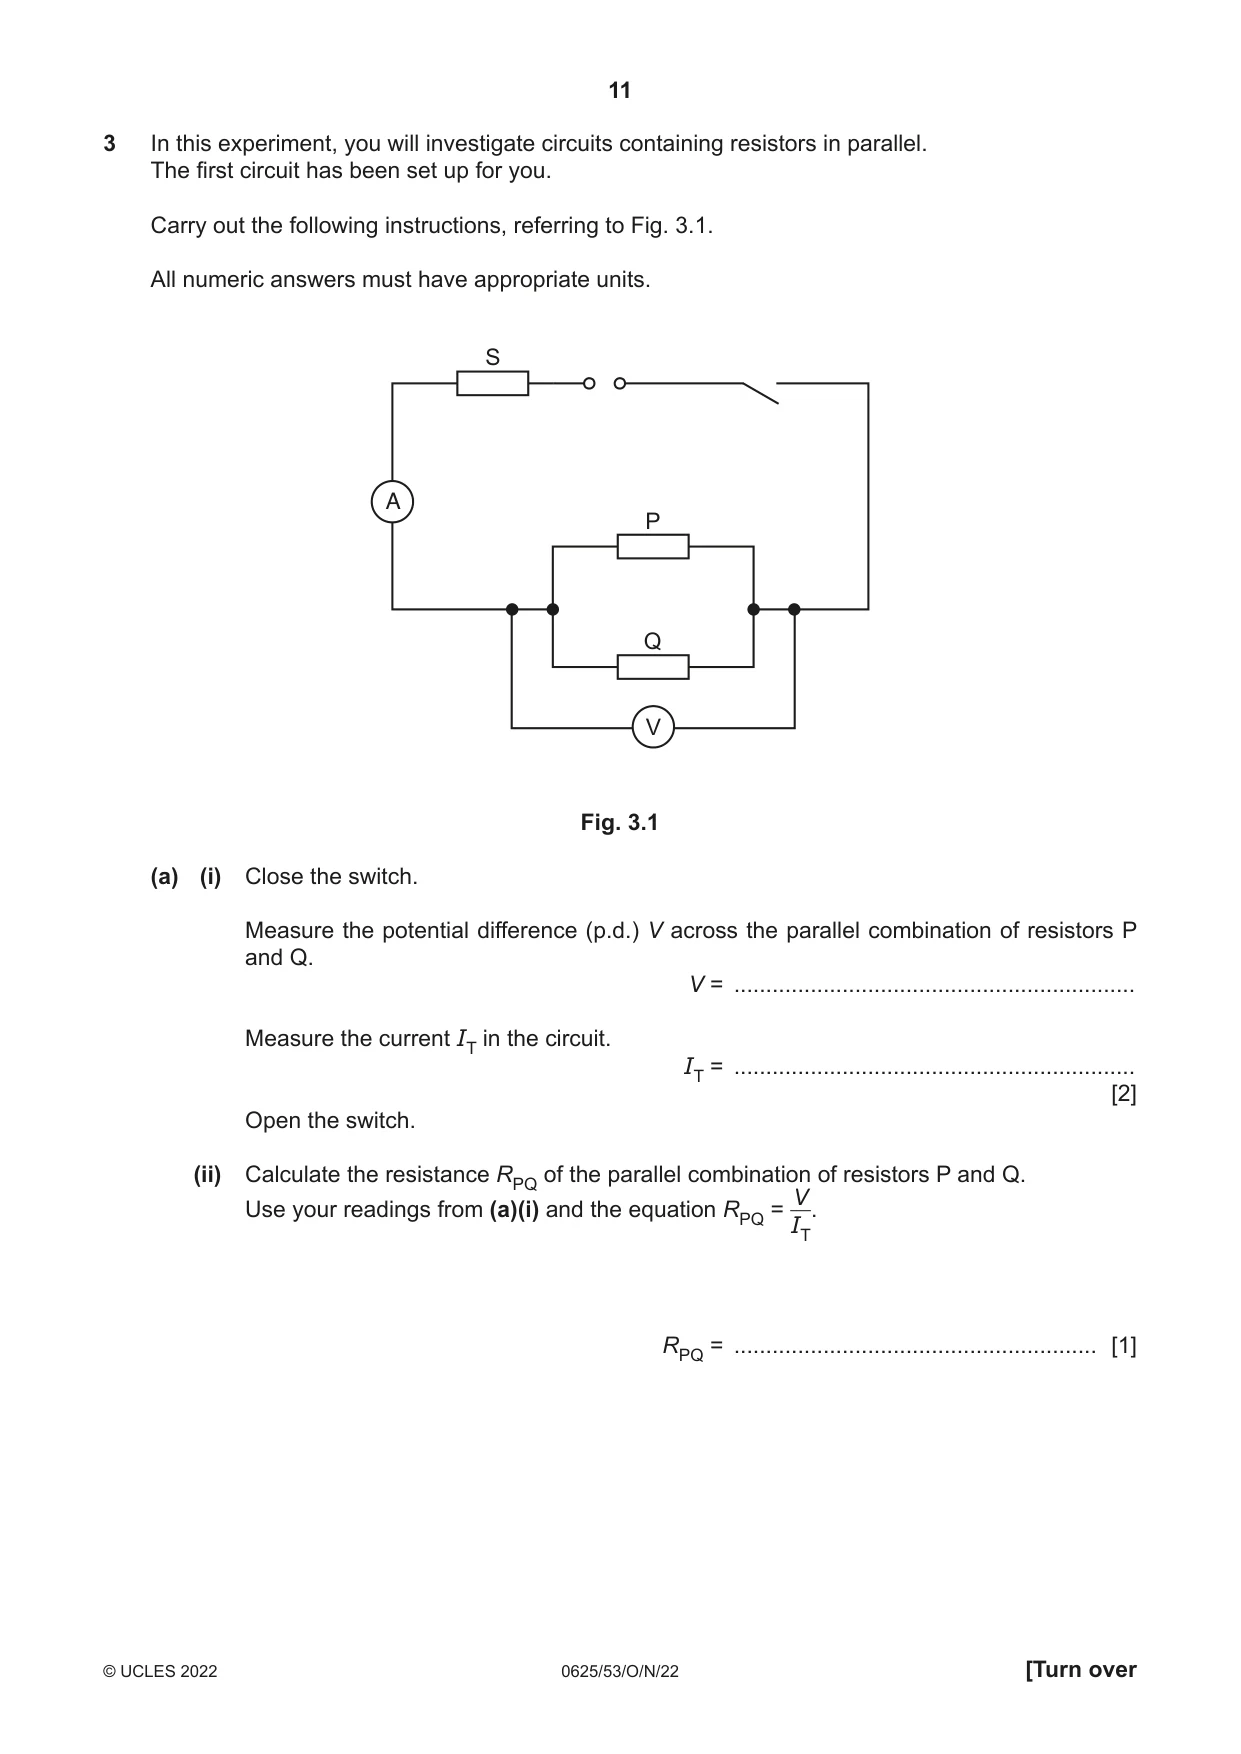
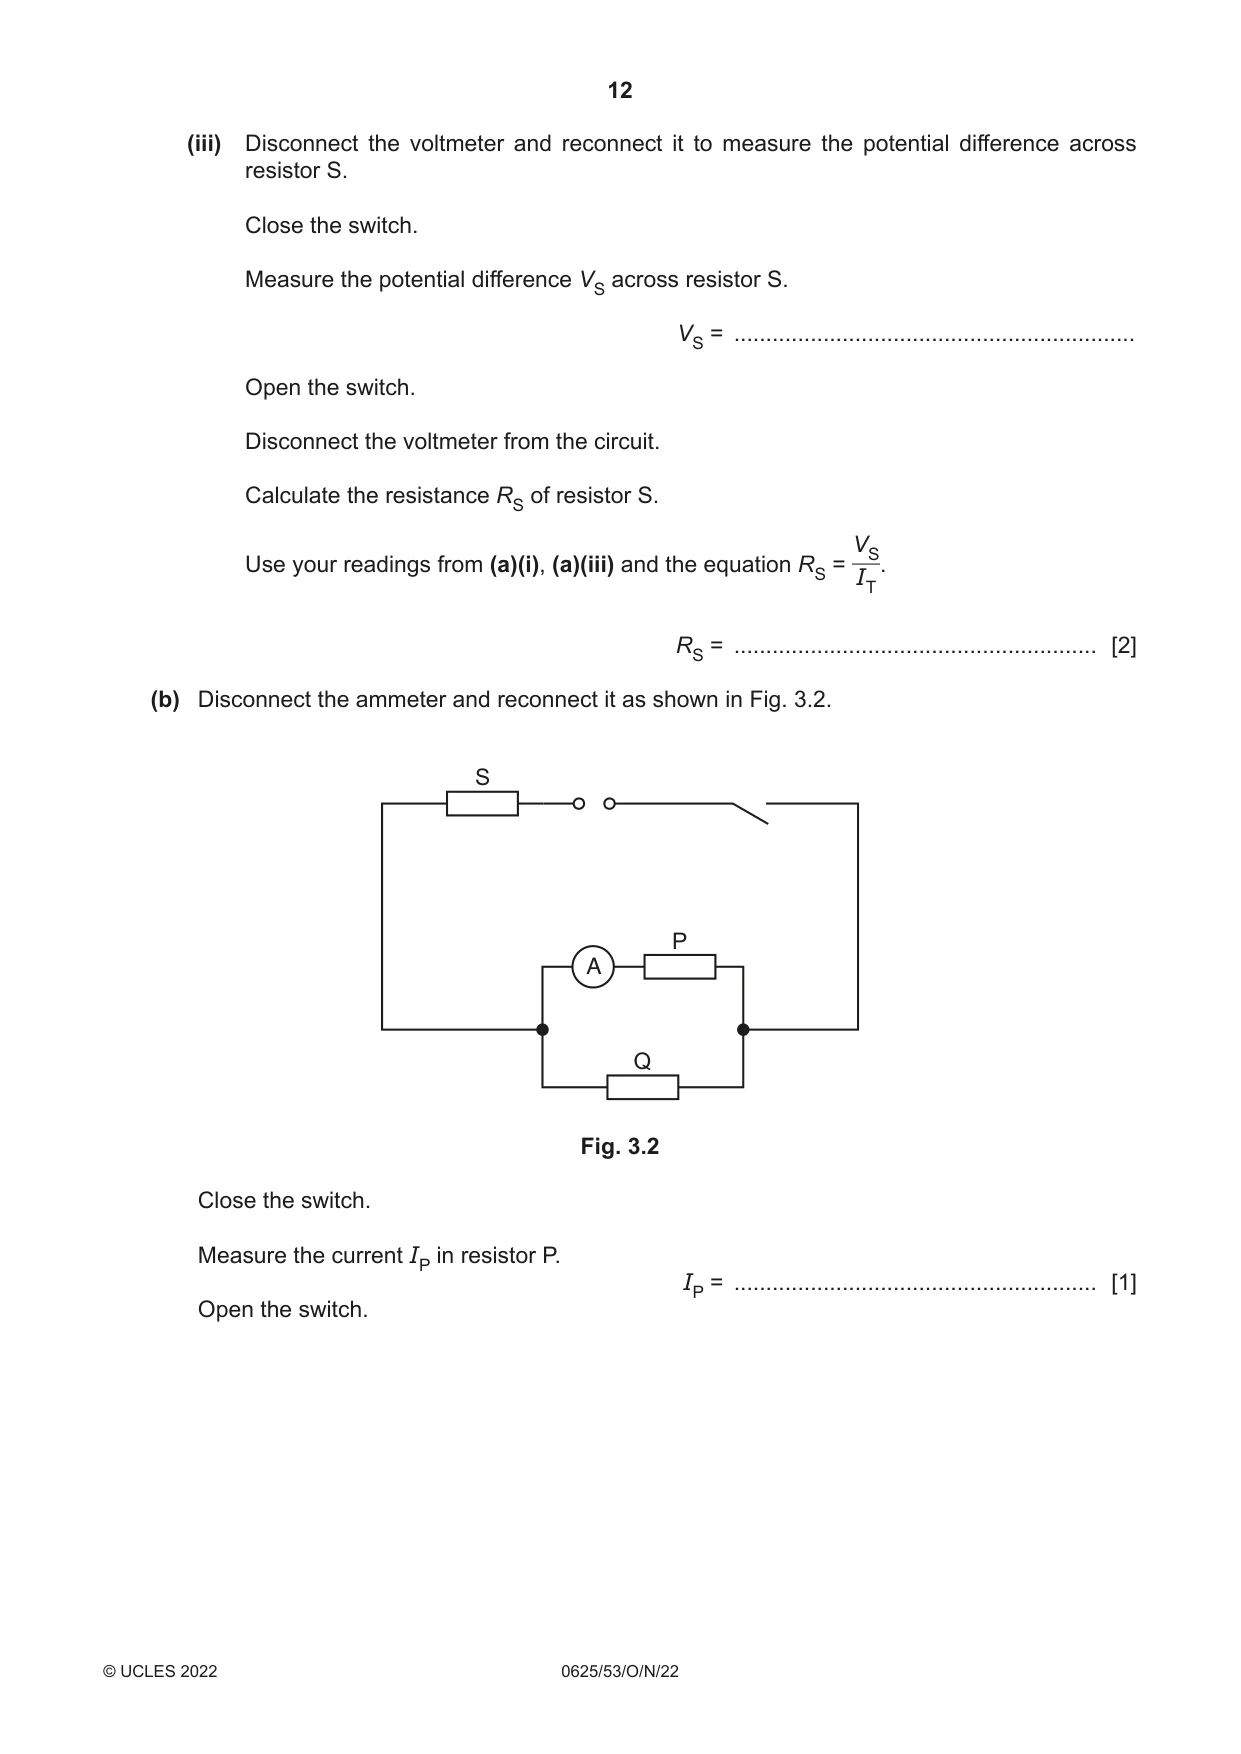
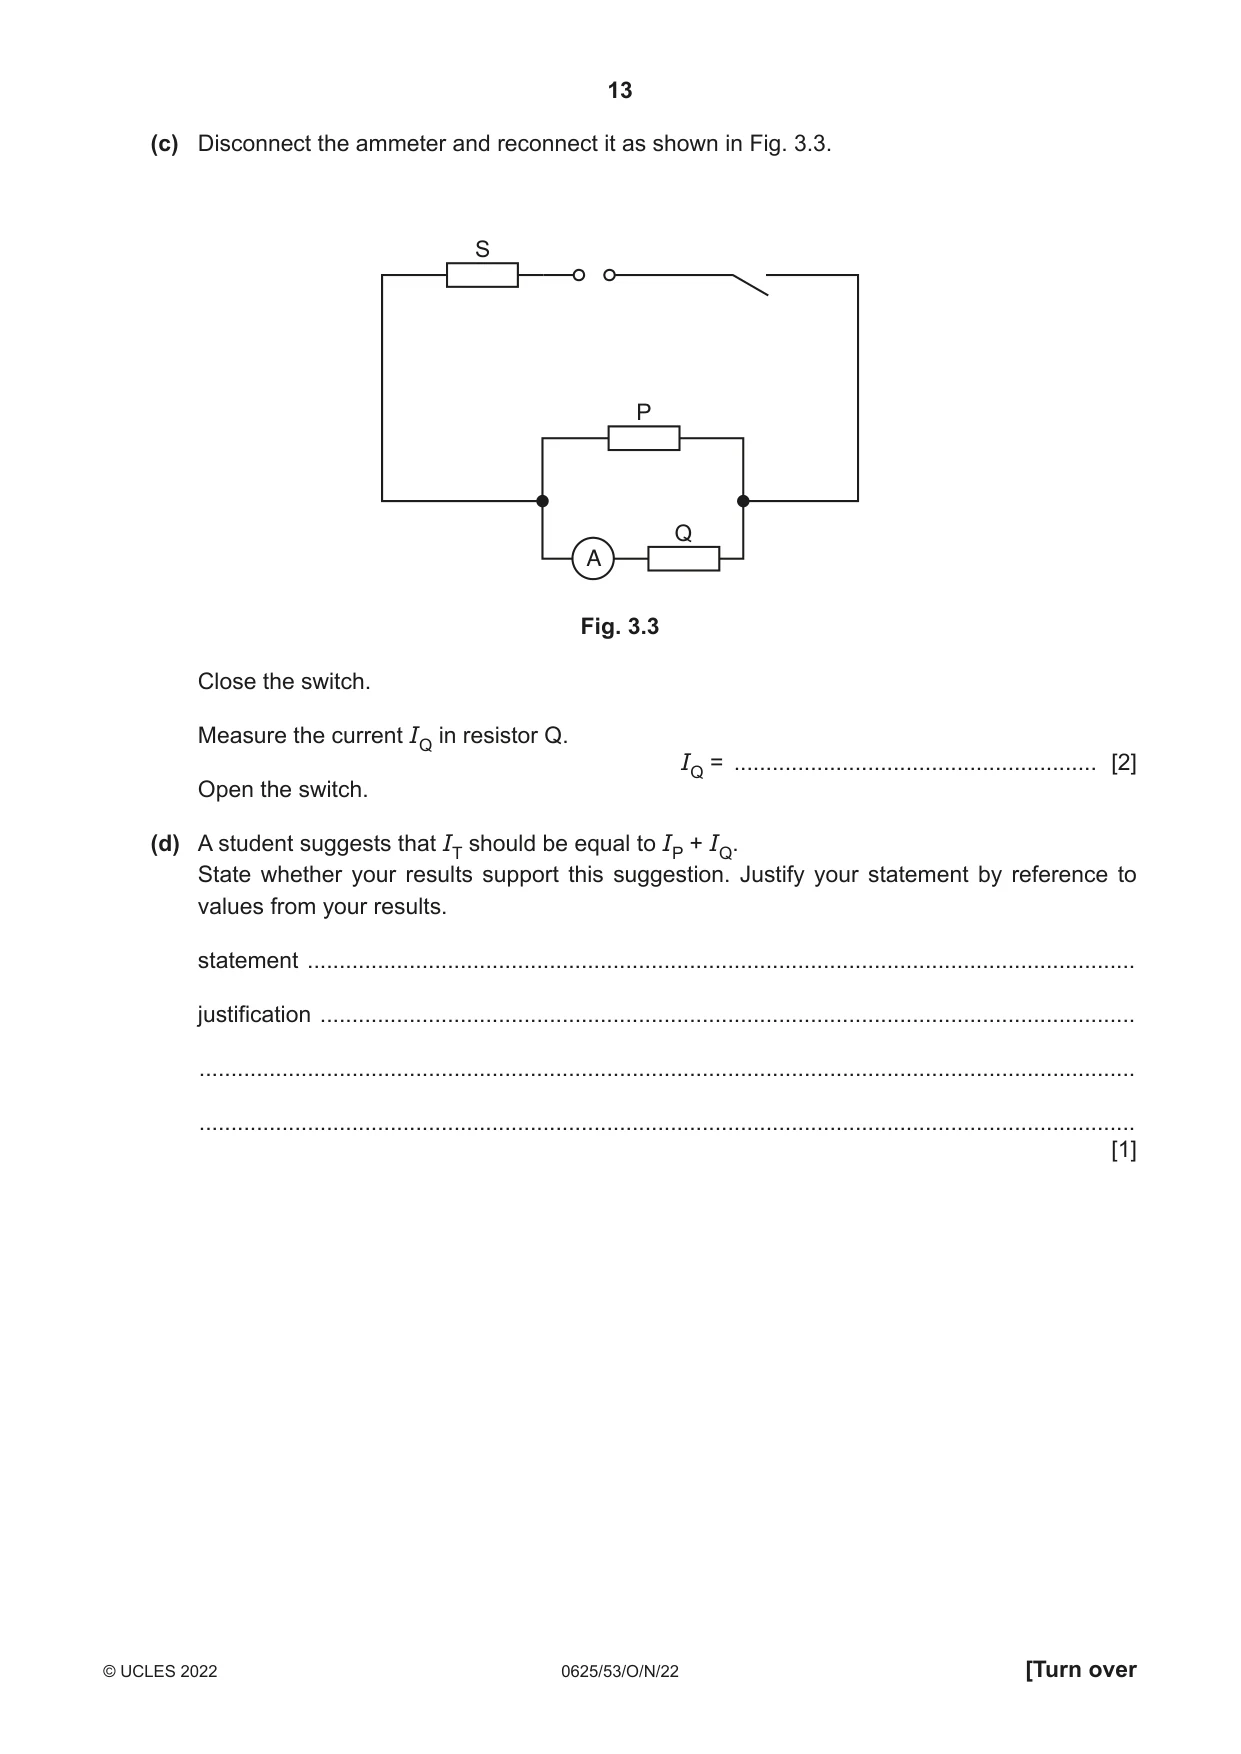
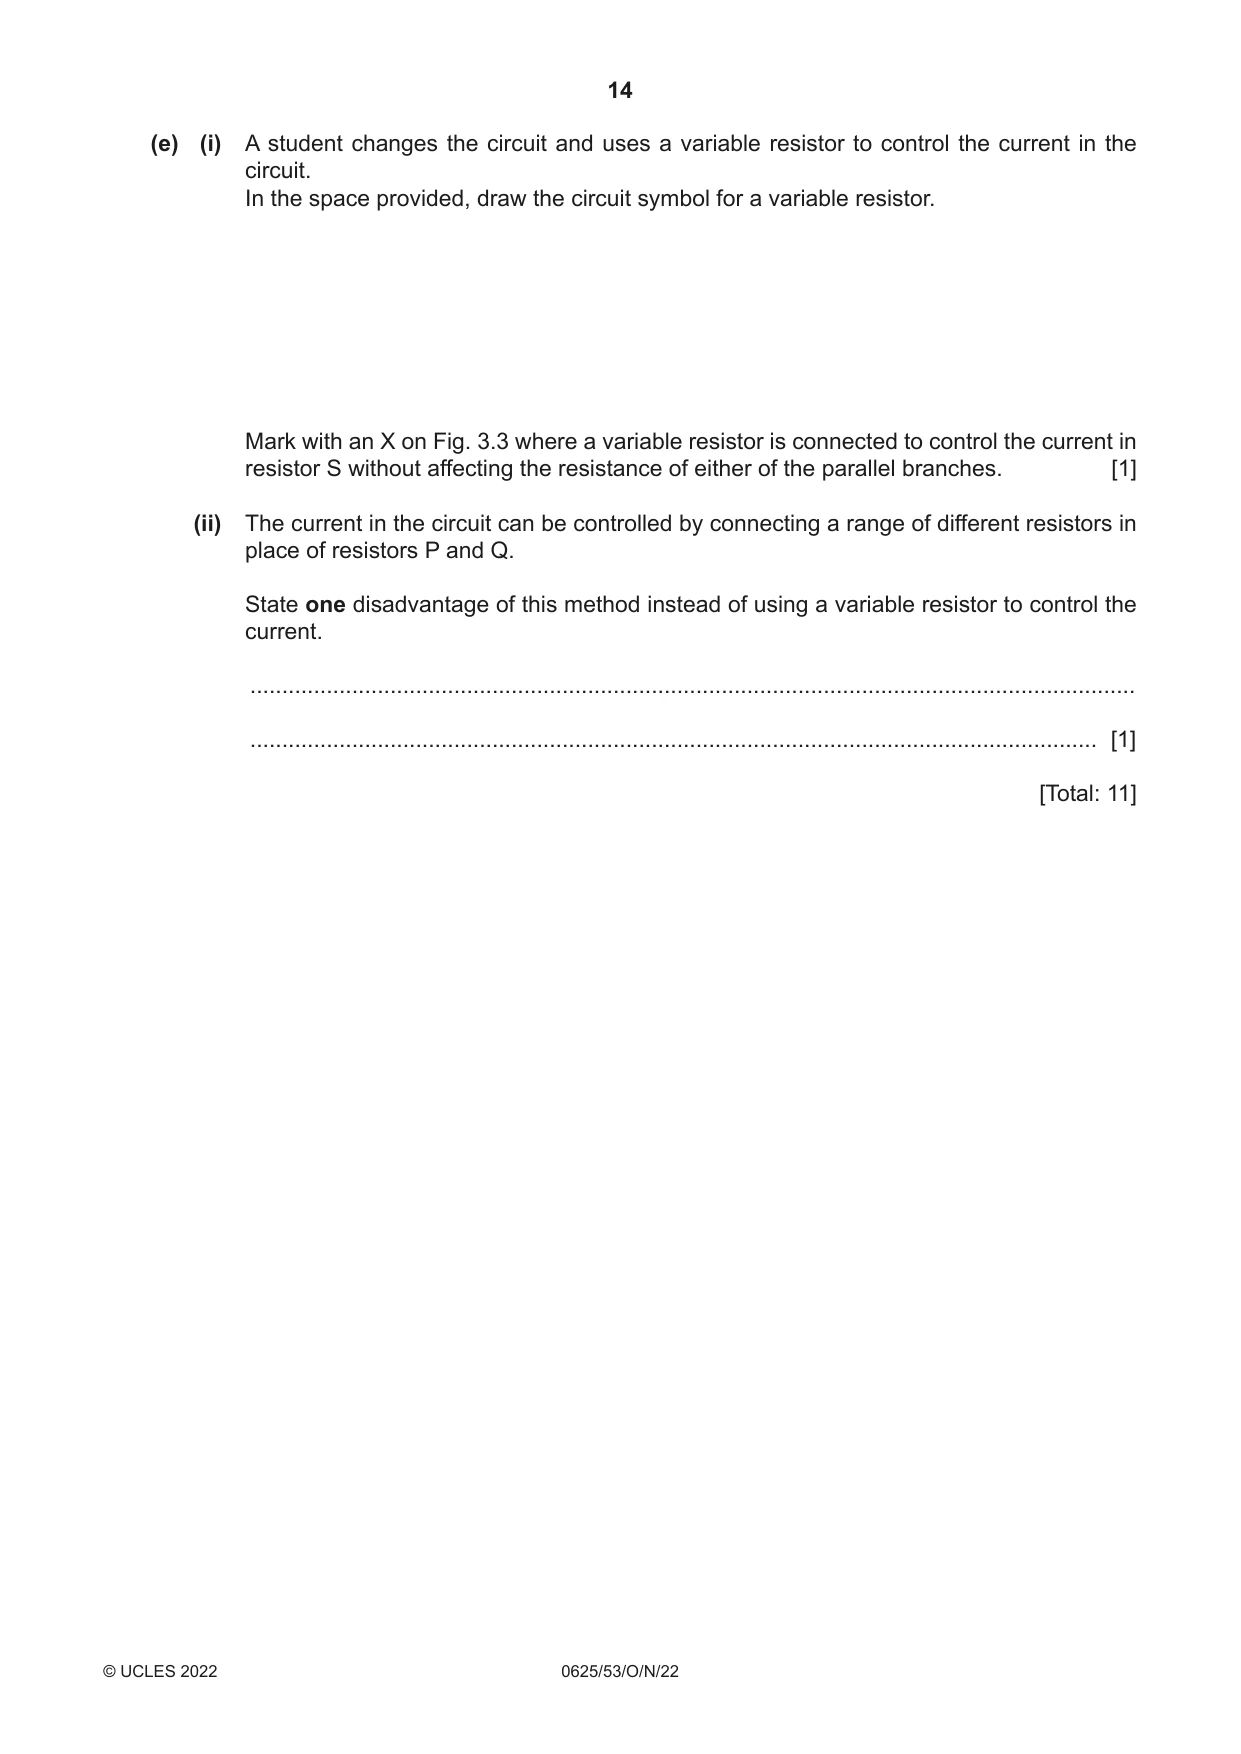
3 In this experiment, you will investigate circuits containing resistors in parallel. The first circuit has been set up for you. Carry out the following instructions, referring to Fig. 3.1. All numeric answers must have appropriate units. S A P Q V Fig. 3.1 (a) (i) Close the switch. Measure the potential difference (p.d.) V across the parallel combination of resistors P and Q. V = ............................................................... Measure the current IT in the circuit. IT = ............................................................... [2] Open the switch. (ii) Calculate the resistance RPQ of the parallel combination of resistors P and Q. V Use your readings from (a)(i) and the equation RPQ = . IT RPQ = ......................................................... [1] (iii) Disconnect the voltmeter and reconnect it to measure the potential difference across resistor S. Close the switch. Measure the potential difference VS across resistor S. VS = ............................................................... Open the switch. Disconnect the voltmeter from the circuit. Calculate the resistance RS of resistor S. VS Use your readings from (a)(i), (a)(iii) and the equation RS = . IT RS = ......................................................... [2] (b) Disconnect the ammeter and reconnect it as shown in Fig. 3.2. S P A Q Fig. 3.2 Close the switch. Measure the current IP in resistor P. IP = ......................................................... [1] Open the switch. (c) Disconnect the ammeter and reconnect it as shown in Fig. 3.3. S P Q A Fig. 3.3 Close the switch. Measure the current IQ in resistor Q. IQ = ......................................................... [2] Open the switch. (d) A student suggests that IT should be equal to IP + IQ. State whether your results support this suggestion. Justify your statement by reference to values from your results. statement .................................................................................................................................. justification ................................................................................................................................ ................................................................................................................................................... ................................................................................................................................................... [1] (e) (i) A student changes the circuit and uses a variable resistor to control the current in the circuit. In the space provided, draw the circuit symbol for a variable resistor. Mark with an X on Fig. 3.3 where a variable resistor is connected to control the current in resistor S without affecting the resistance of either of the parallel branches. [1] (ii) The current in the circuit can be controlled by connecting a range of different resistors in place of resistors P and Q. State one disadvantage of this method instead of using a variable resistor to control the current. ........................................................................................................................................... ..................................................................................................................................... [1] [Total: 11]
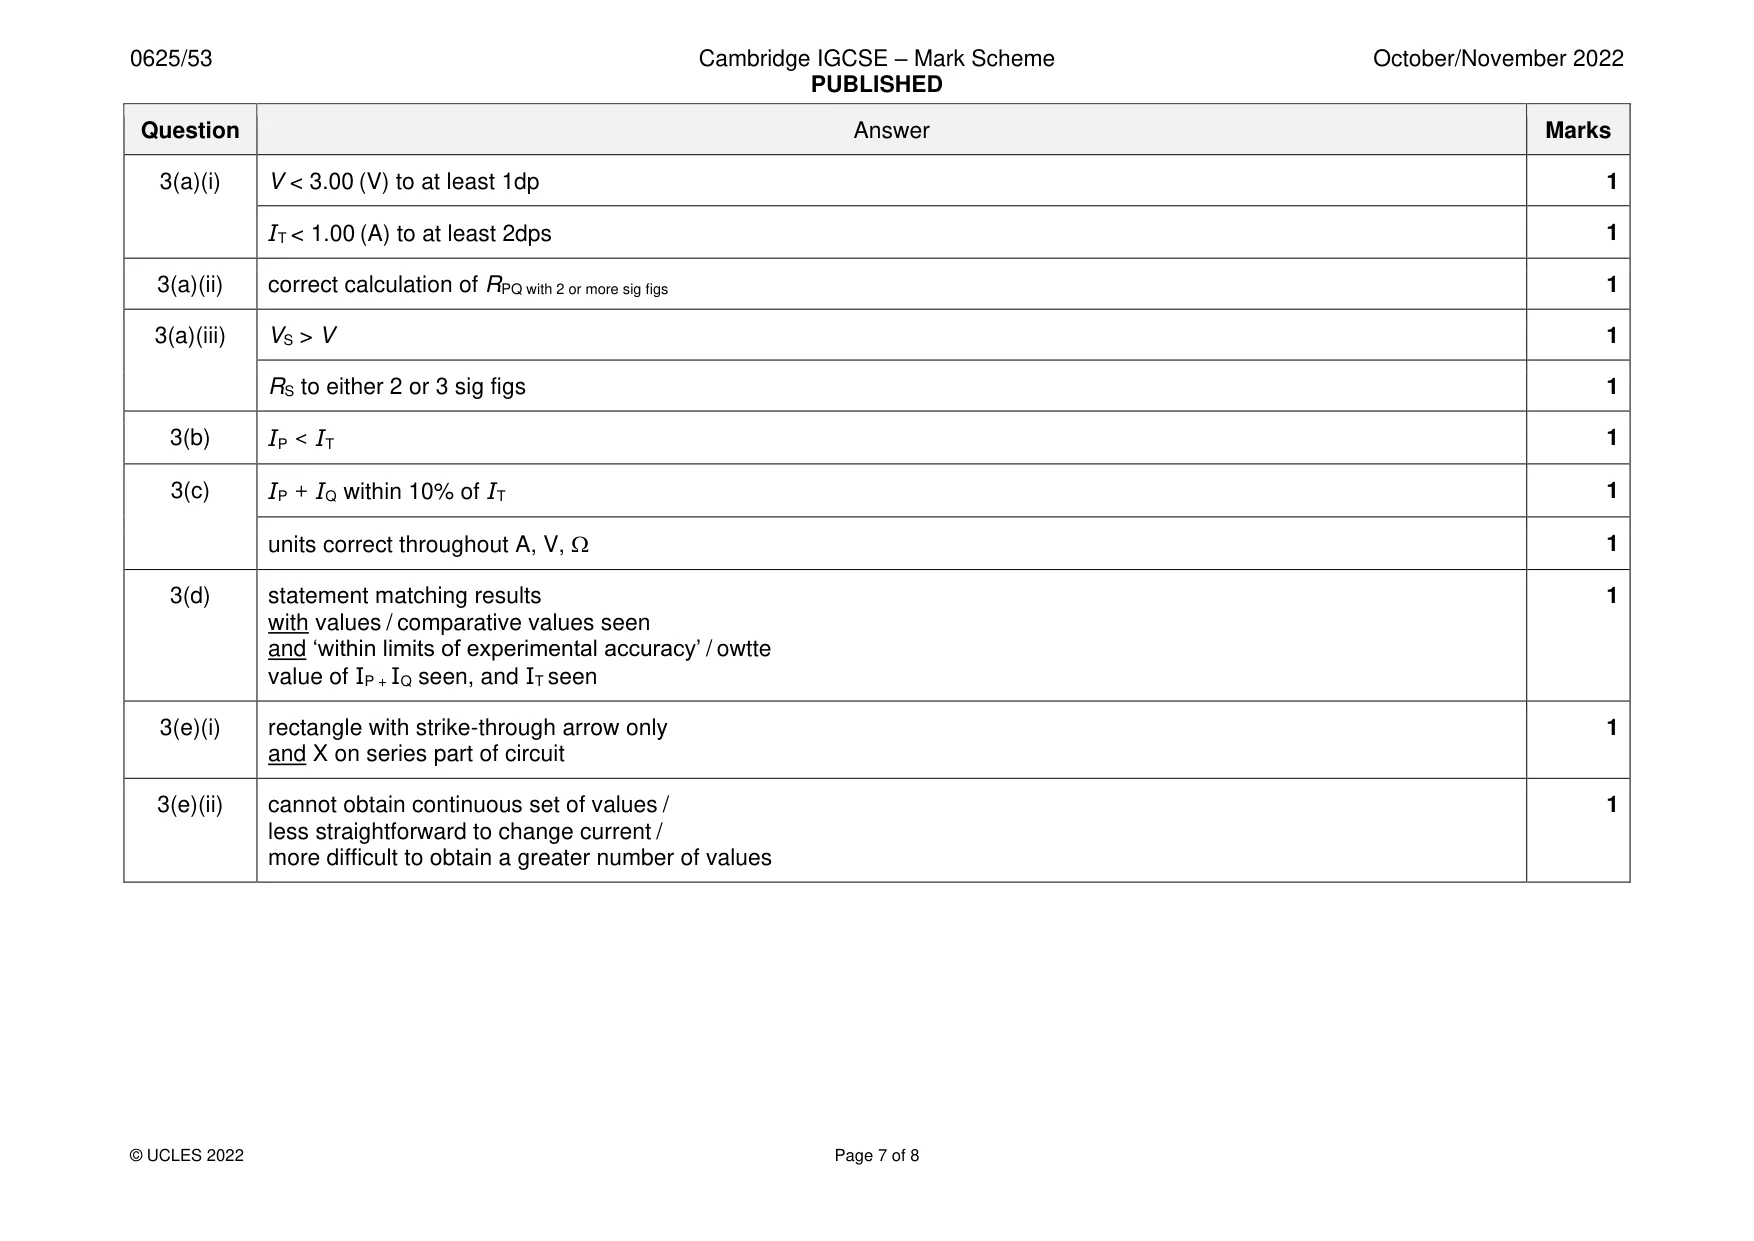
Mark scheme: 3(a)(i) V < 3.00 (V) to at least 1dp 1 IT < 1.00 (A) to at least 2dps 1 3(a)(ii) correct calculation of RPQ with 2 or more sig figs 1 3(a)(iii) VS > V 1 RS to either 2 or 3 sig figs 1 3(b) IP < IT 1 3(c) IP + IQ within 10% of IT 1 units correct throughout A, V, 1 3(d) statement matching results 1 with values / comparative values seen and ‘within limits of experimental accuracy’ / owtte value of IP + IQ seen, and IT seen 3(e)(i) rectangle with strike-through arrow only 1 and X on series part of circuit 3(e)(ii) cannot obtain continuous set of values / 1 less straightforward to change current / more difficult to obtain a greater number of values
Q4 · A student investigates the effect of temperature on the bounce height of a squash ball
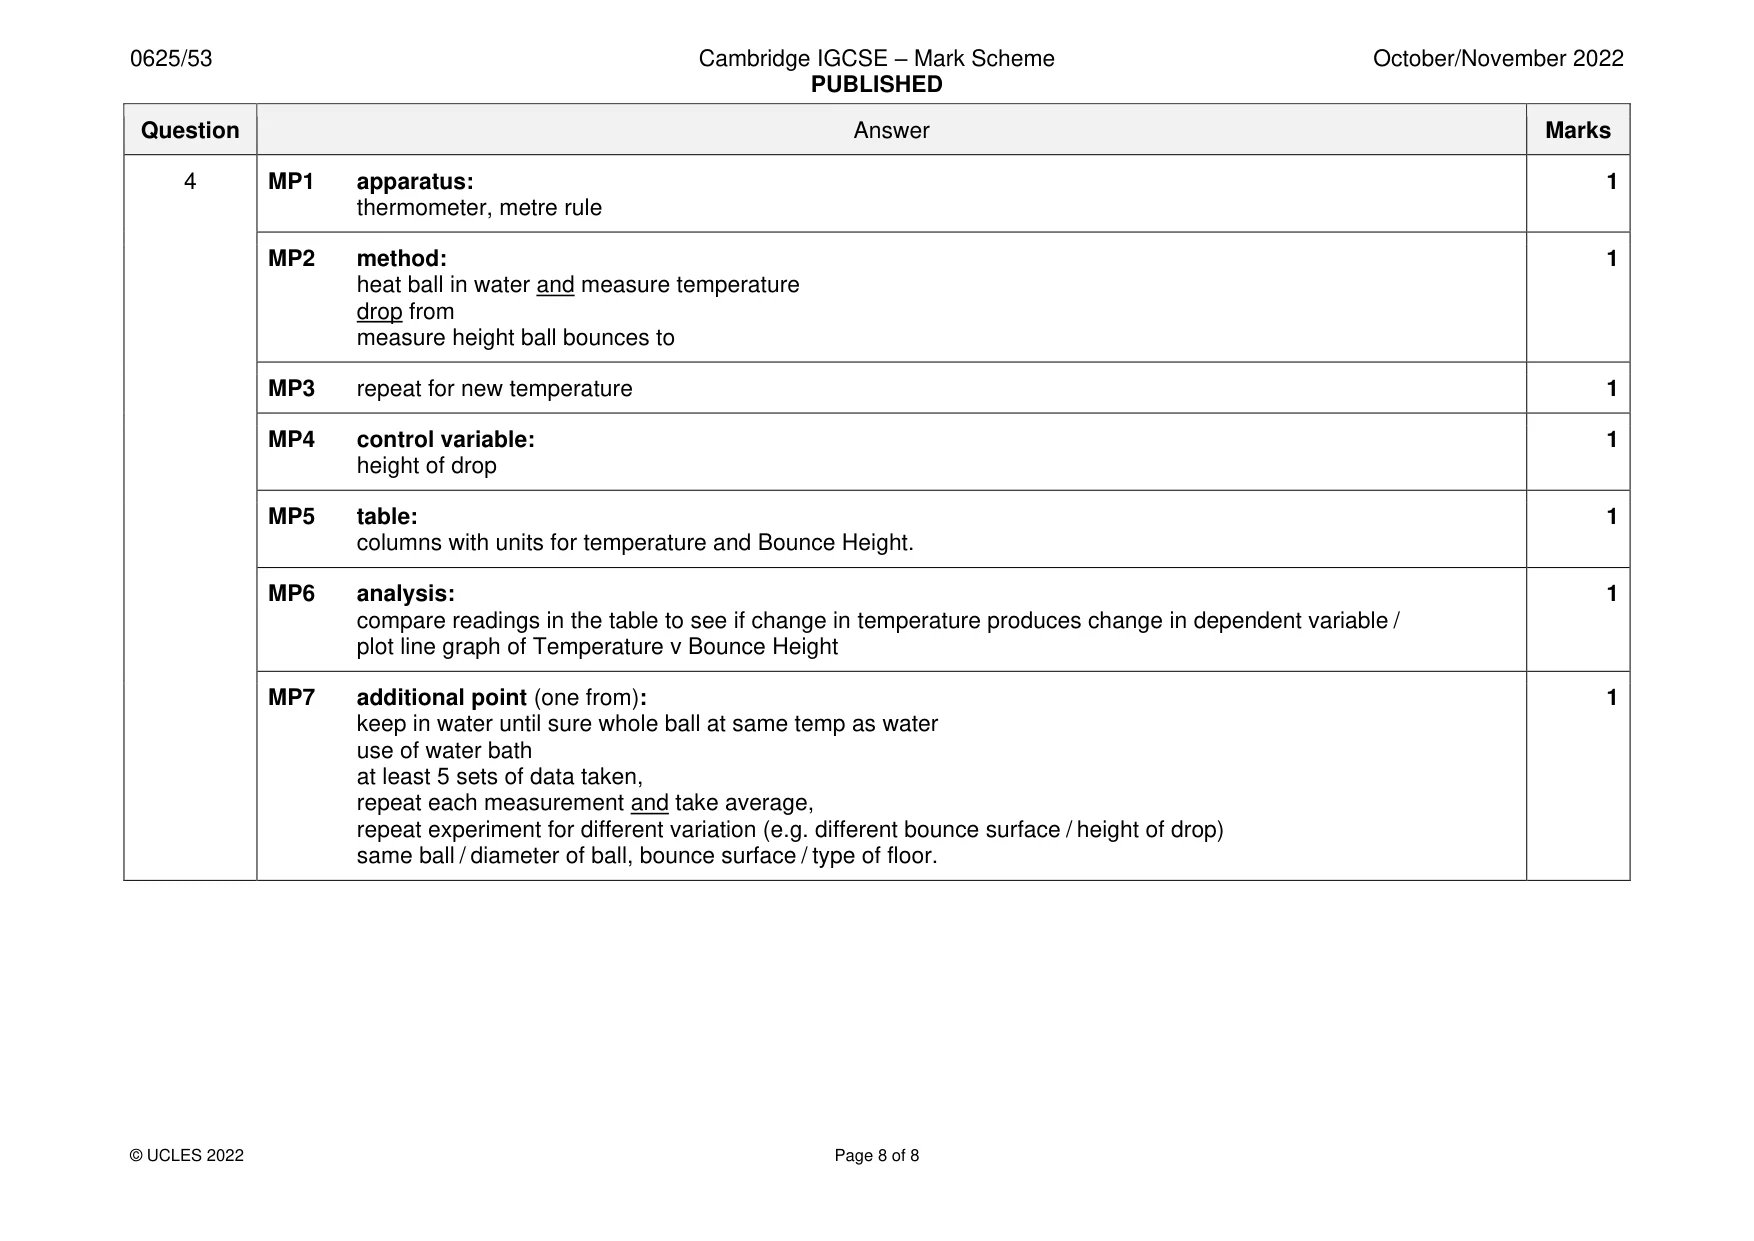
4 A student investigates the effect of temperature on the bounce height of a squash ball. A squash ball is a hollow rubber ball approximately 4 cm in diameter. Plan an experiment to investigate how the bounce height of the ball changes as the temperature of the ball rises. You are not required to carry out the experiment. The apparatus available includes: • a selection of squash balls • standard laboratory heating equipment • a beaker large enough for the squash ball to fit inside • a supply of cold water. In your plan, you should: • list any additional apparatus needed • explain briefly how to do the experiment, including any precautions to ensure reliable results (you may draw a diagram below if it helps to explain your plan) • state the key variables to be kept constant • draw a table, or tables, with column headings, to show how to display the readings (you are not required to enter any readings in the table) • explain how to use the readings to reach a conclusion. .......................................................................................................................................................... .......................................................................................................................................................... .......................................................................................................................................................... .......................................................................................................................................................... .......................................................................................................................................................... .......................................................................................................................................................... .......................................................................................................................................................... .......................................................................................................................................................... .......................................................................................................................................................... .......................................................................................................................................................... .......................................................................................................................................................... .......................................................................................................................................................... .......................................................................................................................................................... .......................................................................................................................................................... .......................................................................................................................................................... .......................................................................................................................................................... .......................................................................................................................................................... .......................................................................................................................................................... .......................................................................................................................................................... .......................................................................................................................................................... .......................................................................................................................................................... .......................................................................................................................................................... .................................................................................................................................................... [7]
Mark scheme: 4 MP1 apparatus: 1 thermometer, metre rule MP2 method: 1 heat ball in water and measure temperature drop from measure height ball bounces to MP3 repeat for new temperature 1 MP4 control variable: 1 height of drop MP5 table: 1 columns with units for temperature and Bounce Height. MP6 analysis: 1 compare readings in the table to see if change in temperature produces change in dependent variable / plot line graph of Temperature v Bounce Height MP7 additional point (one from): 1 keep in water until sure whole ball at same temp as water use of water bath at least 5 sets of data taken, repeat each measurement and take average, repeat experiment for different variation (e.g. different bounce surface / height of drop) same ball / diameter of ball, bounce surface / type of floor.
What was in this paper
The subtopics covered by these 4 questions, and how many questions each got. Open one in a new tab to see every Cambridge question on it.
What you needed in this session
Cambridge’s own grade thresholds for 2022 Oct/Nov, Paper 5 · Variant 3. A higher threshold means an easier paper — the bar moves with how the cohort did.