Cambridge IGCSE Physics 0625 — 2020 May/June Paper 5 · Variant 2
0625/52/M/J/20 · 4 questions · 40 marks · ≈45 min
The question paper and its mark scheme, free to read here and free to download. This is Cambridge’s own paper, exactly as it was sat.
Question paper12 pages

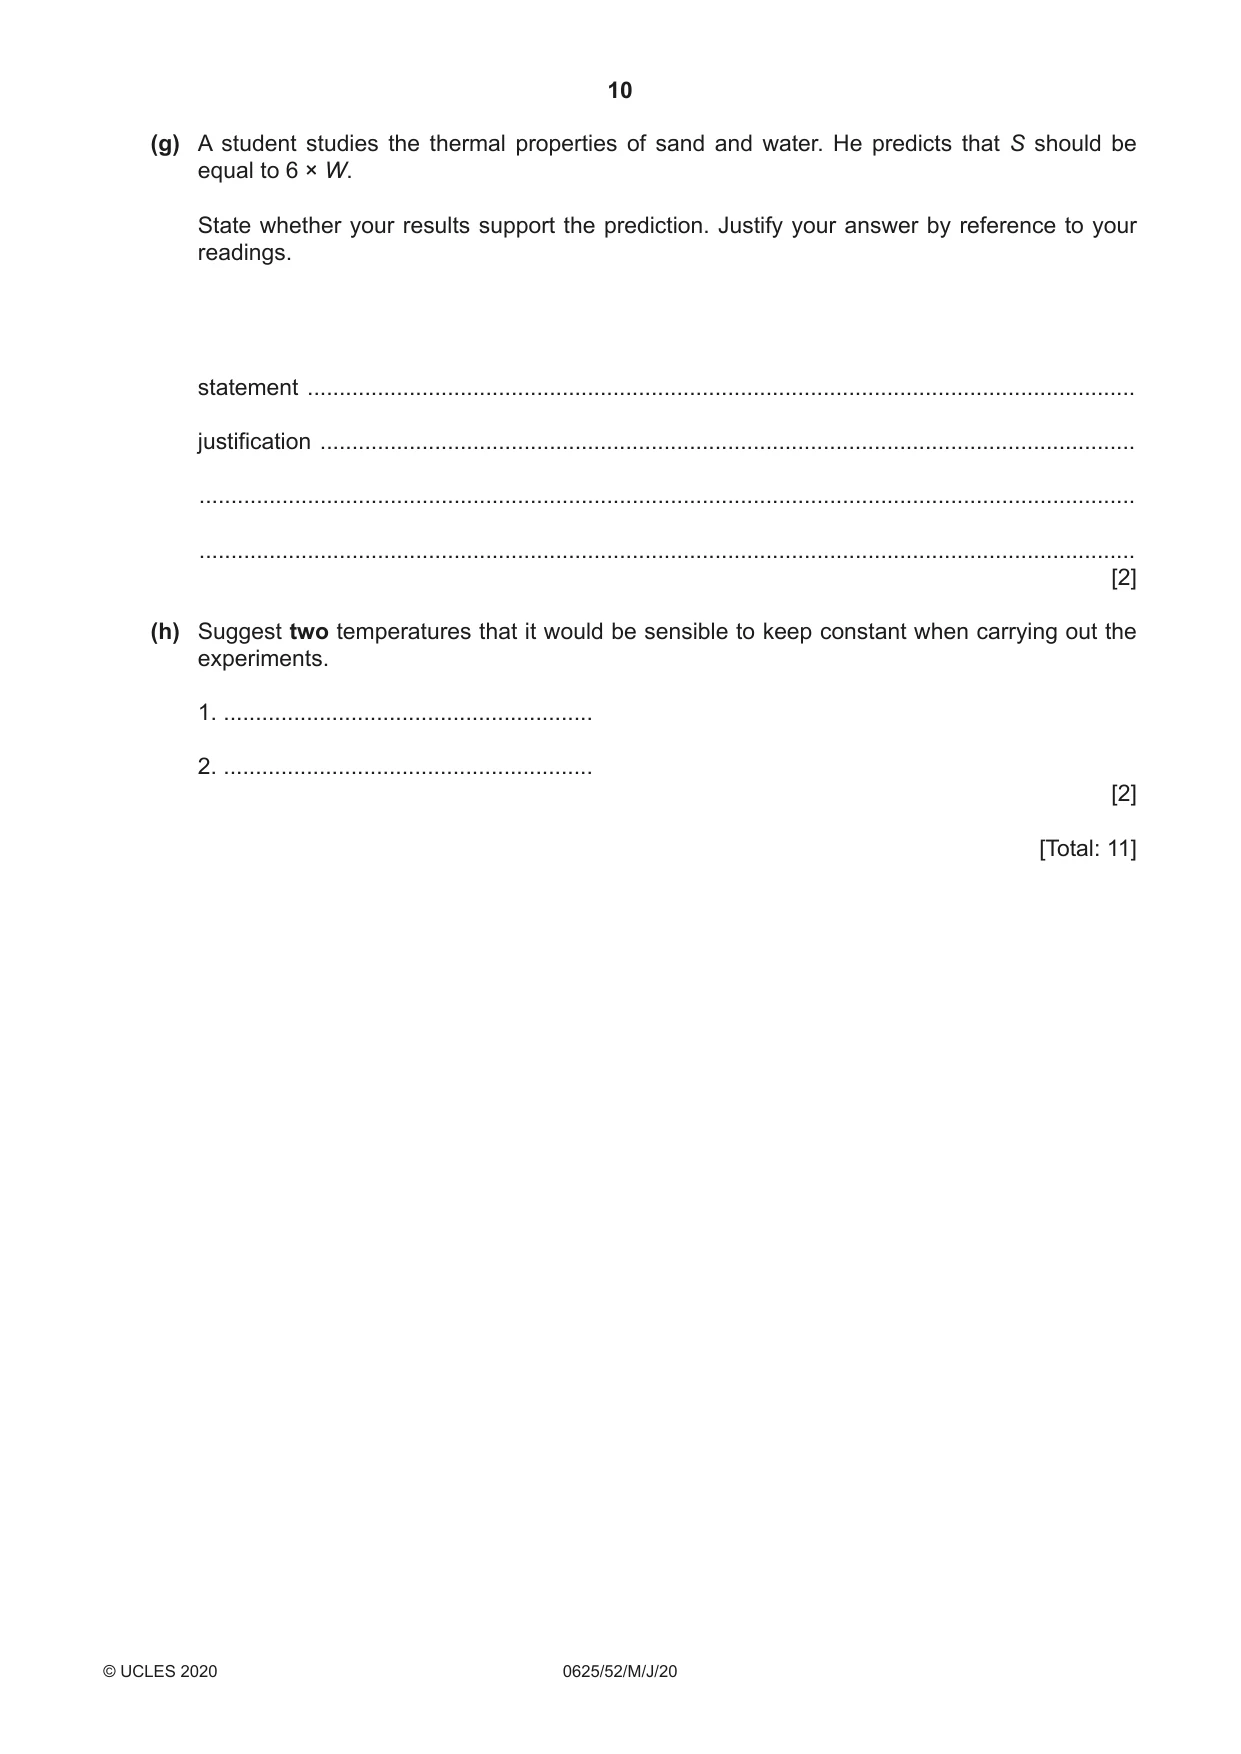
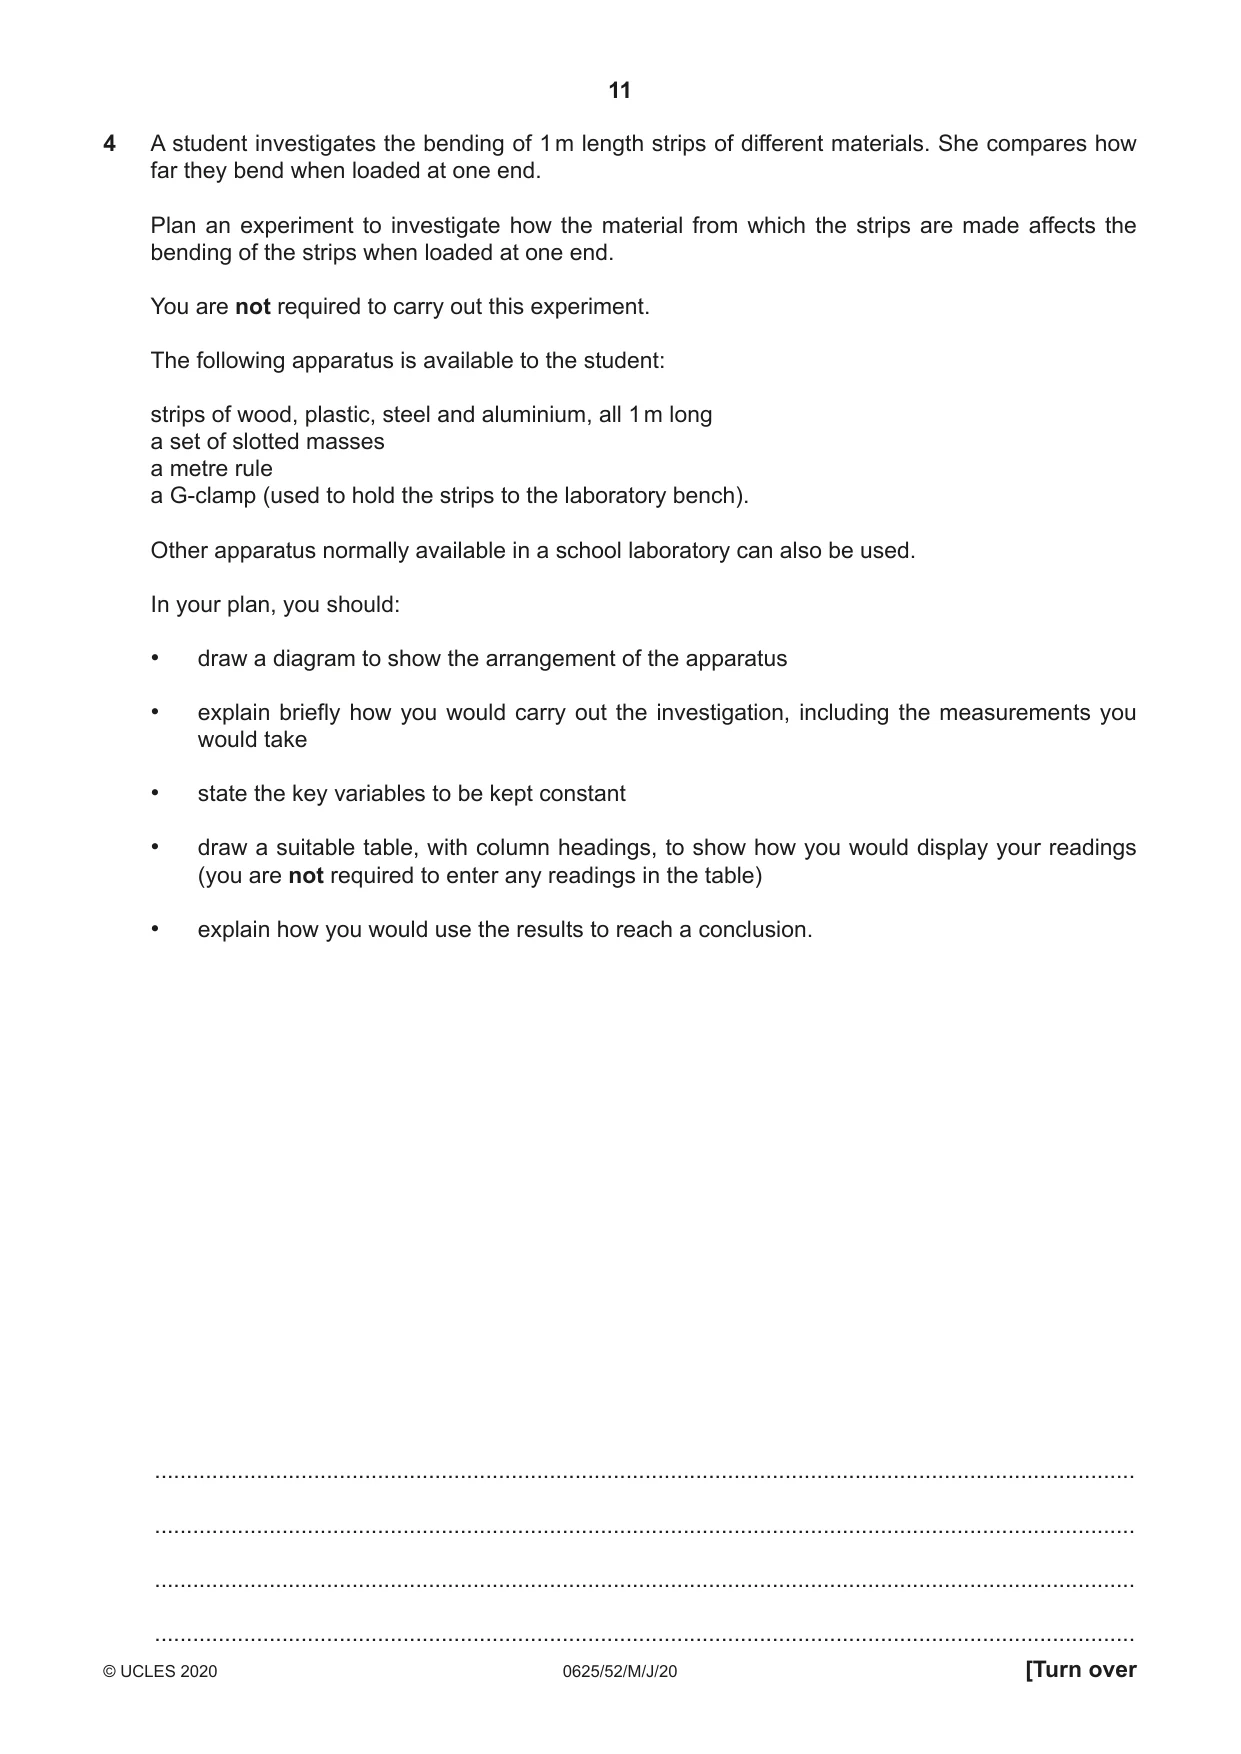
Mark scheme7 pages
Answers below. Sit the paper first if you are practising.
Questions as text
Q1 · In this experiment, you will investigate the period of a pendulum
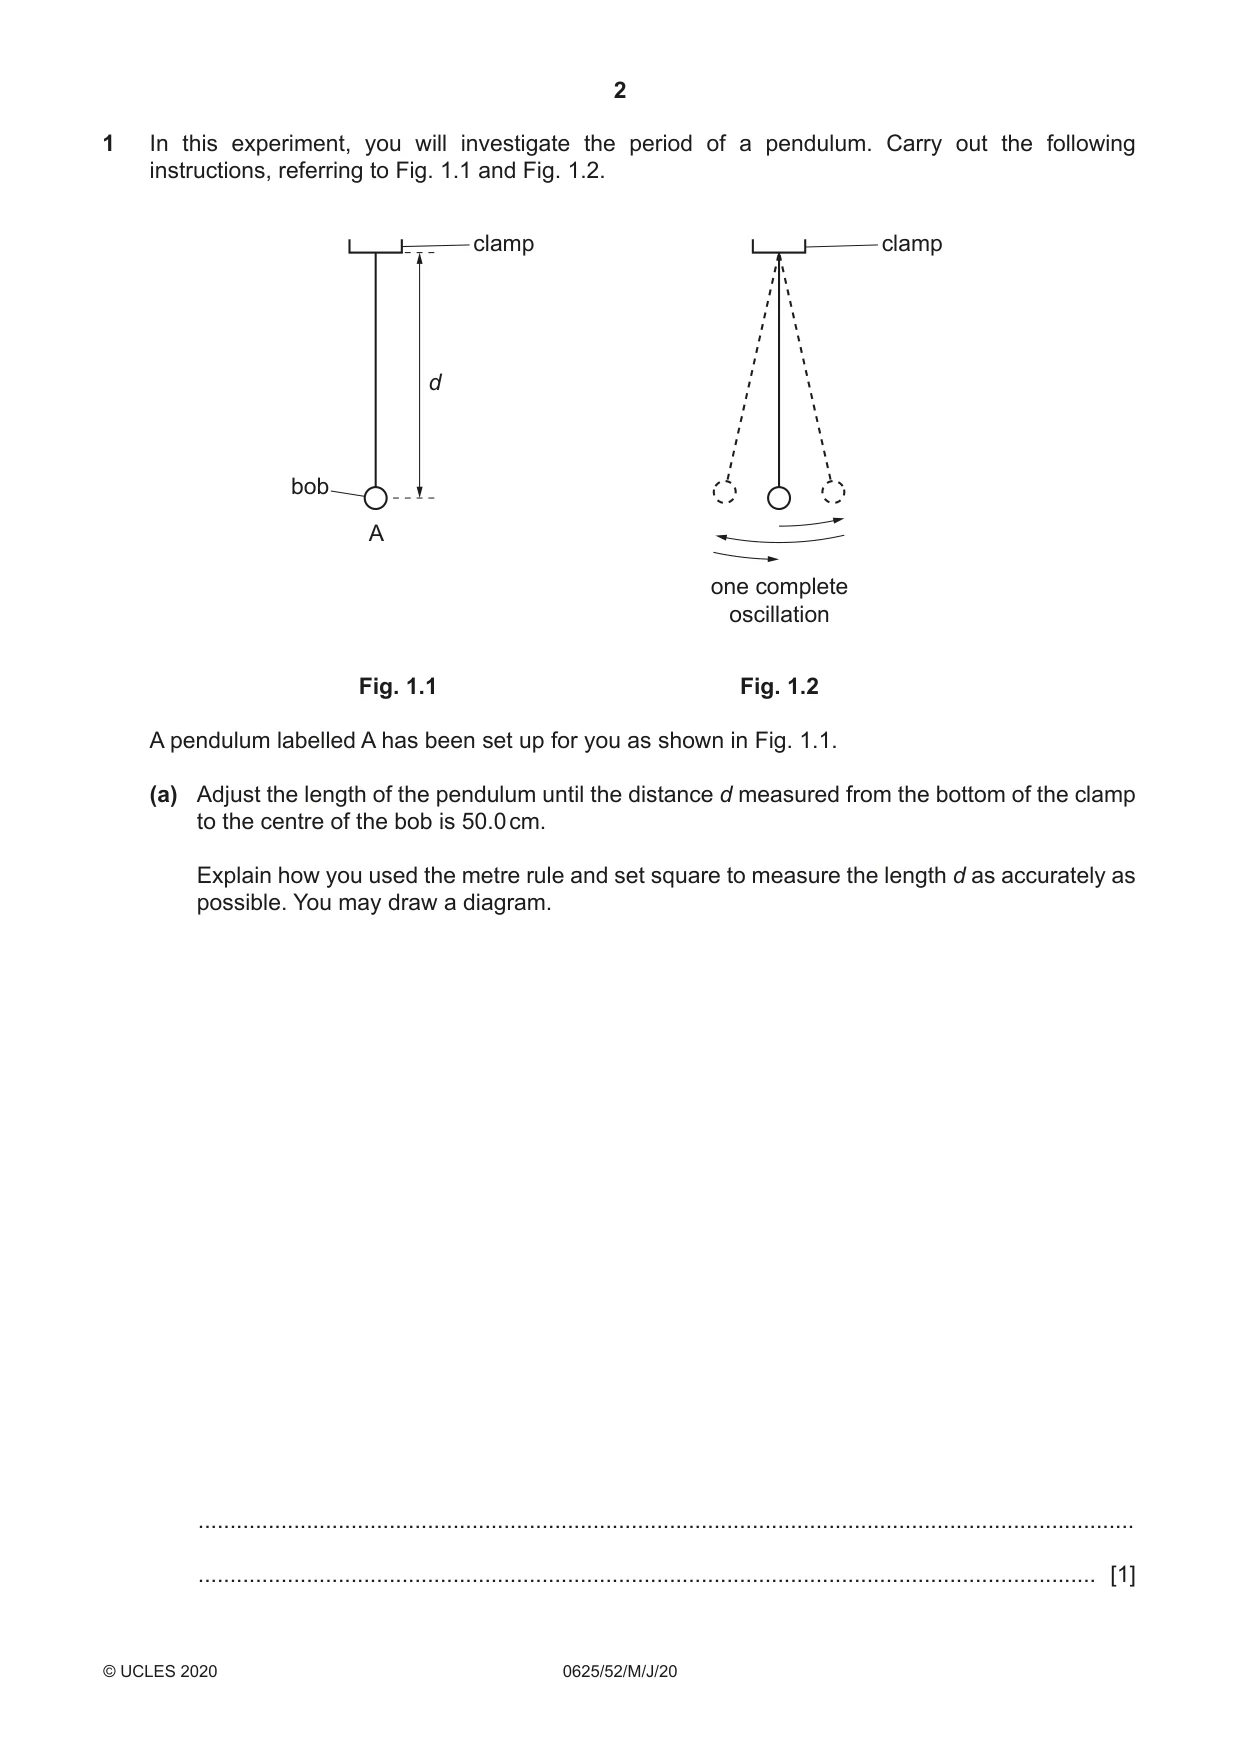
1 In this experiment, you will investigate the period of a pendulum. Carry out the following instructions, referring to Fig. 1.1 and Fig. 1.2. clamp clamp d bob A one complete oscillation Fig. 1.1 Fig. 1.2 A pendulum labelled A has been set up for you as shown in Fig. 1.1. (a) Adjust the length of the pendulum until the distance d measured from the bottom of the clamp to the centre of the bob is 50.0 cm. Explain how you used the metre rule and set square to measure the length d as accurately as possible. You may draw a diagram. ................................................................................................................................................... ............................................................................................................................................. [1] (b) Displace the bob slightly and release it so that it swings. Fig. 1.2 shows one complete oscillation of the pendulum. (i) Measure the time t1 for 10 complete oscillations. t1 = ..................................................... [1] (ii) Calculate the period T1 of the pendulum. The period is the time for one complete oscillation. T1 = ..................................................... [1] (c) Adjust the pendulum until the distance d is 100.0 cm. Repeat the procedure in (b). t2 = ........................................................... T2 = ........................................................... [2] (d) Remove the pendulum from the clamp. Using the balance provided, measure the mass mA of the pendulum. The mass includes the pendulum bob and the thread. mA = .................................................. g [1] (e) Using the balance, measure the mass mB of pendulum B. mB = .................................................. g [1] (f) Hang pendulum B from the clamp. Adjust the length of the pendulum until the distance d is 50.0 cm. (i) Repeat the procedure in (b) and (c). Distance d = 50.0 cm: t3 = ........................................................... T3 = ........................................................... Distance d = 100.0 cm: t4 = ........................................................... T4 = ........................................................... [1] (ii) Explain briefly why timing 10 oscillations gives a more accurate result for the period T than timing 1 oscillation. ........................................................................................................................................... ..................................................................................................................................... [1] (g) (i) Using the results T1, T2, T3 and T4, for the period of each pendulum set up, tick (3) the response that matches your results within the limits of experimental accuracy. the period T is affected by d only the period T is affected by both d and m the period T is affected by m only the period T is not affected by d or m [1] (ii) Justify your answer to (g)(i) by reference to your results. ........................................................................................................................................... ..................................................................................................................................... [1] [Total: 11]
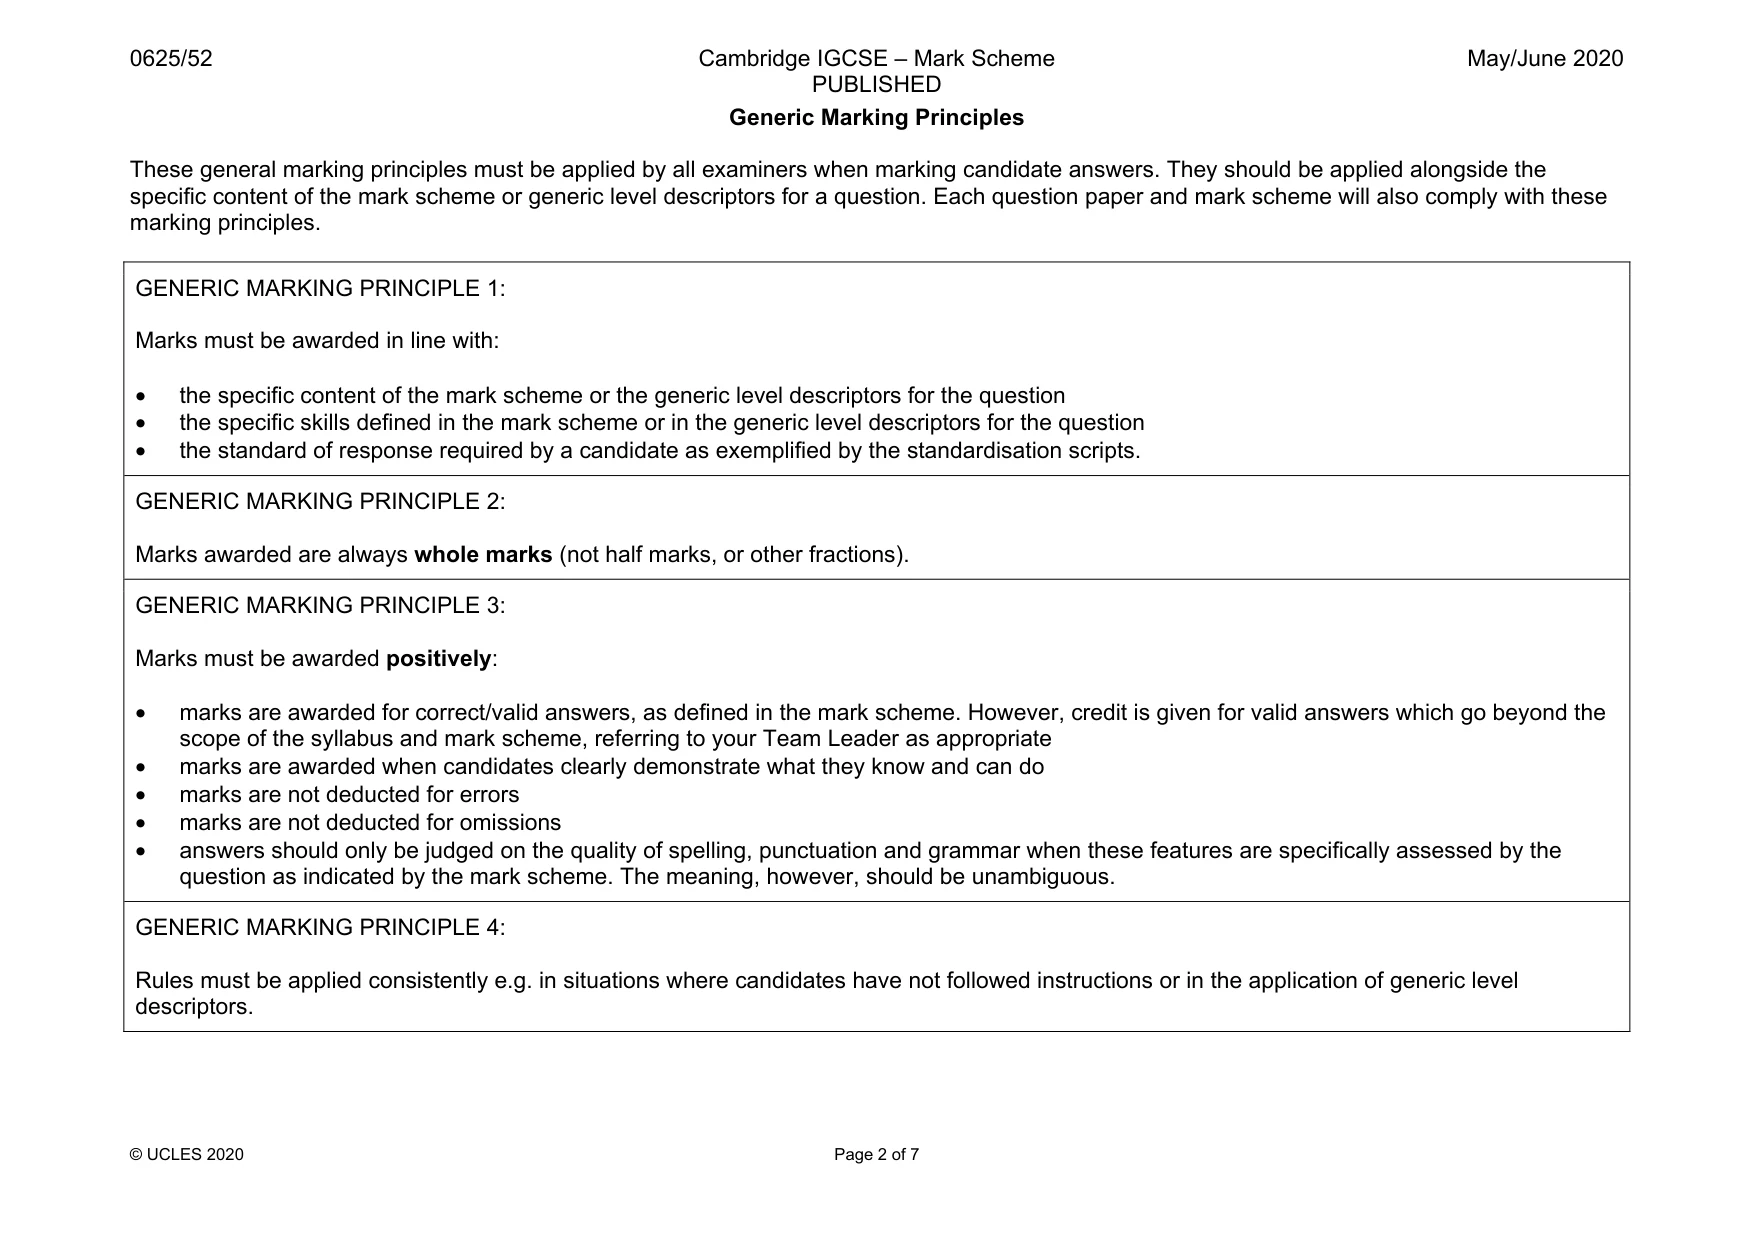
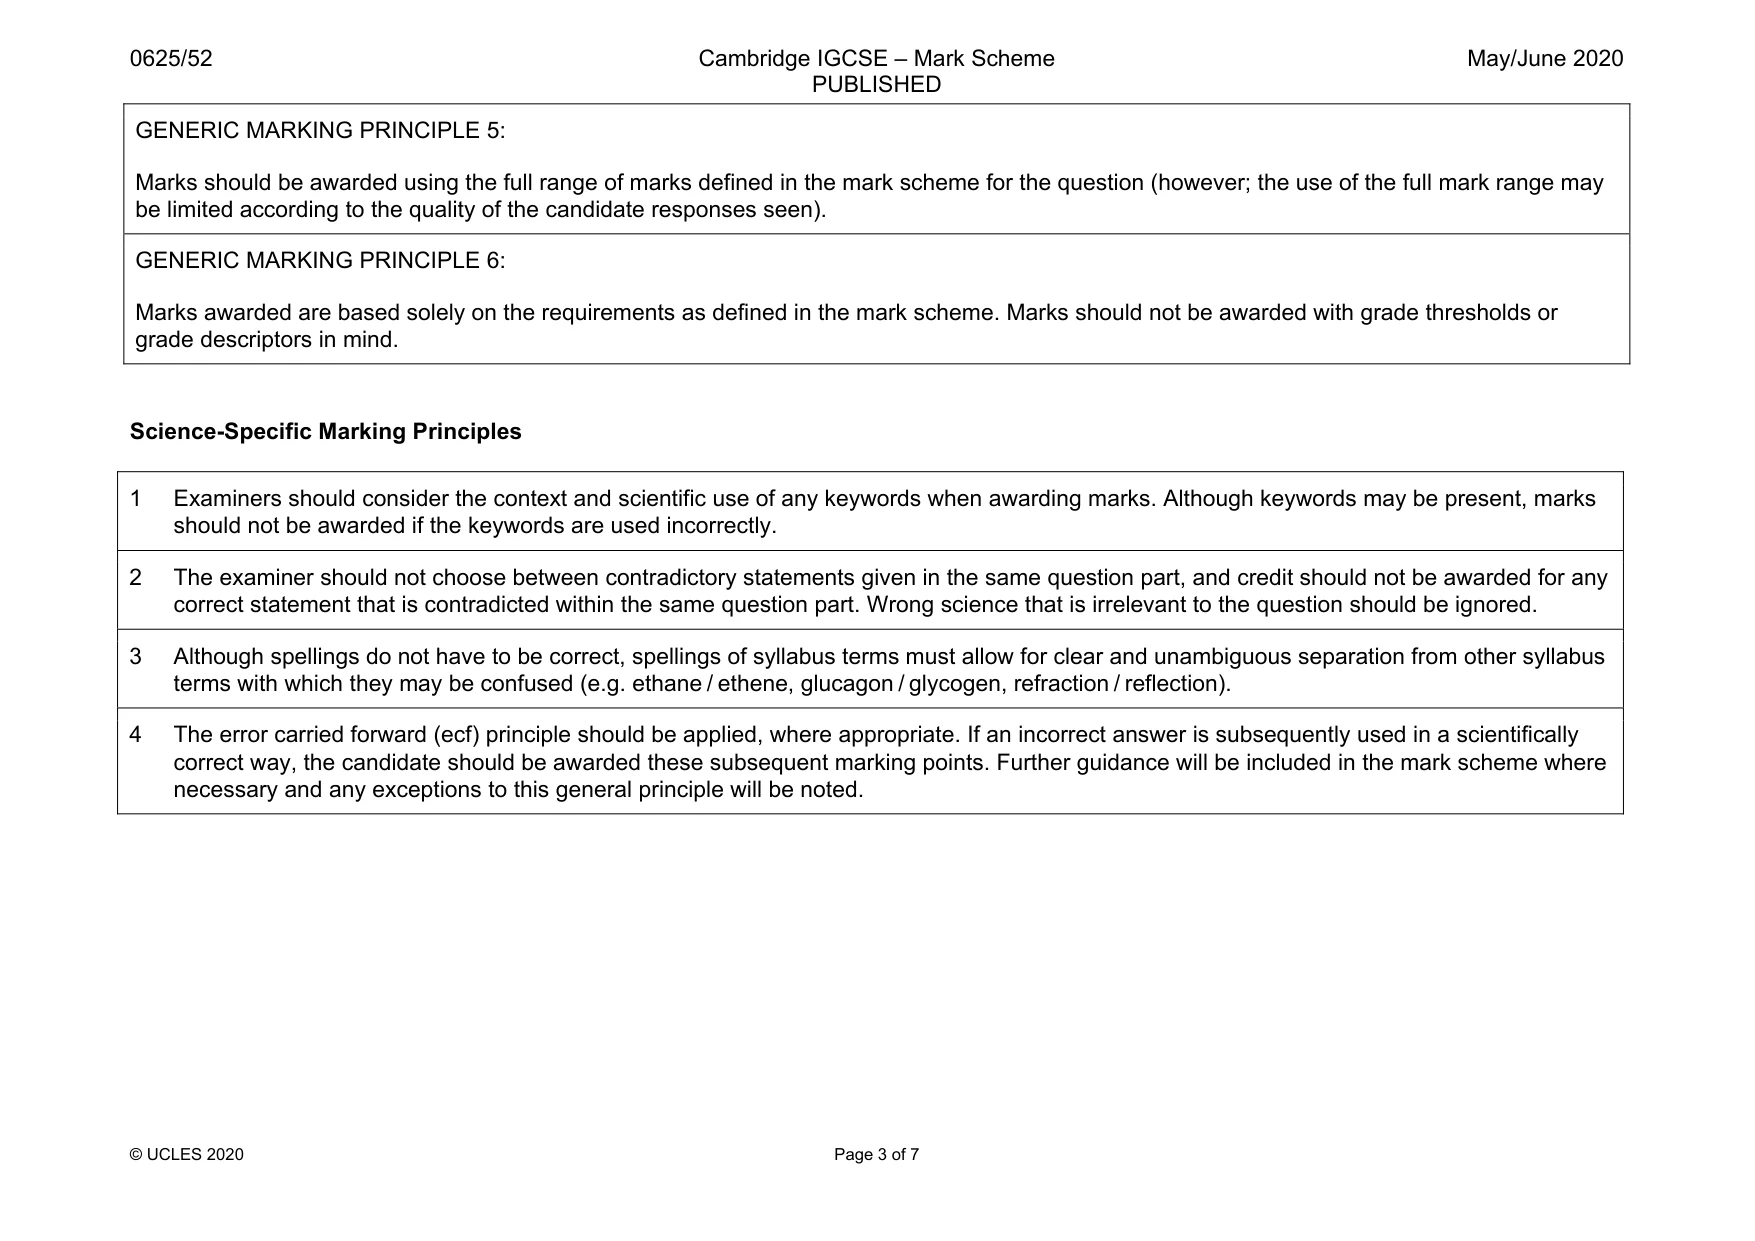
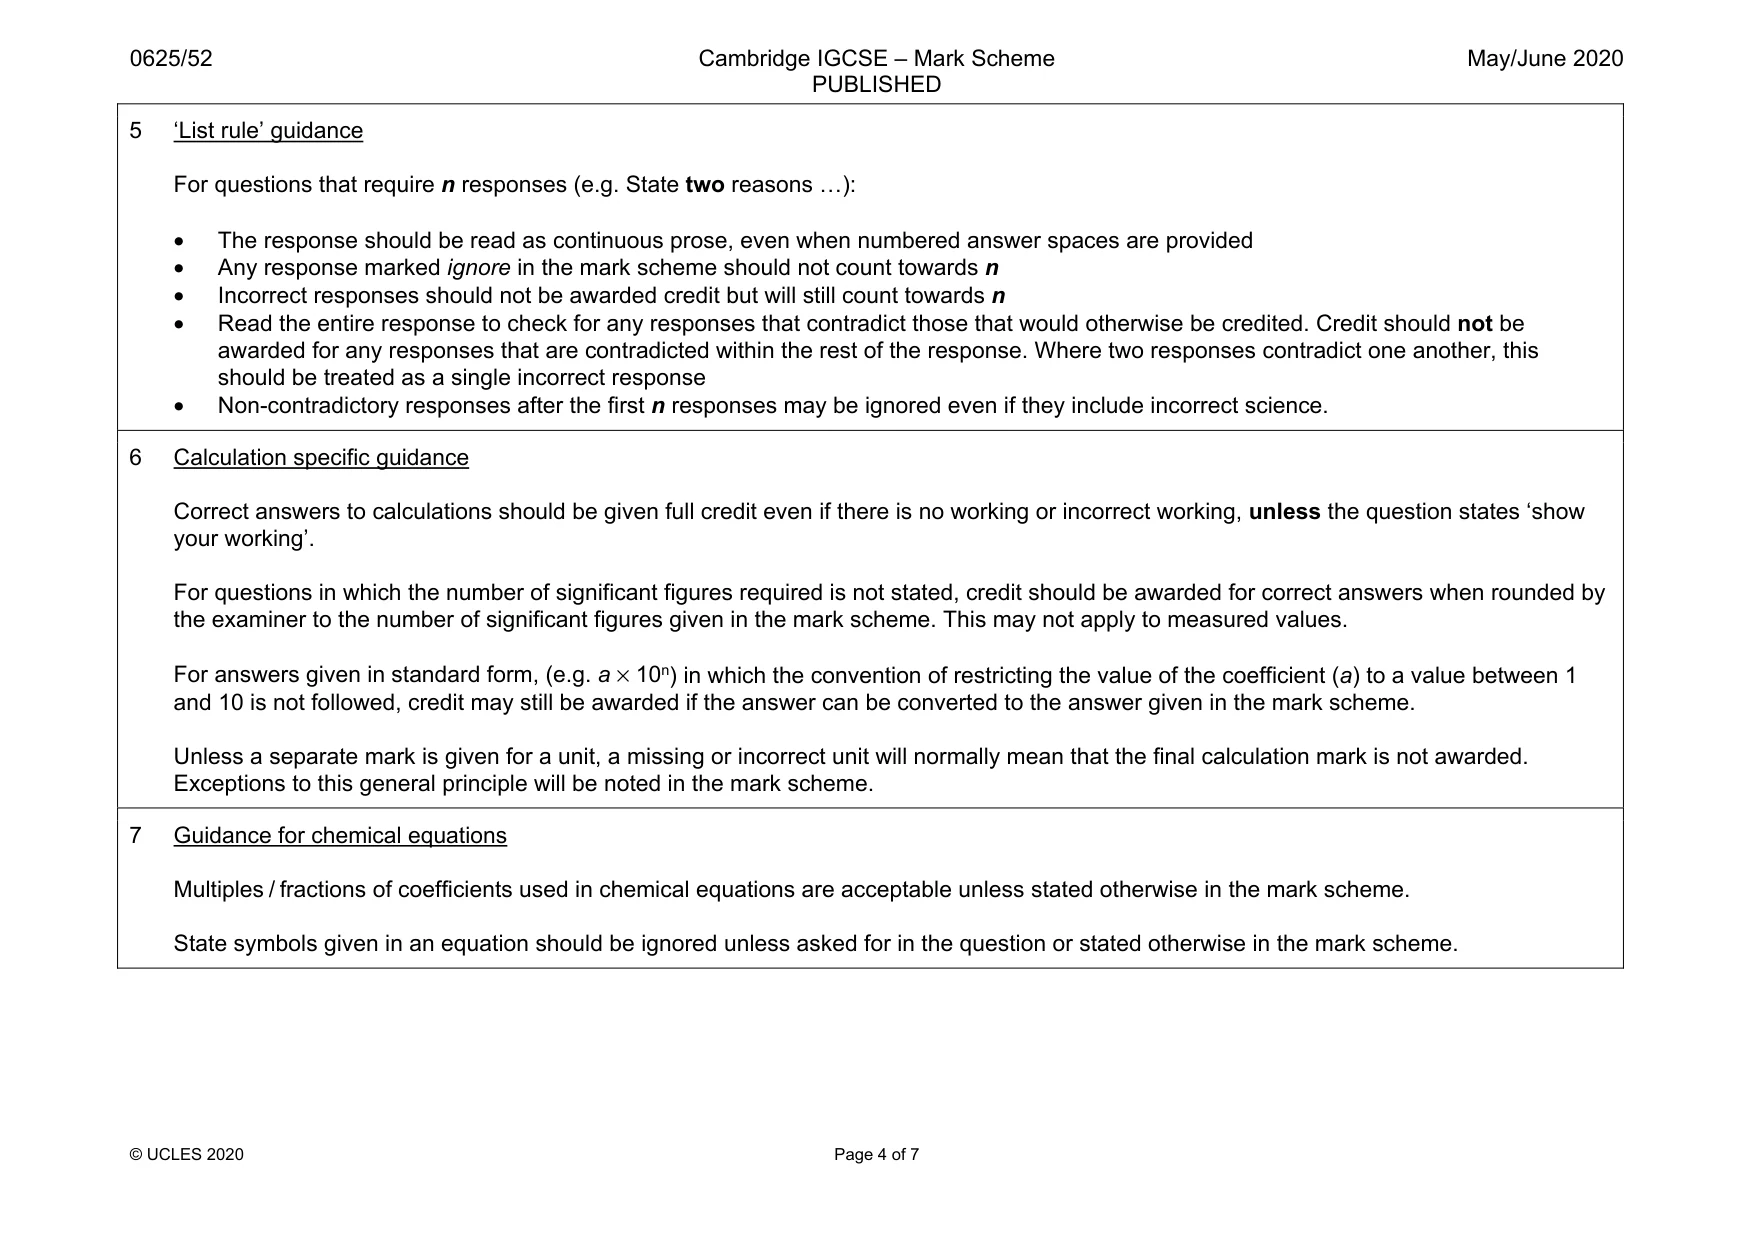
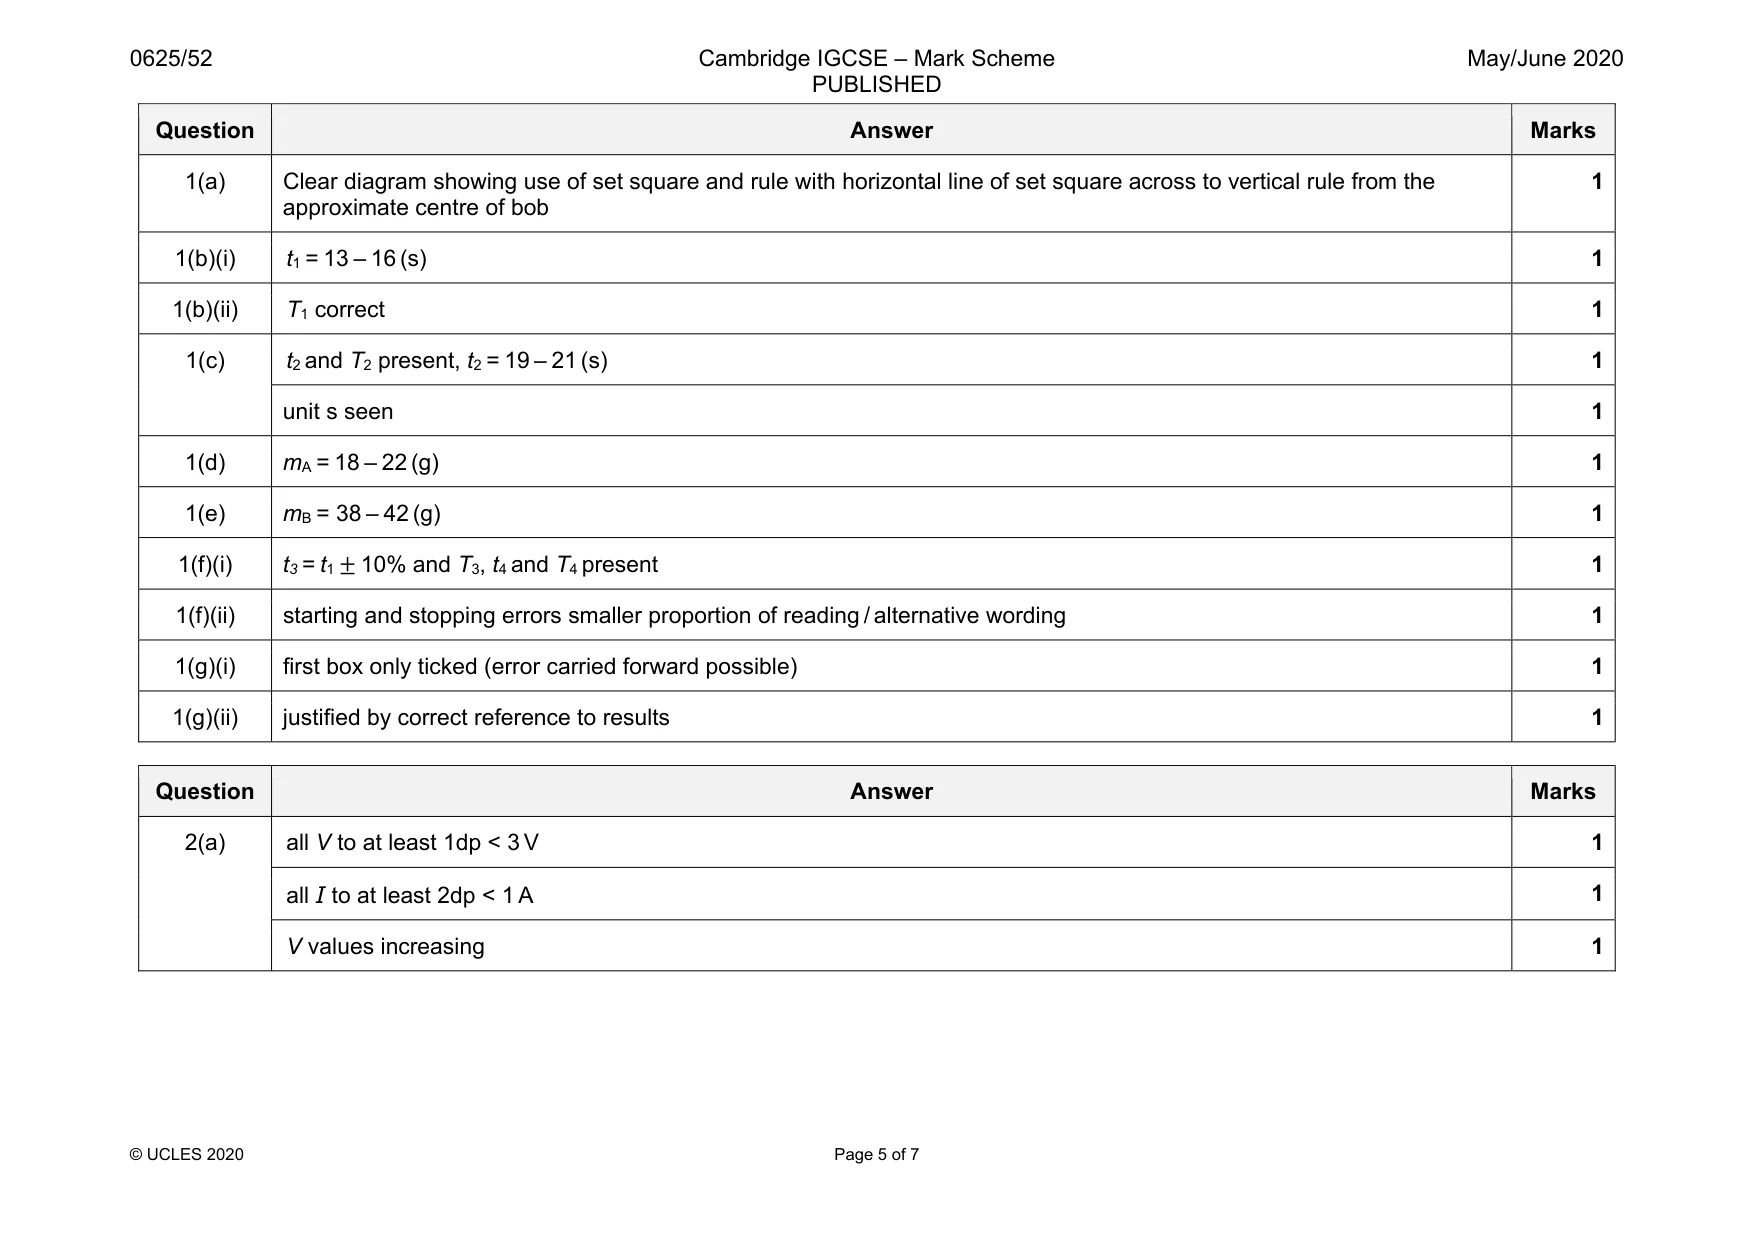
Mark scheme: 1(a) Clear diagram showing use of set square and rule with horizontal line of set square across to vertical rule from the approximate centre of bob 1 1(b)(i) t1 = 13 – 16 (s) 1 1(b)(ii) T1 correct 1 1(c) t2 and T2 present, t2 = 19 – 21 (s) 1 unit s seen 1 1(d) mA = 18 – 22 (g) 1 1(e) mB = 38 – 42 (g) 1 1(f)(i) t3 = t1 ± 10% and T3, t4 and T4 present 1 1(f)(ii) starting and stopping errors smaller proportion of reading / alternative wording 1 1(g)(i) first box only ticked (error carried forward possible) 1 1(g)(ii) justified by correct reference to results 1
Q2 · In this experiment, you will investigate how the potential difference across a resistance…
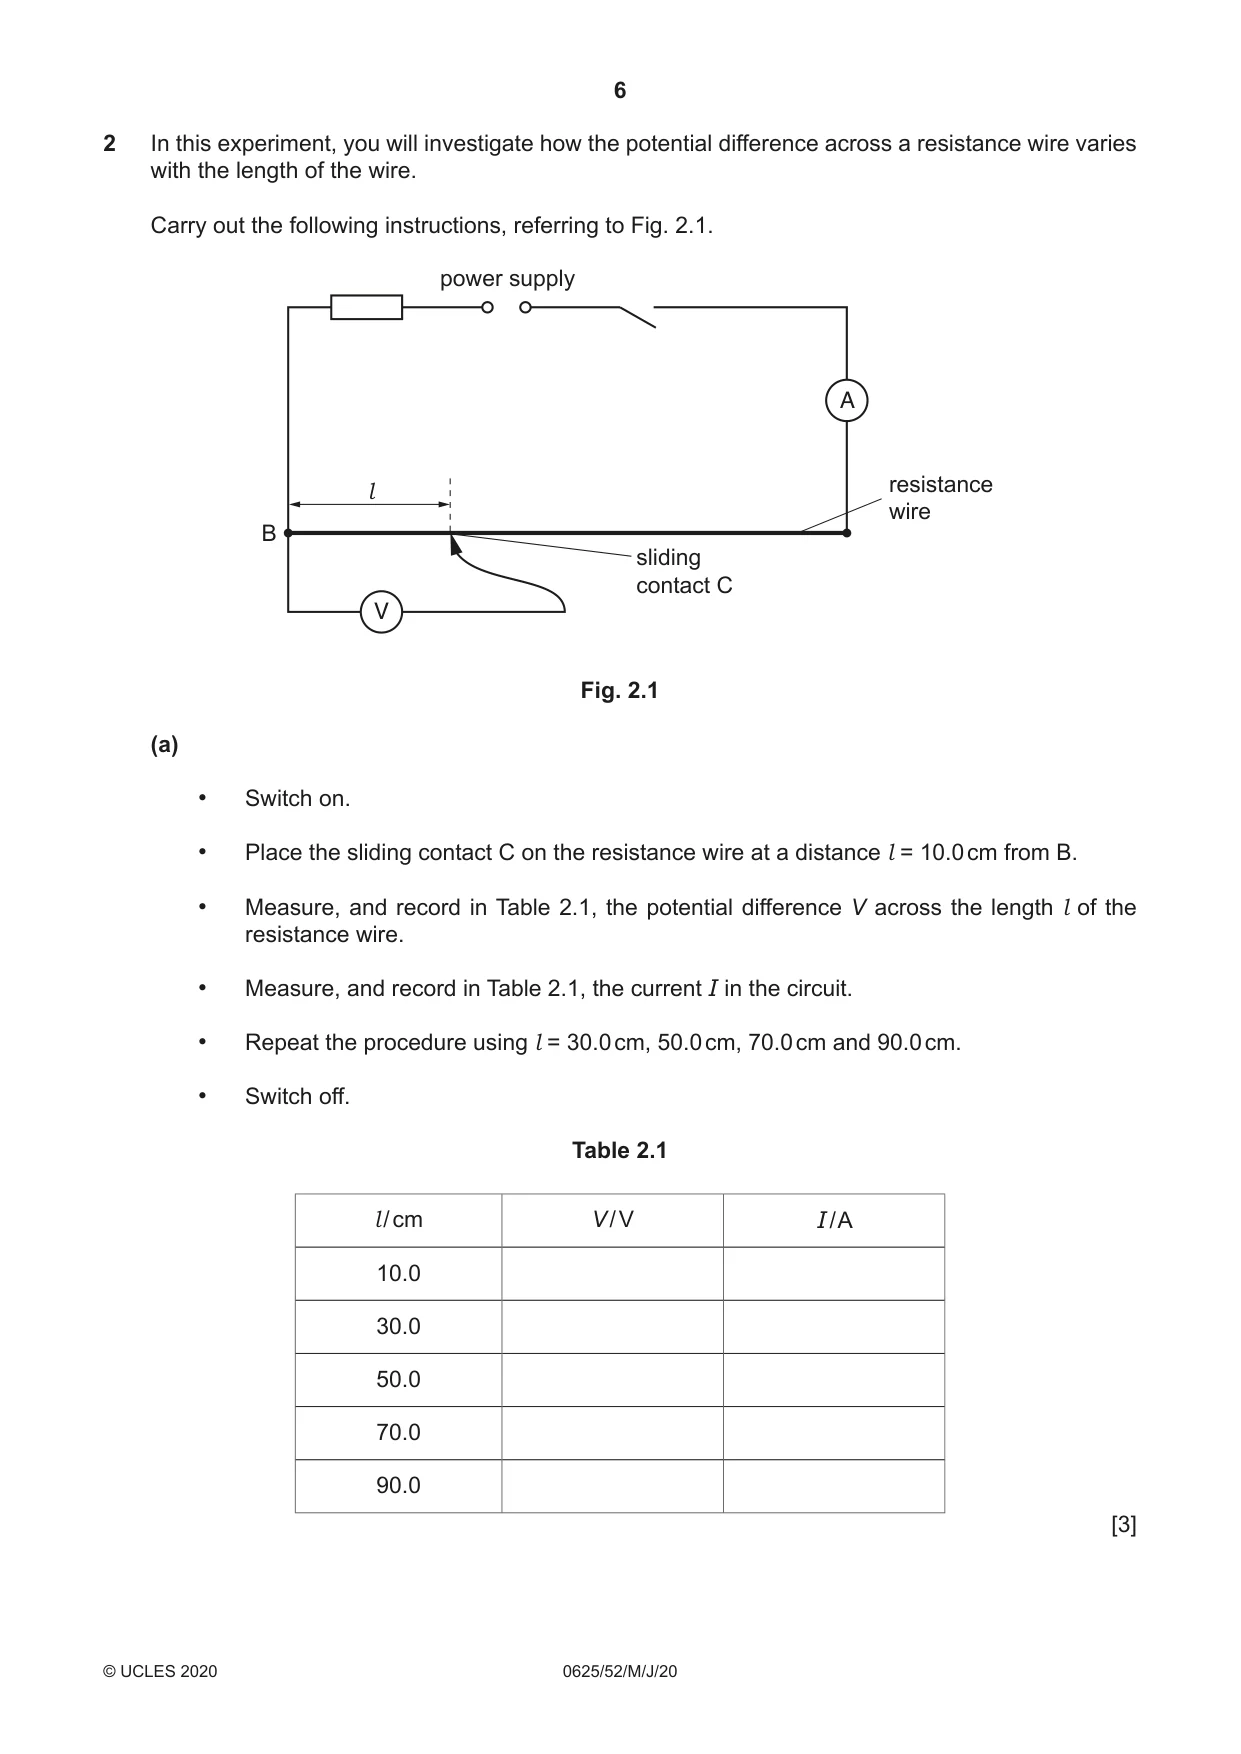
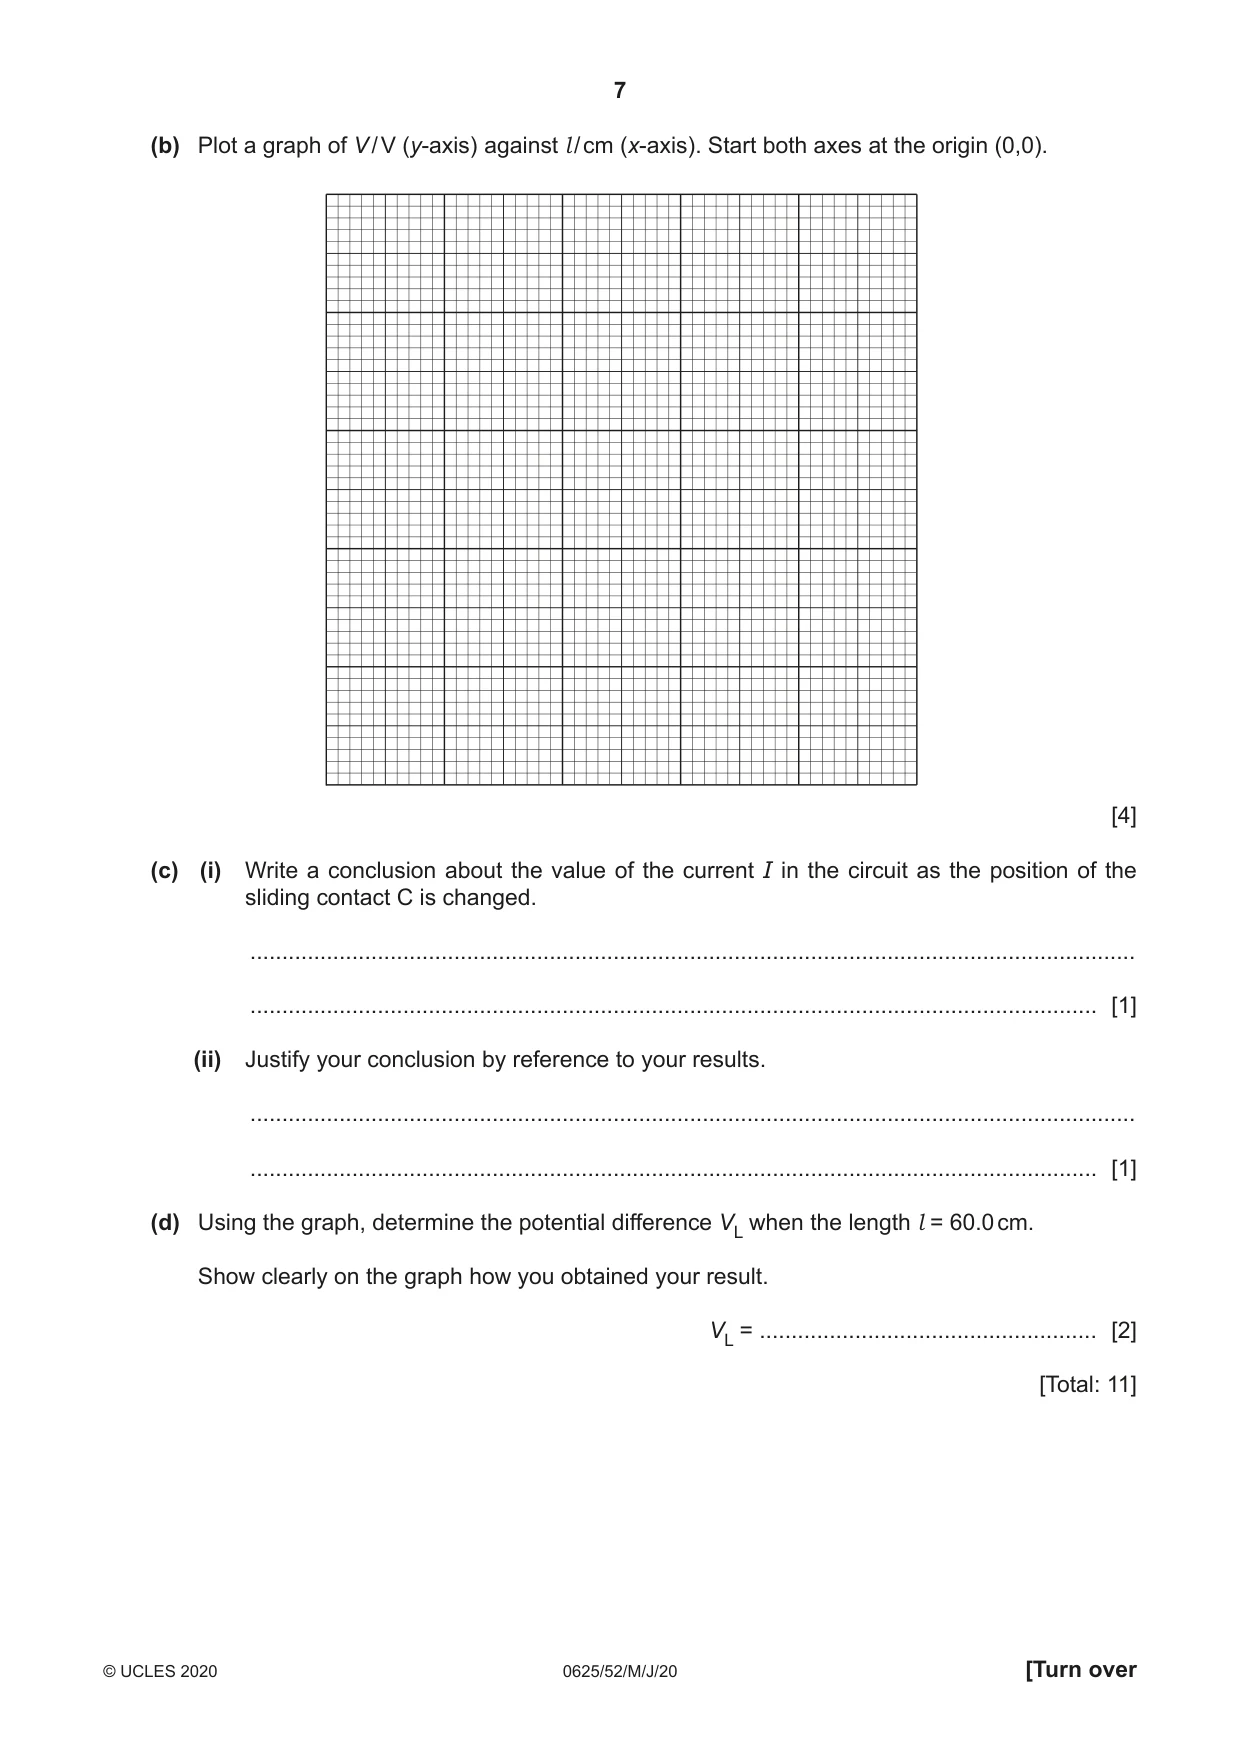
2 In this experiment, you will investigate how the potential difference across a resistance wire varies with the length of the wire. Carry out the following instructions, referring to Fig. 2.1. power supply A resistance l wire B sliding contact C V Fig. 2.1 (a) • Switch on. • Place the sliding contact C on the resistance wire at a distance l = 10.0 cm from B. • Measure, and record in Table 2.1, the potential difference V across the length l of the resistance wire. • Measure, and record in Table 2.1, the current I in the circuit. • Repeat the procedure using l = 30.0 cm, 50.0 cm, 70.0 cm and 90.0 cm. • Switch off. Table 2.1 l / cm V / V I / A 10.0 30.0 50.0 70.0 90.0 [3] (b) Plot a graph of V / V (y-axis) against l / cm (x-axis). Start both axes at the origin (0,0). [4] (c) (i) Write a conclusion about the value of the current I in the circuit as the position of the sliding contact C is changed. ........................................................................................................................................... ..................................................................................................................................... [1] (ii) Justify your conclusion by reference to your results. ........................................................................................................................................... ..................................................................................................................................... [1] (d) Using the graph, determine the potential difference VL when the length l = 60.0 cm. Show clearly on the graph how you obtained your result. VL = ..................................................... [2] [Total: 11]
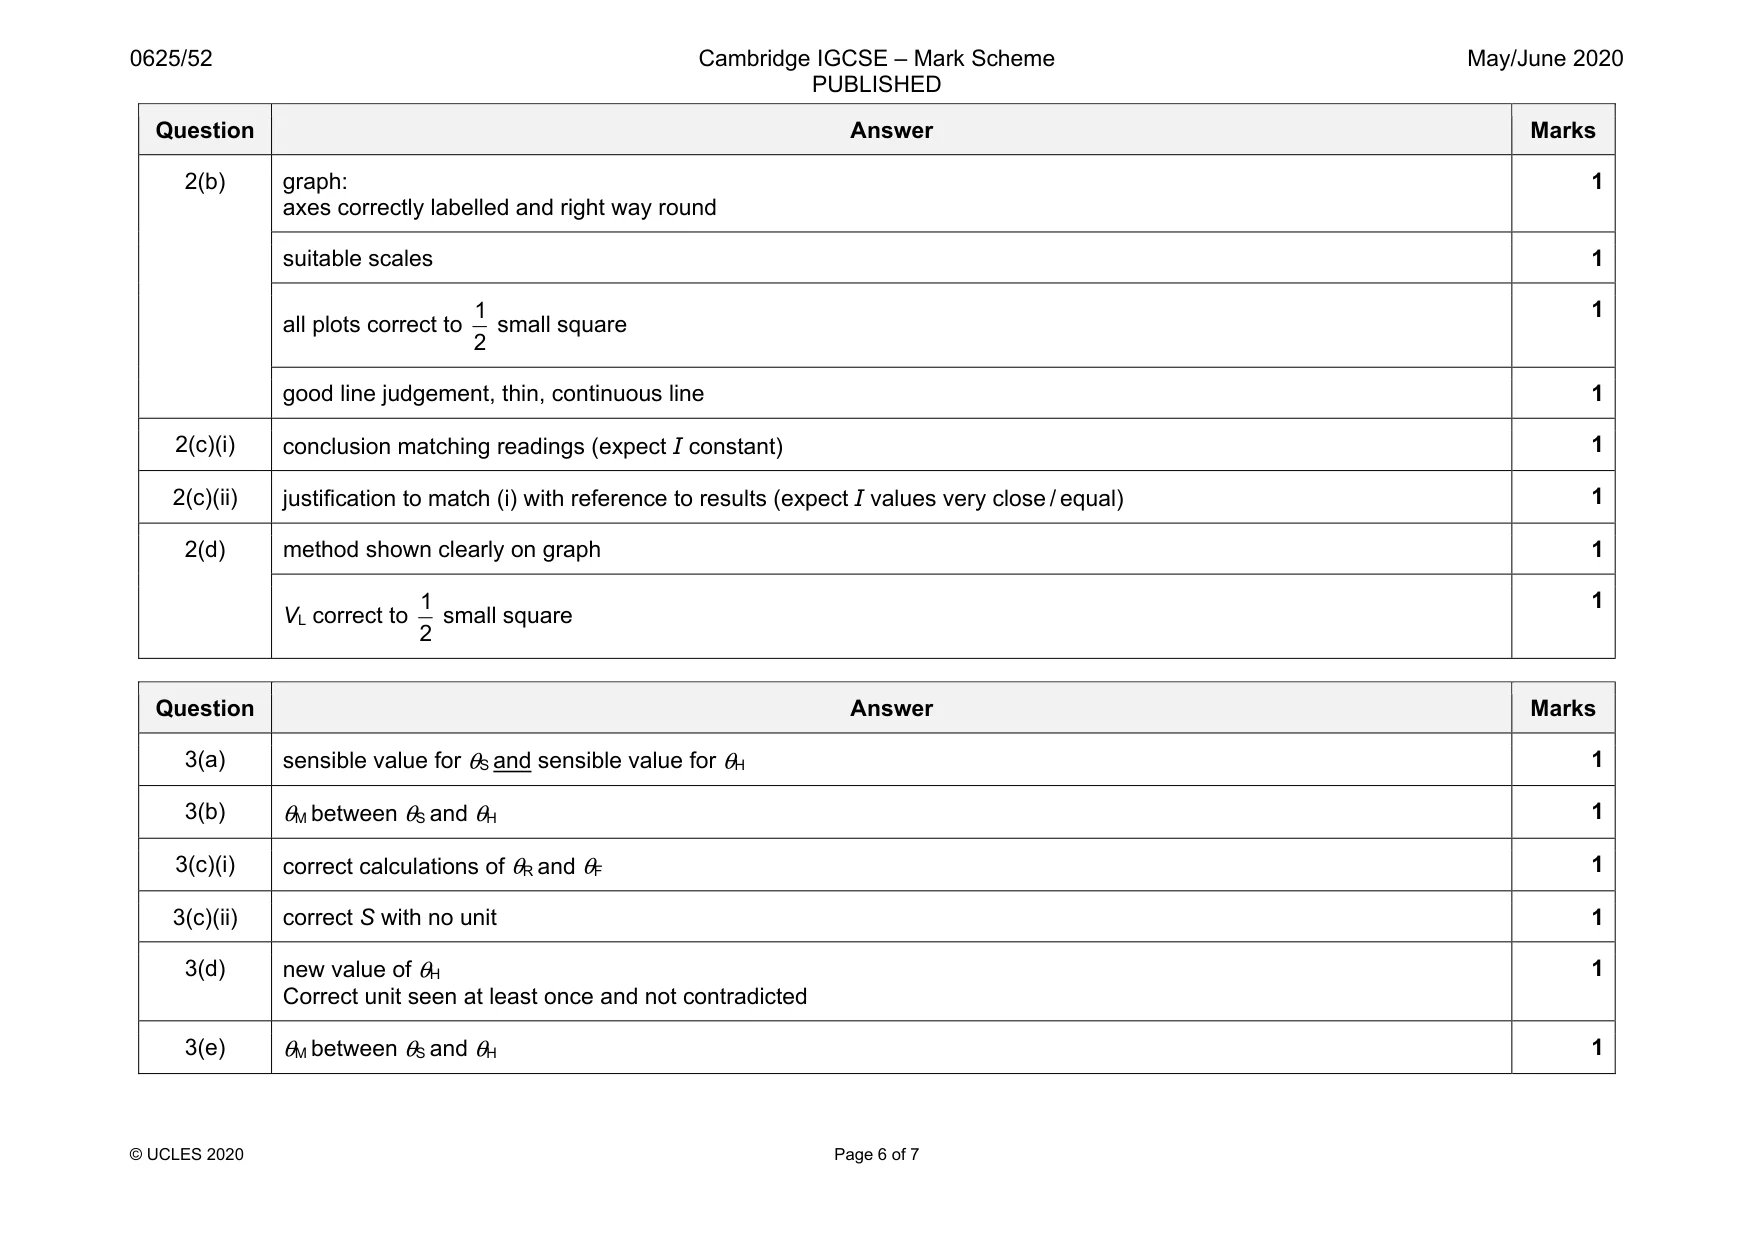
Mark scheme: 2(a) all V to at least 1dp < 3 V 1 all I to at least 2dp < 1 A 1 V values increasing 1 Question Answer Marks 2(b) graph: axes correctly labelled and right way round 1 suitable scales 1 all plots correct to 1 2 small square 1 good line judgement, thin, continuous line 1 2(c)(i) conclusion matching readings (expect I constant) 1 2(c)(ii) justification to match (i) with reference to results (expect I values very close / equal) 1 2(d) method shown clearly on graph 1 VL correct to 1 2 small square 1
Q3 · In this experiment, you will investigate some thermal properties of sand and water
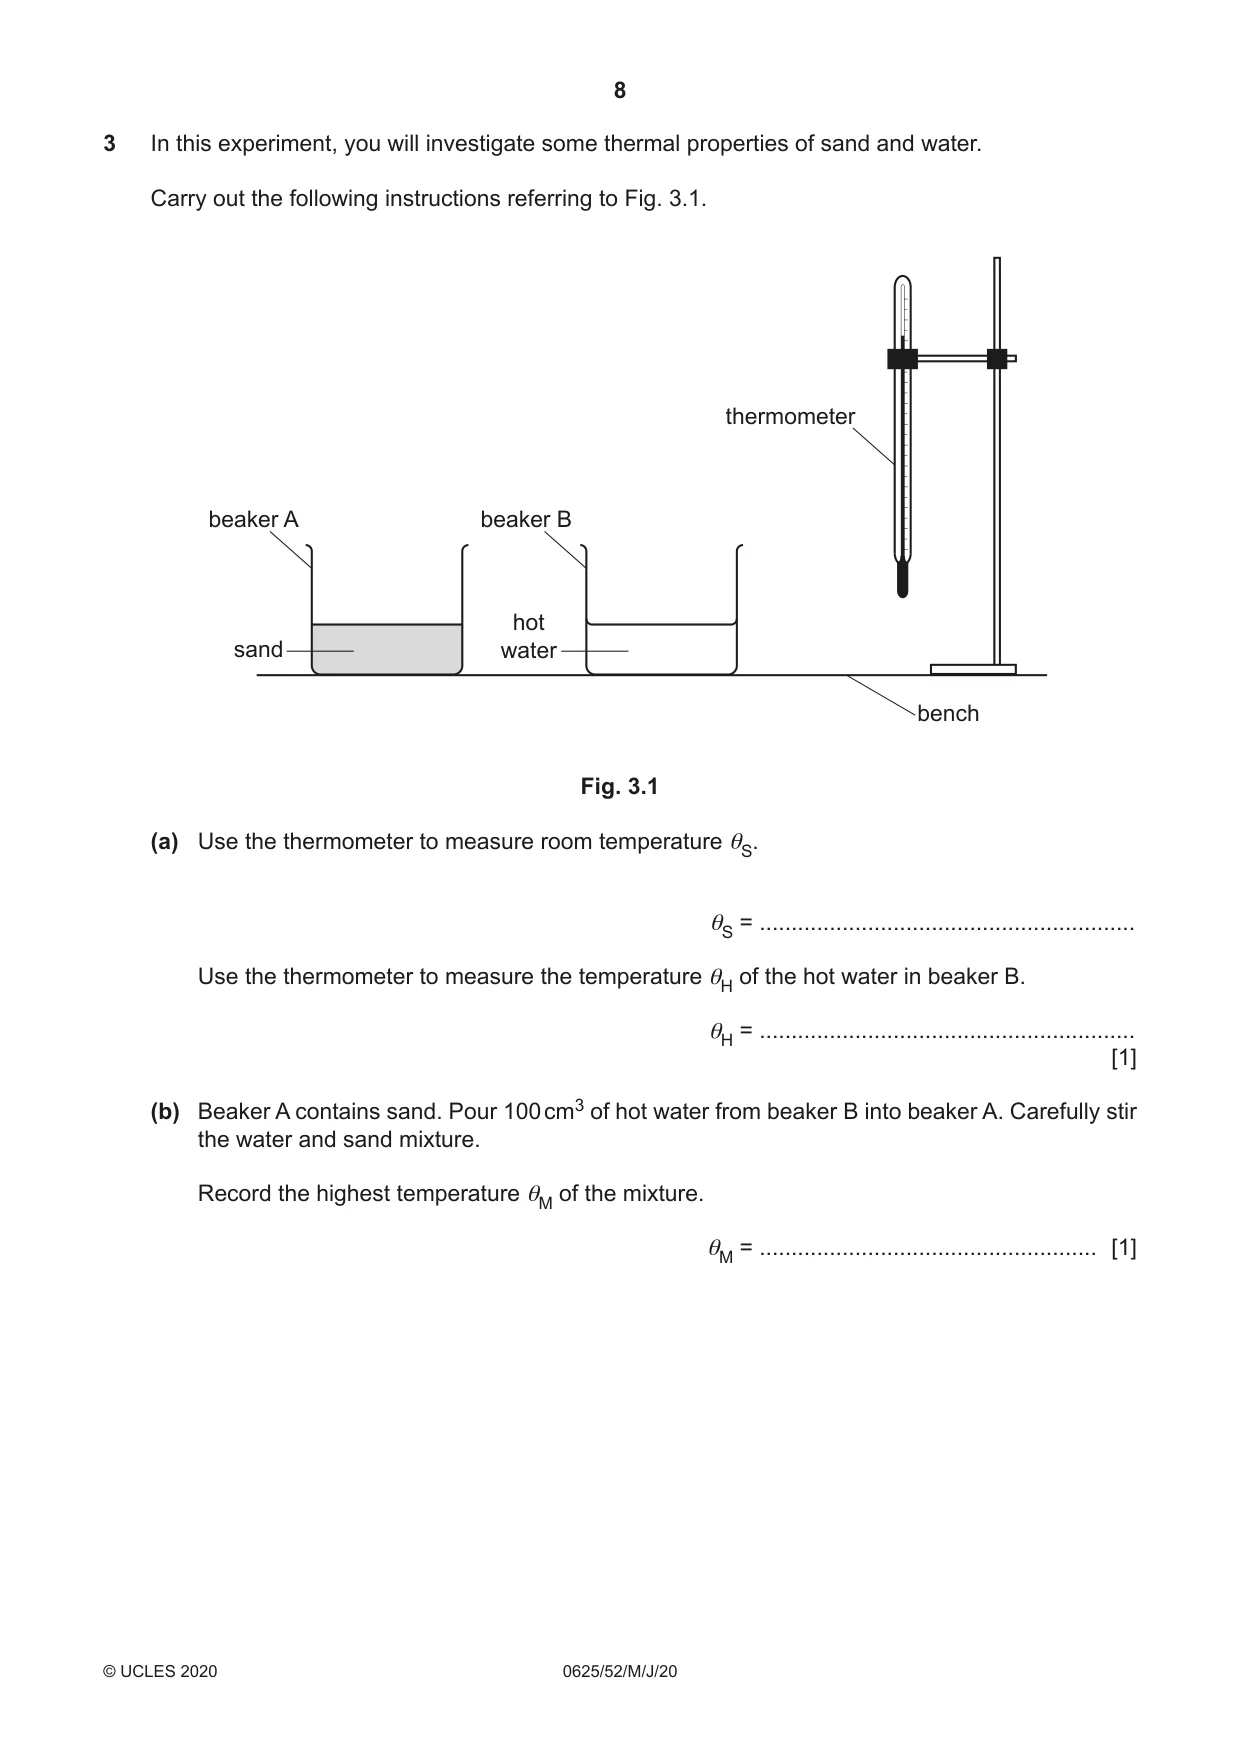
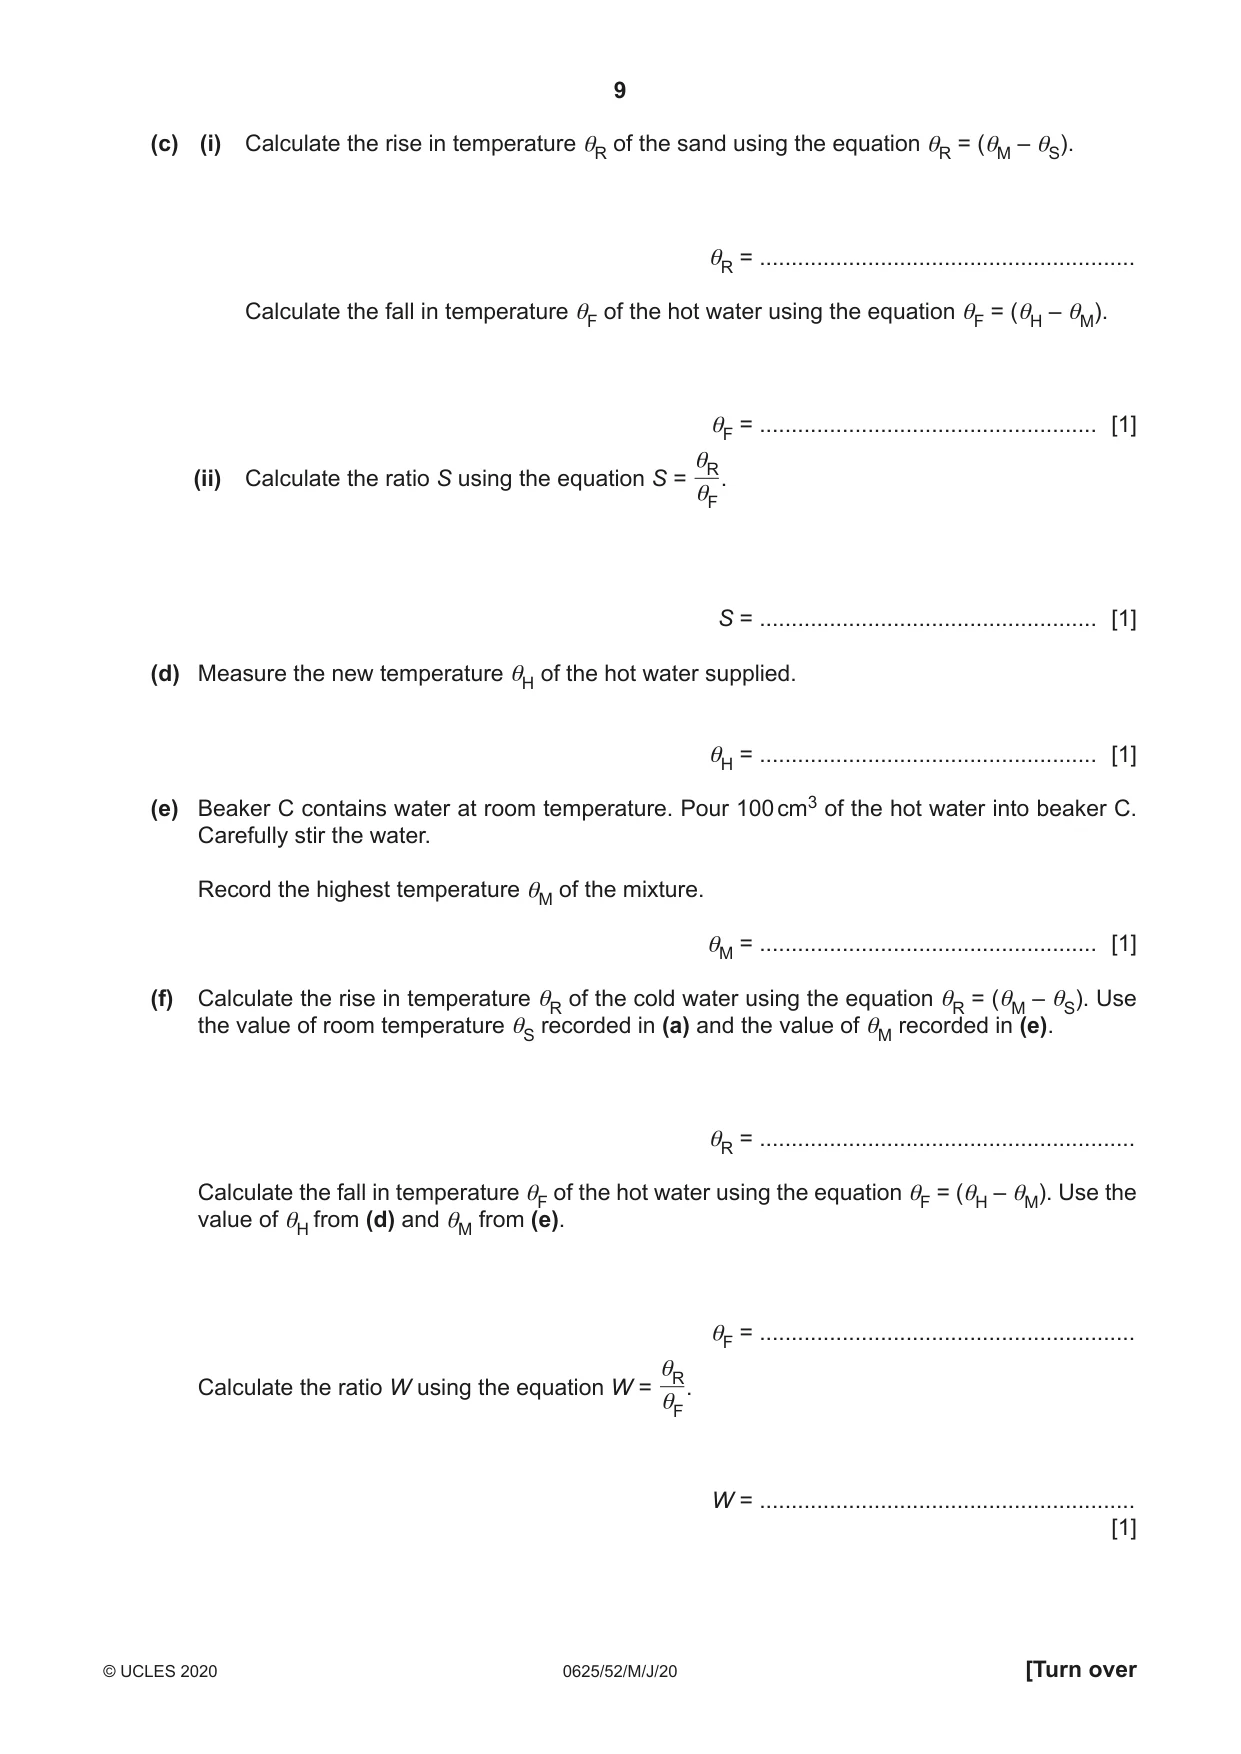
3 In this experiment, you will investigate some thermal properties of sand and water. Carry out the following instructions referring to Fig. 3.1. thermometer beaker A beaker B hot sand water bench Fig. 3.1 (a) Use the thermometer to measure room temperature θS. θS = ........................................................... Use the thermometer to measure the temperature θH of the hot water in beaker B. θH = ........................................................... [1] (b) Beaker A contains sand. Pour 100 cm3 of hot water from beaker B into beaker A. Carefully stir the water and sand mixture. Record the highest temperature θM of the mixture. θM = ..................................................... [1] (c) (i) Calculate the rise in temperature θR of the sand using the equation θR = (θM – θS). θR = ........................................................... Calculate the fall in temperature θF of the hot water using the equation θF = (θH – θM). θF = ..................................................... [1] θR (ii) Calculate the ratio S using the equation S = . θF S = ..................................................... [1] (d) Measure the new temperature θH of the hot water supplied. θH = ..................................................... [1] (e) Beaker C contains water at room temperature. Pour 100 cm3 of the hot water into beaker C. Carefully stir the water. Record the highest temperature θM of the mixture. θM = ..................................................... [1] (f) Calculate the rise in temperature θR of the cold water using the equation θR = (θM – θS). Use the value of room temperature θS recorded in (a) and the value of θM recorded in (e). θR = ........................................................... Calculate the fall in temperature θF of the hot water using the equation θF = (θH – θM). Use the value of θH from (d) and θM from (e). θF = ........................................................... θR Calculate the ratio W using the equation W = . θF W = ........................................................... [1] (g) A student studies the thermal properties of sand and water. He predicts that S should be equal to 6 × W. State whether your results support the prediction. Justify your answer by reference to your readings. statement .................................................................................................................................. justification ................................................................................................................................ ................................................................................................................................................... ................................................................................................................................................... [2] (h) Suggest two temperatures that it would be sensible to keep constant when carrying out the experiments. 1. .......................................................... 2. .......................................................... [2] [Total: 11]
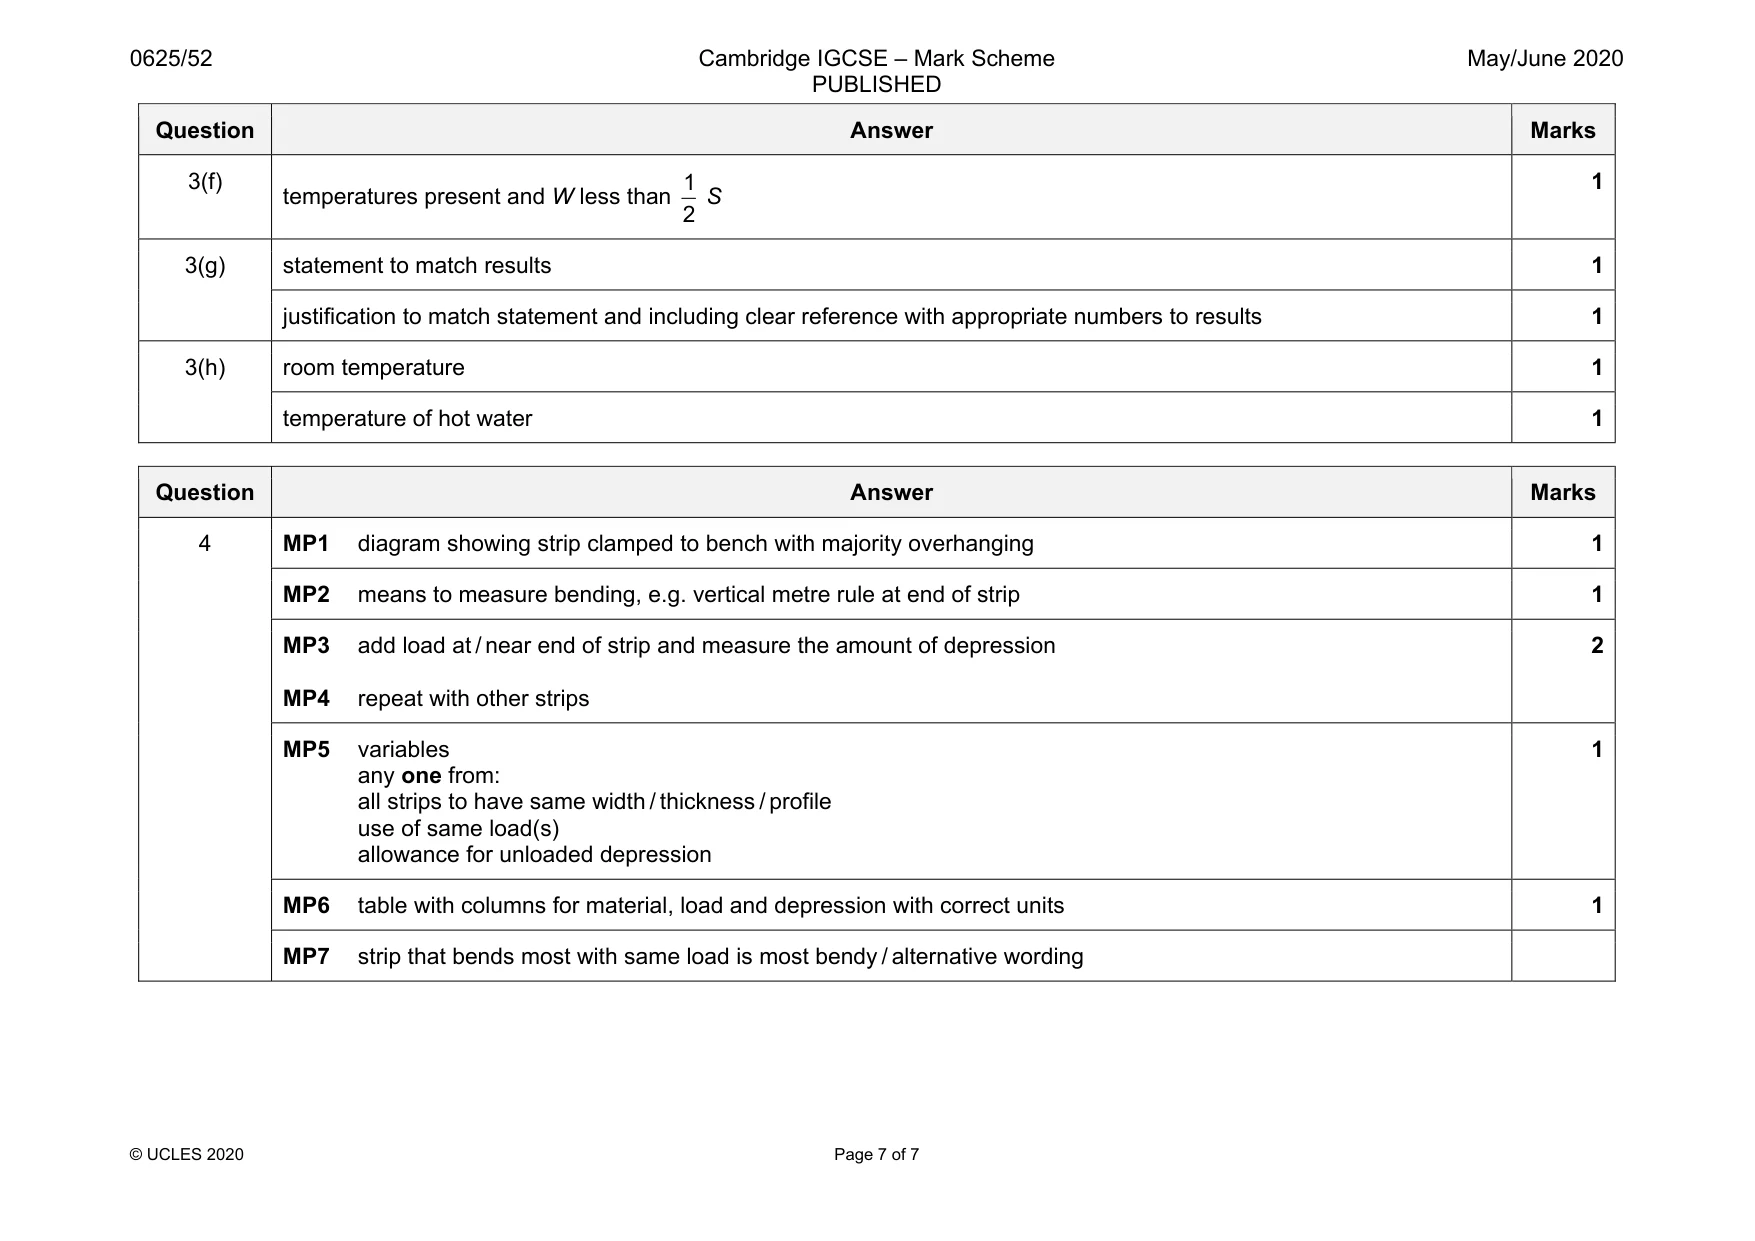
Mark scheme: 3(a) sensible value for θS and sensible value for θH 1 3(b) θM between θS and θH 1 3(c)(i) correct calculations of θR and θF 1 3(c)(ii) correct S with no unit 1 3(d) new value of θH Correct unit seen at least once and not contradicted 1 3(e) θM between θS and θH 1 Question Answer Marks 3(f) temperatures present and W less than 1 2 S 1 3(g) statement to match results 1 justification to match statement and including clear reference with appropriate numbers to results 1 3(h) room temperature 1 temperature of hot water 1
Q4 · A student investigates the bending of 1 m length strips of different materials
4 A student investigates the bending of 1 m length strips of different materials. She compares how far they bend when loaded at one end. Plan an experiment to investigate how the material from which the strips are made affects the bending of the strips when loaded at one end. You are not required to carry out this experiment. The following apparatus is available to the student: strips of wood, plastic, steel and aluminium, all 1 m long a set of slotted masses a metre rule a G-clamp (used to hold the strips to the laboratory bench). Other apparatus normally available in a school laboratory can also be used. In your plan, you should: • draw a diagram to show the arrangement of the apparatus • explain briefly how you would carry out the investigation, including the measurements you would take • state the key variables to be kept constant • draw a suitable table, with column headings, to show how you would display your readings (you are not required to enter any readings in the table) • explain how you would use the results to reach a conclusion. .......................................................................................................................................................... .......................................................................................................................................................... .......................................................................................................................................................... .......................................................................................................................................................... .......................................................................................................................................................... .......................................................................................................................................................... .......................................................................................................................................................... .......................................................................................................................................................... .......................................................................................................................................................... .......................................................................................................................................................... .......................................................................................................................................................... .......................................................................................................................................................... .......................................................................................................................................................... .......................................................................................................................................................... .......................................................................................................................................................... .......................................................................................................................................................... .......................................................................................................................................................... .......................................................................................................................................................... .......................................................................................................................................................... .......................................................................................................................................................... .......................................................................................................................................................... .......................................................................................................................................................... [7] [Total: 7]
Mark scheme: 4 MP1 diagram showing strip clamped to bench with majority overhanging 1 MP2 means to measure bending, e.g. vertical metre rule at end of strip 1 MP3 add load at / near end of strip and measure the amount of depression MP4 repeat with other strips 2 MP5 variables any one from: all strips to have same width / thickness / profile use of same load(s) allowance for unloaded depression 1 MP6 table with columns for material, load and depression with correct units 1 MP7 strip that bends most with same load is most bendy / alternative wording
What was in this paper
The subtopics covered by these 4 questions, and how many questions each got. Open one in a new tab to see every Cambridge question on it.