Cambridge IGCSE Physics 0625 — 2017 Oct/Nov Paper 5 · Variant 3
0625/53/O/N/17 · 4 questions · 40 marks · ≈45 min
The question paper and its mark scheme, free to read here and free to download. This is Cambridge’s own paper, exactly as it was sat.
Question paper12 pages

Mark scheme5 pages
Answers below. Sit the paper first if you are practising.
Questions as text
Q1 · In this experiment, you will investigate how the use of a lid affects the rate of cooling…
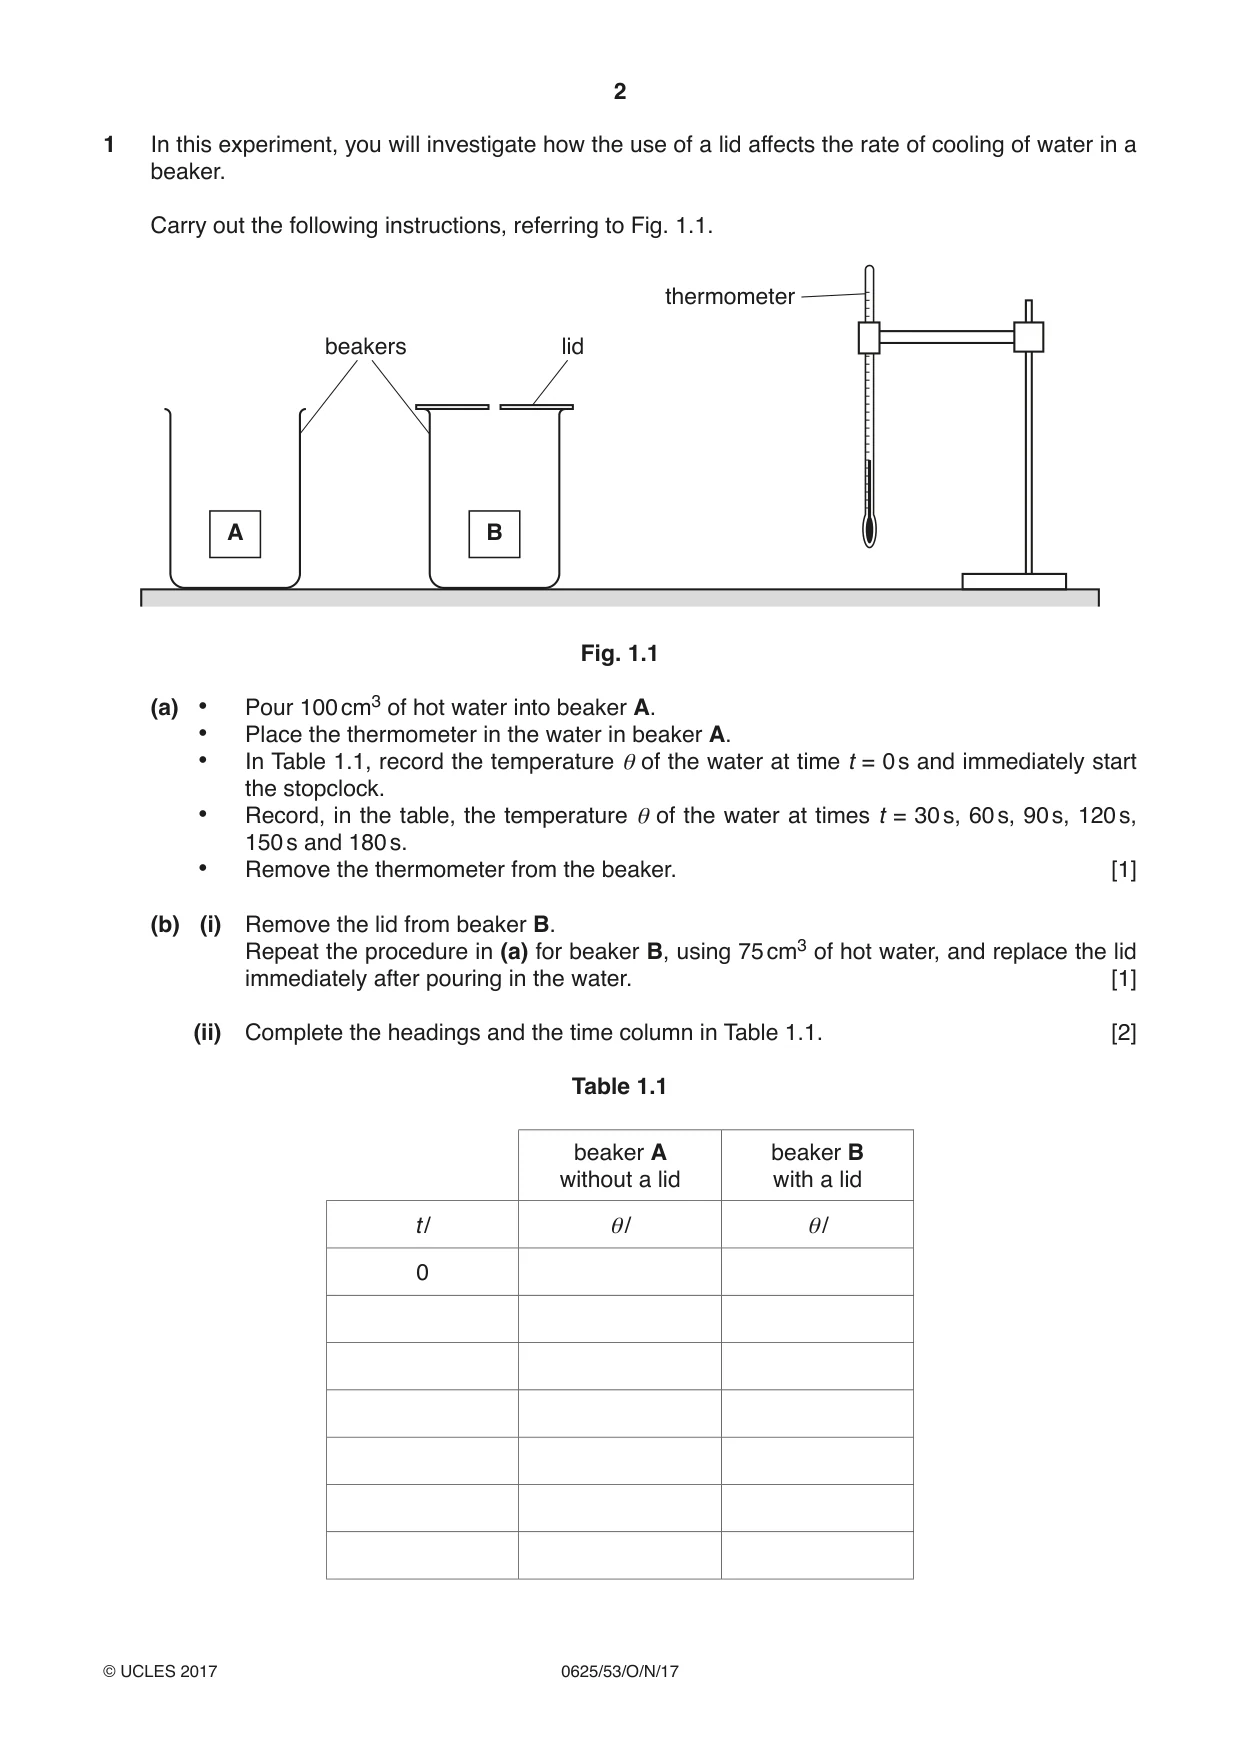
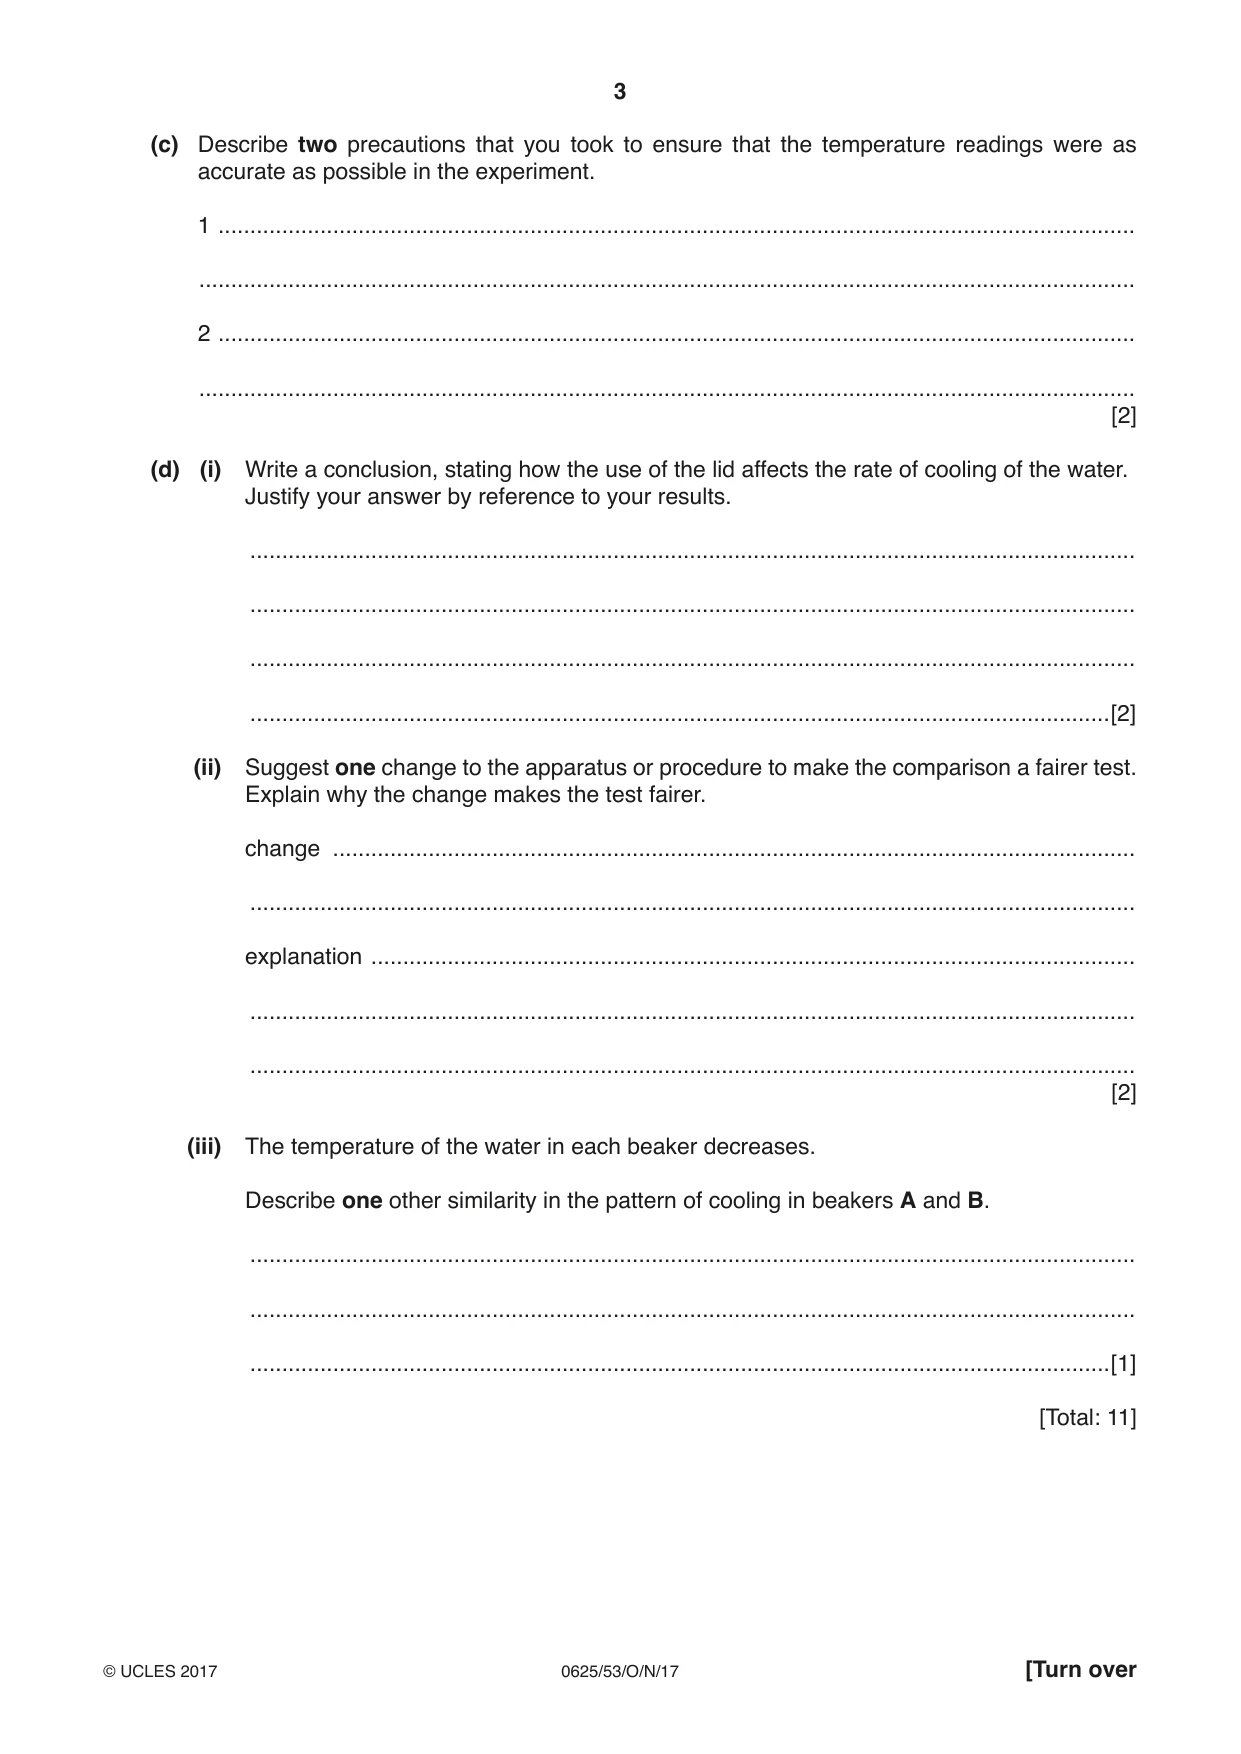
1 In this experiment, you will investigate how the use of a lid affects the rate of cooling of water in a beaker. Carry out the following instructions, referring to Fig. 1.1. thermometer beakers lid A B Fig. 1.1 (a) • Pour 100 cm3 of hot water into beaker A. • Place the thermometer in the water in beaker A. • In Table 1.1, record the temperature θ of the water at time t = 0 s and immediately start the stopclock. • Record, in the table, the temperature θ of the water at times t = 30 s, 60 s, 90 s, 120 s, 150 s and 180 s. • Remove the thermometer from the beaker. [1] (b) (i) Remove the lid from beaker B. Repeat the procedure in (a) for beaker B, using 75 cm3 of hot water, and replace the lid immediately after pouring in the water. [1] (ii) Complete the headings and the time column in Table 1.1. [2] Table 1.1 beaker A beaker B without a lid with a lid t / θ/ θ/ 0 (c) Describe two precautions that you took to ensure that the temperature readings were as accurate as possible in the experiment. 1 ................................................................................................................................................ ................................................................................................................................................... 2 ................................................................................................................................................ ................................................................................................................................................... [2] (d) (i) Write a conclusion, stating how the use of the lid affects the rate of cooling of the water. Justify your answer by reference to your results. ........................................................................................................................................... ........................................................................................................................................... ........................................................................................................................................... .......................................................................................................................................[2] (ii) Suggest one change to the apparatus or procedure to make the comparison a fairer test. Explain why the change makes the test fairer. change .............................................................................................................................. ........................................................................................................................................... explanation ........................................................................................................................ ........................................................................................................................................... ........................................................................................................................................... [2] (iii) The temperature of the water in each beaker decreases. Describe one other similarity in the pattern of cooling in beakers A and B. ........................................................................................................................................... ........................................................................................................................................... .......................................................................................................................................[1] [Total: 11]
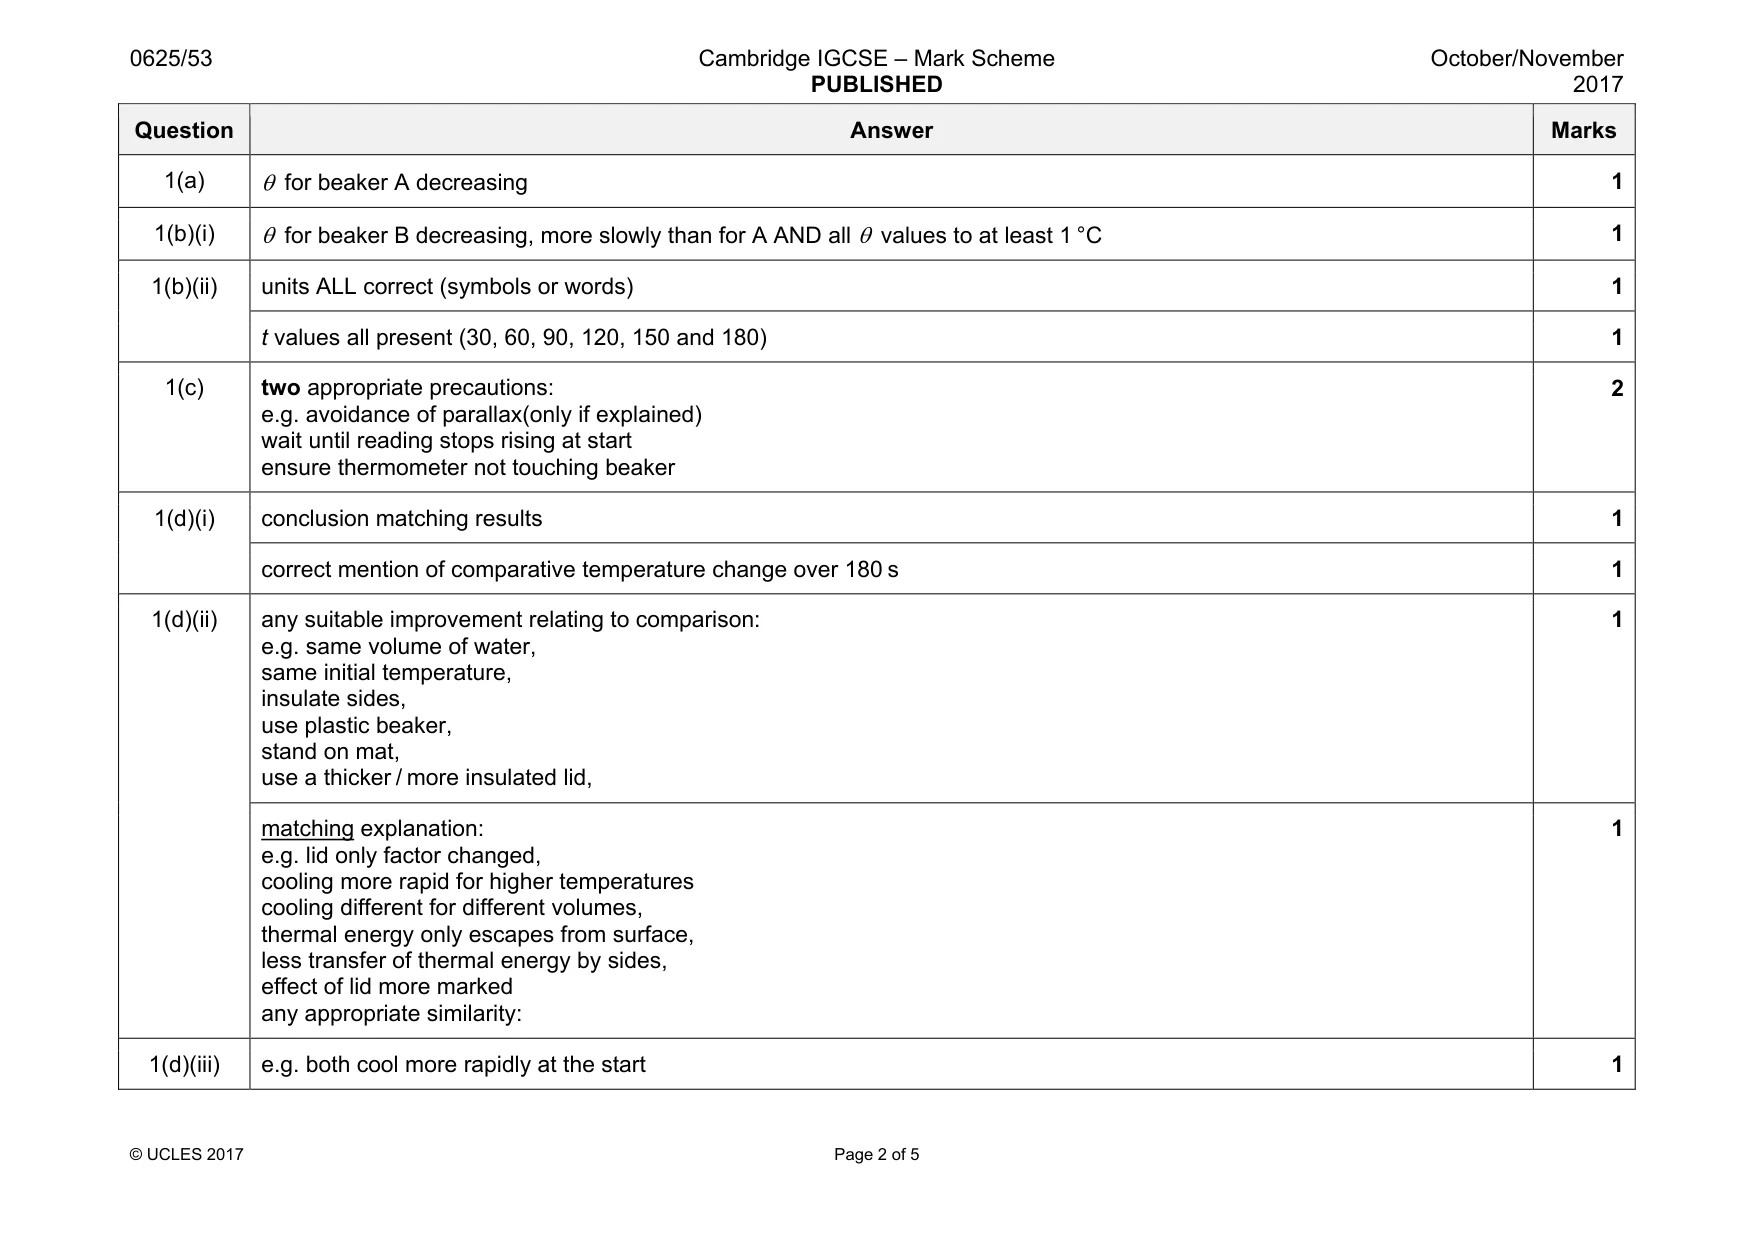
Mark scheme: 1(a) 1 1(b)(i) θ for beaker B decreasing, more slowly than for A AND all θ values to at least 1 °C 1 1(b)(ii) units ALL correct (symbols or words) 1 t values all present (30, 60, 90, 120, 150 and 180) 1 1(c) two appropriate precautions: e.g. avoidance of parallax(only if explained) wait until reading stops rising at start ensure thermometer not touching beaker 2 1(d)(i) conclusion matching results 1 correct mention of comparative temperature change over 180 s 1 1(d)(ii) any suitable improvement relating to comparison: e.g. same volume of water, same initial temperature, insulate sides, use plastic beaker, stand on mat, use a thicker / more insulated lid, 1 matching explanation: e.g. lid only factor changed, cooling more rapid for higher temperatures cooling different for different volumes, thermal energy only escapes from surface, less transfer of thermal energy by sides, effect of lid more marked any appropriate similarity: 1 1(d)(iii) e.g. both cool more rapidly at the start 1
Q2 · In this experiment, you will investigate a circuit containing resistors
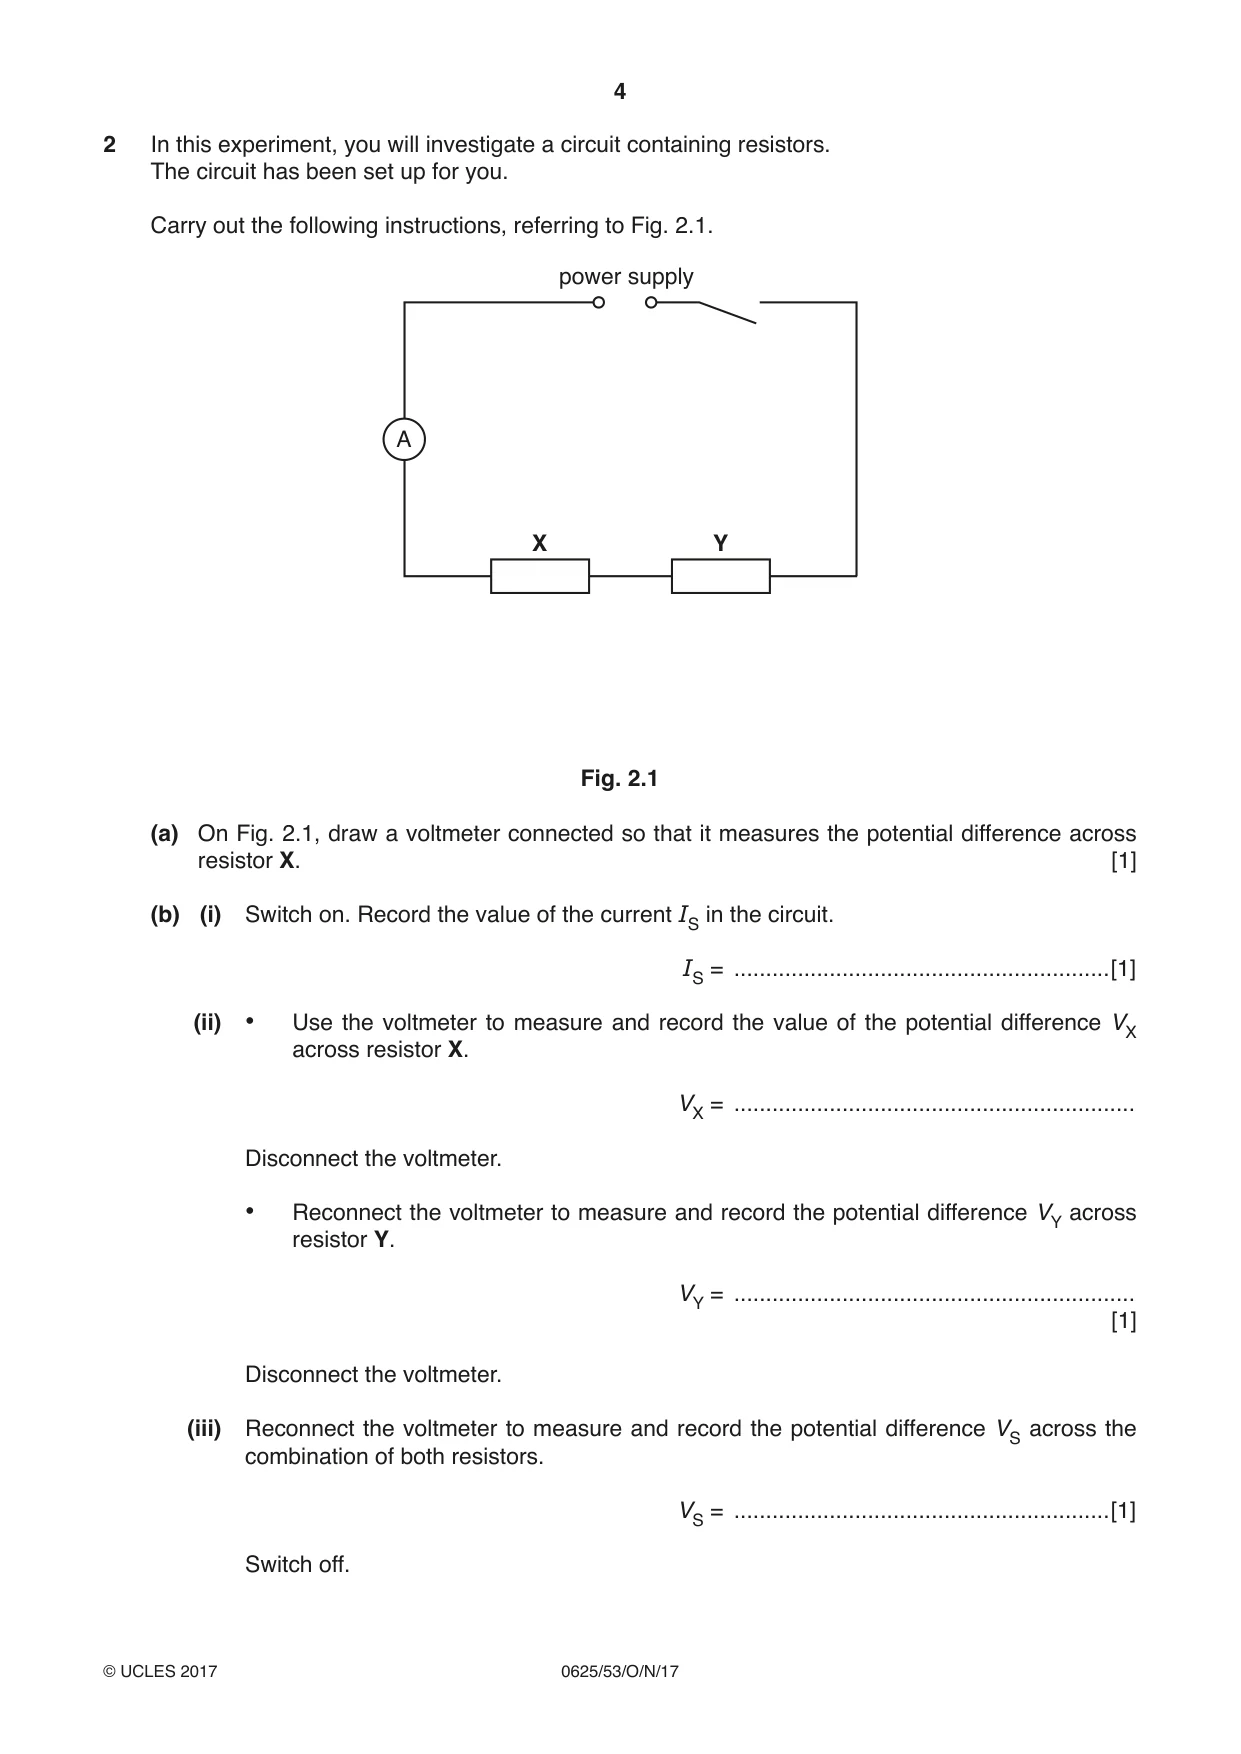
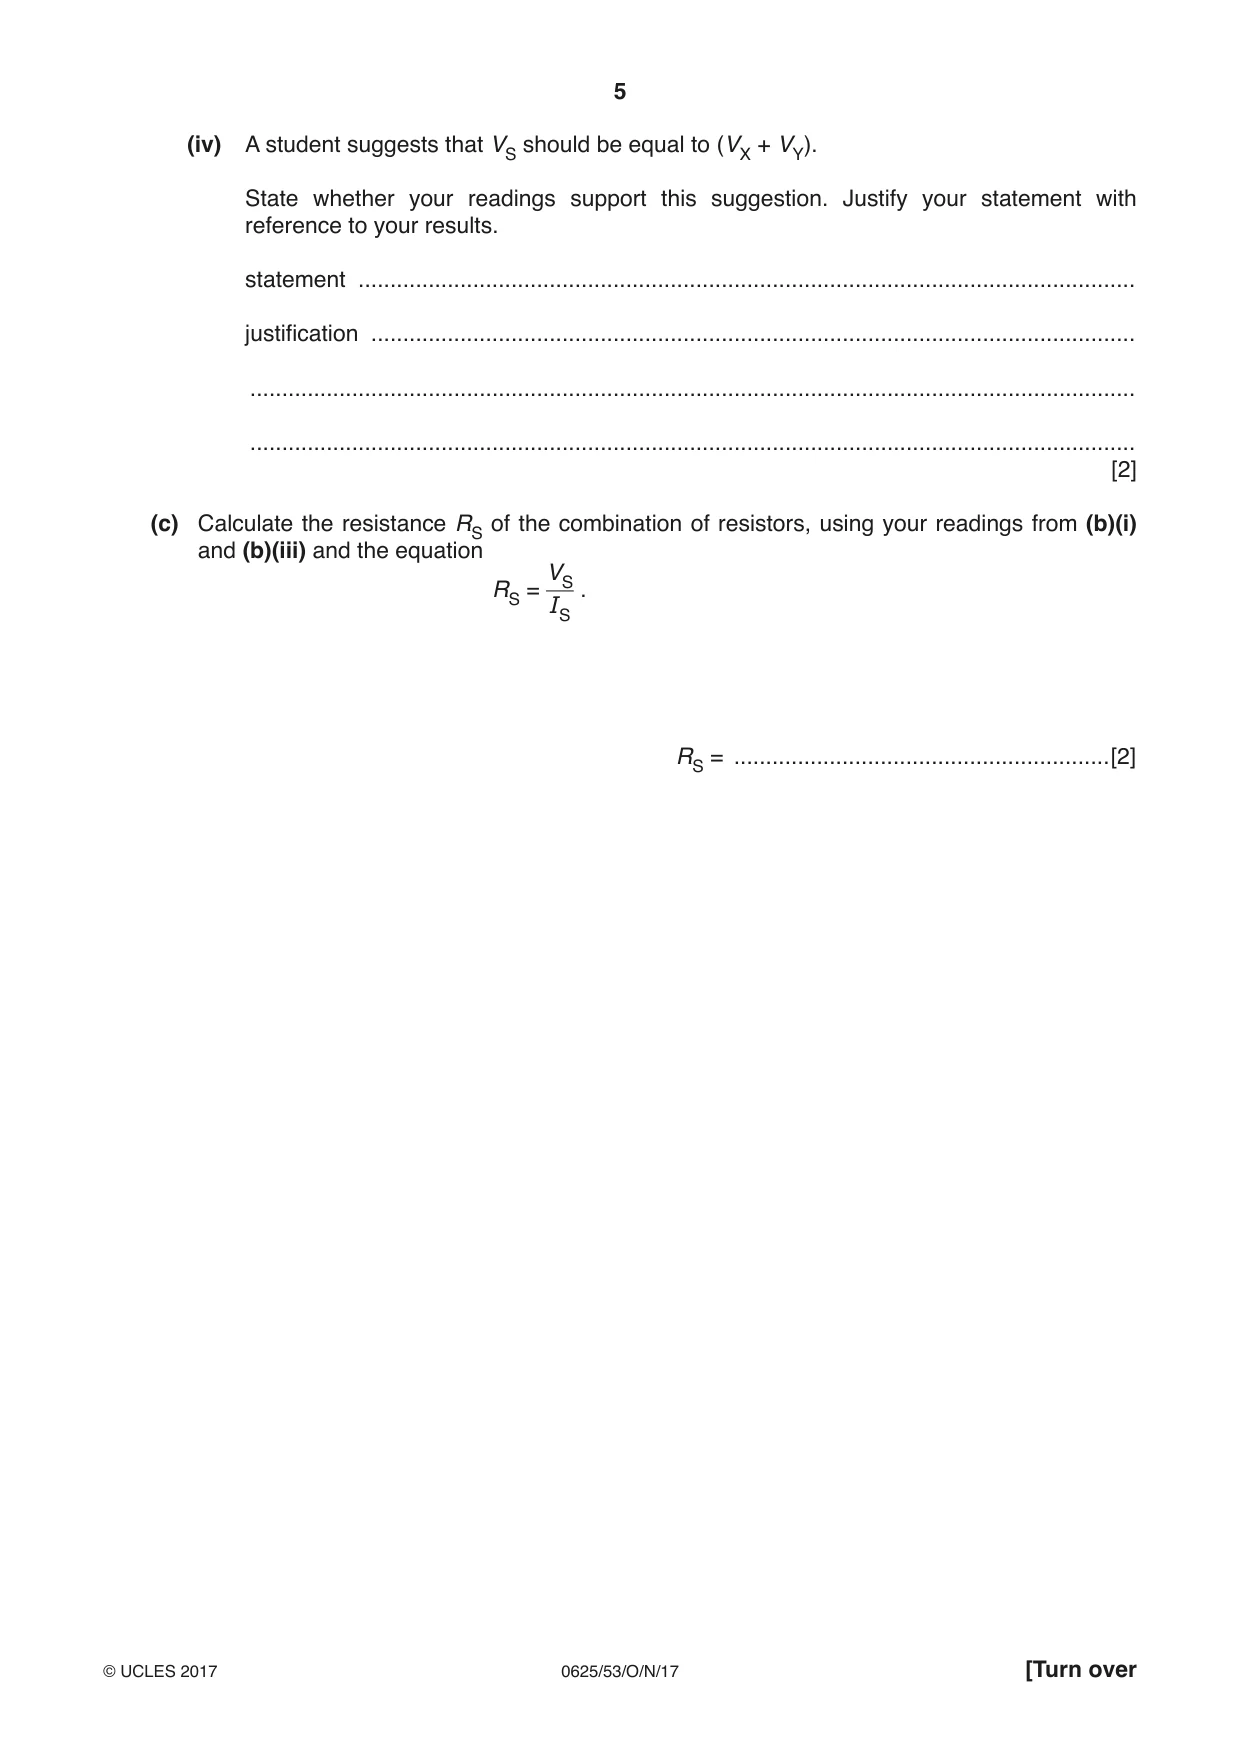
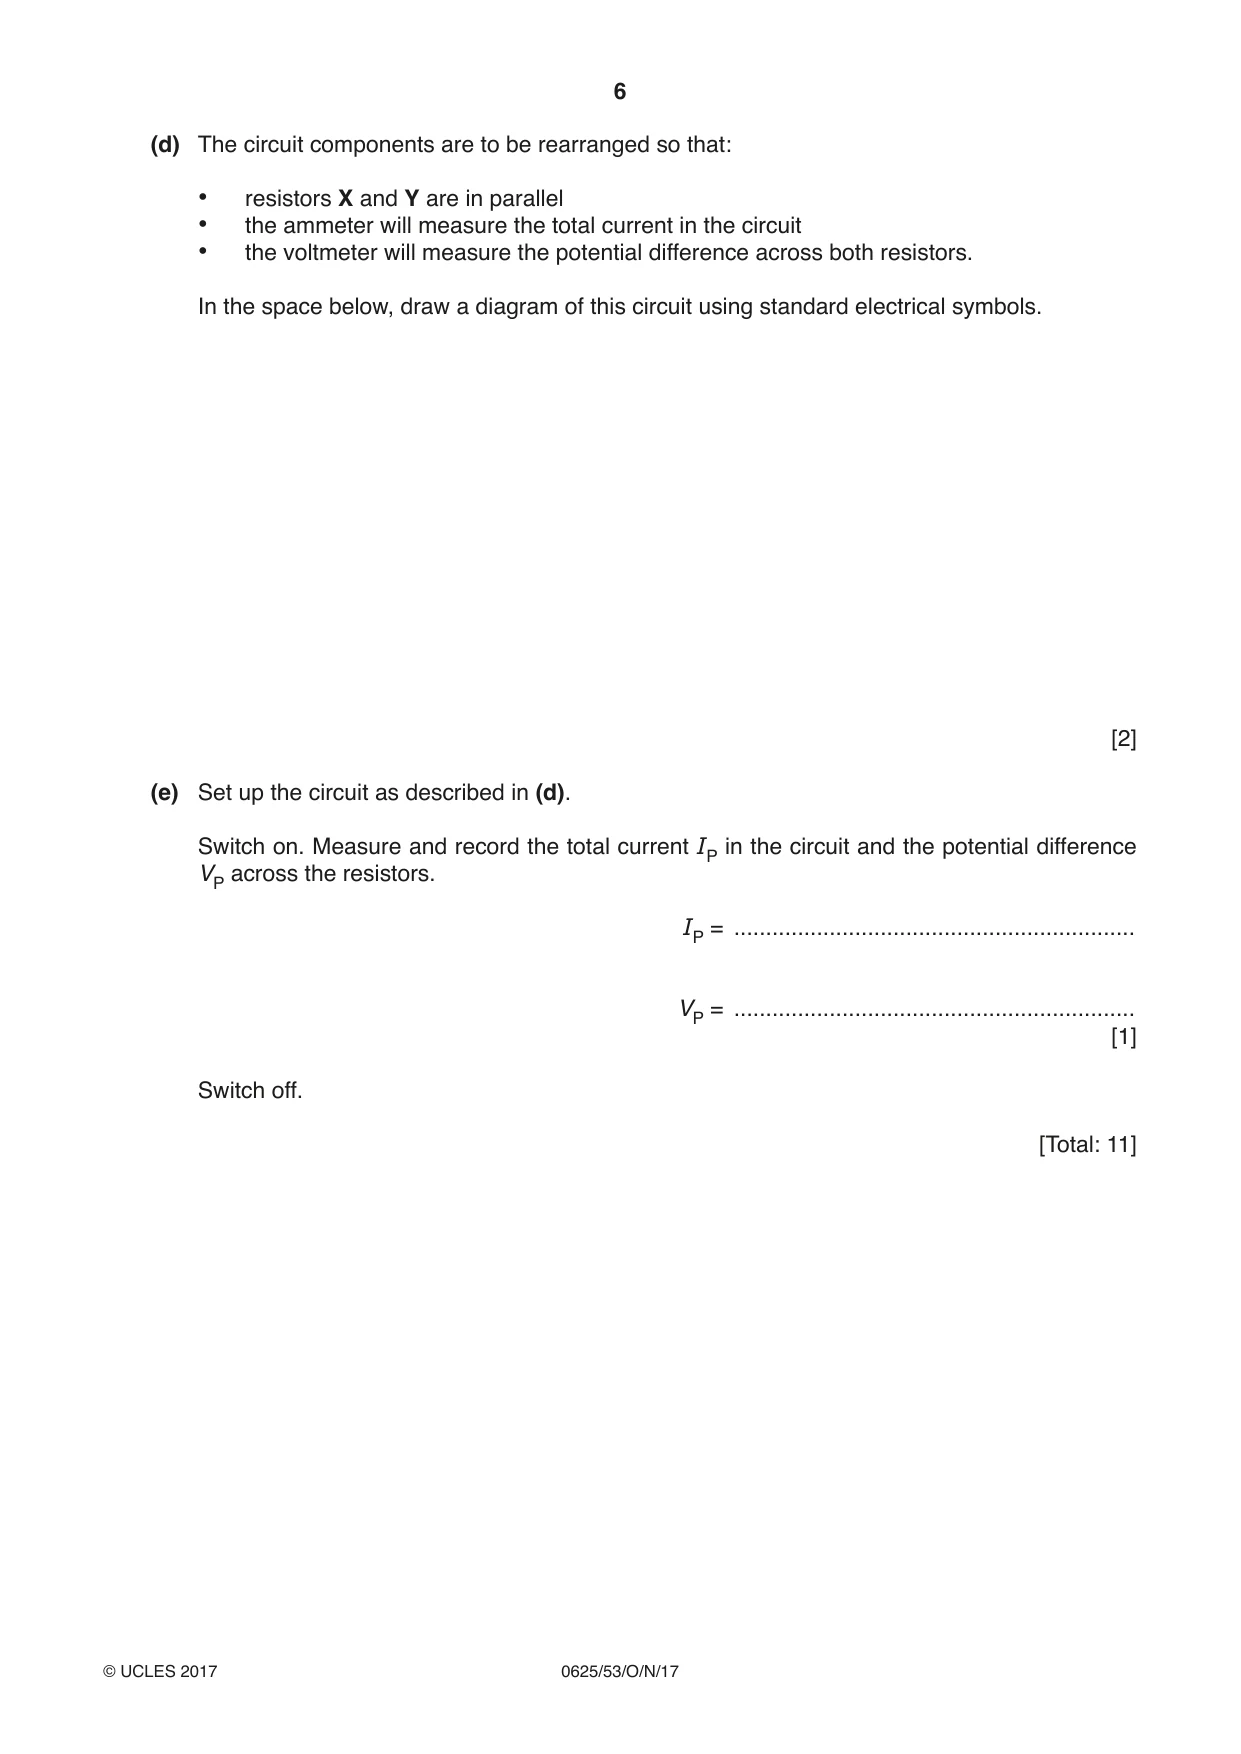
2 In this experiment, you will investigate a circuit containing resistors. The circuit has been set up for you. Carry out the following instructions, referring to Fig. 2.1. power supply A X Y Fig. 2.1 (a) On Fig. 2.1, draw a voltmeter connected so that it measures the potential difference across resistor X. [1] (b) (i) Switch on. Record the value of the current IS in the circuit. IS = ...........................................................[1] (ii) • Use the voltmeter to measure and record the value of the potential difference VX across resistor X. VX = ............................................................... Disconnect the voltmeter. • Reconnect the voltmeter to measure and record the potential difference VY across resistor Y. VY = ............................................................... [1] Disconnect the voltmeter. (iii) Reconnect the voltmeter to measure and record the potential difference VS across the combination of both resistors. VS = ...........................................................[1] Switch off. (iv) A student suggests that VS should be equal to (VX + VY). State whether your readings support this suggestion. Justify your statement with reference to your results. statement .......................................................................................................................... justification ........................................................................................................................ ........................................................................................................................................... ........................................................................................................................................... [2] (c) Calculate the resistance RS of the combination of resistors, using your readings from (b)(i) and (b)(iii) and the equation VS RS = . IS RS = ...........................................................[2] (d) The circuit components are to be rearranged so that: • resistors X and Y are in parallel • the ammeter will measure the total current in the circuit • the voltmeter will measure the potential difference across both resistors. In the space below, draw a diagram of this circuit using standard electrical symbols. [2] (e) Set up the circuit as described in (d). Switch on. Measure and record the total current IP in the circuit and the potential difference VP across the resistors. IP = ............................................................... VP = ............................................................... [1] Switch off. [Total: 11]
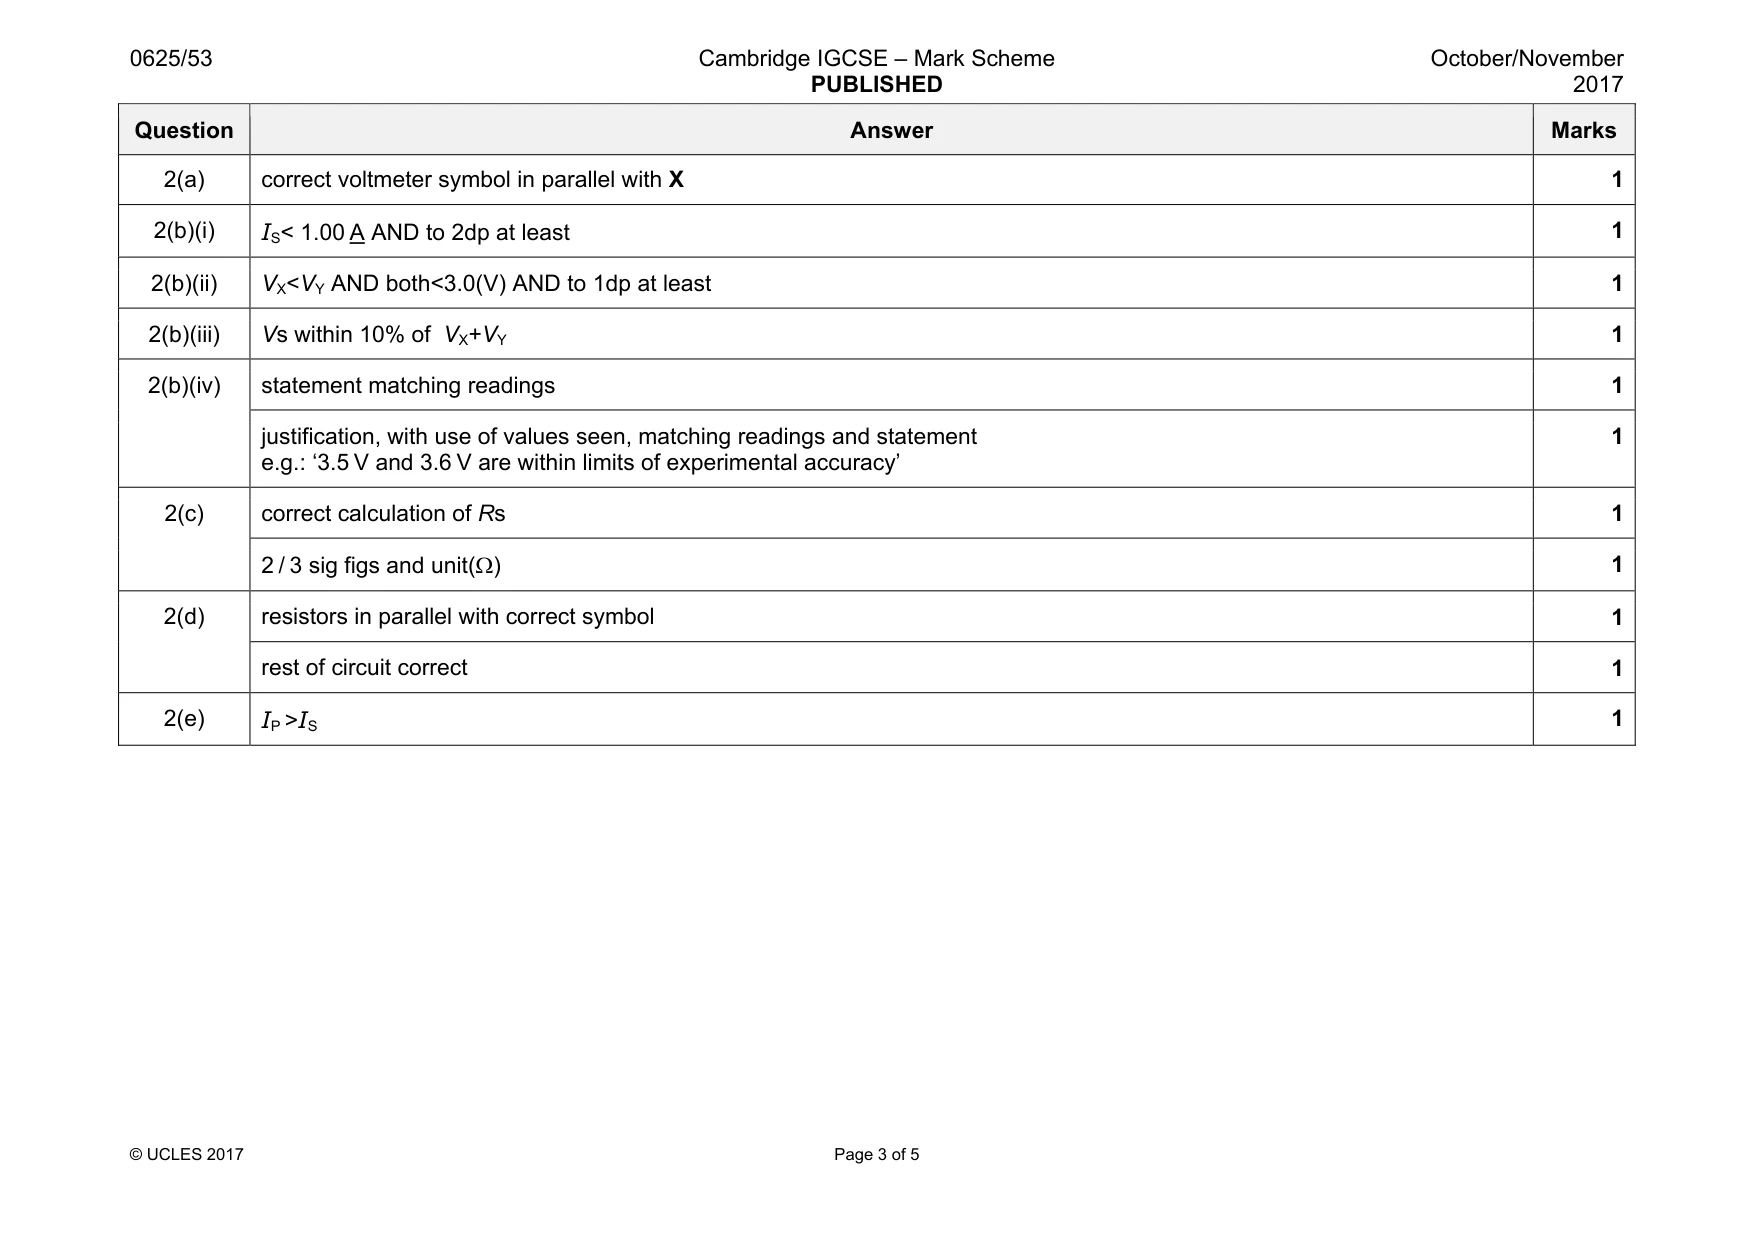
Mark scheme: 2(a) correct voltmeter symbol in parallel with X 1 2(b)(i) IS< 1.00 A AND to 2dp at least 1 2(b)(ii) VX<VY AND both<3.0(V) AND to 1dp at least 1 2(b)(iii) Vs within 10% of VX+VY 1 2(b)(iv) statement matching readings 1 justification, with use of values seen, matching readings and statement e.g.: ‘3.5 V and 3.6 V are within limits of experimental accuracy’ 1 2(c) correct calculation of Rs 1 2 / 3 sig figs and unit(Ω) 1 2(d) resistors in parallel with correct symbol 1 rest of circuit correct 1 2(e) IP >IS 1
Q3 · In this experiment, you will determine the weight of a metre rule
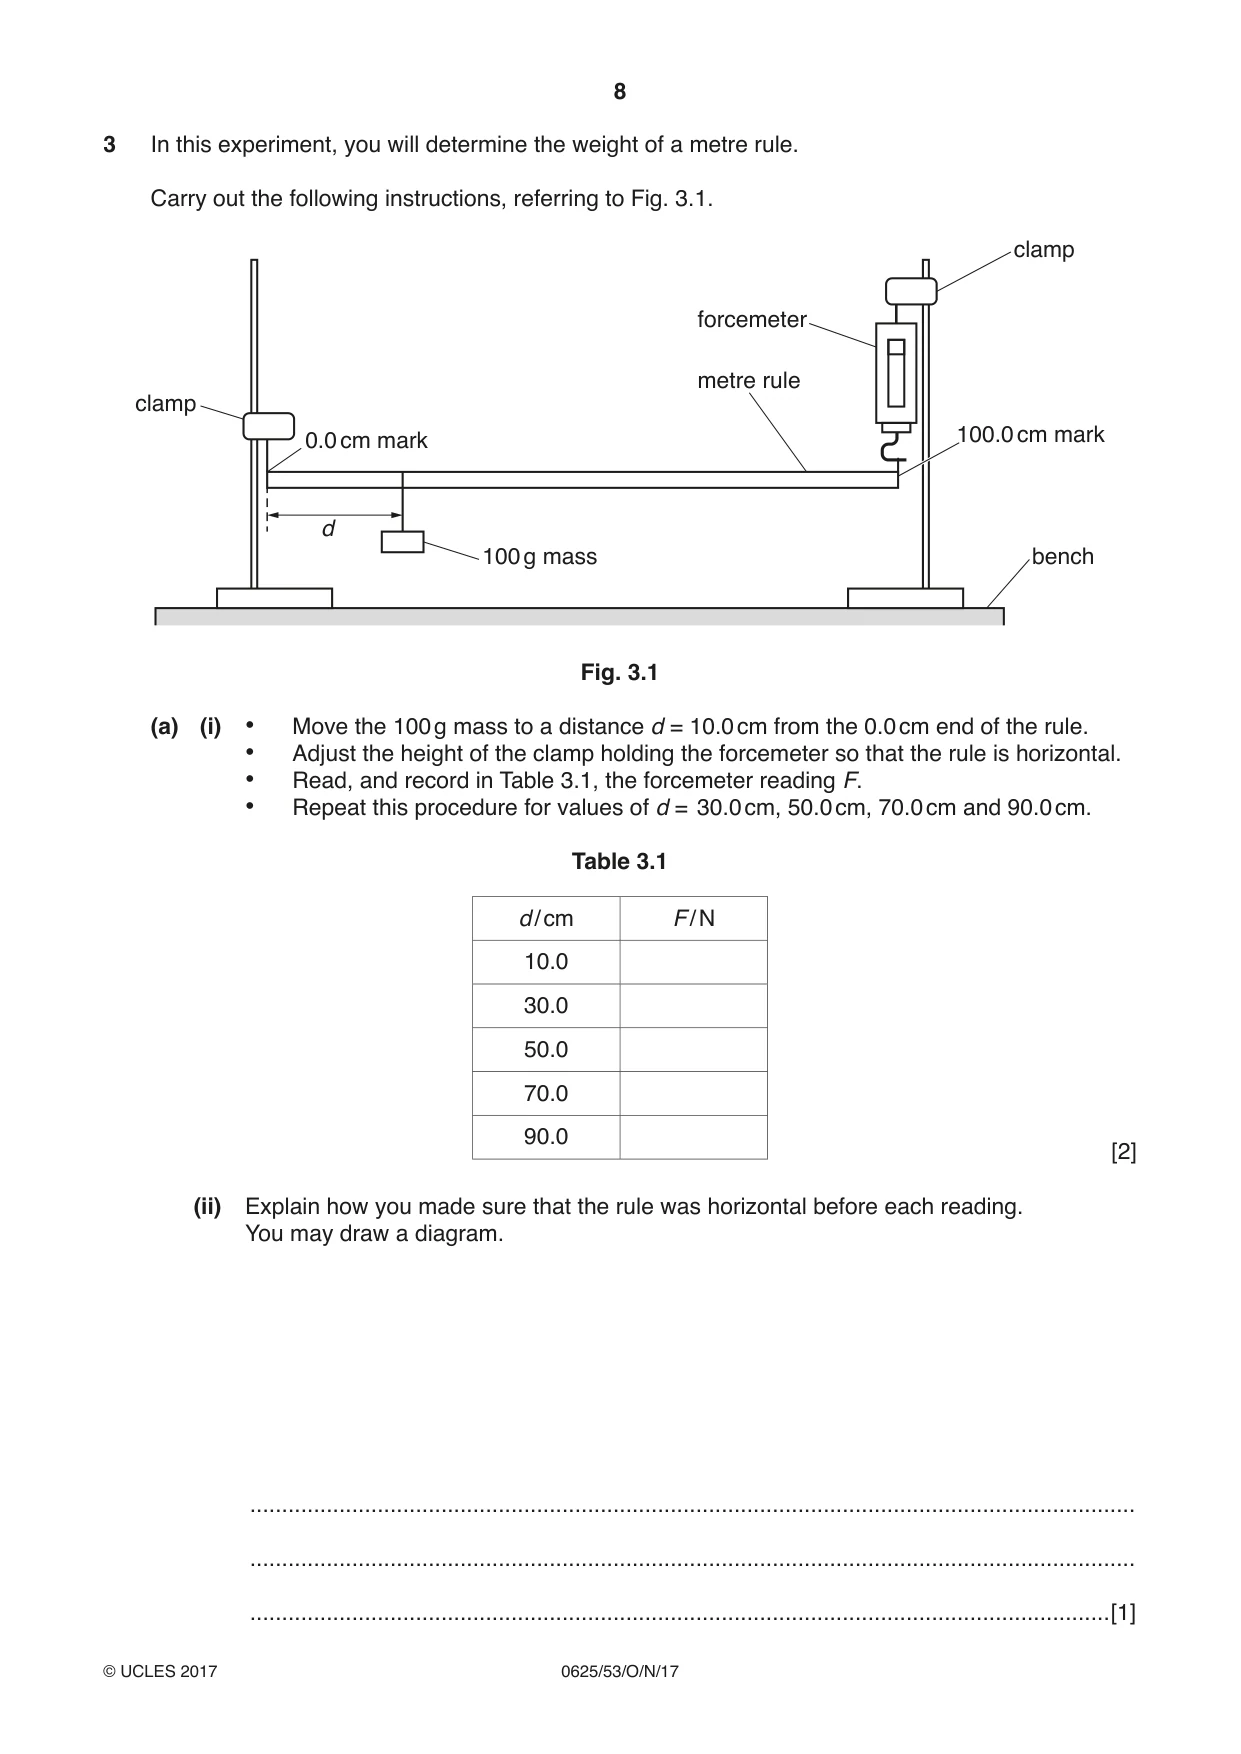
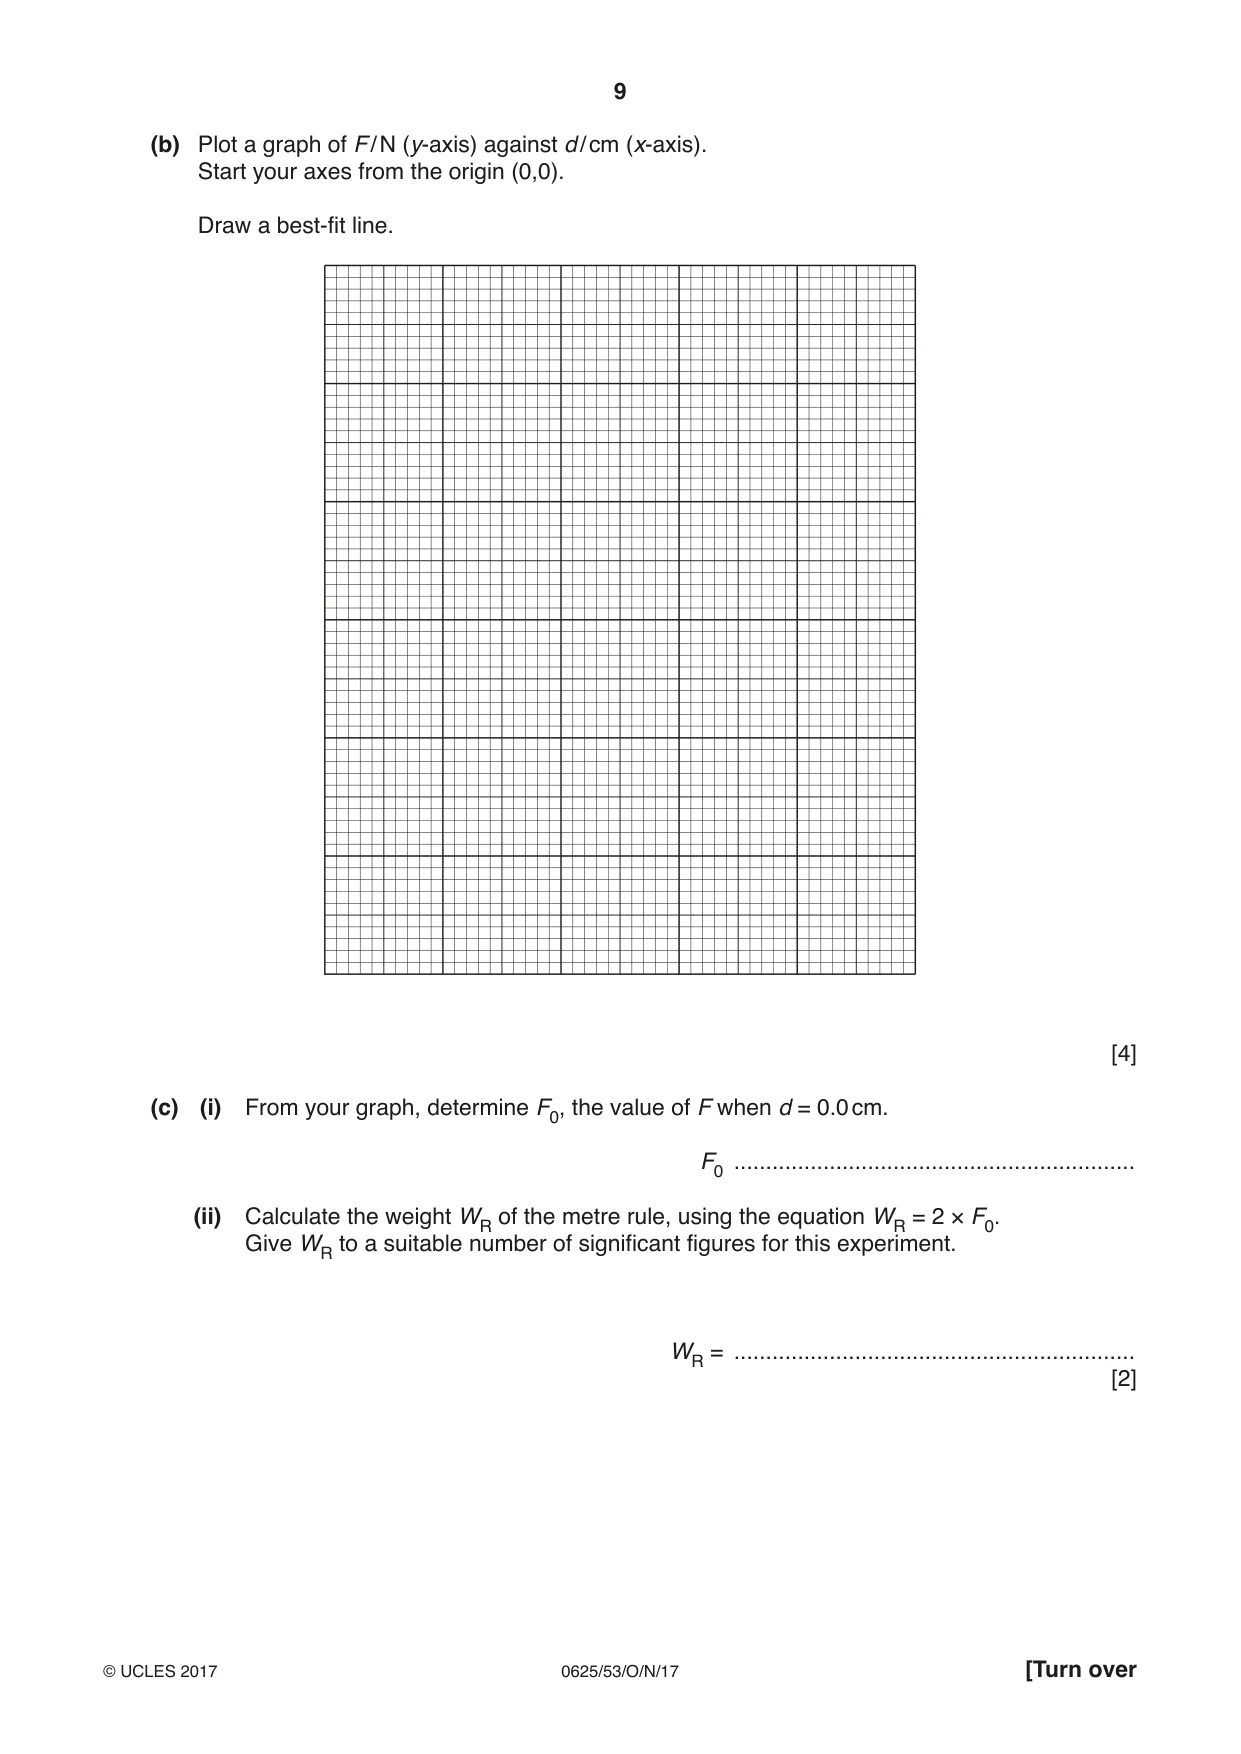
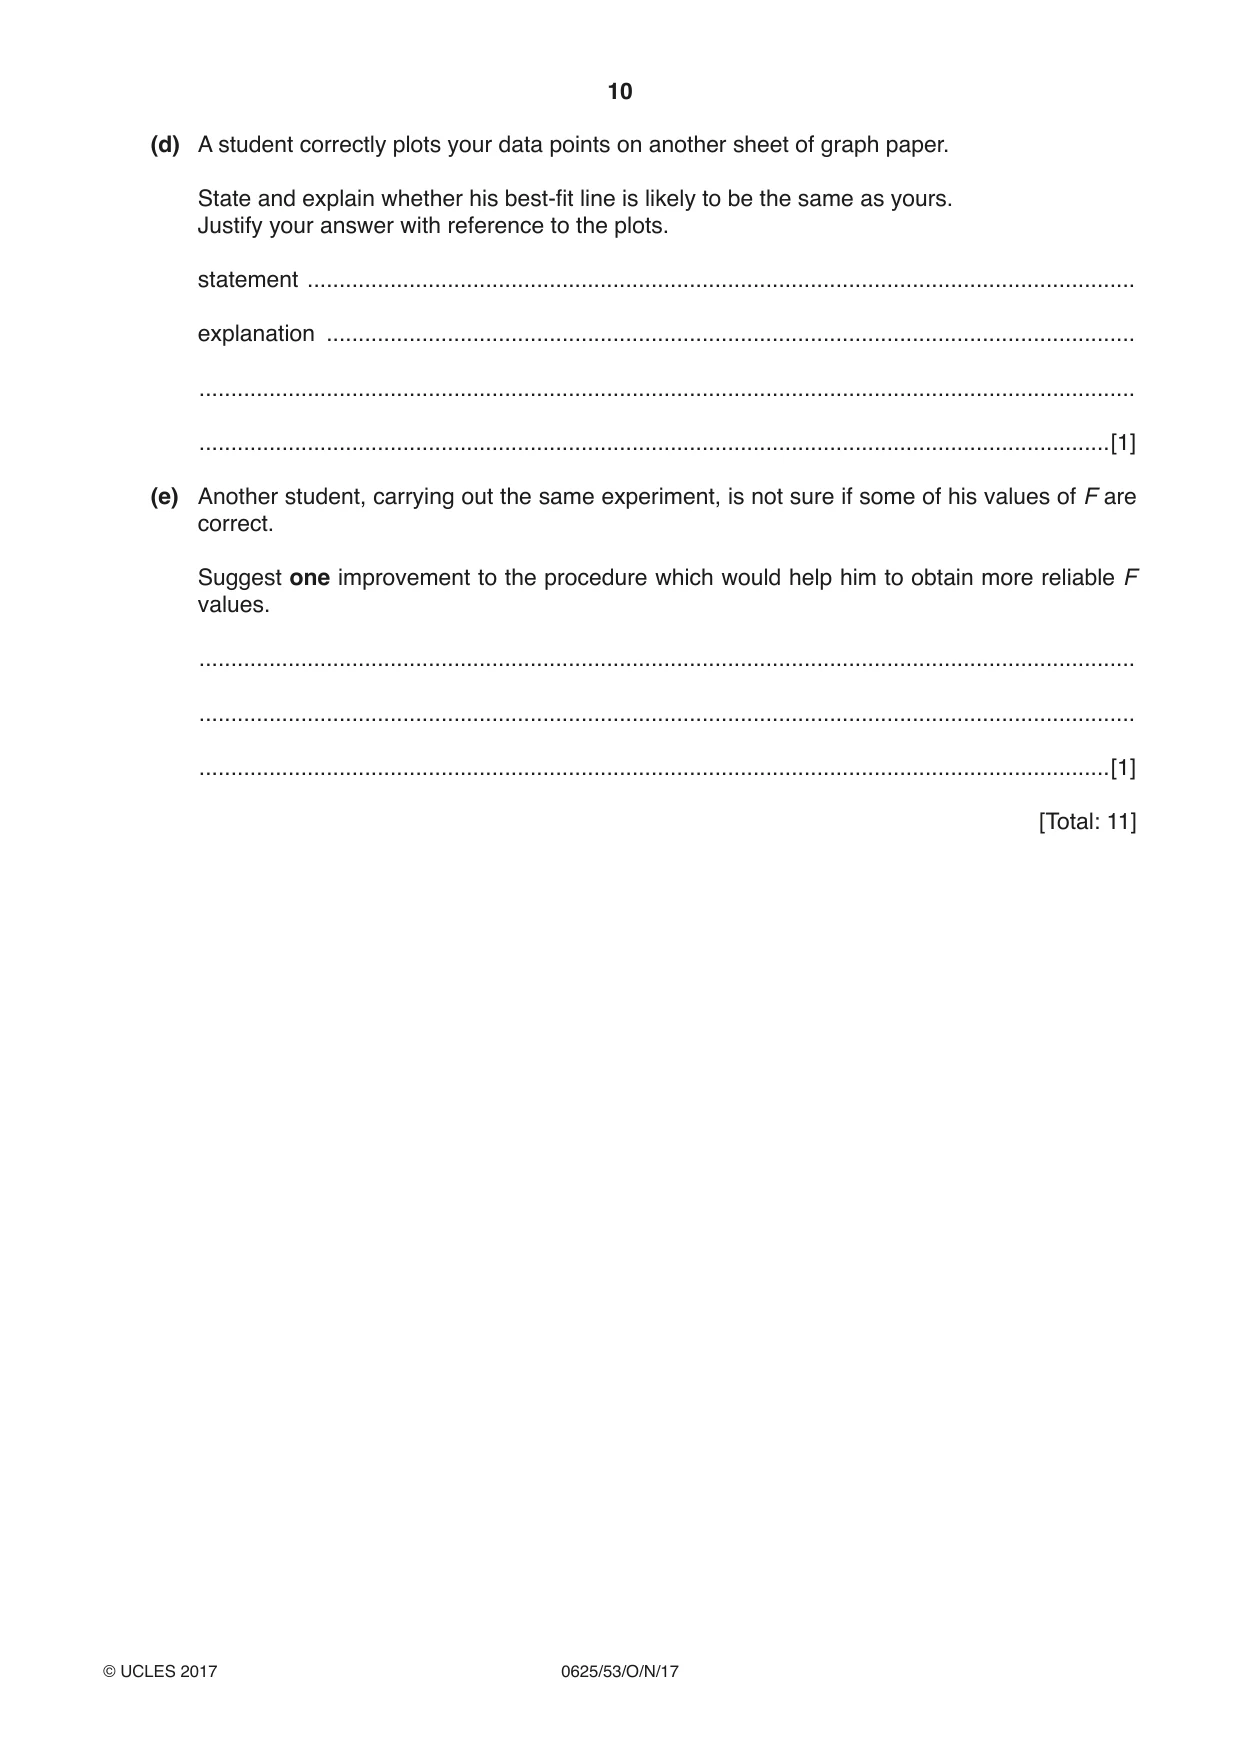
3 In this experiment, you will determine the weight of a metre rule. Carry out the following instructions, referring to Fig. 3.1. clamp forcemeter metre rule clamp 100.0 cm mark 0.0 cm mark d 100 g mass bench Fig. 3.1 (a) (i) • Move the 100 g mass to a distance d = 10.0 cm from the 0.0 cm end of the rule. • Adjust the height of the clamp holding the forcemeter so that the rule is horizontal. • Read, and record in Table 3.1, the forcemeter reading F. • Repeat this procedure for values of d = 30.0 cm, 50.0 cm, 70.0 cm and 90.0 cm. Table 3.1 d / cm F / N 10.0 30.0 50.0 70.0 90.0 [2] (ii) Explain how you made sure that the rule was horizontal before each reading. You may draw a diagram. ........................................................................................................................................... ........................................................................................................................................... .......................................................................................................................................[1] (b) Plot a graph of F / N (y-axis) against d / cm (x-axis). Start your axes from the origin (0,0). Draw a best-fit line. [4] (c) (i) From your graph, determine F0, the value of F when d = 0.0 cm. F0 ............................................................... (ii) Calculate the weight WR of the metre rule, using the equation WR = 2 × F0. Give WR to a suitable number of significant figures for this experiment. WR = ............................................................... [2] (d) A student correctly plots your data points on another sheet of graph paper. State and explain whether his best-fit line is likely to be the same as yours. Justify your answer with reference to the plots. statement .................................................................................................................................. explanation ............................................................................................................................... ................................................................................................................................................... ...............................................................................................................................................[1] (e) Another student, carrying out the same experiment, is not sure if some of his values of F are correct. Suggest one improvement to the procedure which would help him to obtain more reliable F values. ................................................................................................................................................... ................................................................................................................................................... ...............................................................................................................................................[1] [Total: 11]
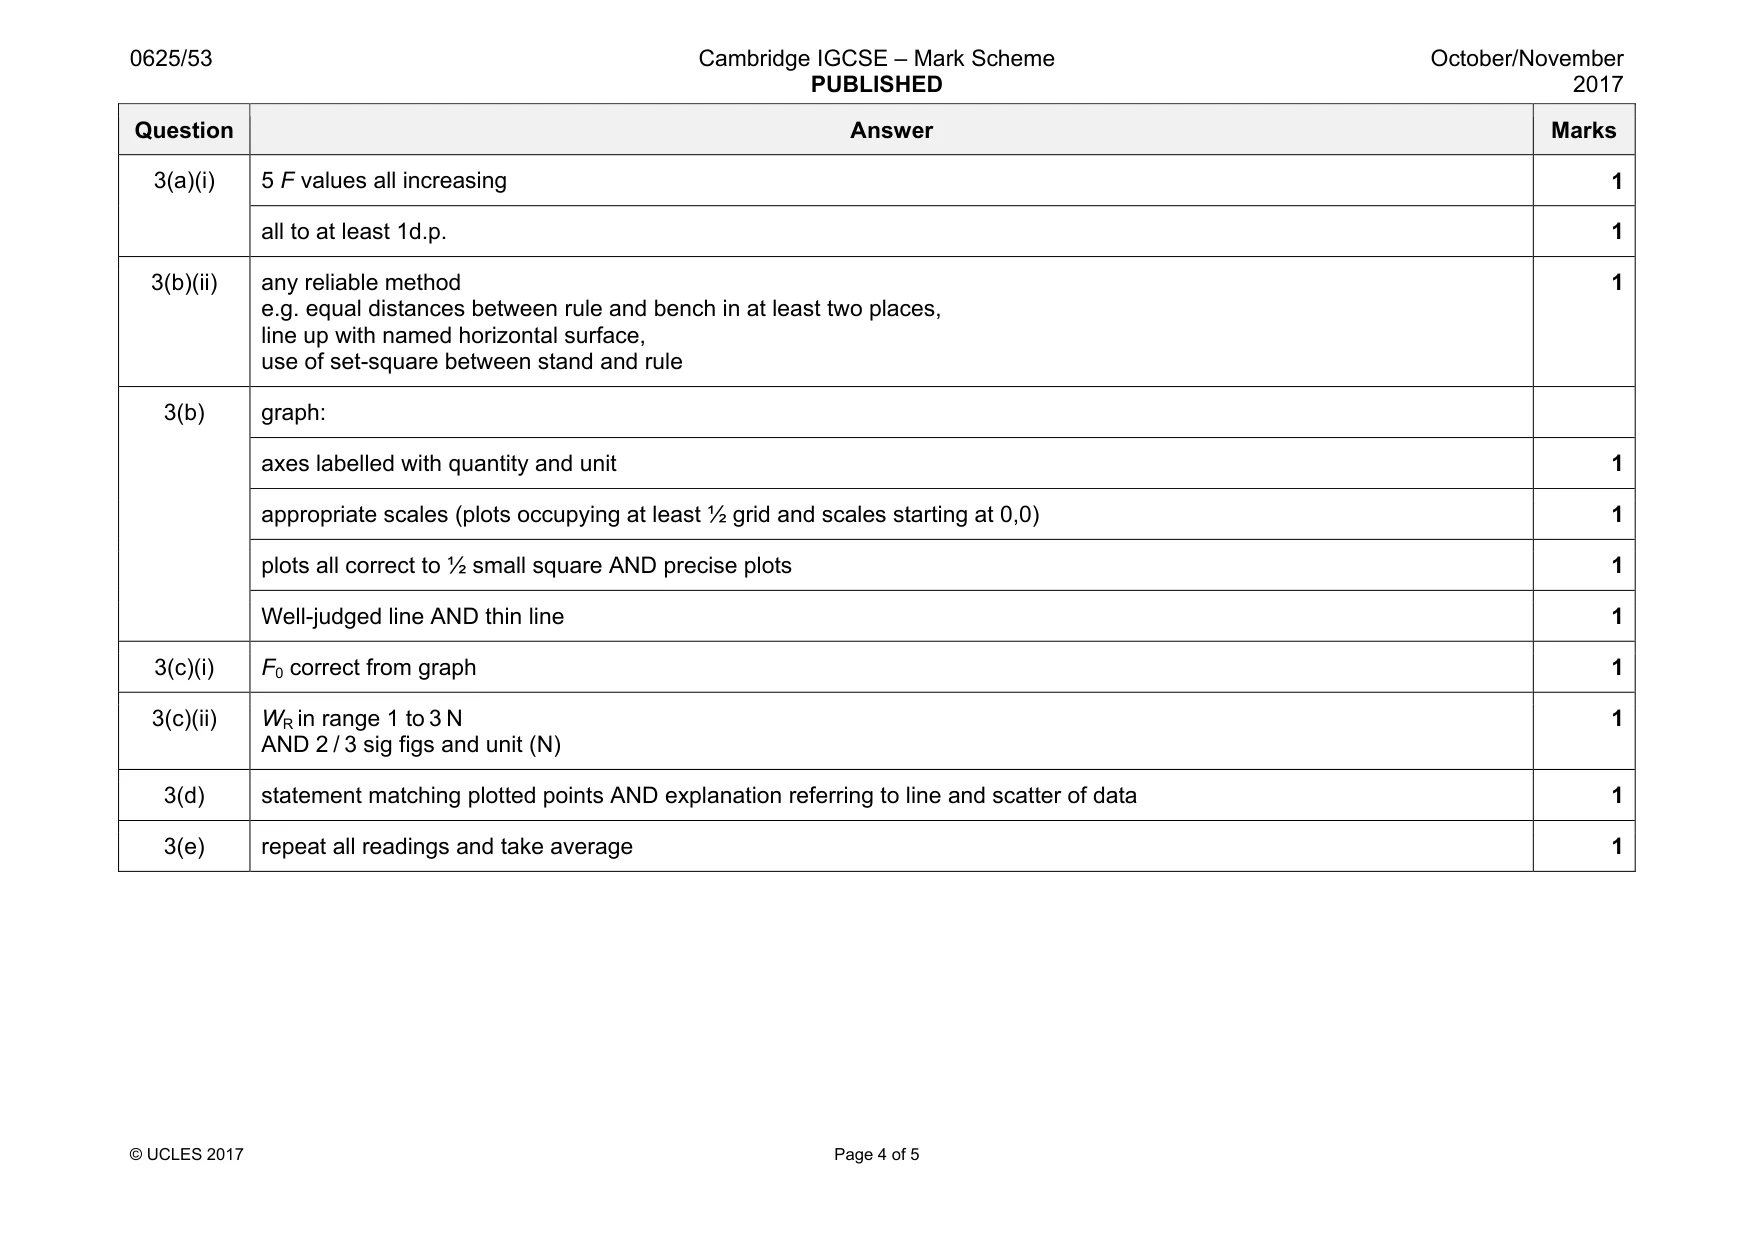
Mark scheme: 3(a)(i) 5 F values all increasing 1 all to at least 1d.p. 1 3(b)(ii) any reliable method e.g. equal distances between rule and bench in at least two places, line up with named horizontal surface, use of set-square between stand and rule 1 3(b) graph: axes labelled with quantity and unit 1 appropriate scales (plots occupying at least ½ grid and scales starting at 0,0) 1 plots all correct to ½ small square AND precise plots 1 Well-judged line AND thin line 1 3(c)(i) F0 correct from graph 1 3(c)(ii) WR in range 1 to 3 N AND 2 / 3 sig figs and unit (N) 1 3(d) statement matching plotted points AND explanation referring to line and scatter of data 1 3(e) repeat all readings and take average 1
Q4 · A student has a box of converging lenses, but does not know their focal lengths
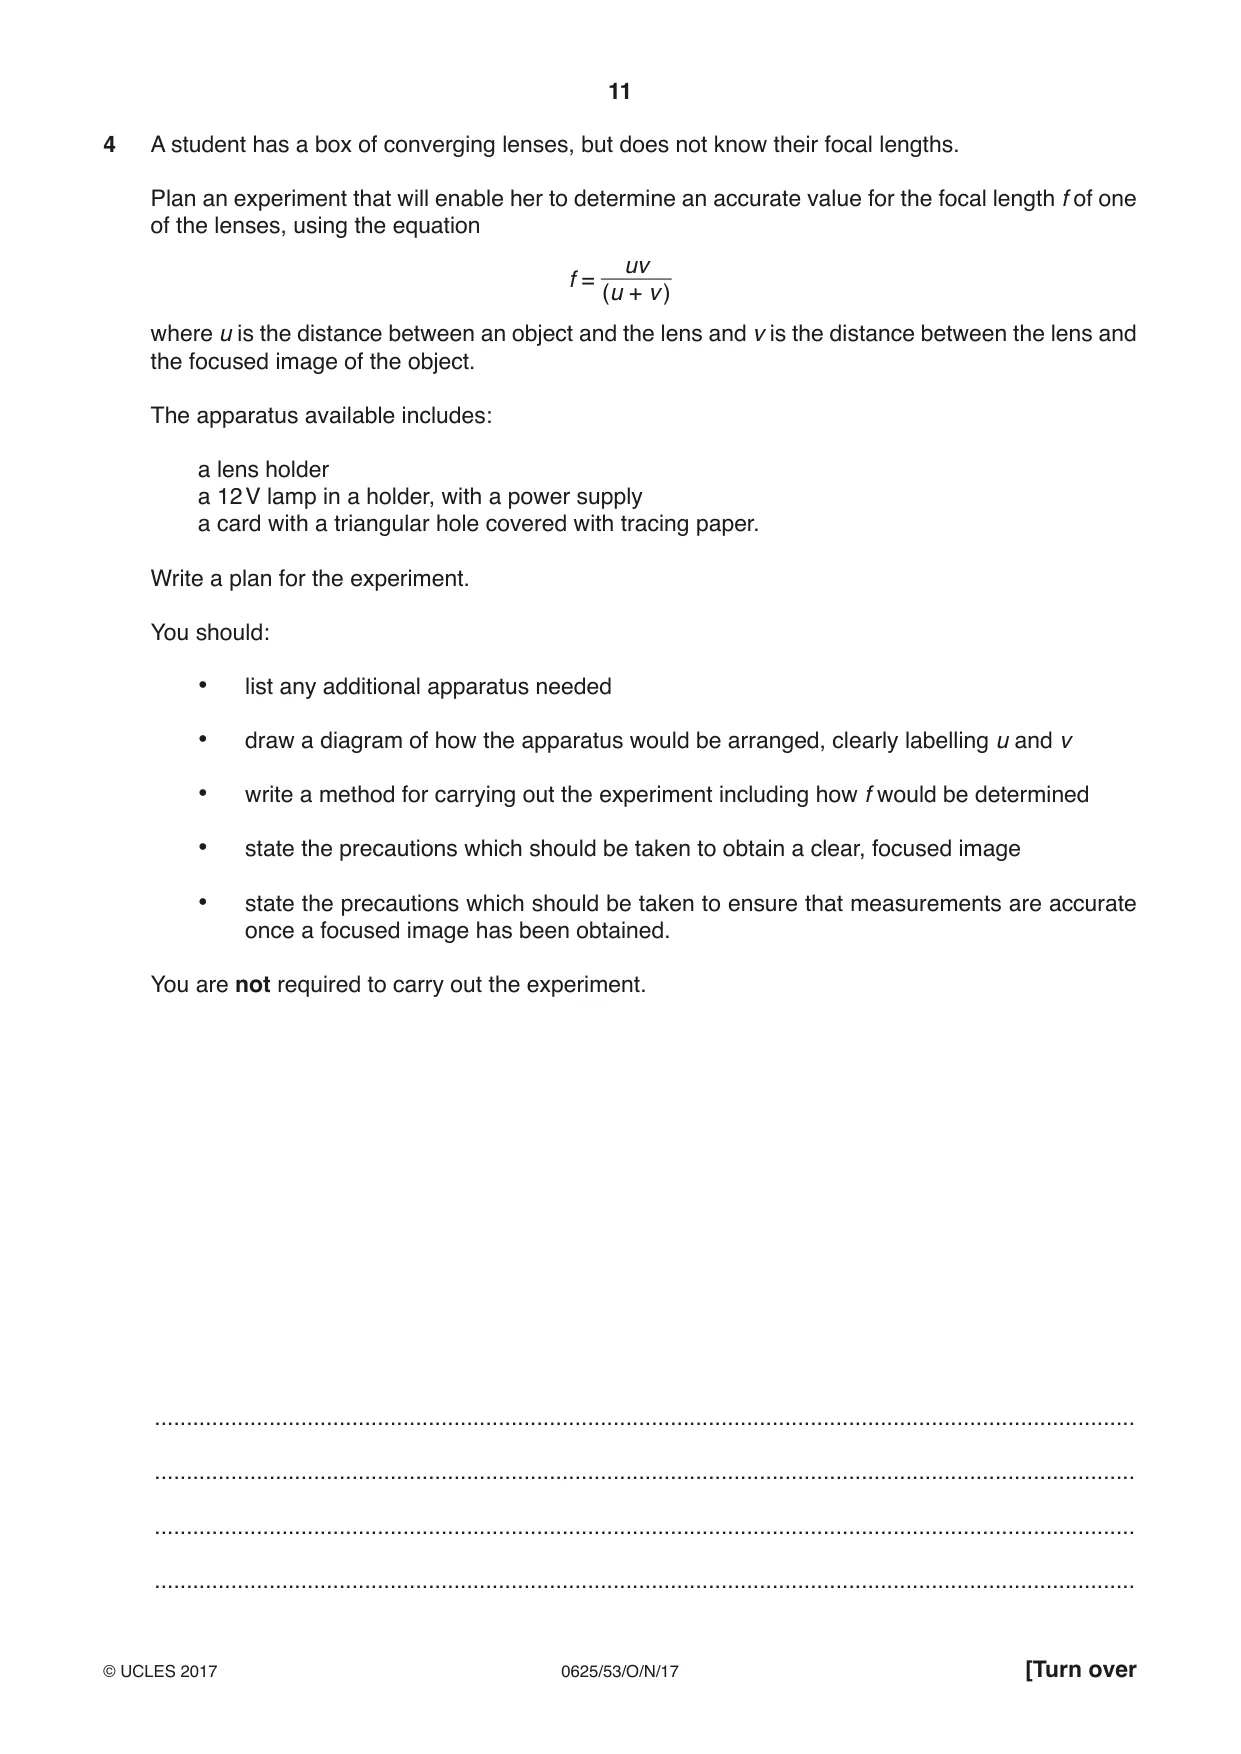
4 A student has a box of converging lenses, but does not know their focal lengths. Plan an experiment that will enable her to determine an accurate value for the focal length f of one of the lenses, using the equation uv f = (u + v ) where u is the distance between an object and the lens and v is the distance between the lens and the focused image of the object. The apparatus available includes: a lens holder a 12 V lamp in a holder, with a power supply a card with a triangular hole covered with tracing paper. Write a plan for the experiment. You should: • list any additional apparatus needed • draw a diagram of how the apparatus would be arranged, clearly labelling u and v • write a method for carrying out the experiment including how f would be determined • state the precautions which should be taken to obtain a clear, focused image • state the precautions which should be taken to ensure that measurements are accurate once a focused image has been obtained. You are not required to carry out the experiment. .......................................................................................................................................................... .......................................................................................................................................................... .......................................................................................................................................................... .......................................................................................................................................................... .......................................................................................................................................................... .......................................................................................................................................................... .......................................................................................................................................................... .......................................................................................................................................................... .......................................................................................................................................................... .......................................................................................................................................................... .......................................................................................................................................................... .......................................................................................................................................................... .......................................................................................................................................................... .......................................................................................................................................................... .......................................................................................................................................................... .......................................................................................................................................................... .......................................................................................................................................................... .......................................................................................................................................................... .......................................................................................................................................................... .......................................................................................................................................................... .......................................................................................................................................................... ......................................................................................................................................................[7] [Total: 7]
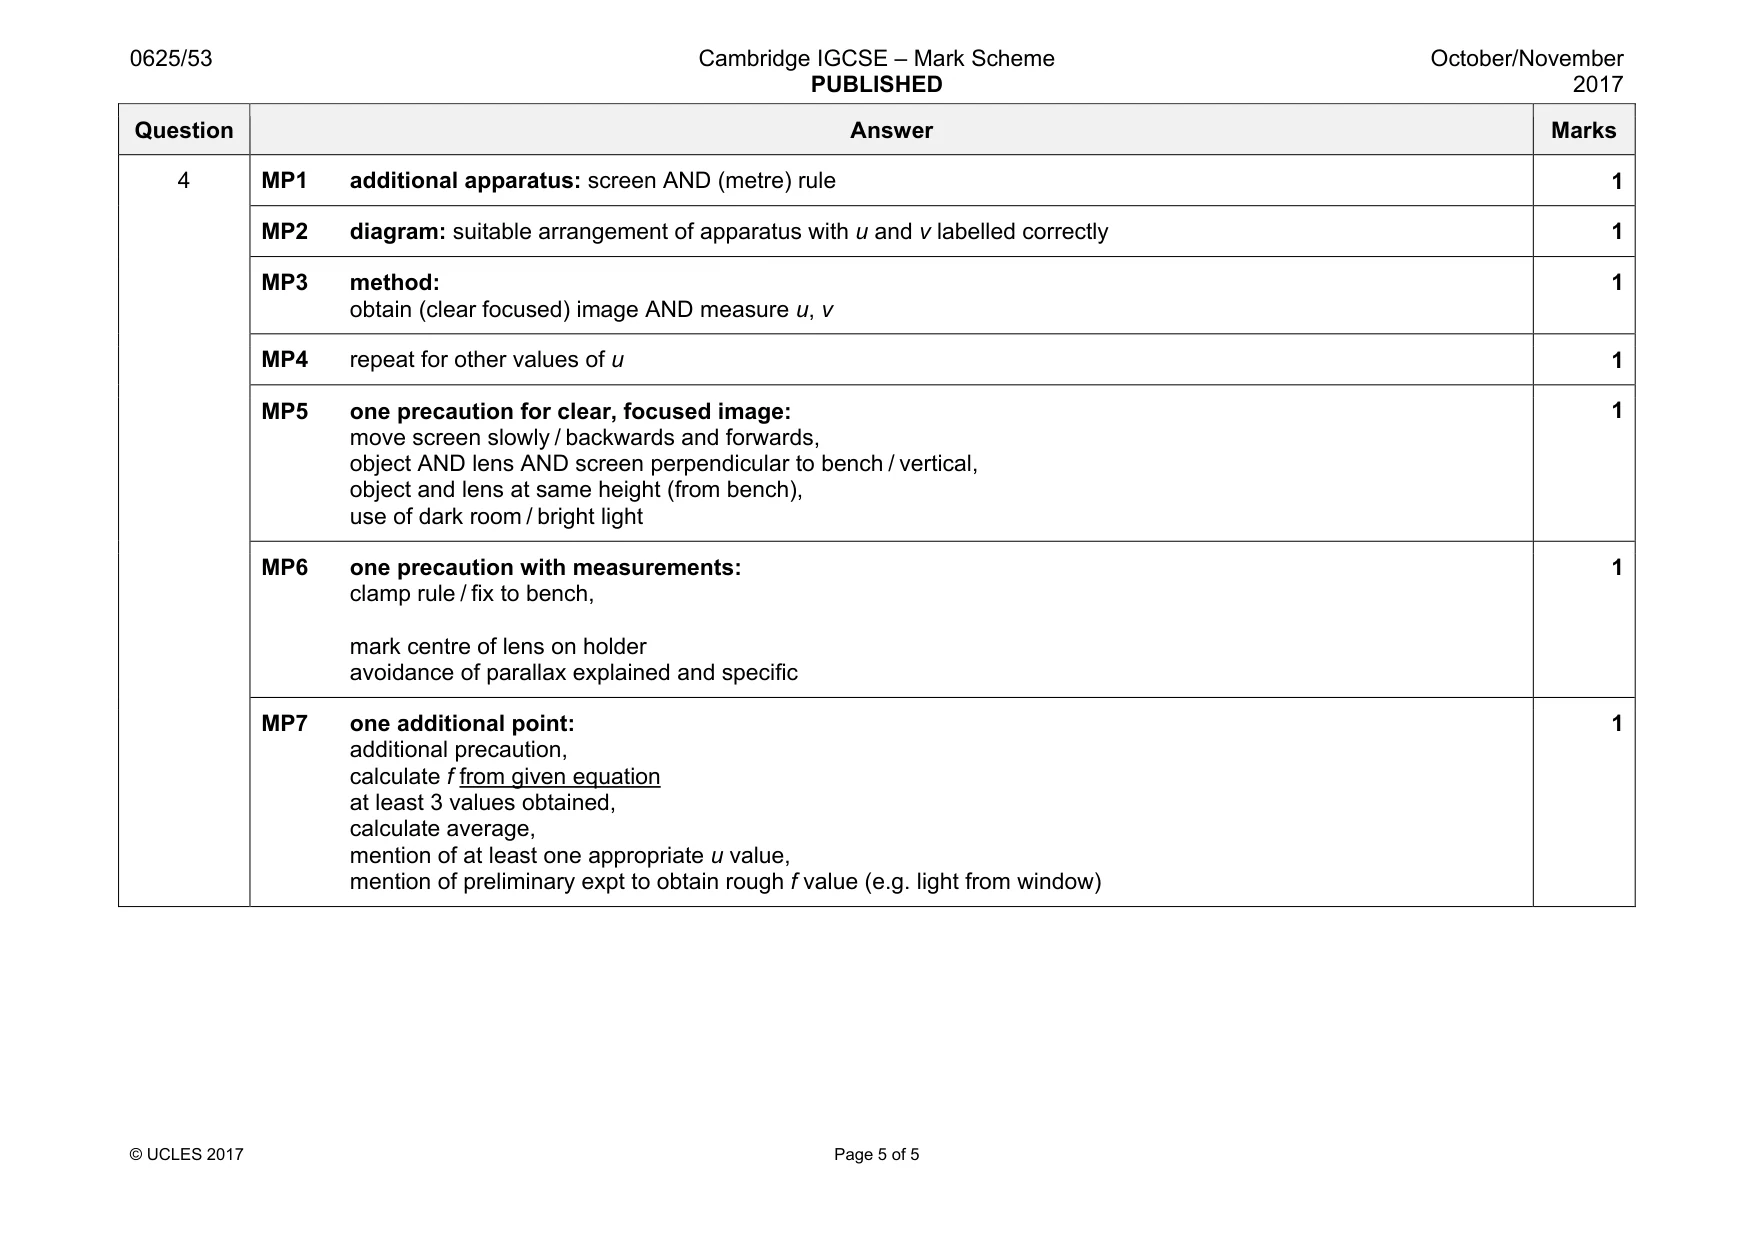
Mark scheme: 4 MP1 additional apparatus: screen AND (metre) rule 1 MP2 diagram: suitable arrangement of apparatus with u and v labelled correctly 1 MP3 method: obtain (clear focused) image AND measure u, v 1 MP4 repeat for other values of u 1 MP5 one precaution for clear, focused image: move screen slowly / backwards and forwards, object AND lens AND screen perpendicular to bench / vertical, object and lens at same height (from bench), use of dark room / bright light 1 MP6 one precaution with measurements: clamp rule / fix to bench, mark centre of lens on holder avoidance of parallax explained and specific 1 MP7 one additional point: additional precaution, calculate f from given equation at least 3 values obtained, calculate average, mention of at least one appropriate u value, mention of preliminary expt to obtain rough f value (e.g. light from window) 1
What was in this paper
The subtopics covered by these 4 questions, and how many questions each got. Open one in a new tab to see every Cambridge question on it.
What you needed in this session
Cambridge’s own grade thresholds for 2017 Oct/Nov, Paper 5 · Variant 3. A higher threshold means an easier paper — the bar moves with how the cohort did.