Cambridge IGCSE Physics 0625 — 2017 Oct/Nov Paper 5 · Variant 1
0625/51/O/N/17 · 4 questions · 40 marks · ≈45 min
The question paper and its mark scheme, free to read here and free to download. This is Cambridge’s own paper, exactly as it was sat.
Question paper12 pages

Mark scheme5 pages
Answers below. Sit the paper first if you are practising.
Questions as text
Q1 · In this experiment, you will determine the weight of a load using a balancing method
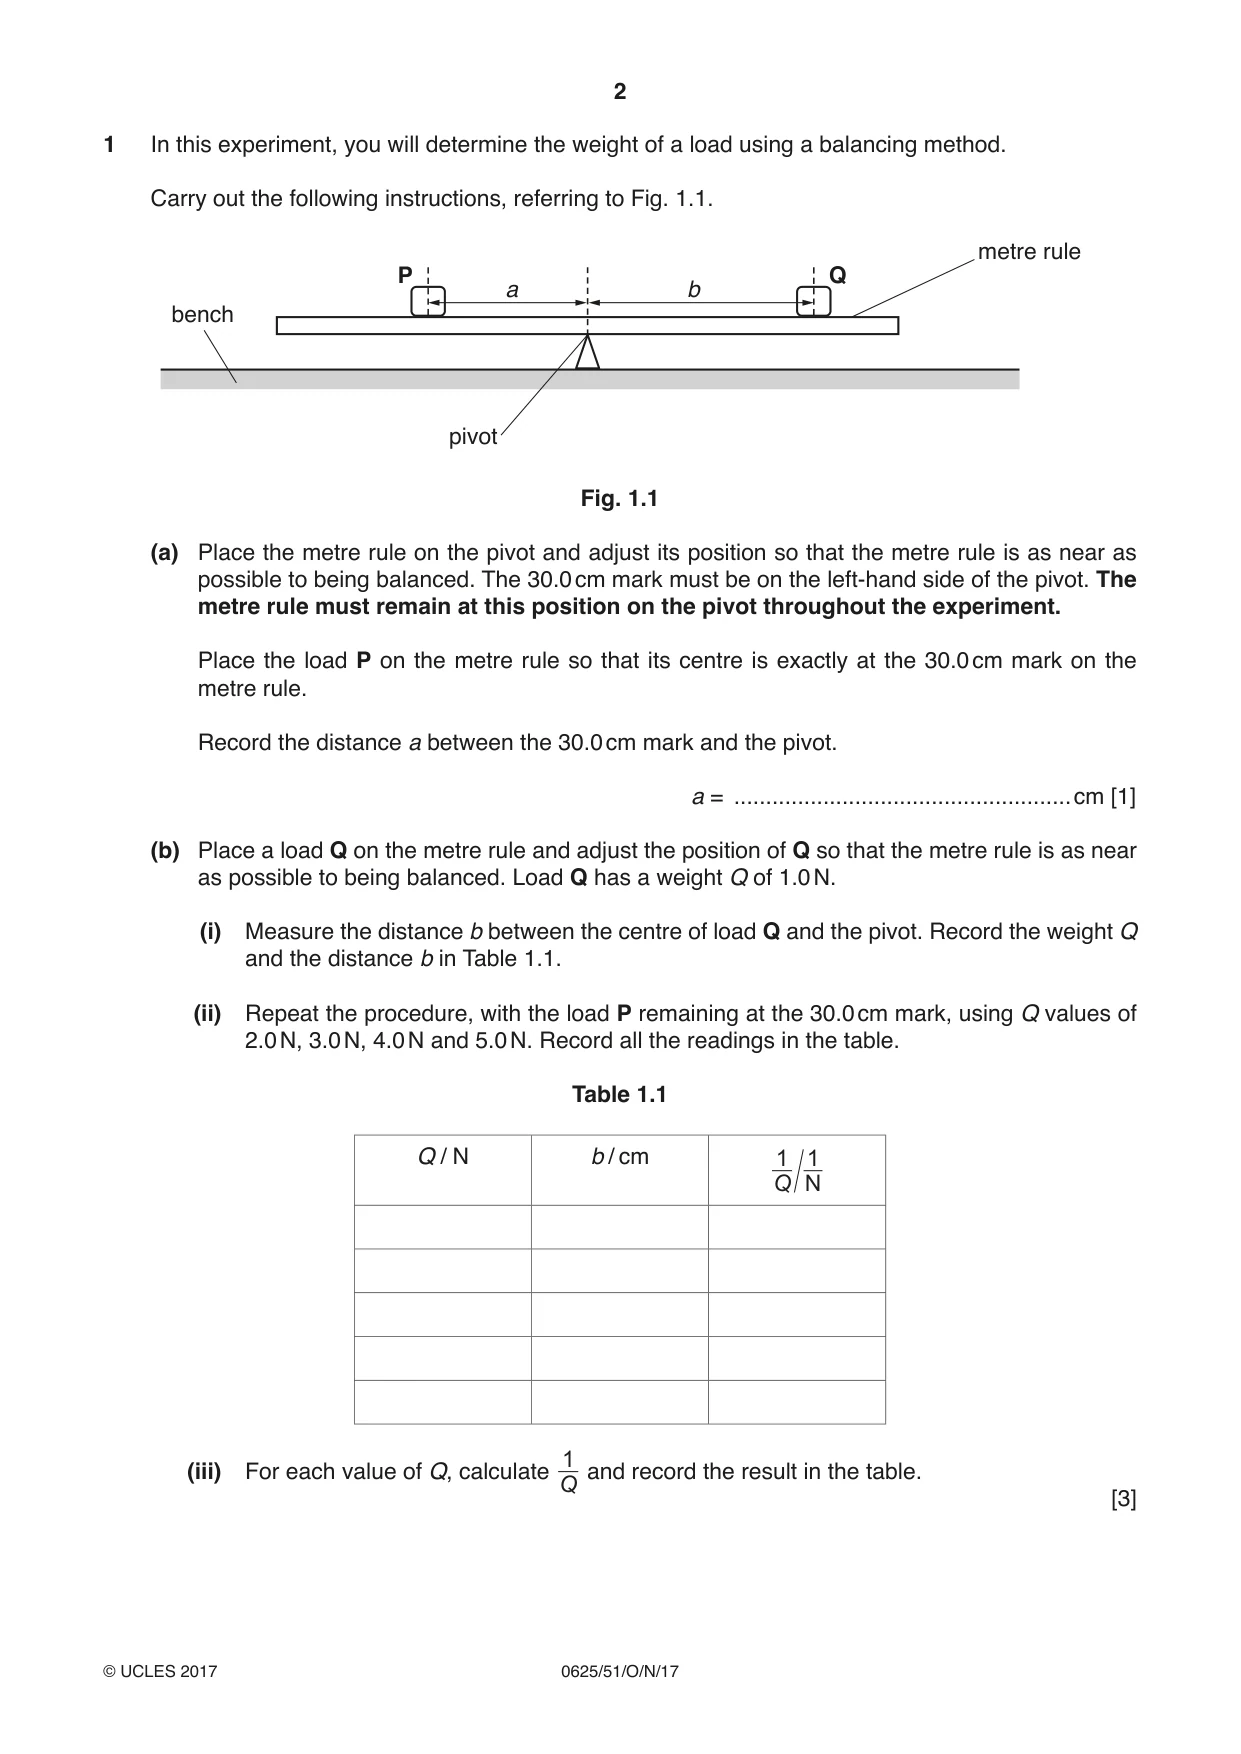
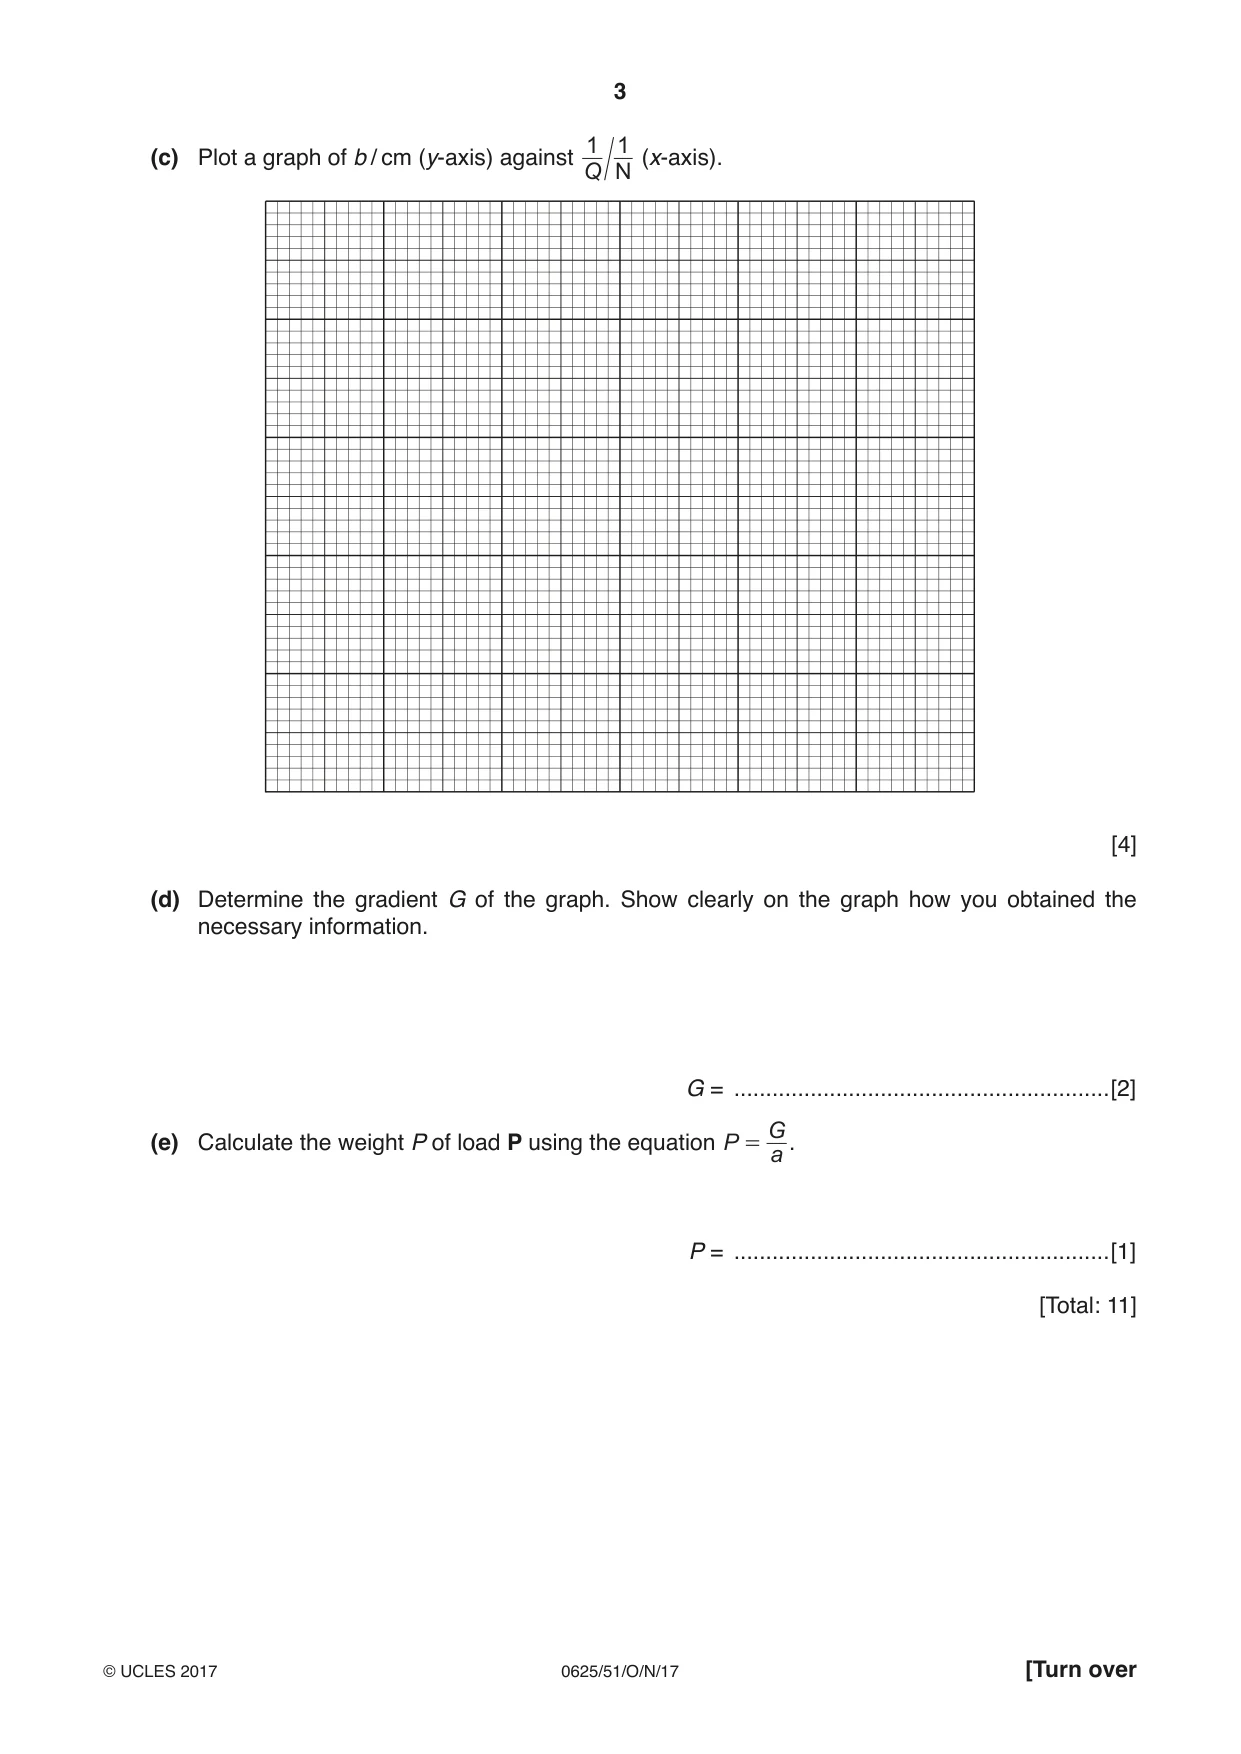
1 In this experiment, you will determine the weight of a load using a balancing method. Carry out the following instructions, referring to Fig. 1.1. metre rule P Q a b bench pivot Fig. 1.1 (a) Place the metre rule on the pivot and adjust its position so that the metre rule is as near as possible to being balanced. The 30.0 cm mark must be on the left-hand side of the pivot. The metre rule must remain at this position on the pivot throughout the experiment. Place the load P on the metre rule so that its centre is exactly at the 30.0 cm mark on the metre rule. Record the distance a between the 30.0 cm mark and the pivot. a = .....................................................cm [1] (b) Place a load Q on the metre rule and adjust the position of Q so that the metre rule is as near as possible to being balanced. Load Q has a weight Q of 1.0 N. (i) Measure the distance b between the centre of load Q and the pivot. Record the weight Q and the distance b in Table 1.1. (ii) Repeat the procedure, with the load P remaining at the 30.0 cm mark, using Q values of 2.0 N, 3.0 N, 4.0 N and 5.0 N. Record all the readings in the table. Table 1.1 Q / N b / cm 1 1 Q N 1 (iii) For each value of Q, calculate and record the result in the table. Q [3] 1 1(c) Plot a graph of b / cm (y-axis) against (x-axis). Q N [4] (d) Determine the gradient G of the graph. Show clearly on the graph how you obtained the necessary information. G = ...........................................................[2] G = .(e) Calculate the weight P of load P using the equation P a P = ...........................................................[1] [Total: 11]
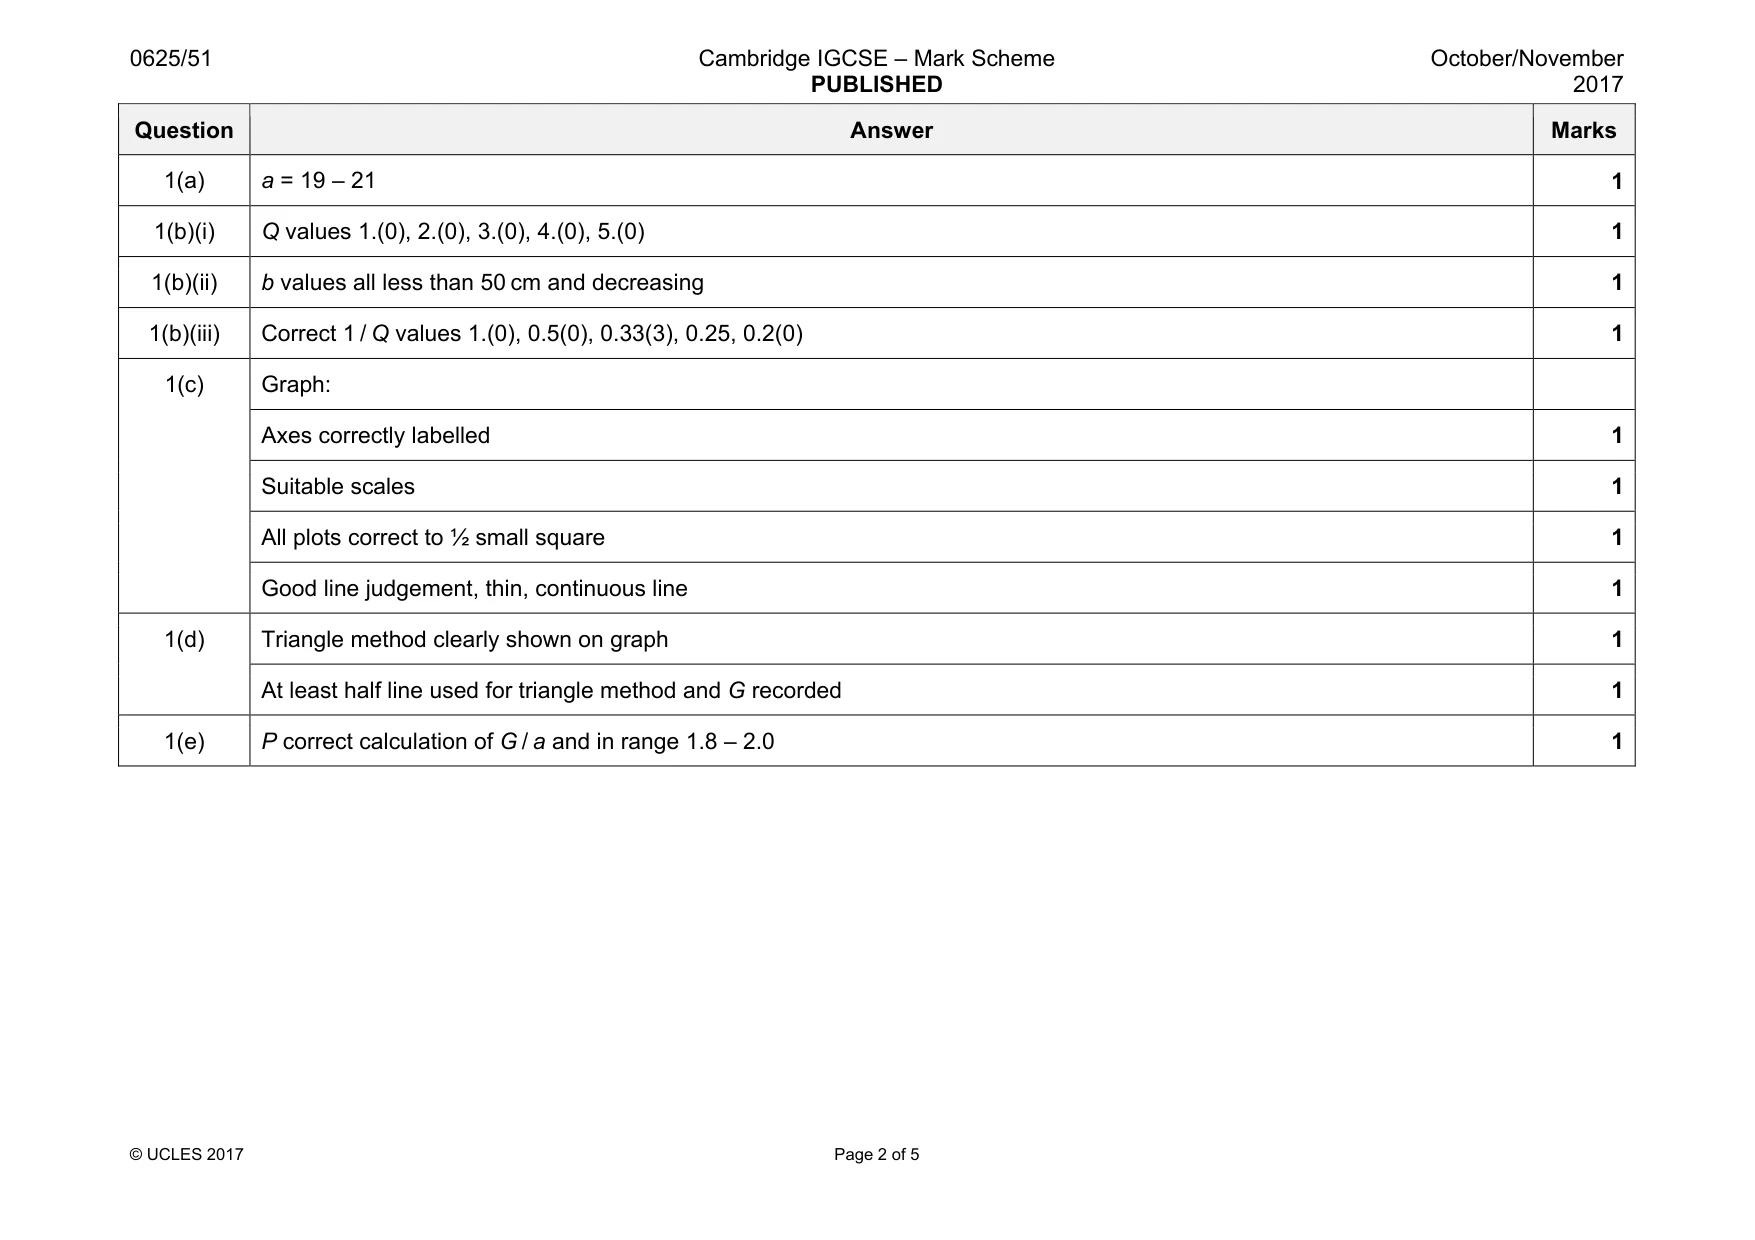
Mark scheme: 1(a) a = 19 – 21 1 1(b)(i) Q values 1.(0), 2.(0), 3.(0), 4.(0), 5.(0) 1 1(b)(ii) b values all less than 50 cm and decreasing 1 1(b)(iii) Correct 1 / Q values 1.(0), 0.5(0), 0.33(3), 0.25, 0.2(0) 1 1(c) Graph: Axes correctly labelled 1 Suitable scales 1 All plots correct to ½ small square 1 Good line judgement, thin, continuous line 1 1(d) Triangle method clearly shown on graph 1 At least half line used for triangle method and G recorded 1 1(e) P correct calculation of G / a and in range 1.8 – 2.0 1
Q2 · In this experiment, you will investigate resistance
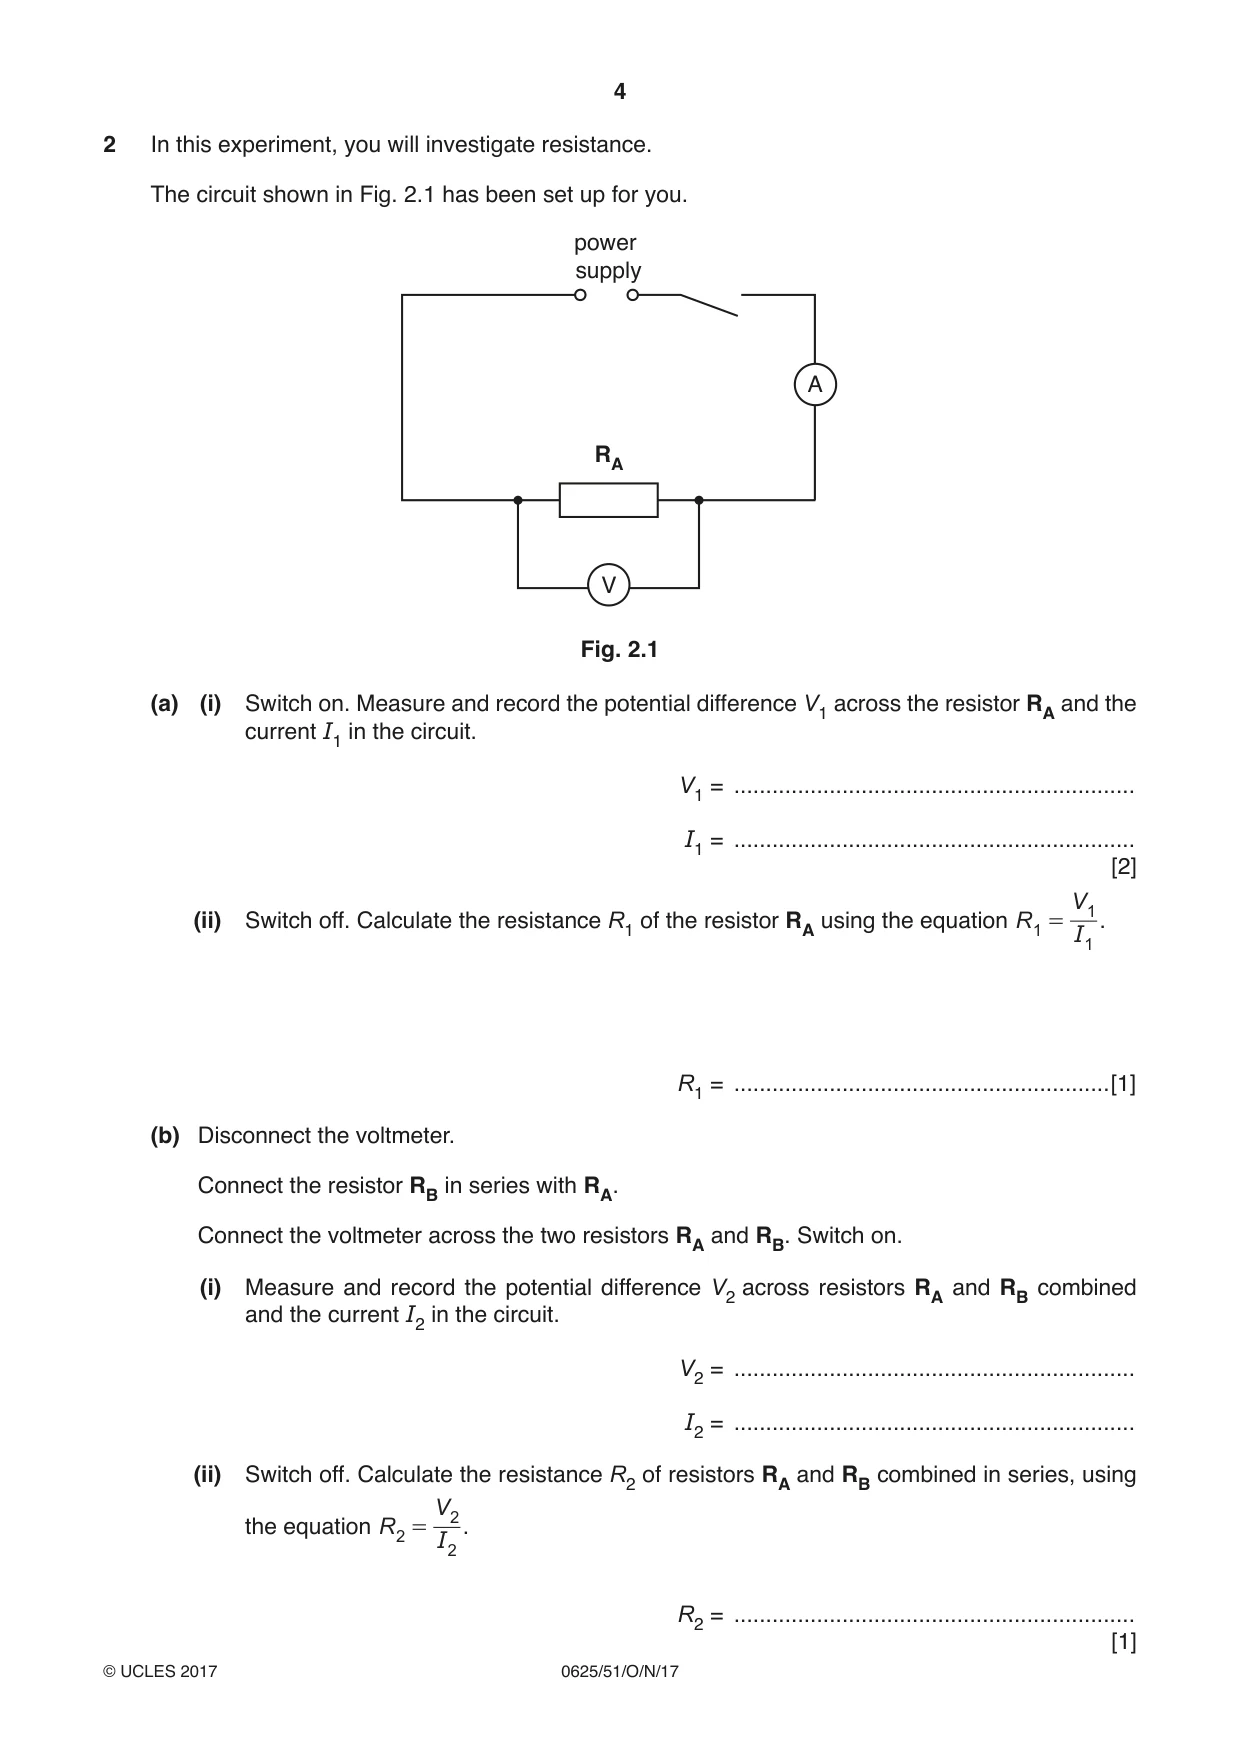
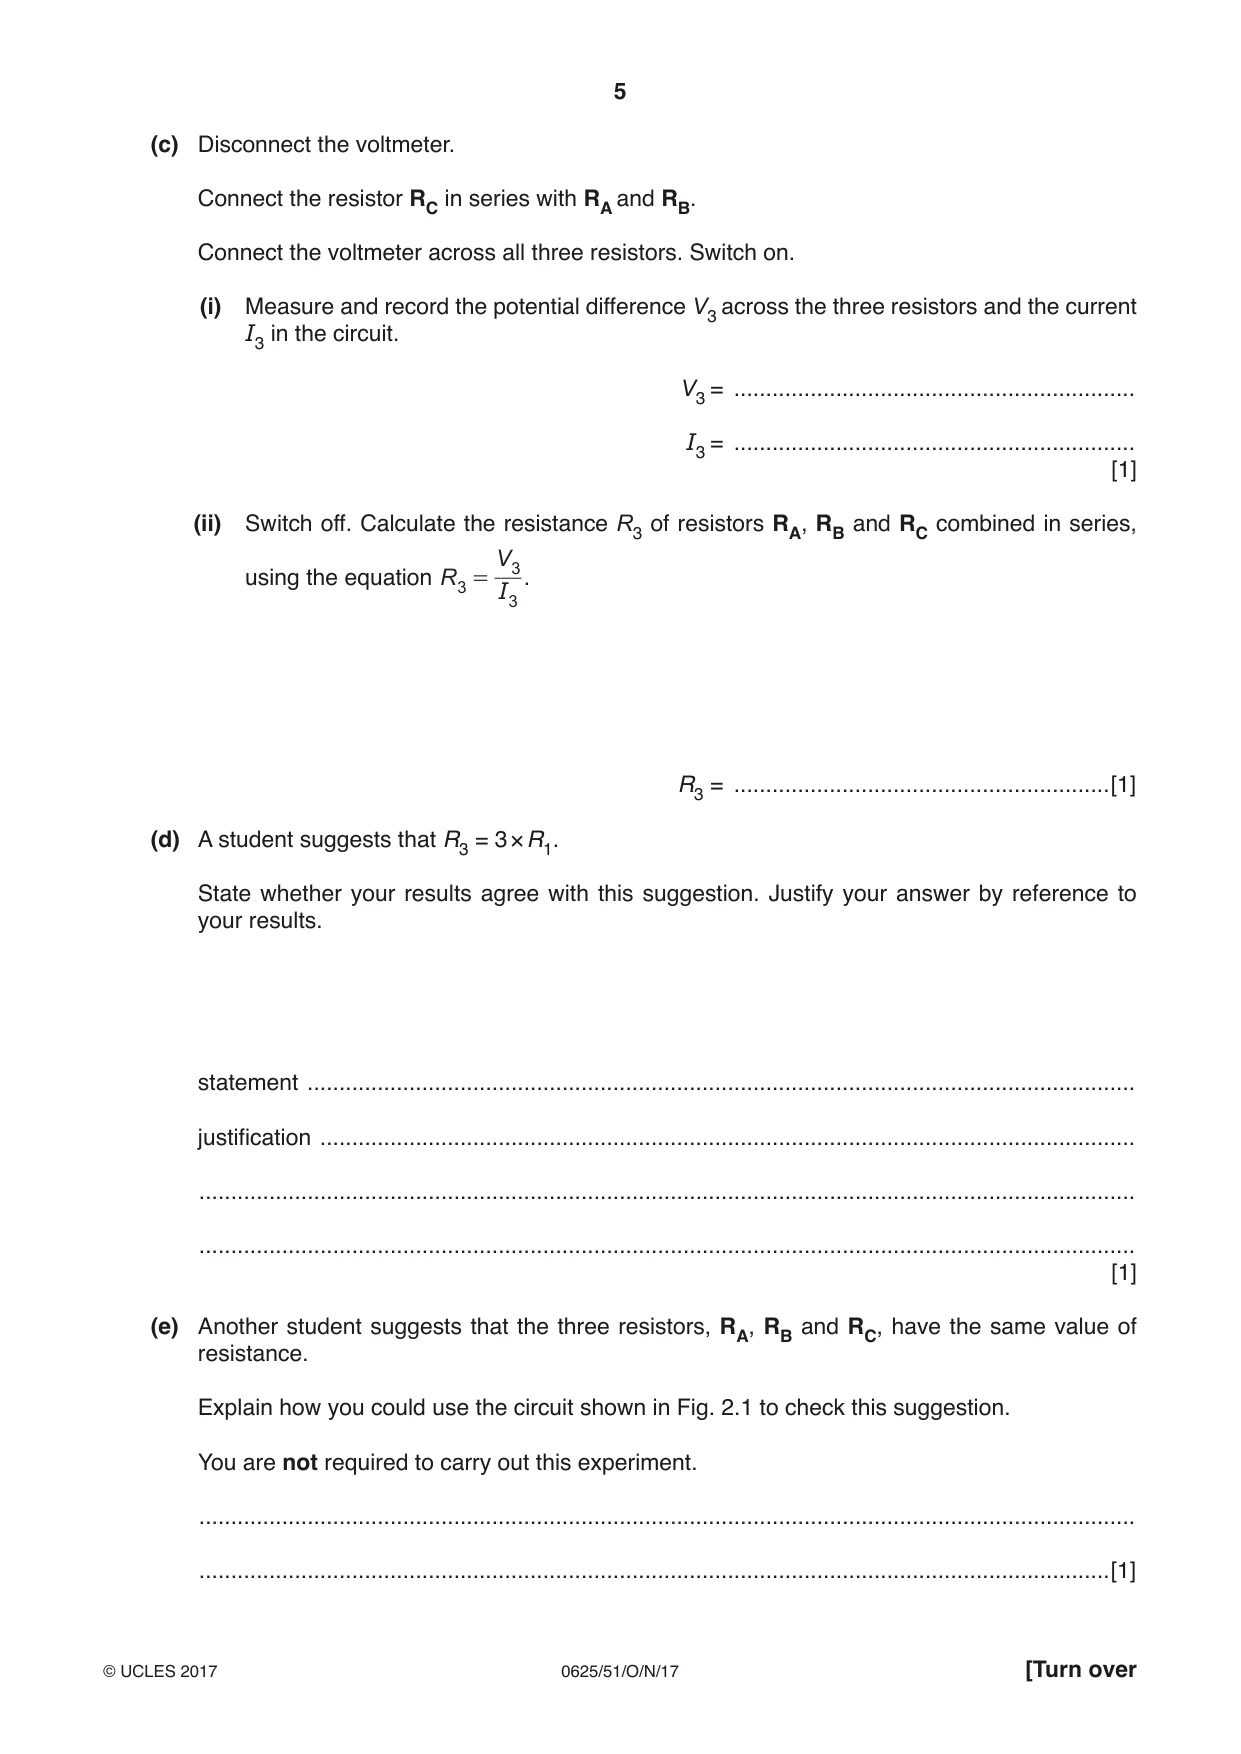
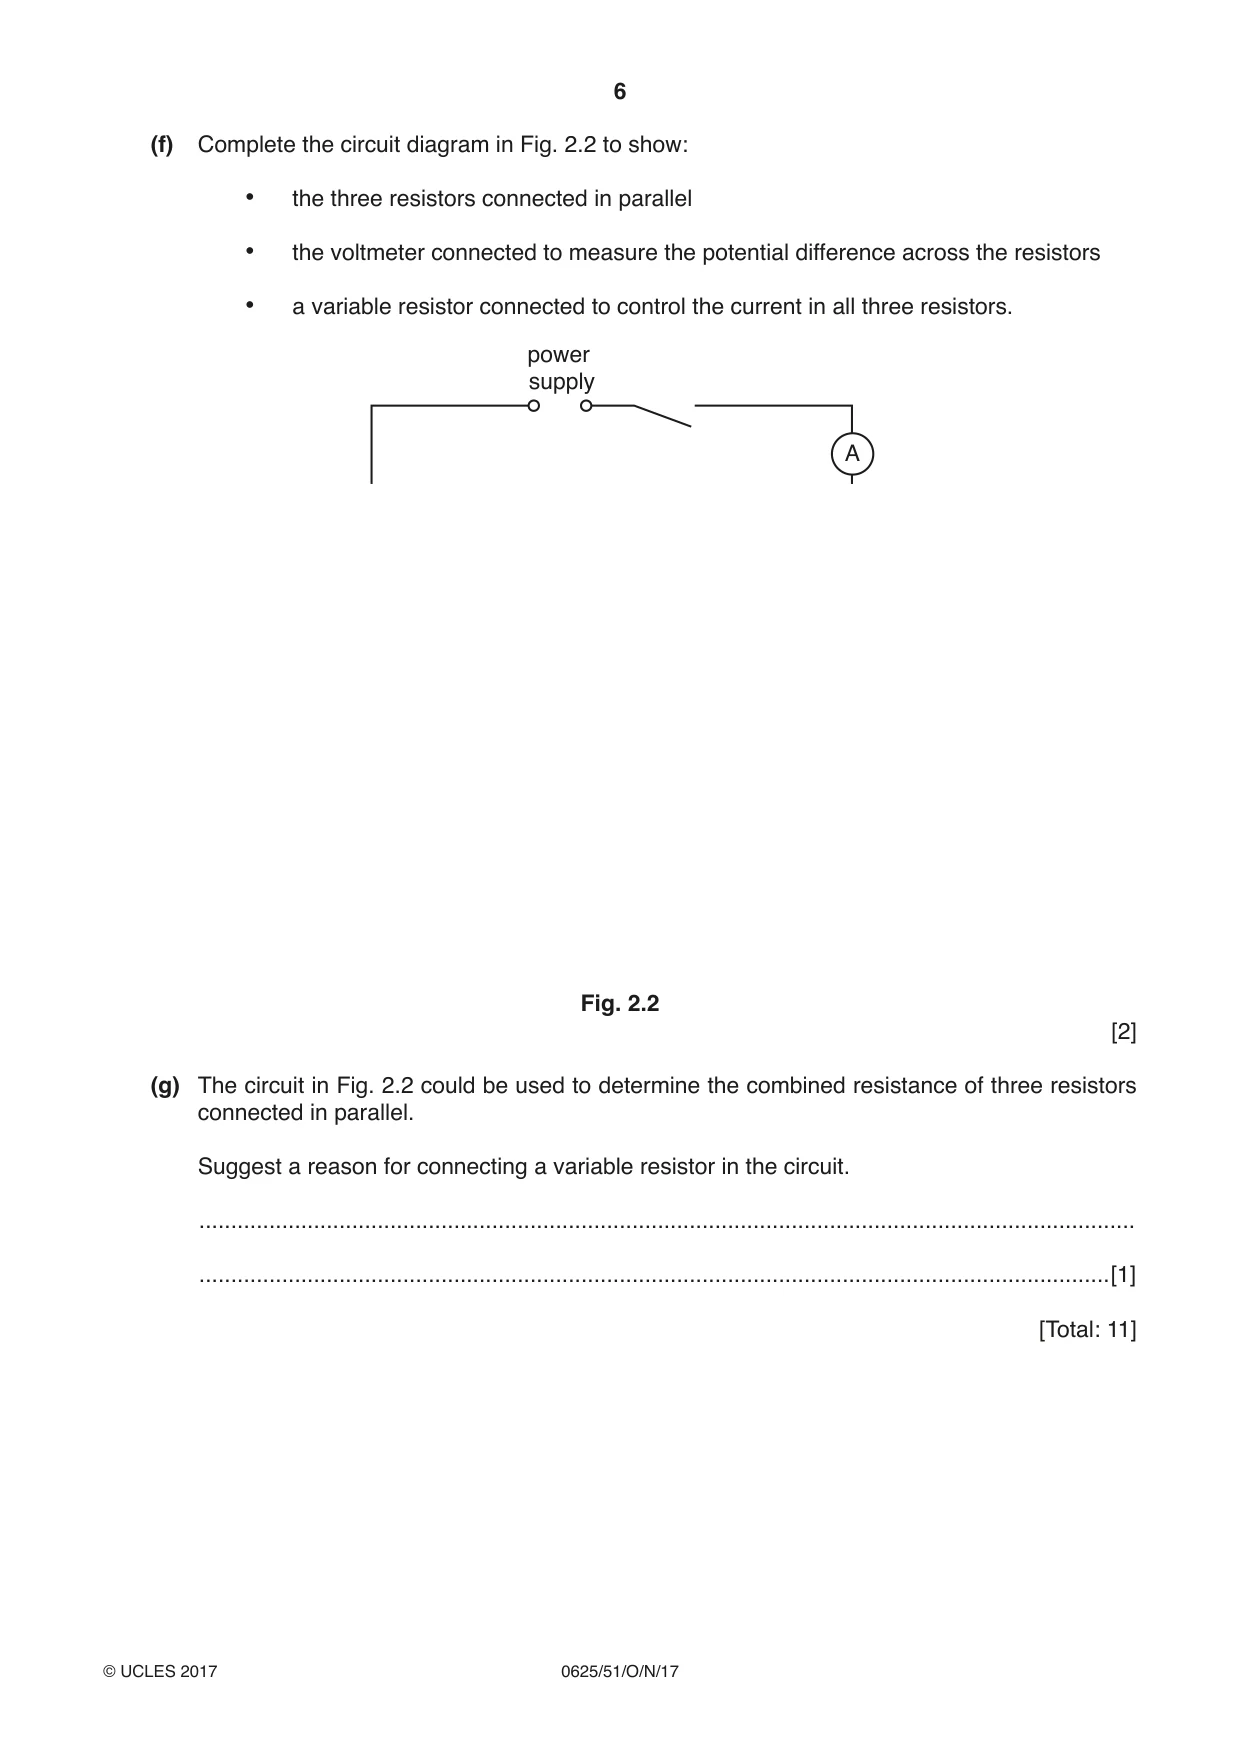
2 In this experiment, you will investigate resistance. The circuit shown in Fig. 2.1 has been set up for you. power supply A RA V Fig. 2.1 (a) (i) Switch on. Measure and record the potential difference V1 across the resistor RA and the current I1 in the circuit. V1 = ............................................................... I1 = ............................................................... [2] V 1 = . (ii) Switch off. Calculate the resistance R1 of the resistor RA using the equation R 1 I 1 R1 = ...........................................................[1] (b) Disconnect the voltmeter. Connect the resistor RB in series with RA. Connect the voltmeter across the two resistors RA and RB. Switch on. (i) Measure and record the potential difference V2 across resistors RA and RB combined and the current I2 in the circuit. V2 = ............................................................... I2 = ............................................................... (ii) Switch off. Calculate the resistance R2 of resistors RA and RB combined in series, using V 2 = . the equation R 2 I 2 R2 = ............................................................... [1] (c) Disconnect the voltmeter. Connect the resistor RC in series with RA and RB. Connect the voltmeter across all three resistors. Switch on. (i) Measure and record the potential difference V3 across the three resistors and the current I3 in the circuit. V3 = ............................................................... I3 = ............................................................... [1] (ii) Switch off. Calculate the resistance R3 of resistors RA, RB and RC combined in series, V 3 = . using the equation R 3 I 3 R3 = ...........................................................[1] (d) A student suggests that R3 = 3 × R1. State whether your results agree with this suggestion. Justify your answer by reference to your results. statement .................................................................................................................................. justification ................................................................................................................................ ................................................................................................................................................... ................................................................................................................................................... [1] (e) Another student suggests that the three resistors, RA, RB and RC, have the same value of resistance. Explain how you could use the circuit shown in Fig. 2.1 to check this suggestion. You are not required to carry out this experiment. ................................................................................................................................................... ...............................................................................................................................................[1] (f) Complete the circuit diagram in Fig. 2.2 to show: • the three resistors connected in parallel • the voltmeter connected to measure the potential difference across the resistors • a variable resistor connected to control the current in all three resistors. power supply A Fig. 2.2 [2] (g) The circuit in Fig. 2.2 could be used to determine the combined resistance of three resistors connected in parallel. Suggest a reason for connecting a variable resistor in the circuit. ................................................................................................................................................... ...............................................................................................................................................[1] [Total: 11]
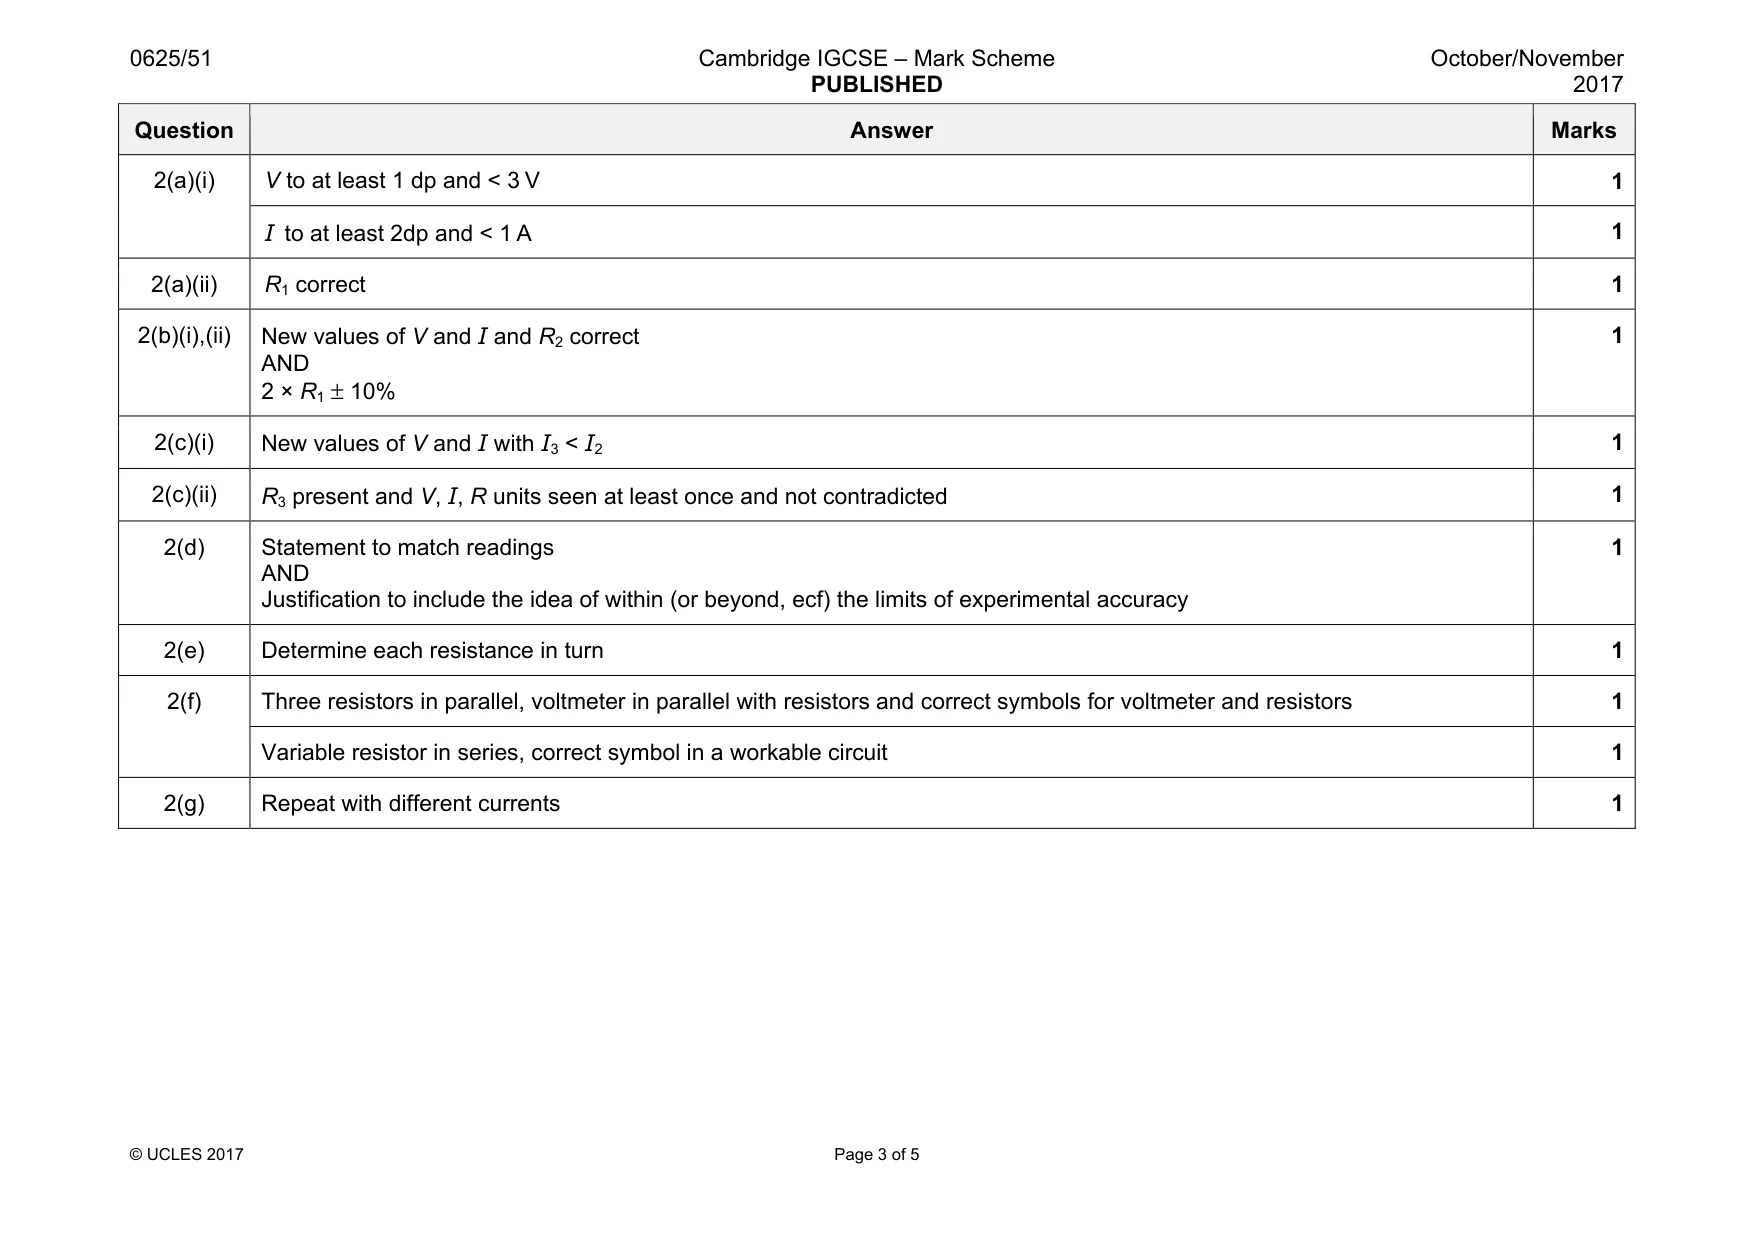
Mark scheme: 2(a)(i) V to at least 1 dp and < 3 V 1 I to at least 2dp and < 1 A 1 2(a)(ii) R1 correct 1 2(b)(i),(ii) New values of V and I and R2 correct AND 2 × R1 ± 10% 1 2(c)(i) New values of V and I with I3 < I2 1 2(c)(ii) R3 present and V, I, R units seen at least once and not contradicted 1 2(d) Statement to match readings AND Justification to include the idea of within (or beyond, ecf) the limits of experimental accuracy 1 2(e) Determine each resistance in turn 1 2(f) Three resistors in parallel, voltmeter in parallel with resistors and correct symbols for voltmeter and resistors 1 Variable resistor in series, correct symbol in a workable circuit 1 2(g) Repeat with different currents 1
Q3 · In this experiment, you will determine the focal length f of a lens
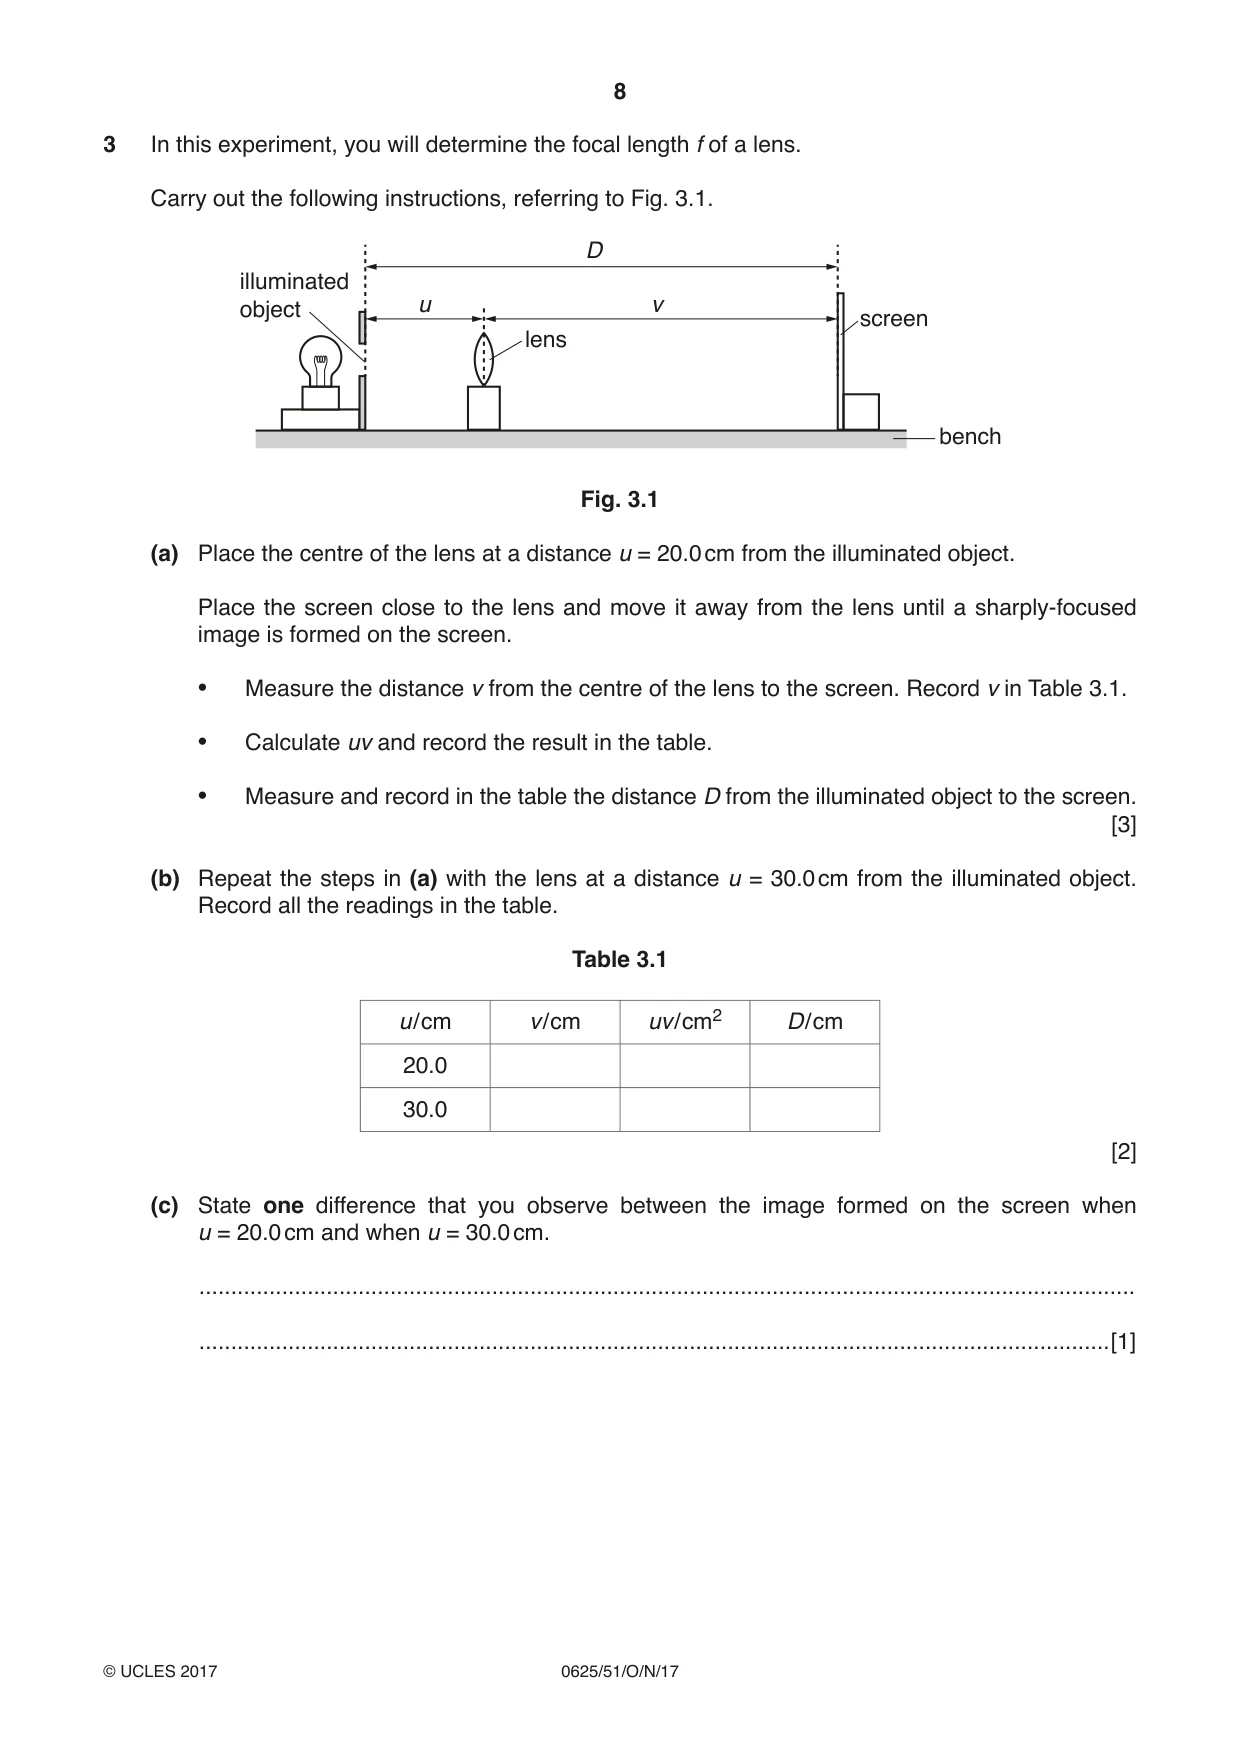
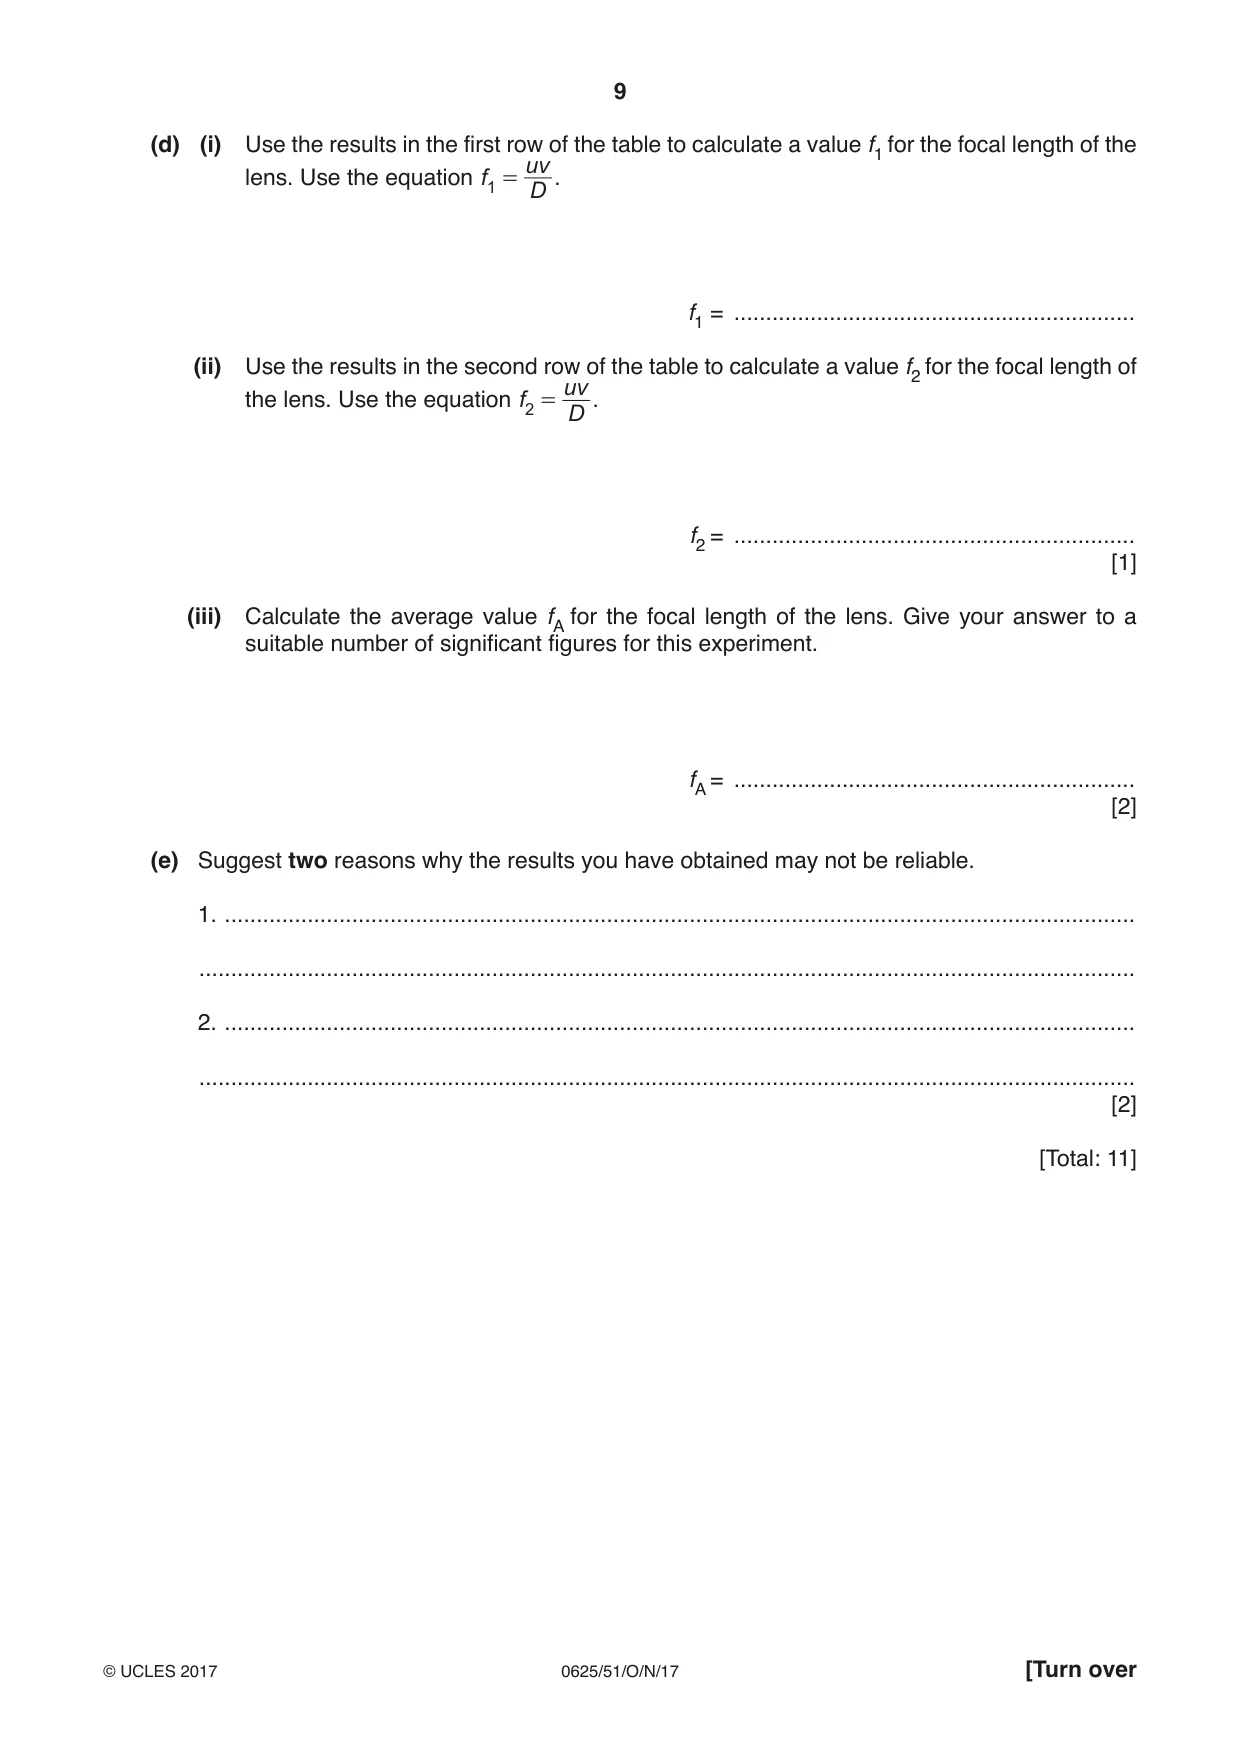
3 In this experiment, you will determine the focal length f of a lens. Carry out the following instructions, referring to Fig. 3.1. D illuminated object u v screen lens bench Fig. 3.1 (a) Place the centre of the lens at a distance u = 20.0 cm from the illuminated object. Place the screen close to the lens and move it away from the lens until a sharply-focused image is formed on the screen. • Measure the distance v from the centre of the lens to the screen. Record v in Table 3.1. • Calculate uv and record the result in the table. • Measure and record in the table the distance D from the illuminated object to the screen. [3] (b) Repeat the steps in (a) with the lens at a distance u = 30.0 cm from the illuminated object. Record all the readings in the table. Table 3.1 u / cm v / cm uv / cm2 D / cm 20.0 30.0 [2] (c) State one difference that you observe between the image formed on the screen when u = 20.0 cm and when u = 30.0 cm. ................................................................................................................................................... ...............................................................................................................................................[1] (d) (i) Use the results in the first row of the table to calculate a value f1 for the focal length of the uv = . lens. Use the equation f1 D f1 = ............................................................... (ii) Use the results in the second row of the table to calculate a value f2 for the focal length of uv = . the lens. Use the equation f2 D f2 = ............................................................... [1] (iii) Calculate the average value fA for the focal length of the lens. Give your answer to a suitable number of significant figures for this experiment. fA = ............................................................... [2] (e) Suggest two reasons why the results you have obtained may not be reliable. 1. ............................................................................................................................................... ................................................................................................................................................... 2. ............................................................................................................................................... ................................................................................................................................................... [2] [Total: 11]
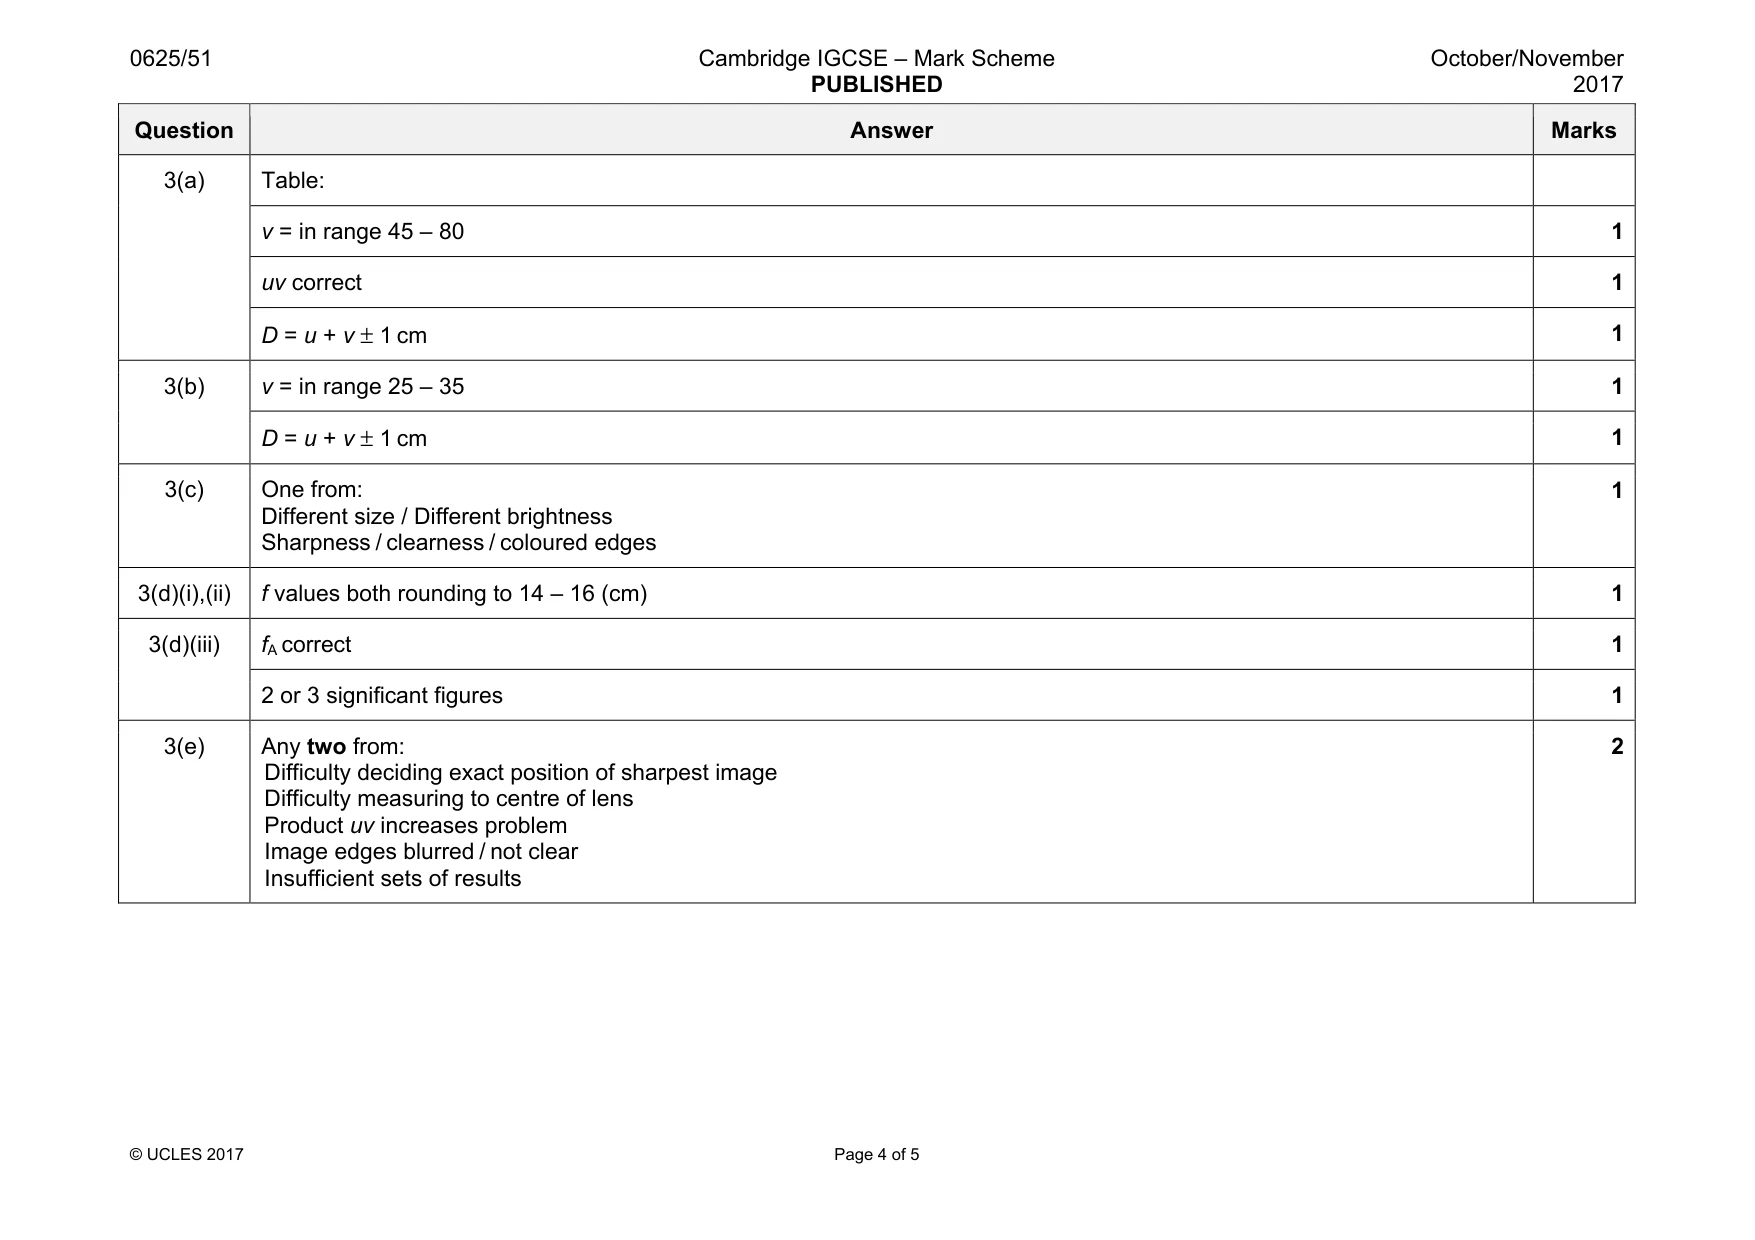
Mark scheme: 3(a) Table: v = in range 45 – 80 1 uv correct 1 D = u + v ± 1 cm 1 3(b) v = in range 25 – 35 1 D = u + v ± 1 cm 1 3(c) One from: Different size / Different brightness Sharpness / clearness / coloured edges 1 3(d)(i),(ii) f values both rounding to 14 – 16 (cm) 1 3(d)(iii) fA correct 1 2 or 3 significant figures 1 3(e) Any two from: Difficulty deciding exact position of sharpest image Difficulty measuring to centre of lens Product uv increases problem Image edges blurred / not clear Insufficient sets of results 2
Q4 · A student is investigating whether the diameter of a pendulum bob affects the period of a…
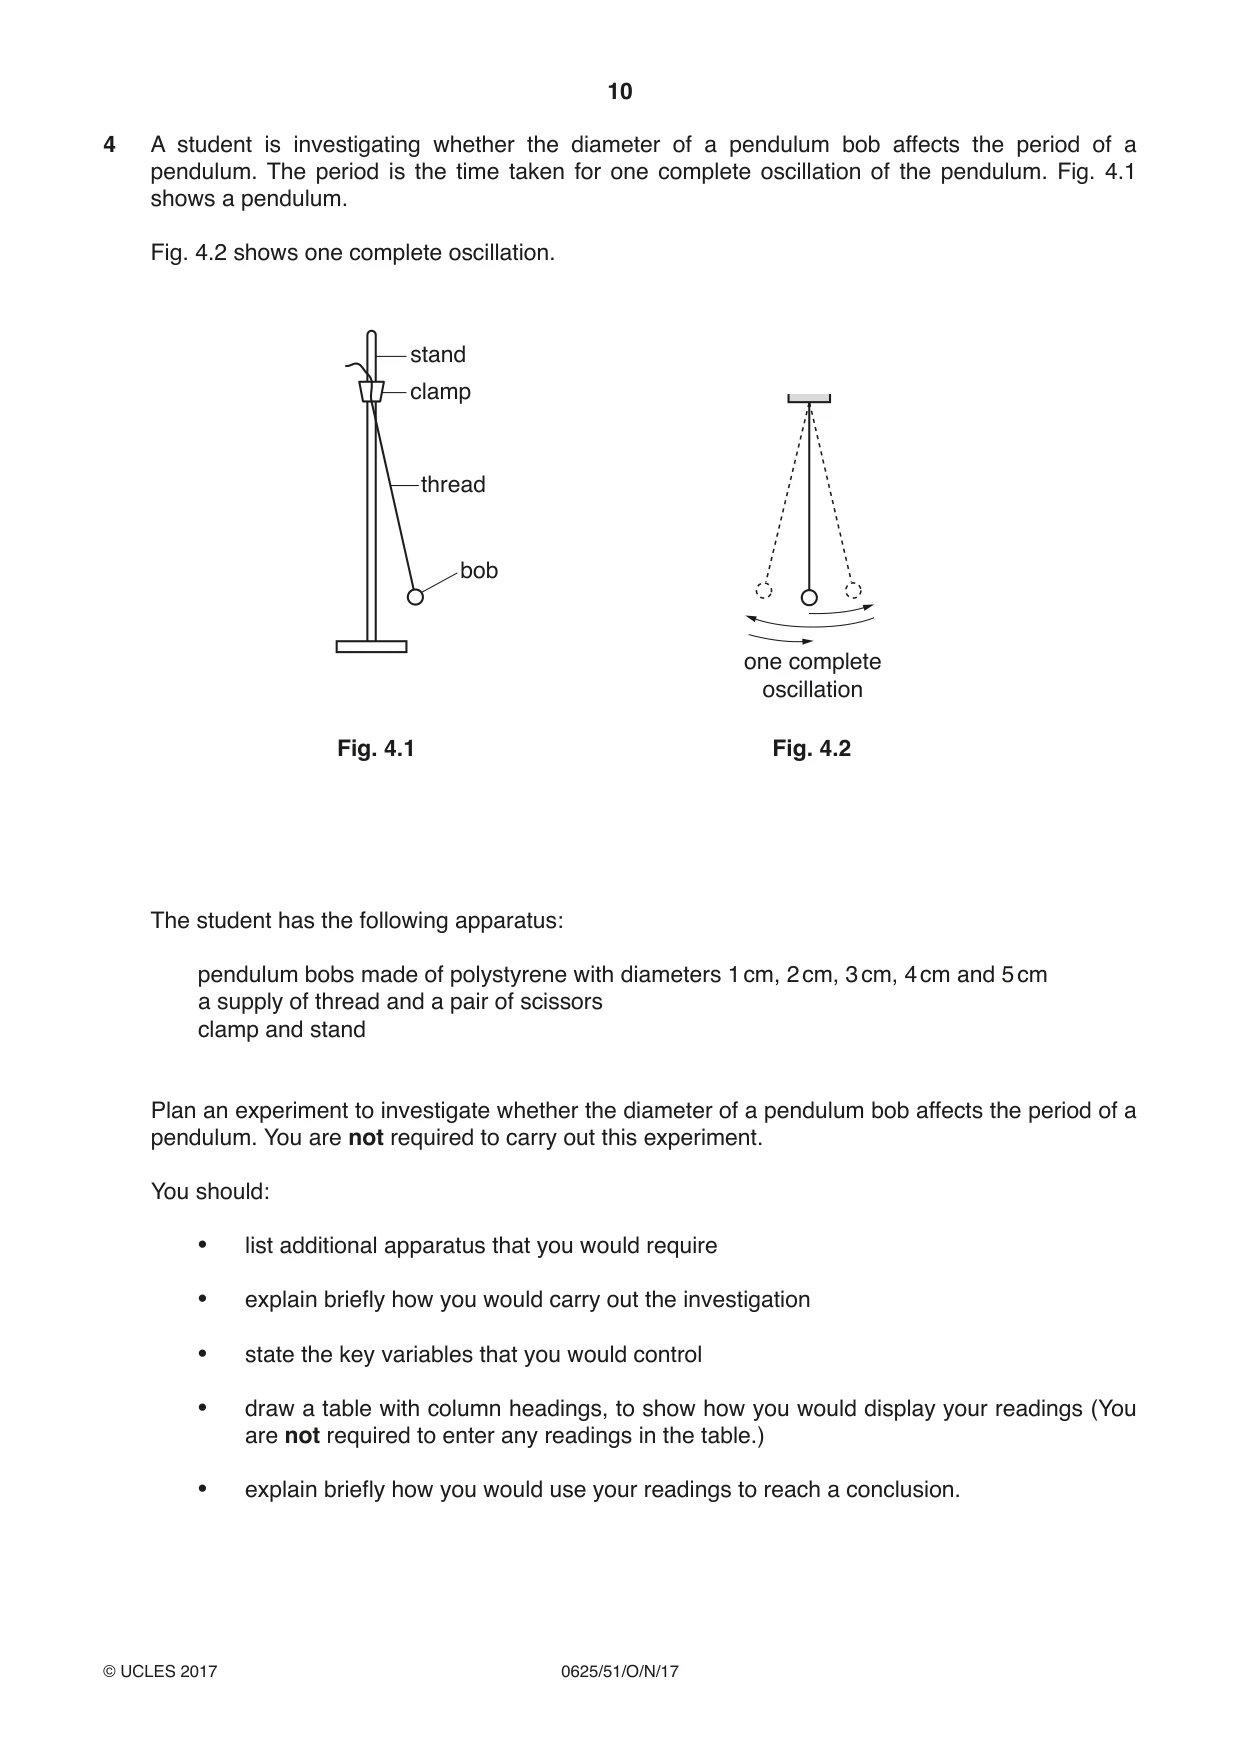
4 A student is investigating whether the diameter of a pendulum bob affects the period of a pendulum. The period is the time taken for one complete oscillation of the pendulum. Fig. 4.1 shows a pendulum. Fig. 4.2 shows one complete oscillation. stand clamp thread bob one complete oscillation Fig. 4.1 Fig. 4.2 The student has the following apparatus: pendulum bobs made of polystyrene with diameters 1 cm, 2 cm, 3 cm, 4 cm and 5 cm a supply of thread and a pair of scissors clamp and stand Plan an experiment to investigate whether the diameter of a pendulum bob affects the period of a pendulum. You are not required to carry out this experiment. You should: • list additional apparatus that you would require • explain briefly how you would carry out the investigation • state the key variables that you would control • draw a table with column headings, to show how you would display your readings (You are not required to enter any readings in the table.) • explain briefly how you would use your readings to reach a conclusion. .......................................................................................................................................................... .......................................................................................................................................................... .......................................................................................................................................................... .......................................................................................................................................................... .......................................................................................................................................................... .......................................................................................................................................................... .......................................................................................................................................................... .......................................................................................................................................................... .......................................................................................................................................................... .......................................................................................................................................................... .......................................................................................................................................................... .......................................................................................................................................................... .......................................................................................................................................................... .......................................................................................................................................................... .......................................................................................................................................................... ......................................................................................................................................................[7] [Total: 7]
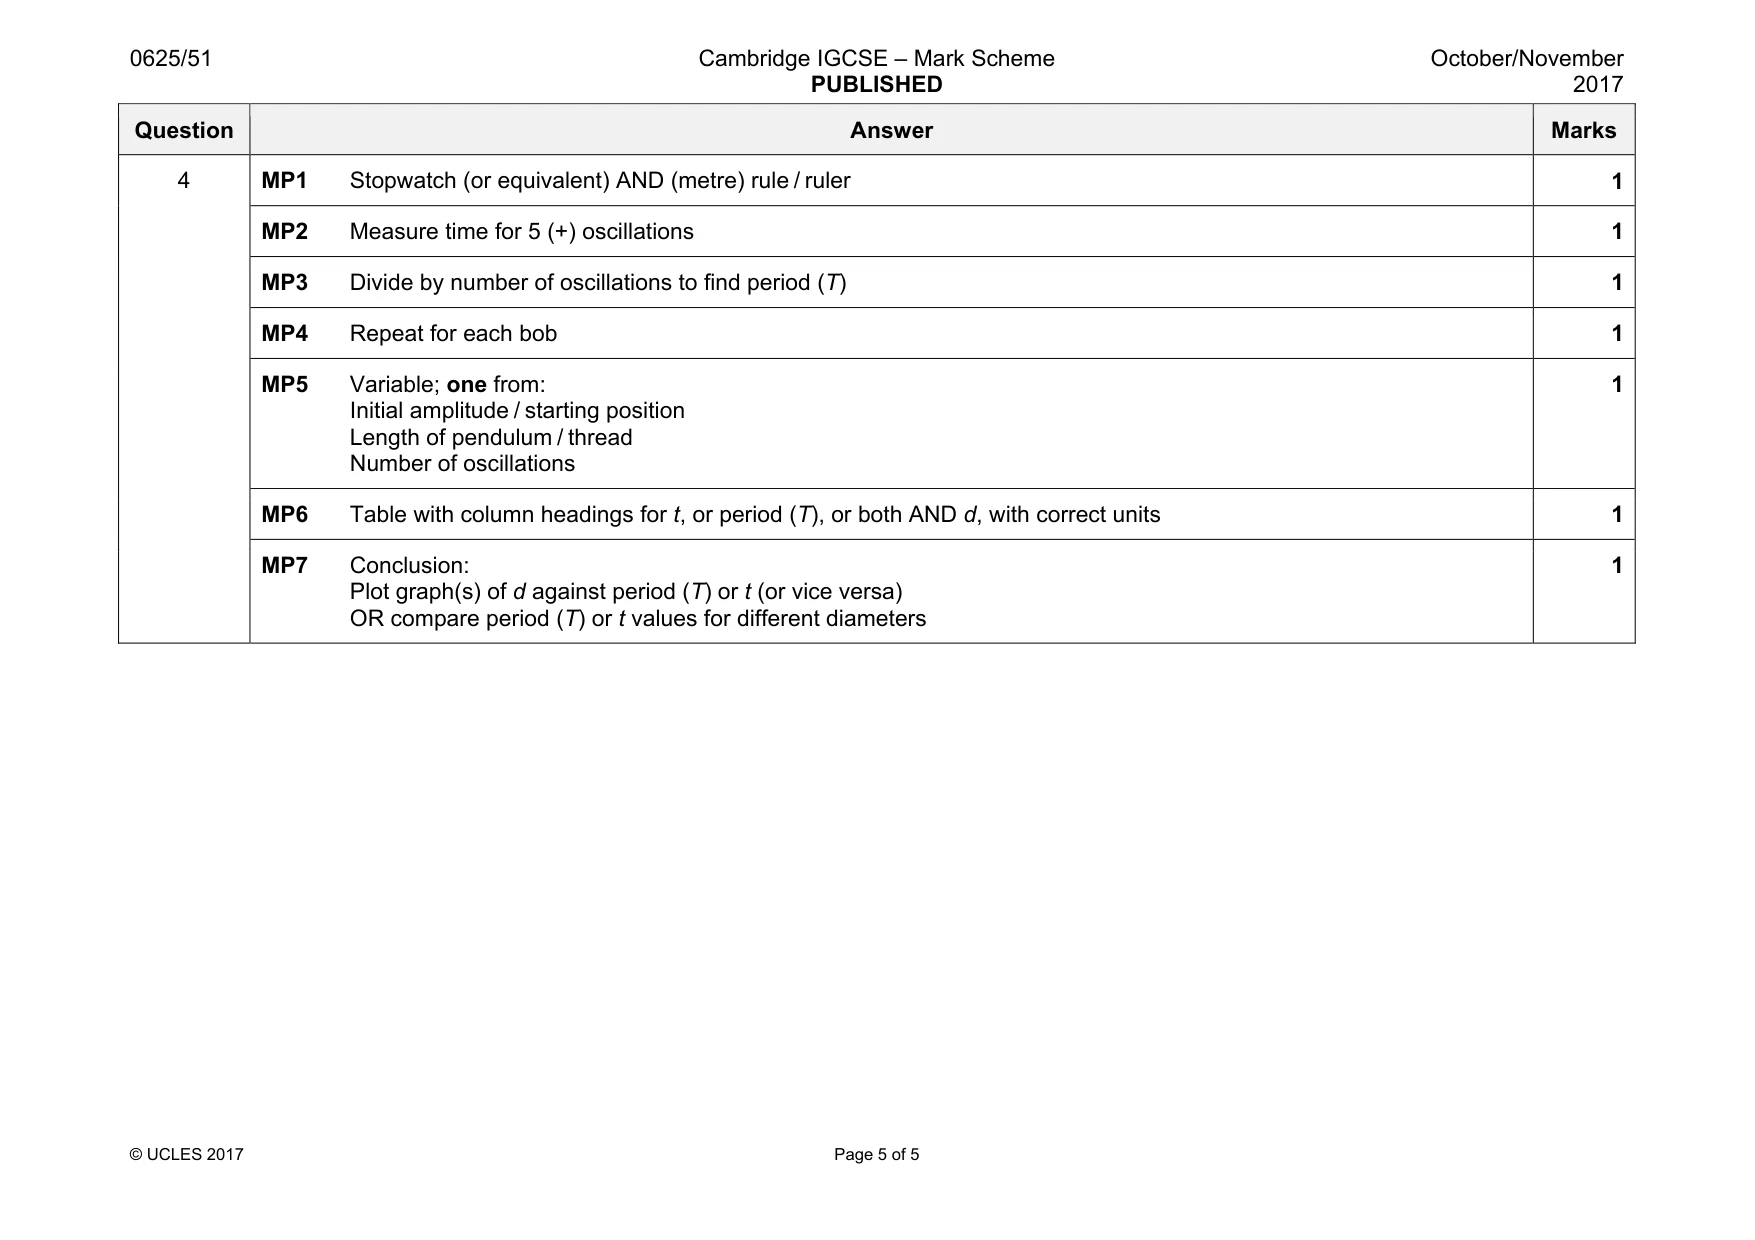
Mark scheme: 4 MP1 Stopwatch (or equivalent) AND (metre) rule / ruler 1 MP2 Measure time for 5 (+) oscillations 1 MP3 Divide by number of oscillations to find period (T) 1 MP4 Repeat for each bob 1 MP5 Variable; one from: Initial amplitude / starting position Length of pendulum / thread Number of oscillations 1 MP6 Table with column headings for t, or period (T), or both AND d, with correct units 1 MP7 Conclusion: Plot graph(s) of d against period (T) or t (or vice versa) OR compare period (T) or t values for different diameters 1
What was in this paper
The subtopics covered by these 4 questions, and how many questions each got. Open one in a new tab to see every Cambridge question on it.
What you needed in this session
Cambridge’s own grade thresholds for 2017 Oct/Nov, Paper 5 · Variant 1. A higher threshold means an easier paper — the bar moves with how the cohort did.