Cambridge IGCSE Physics 0625 — 2016 May/June Paper 6 · Variant 3
0625/63/M/J/16 · 3 questions · 40 marks · ≈45 min
The question paper and its mark scheme, free to read here and free to download. This is Cambridge’s own paper, exactly as it was sat.
Question paper12 pages
Mark scheme6 pages
Answers below. Sit the paper first if you are practising.
Questions as text
Q1 · Some students are comparing the rates of cooling of two thermometer bulbs under wet and…
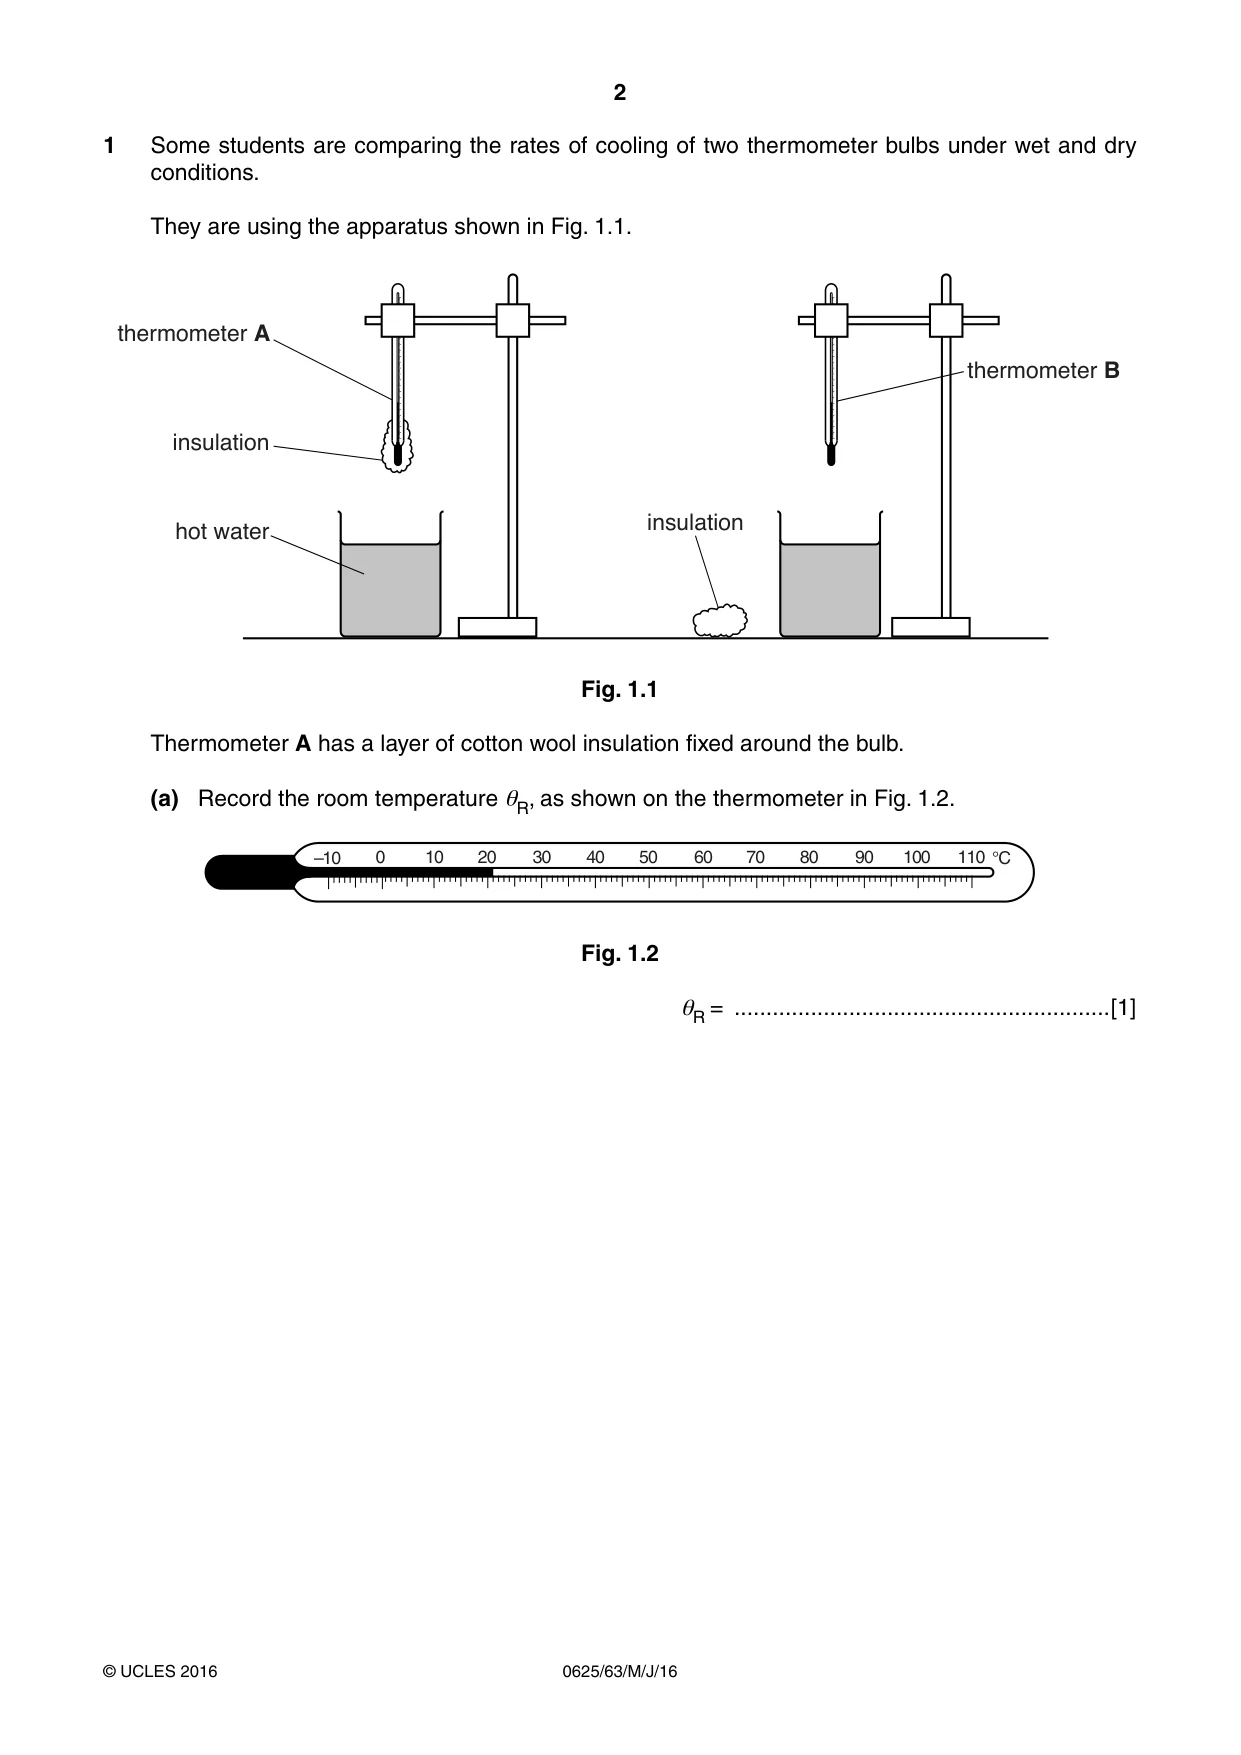
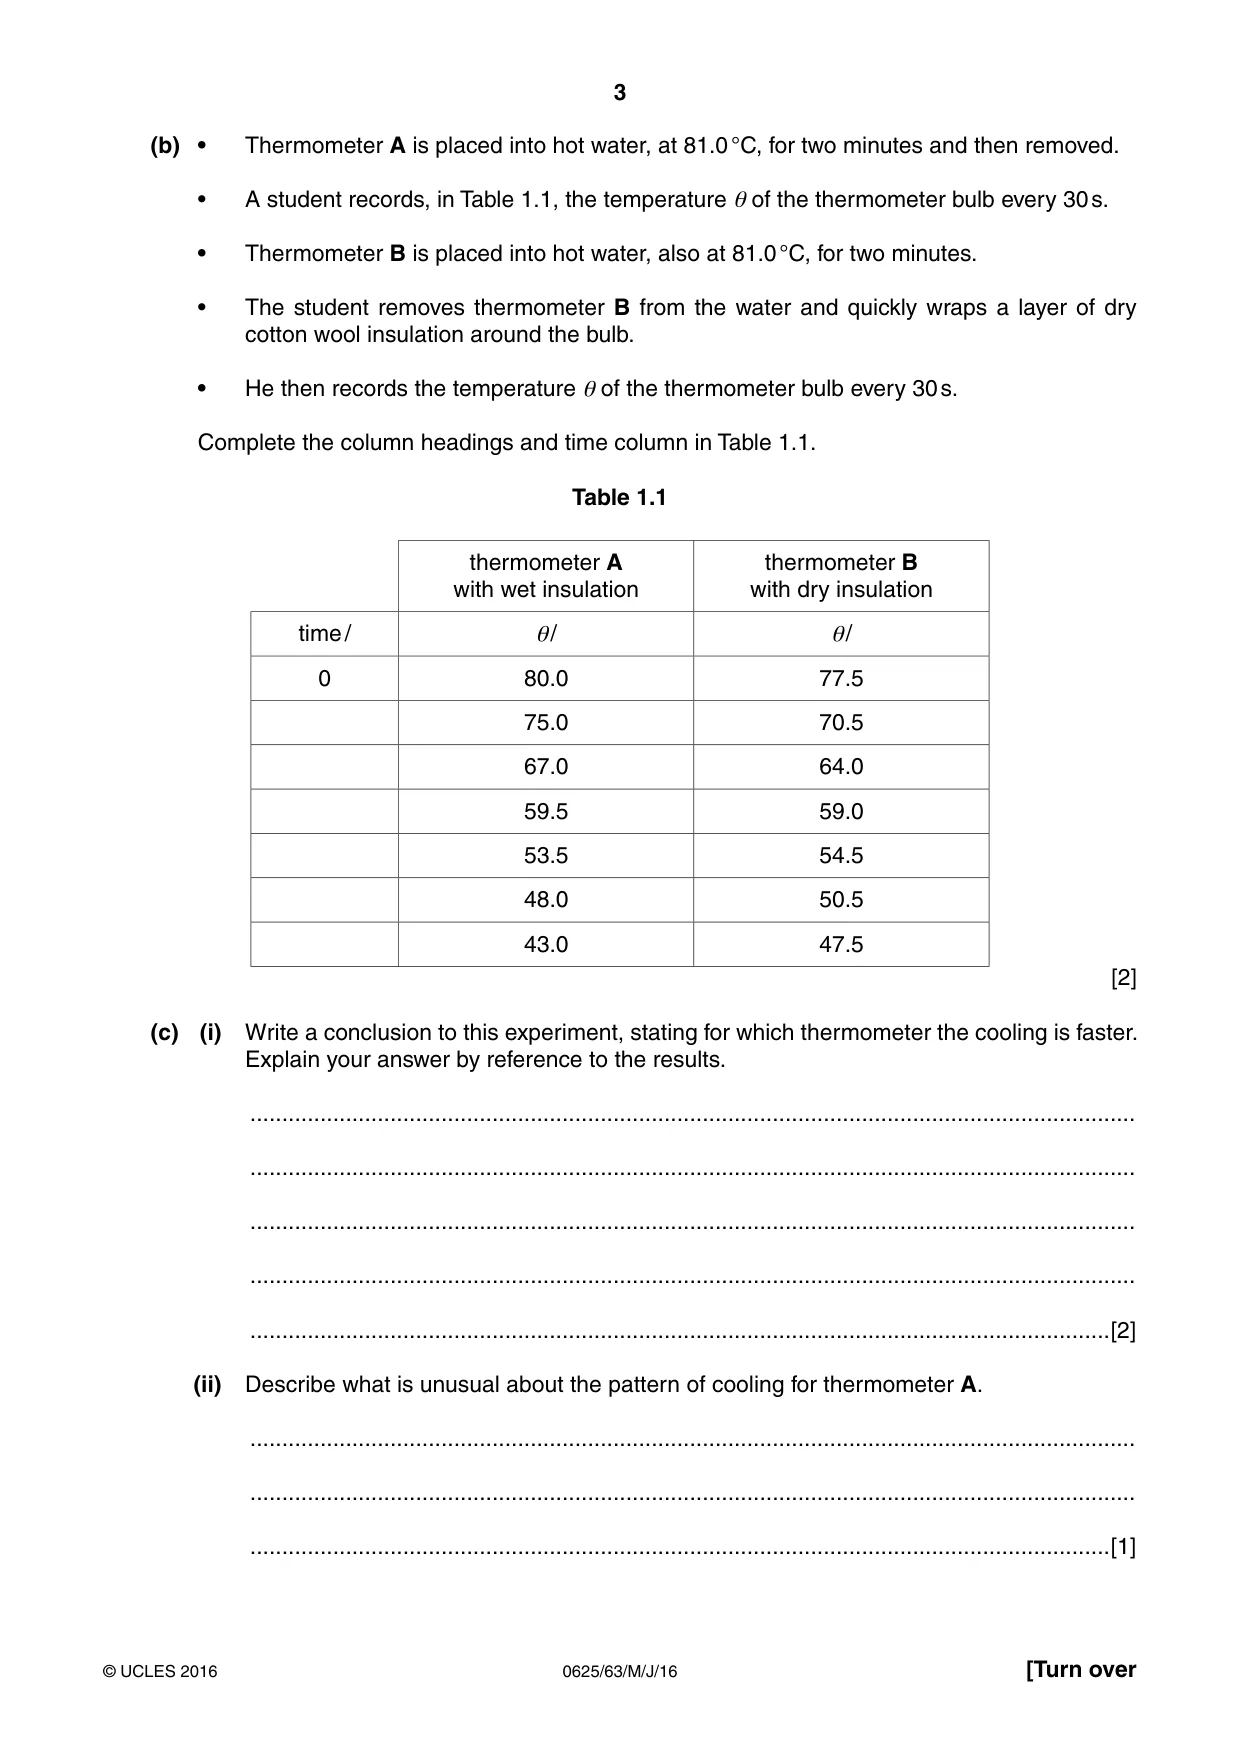
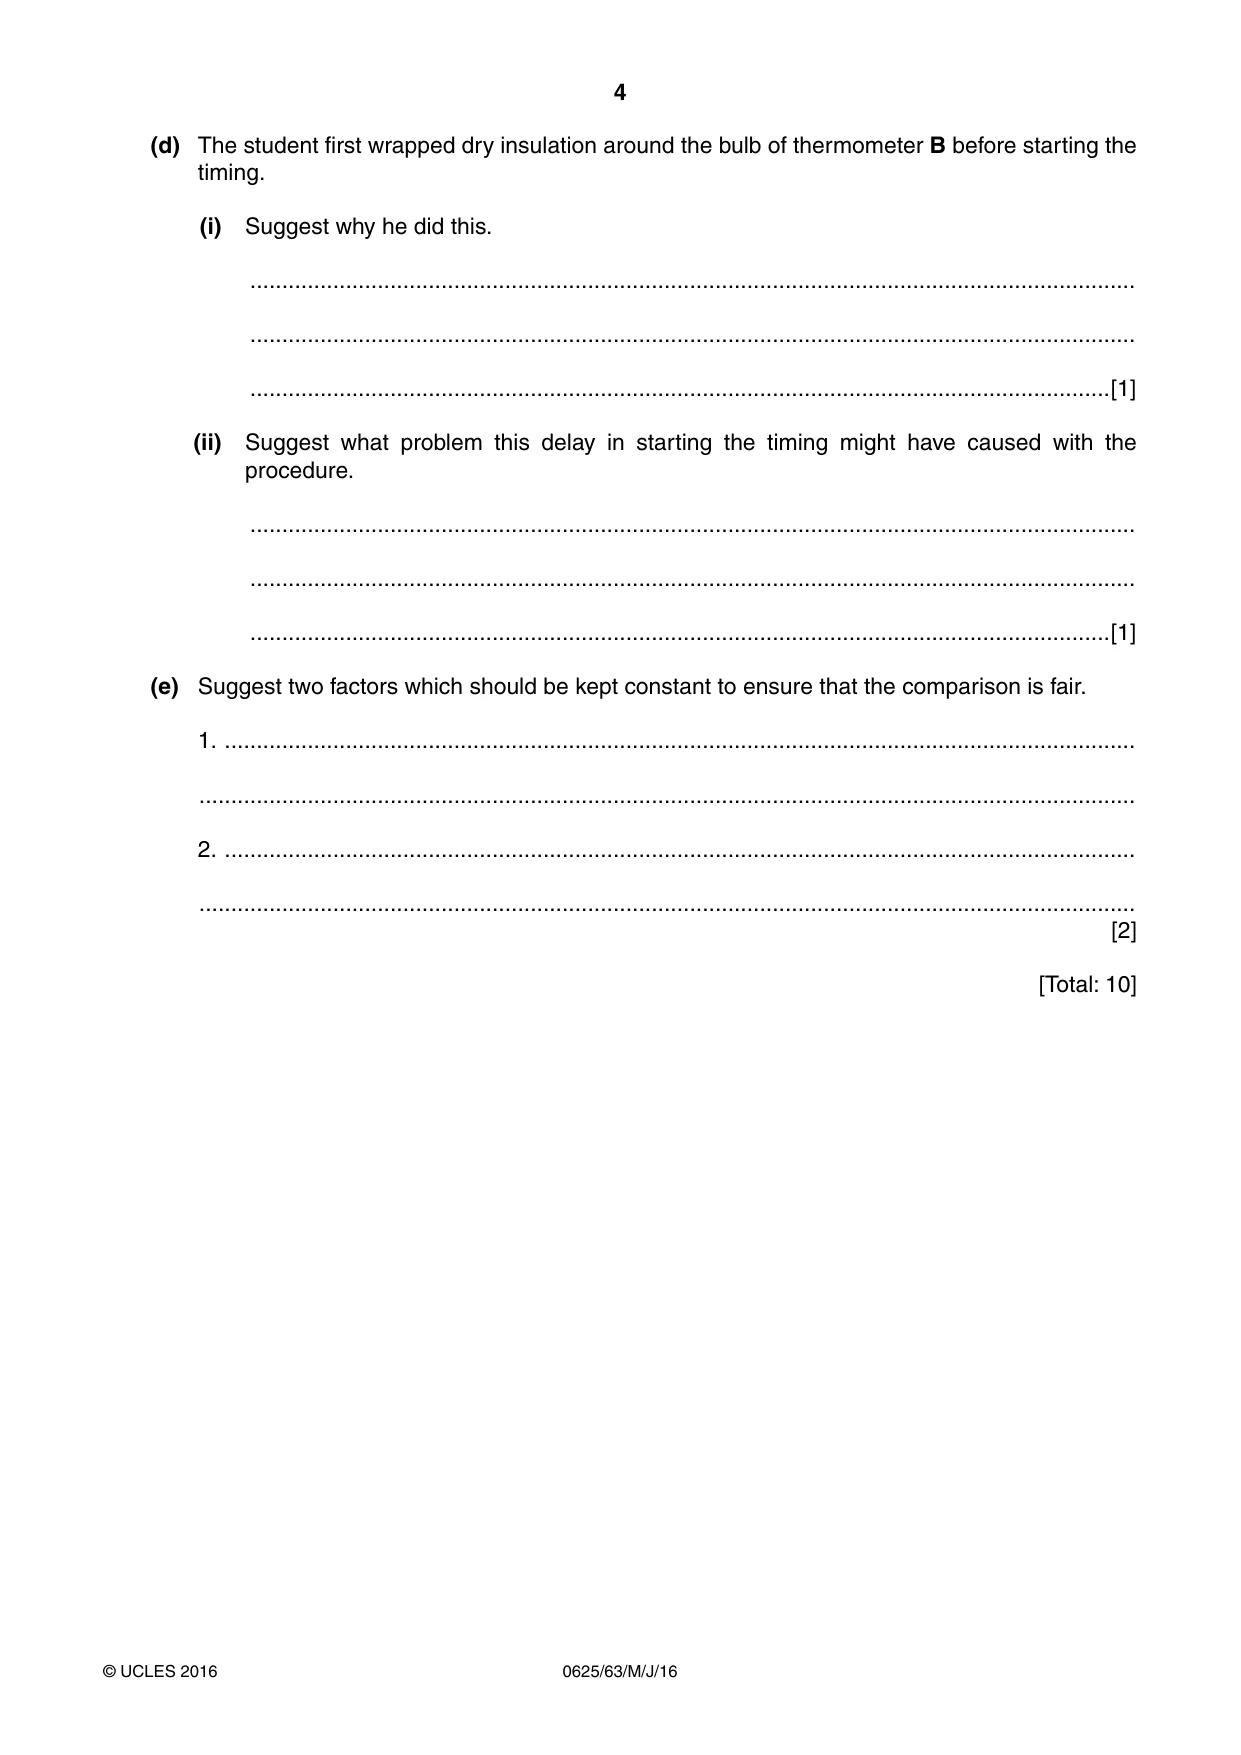
1 Some students are comparing the rates of cooling of two thermometer bulbs under wet and dry conditions. They are using the apparatus shown in Fig. 1.1. thermometer A thermometer B insulation insulation hot water Fig. 1.1 Thermometer A has a layer of cotton wool insulation fixed around the bulb. (a) Record the room temperature θR, as shown on the thermometer in Fig. 1.2. –10 0 10 20 30 40 50 60 70 80 90 100 110 °C Fig. 1.2 θR = ...........................................................[1] (b) • Thermometer A is placed into hot water, at 81.0 °C, for two minutes and then removed. • A student records, in Table 1.1, the temperature θ of the thermometer bulb every 30 s. • Thermometer B is placed into hot water, also at 81.0 °C, for two minutes. • The student removes thermometer B from the water and quickly wraps a layer of dry cotton wool insulation around the bulb. • He then records the temperature θ of the thermometer bulb every 30 s. Complete the column headings and time column in Table 1.1. Table 1.1 thermometer A thermometer B with wet insulation with dry insulation time / θ/ θ/ 0 80.0 77.5 75.0 70.5 67.0 64.0 59.5 59.0 53.5 54.5 48.0 50.5 43.0 47.5 [2] (c) (i) Write a conclusion to this experiment, stating for which thermometer the cooling is faster. Explain your answer by reference to the results. ........................................................................................................................................... ........................................................................................................................................... ........................................................................................................................................... ........................................................................................................................................... .......................................................................................................................................[2] (ii) Describe what is unusual about the pattern of cooling for thermometer A. ........................................................................................................................................... ........................................................................................................................................... .......................................................................................................................................[1] (d) The student first wrapped dry insulation around the bulb of thermometer B before starting the timing. (i) Suggest why he did this. ........................................................................................................................................... ........................................................................................................................................... .......................................................................................................................................[1] (ii) Suggest what problem this delay in starting the timing might have caused with the procedure. ........................................................................................................................................... ........................................................................................................................................... .......................................................................................................................................[1] (e) Suggest two factors which should be kept constant to ensure that the comparison is fair. 1. ............................................................................................................................................... ................................................................................................................................................... 2. ............................................................................................................................................... ................................................................................................................................................... [2] [Total: 10]
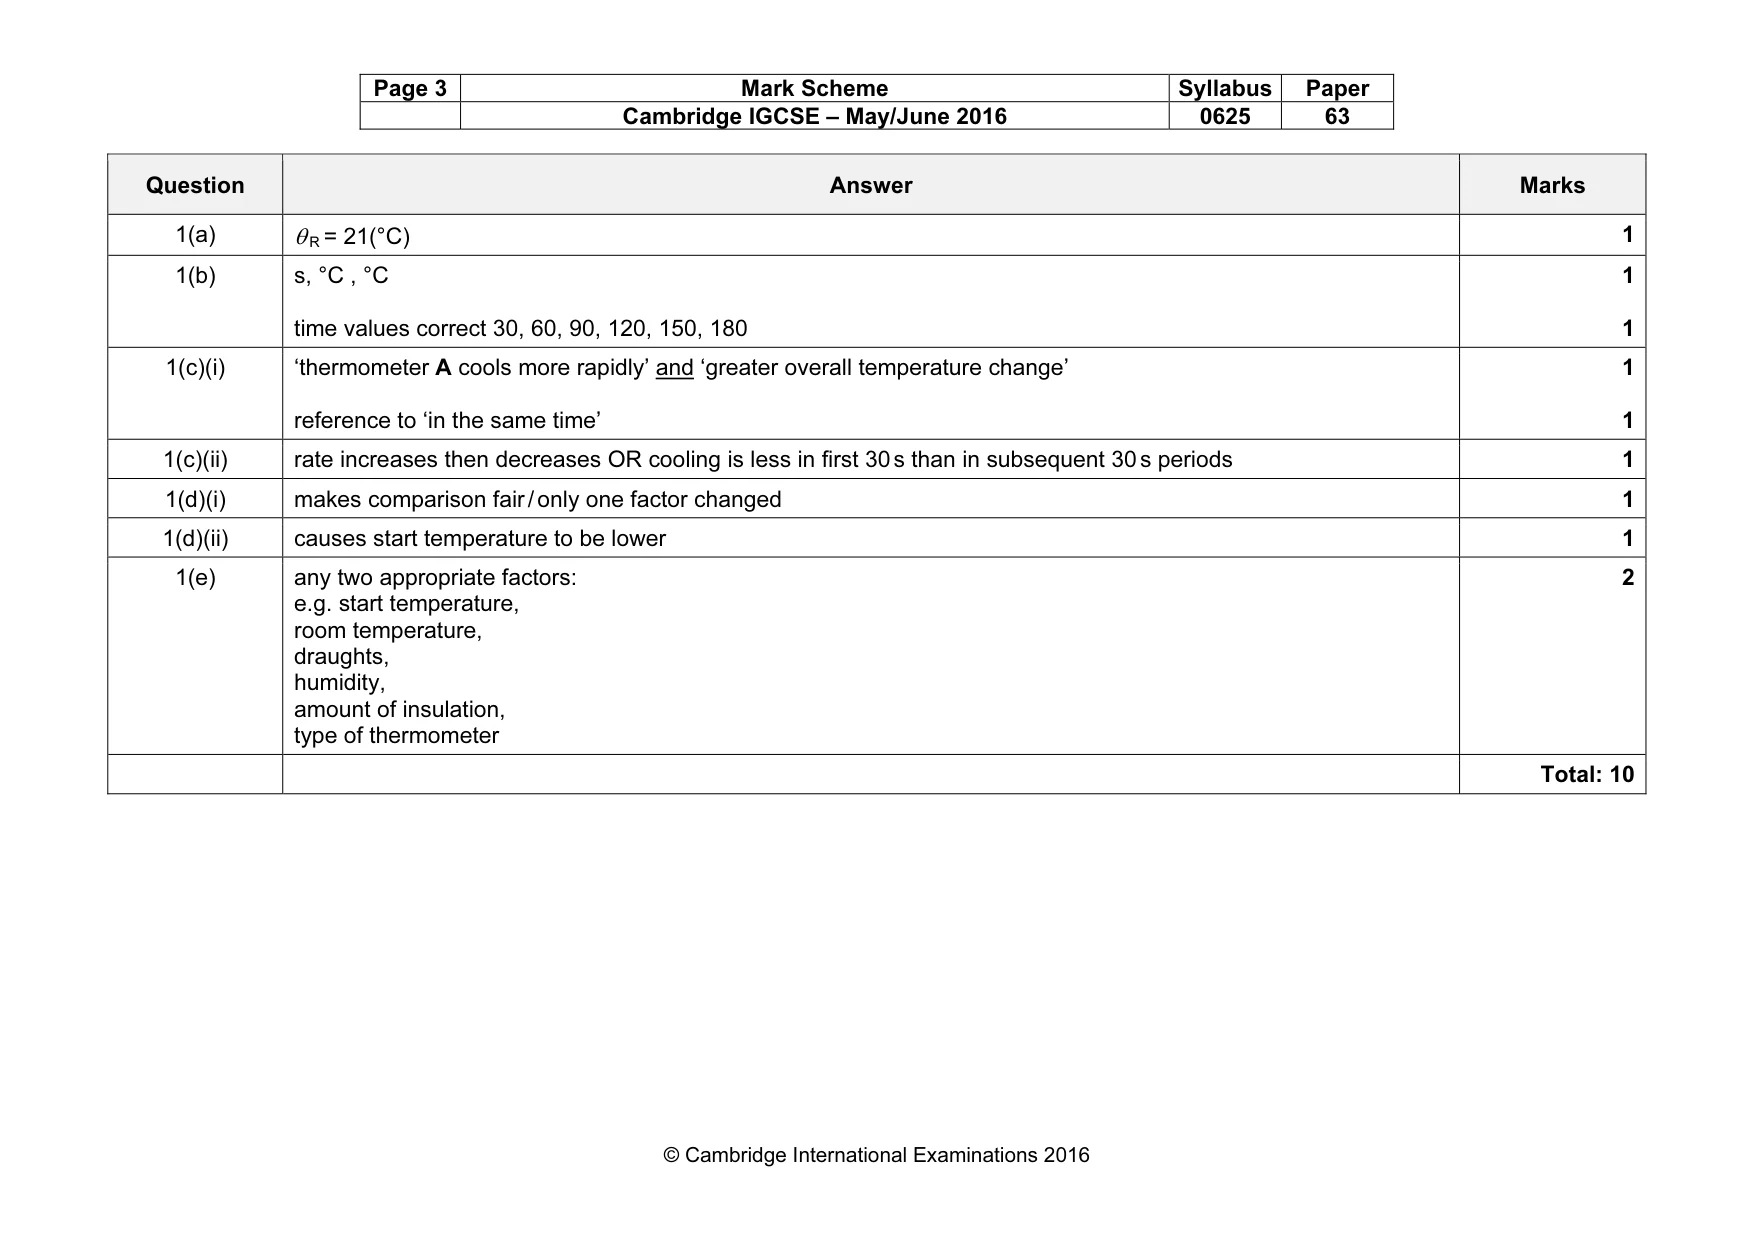
Mark scheme: 1(a) θ R = 21(°C) 1 1(b) s, °C , °C time values correct 30, 60, 90, 120, 150, 180 1 1 1(c)(i) ‘thermometer A cools more rapidly’ and ‘greater overall temperature change’ reference to ‘in the same time’ 1 1 1(c)(ii) rate increases then decreases OR cooling is less in first 30 s than in subsequent 30 s periods 1 1(d)(i) makes comparison fair / only one factor changed 1 1(d)(ii) causes start temperature to be lower 1 1(e) any two appropriate factors: e.g. start temperature, room temperature, draughts, humidity, amount of insulation, type of thermometer 2 Total: 10
Q2 · A student is using a forcemeter and a set of different loads to determine the weight of a…
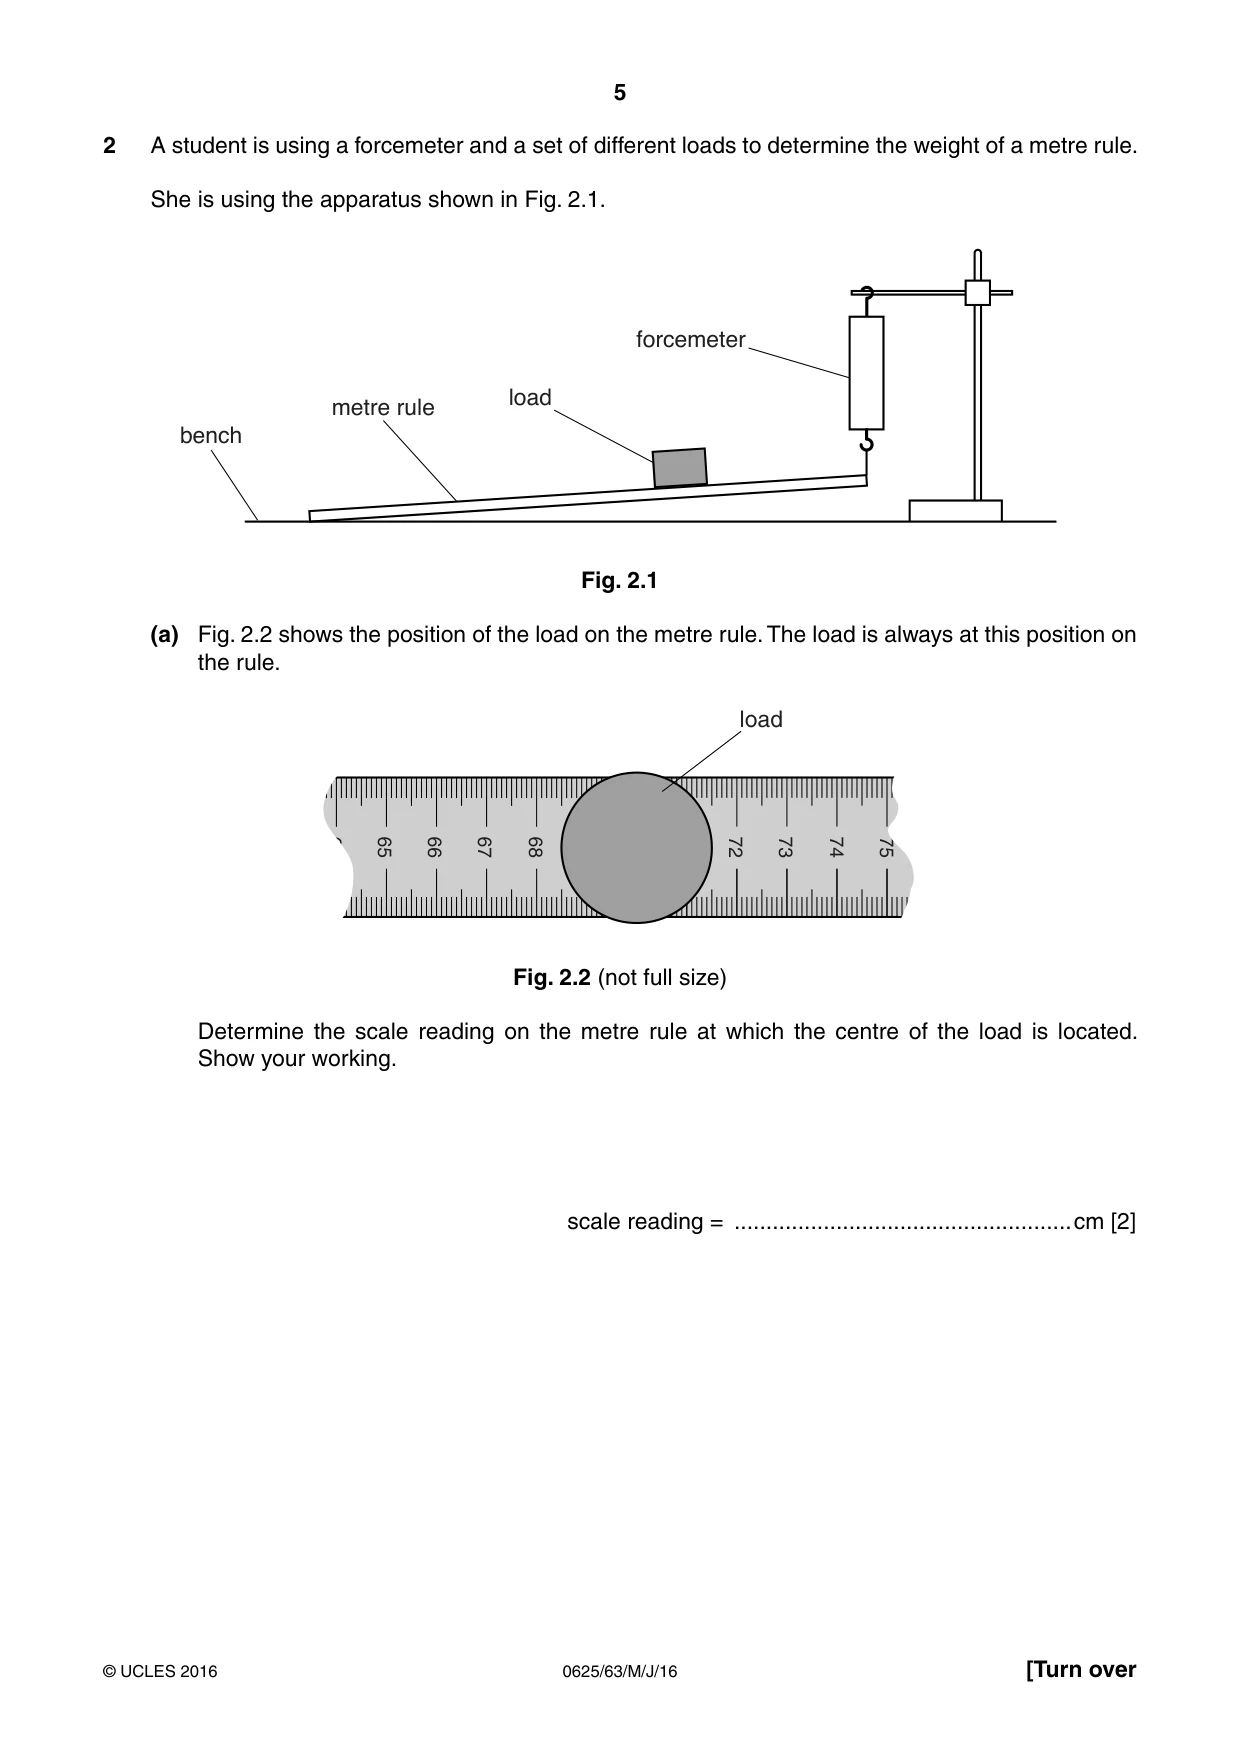
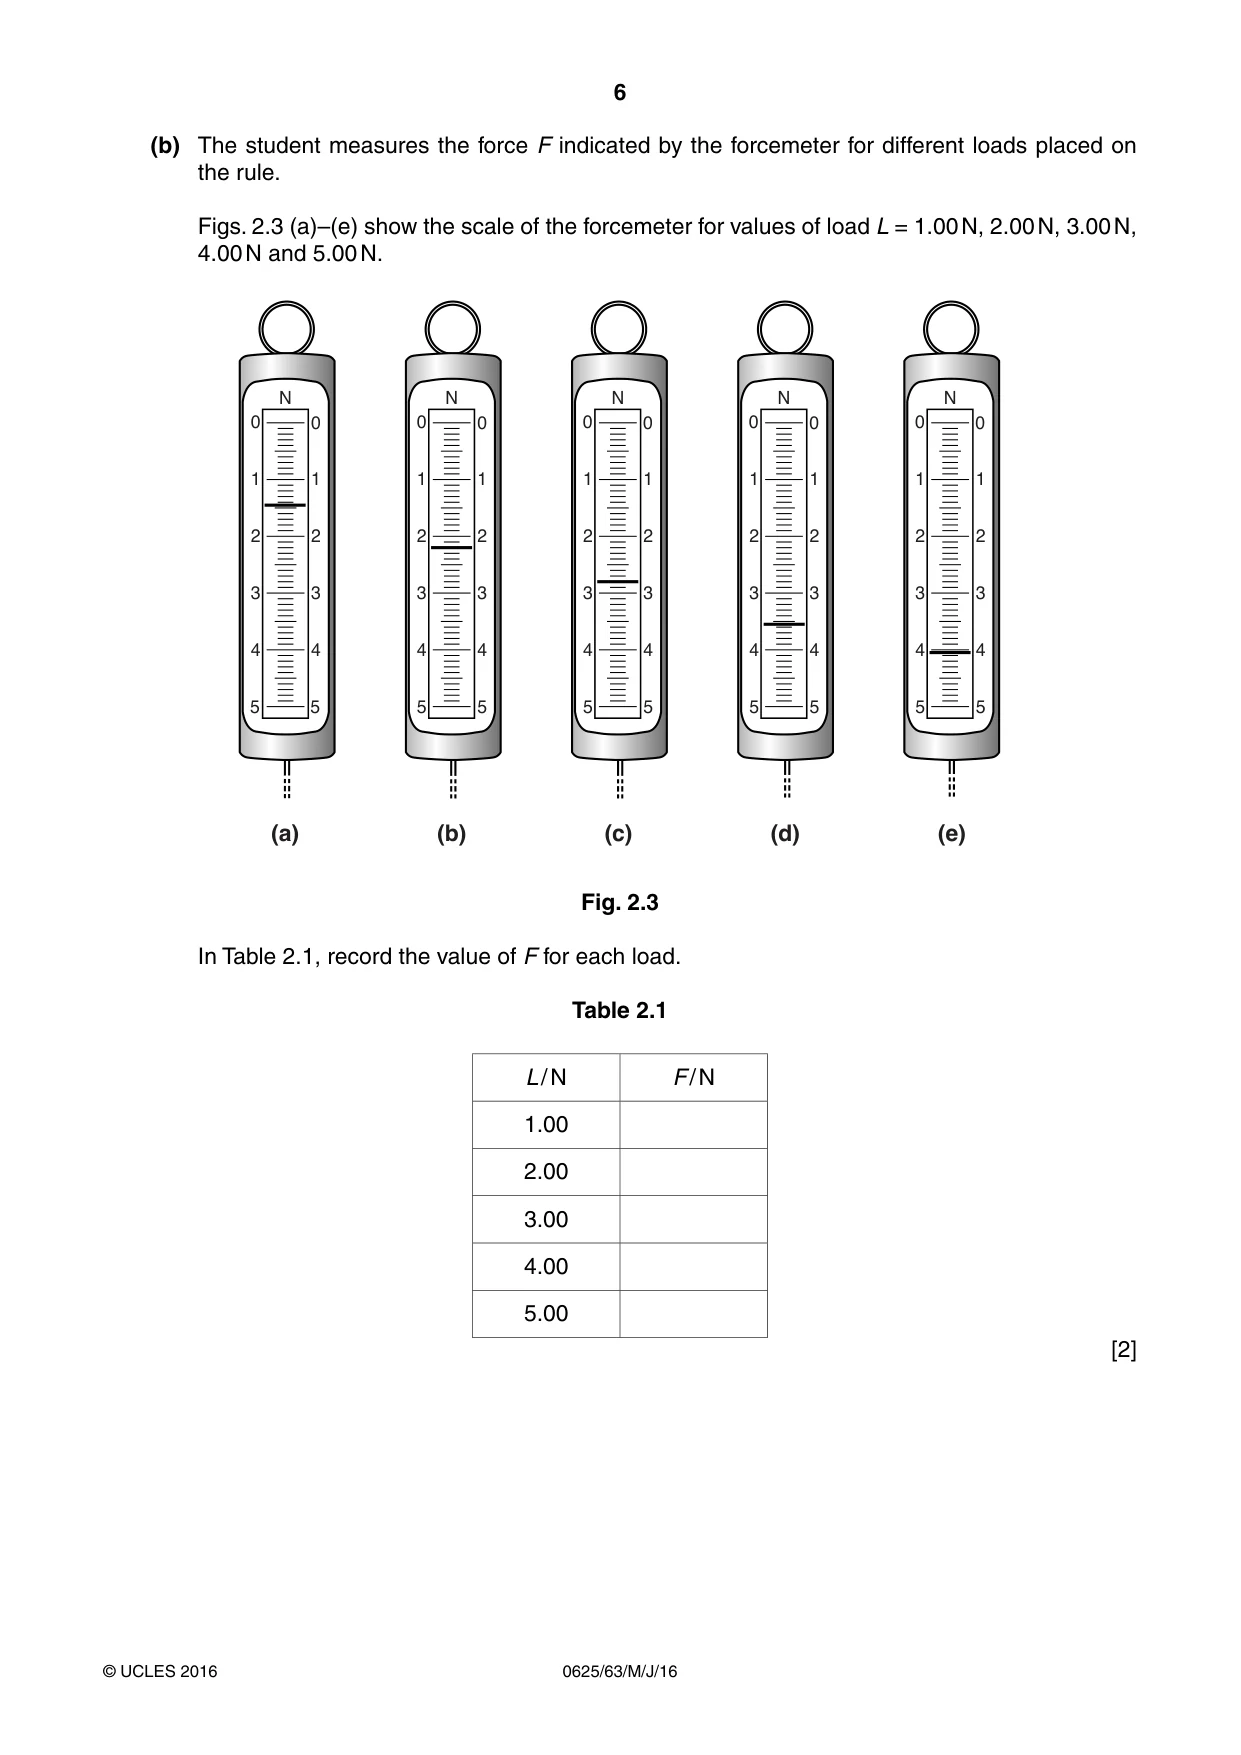
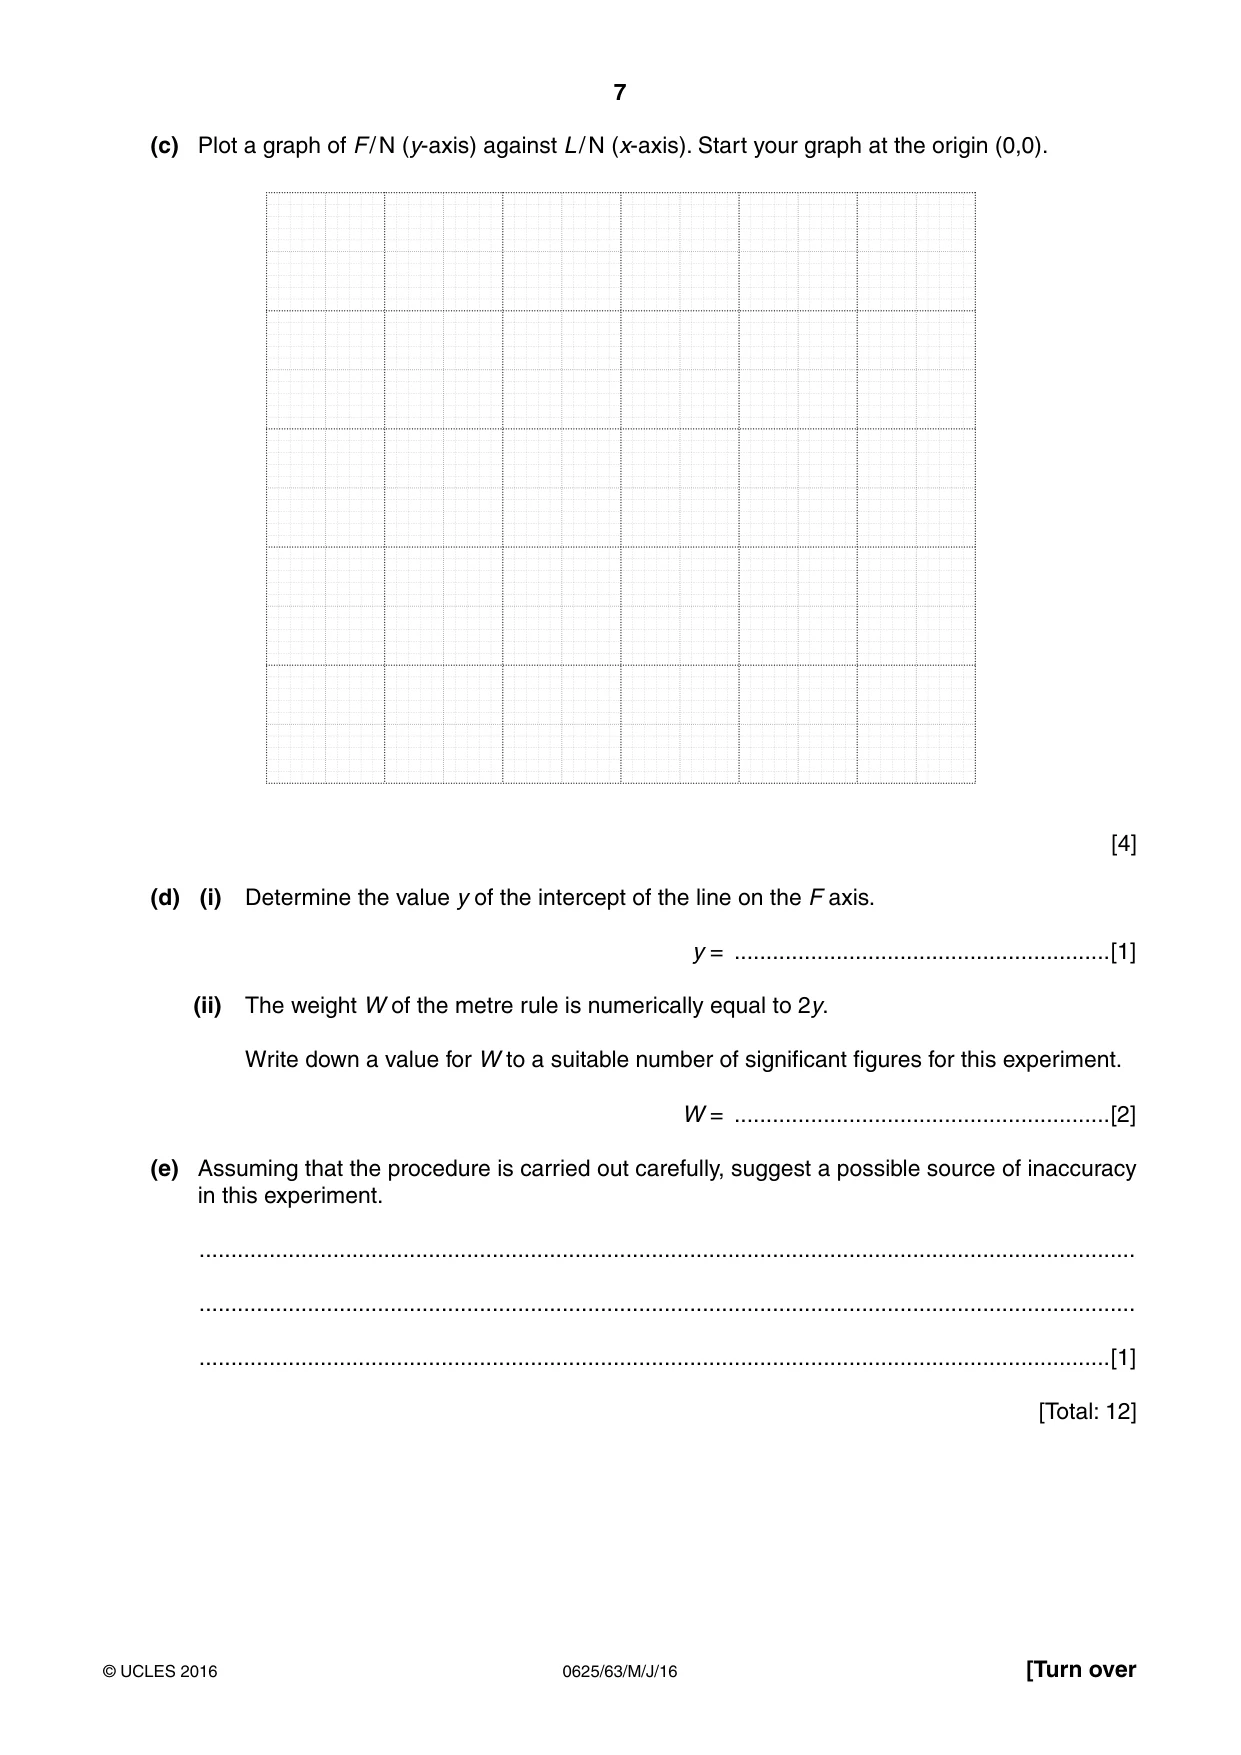
2 A student is using a forcemeter and a set of different loads to determine the weight of a metre rule. She is using the apparatus shown in Fig. 2.1. forcemeter load metre rule bench Fig. 2.1 (a) Fig. 2.2 shows the position of the load on the metre rule. The load is always at this position on the rule. load 64 65 66 67 68 69 70 71 72 73 74 75 Fig. 2.2 (not full size) Determine the scale reading on the metre rule at which the centre of the load is located. Show your working. scale reading = .....................................................cm [2] (b) The student measures the force F indicated by the forcemeter for different loads placed on the rule. Figs. 2.3 (a)–(e) show the scale of the forcemeter for values of load L = 1.00 N, 2.00 N, 3.00 N, 4.00 N and 5.00 N. N N N N N 0 0 0 0 0 0 0 0 0 0 1 1 1 1 1 1 1 1 1 1 2 2 2 2 2 2 2 2 2 2 3 3 3 3 3 3 3 3 3 3 4 4 4 4 4 4 4 4 4 4 5 5 5 5 5 5 5 5 5 5 (a) (b) (c) (d) (e) Fig. 2.3 In Table 2.1, record the value of F for each load. Table 2.1 L / N F / N 1.00 2.00 3.00 4.00 5.00 [2] (c) Plot a graph of F / N (y-axis) against L / N (x-axis). Start your graph at the origin (0,0). [4] (d) (i) Determine the value y of the intercept of the line on the F axis. y = ...........................................................[1] (ii) The weight W of the metre rule is numerically equal to 2y. Write down a value for W to a suitable number of significant figures for this experiment. W = ...........................................................[2] (e) Assuming that the procedure is carried out carefully, suggest a possible source of inaccuracy in this experiment. ................................................................................................................................................... ................................................................................................................................................... ...............................................................................................................................................[1] [Total: 12]
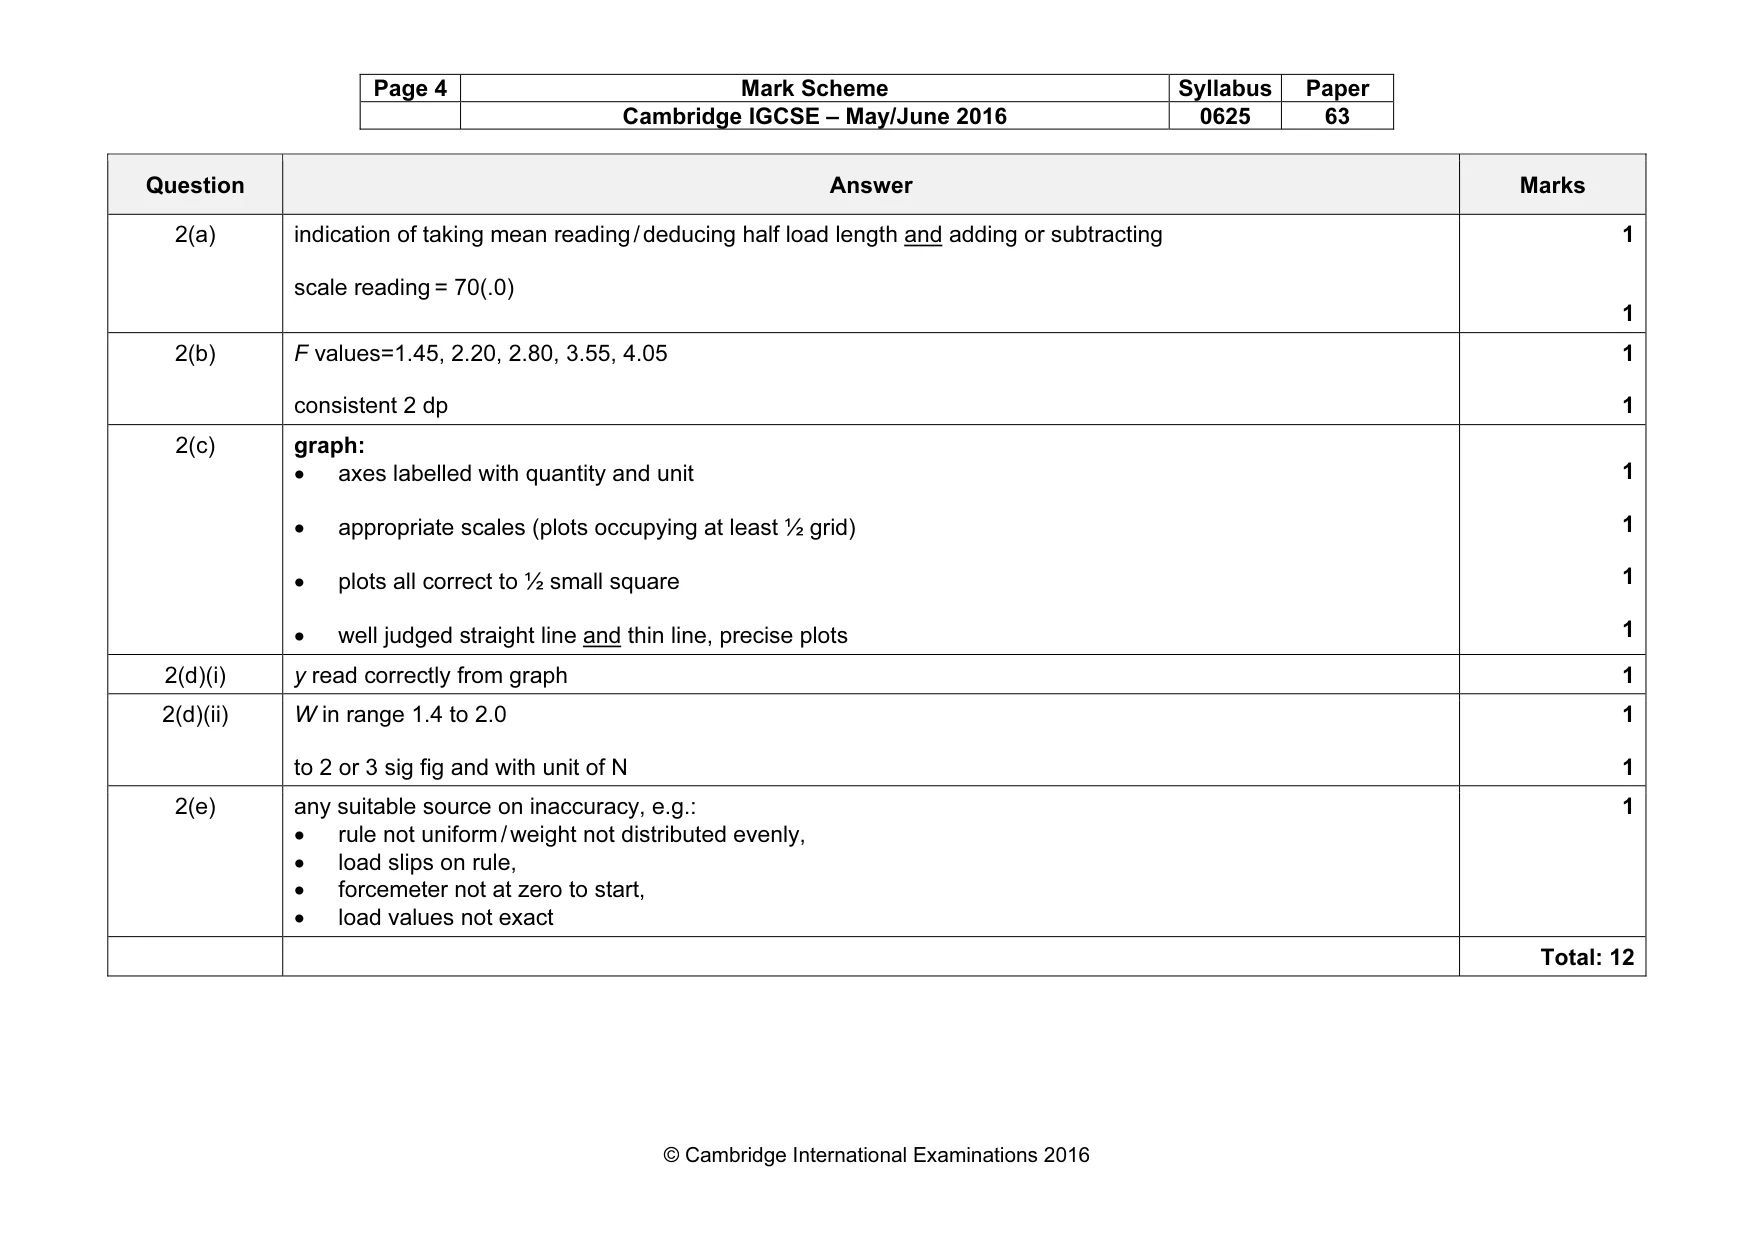
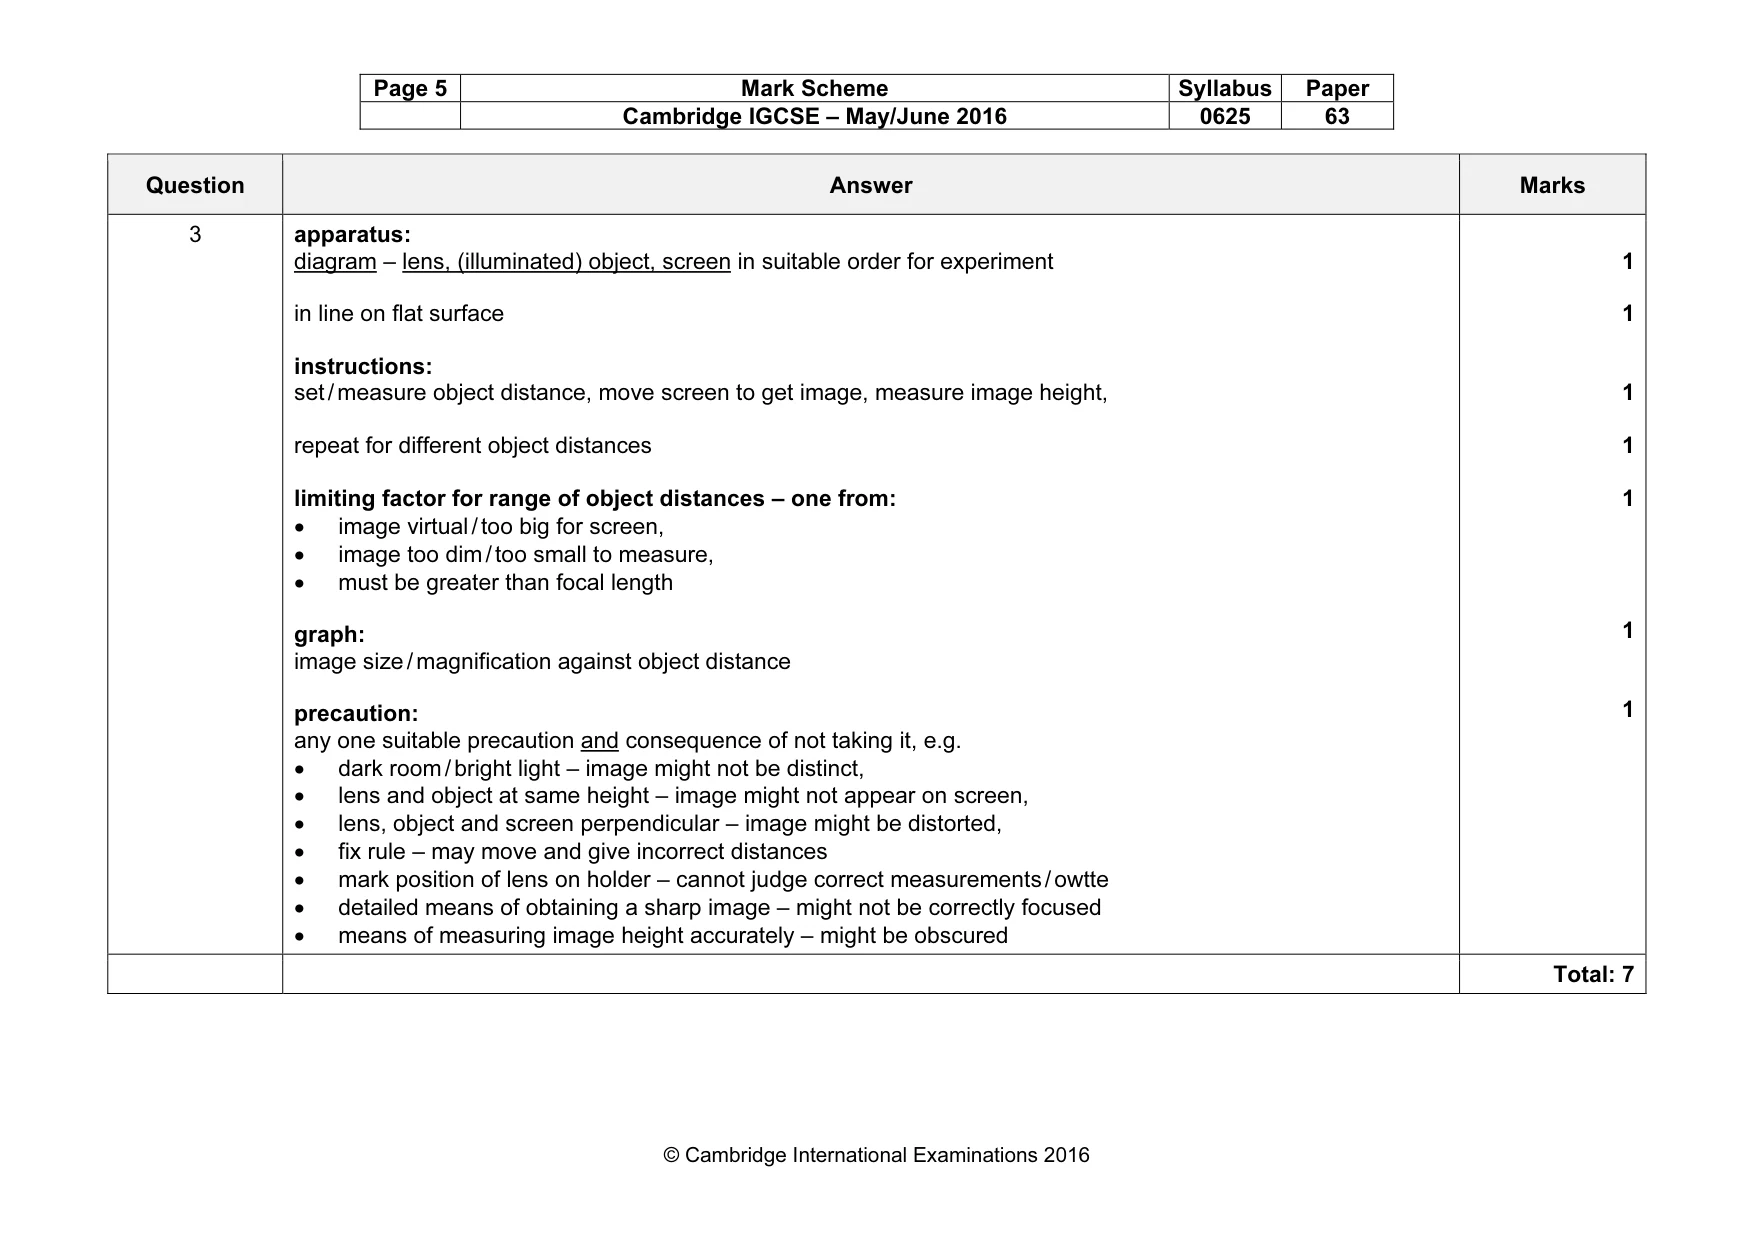
Mark scheme: 2(a) indication of taking mean reading / deducing half load length and adding or subtracting scale reading = 70(.0) 1 1 2(b) F values=1.45, 2.20, 2.80, 3.55, 4.05 consistent 2 dp 1 1 2(c) graph: • axes labelled with quantity and unit • appropriate scales (plots occupying at least ½ grid) • plots all correct to ½ small square • well judged straight line and thin line, precise plots 1 1 1 1 2(d)(i) y read correctly from graph 1 2(d)(ii) W in range 1.4 to 2.0 to 2 or 3 sig fig and with unit of N 1 1 2(e) any suitable source on inaccuracy, e.g.: • rule not uniform / weight not distributed evenly, • load slips on rule, • forcemeter not at zero to start, • load values not exact 1 Total: 12 Question Answer Marks 3 apparatus: diagram – lens, (illuminated) object, screen in suitable order for experiment in line on flat surface instructions: set / measure object distance, move screen to get image, measure image height, repeat for different object distances limiting factor for range of object distances – one from: • image virtual / too big for screen, • image too dim / too small to measure, • must be greater than focal length graph: image size / magnification against object distance precaution: any one suitable precaution and consequence of not taking it, e.g. • dark room / bright light – image might not be distinct, • lens and object at same height – image might not appear on screen, • lens, object and screen perpendicular – image might be distorted, • fix rule – may move and give incorrect distances • mark position of lens on holder – cannot judge correct measurements / owtte • detailed means of obtaining a sharp image – might not be correctly focused • means of measuring image height accurately – might be obscured 1 1 1 1 1 1 1 Total: 7
Q4 · The class is investigating a circuit containing two lamps in series
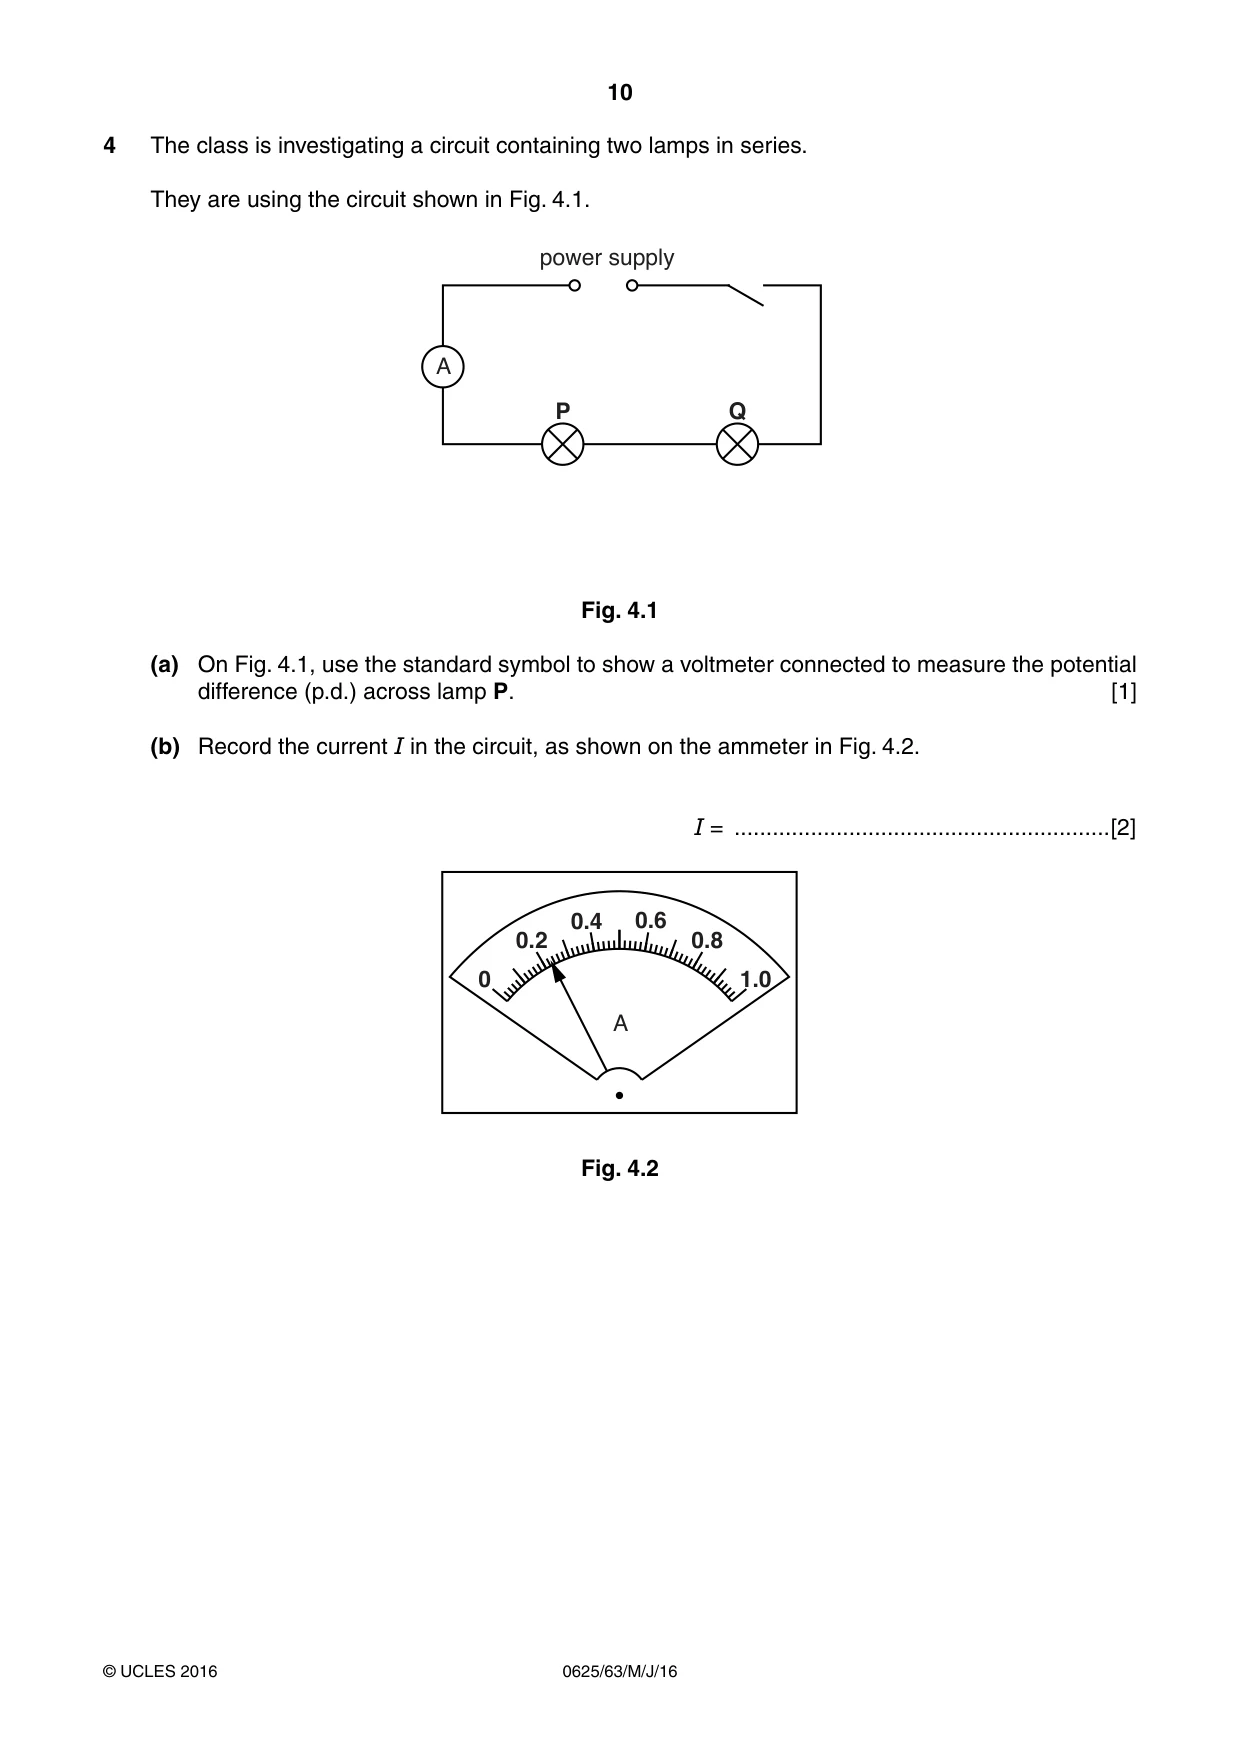
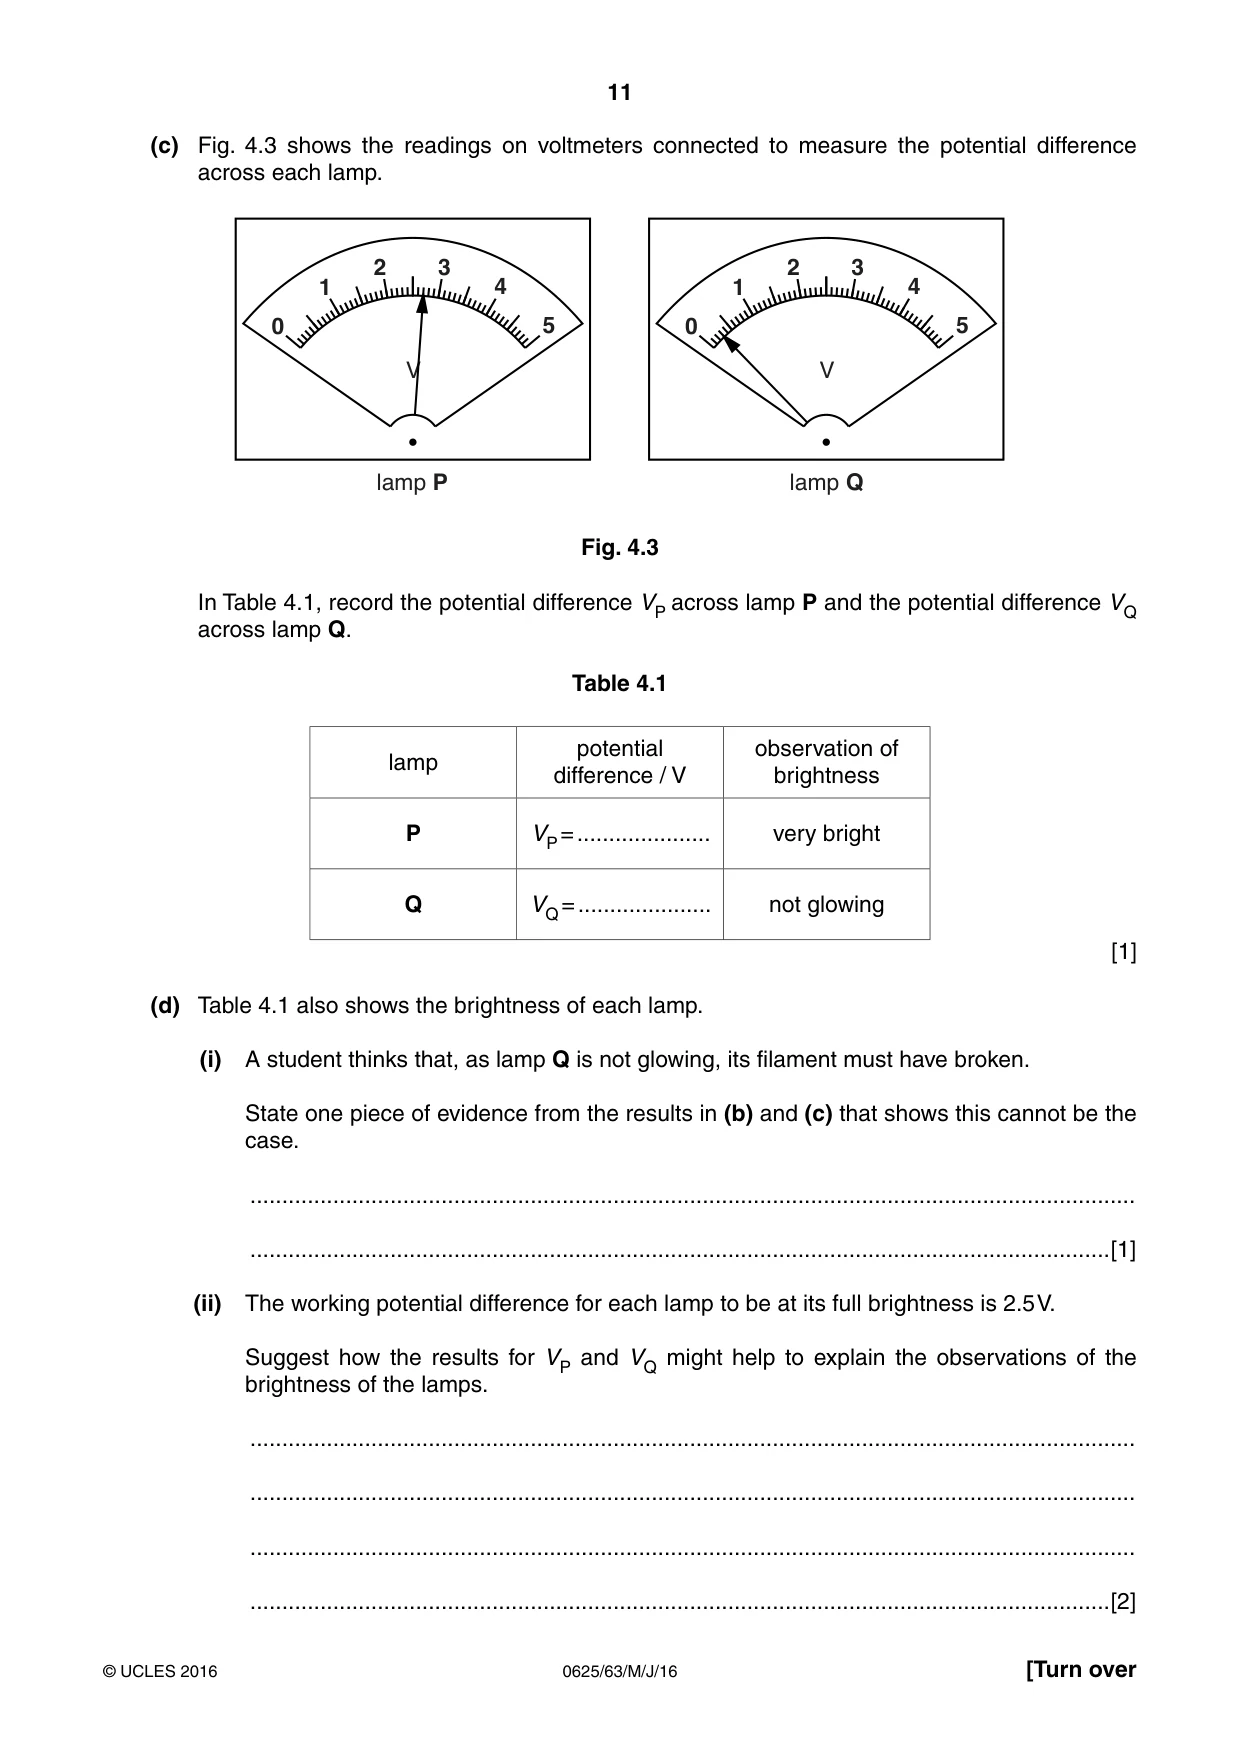
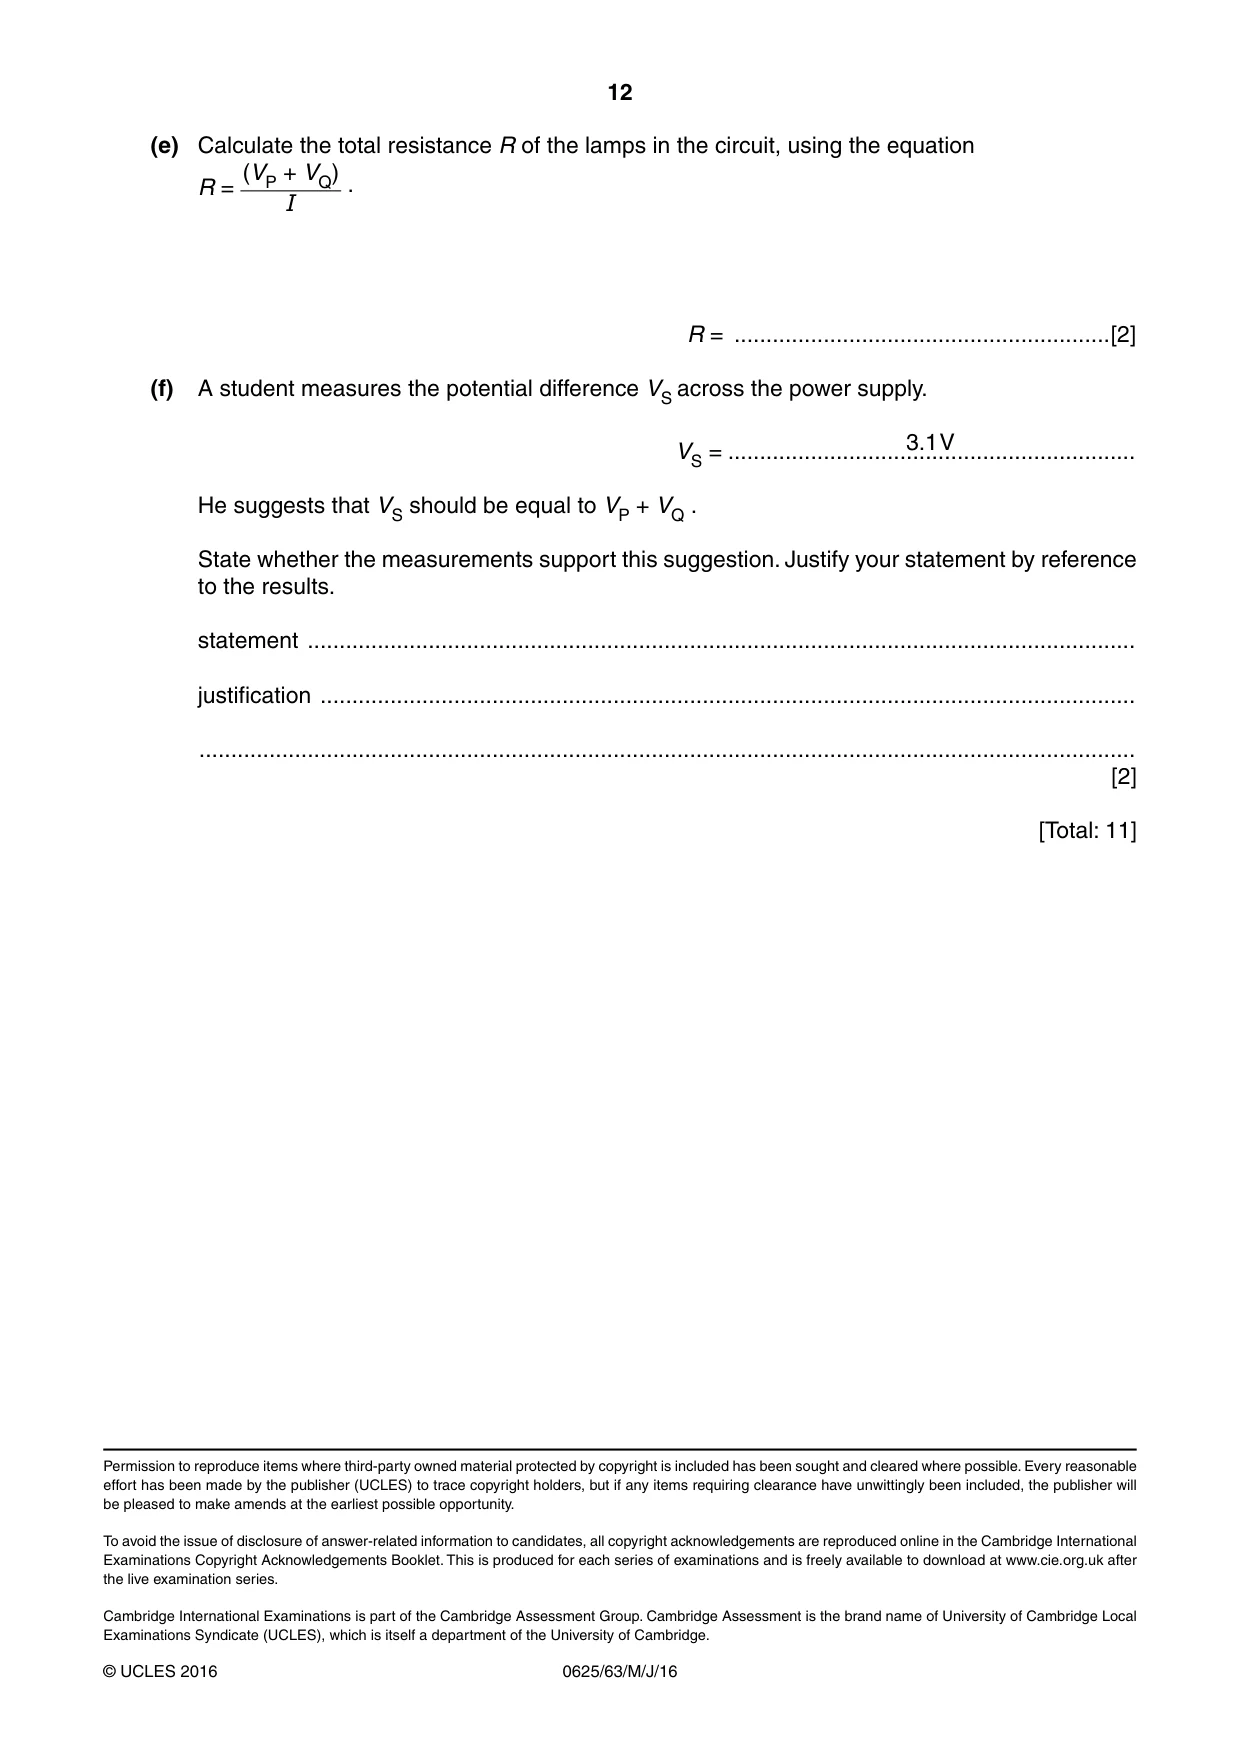
4 The class is investigating a circuit containing two lamps in series. They are using the circuit shown in Fig. 4.1. power supply A P Q Fig. 4.1 (a) On Fig. 4.1, use the standard symbol to show a voltmeter connected to measure the potential difference (p.d.) across lamp P. [1] (b) Record the current I in the circuit, as shown on the ammeter in Fig. 4.2. I = ...........................................................[2] 0.4 0.6 0.2 0.8 0 1.0 A Fig. 4.2 (c) Fig. 4.3 shows the readings on voltmeters connected to measure the potential difference across each lamp. 2 3 2 3 1 4 1 4 0 5 0 5 V V lamp P lamp Q Fig. 4.3 In Table 4.1, record the potential difference VP across lamp P and the potential difference VQ across lamp Q. Table 4.1 potential observation of lamp difference / V brightness P VP = ..................... very bright Q VQ = ..................... not glowing [1] (d) Table 4.1 also shows the brightness of each lamp. (i) A student thinks that, as lamp Q is not glowing, its filament must have broken. State one piece of evidence from the results in (b) and (c) that shows this cannot be the case. ........................................................................................................................................... .......................................................................................................................................[1] (ii) The working potential difference for each lamp to be at its full brightness is 2.5 V. Suggest how the results for VP and VQ might help to explain the observations of the brightness of the lamps. ........................................................................................................................................... ........................................................................................................................................... ........................................................................................................................................... .......................................................................................................................................[2] (e) Calculate the total resistance R of the lamps in the circuit, using the equation (VP + VQ) . R = I R = ...........................................................[2] (f) A student measures the potential difference VS across the power supply. 3.1 V VS = ................................................................ He suggests that VS should be equal to VP + VQ . State whether the measurements support this suggestion. Justify your statement by reference to the results. statement .................................................................................................................................. justification ................................................................................................................................ ................................................................................................................................................... [2] [Total: 11]
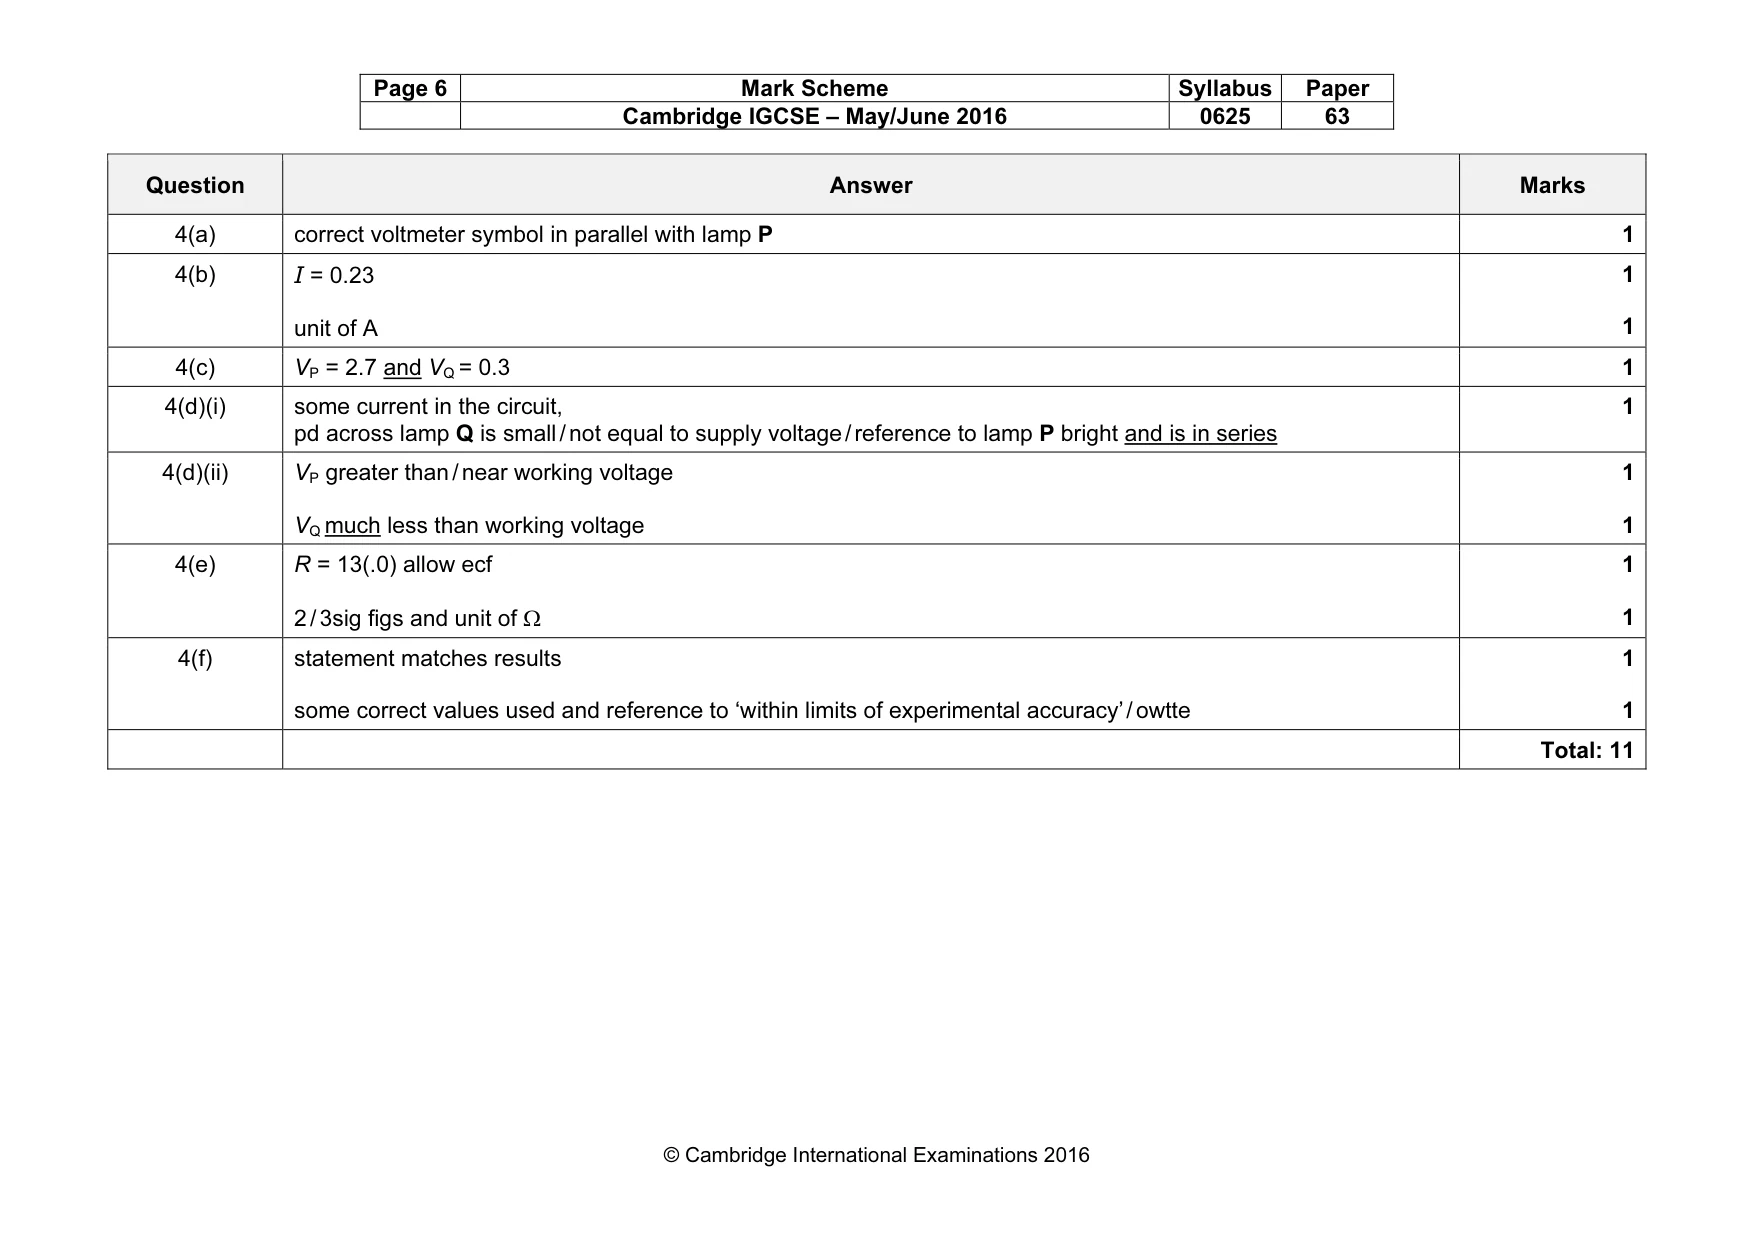
Mark scheme: 4(a) correct voltmeter symbol in parallel with lamp P 1 4(b) I = 0.23 unit of A 1 1 4(c) VP = 2.7 and VQ = 0.3 1 4(d)(i) some current in the circuit, pd across lamp Q is small / not equal to supply voltage / reference to lamp P bright and is in series 1 4(d)(ii) VP greater than / near working voltage VQ much less than working voltage 1 1 4(e) R = 13(.0) allow ecf 2 / 3sig figs and unit of Ω 1 1 4(f) statement matches results some correct values used and reference to ‘within limits of experimental accuracy’ / owtte 1 1 Total: 11
What was in this paper
The subtopics covered by these 3 questions, and how many questions each got. Open one in a new tab to see every Cambridge question on it.
What you needed in this session
Cambridge’s own grade thresholds for 2016 May/June, Paper 6 · Variant 3. A higher threshold means an easier paper — the bar moves with how the cohort did.