Cambridge IGCSE Physics 0625 — 2023 May/June Paper 6 · Variant 3
0625/63/M/J/23 · 4 questions · 40 marks · ≈45 min
The question paper and its mark scheme, free to read here and free to download. This is Cambridge’s own paper, exactly as it was sat.
Question paper16 pages
Mark scheme9 pages
Answers below. Sit the paper first if you are practising.
Questions as text
Q1 · A student determines the mass MR of a metre ruler by a balancing method
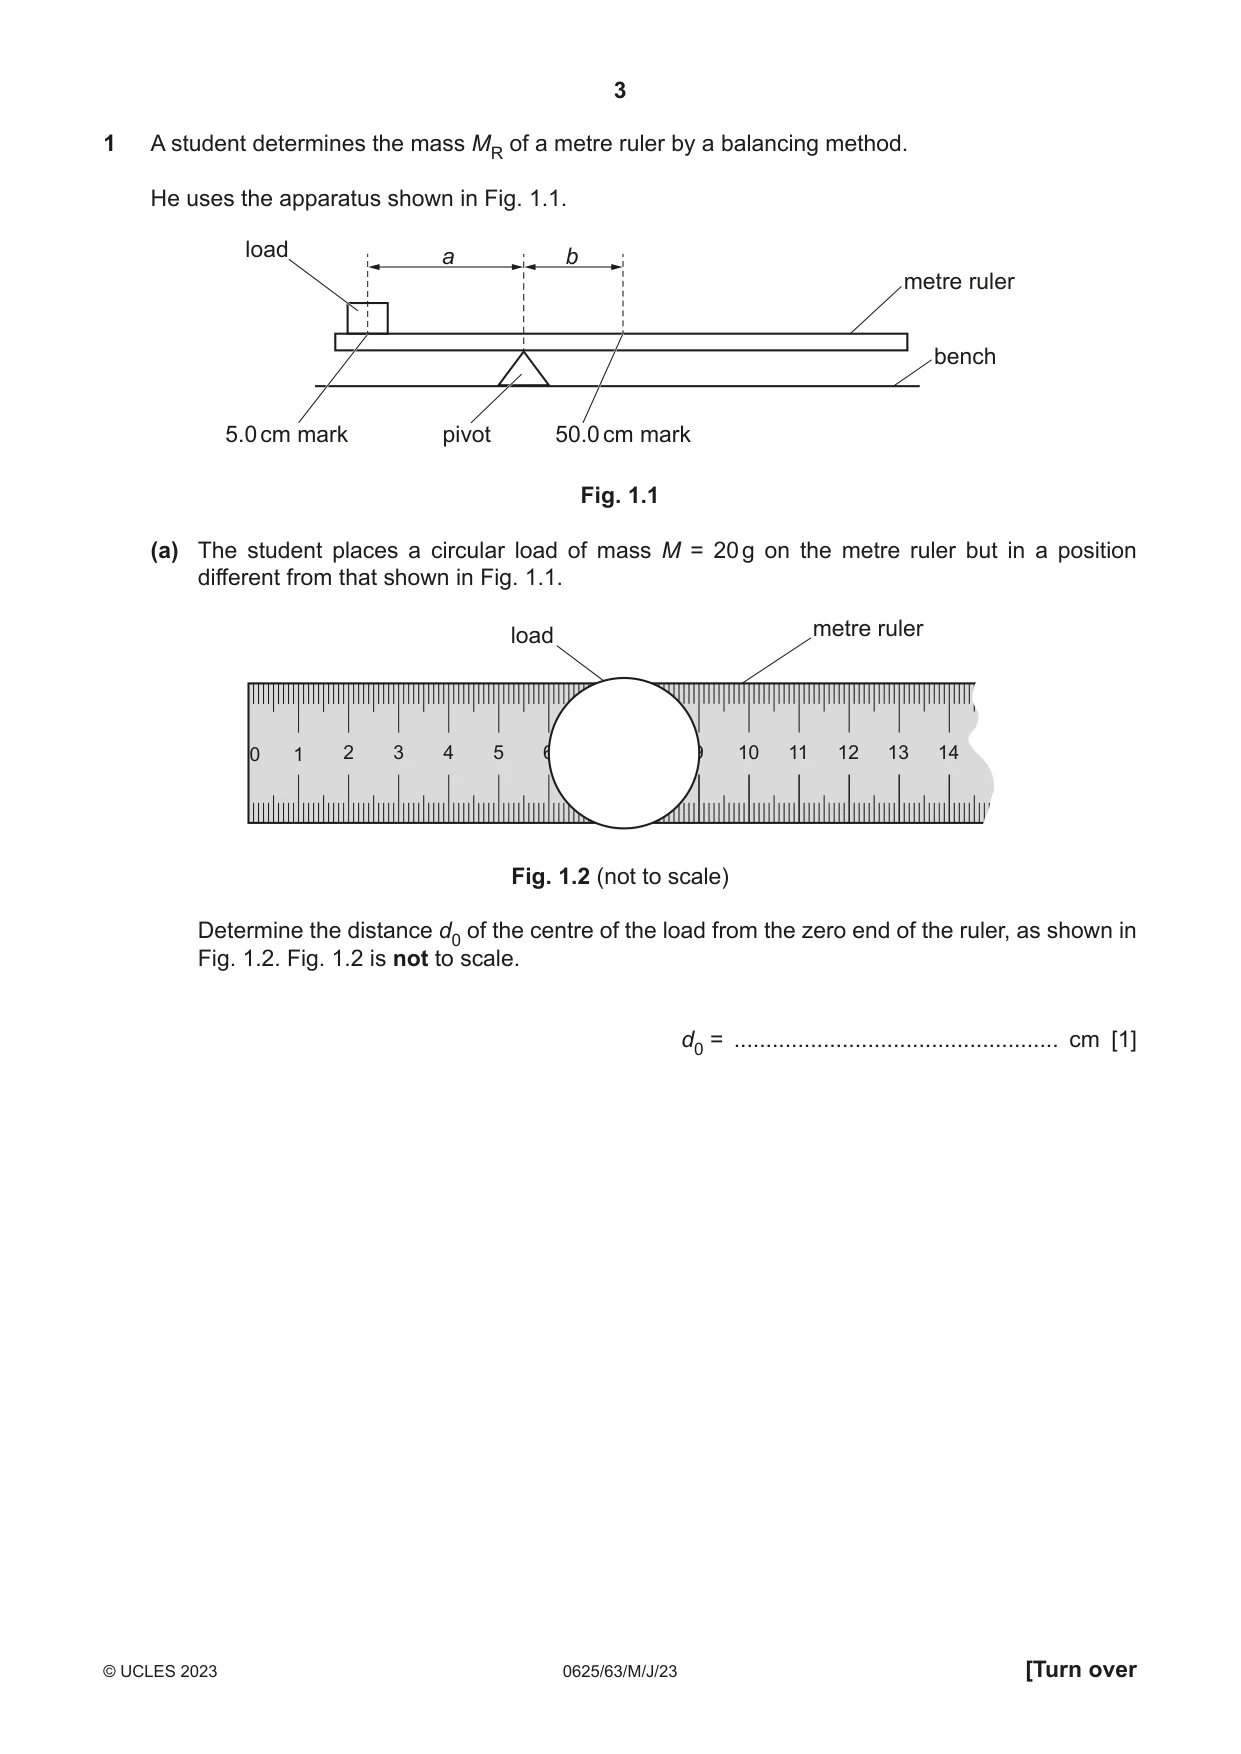
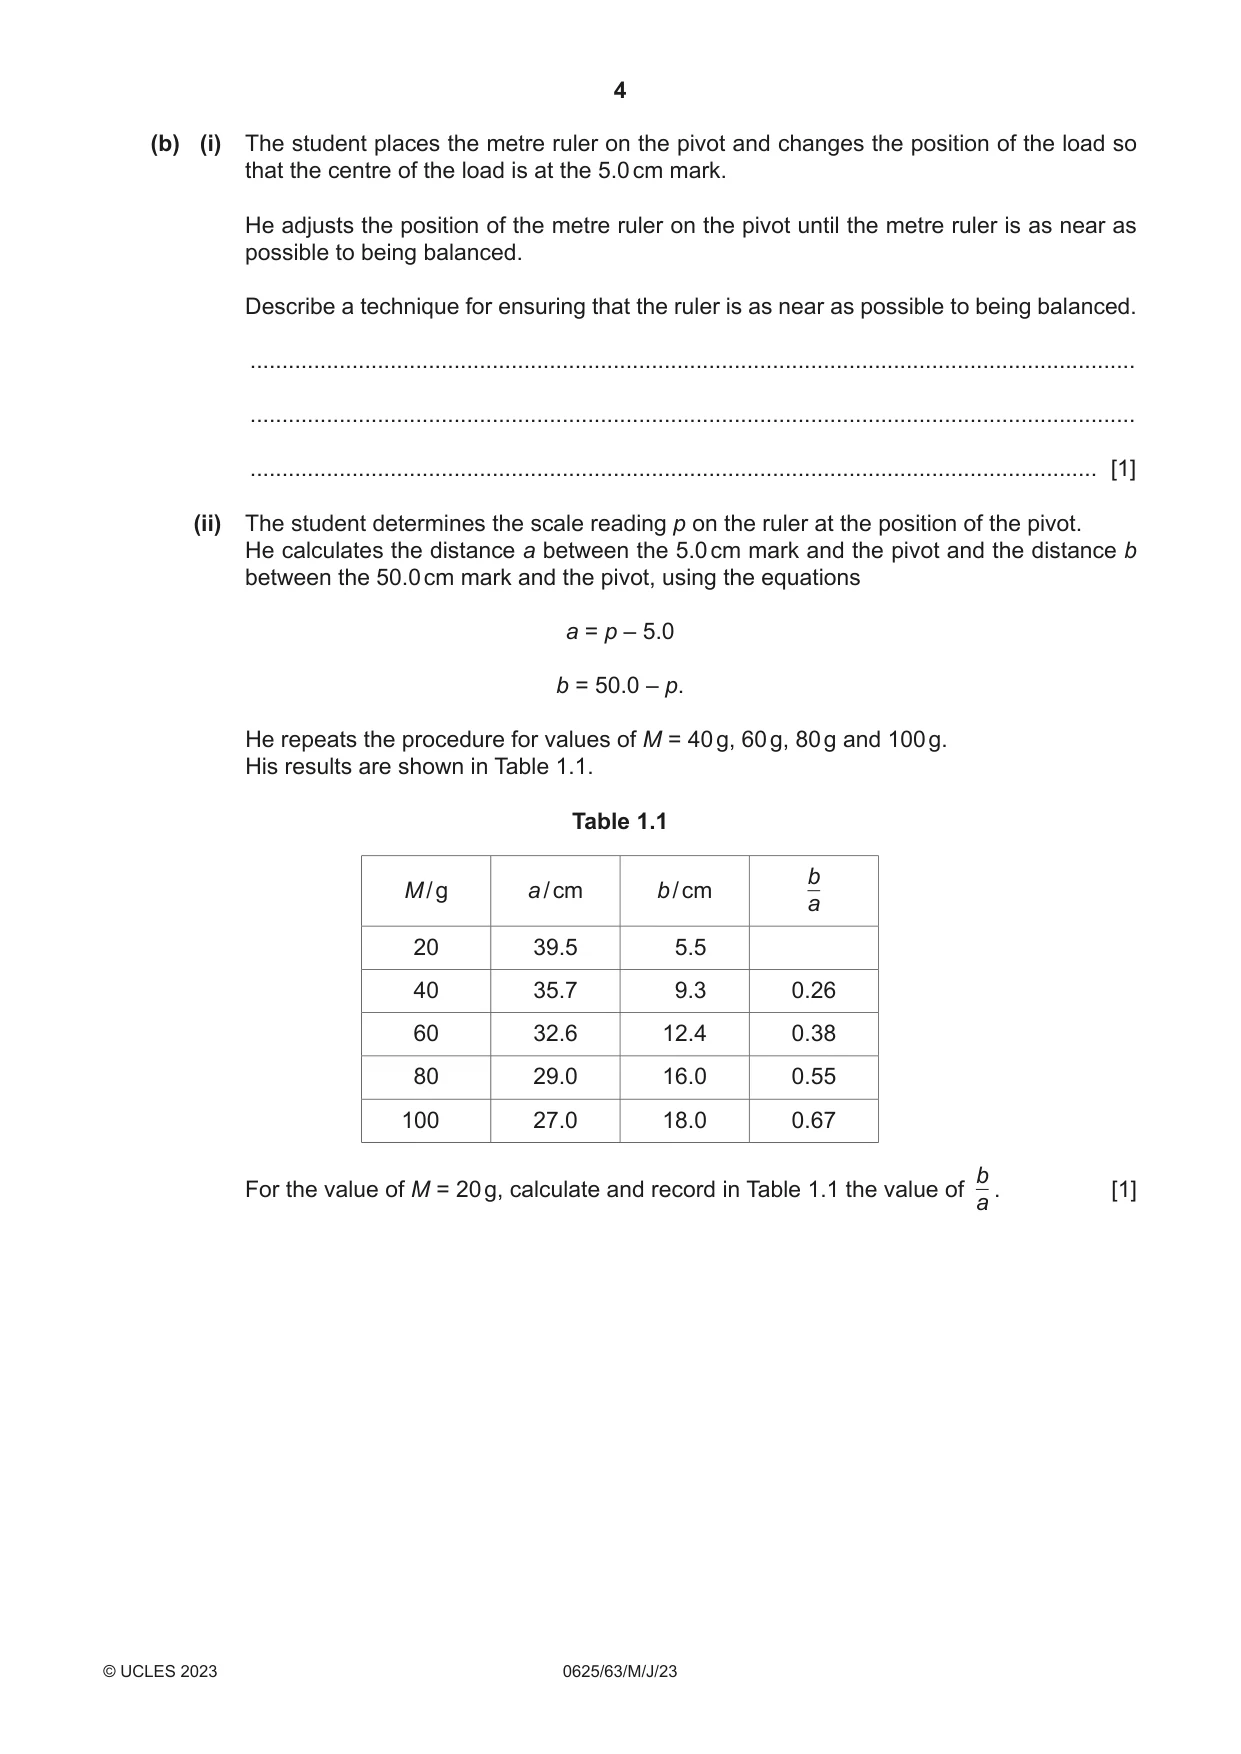
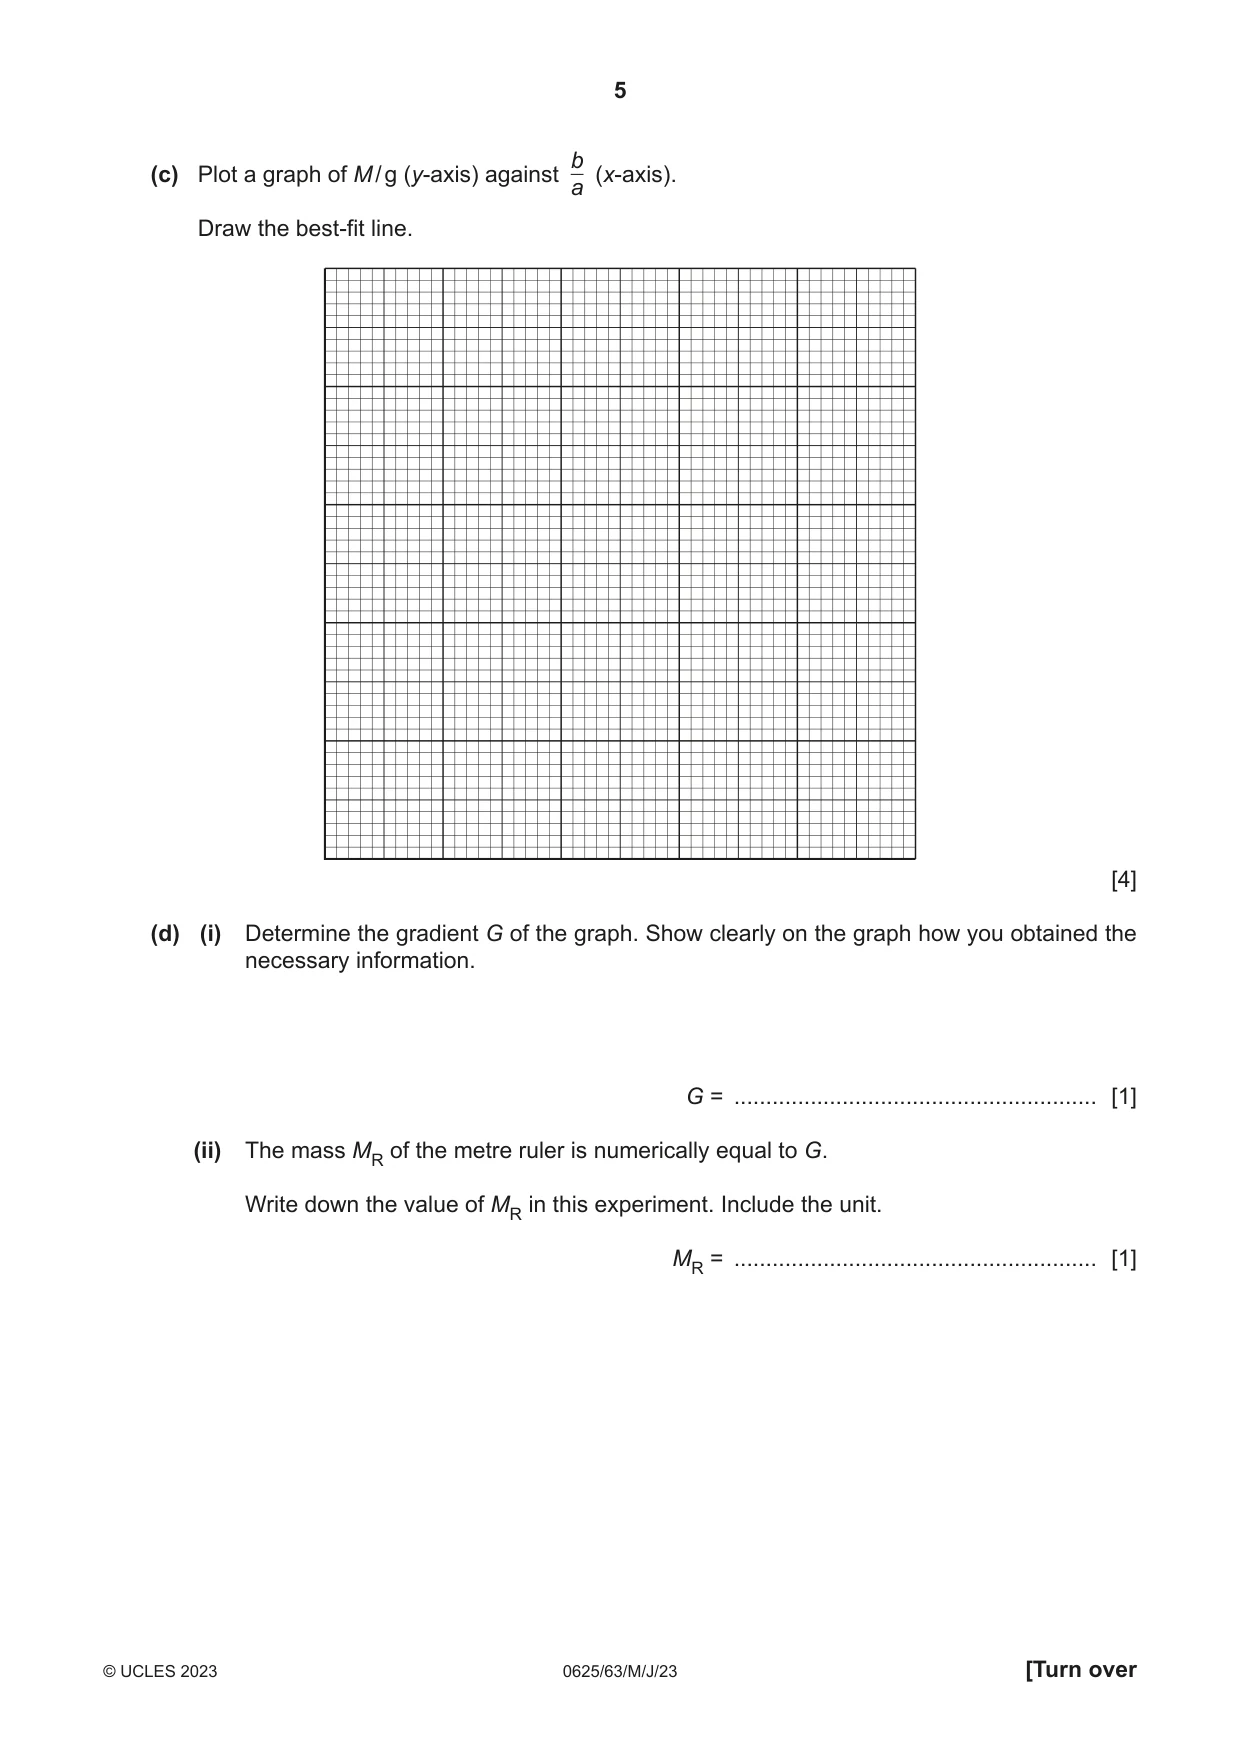
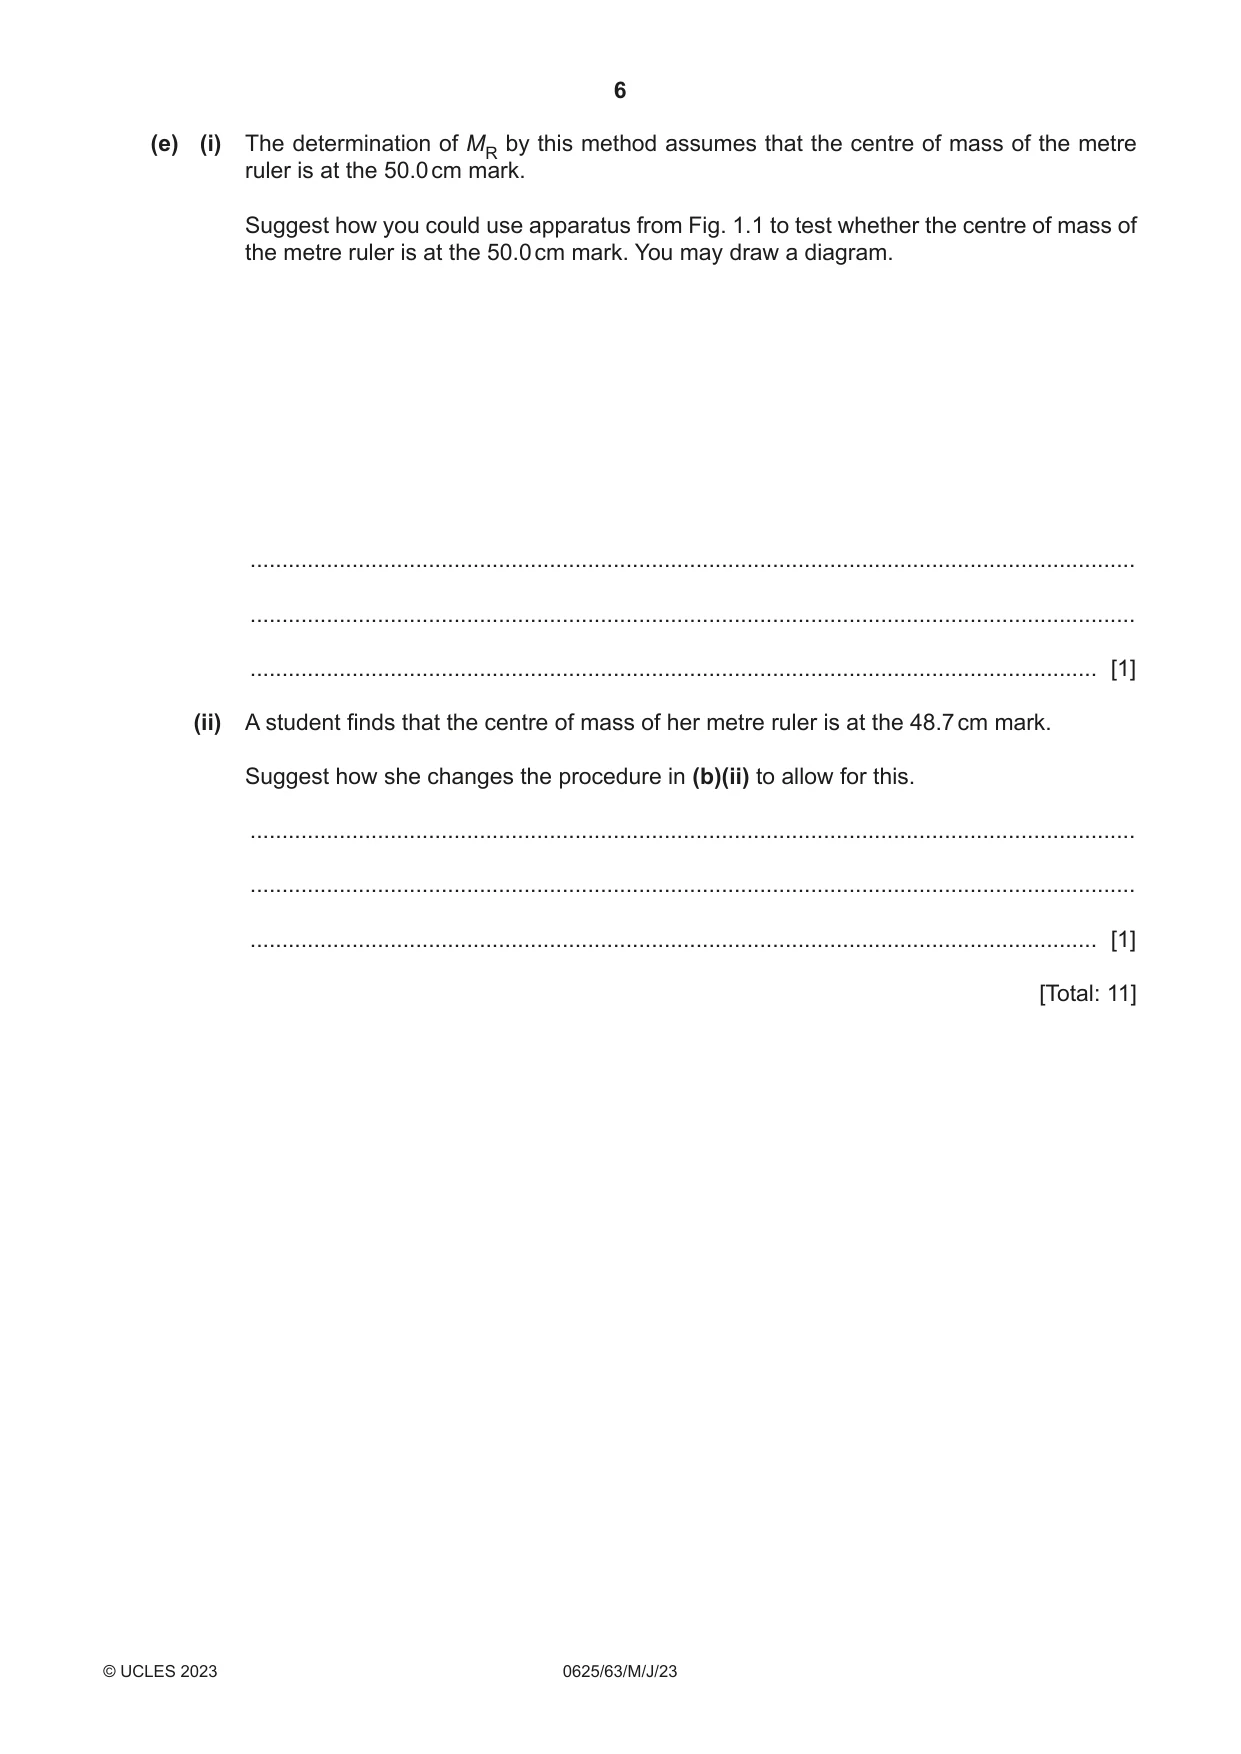
1 A student determines the mass MR of a metre ruler by a balancing method. He uses the apparatus shown in Fig. 1.1. load a b metre ruler bench 5.0 cm mark pivot 50.0 cm mark Fig. 1.1 (a) The student places a circular load of mass M = 20 g on the metre ruler but in a position different from that shown in Fig. 1.1. metre ruler load 0 1 2 3 4 5 6 7 8 9 10 11 12 13 14 1 Fig. 1.2 (not to scale) Determine the distance d0 of the centre of the load from the zero end of the ruler, as shown in Fig. 1.2. Fig. 1.2 is not to scale. d0 = ................................................... cm [1] (b) (i) The student places the metre ruler on the pivot and changes the position of the load so that the centre of the load is at the 5.0 cm mark. He adjusts the position of the metre ruler on the pivot until the metre ruler is as near as possible to being balanced. Describe a technique for ensuring that the ruler is as near as possible to being balanced. ........................................................................................................................................... ........................................................................................................................................... ..................................................................................................................................... [1] (ii) The student determines the scale reading p on the ruler at the position of the pivot. He calculates the distance a between the 5.0 cm mark and the pivot and the distance b between the 50.0 cm mark and the pivot, using the equations a = p – 5.0 b = 50.0 – p. He repeats the procedure for values of M = 40 g, 60 g, 80 g and 100 g. His results are shown in Table 1.1. Table 1.1 b M / g a / cm b / cm a 20 39.5 5.5 40 35.7 9.3 0.26 60 32.6 12.4 0.38 80 29.0 16.0 0.55 100 27.0 18.0 0.67 b For the value of M = 20 g, calculate and record in Table 1.1 the value of . [1] a b(c) Plot a graph of M / g (y-axis) against (x-axis). a Draw the best-fit line. [4] (d) (i) Determine the gradient G of the graph. Show clearly on the graph how you obtained the necessary information. G = ......................................................... [1] (ii) The mass MR of the metre ruler is numerically equal to G. Write down the value of MR in this experiment. Include the unit. MR = ......................................................... [1] (e) (i) The determination of MR by this method assumes that the centre of mass of the metre ruler is at the 50.0 cm mark. Suggest how you could use apparatus from Fig. 1.1 to test whether the centre of mass of the metre ruler is at the 50.0 cm mark. You may draw a diagram. ........................................................................................................................................... ........................................................................................................................................... ..................................................................................................................................... [1] (ii) A student finds that the centre of mass of her metre ruler is at the 48.7 cm mark. Suggest how she changes the procedure in (b)(ii) to allow for this. ........................................................................................................................................... ........................................................................................................................................... ..................................................................................................................................... [1] [Total: 11]
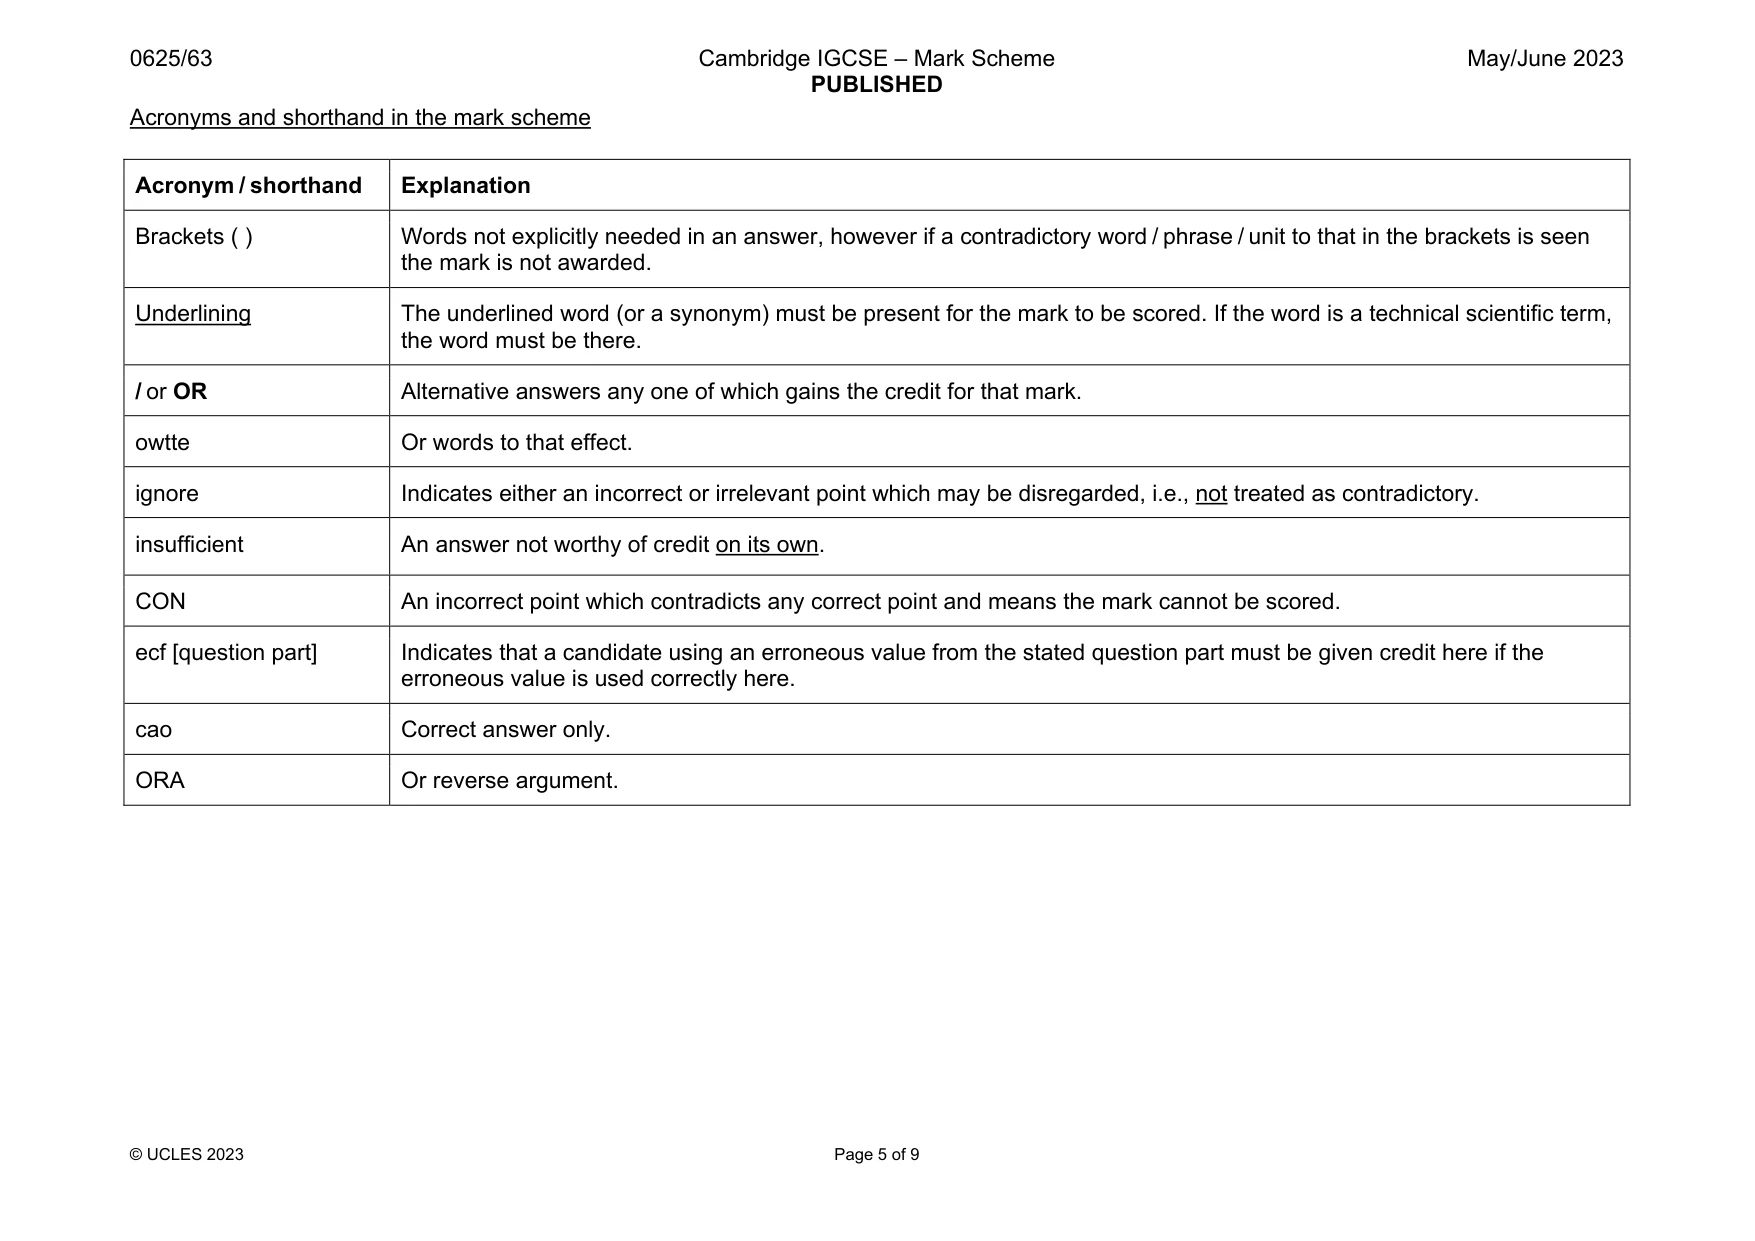
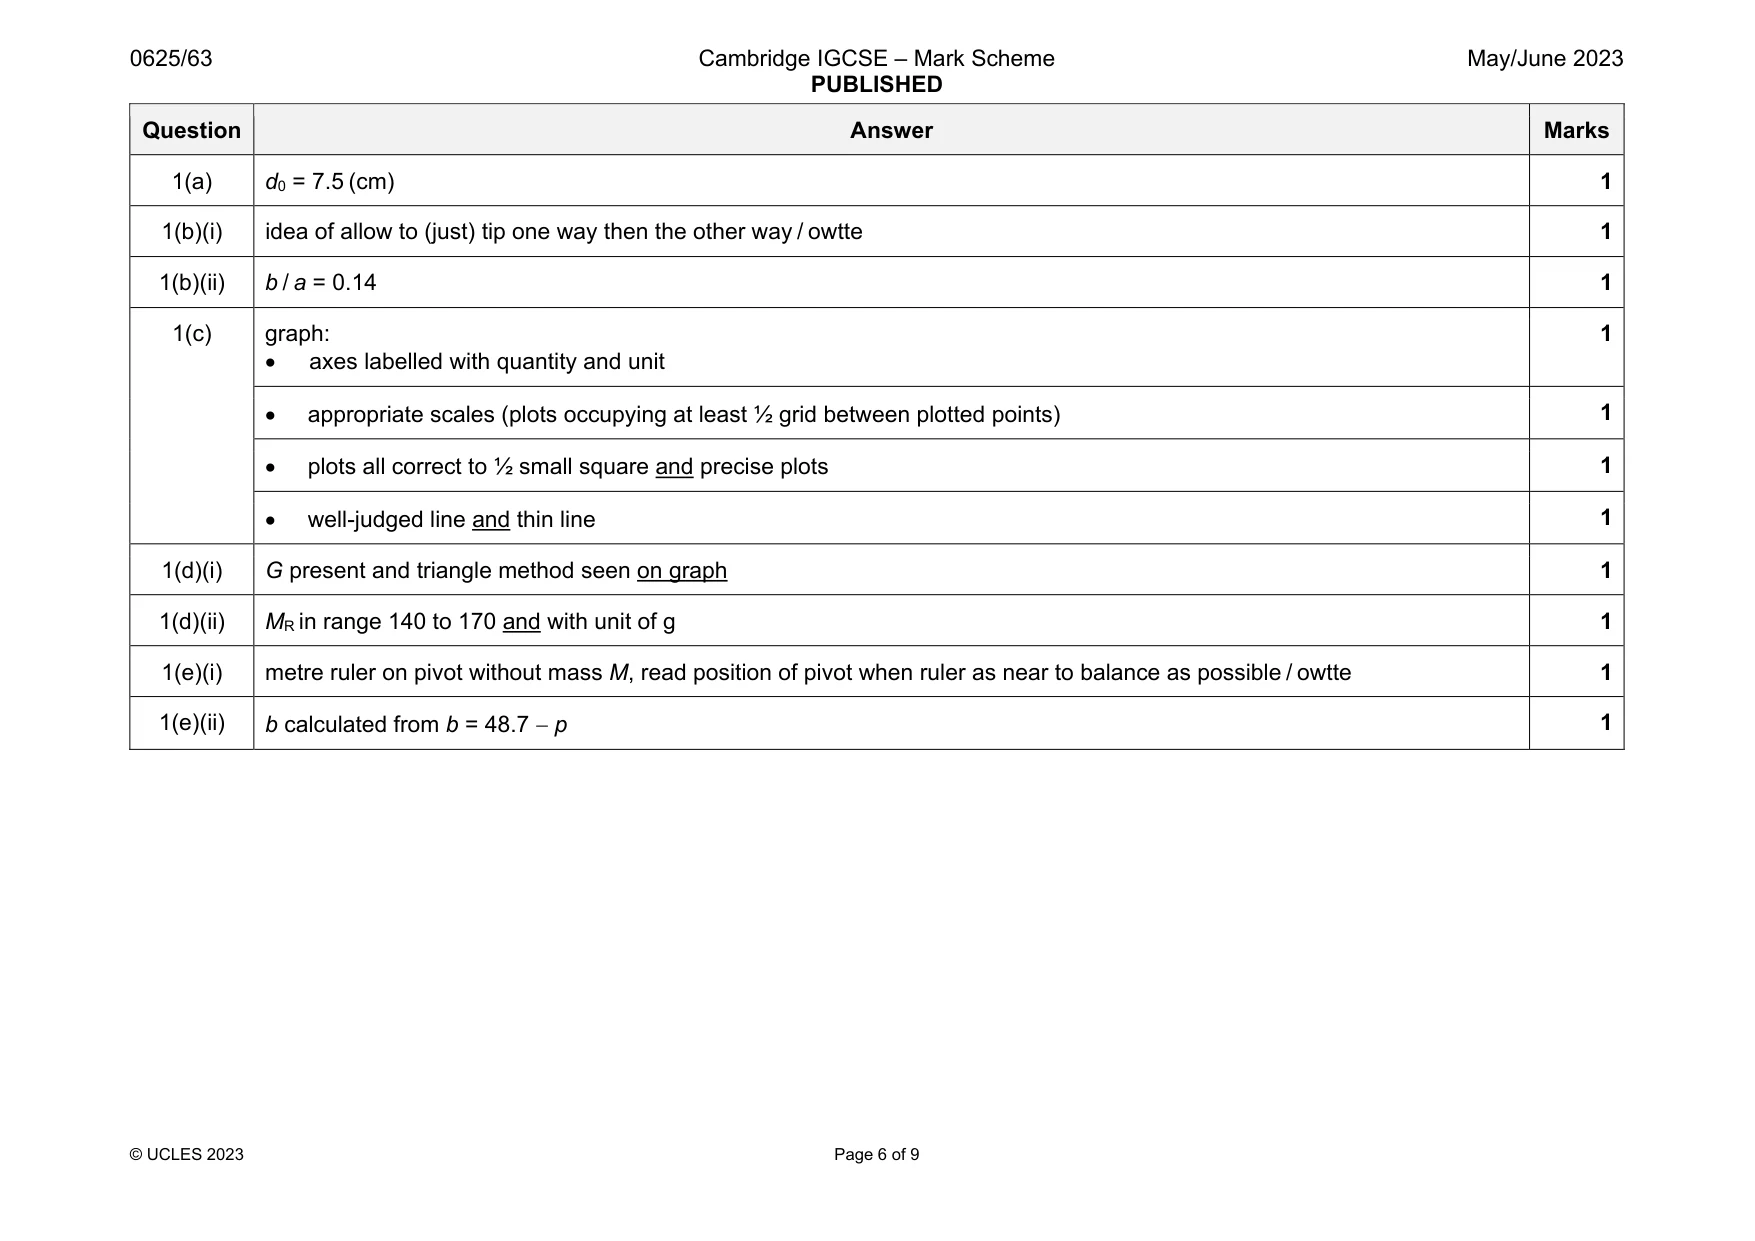
Mark scheme: 1(a) d0 = 7.5 (cm) 1 1(b)(i) idea of allow to (just) tip one way then the other way / owtte 1 1(b)(ii) b / a = 0.14 1 1(c) graph: axes labelled with quantity and unit 1 appropriate scales (plots occupying at least ½ grid between plotted points) 1 plots all correct to ½ small square and precise plots 1 well-judged line and thin line 1 1(d)(i) G present and triangle method seen on graph 1 1(d)(ii) MR in range 140 to 170 and with unit of g 1 1(e)(i) metre ruler on pivot without mass M, read position of pivot when ruler as near to balance as possible / owtte 1 1(e)(ii) b calculated from b = 48.7 p 1
Q2 · A student investigates a circuit containing different combinations of resistors
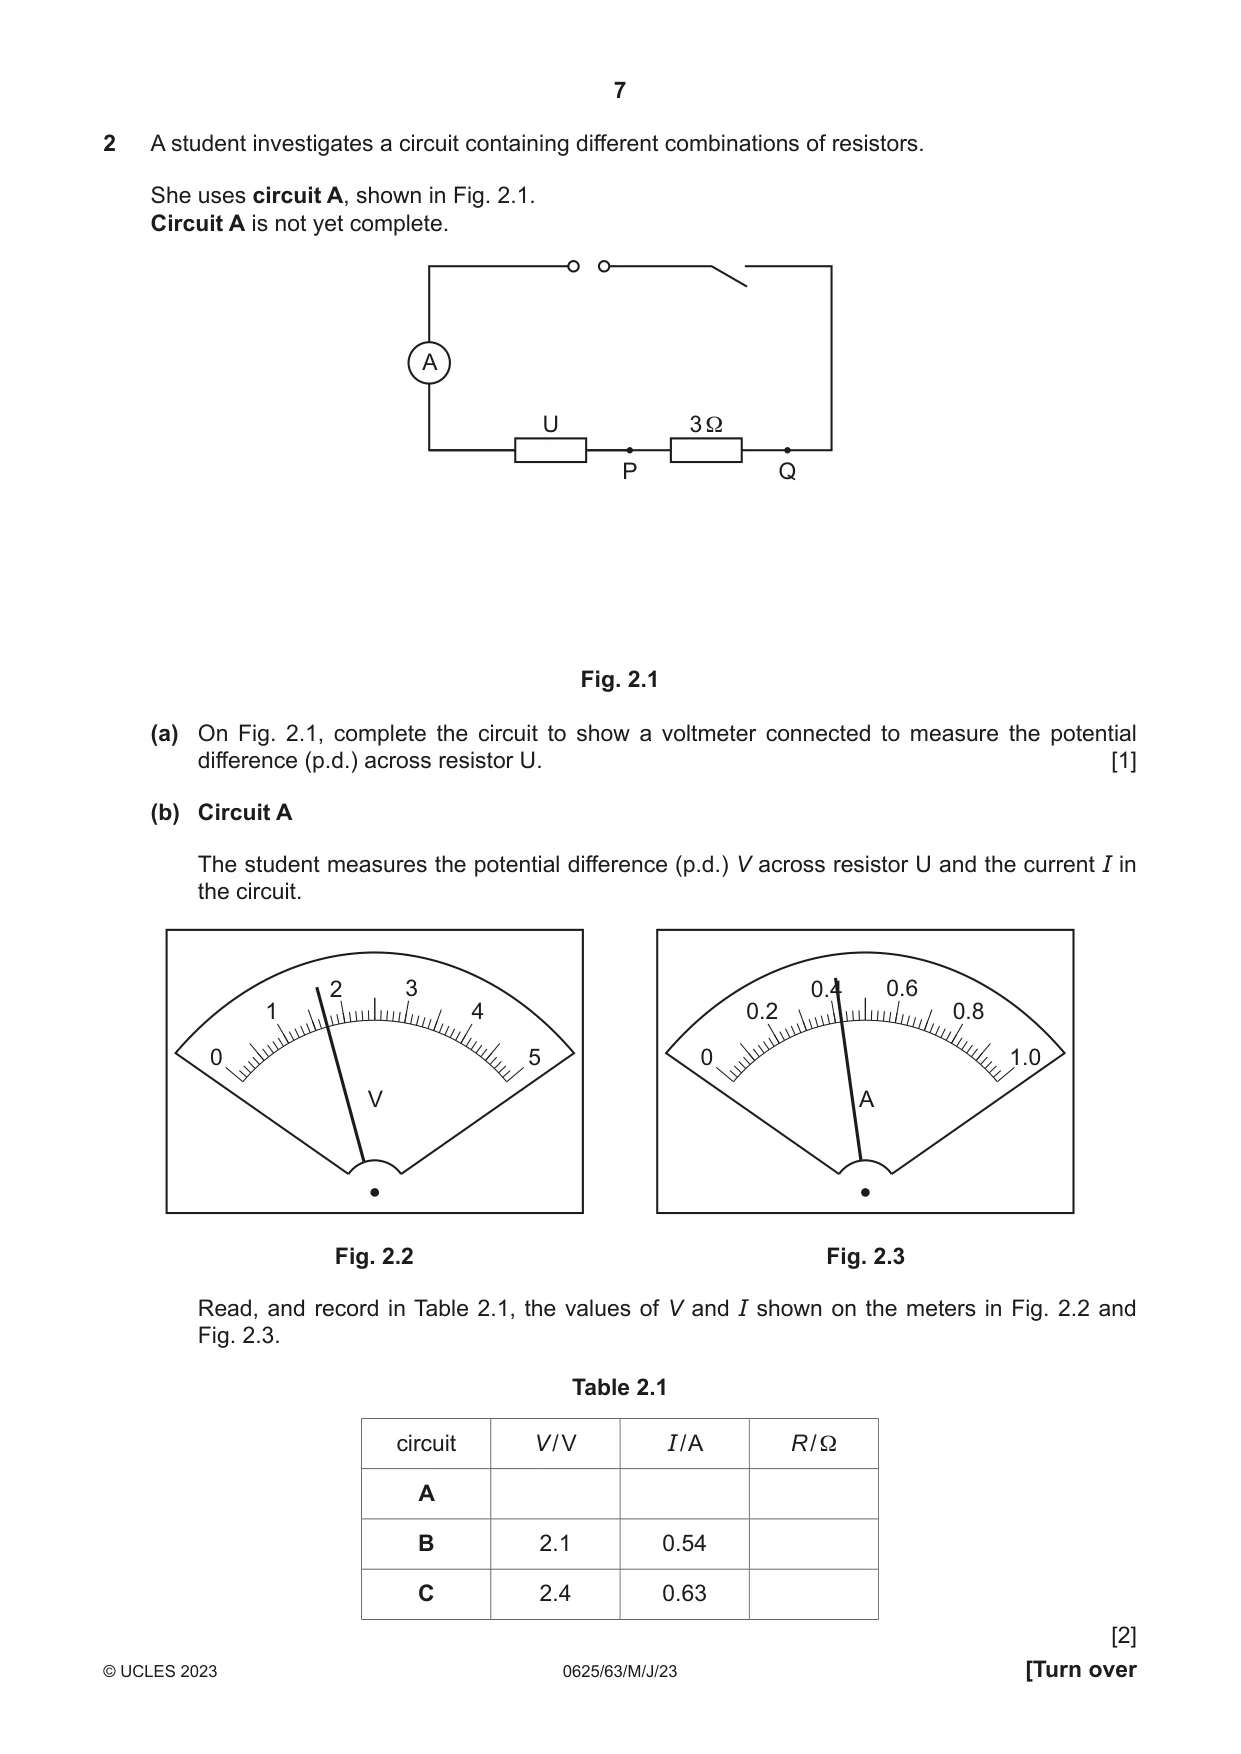
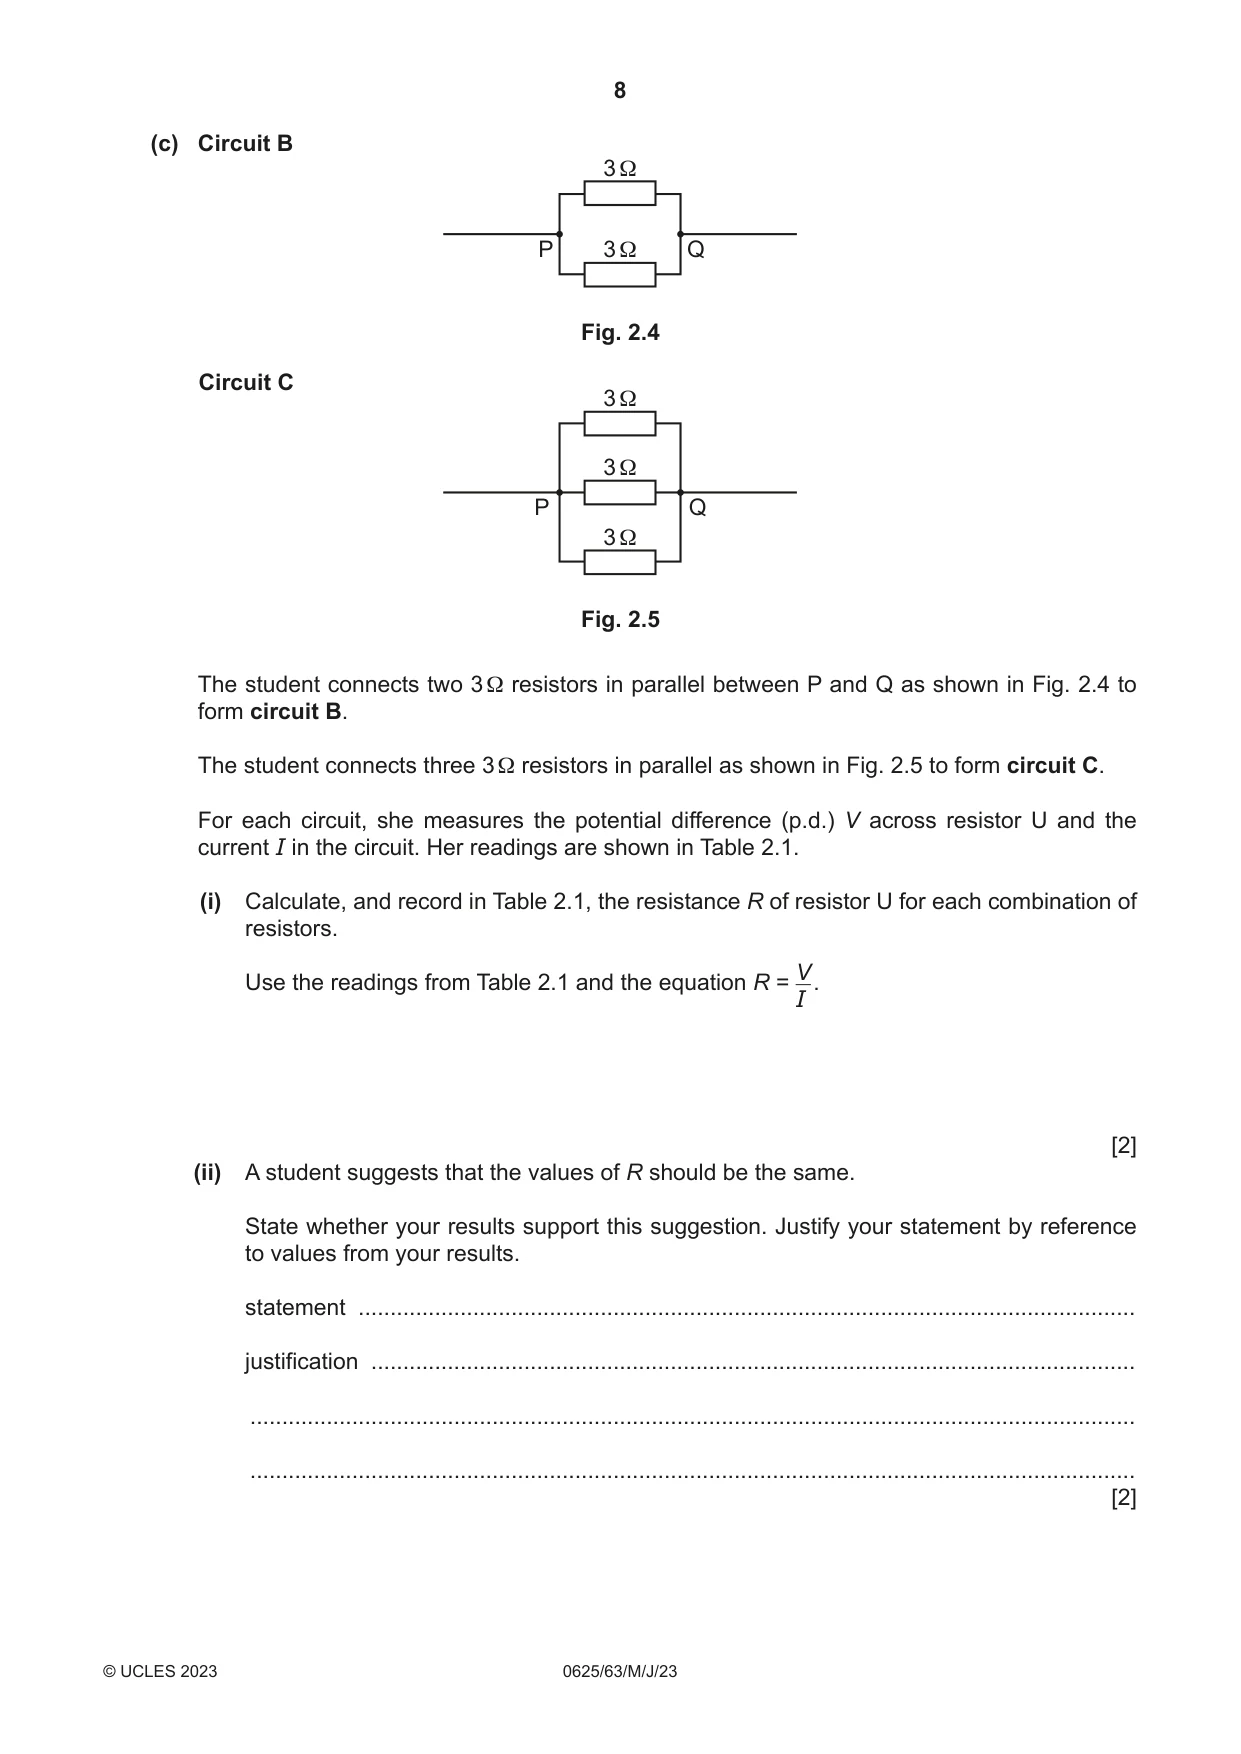
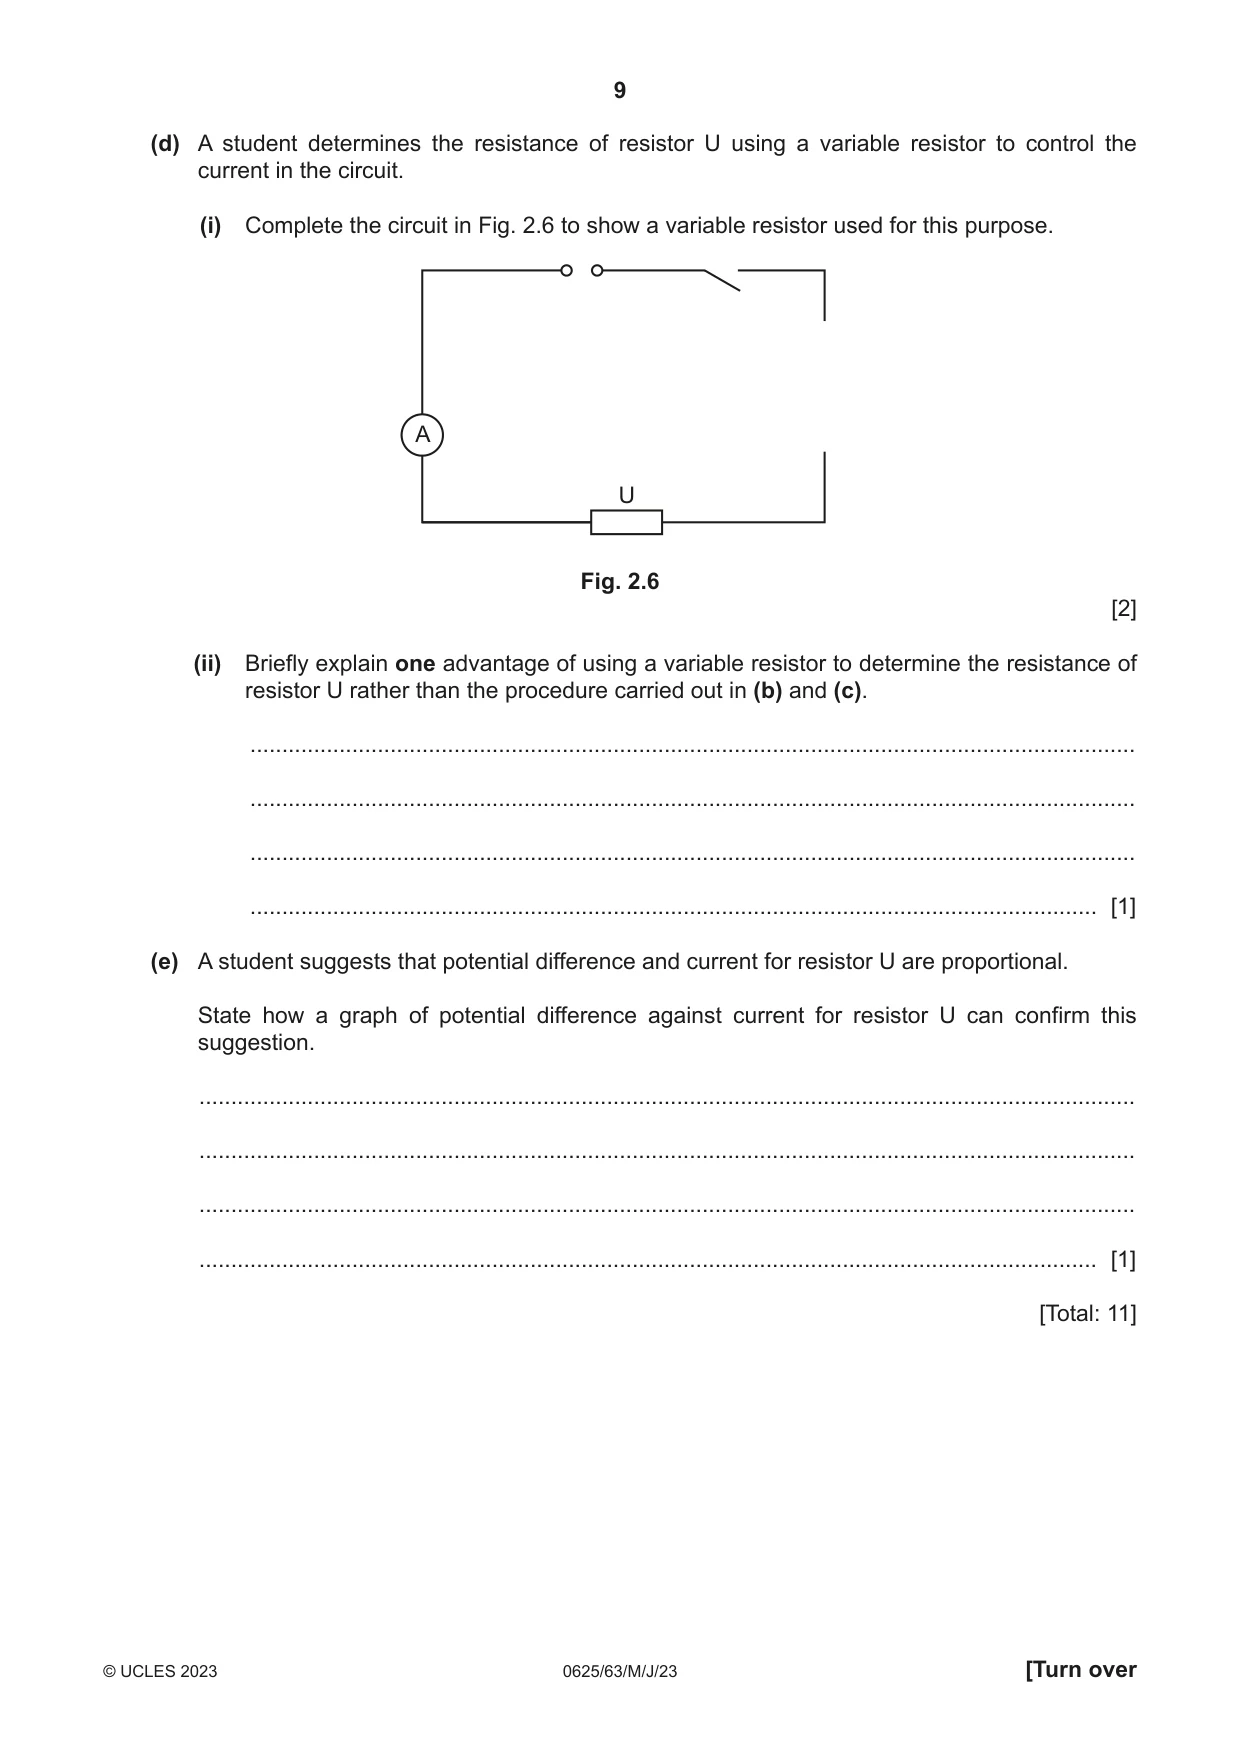
2 A student investigates a circuit containing different combinations of resistors. She uses circuit A, shown in Fig. 2.1. Circuit A is not yet complete. A U 3 Ω P Q Fig. 2.1 (a) On Fig. 2.1, complete the circuit to show a voltmeter connected to measure the potential difference (p.d.) across resistor U. [1] (b) Circuit A The student measures the potential difference (p.d.) V across resistor U and the current I in the circuit. 2 3 0.4 0.6 1 4 0.2 0.8 0 5 0 1.0 V A Fig. 2.2 Fig. 2.3 Read, and record in Table 2.1, the values of V and I shown on the meters in Fig. 2.2 and Fig. 2.3. Table 2.1 circuit V / V I / A R / Ω A B 2.1 0.54 C 2.4 0.63 [2] (c) Circuit B 3 Ω P 3 Ω Q Fig. 2.4 Circuit C 3 Ω 3 Ω P Q 3 Ω Fig. 2.5 The student connects two 3 Ω resistors in parallel between P and Q as shown in Fig. 2.4 to form circuit B. The student connects three 3 Ω resistors in parallel as shown in Fig. 2.5 to form circuit C. For each circuit, she measures the potential difference (p.d.) V across resistor U and the current I in the circuit. Her readings are shown in Table 2.1. (i) Calculate, and record in Table 2.1, the resistance R of resistor U for each combination of resistors. V Use the readings from Table 2.1 and the equation R = . I [2] (ii) A student suggests that the values of R should be the same. State whether your results support this suggestion. Justify your statement by reference to values from your results. statement .......................................................................................................................... justification ........................................................................................................................ ........................................................................................................................................... ........................................................................................................................................... [2] (d) A student determines the resistance of resistor U using a variable resistor to control the current in the circuit. (i) Complete the circuit in Fig. 2.6 to show a variable resistor used for this purpose. A U Fig. 2.6 [2] (ii) Briefly explain one advantage of using a variable resistor to determine the resistance of resistor U rather than the procedure carried out in (b) and (c). ........................................................................................................................................... ........................................................................................................................................... ........................................................................................................................................... ..................................................................................................................................... [1] (e) A student suggests that potential difference and current for resistor U are proportional. State how a graph of potential difference against current for resistor U can confirm this suggestion. ................................................................................................................................................... ................................................................................................................................................... ................................................................................................................................................... ............................................................................................................................................. [1] [Total: 11]
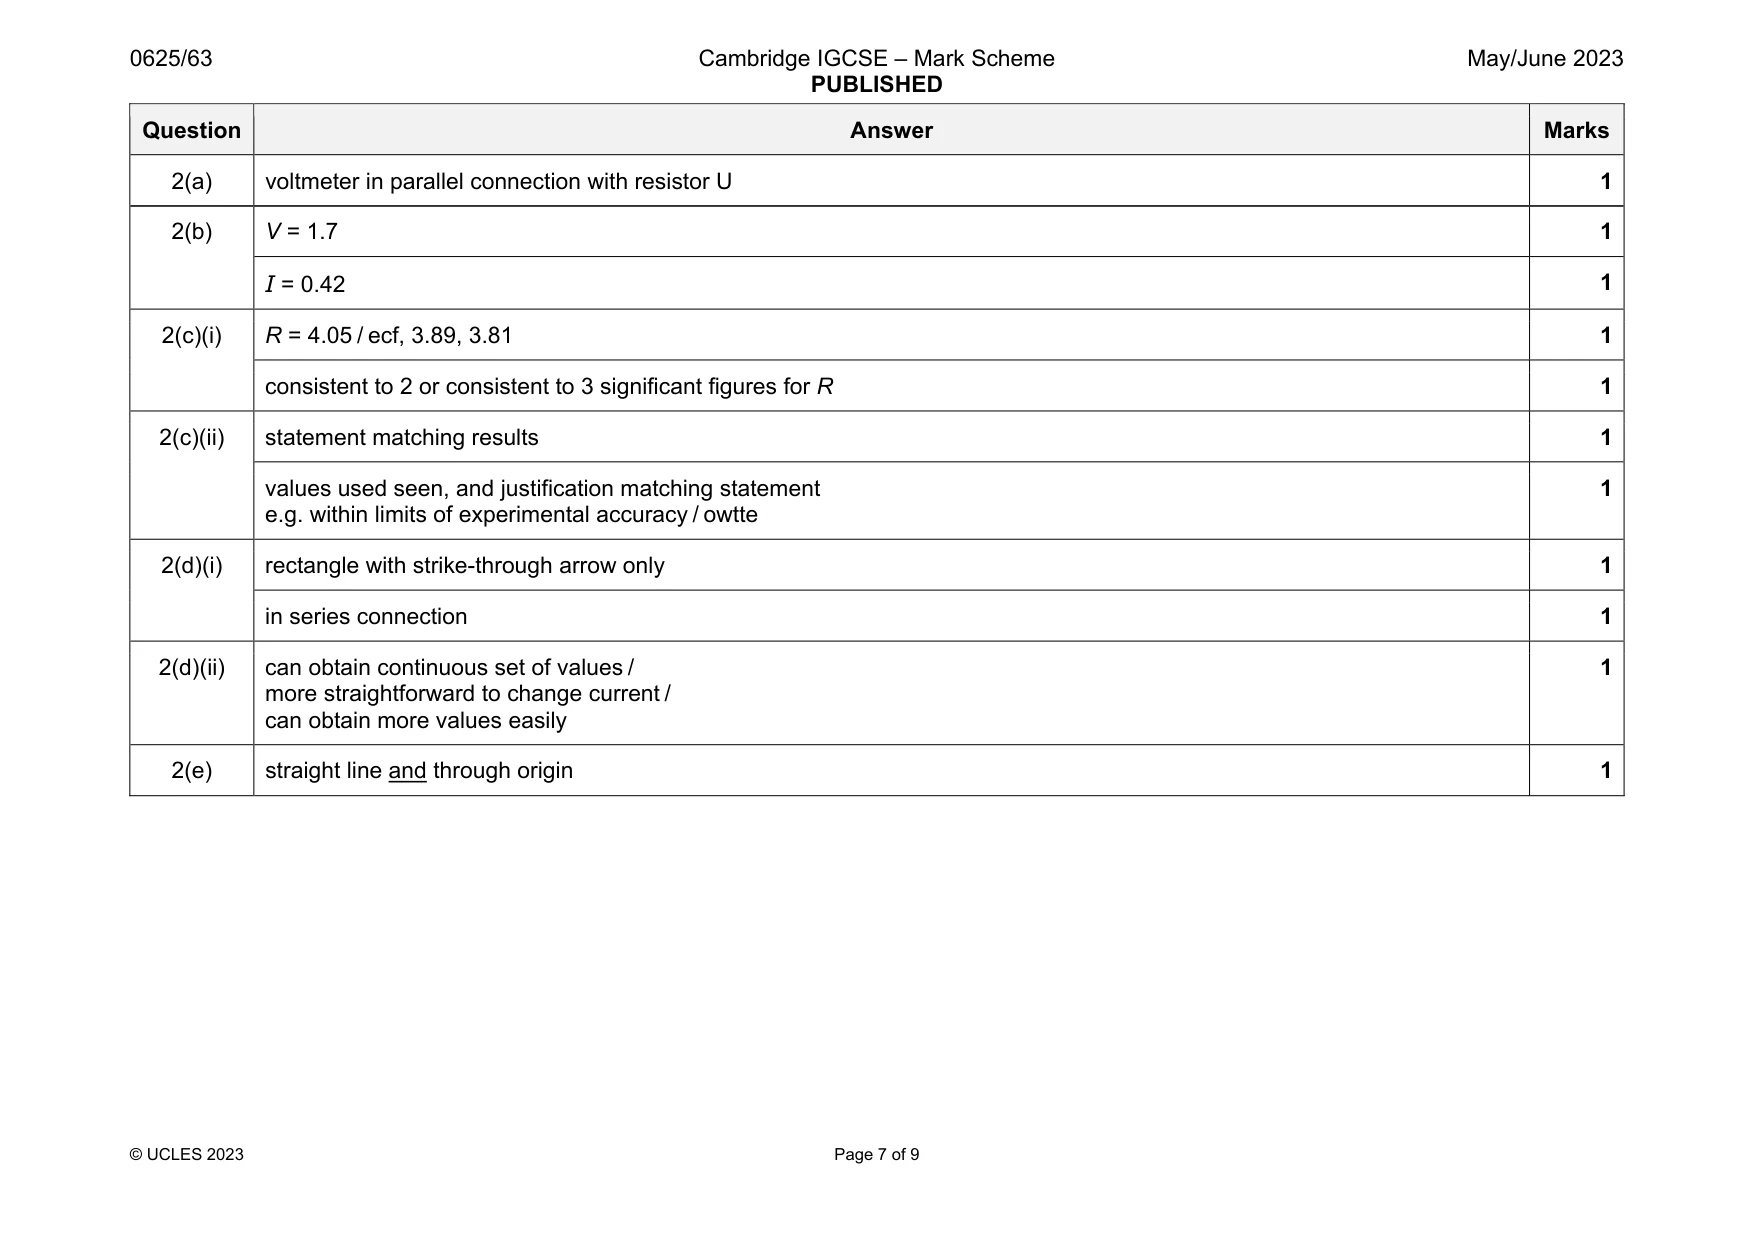
Mark scheme: 2(a) voltmeter in parallel connection with resistor U 1 2(b) V = 1.7 1 I = 0.42 1 2(c)(i) R = 4.05 / ecf, 3.89, 3.81 1 consistent to 2 or consistent to 3 significant figures for R 1 2(c)(ii) statement matching results 1 values used seen, and justification matching statement e.g. within limits of experimental accuracy / owtte 1 2(d)(i) rectangle with strike-through arrow only 1 in series connection 1 2(d)(ii) can obtain continuous set of values / more straightforward to change current / can obtain more values easily 1 2(e) straight line and through origin 1
Q3 · A student investigates the reflection of light by two plane mirrors
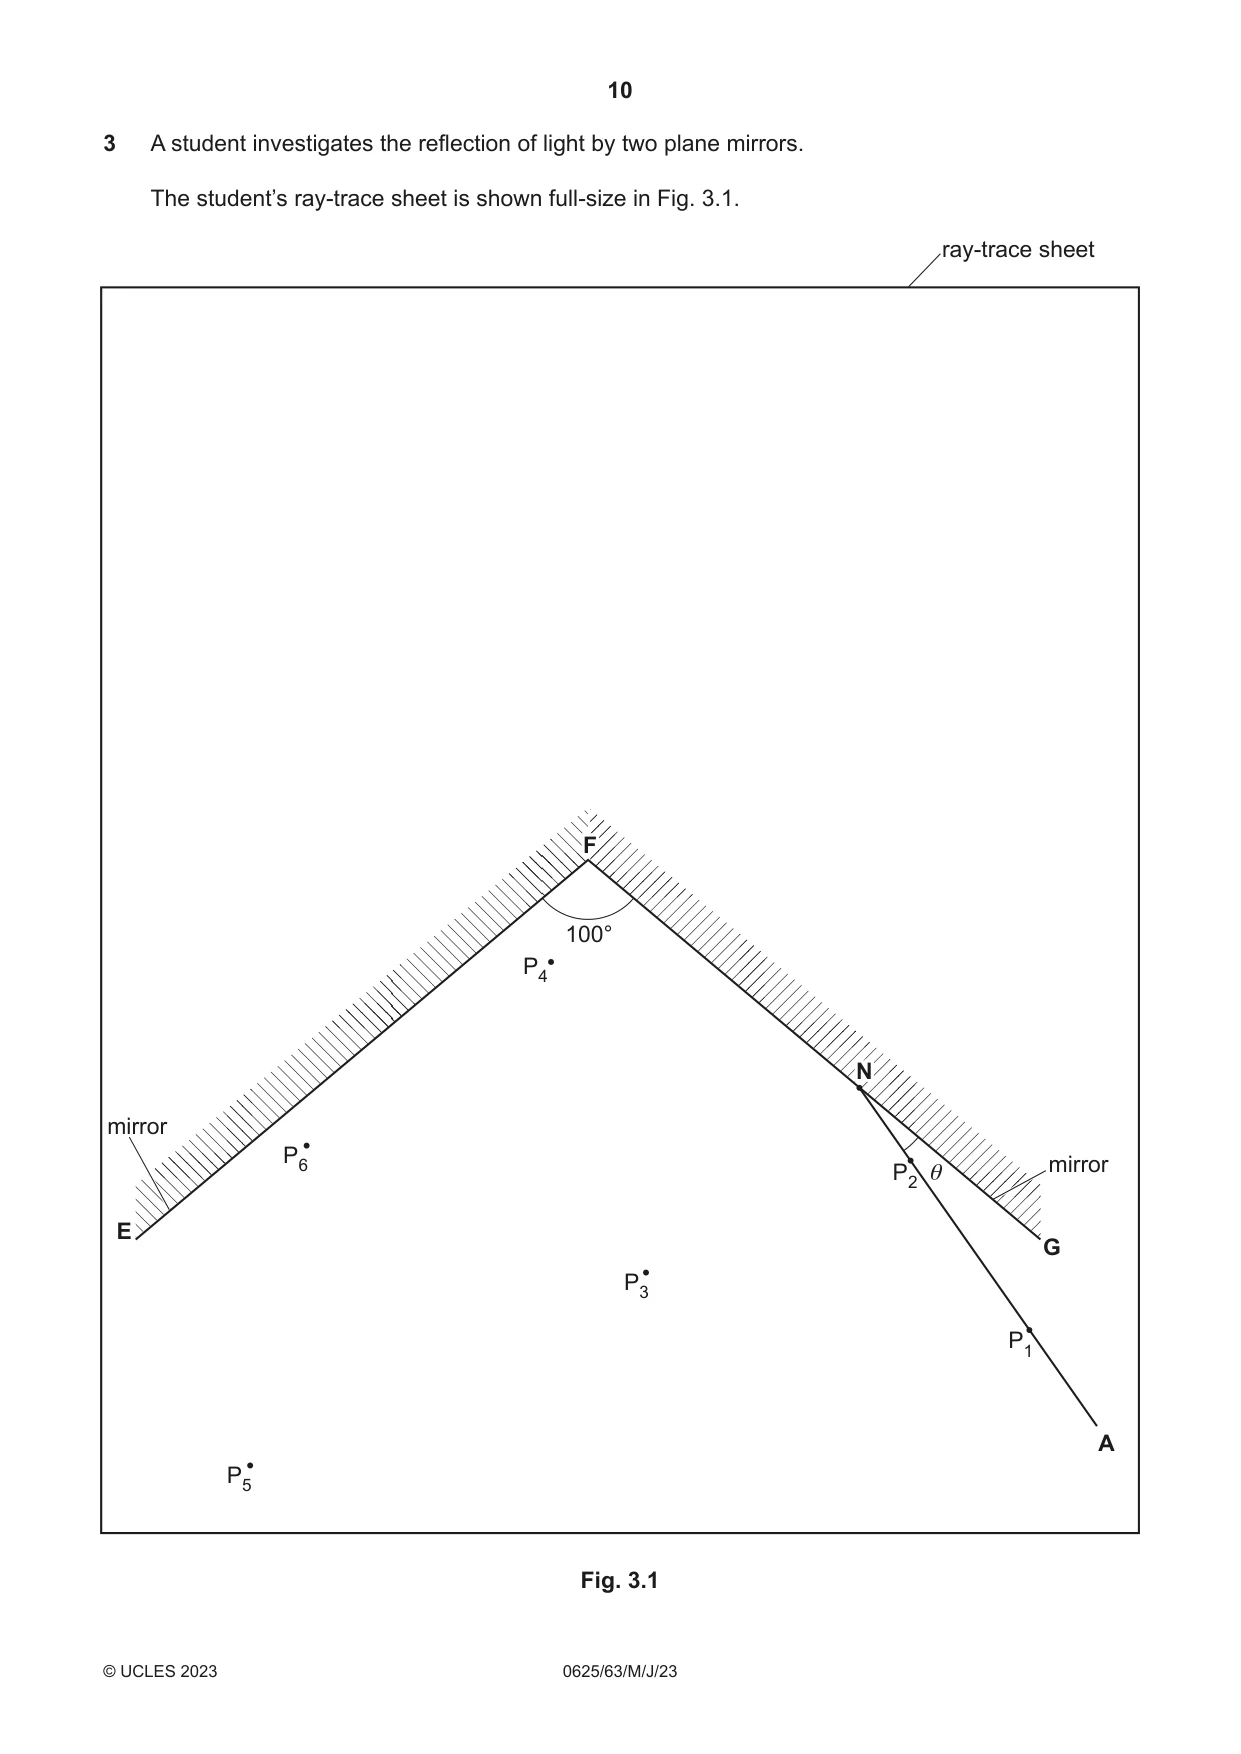
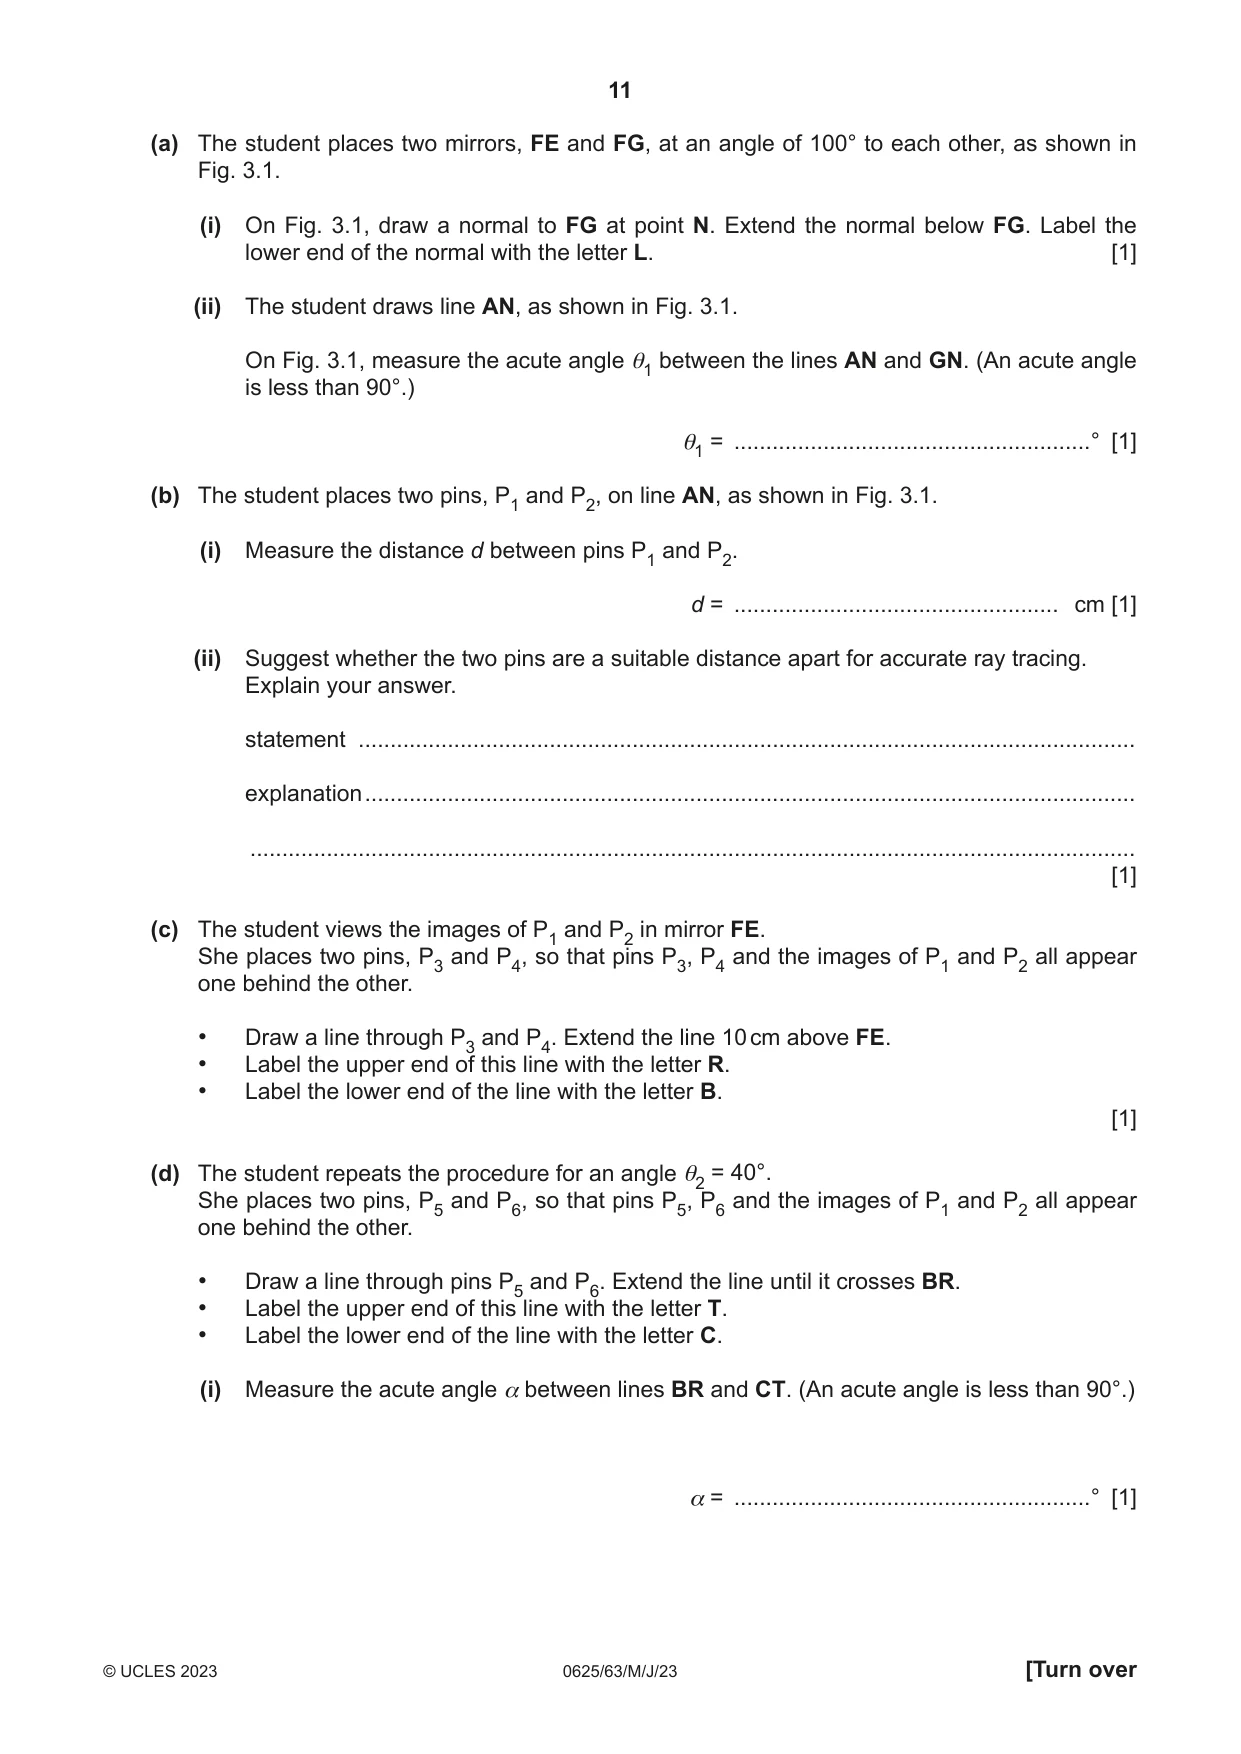
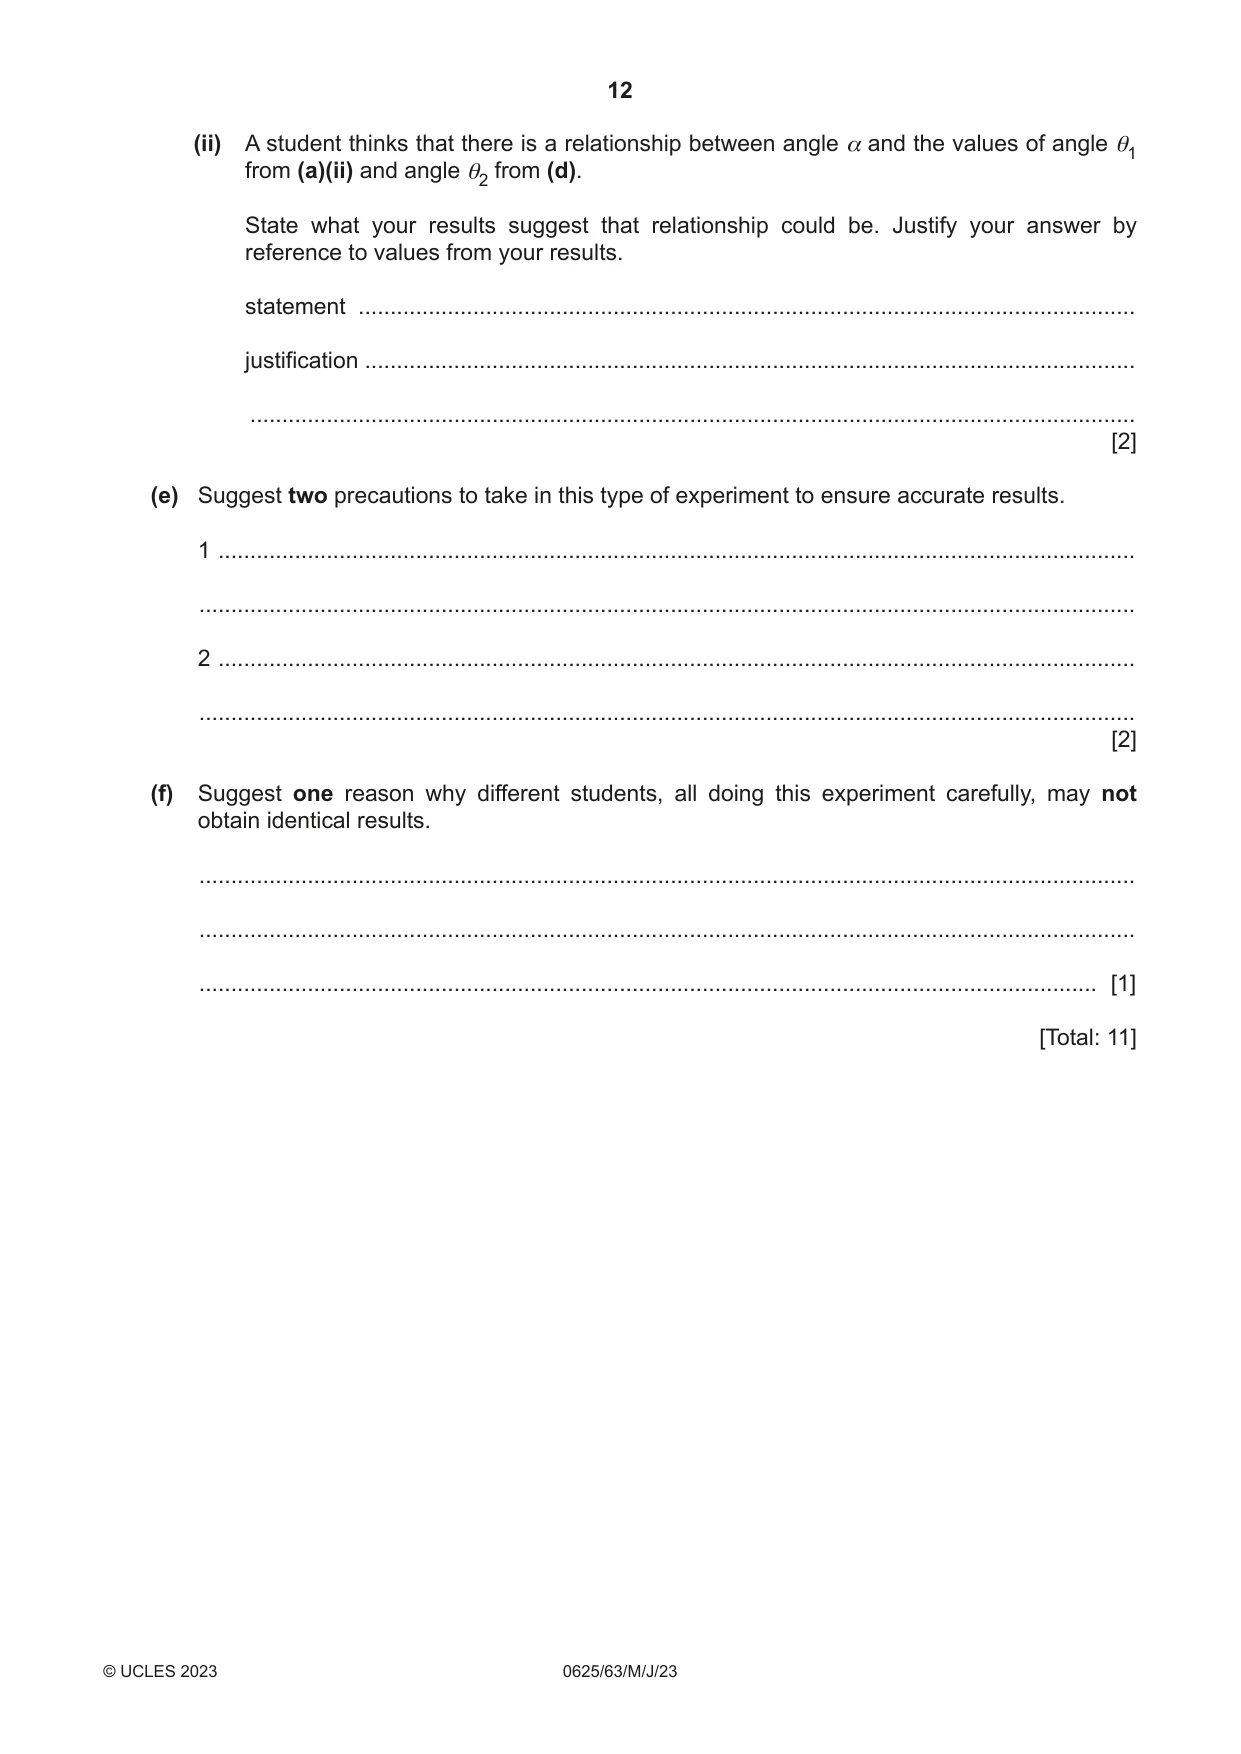
3 A student investigates the reflection of light by two plane mirrors. The student’s ray-trace sheet is shown full-size in Fig. 3.1. ray-trace sheet F 100° P4 N mirror P6 mirror P2 θ E G P3 P1 A P5 Fig. 3.1 (a) The student places two mirrors, FE and FG, at an angle of 100° to each other, as shown in Fig. 3.1. (i) On Fig. 3.1, draw a normal to FG at point N. Extend the normal below FG. Label the lower end of the normal with the letter L. [1] (ii) The student draws line AN, as shown in Fig. 3.1. On Fig. 3.1, measure the acute angle θ1 between the lines AN and GN. (An acute angle is less than 90°.) θ1 = ........................................................° [1] (b) The student places two pins, P1 and P2, on line AN, as shown in Fig. 3.1. (i) Measure the distance d between pins P1 and P2. d = ................................................... cm [1] (ii) Suggest whether the two pins are a suitable distance apart for accurate ray tracing. Explain your answer. statement .......................................................................................................................... explanation ......................................................................................................................... ........................................................................................................................................... [1] (c) The student views the images of P1 and P2 in mirror FE. She places two pins, P3 and P4, so that pins P3, P4 and the images of P1 and P2 all appear one behind the other. • Draw a line through P3 and P4. Extend the line 10 cm above FE. • Label the upper end of this line with the letter R. • Label the lower end of the line with the letter B. [1] (d) The student repeats the procedure for an angle θ2 = 40°. She places two pins, P5 and P6, so that pins P5, P6 and the images of P1 and P2 all appear one behind the other. • Draw a line through pins P5 and P6. Extend the line until it crosses BR. • Label the upper end of this line with the letter T. • Label the lower end of the line with the letter C. (i) Measure the acute angle α between lines BR and CT. (An acute angle is less than 90°.) α = ........................................................° [1] (ii) A student thinks that there is a relationship between angle α and the values of angle θ1 from (a)(ii) and angle θ2 from (d). State what your results suggest that relationship could be. Justify your answer by reference to values from your results. statement .......................................................................................................................... justification ......................................................................................................................... ........................................................................................................................................... [2] (e) Suggest two precautions to take in this type of experiment to ensure accurate results. 1 ................................................................................................................................................ ................................................................................................................................................... 2 ................................................................................................................................................ ................................................................................................................................................... [2] (f) Suggest one reason why different students, all doing this experiment carefully, may not obtain identical results. ................................................................................................................................................... ................................................................................................................................................... ............................................................................................................................................. [1] [Total: 11] Question 4 is on page 14.
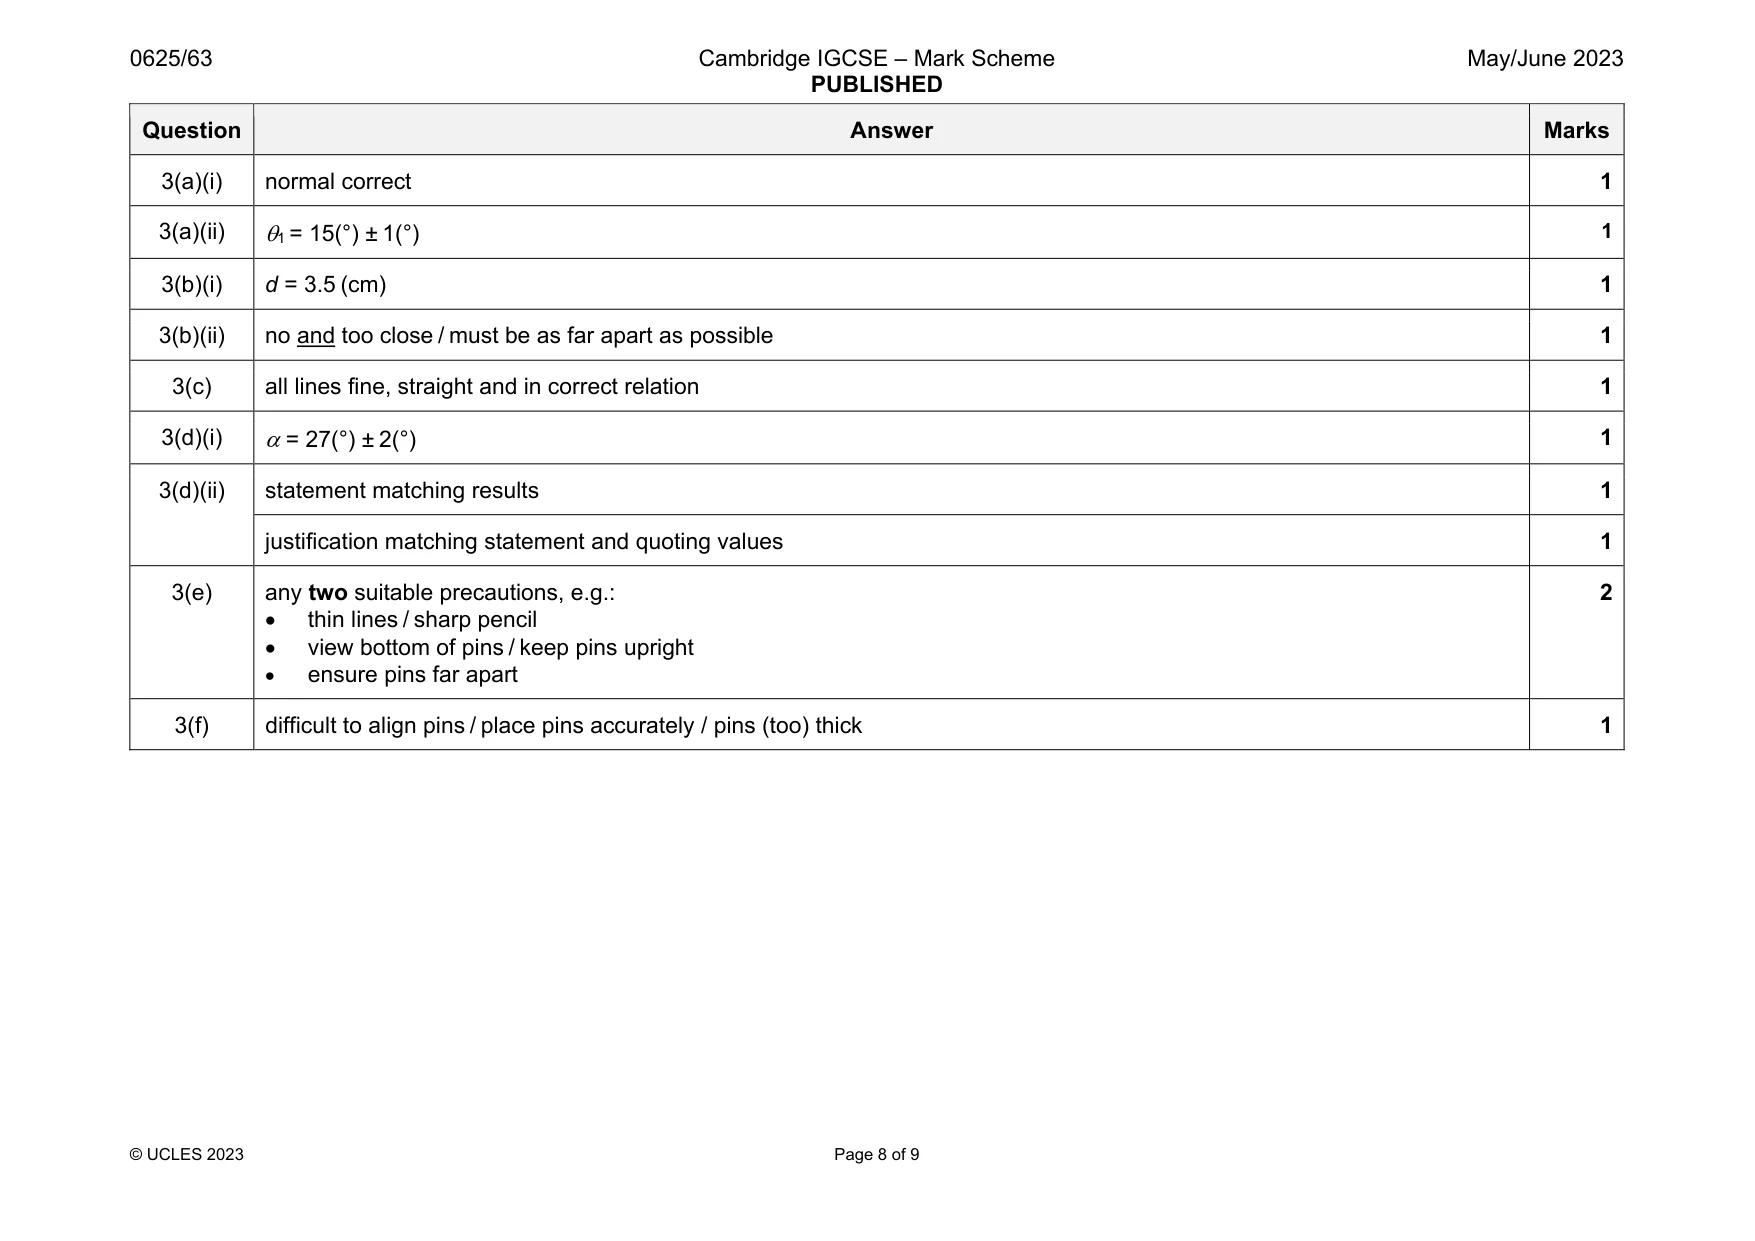
Mark scheme: 3(a)(i) normal correct 1 3(a)(ii) 1 = 15(°) ± 1(°) 1 3(b)(i) d = 3.5 (cm) 1 3(b)(ii) no and too close / must be as far apart as possible 1 3(c) all lines fine, straight and in correct relation 1 3(d)(i) = 27(°) ± 2(°) 1 3(d)(ii) statement matching results 1 justification matching statement and quoting values 1 3(e) any two suitable precautions, e.g.: thin lines / sharp pencil view bottom of pins / keep pins upright ensure pins far apart 2 3(f) difficult to align pins / place pins accurately / pins (too) thick 1
Q4 · A student investigates the rate of cooling of hot water in a container which has a lid
4 A student investigates the rate of cooling of hot water in a container which has a lid. Plan an experiment which will enable him to compare the effect of lids of different thicknesses on the rate of cooling. The apparatus available includes: • a beaker • a supply of hot water • insulating material from which lids can be cut. In your plan, you should: • list any additional apparatus needed • explain briefly how to do the experiment, including the measurements to take so that the rate of cooling can be determined • state the key variables to keep constant • draw a table, or tables, with column headings, to show how to display the readings (you are not required to enter any readings in the table) • explain how to use the readings to reach a conclusion. You may draw a diagram if it helps to explain your plan. .......................................................................................................................................................... .......................................................................................................................................................... .......................................................................................................................................................... .......................................................................................................................................................... .......................................................................................................................................................... .......................................................................................................................................................... .......................................................................................................................................................... .......................................................................................................................................................... .......................................................................................................................................................... .......................................................................................................................................................... .......................................................................................................................................................... .......................................................................................................................................................... .......................................................................................................................................................... .......................................................................................................................................................... .......................................................................................................................................................... .......................................................................................................................................................... .......................................................................................................................................................... .......................................................................................................................................................... .......................................................................................................................................................... .......................................................................................................................................................... .......................................................................................................................................................... .......................................................................................................................................................... .................................................................................................................................................... [7]
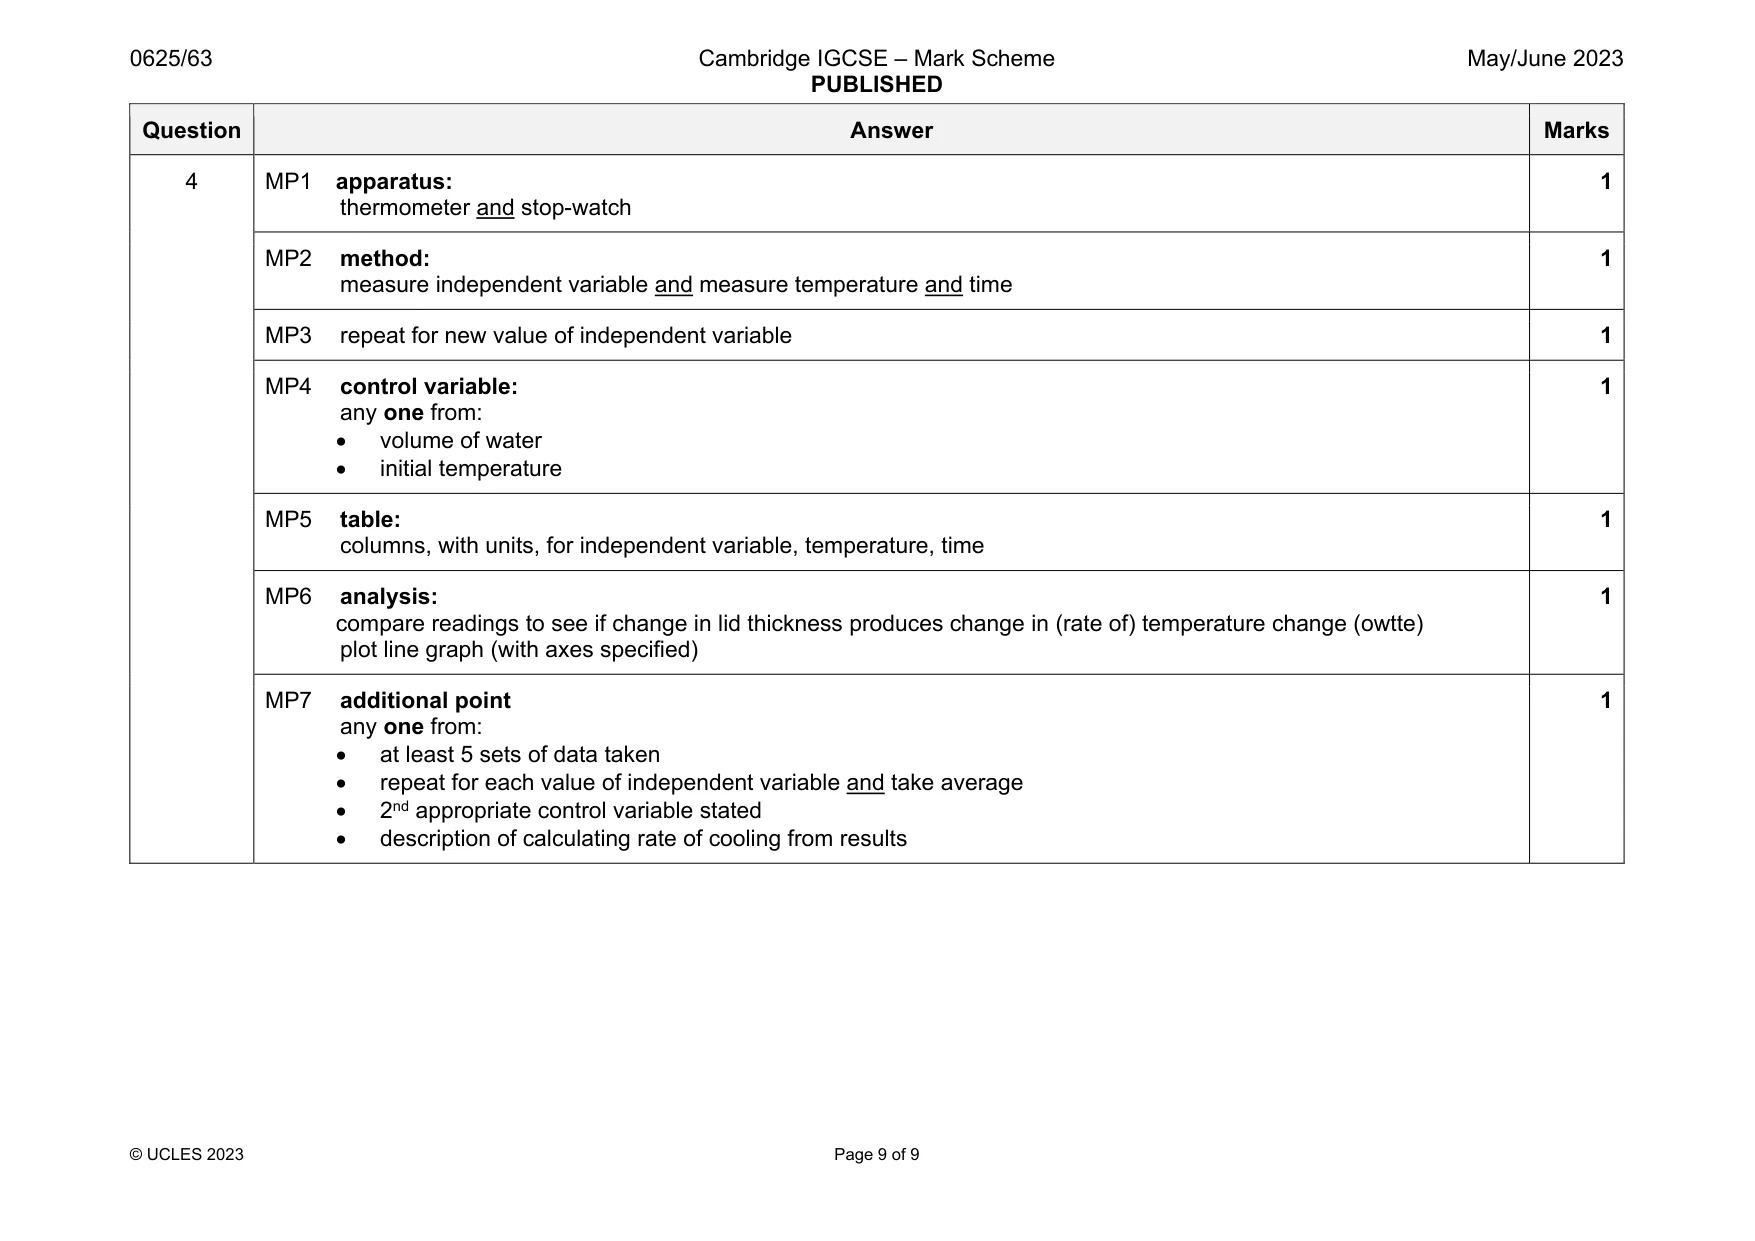
Mark scheme: 4 MP1 apparatus: thermometer and stop-watch 1 MP2 method: measure independent variable and measure temperature and time 1 MP3 repeat for new value of independent variable 1 MP4 control variable: any one from: volume of water initial temperature 1 MP5 table: columns, with units, for independent variable, temperature, time 1 MP6 analysis: compare readings to see if change in lid thickness produces change in (rate of) temperature change (owtte) plot line graph (with axes specified) 1 MP7 additional point any one from: at least 5 sets of data taken repeat for each value of independent variable and take average 2nd appropriate control variable stated description of calculating rate of cooling from results 1
What was in this paper
The subtopics covered by these 4 questions, and how many questions each got. Open one in a new tab to see every Cambridge question on it.
What you needed in this session
Cambridge’s own grade thresholds for 2023 May/June, Paper 6 · Variant 3. A higher threshold means an easier paper — the bar moves with how the cohort did.