Cambridge IGCSE Physics 0625 — 2025 May/June Paper 6 · Variant 3
0625/63/M/J/25 · 4 questions · 40 marks · ≈45 min
The question paper and its mark scheme, free to read here and free to download. This is Cambridge’s own paper, exactly as it was sat.
Question paper16 pages
Mark scheme11 pages
Answers below. Sit the paper first if you are practising.
Questions as text
Q1 · A student investigates the forces supporting a metre ruler to determine the weight of the…
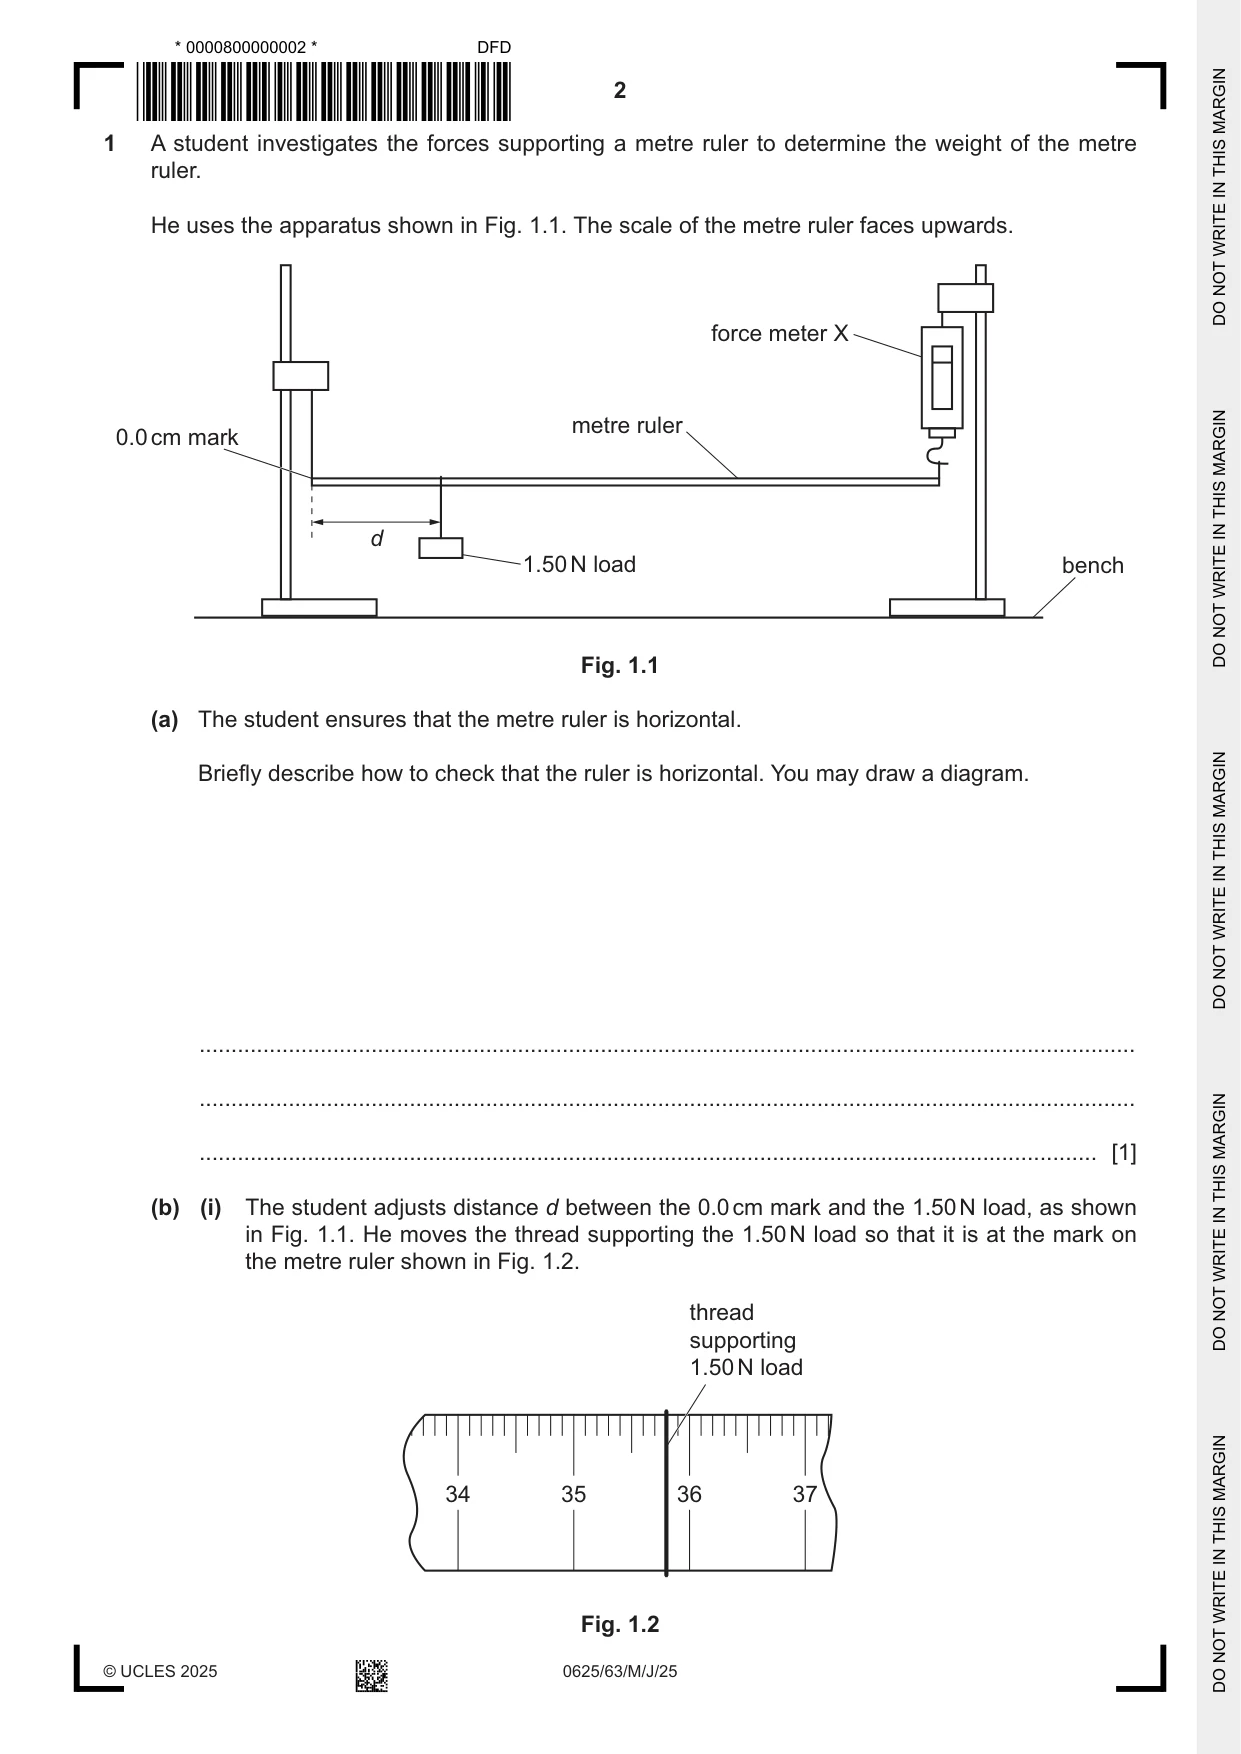
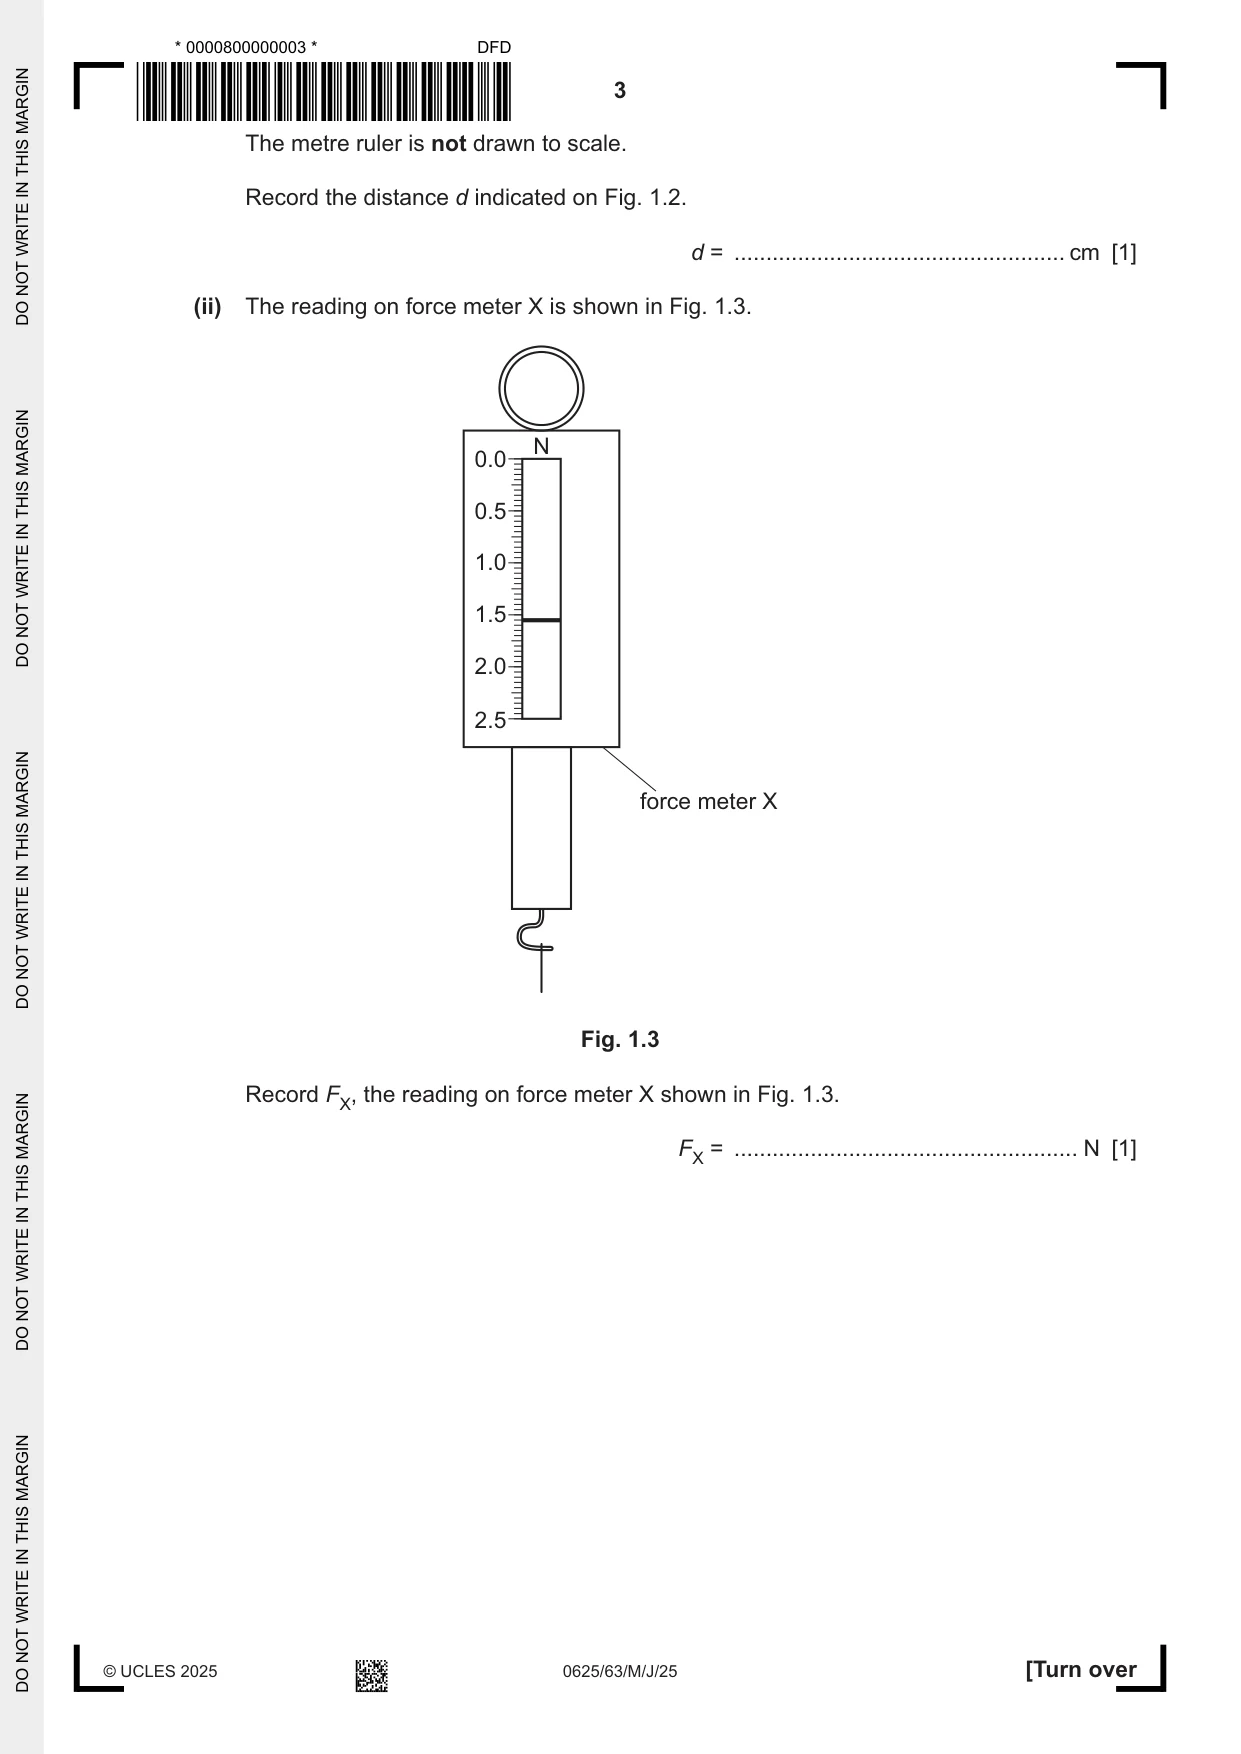
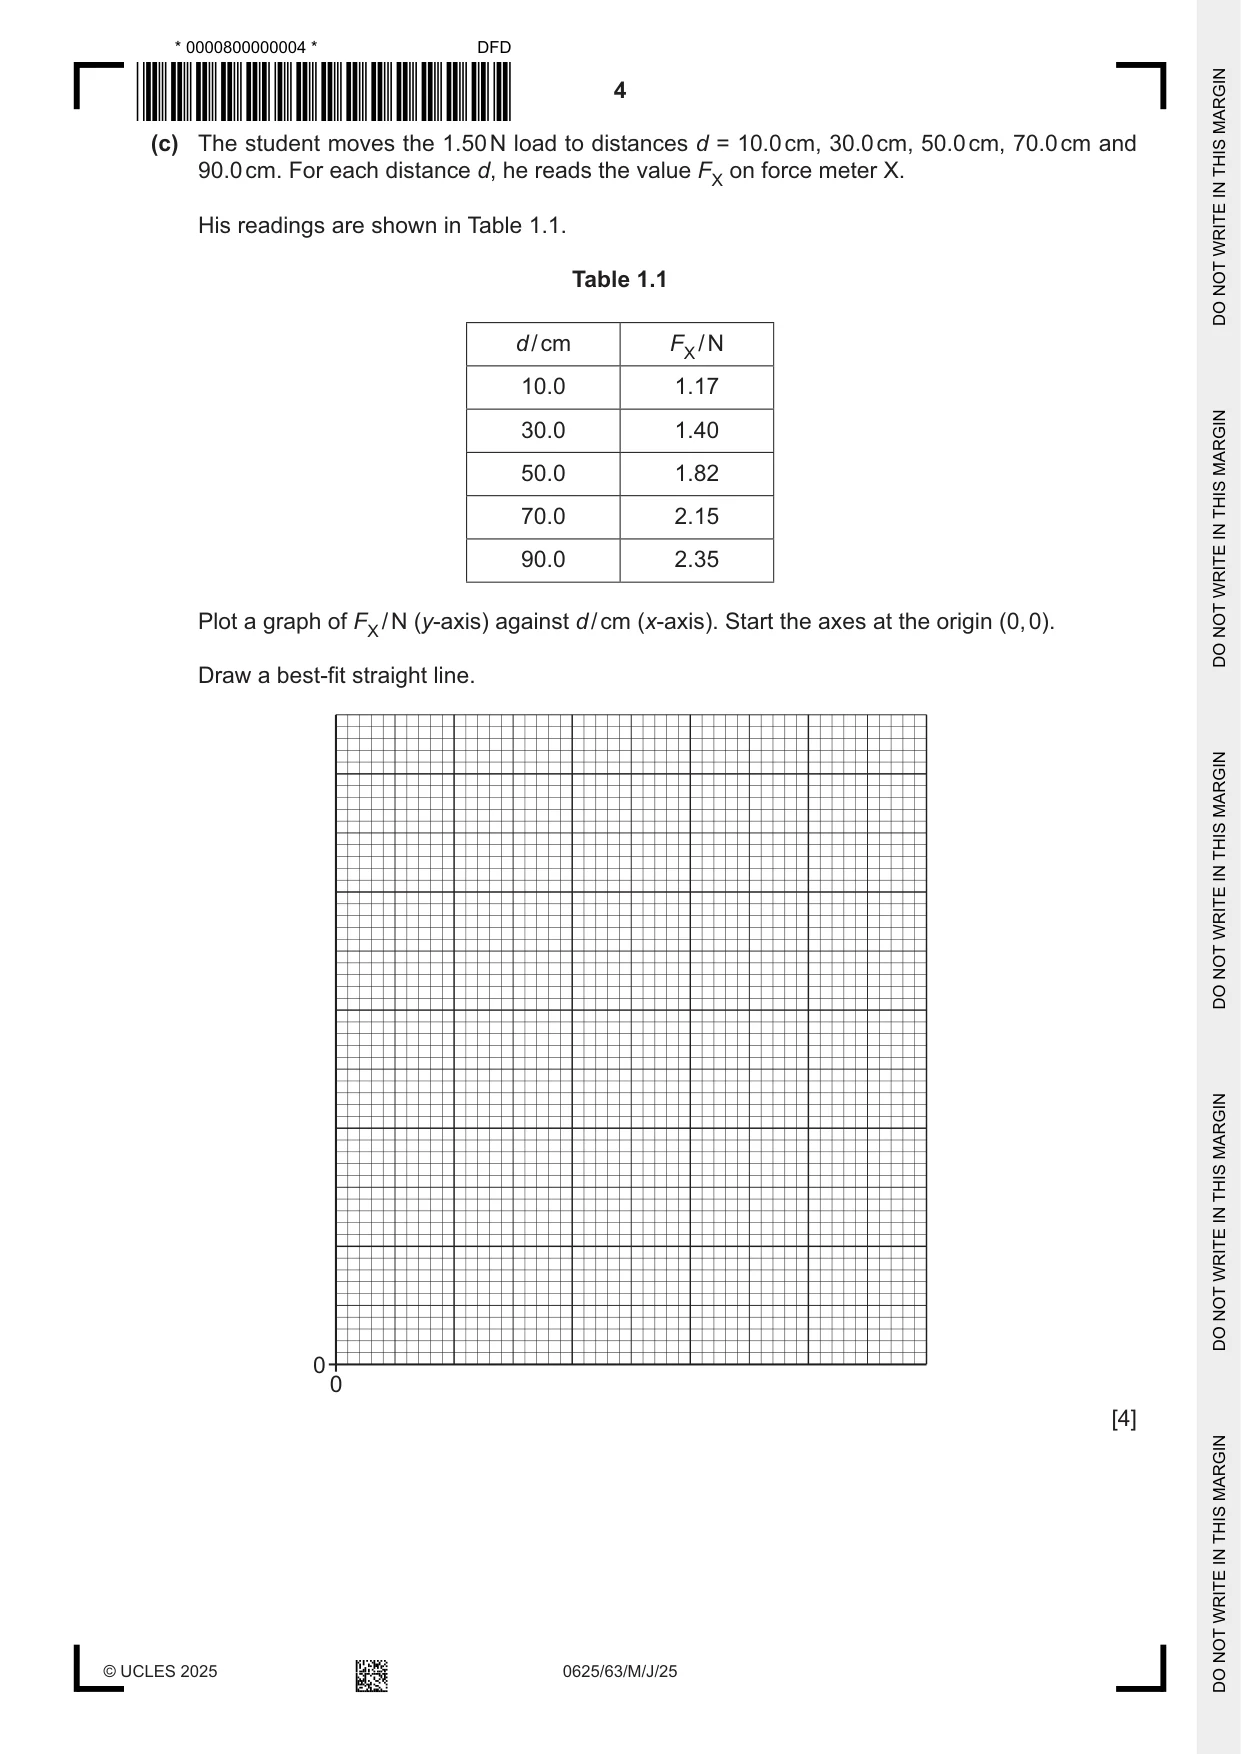
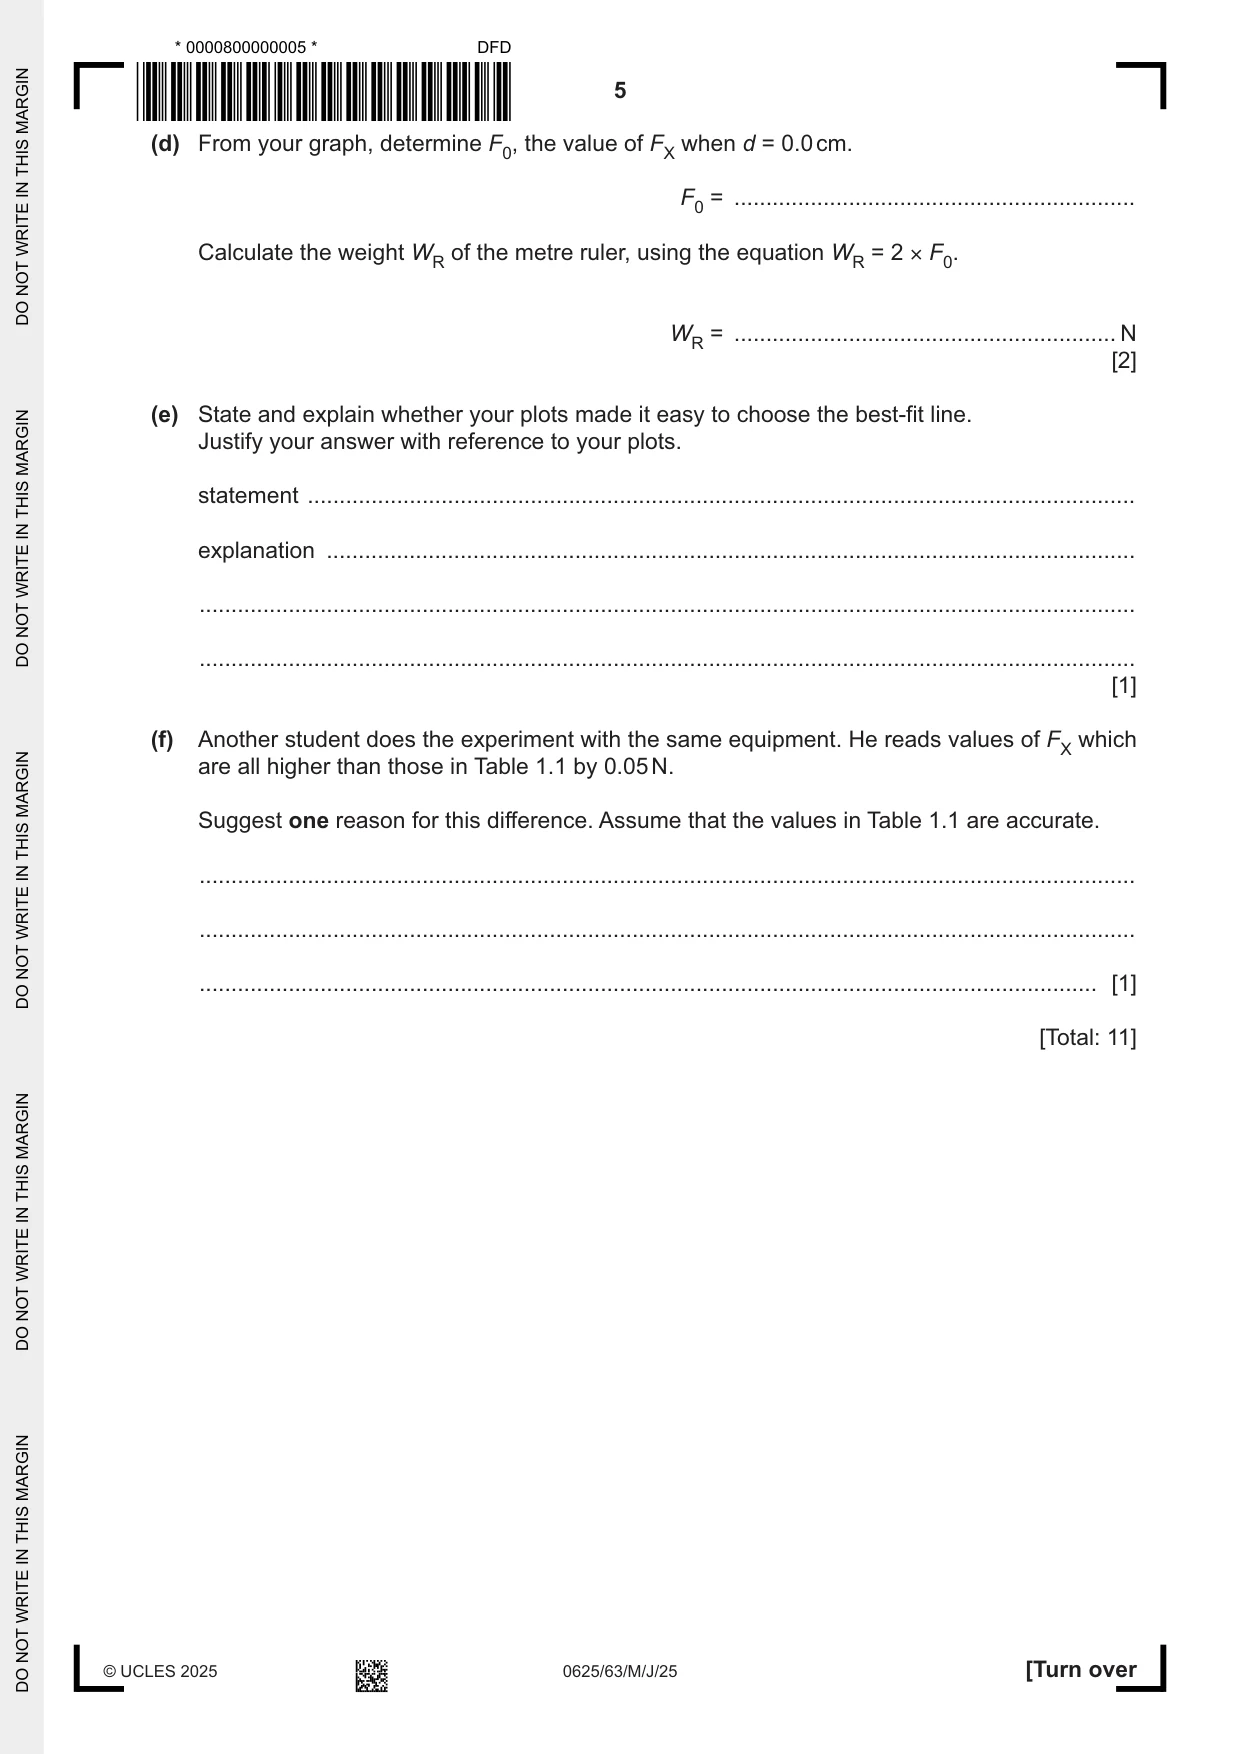
1 A student investigates the forces supporting a metre ruler to determine the weight of the metre ruler. He uses the apparatus shown in Fig. 1.1. The scale of the metre ruler faces upwards. force meter X metre ruler 0.0 cm mark d 1.50 N load bench Fig. 1.1 (a) The student ensures that the metre ruler is horizontal. Briefly describe how to check that the ruler is horizontal. You may draw a diagram. ................................................................................................................................................... ................................................................................................................................................... ............................................................................................................................................. [1] (b) (i) The student adjusts distance d between the 0.0 cm mark and the 1.50 N load, as shown in Fig. 1.1. He moves the thread supporting the 1.50 N load so that it is at the mark on the metre ruler shown in Fig. 1.2. thread supporting 1.50 N load 34 35 36 37 Fig. 1.2 The metre ruler is not drawn to scale. Record the distance d indicated on Fig. 1.2. d = .................................................... cm [1] (ii) The reading on force meter X is shown in Fig. 1.3. N 0.0 0.5 1.0 1.5 2.0 2.5 force meter X Fig. 1.3 Record FX, the reading on force meter X shown in Fig. 1.3. FX = ...................................................... N [1] (c) The student moves the 1.50 N load to distances d = 10.0 cm, 30.0 cm, 50.0 cm, 70.0 cm and 90.0 cm. For each distance d, he reads the value FX on force meter X. His readings are shown in Table 1.1. Table 1.1 d / cm FX / N 10.0 1.17 30.0 1.40 50.0 1.82 70.0 2.15 90.0 2.35 Plot a graph of FX / N (y-axis) against d / cm (x-axis). Start the axes at the origin (0, 0). Draw a best-fit straight line. 0 0 [4] (d) From your graph, determine F0, the value of FX when d = 0.0 cm. F0 = ............................................................... Calculate the weight WR of the metre ruler, using the equation WR = 2 × F0. WR = ............................................................ N [2] (e) State and explain whether your plots made it easy to choose the best-fit line. Justify your answer with reference to your plots. statement .................................................................................................................................. explanation ............................................................................................................................... ................................................................................................................................................... ................................................................................................................................................... [1] (f) Another student does the experiment with the same equipment. He reads values of FX which are all higher than those in Table 1.1 by 0.05 N. Suggest one reason for this difference. Assume that the values in Table 1.1 are accurate. ................................................................................................................................................... ................................................................................................................................................... ............................................................................................................................................. [1] [Total: 11]
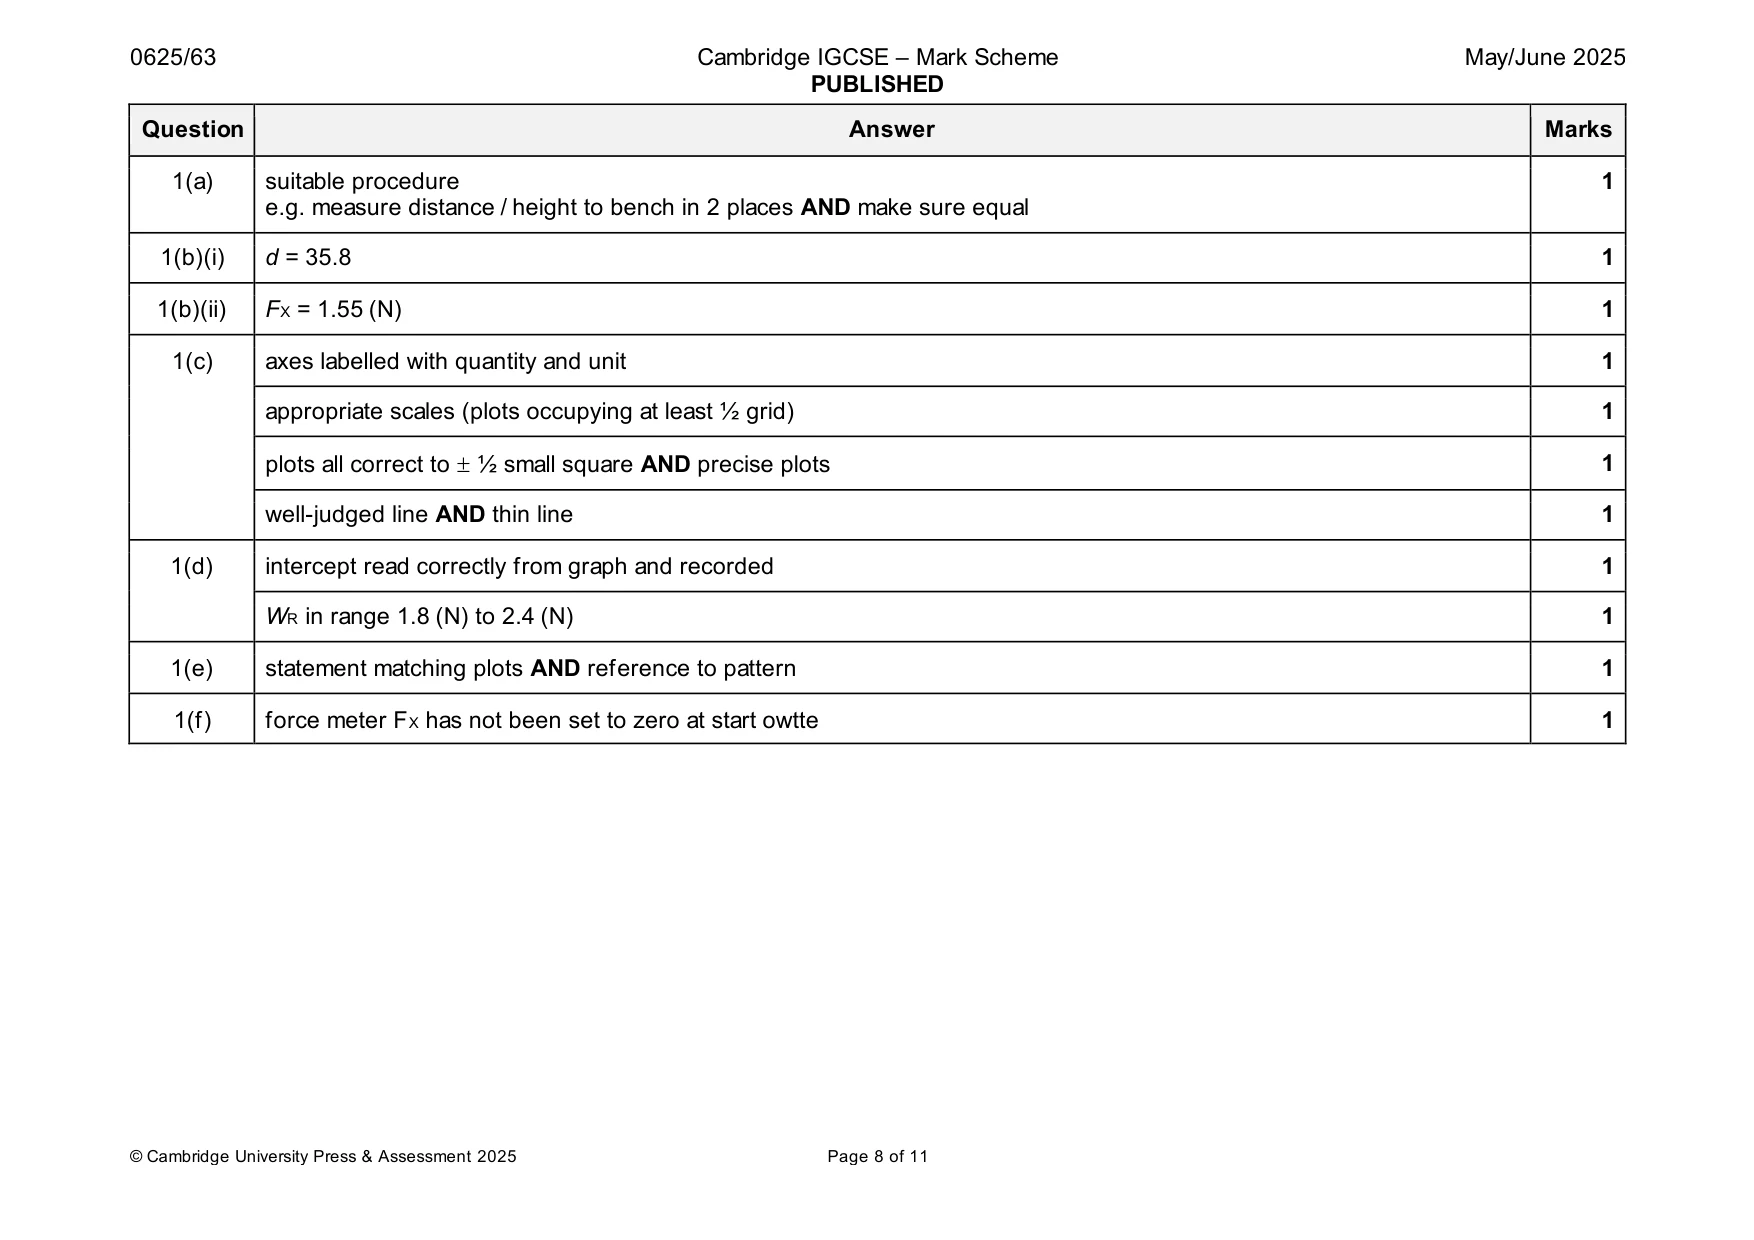
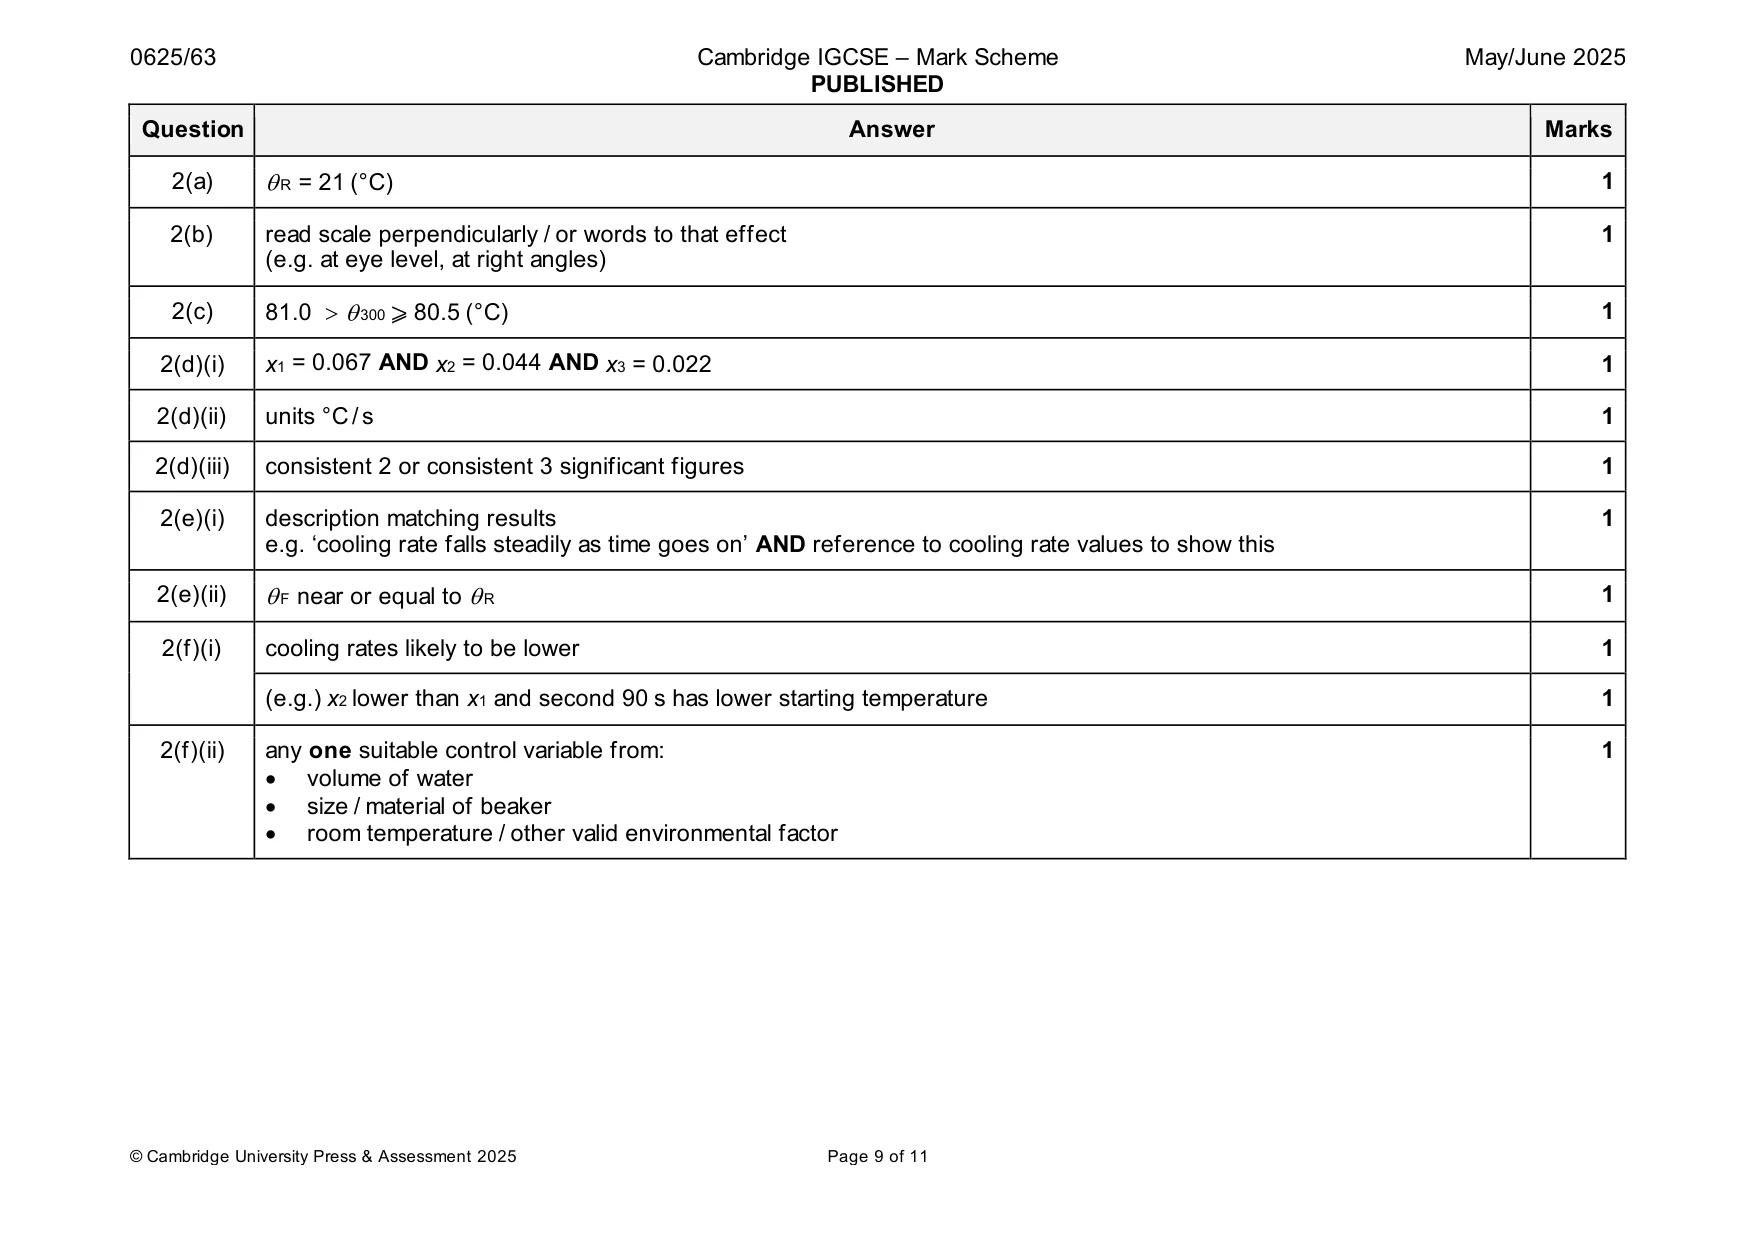
Mark scheme: Question Answer Marks 1(a) suitable procedure 1 e.g. measure distance / height to bench in 2 places AND make sure equal 1(b)(i) d = 35.8 1 1(b)(ii) FX = 1.55 (N) 1 1(c) axes labelled with quantity and unit 1 appropriate scales (plots occupying at least ½ grid) 1 plots all correct to ½ small square AND precise plots 1 well-judged line AND thin line 1 1(d) intercept read correctly from graph and recorded 1 WR in range 1.8 (N) to 2.4 (N) 1 1(e) statement matching plots AND reference to pattern 1 1(f) force meter FX has not been set to zero at start owtte 1
Q2 · A student investigates the cooling of hot water in a beaker
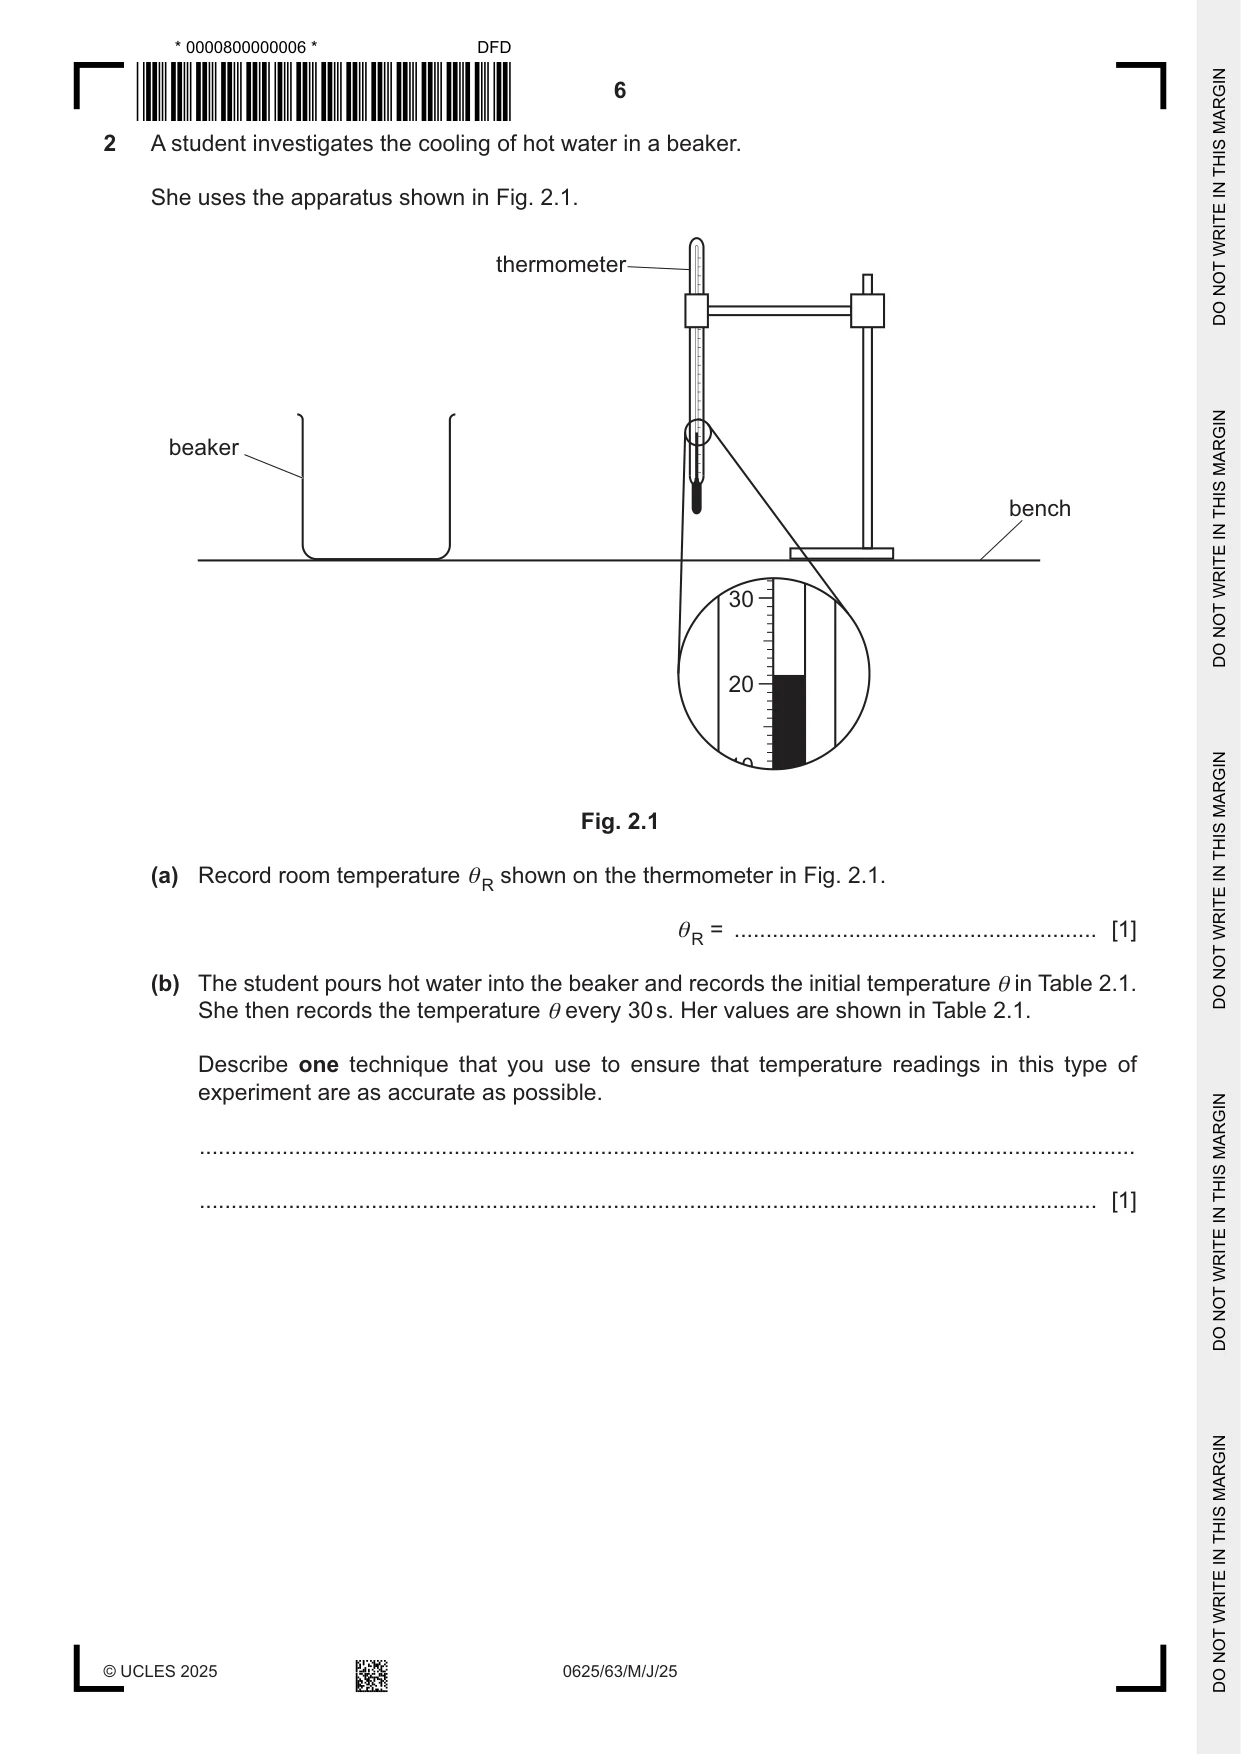
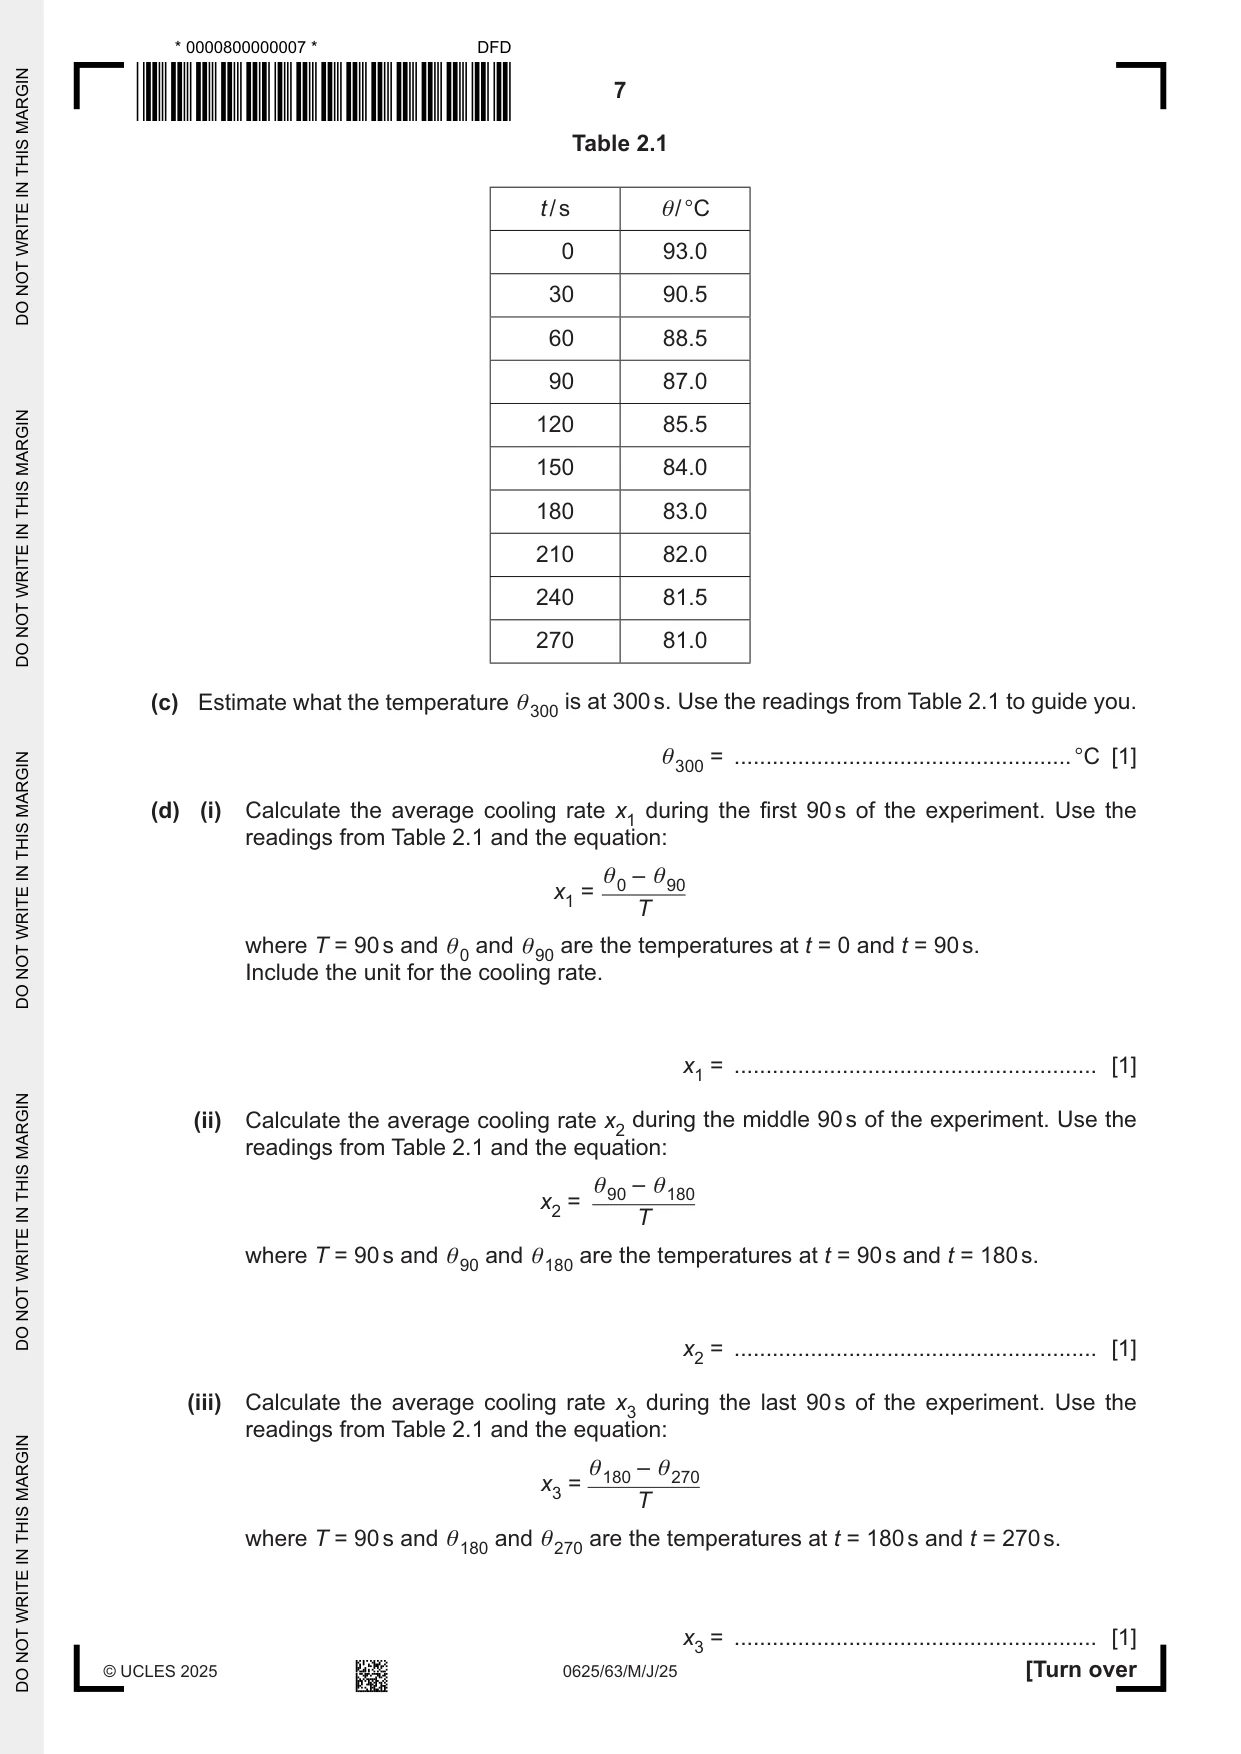
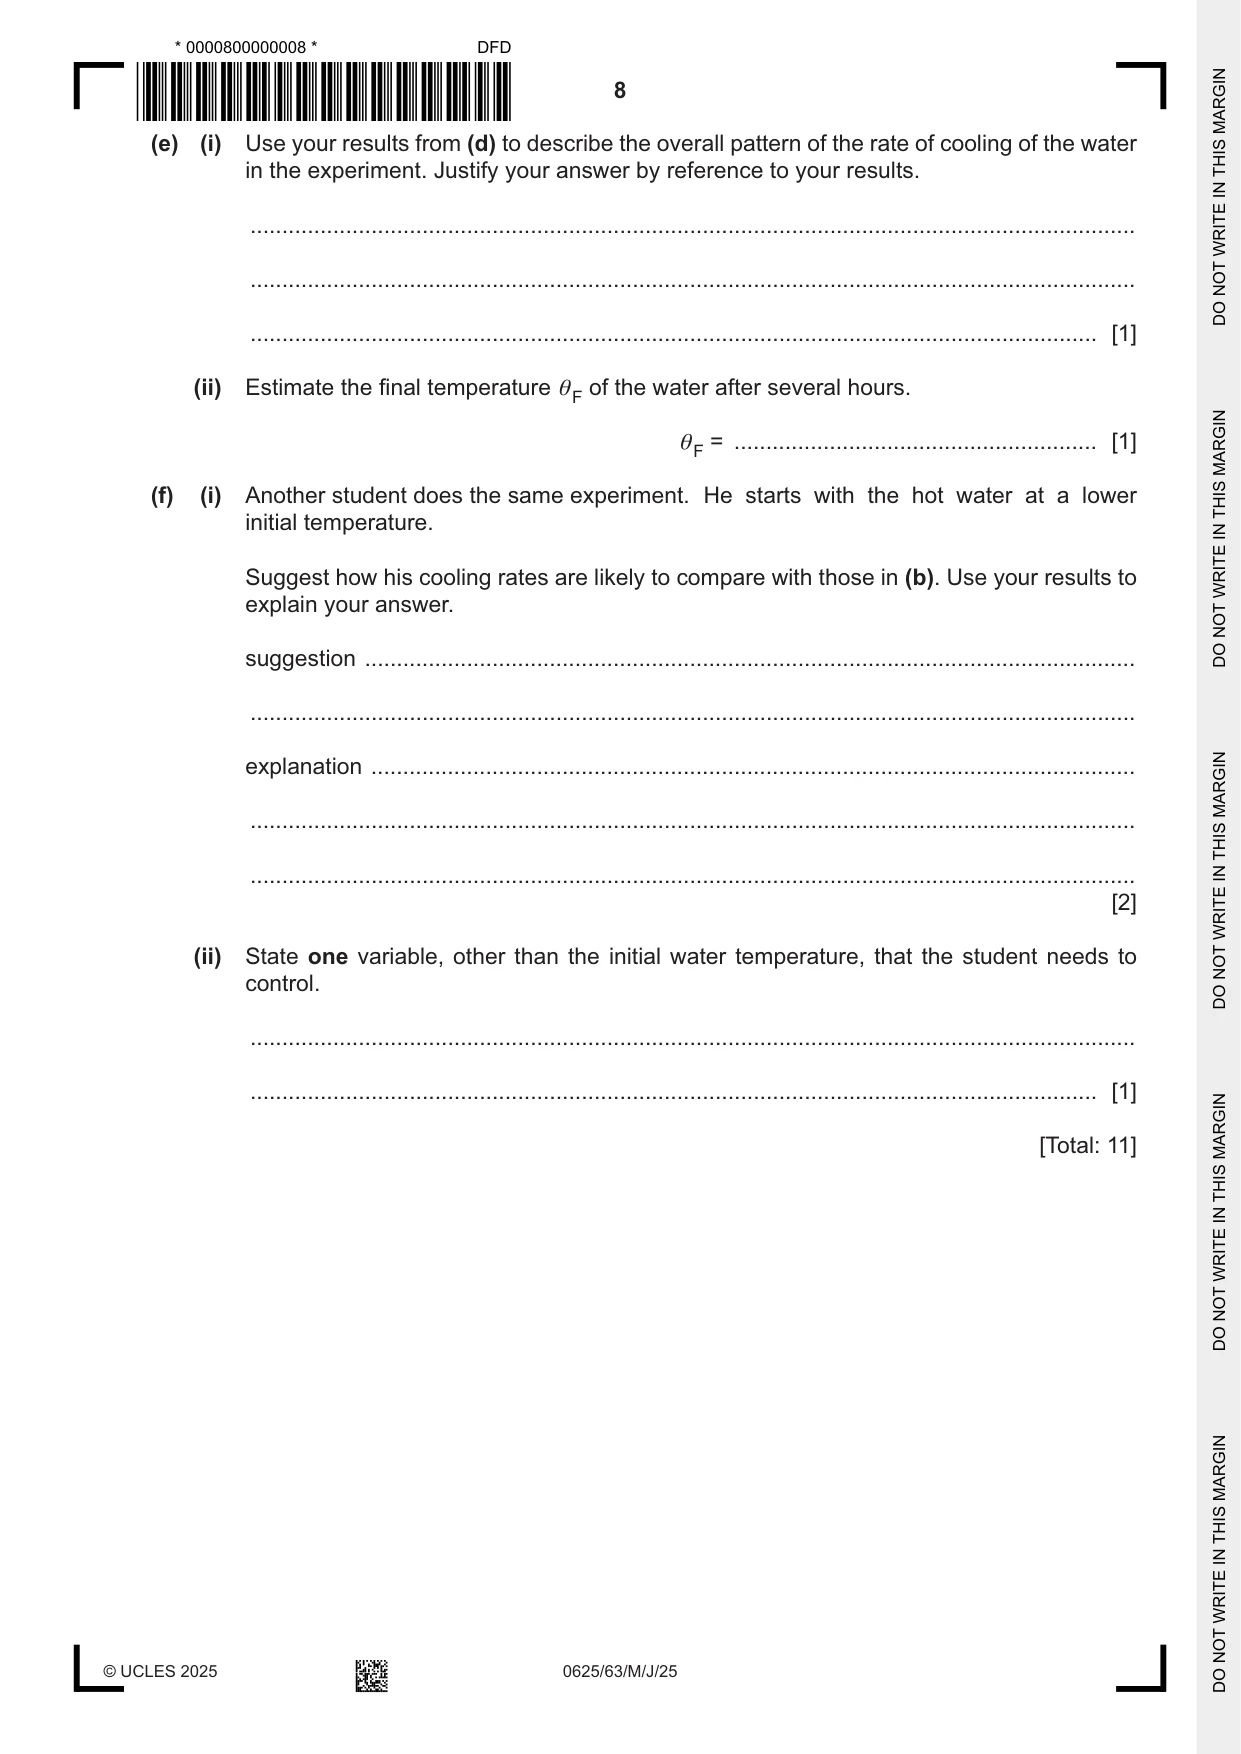
2 A student investigates the cooling of hot water in a beaker. She uses the apparatus shown in Fig. 2.1. thermometer beaker bench 30 20 10 Fig. 2.1 (a) Record room temperature θ shown on the thermometer in Fig. 2.1. R θ = ......................................................... [1] R (b) The student pours hot water into the beaker and records the initial temperature θ in Table 2.1. She then records the temperature θ every 30 s. Her values are shown in Table 2.1. Describe one technique that you use to ensure that temperature readings in this type of experiment are as accurate as possible. ................................................................................................................................................... ............................................................................................................................................. [1] Table 2.1 t / s θ/ °C 0 93.0 30 90.5 60 88.5 90 87.0 120 85.5 150 84.0 180 83.0 210 82.0 240 81.5 270 81.0 (c) Estimate what the temperature θ is at 300 s. Use the readings from Table 2.1 to guide you. 300 θ = .....................................................°C [1] 300 (d) (i) Calculate the average cooling rate x1 during the first 90 s of the experiment. Use the readings from Table 2.1 and the equation: θ – θ x1 = 0 90 T where T = 90 s and θ and θ are the temperatures at t = 0 and t = 90 s. 0 90 Include the unit for the cooling rate. x1 = ......................................................... [1] (ii) Calculate the average cooling rate x2 during the middle 90 s of the experiment. Use the readings from Table 2.1 and the equation: θ – θ x2 = 90 180 T where T = 90 s and θ and θ are the temperatures at t = 90 s and t = 180 s. 90 180 x2 = ......................................................... [1] (iii) Calculate the average cooling rate x3 during the last 90 s of the experiment. Use the readings from Table 2.1 and the equation: θ – θ x3 = 180 270 T where T = 90 s and θ and θ are the temperatures at t = 180 s and t = 270 s. 180 270 x3 = ......................................................... [1] (e) (i) Use your results from (d) to describe the overall pattern of the rate of cooling of the water in the experiment. Justify your answer by reference to your results. ........................................................................................................................................... ........................................................................................................................................... ..................................................................................................................................... [1] (ii) Estimate the final temperature θ of the water after several hours. F θ = ......................................................... [1] F (f) (i) Another student does the same experiment. He starts with the hot water at a lower initial temperature. Suggest how his cooling rates are likely to compare with those in (b). Use your results to explain your answer. suggestion ......................................................................................................................... ........................................................................................................................................... explanation ........................................................................................................................ ........................................................................................................................................... ........................................................................................................................................... [2] (ii) State one variable, other than the initial water temperature, that the student needs to control. ........................................................................................................................................... ..................................................................................................................................... [1] [Total: 11]
Mark scheme: 2(a) R = 21 (°C) 1 2(b) read scale perpendicularly / or words to that effect 1 (e.g. at eye level, at right angles) 2(c) 81.0 300 ⩾ 80.5 (°C) 1 2(d)(i) x1 = 0.067 AND x2 = 0.044 AND x3 = 0.022 1 2(d)(ii) units °C / s 1 2(d)(iii) consistent 2 or consistent 3 significant figures 1 2(e)(i) description matching results 1 e.g. ‘cooling rate falls steadily as time goes on’ AND reference to cooling rate values to show this 2(e)(ii) F near or equal to R 1 2(f)(i) cooling rates likely to be lower 1 (e.g.) x2 lower than x1 and second 90 s has lower starting temperature 1 2(f)(ii) any one suitable control variable from: 1 • volume of water • size / material of beaker • room temperature / other valid environmental factor
Q3 · A student investigates circuits containing different combinations of resistors
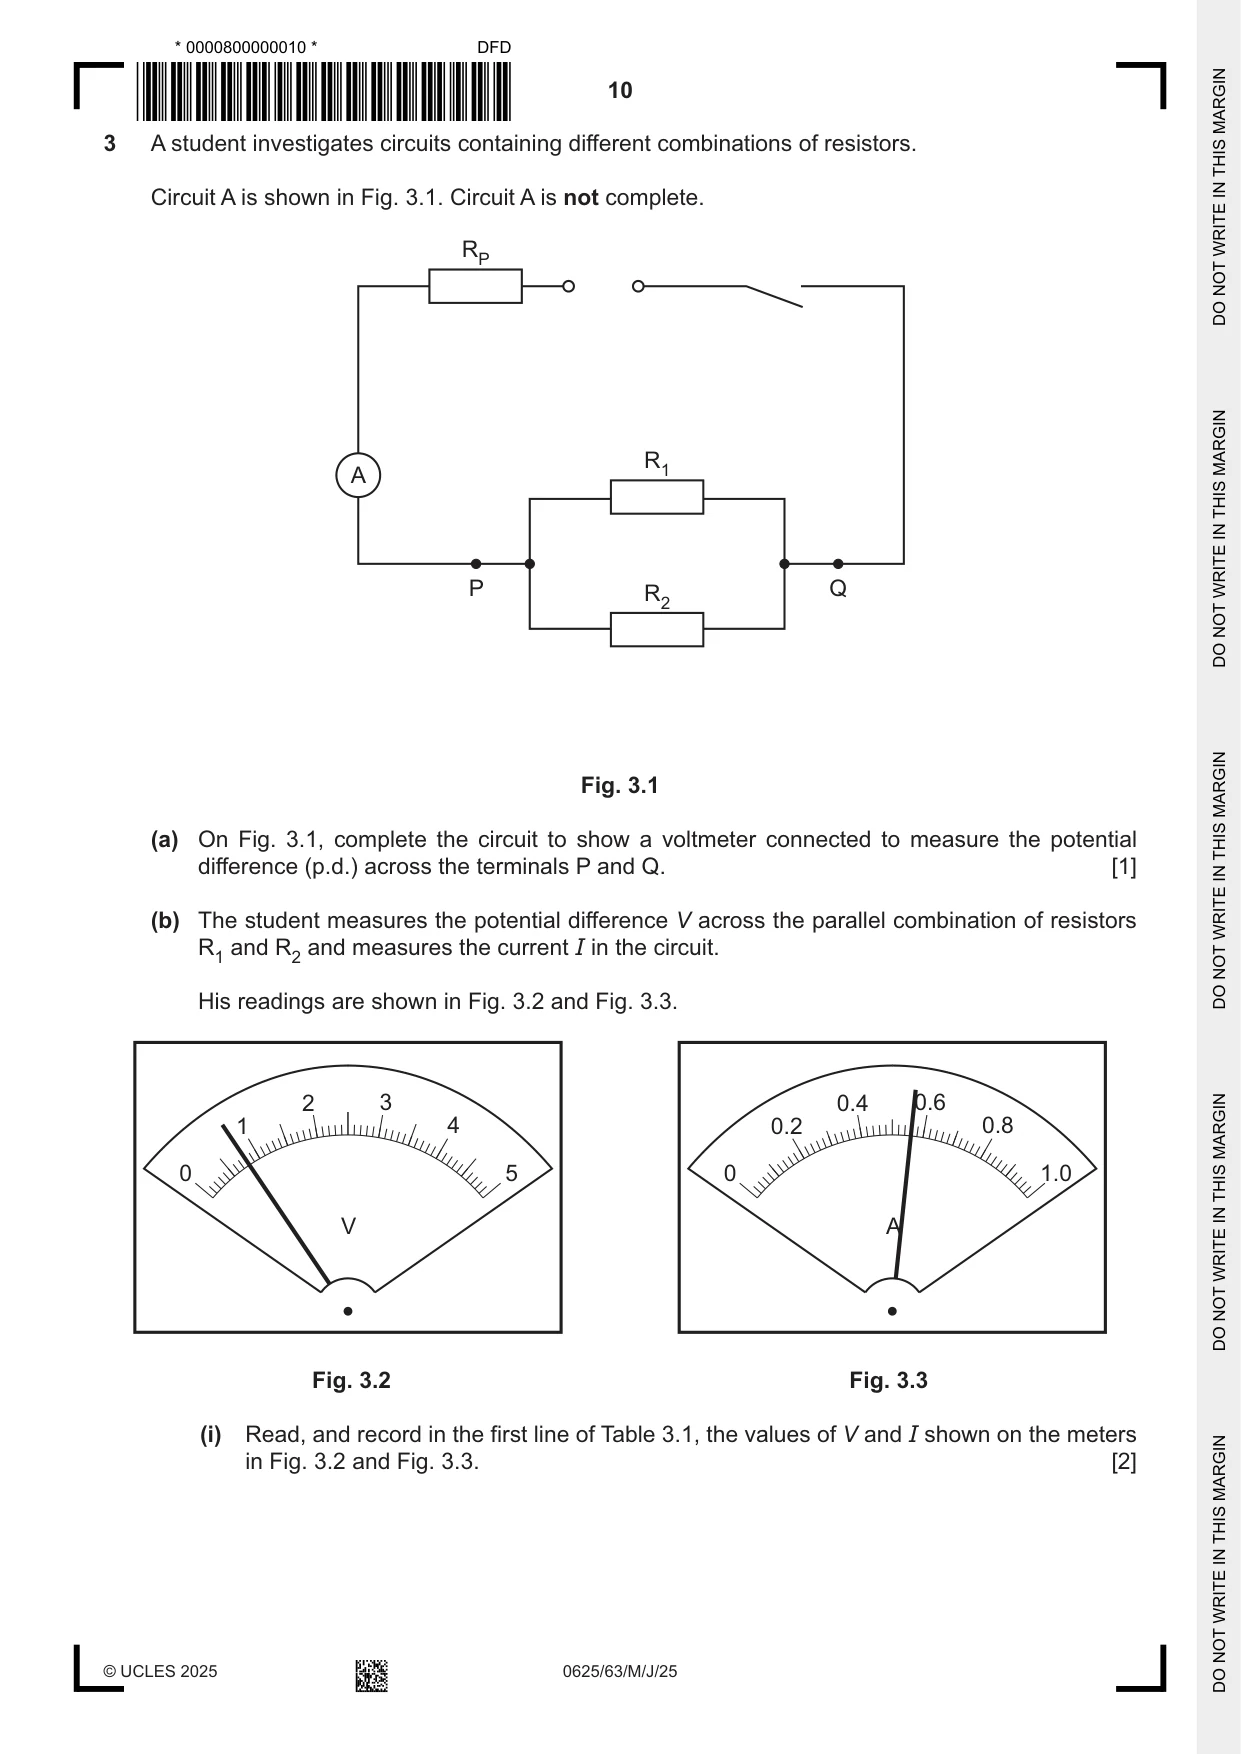
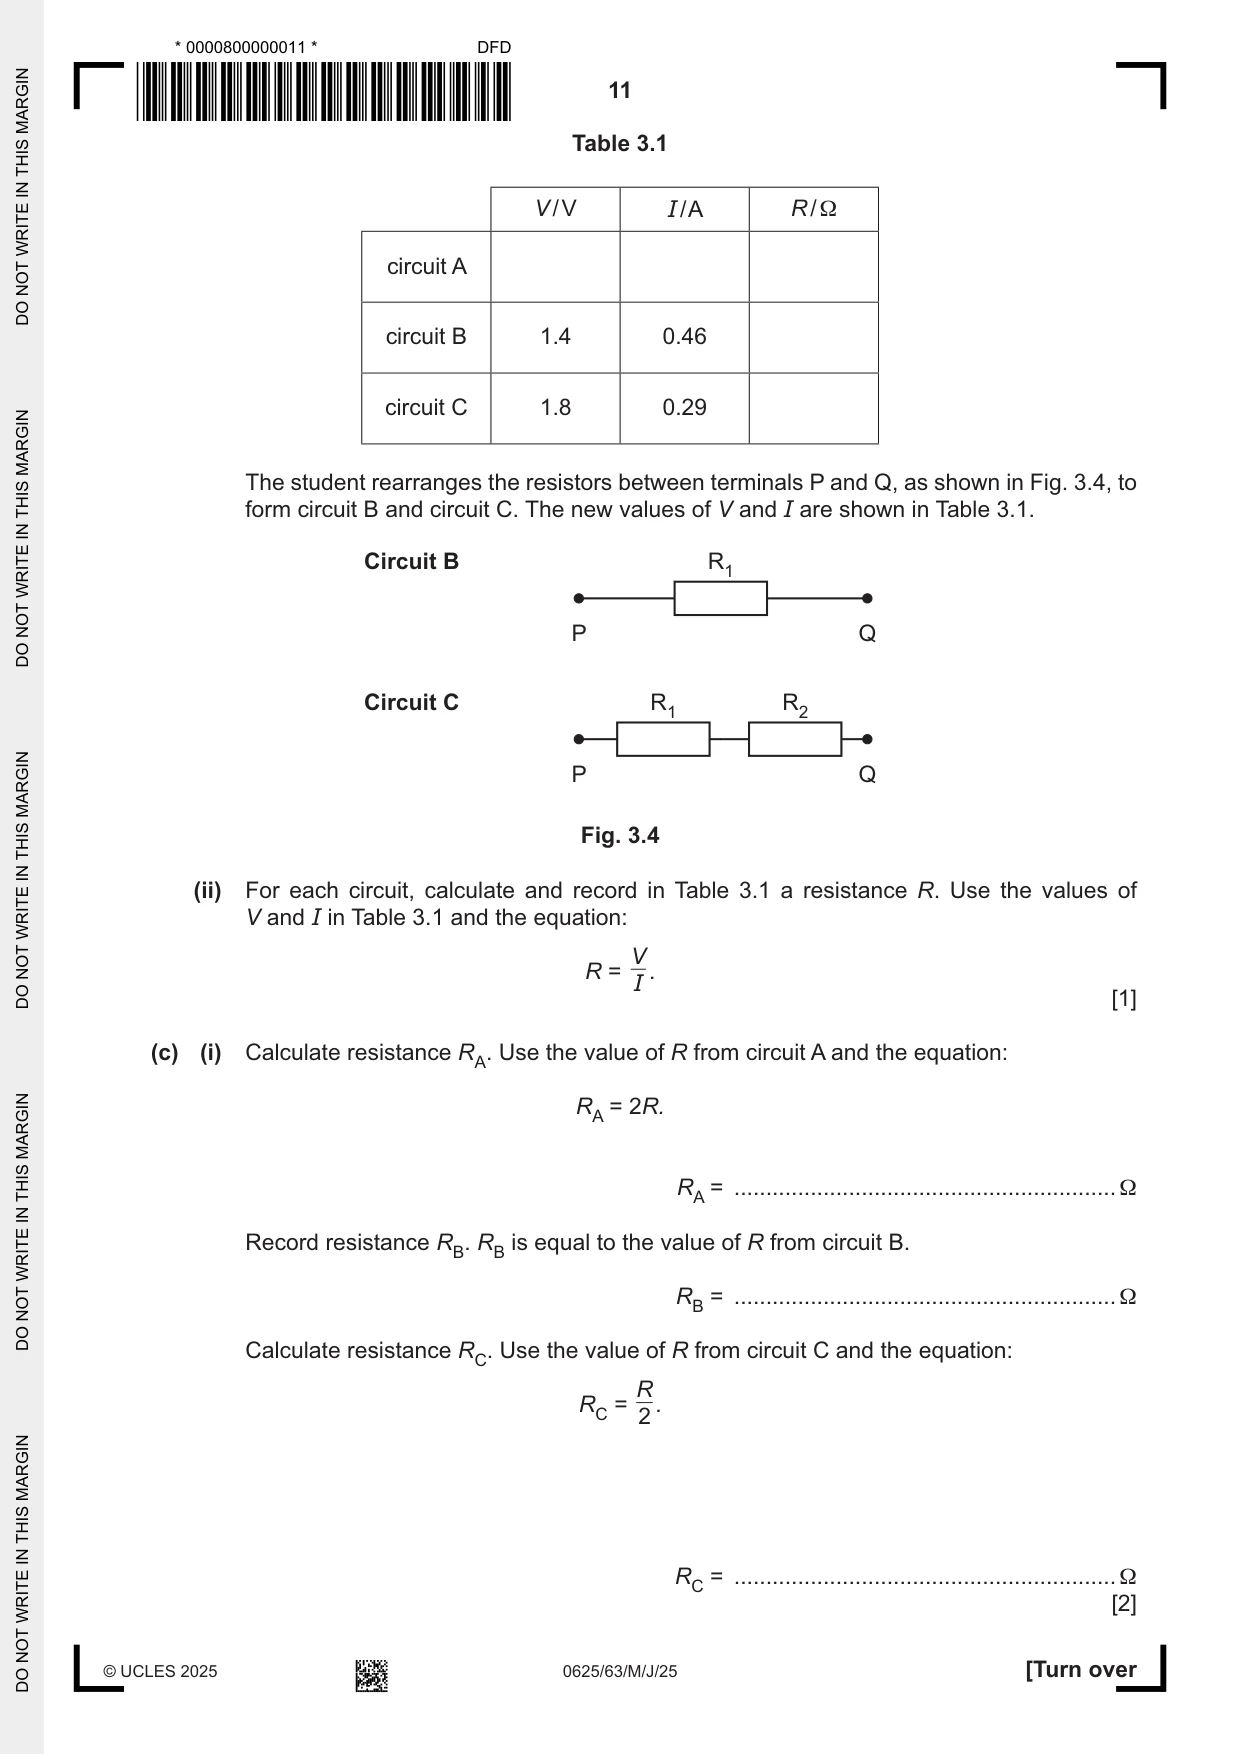
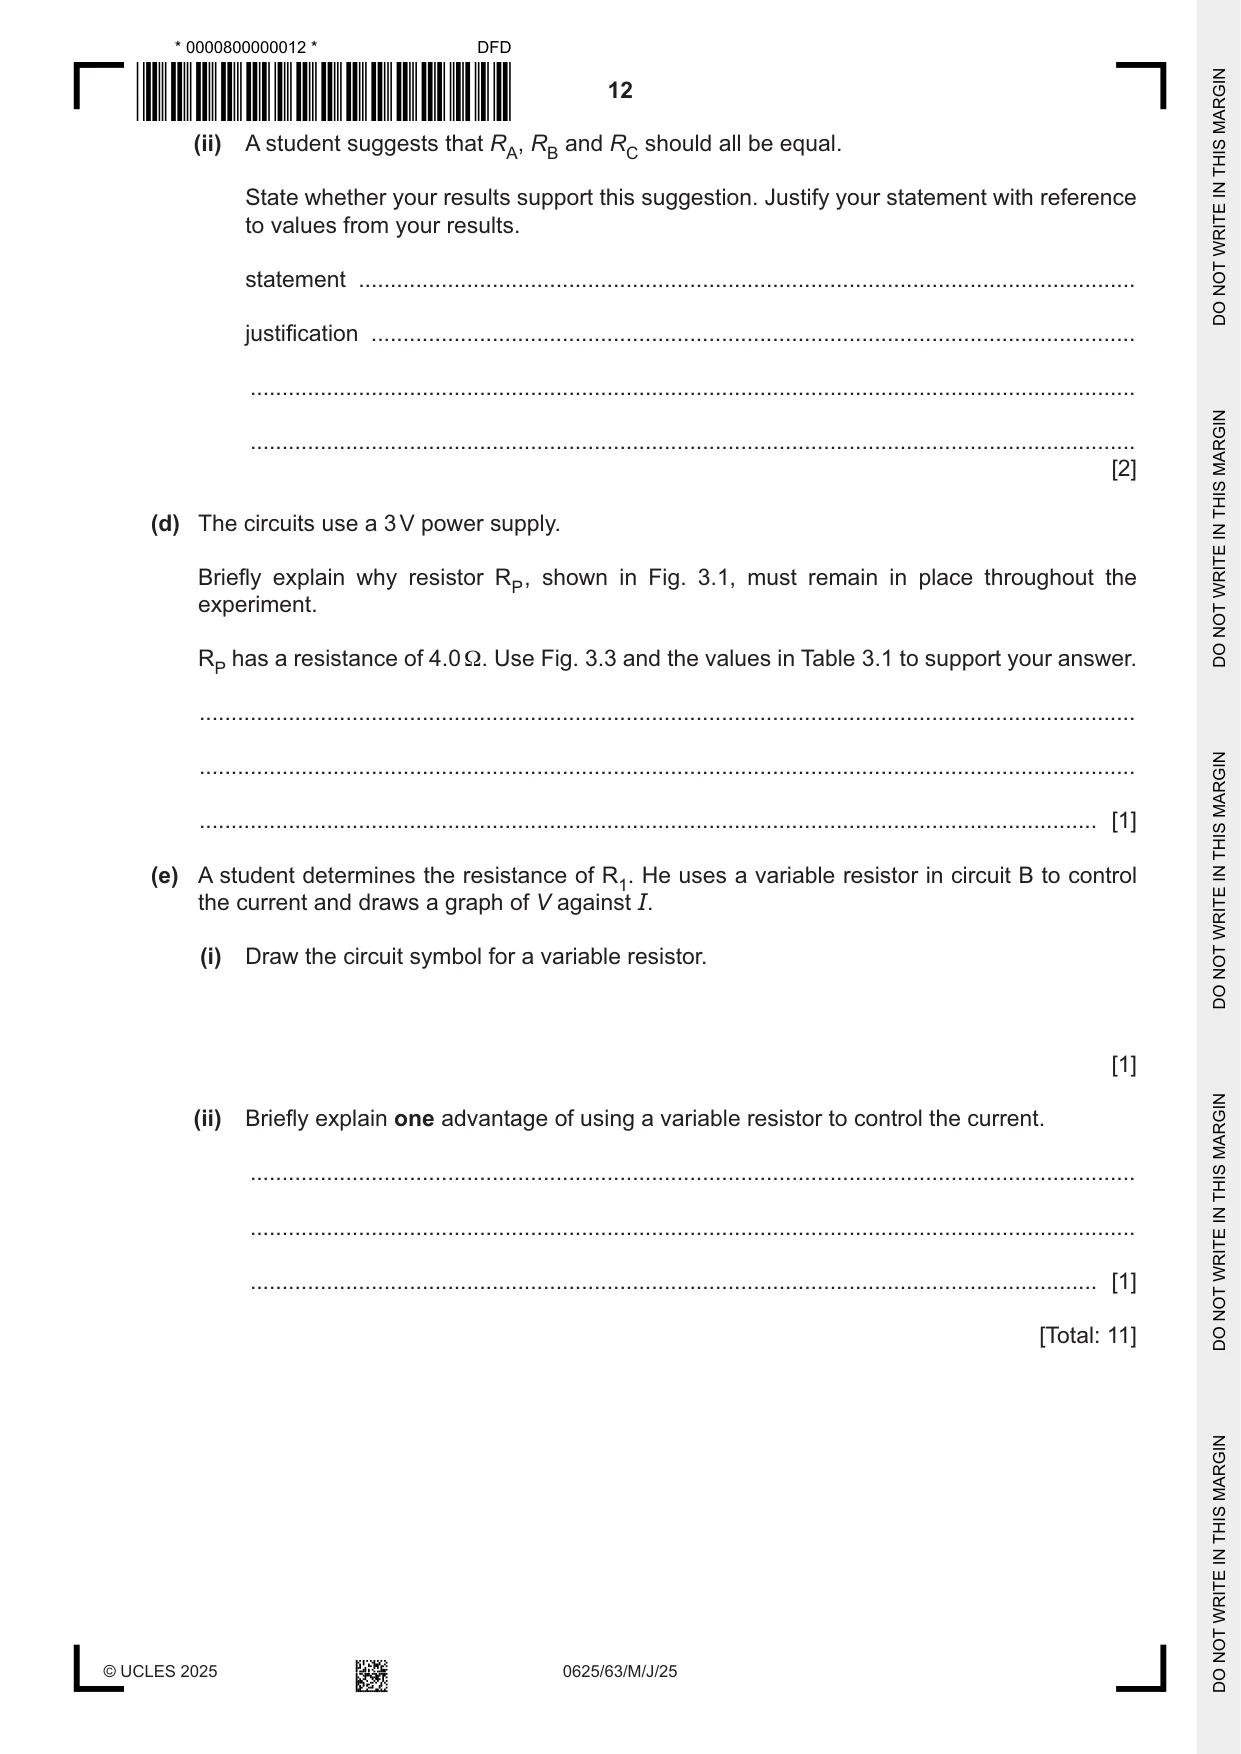
3 A student investigates circuits containing different combinations of resistors. Circuit A is shown in Fig. 3.1. Circuit A is not complete. RP R1 A P R2 Q Fig. 3.1 (a) On Fig. 3.1, complete the circuit to show a voltmeter connected to measure the potential difference (p.d.) across the terminals P and Q. [1] (b) The student measures the potential difference V across the parallel combination of resistors R1 and R2 and measures the current I in the circuit. His readings are shown in Fig. 3.2 and Fig. 3.3. 2 3 0.4 0.6 1 4 0.2 0.8 0 5 0 1.0 V A Fig. 3.2 Fig. 3.3 (i) Read, and record in the first line of Table 3.1, the values of V and I shown on the meters in Fig. 3.2 and Fig. 3.3. [2] Table 3.1 V / V I / A R / Ω circuit A circuit B 1.4 0.46 circuit C 1.8 0.29 The student rearranges the resistors between terminals P and Q, as shown in Fig. 3.4, to form circuit B and circuit C. The new values of V and I are shown in Table 3.1. Circuit B R1 P Q Circuit C R1 R2 P Q Fig. 3.4 (ii) For each circuit, calculate and record in Table 3.1 a resistance R. Use the values of V and I in Table 3.1 and the equation: V R = . I [1] (c) (i) Calculate resistance RA. Use the value of R from circuit A and the equation: RA = 2R. RA = ............................................................Ω Record resistance RB. RB is equal to the value of R from circuit B. RB = ............................................................Ω Calculate resistance RC. Use the value of R from circuit C and the equation: R RC = 2 . RC = ............................................................Ω [2] (ii) A student suggests that RA, RB and RC should all be equal. State whether your results support this suggestion. Justify your statement with reference to values from your results. statement .......................................................................................................................... justification ........................................................................................................................ ........................................................................................................................................... ........................................................................................................................................... [2] (d) The circuits use a 3 V power supply. Briefly explain why resistor RP , shown in Fig. 3.1, must remain in place throughout the experiment. RP has a resistance of 4.0 Ω. Use Fig. 3.3 and the values in Table 3.1 to support your answer. ................................................................................................................................................... ................................................................................................................................................... ............................................................................................................................................. [1] (e) A student determines the resistance of R1. He uses a variable resistor in circuit B to control the current and draws a graph of V against I. (i) Draw the circuit symbol for a variable resistor. [1] (ii) Briefly explain one advantage of using a variable resistor to control the current. ........................................................................................................................................... ........................................................................................................................................... ..................................................................................................................................... [1] [Total: 11]
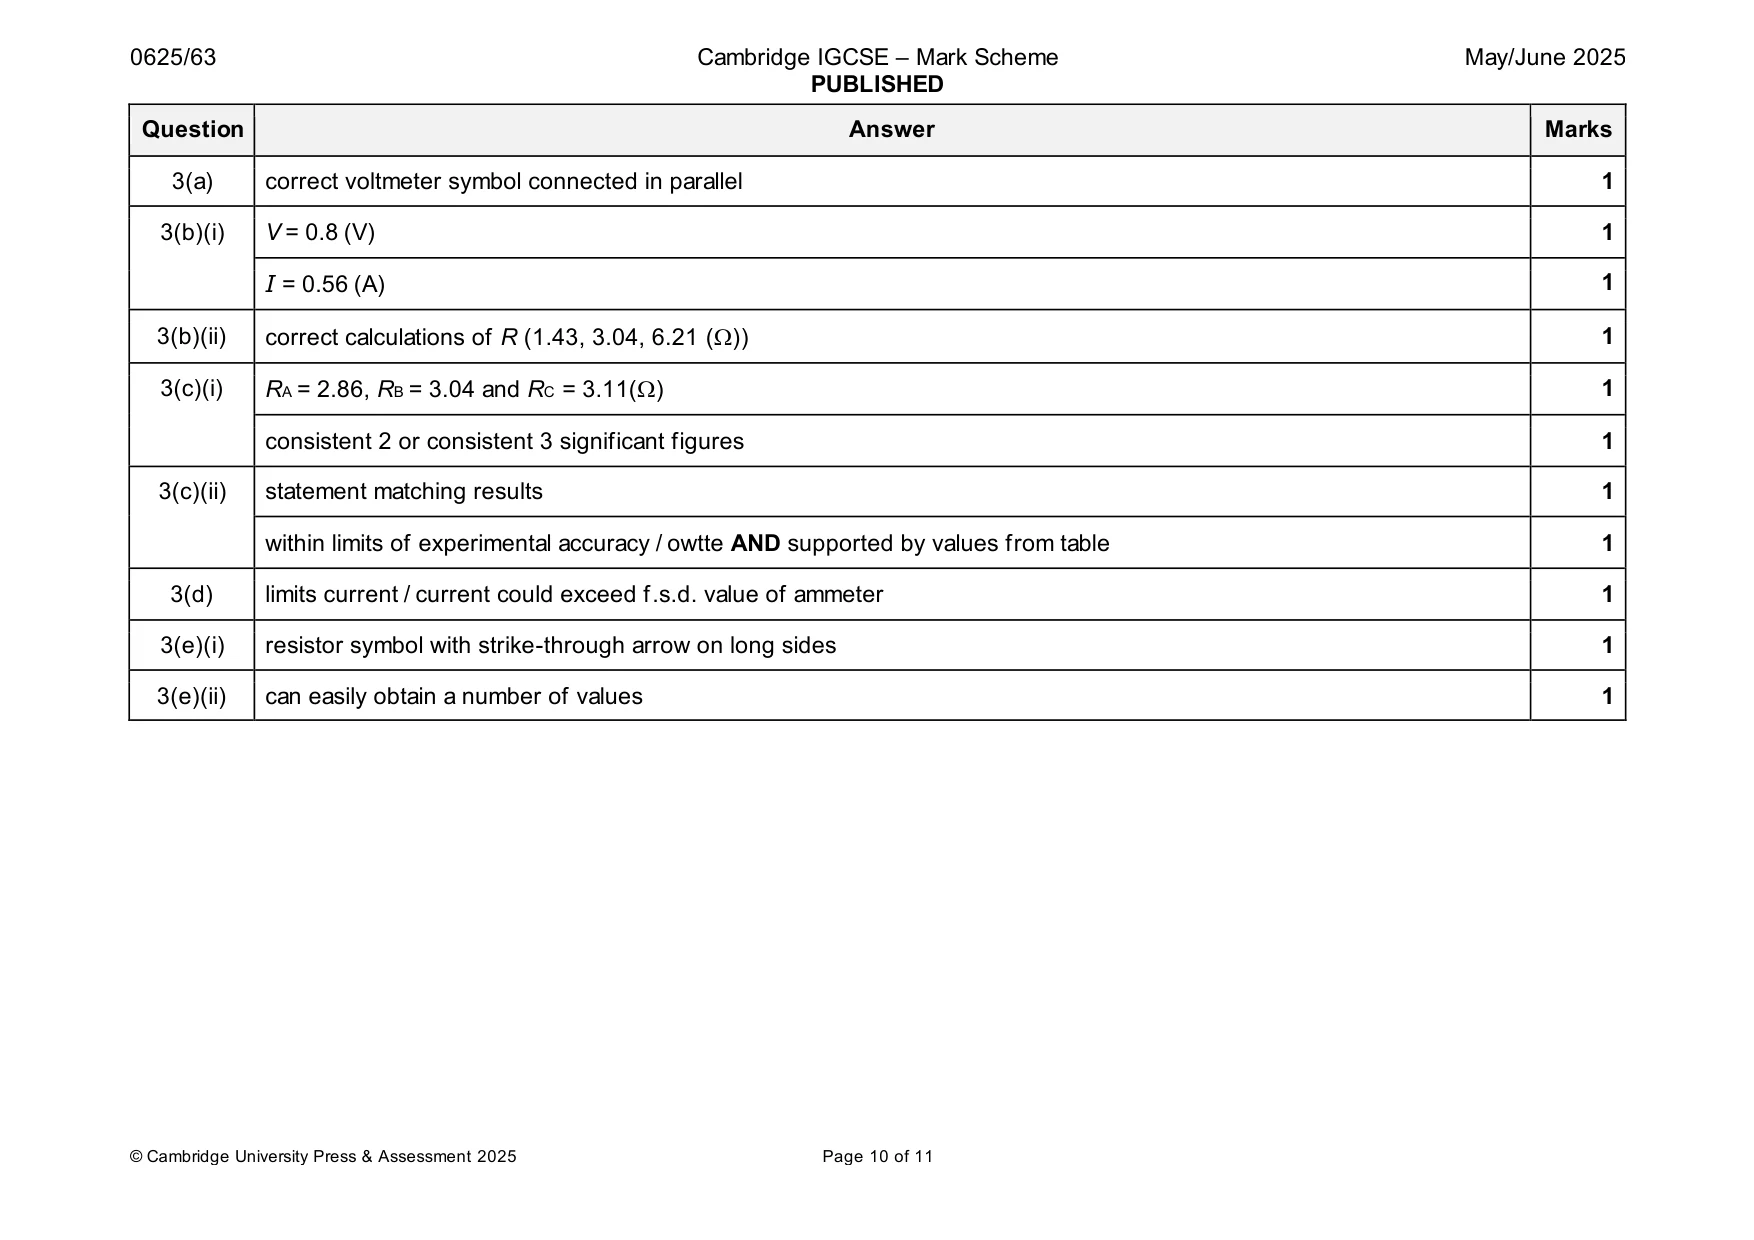
Mark scheme: 3(a) correct voltmeter symbol connected in parallel 1 3(b)(i) V = 0.8 (V) 1 I = 0.56 (A) 1 3(b)(ii) correct calculations of R (1.43, 3.04, 6.21 ()) 1 3(c)(i) RA = 2.86, RB = 3.04 and RC = 3.11() 1 consistent 2 or consistent 3 significant figures 1 3(c)(ii) statement matching results 1 within limits of experimental accuracy / owtte AND supported by values from table 1 3(d) limits current / current could exceed f.s.d. value of ammeter 1 3(e)(i) resistor symbol with strike-through arrow on long sides 1 3(e)(ii) can easily obtain a number of values 1
Q4 · A student investigates the refraction of light
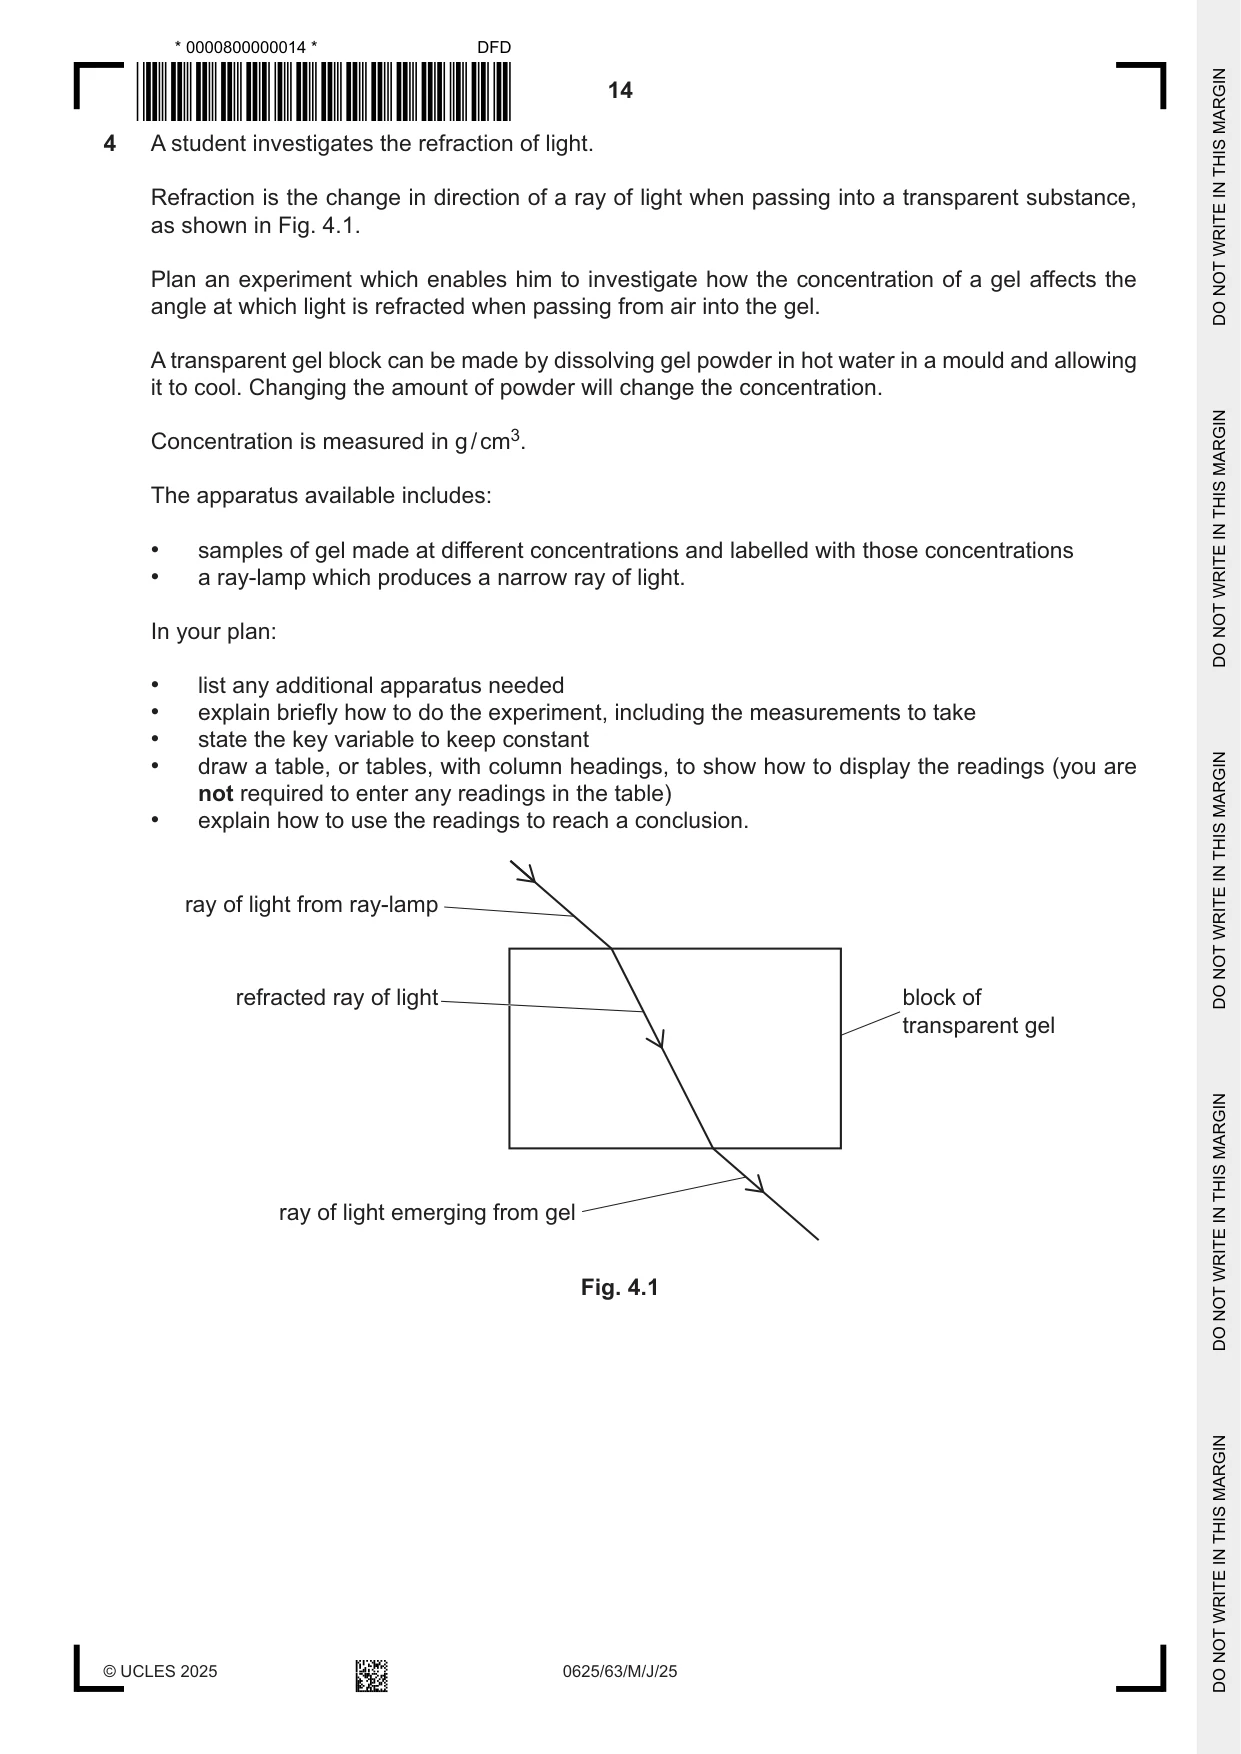
4 A student investigates the refraction of light. Refraction is the change in direction of a ray of light when passing into a transparent substance, as shown in Fig. 4.1. Plan an experiment which enables him to investigate how the concentration of a gel affects the angle at which light is refracted when passing from air into the gel. A transparent gel block can be made by dissolving gel powder in hot water in a mould and allowing it to cool. Changing the amount of powder will change the concentration. Concentration is measured in g / cm3. The apparatus available includes: • samples of gel made at different concentrations and labelled with those concentrations • a ray-lamp which produces a narrow ray of light. In your plan: • list any additional apparatus needed • explain briefly how to do the experiment, including the measurements to take • state the key variable to keep constant • draw a table, or tables, with column headings, to show how to display the readings (you are not required to enter any readings in the table) • explain how to use the readings to reach a conclusion. ray of light from ray-lamp refracted ray of light block of transparent gel ray of light emerging from gel Fig. 4.1 .......................................................................................................................................................... .......................................................................................................................................................... .......................................................................................................................................................... .......................................................................................................................................................... .......................................................................................................................................................... .......................................................................................................................................................... .......................................................................................................................................................... .......................................................................................................................................................... .......................................................................................................................................................... .......................................................................................................................................................... .......................................................................................................................................................... .......................................................................................................................................................... .......................................................................................................................................................... .......................................................................................................................................................... .......................................................................................................................................................... .......................................................................................................................................................... .......................................................................................................................................................... .......................................................................................................................................................... .......................................................................................................................................................... .................................................................................................................................................... [7]
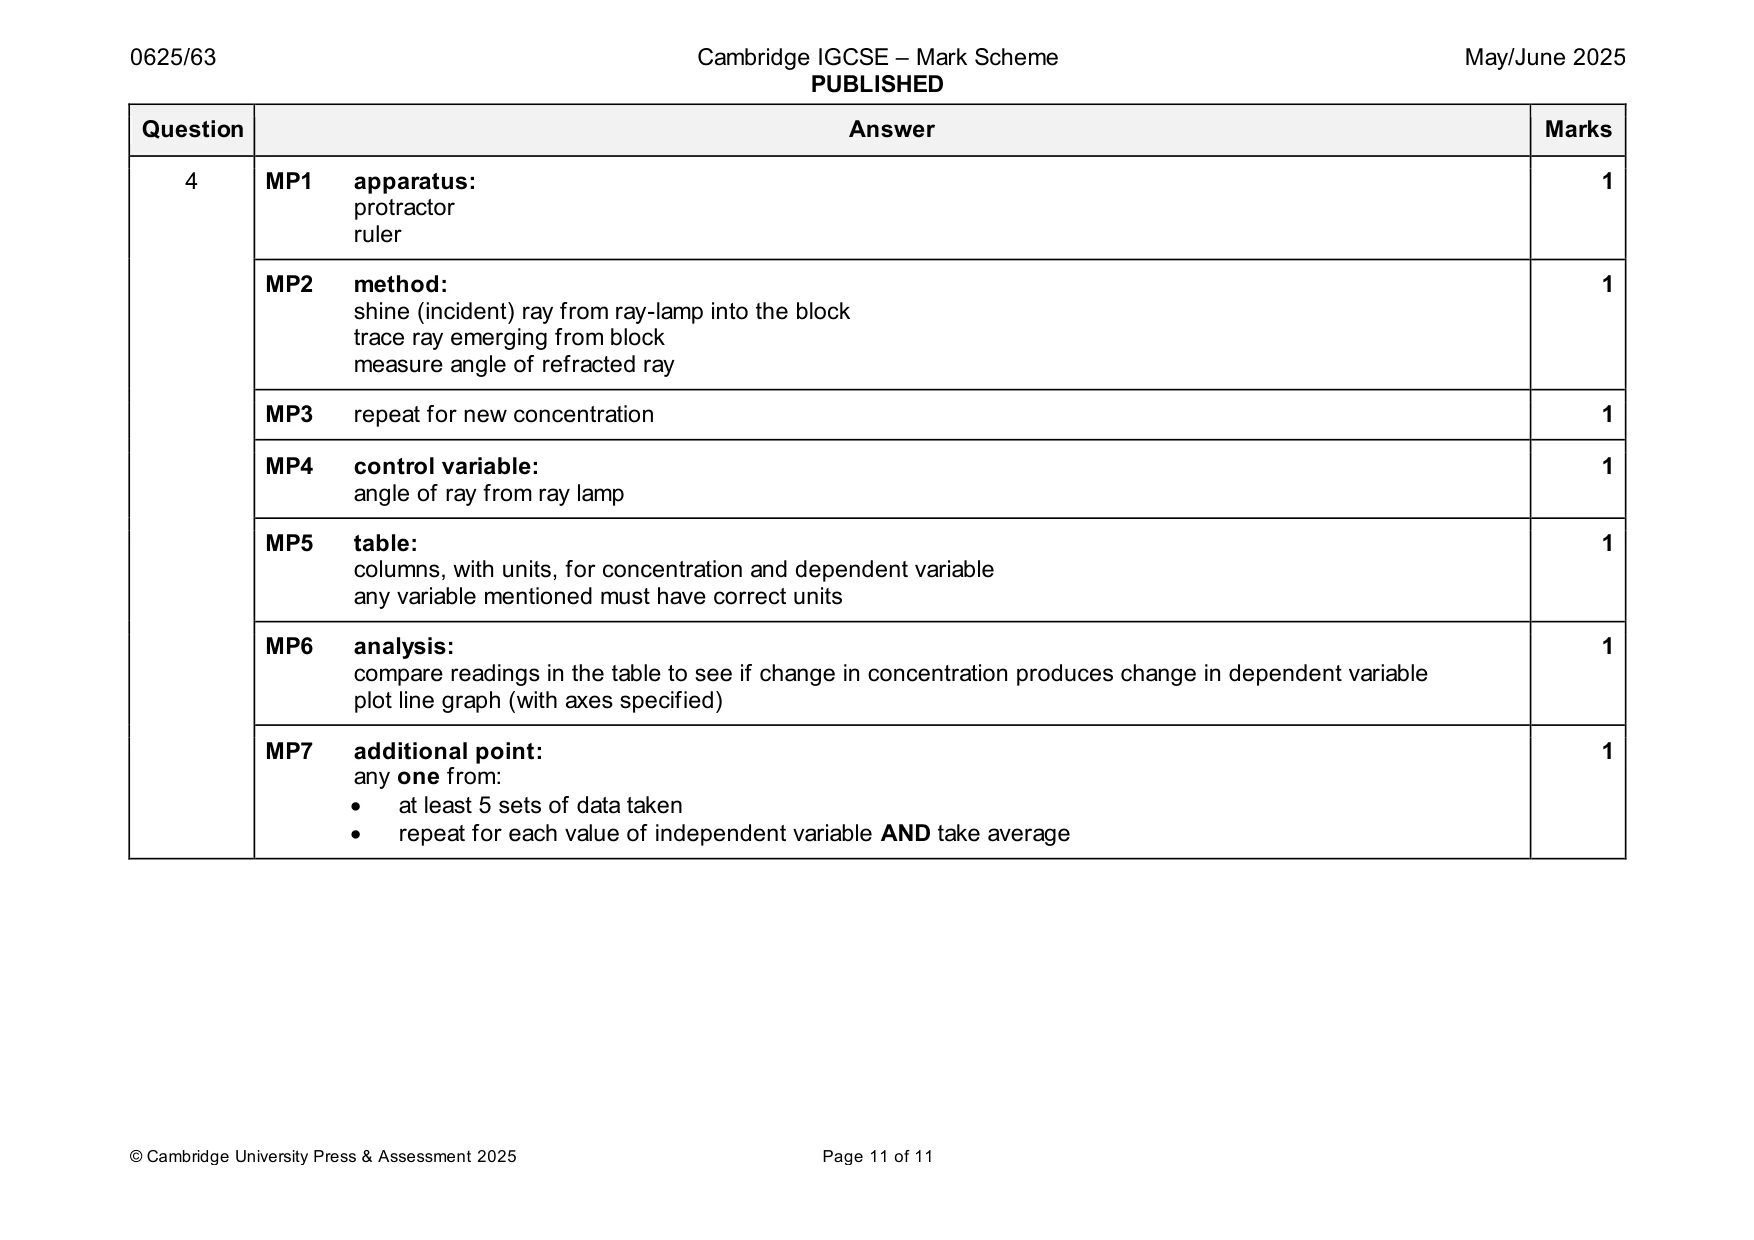
Mark scheme: 4 MP1 apparatus: 1 protractor ruler MP2 method: 1 shine (incident) ray from ray-lamp into the block trace ray emerging from block measure angle of refracted ray MP3 repeat for new concentration 1 MP4 control variable: 1 angle of ray from ray lamp MP5 table: 1 columns, with units, for concentration and dependent variable any variable mentioned must have correct units MP6 analysis: 1 compare readings in the table to see if change in concentration produces change in dependent variable plot line graph (with axes specified) MP7 additional point: 1 any one from: • at least 5 sets of data taken • repeat for each value of independent variable AND take average
What was in this paper
The subtopics covered by these 4 questions, and how many questions each got. Open one in a new tab to see every Cambridge question on it.
What you needed in this session
Cambridge’s own grade thresholds for 2025 May/June, Paper 6 · Variant 3. A higher threshold means an easier paper — the bar moves with how the cohort did.