Cambridge IGCSE Physics 0625 — 2016 May/June Paper 6 · Variant 2
0625/62/M/J/16 · 5 questions · 40 marks · ≈45 min
The question paper and its mark scheme, free to read here and free to download. This is Cambridge’s own paper, exactly as it was sat.
Question paper12 pages
Mark scheme6 pages
Answers below. Sit the paper first if you are practising.
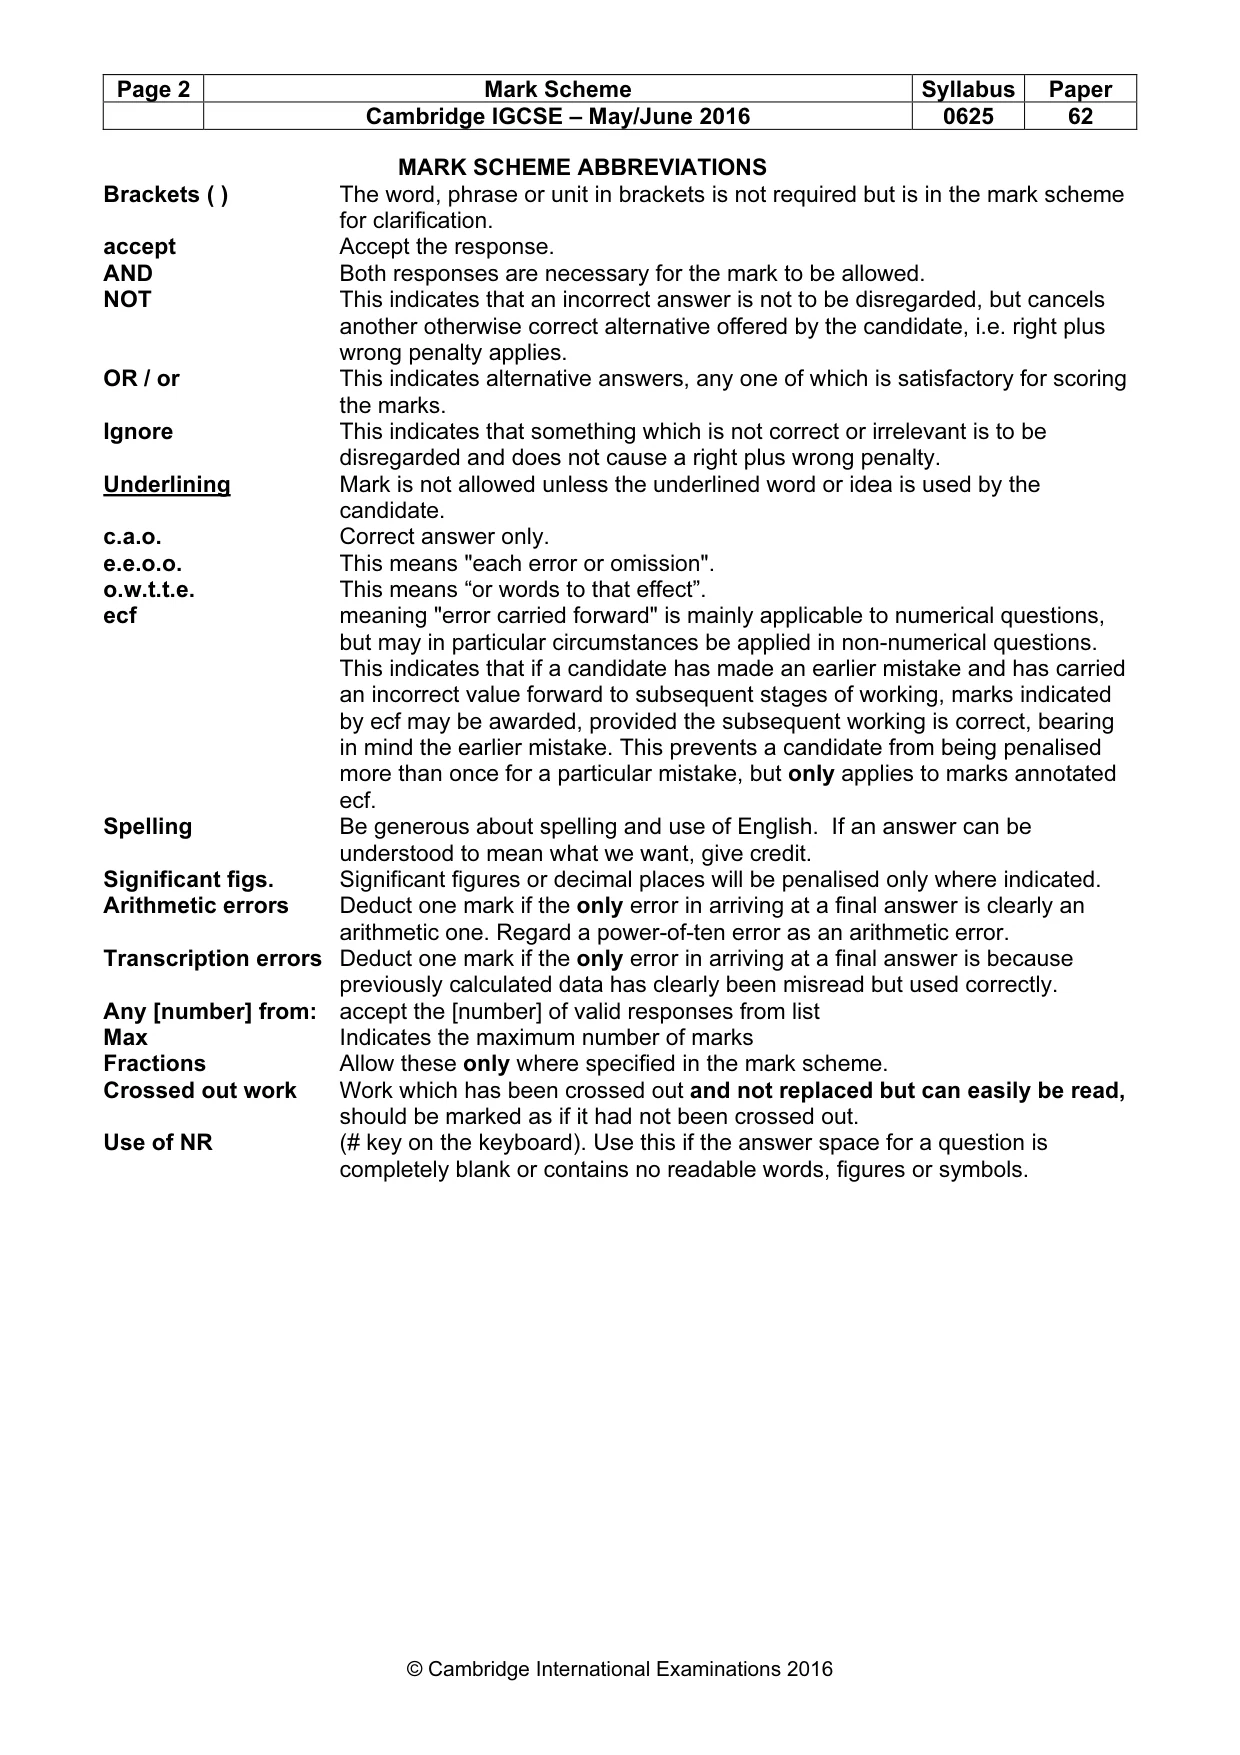
Questions as text
Q1 · A student is investigating the stretching of a spring
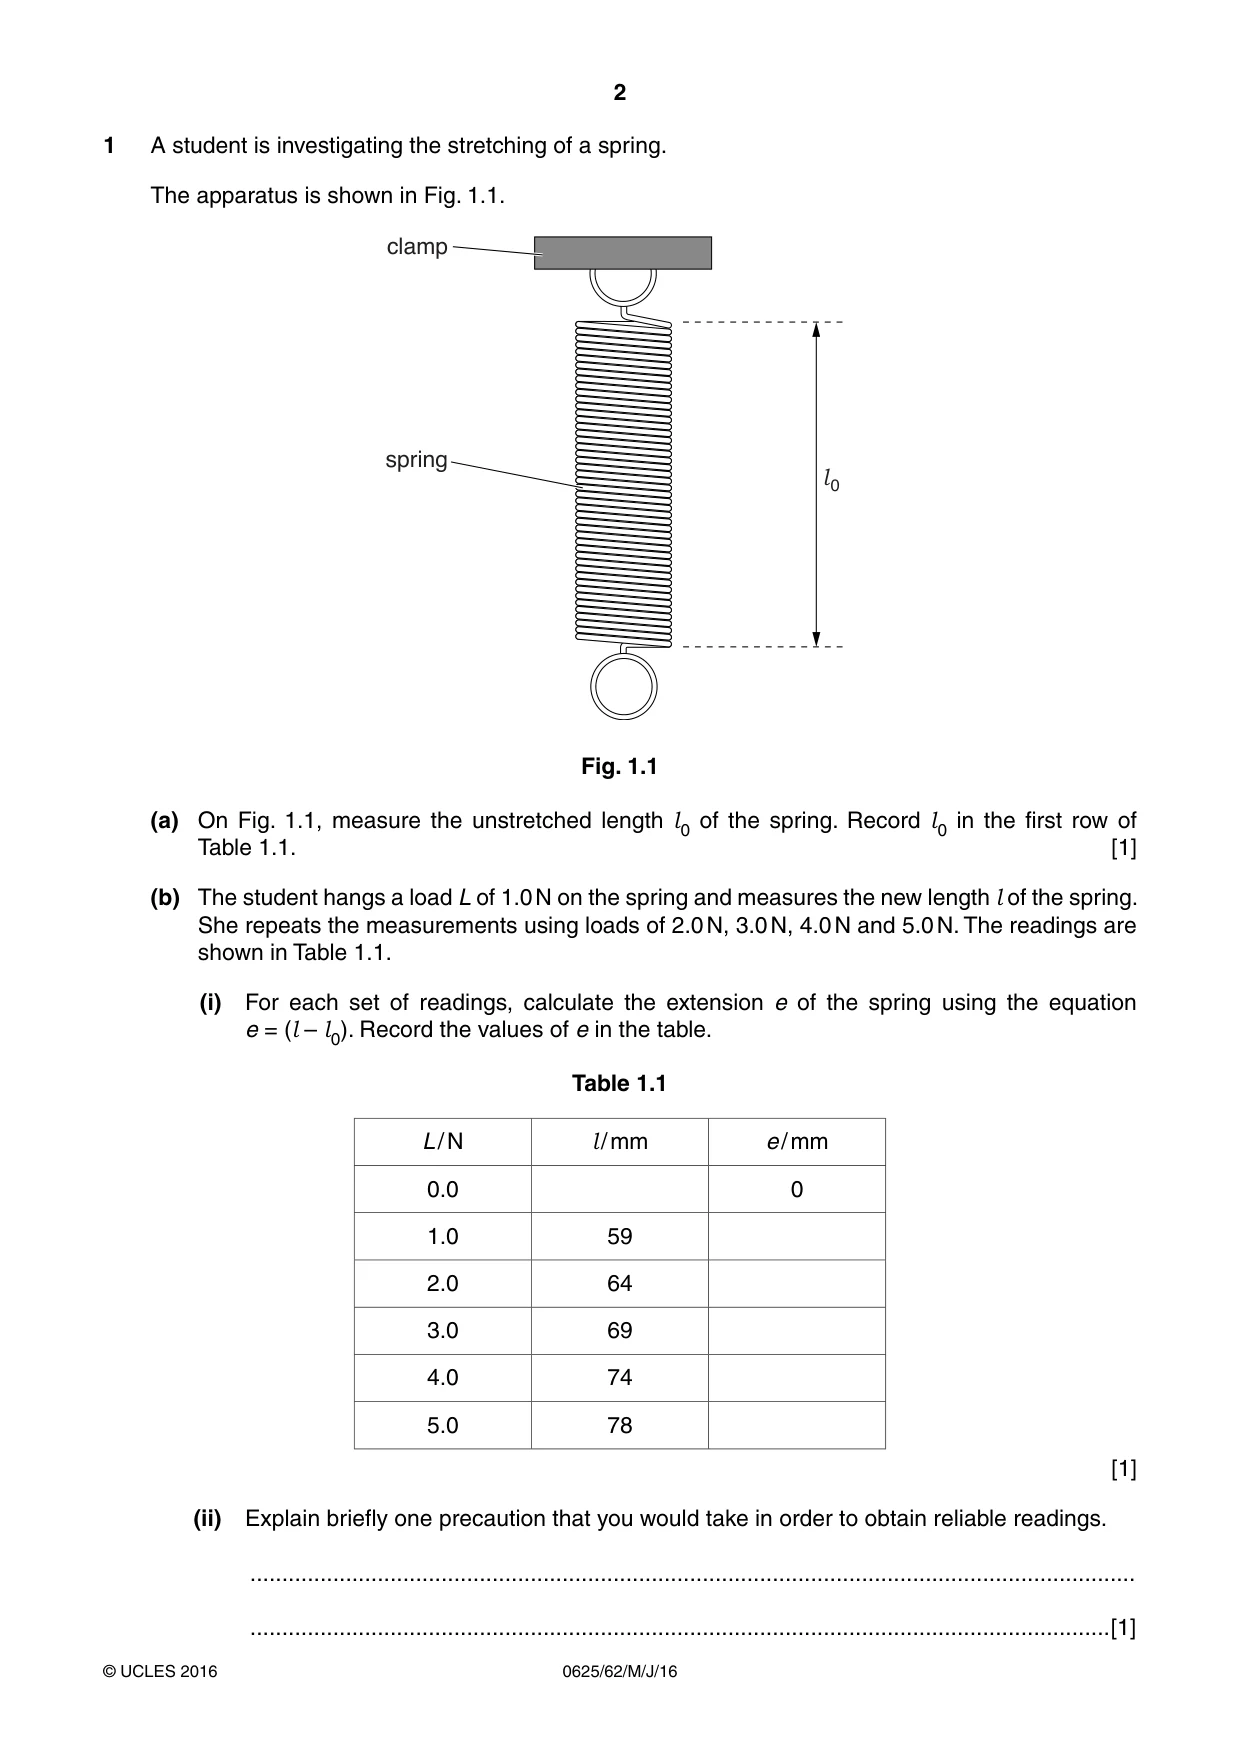
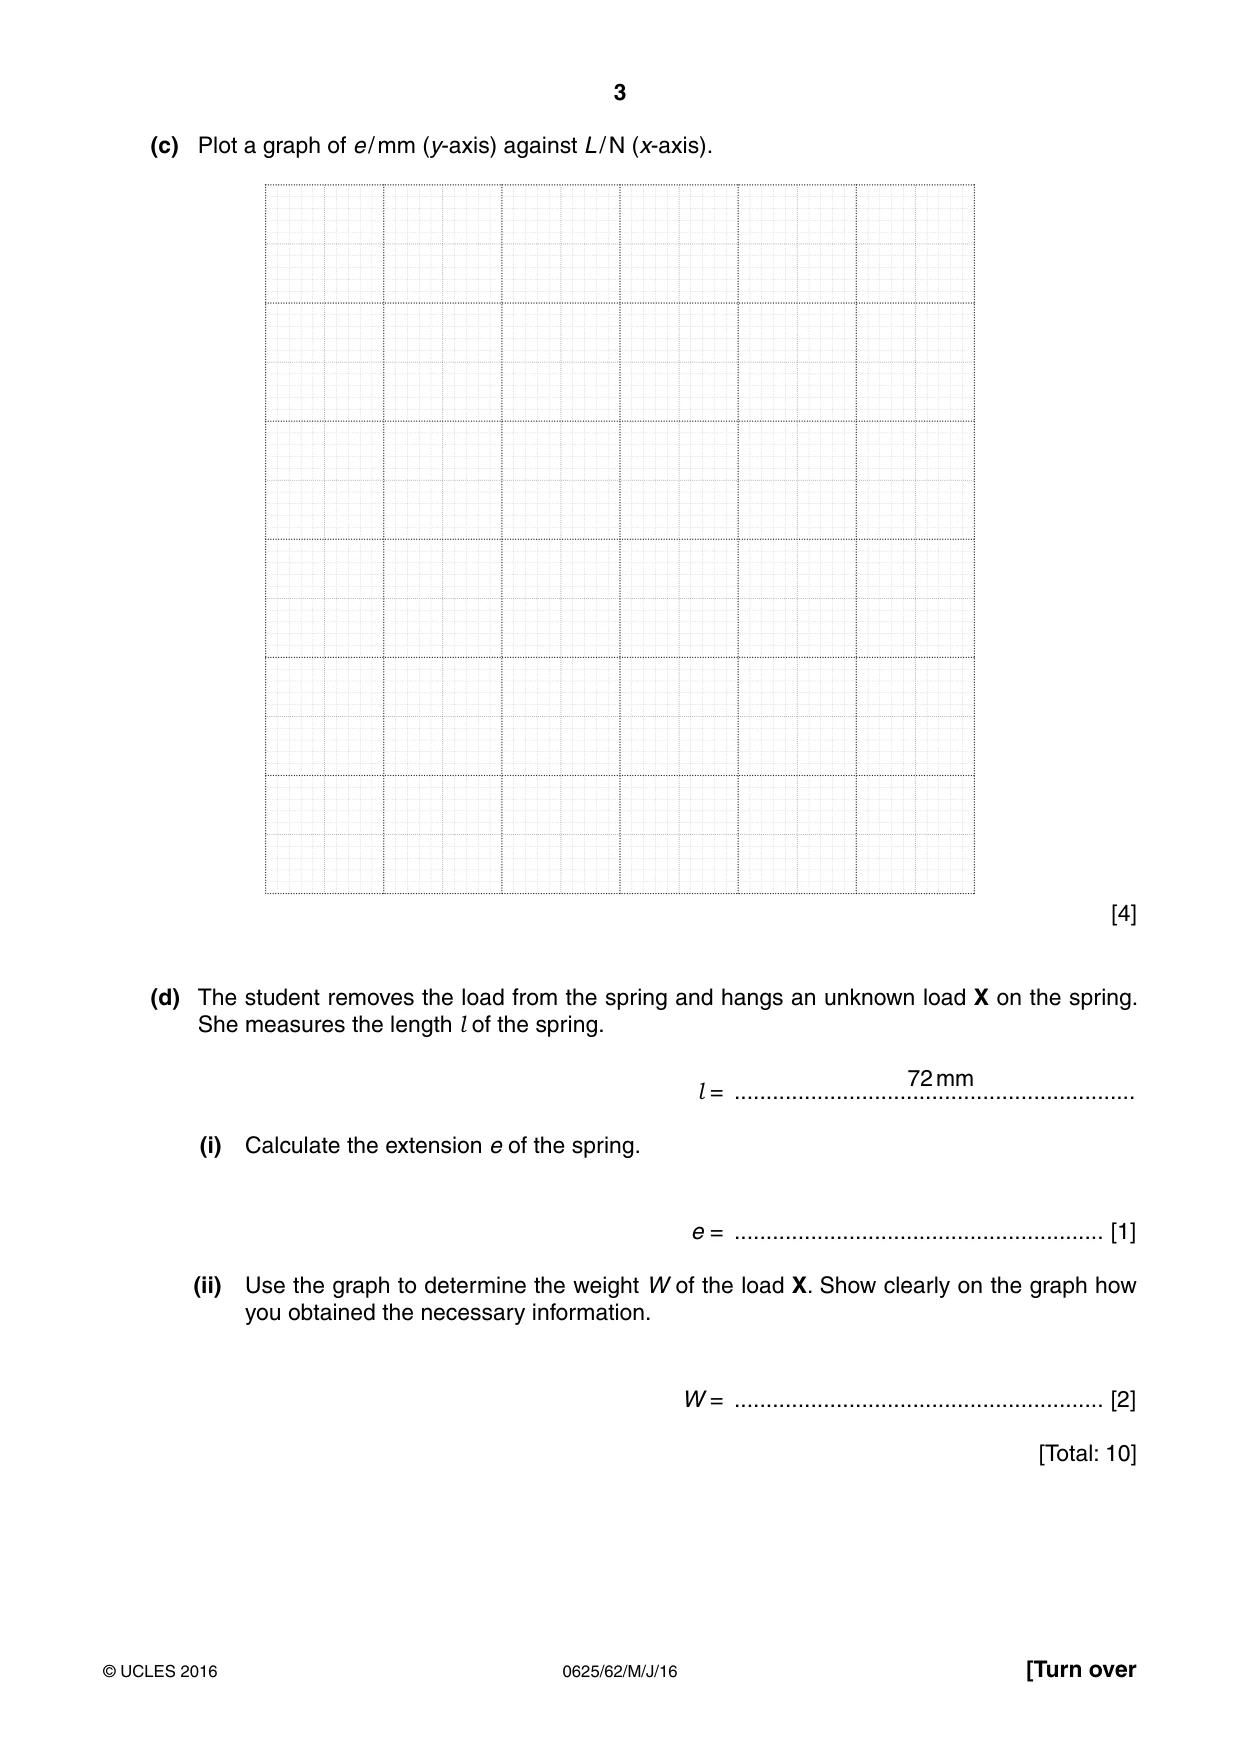
1 A student is investigating the stretching of a spring. The apparatus is shown in Fig. 1.1. clamp spring l 0 Fig. 1.1 (a) On Fig. 1.1, measure the unstretched length l of the spring. Record l in the first row of 0 0 Table 1.1. [1] (b) The student hangs a load L of 1.0 N on the spring and measures the new length l of the spring. She repeats the measurements using loads of 2.0 N, 3.0 N, 4.0 N and 5.0 N. The readings are shown in Table 1.1. (i) For each set of readings, calculate the extension e of the spring using the equation e = (l – l 0). Record the values of e in the table. Table 1.1 L / N l / mm e / mm 0.0 0 1.0 59 2.0 64 3.0 69 4.0 74 5.0 78 [1] (ii) Explain briefly one precaution that you would take in order to obtain reliable readings. ........................................................................................................................................... .......................................................................................................................................[1] (c) Plot a graph of e / mm (y-axis) against L / N (x-axis). [4] (d) The student removes the load from the spring and hangs an unknown load X on the spring. She measures the length l of the spring. 72 mm l = ............................................................... (i) Calculate the extension e of the spring. e = .......................................................... [1] (ii) Use the graph to determine the weight W of the load X. Show clearly on the graph how you obtained the necessary information. W = .......................................................... [2] [Total: 10]
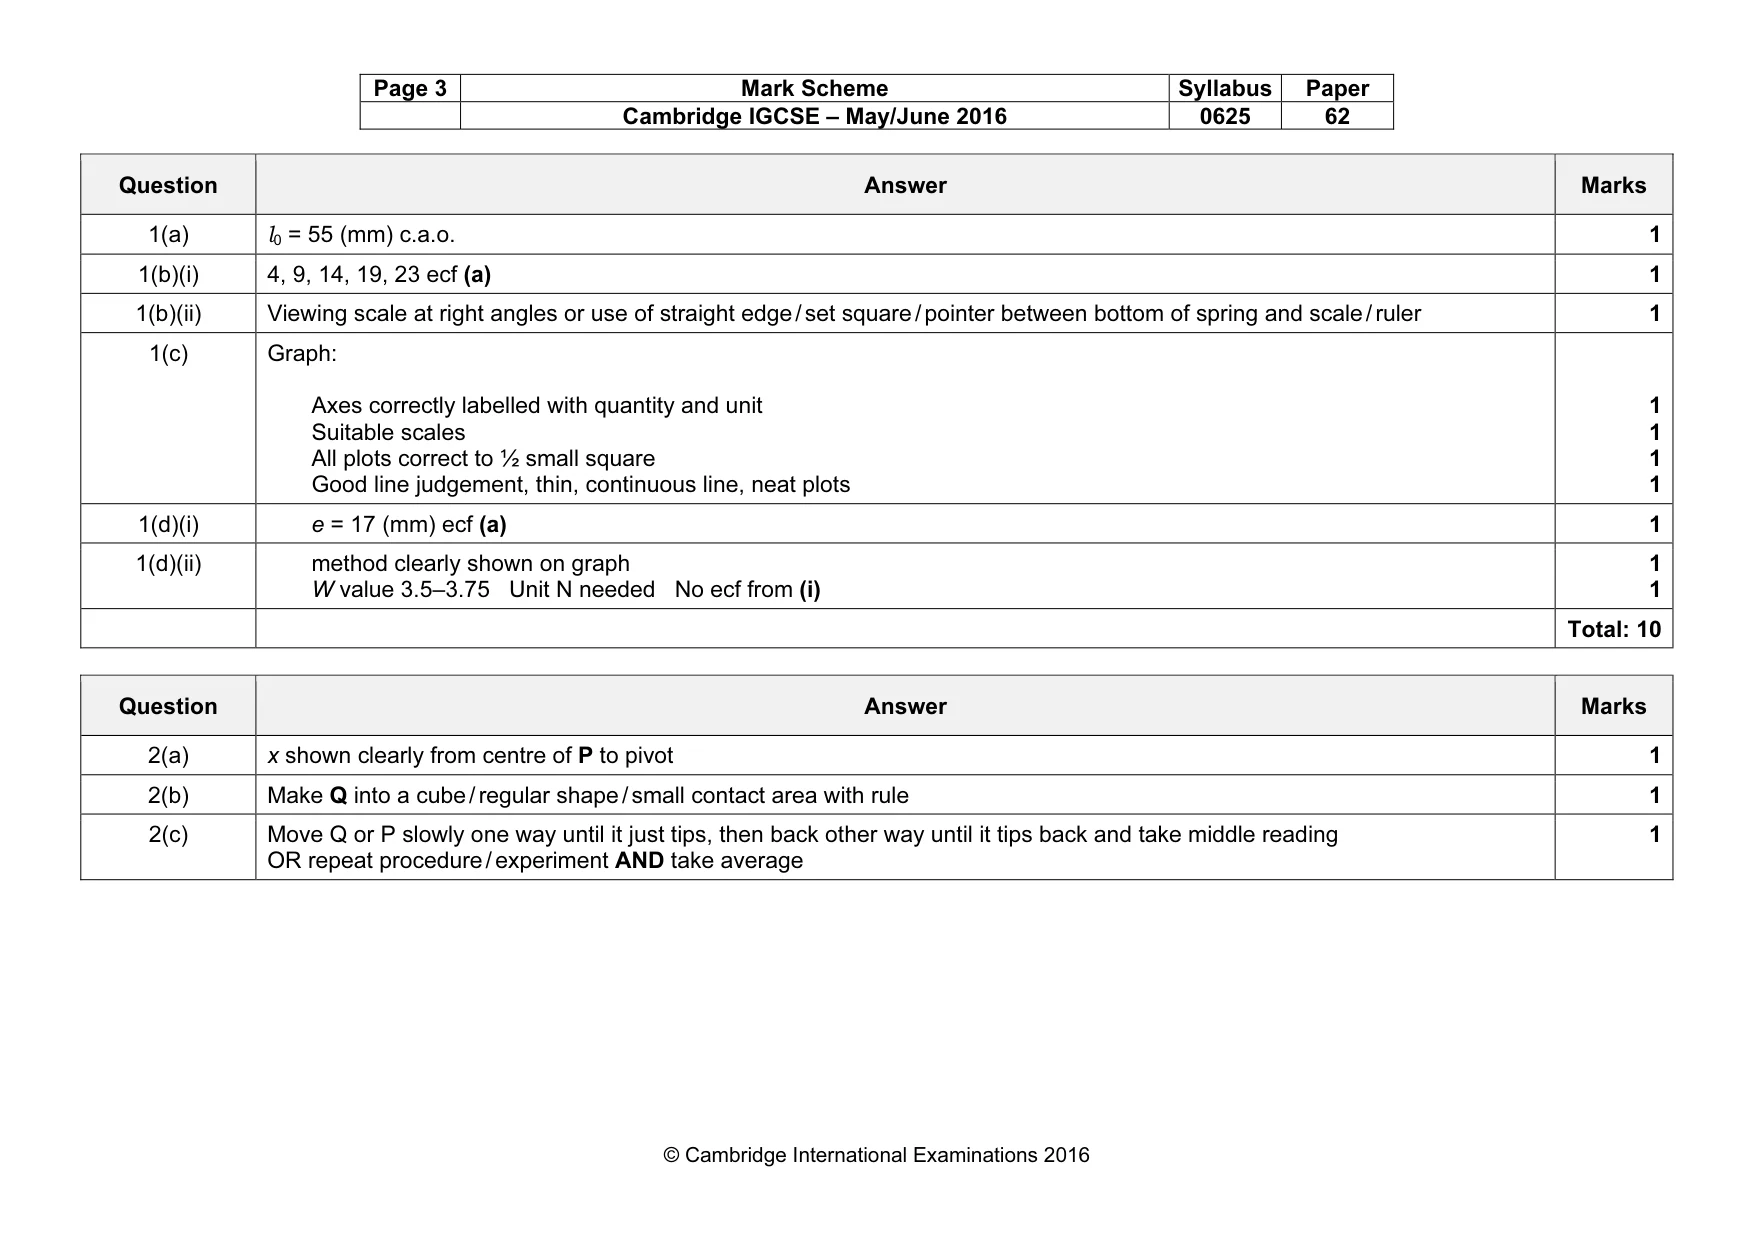
Mark scheme: 1(a) 1 1(b)(i) 4, 9, 14, 19, 23 ecf (a) 1 1(b)(ii) Viewing scale at right angles or use of straight edge / set square / pointer between bottom of spring and scale / ruler 1 1(c) Graph: Axes correctly labelled with quantity and unit Suitable scales All plots correct to ½ small square Good line judgement, thin, continuous line, neat plots 1 1 1 1 1(d)(i) e = 17 (mm) ecf (a) 1 1(d)(ii) method clearly shown on graph W value 3.5–3.75 Unit N needed No ecf from (i) 1 1 Total: 10
Q2 · A student is using a balancing method to determine the weight of a piece of soft…
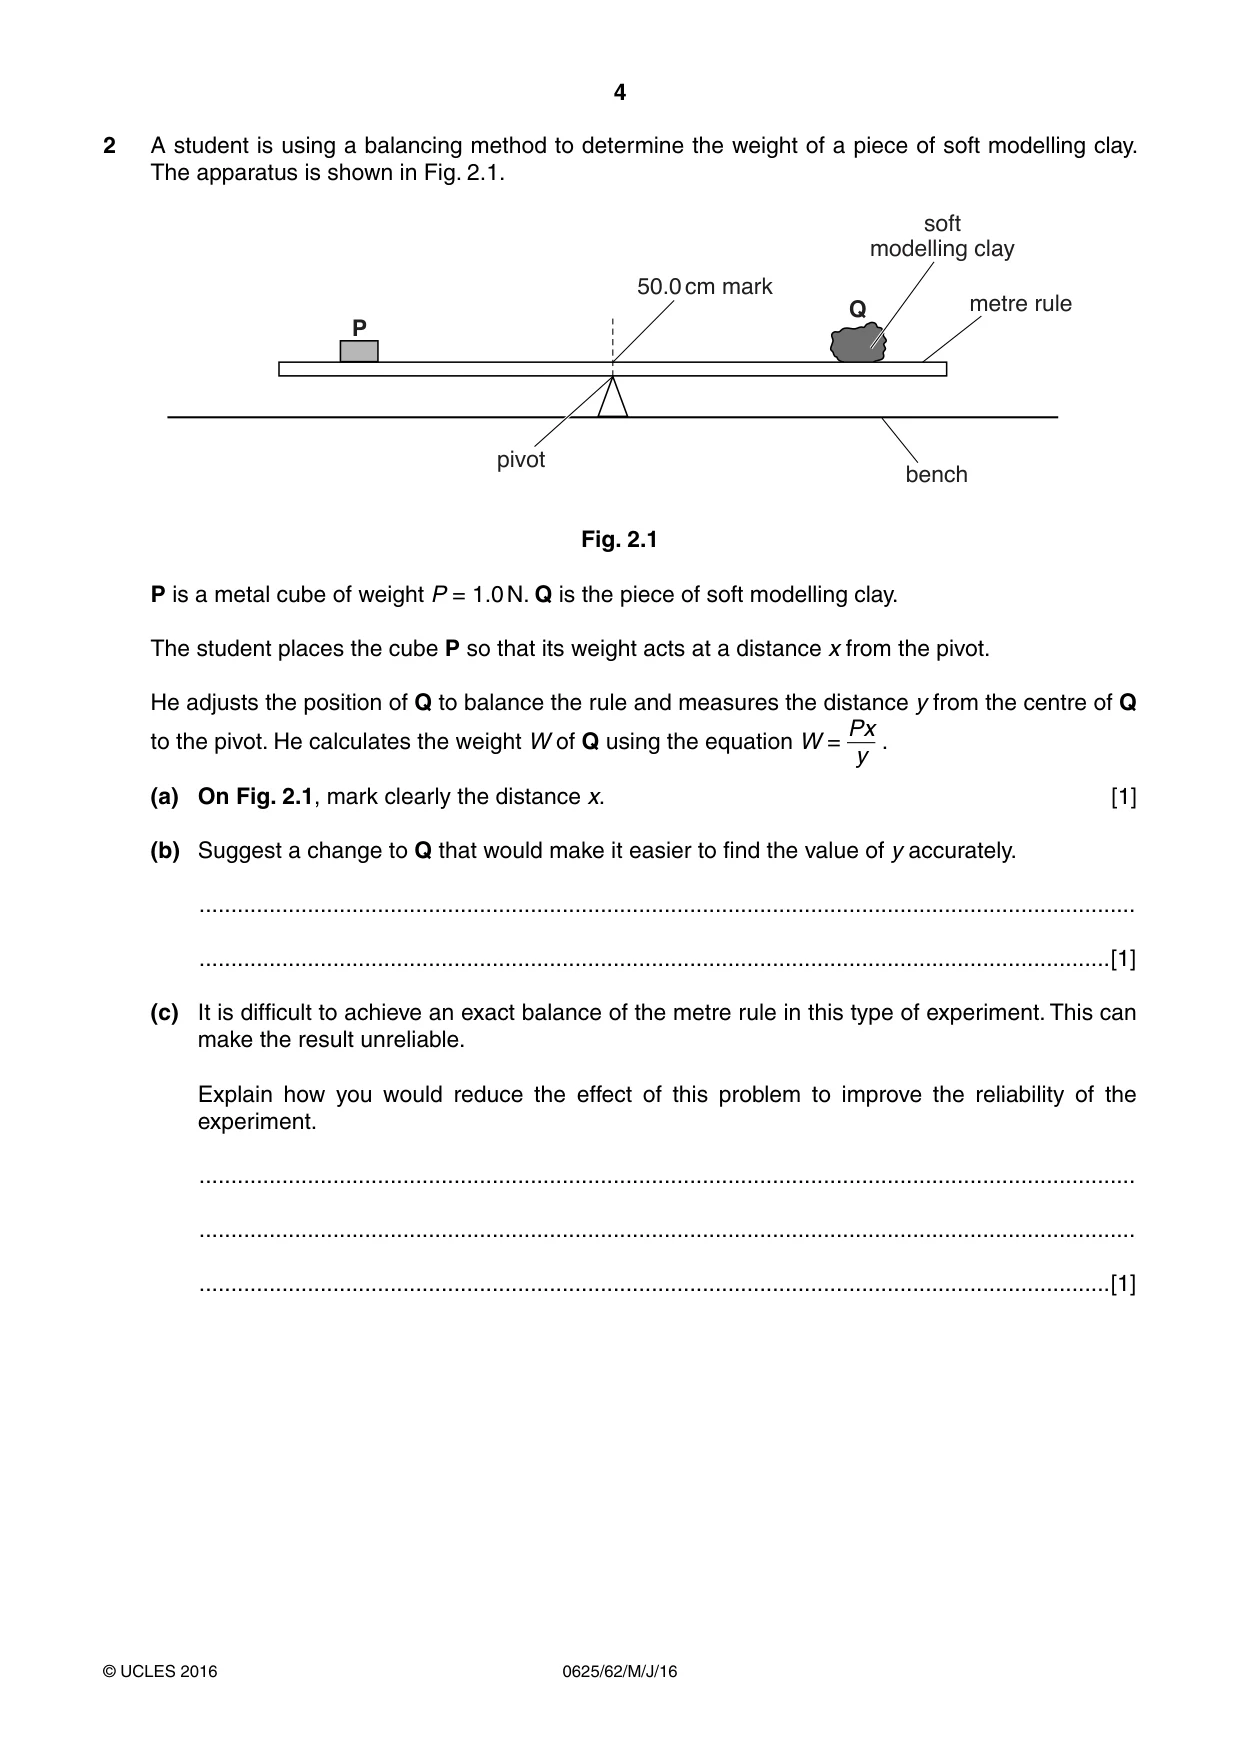
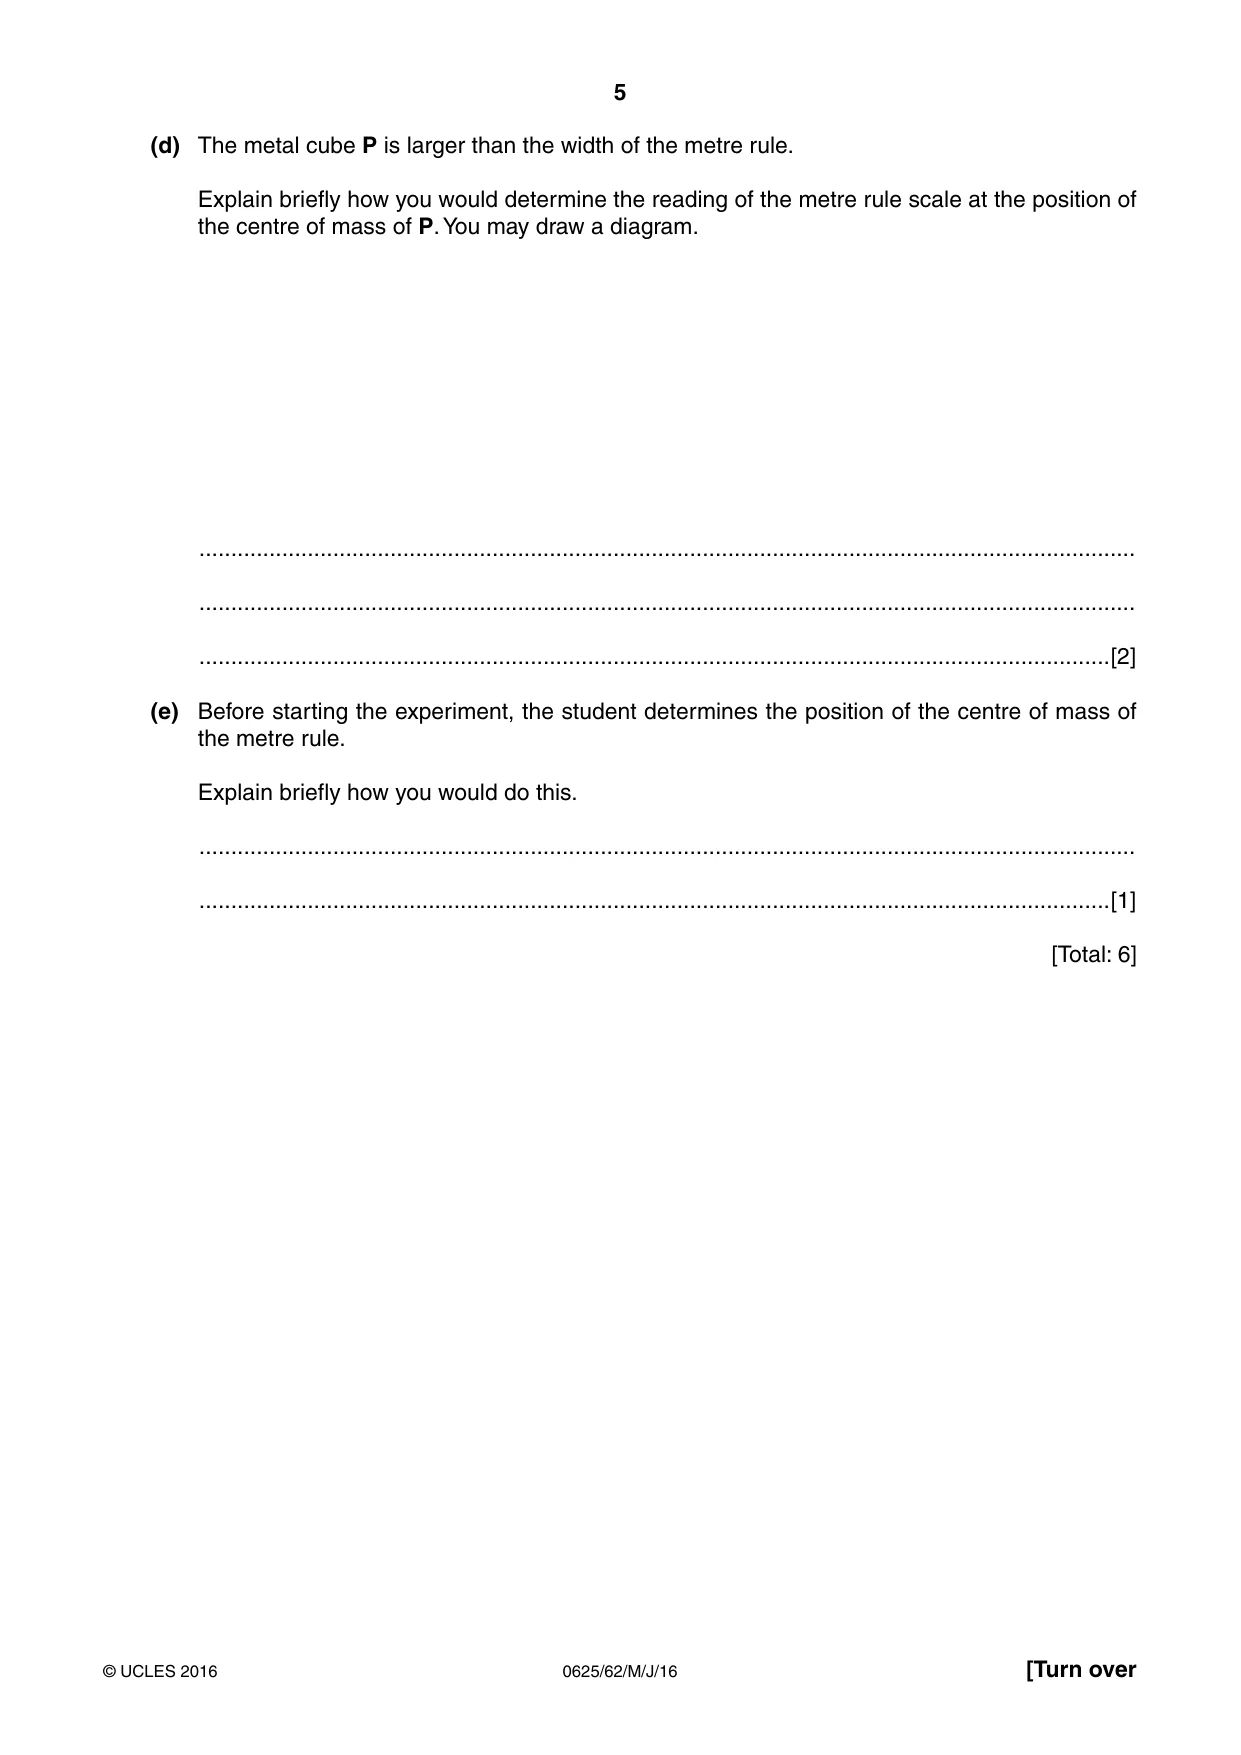
2 A student is using a balancing method to determine the weight of a piece of soft modelling clay. The apparatus is shown in Fig. 2.1. soft modelling clay 50.0 cm mark metre rule Q P pivot bench Fig. 2.1 P is a metal cube of weight P = 1.0 N. Q is the piece of soft modelling clay. The student places the cube P so that its weight acts at a distance x from the pivot. He adjusts the position of Q to balance the rule and measures the distance y from the centre of Q Px to the pivot. He calculates the weight W of Q using the equation W = . y (a) On Fig. 2.1, mark clearly the distance x. [1] (b) Suggest a change to Q that would make it easier to find the value of y accurately. ................................................................................................................................................... ...............................................................................................................................................[1] (c) It is difficult to achieve an exact balance of the metre rule in this type of experiment. This can make the result unreliable. Explain how you would reduce the effect of this problem to improve the reliability of the experiment. ................................................................................................................................................... ................................................................................................................................................... ...............................................................................................................................................[1] (d) The metal cube P is larger than the width of the metre rule. Explain briefly how you would determine the reading of the metre rule scale at the position of the centre of mass of P. You may draw a diagram. ................................................................................................................................................... ................................................................................................................................................... ...............................................................................................................................................[2] (e) Before starting the experiment, the student determines the position of the centre of mass of the metre rule. Explain briefly how you would do this. ................................................................................................................................................... ...............................................................................................................................................[1] [Total: 6]
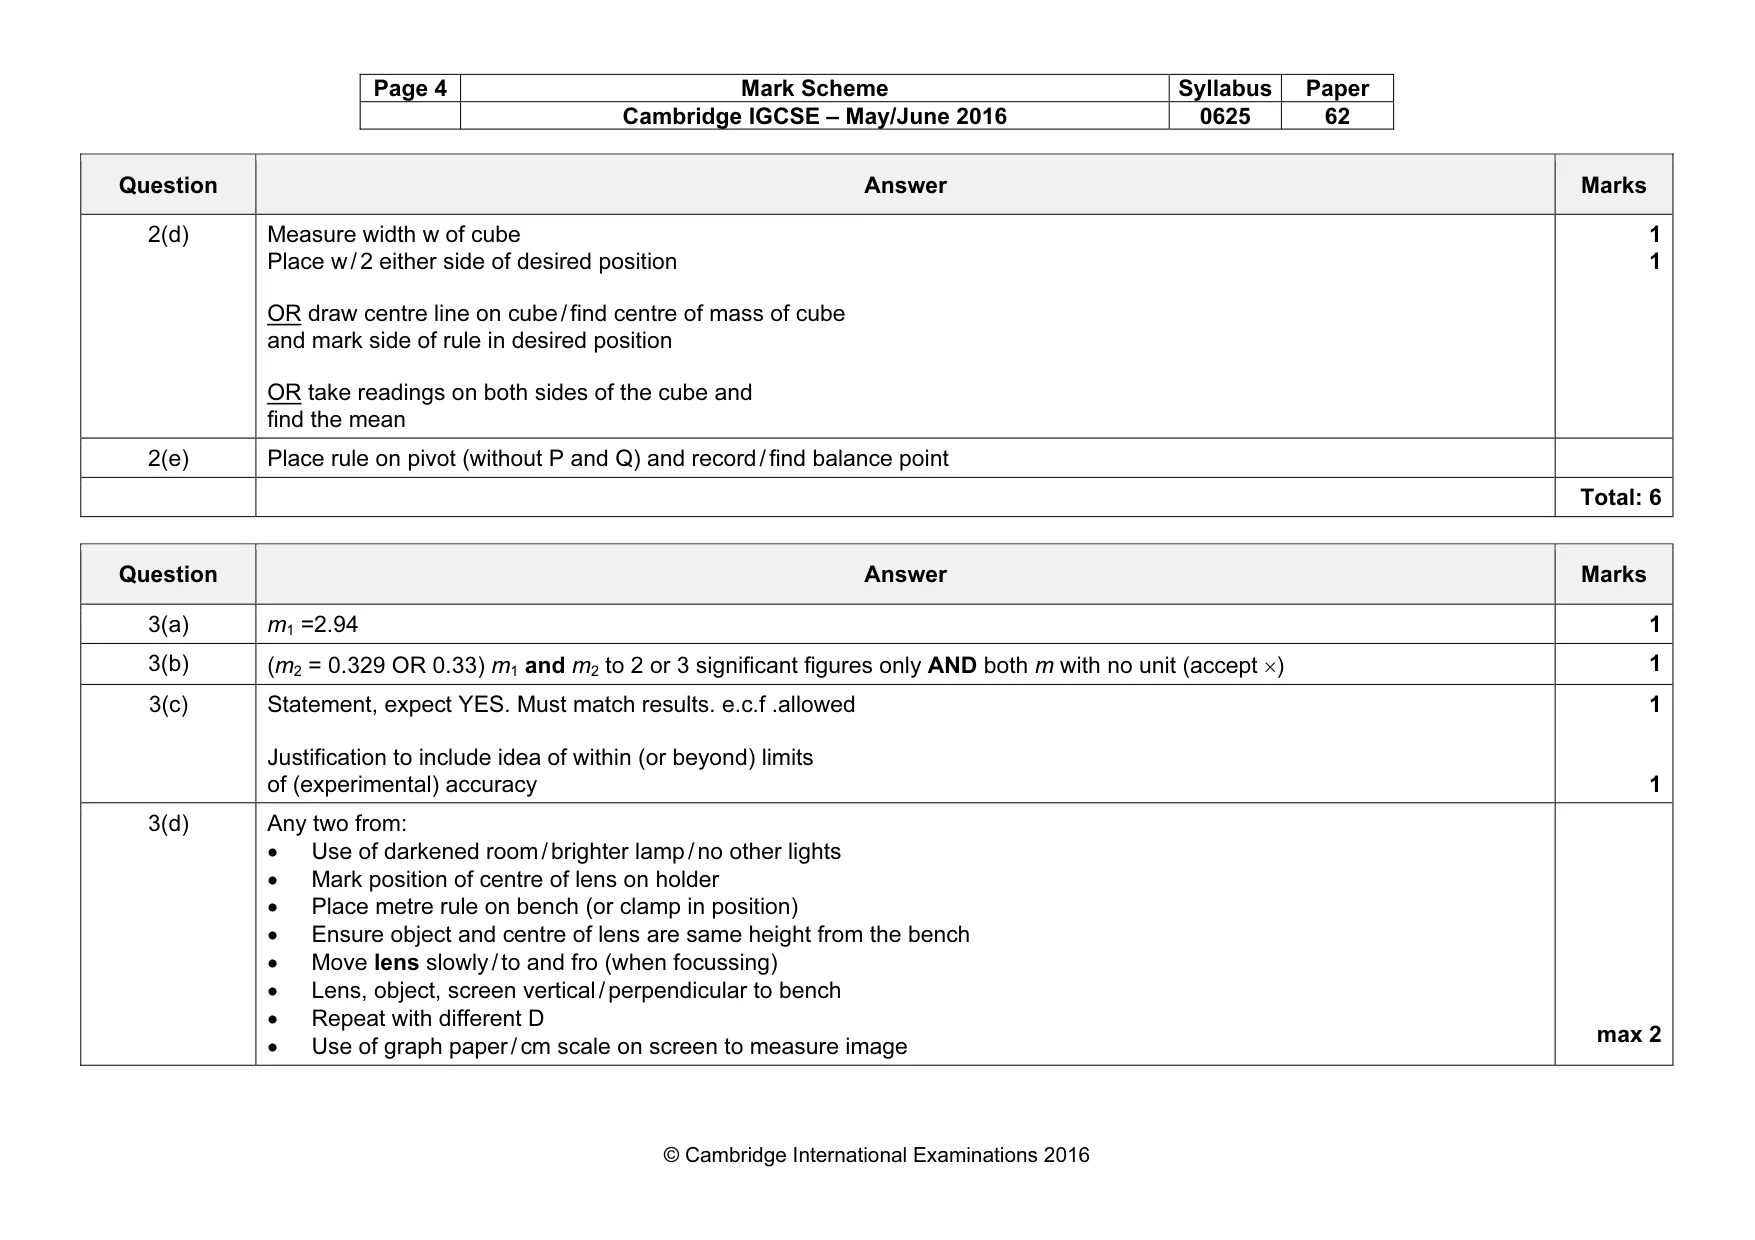
Mark scheme: 2(a) 1 2(b) Make Q into a cube / regular shape / small contact area with rule 1 2(c) Move Q or P slowly one way until it just tips, then back other way until it tips back and take middle reading OR repeat procedure / experiment AND take average 1 Question Answer Marks 2(d) Measure width w of cube Place w / 2 either side of desired position OR draw centre line on cube / find centre of mass of cube and mark side of rule in desired position OR take readings on both sides of the cube and find the mean 1 1 2(e) Place rule on pivot (without P and Q) and record / find balance point Total: 6
More questions on Physical quantities and measurement techniques
Q3 · A student is investigating the magnification of images produced by a lens
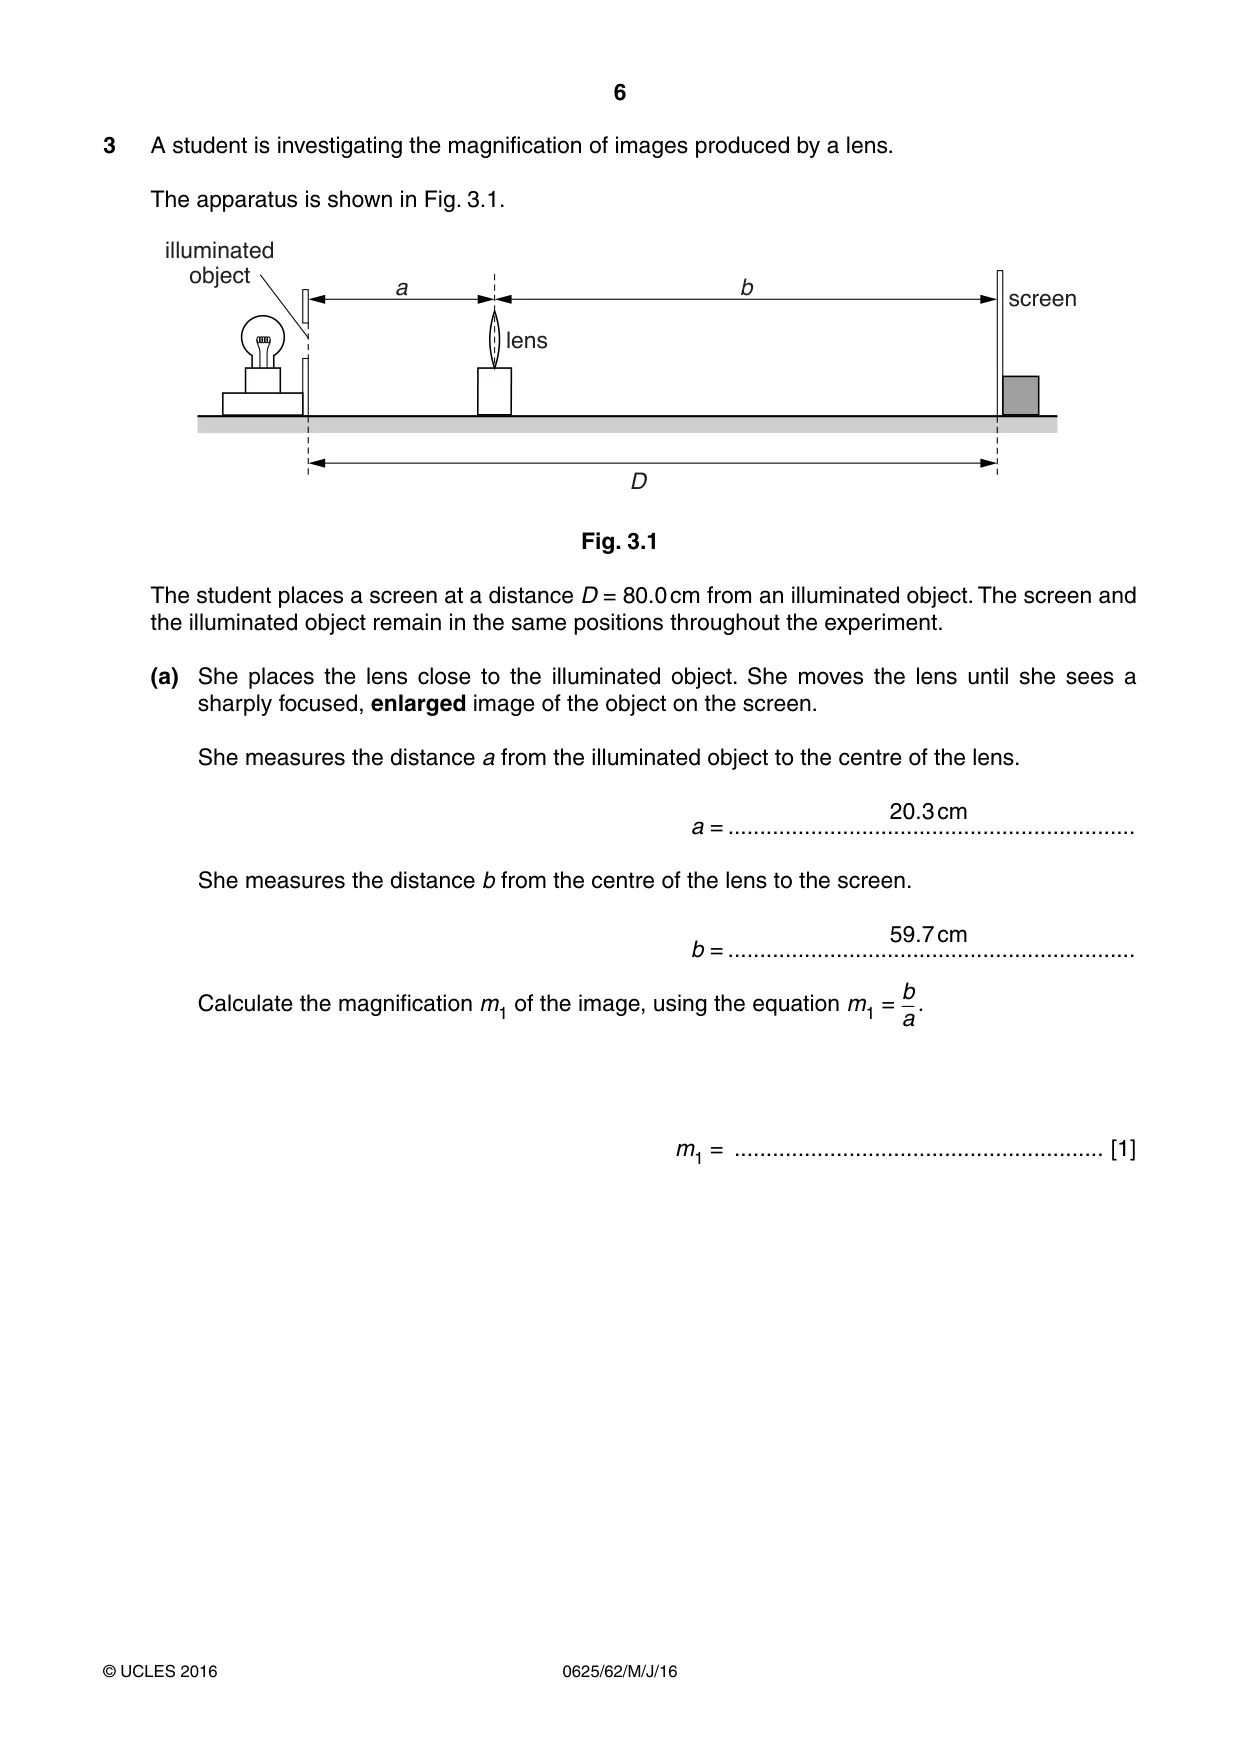
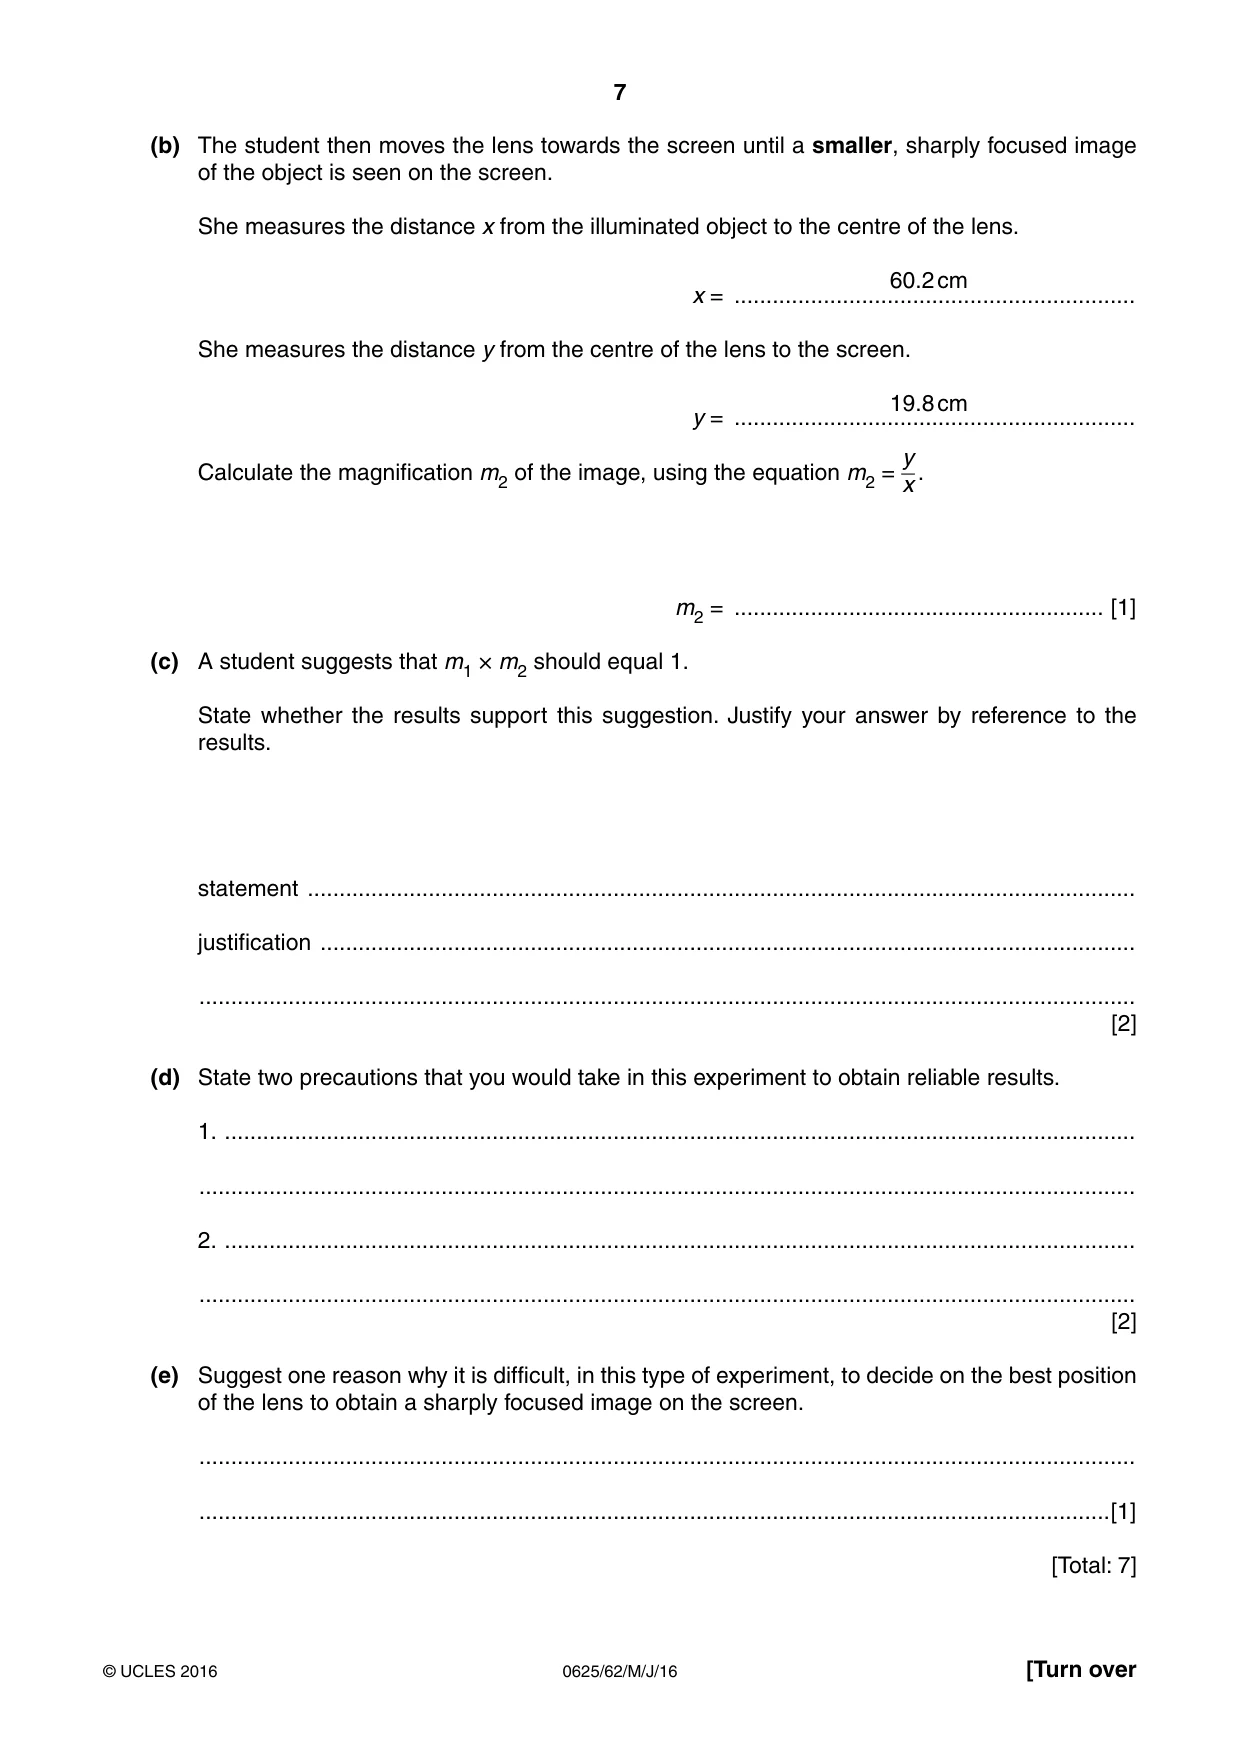
3 A student is investigating the magnification of images produced by a lens. The apparatus is shown in Fig. 3.1. illuminated object a b screen lens D Fig. 3.1 The student places a screen at a distance D = 80.0 cm from an illuminated object. The screen and the illuminated object remain in the same positions throughout the experiment. (a) She places the lens close to the illuminated object. She moves the lens until she sees a sharply focused, enlarged image of the object on the screen. She measures the distance a from the illuminated object to the centre of the lens. 20.3 cm a = ................................................................ She measures the distance b from the centre of the lens to the screen. 59.7 cm b = ................................................................ b Calculate the magnification m1 of the image, using the equation m1 = . a m1 = .......................................................... [1] (b) The student then moves the lens towards the screen until a smaller, sharply focused image of the object is seen on the screen. She measures the distance x from the illuminated object to the centre of the lens. 60.2 cm x = ............................................................... She measures the distance y from the centre of the lens to the screen. 19.8 cm y = ............................................................... y Calculate the magnification m2 of the image, using the equation m2 = x . m2 = .......................................................... [1] (c) A student suggests that m1 × m2 should equal 1. State whether the results support this suggestion. Justify your answer by reference to the results. statement .................................................................................................................................. justification ................................................................................................................................ ................................................................................................................................................... [2] (d) State two precautions that you would take in this experiment to obtain reliable results. 1. ............................................................................................................................................... ................................................................................................................................................... 2. ............................................................................................................................................... ................................................................................................................................................... [2] (e) Suggest one reason why it is difficult, in this type of experiment, to decide on the best position of the lens to obtain a sharply focused image on the screen. ................................................................................................................................................... ...............................................................................................................................................[1] [Total: 7]
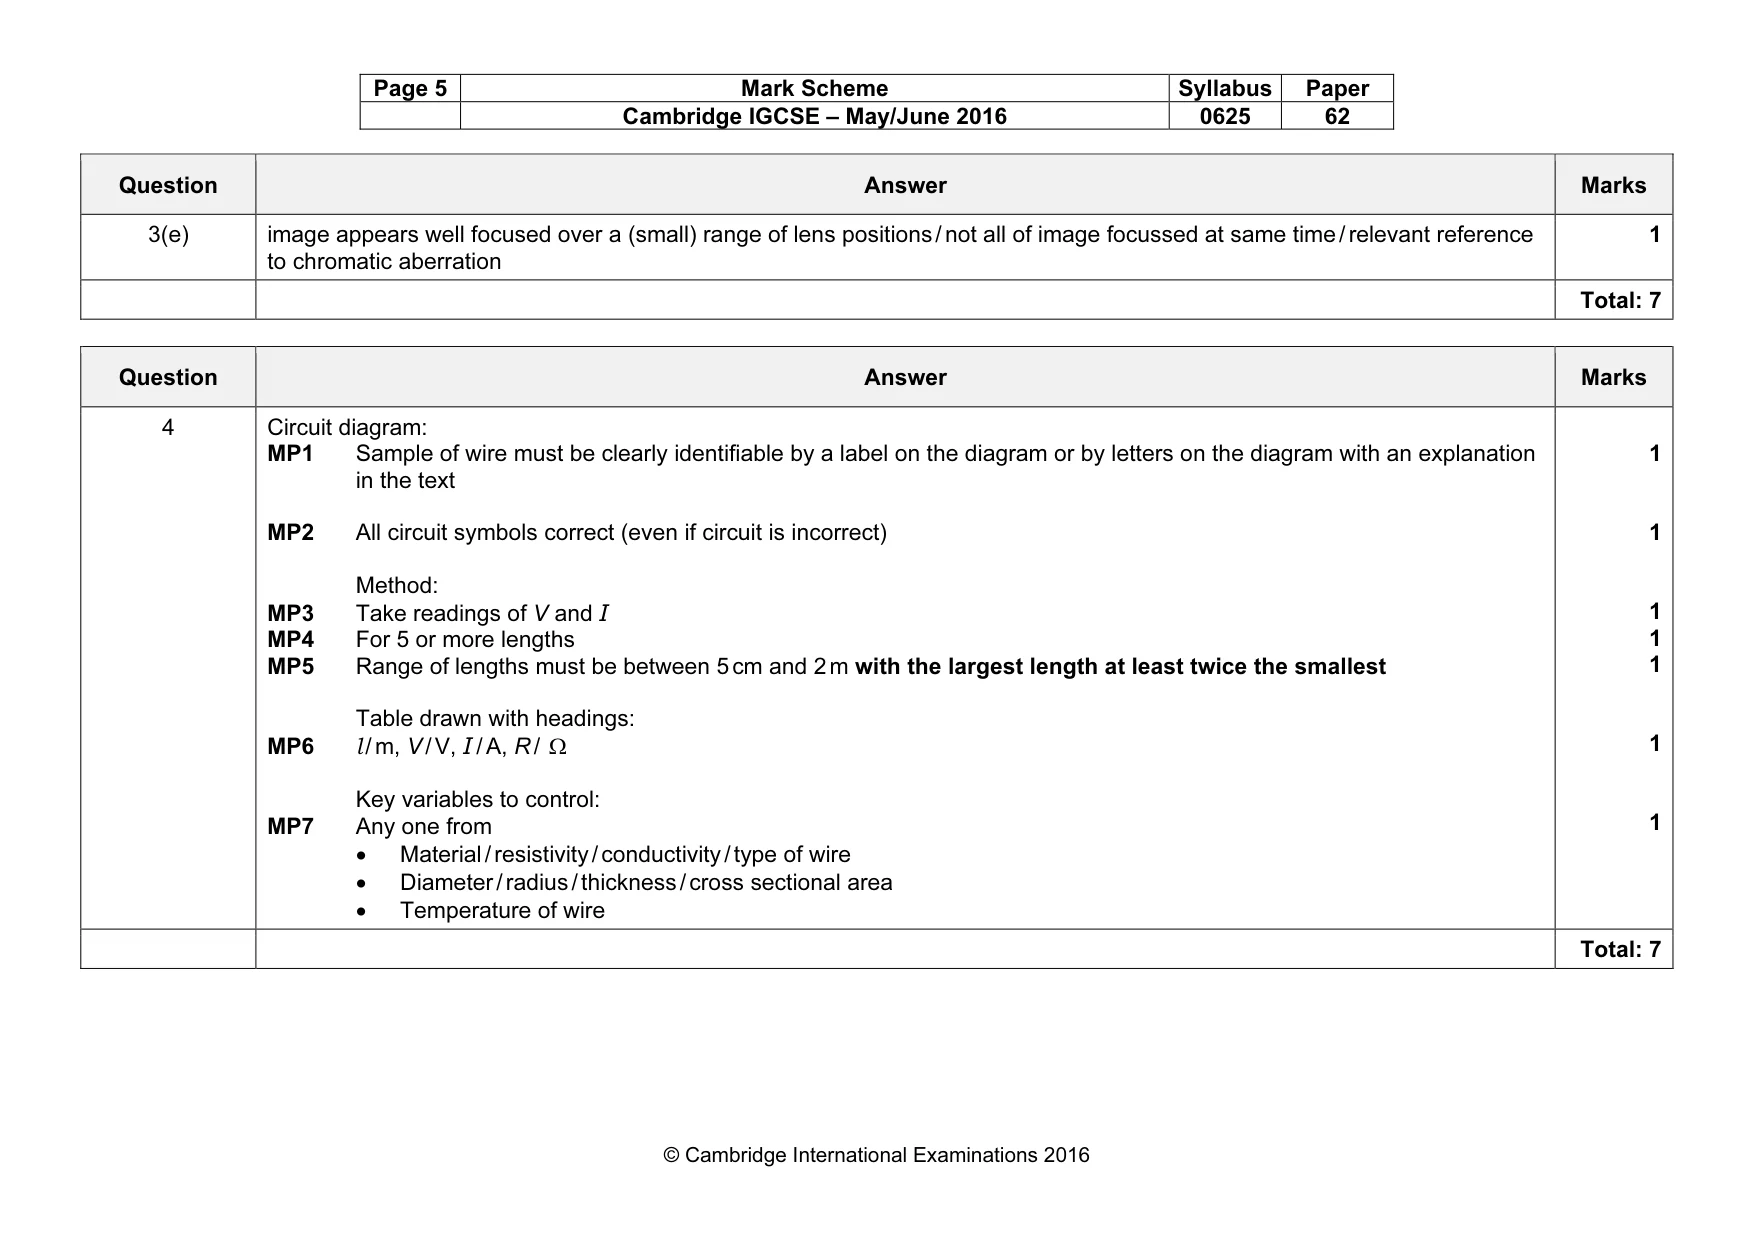
Mark scheme: 3(a) 1 3(b) (m2 = 0.329 OR 0.33) m1 and m2 to 2 or 3 significant figures only AND both m with no unit (accept ×) 1 3(c) Statement, expect YES. Must match results. e.c.f .allowed Justification to include idea of within (or beyond) limits of (experimental) accuracy 1 1 3(d) Any two from: • Use of darkened room / brighter lamp / no other lights • Mark position of centre of lens on holder • Place metre rule on bench (or clamp in position) • Ensure object and centre of lens are same height from the bench • Move lens slowly / to and fro (when focussing) • Lens, object, screen vertical / perpendicular to bench • Repeat with different D • Use of graph paper / cm scale on screen to measure image max 2 Question Answer Marks 3(e) image appears well focused over a (small) range of lens positions / not all of image focussed at same time / relevant reference to chromatic aberration 1 Total: 7
Q4 · A student is investigating how the resistance of a wire depends on the length of the wire
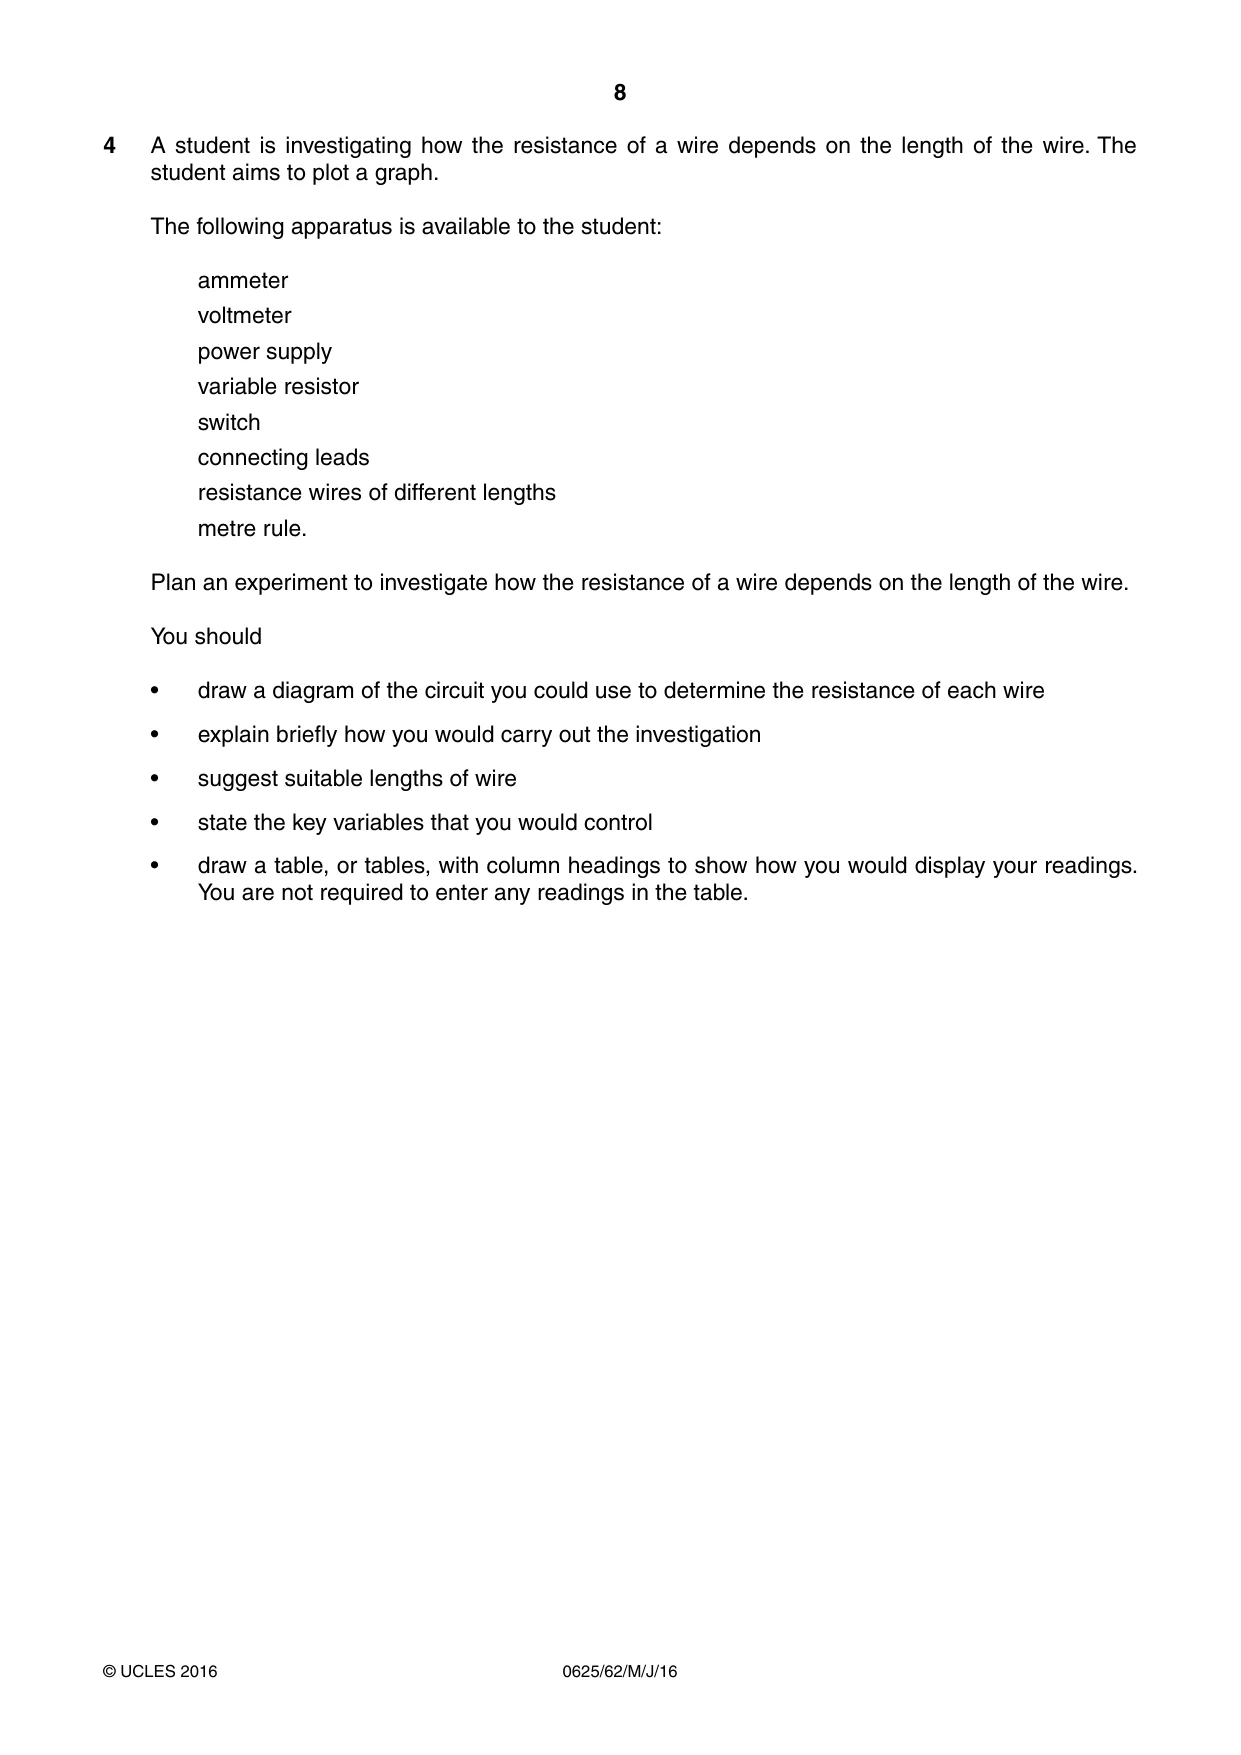
4 A student is investigating how the resistance of a wire depends on the length of the wire. The student aims to plot a graph. The following apparatus is available to the student: ammeter voltmeter power supply variable resistor switch connecting leads resistance wires of different lengths metre rule. Plan an experiment to investigate how the resistance of a wire depends on the length of the wire. You should • draw a diagram of the circuit you could use to determine the resistance of each wire • explain briefly how you would carry out the investigation • suggest suitable lengths of wire • state the key variables that you would control • draw a table, or tables, with column headings to show how you would display your readings. You are not required to enter any readings in the table. .......................................................................................................................................................... .......................................................................................................................................................... .......................................................................................................................................................... .......................................................................................................................................................... .......................................................................................................................................................... .......................................................................................................................................................... .......................................................................................................................................................... .......................................................................................................................................................... .......................................................................................................................................................... .......................................................................................................................................................... .......................................................................................................................................................... .......................................................................................................................................................... .......................................................................................................................................................... .......................................................................................................................................................... .......................................................................................................................................................... .......................................................................................................................................................... .......................................................................................................................................................... .......................................................................................................................................................... .......................................................................................................................................................... .......................................................................................................................................................... .......................................................................................................................................................... .......................................................................................................................................................... .......................................................................................................................................................... .......................................................................................................................................................... .......................................................................................................................................................... .......................................................................................................................................................... ......................................................................................................................................................[7] [Total: 7]
Mark scheme: 4 Circuit diagram: MP1 Sample of wire must be clearly identifiable by a label on the diagram or by letters on the diagram with an explanation in the text MP2 All circuit symbols correct (even if circuit is incorrect) Method: MP3 Take readings of V and I MP4 For 5 or more lengths MP5 Range of lengths must be between 5 cm and 2 m with the largest length at least twice the smallest Table drawn with headings: MP6 l / m, V / V, I / A, R / Ω Key variables to control: MP7 Any one from • Material / resistivity / conductivity / type of wire • Diameter / radius / thickness / cross sectional area • Temperature of wire 1 1 1 1 1 1 1 Total: 7
Q5 · A student is investigating the cooling of water
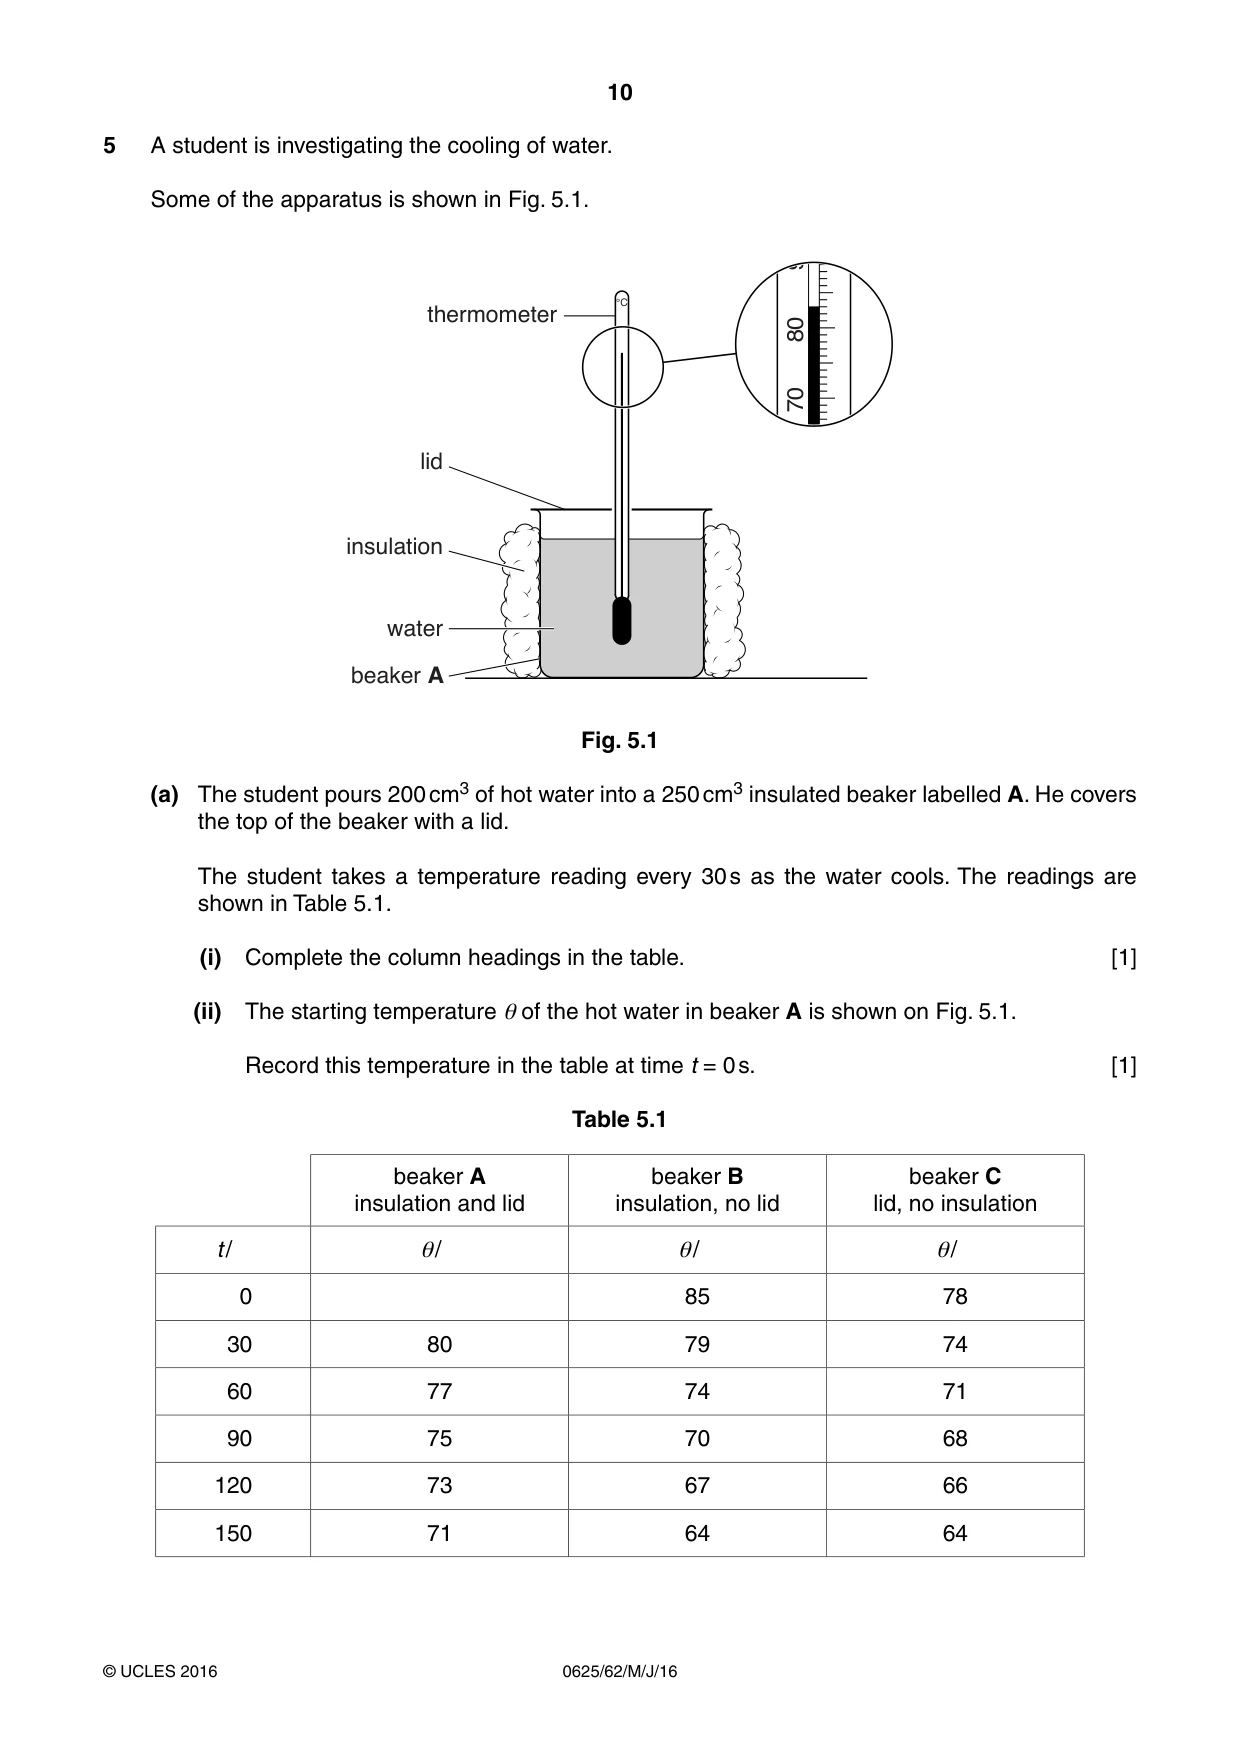
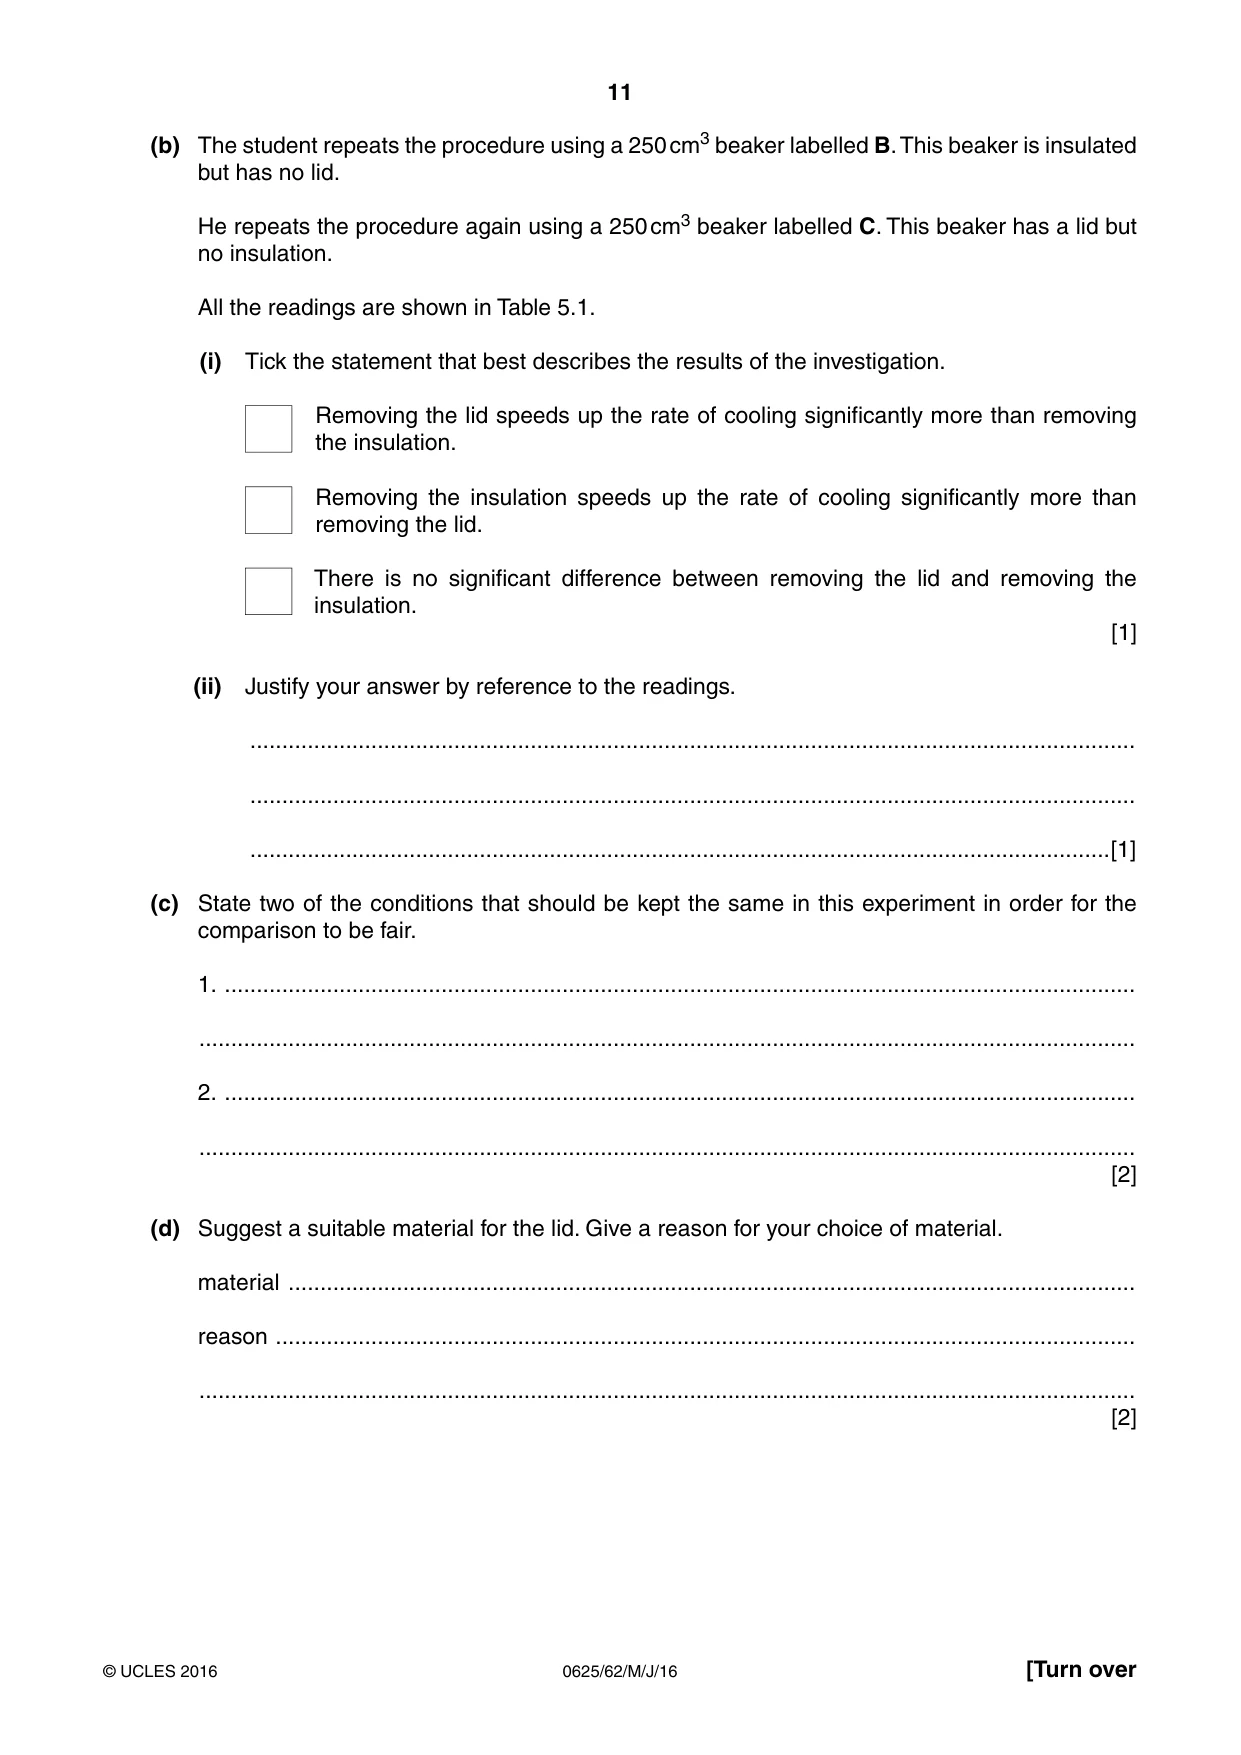
5 A student is investigating the cooling of water. Some of the apparatus is shown in Fig. 5.1. 90 thermometer °C 80 70 lid insulation water beaker A Fig. 5.1 (a) The student pours 200 cm3 of hot water into a 250 cm3 insulated beaker labelled A. He covers the top of the beaker with a lid. The student takes a temperature reading every 30 s as the water cools. The readings are shown in Table 5.1. (i) Complete the column headings in the table. [1] (ii) The starting temperature θ of the hot water in beaker A is shown on Fig. 5.1. Record this temperature in the table at time t = 0 s. [1] Table 5.1 beaker A beaker B beaker C insulation and lid insulation, no lid lid, no insulation t / θ/ θ/ θ/ 0 85 78 30 80 79 74 60 77 74 71 90 75 70 68 120 73 67 66 150 71 64 64 (b) The student repeats the procedure using a 250 cm3 beaker labelled B. This beaker is insulated but has no lid. He repeats the procedure again using a 250 cm3 beaker labelled C. This beaker has a lid but no insulation. All the readings are shown in Table 5.1. (i) Tick the statement that best describes the results of the investigation. Removing the lid speeds up the rate of cooling significantly more than removing the insulation. Removing the insulation speeds up the rate of cooling significantly more than removing the lid. There is no significant difference between removing the lid and removing the insulation. [1] (ii) Justify your answer by reference to the readings. ........................................................................................................................................... ........................................................................................................................................... .......................................................................................................................................[1] (c) State two of the conditions that should be kept the same in this experiment in order for the comparison to be fair. 1. ............................................................................................................................................... ................................................................................................................................................... 2. ............................................................................................................................................... ................................................................................................................................................... [2] (d) Suggest a suitable material for the lid. Give a reason for your choice of material. material ..................................................................................................................................... reason ....................................................................................................................................... ................................................................................................................................................... [2] (e) Describe briefly how a measuring cylinder is read in order to obtain a reliable value for the volume of water. You may draw a diagram. ................................................................................................................................................... ................................................................................................................................................... ................................................................................................................................................... ...............................................................................................................................................[2] [Total: 10]
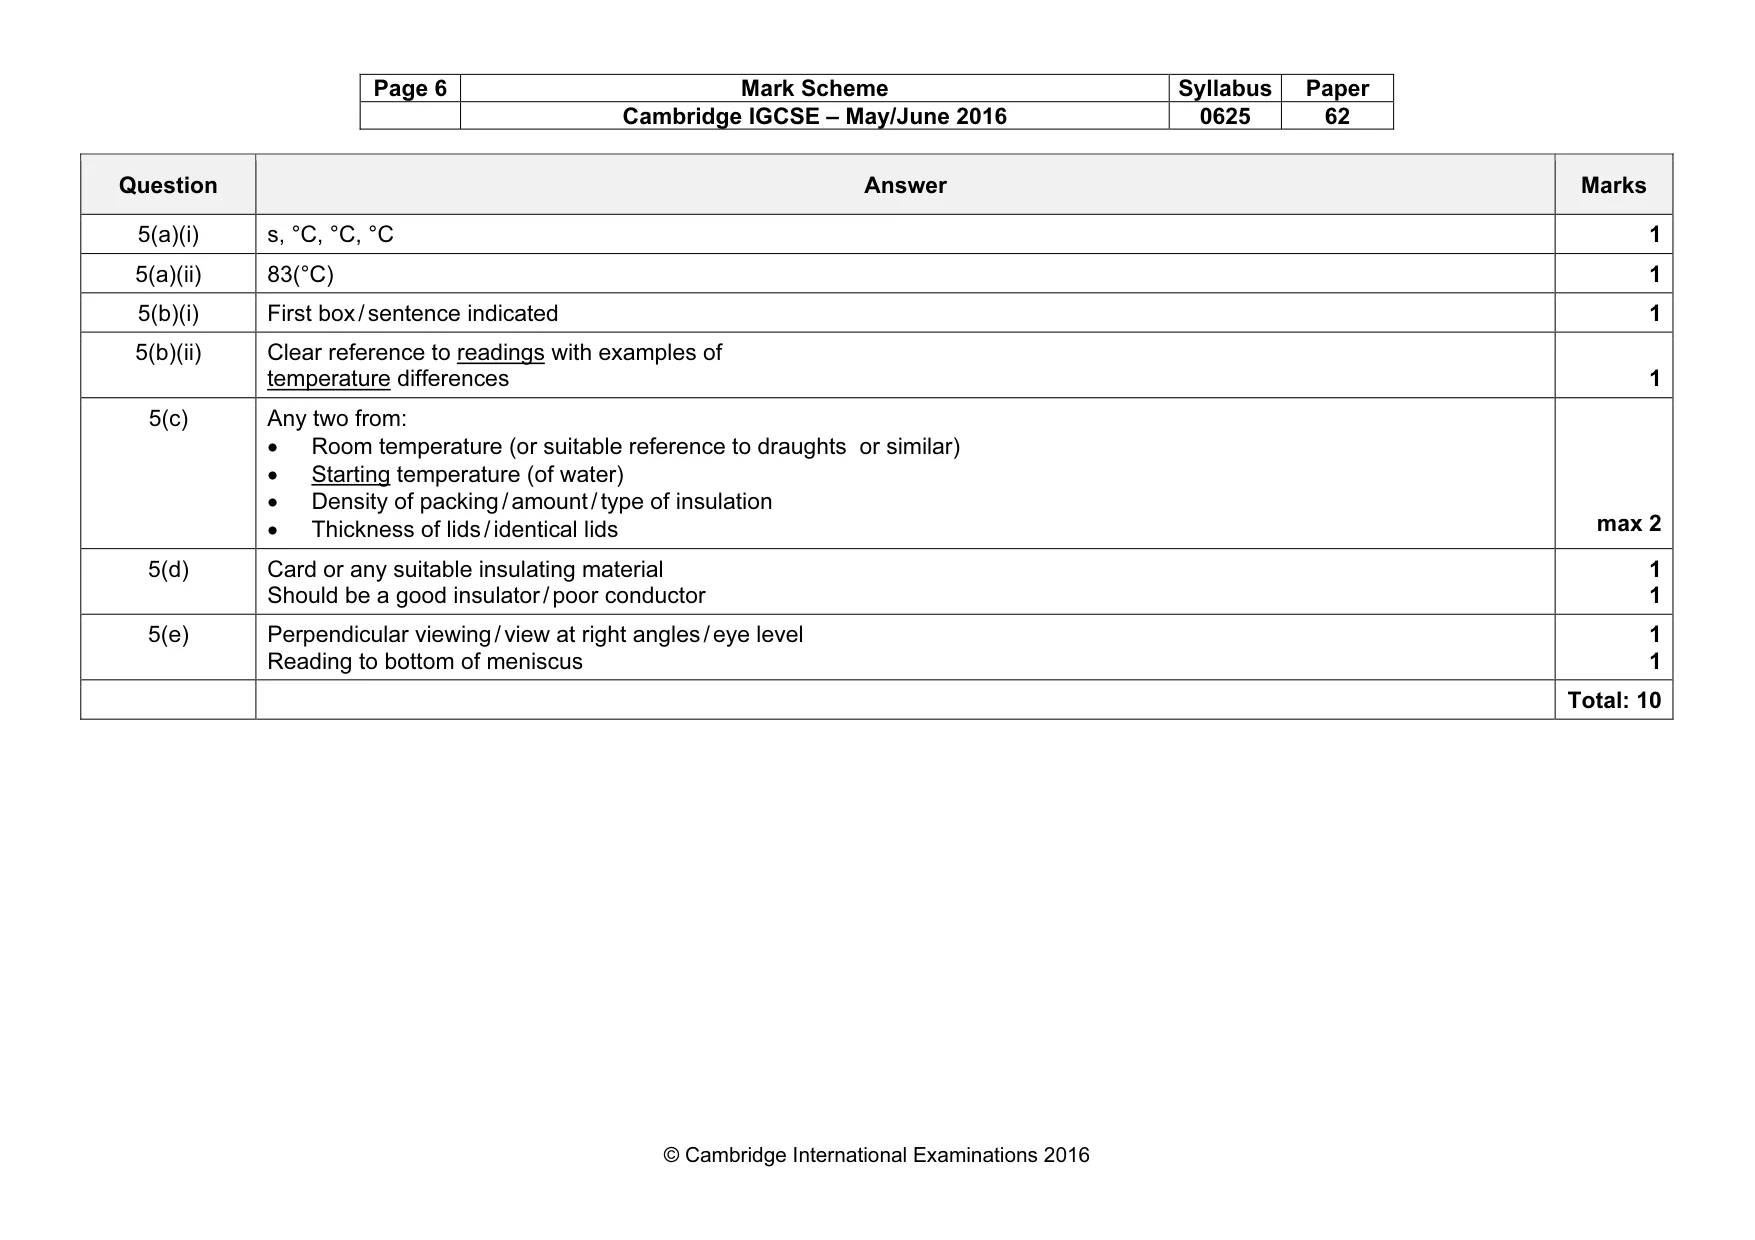
Mark scheme: 5(a)(i) s, °C, °C, °C 1 5(a)(ii) 83(°C) 1 5(b)(i) First box / sentence indicated 1 5(b)(ii) Clear reference to readings with examples of temperature differences 1 5(c) Any two from: • Room temperature (or suitable reference to draughts or similar) • Starting temperature (of water) • Density of packing / amount / type of insulation • Thickness of lids / identical lids max 2 5(d) Card or any suitable insulating material Should be a good insulator / poor conductor 1 1 5(e) Perpendicular viewing / view at right angles / eye level Reading to bottom of meniscus 1 1 Total: 10
What was in this paper
The subtopics covered by these 5 questions, and how many questions each got. Open one in a new tab to see every Cambridge question on it.
What you needed in this session
Cambridge’s own grade thresholds for 2016 May/June, Paper 6 · Variant 2. A higher threshold means an easier paper — the bar moves with how the cohort did.