Cambridge IGCSE Physics 0625 — 2015 Feb/March Paper 5 · Variant 2
0625/52/F/M/15 · 4 questions · 40 marks · ≈45 min
The question paper and its mark scheme, free to read here and free to download. This is Cambridge’s own paper, exactly as it was sat.
Question paper12 pages

Mark scheme5 pages
Answers below. Sit the paper first if you are practising.
Questions as text
Q1 · In this experiment, you will investigate the link between the brightness of a filament…
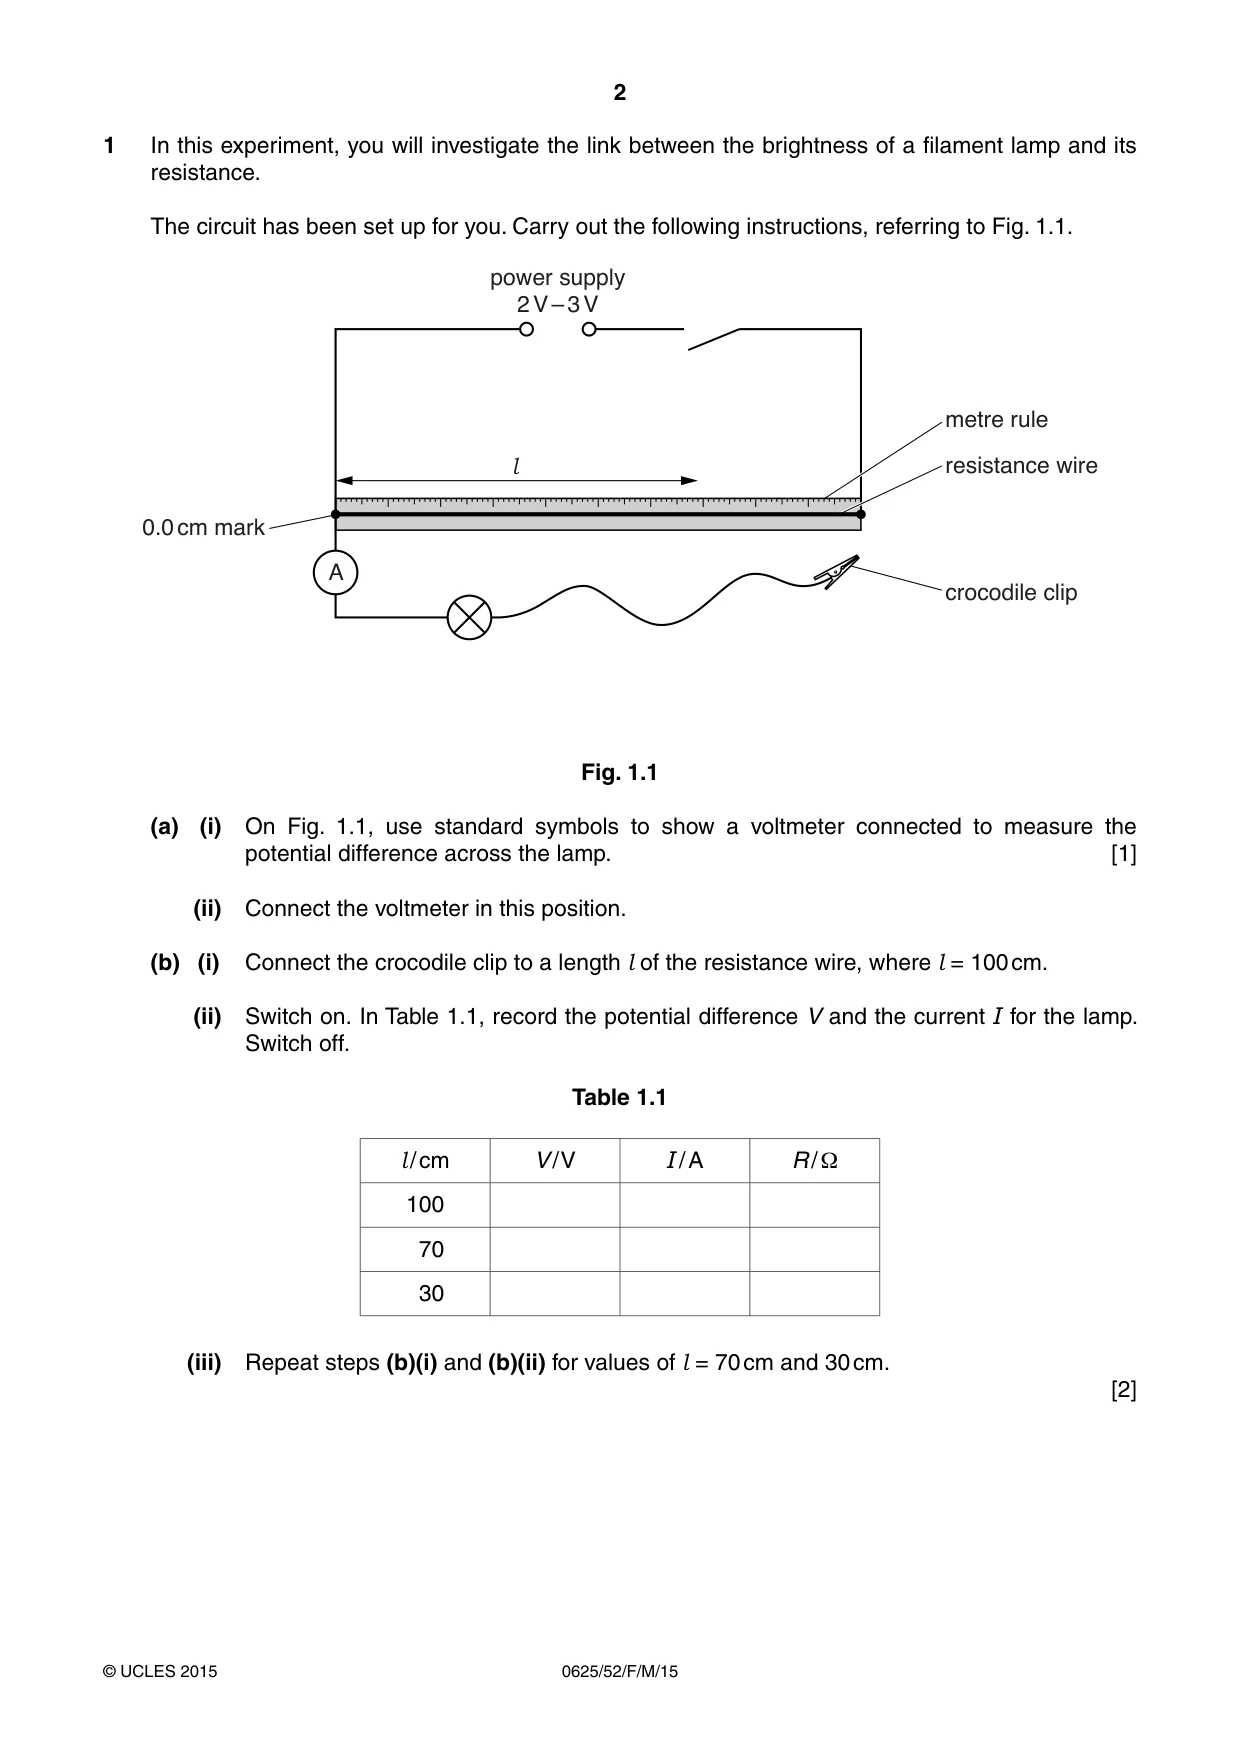
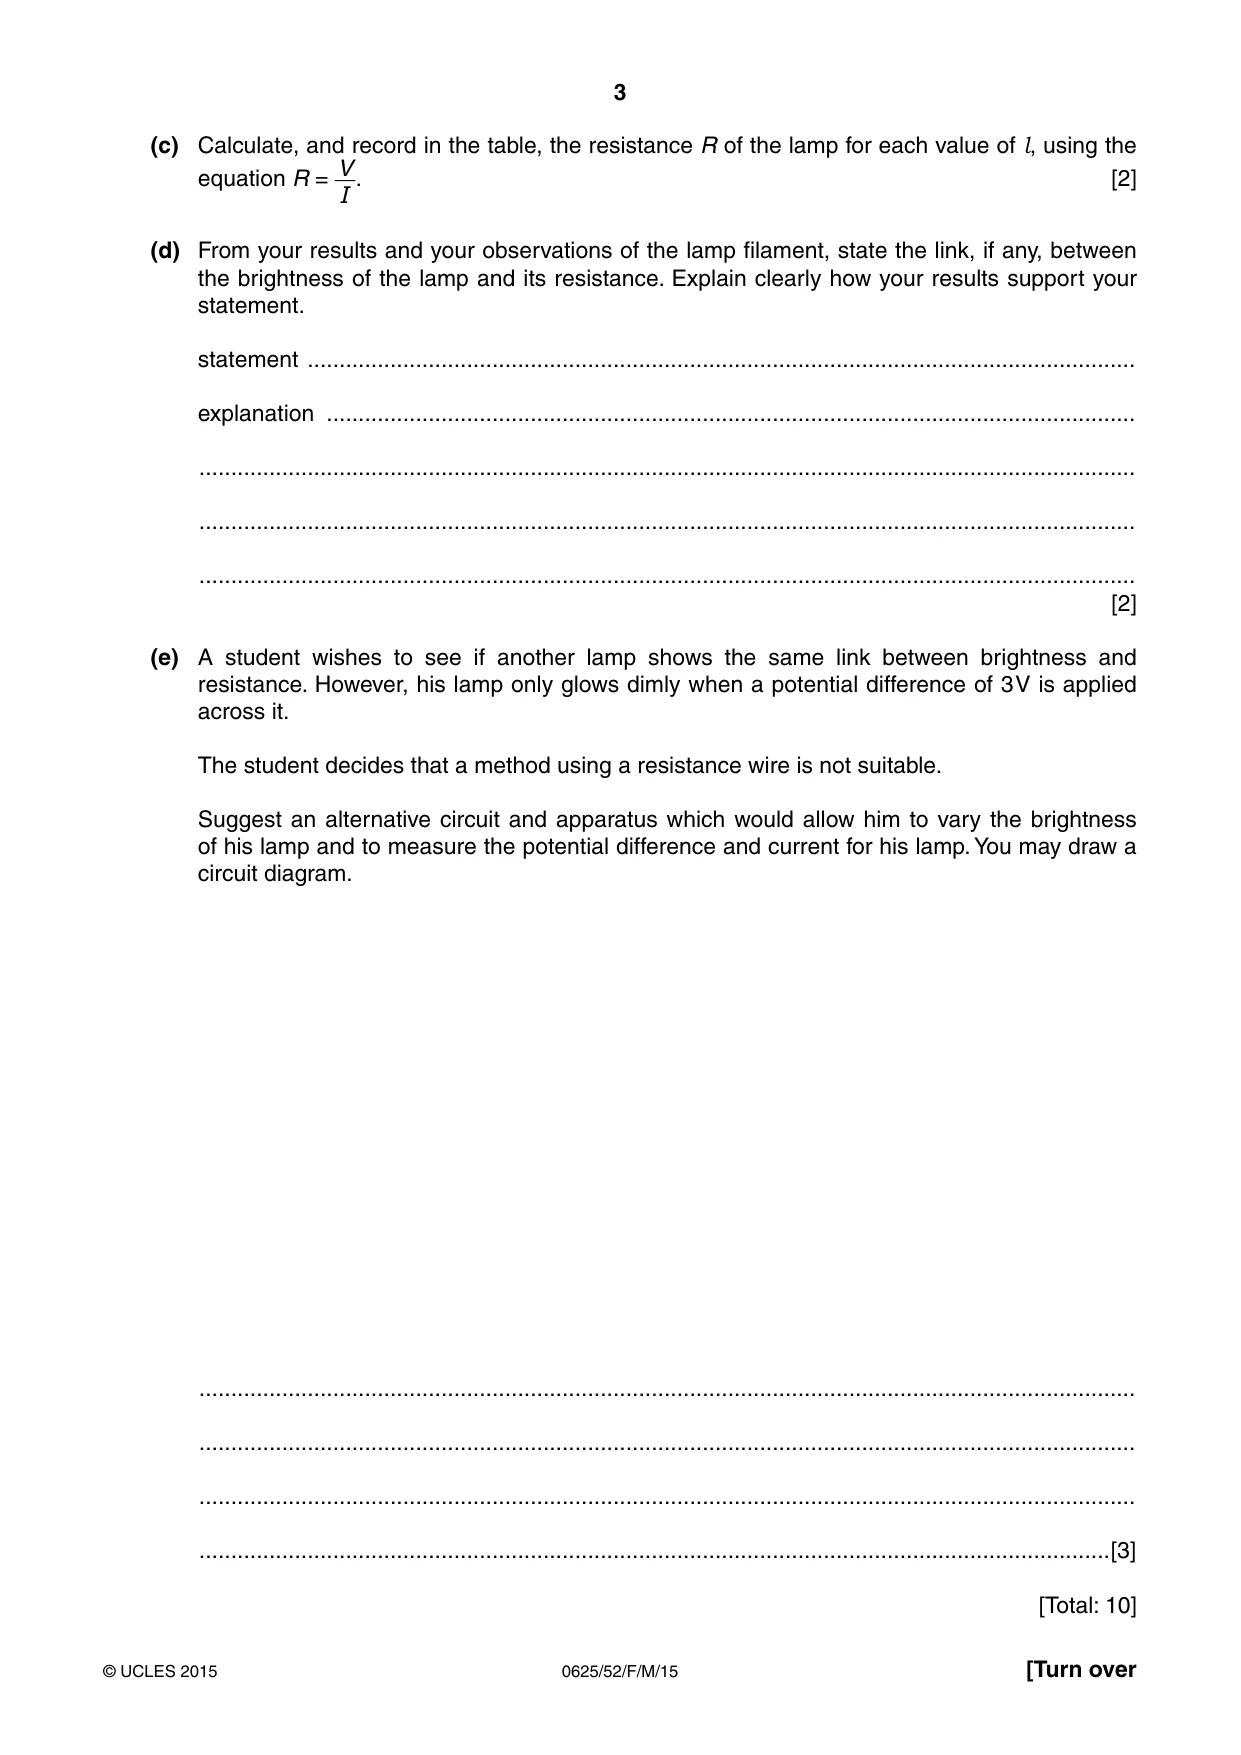
1 In this experiment, you will investigate the link between the brightness of a filament lamp and its resistance. The circuit has been set up for you. Carry out the following instructions, referring to Fig. 1.1. power supply 2 V – 3 V metre rule l resistance wire 0.0 cm mark A crocodile clip Fig. 1.1 (a) (i) On Fig. 1.1, use standard symbols to show a voltmeter connected to measure the potential difference across the lamp. [1] (ii) Connect the voltmeter in this position. (b) (i) Connect the crocodile clip to a length l of the resistance wire, where l = 100 cm. (ii) Switch on. In Table 1.1, record the potential difference V and the current I for the lamp. Switch off. Table 1.1 l / cm V / V I / A R / Ω 100 70 30 (iii) Repeat steps (b)(i) and (b)(ii) for values of l = 70 cm and 30 cm. [2] (c) Calculate, and record in the table, the resistance R of the lamp for each value of l, using the V equation R = . [2] I (d) From your results and your observations of the lamp filament, state the link, if any, between the brightness of the lamp and its resistance. Explain clearly how your results support your statement. statement .................................................................................................................................. explanation ............................................................................................................................... ................................................................................................................................................... ................................................................................................................................................... ................................................................................................................................................... [2] (e) A student wishes to see if another lamp shows the same link between brightness and resistance. However, his lamp only glows dimly when a potential difference of 3 V is applied across it. The student decides that a method using a resistance wire is not suitable. Suggest an alternative circuit and apparatus which would allow him to vary the brightness of his lamp and to measure the potential difference and current for his lamp. You may draw a circuit diagram. ................................................................................................................................................... ................................................................................................................................................... ................................................................................................................................................... ...............................................................................................................................................[3] [Total: 10]
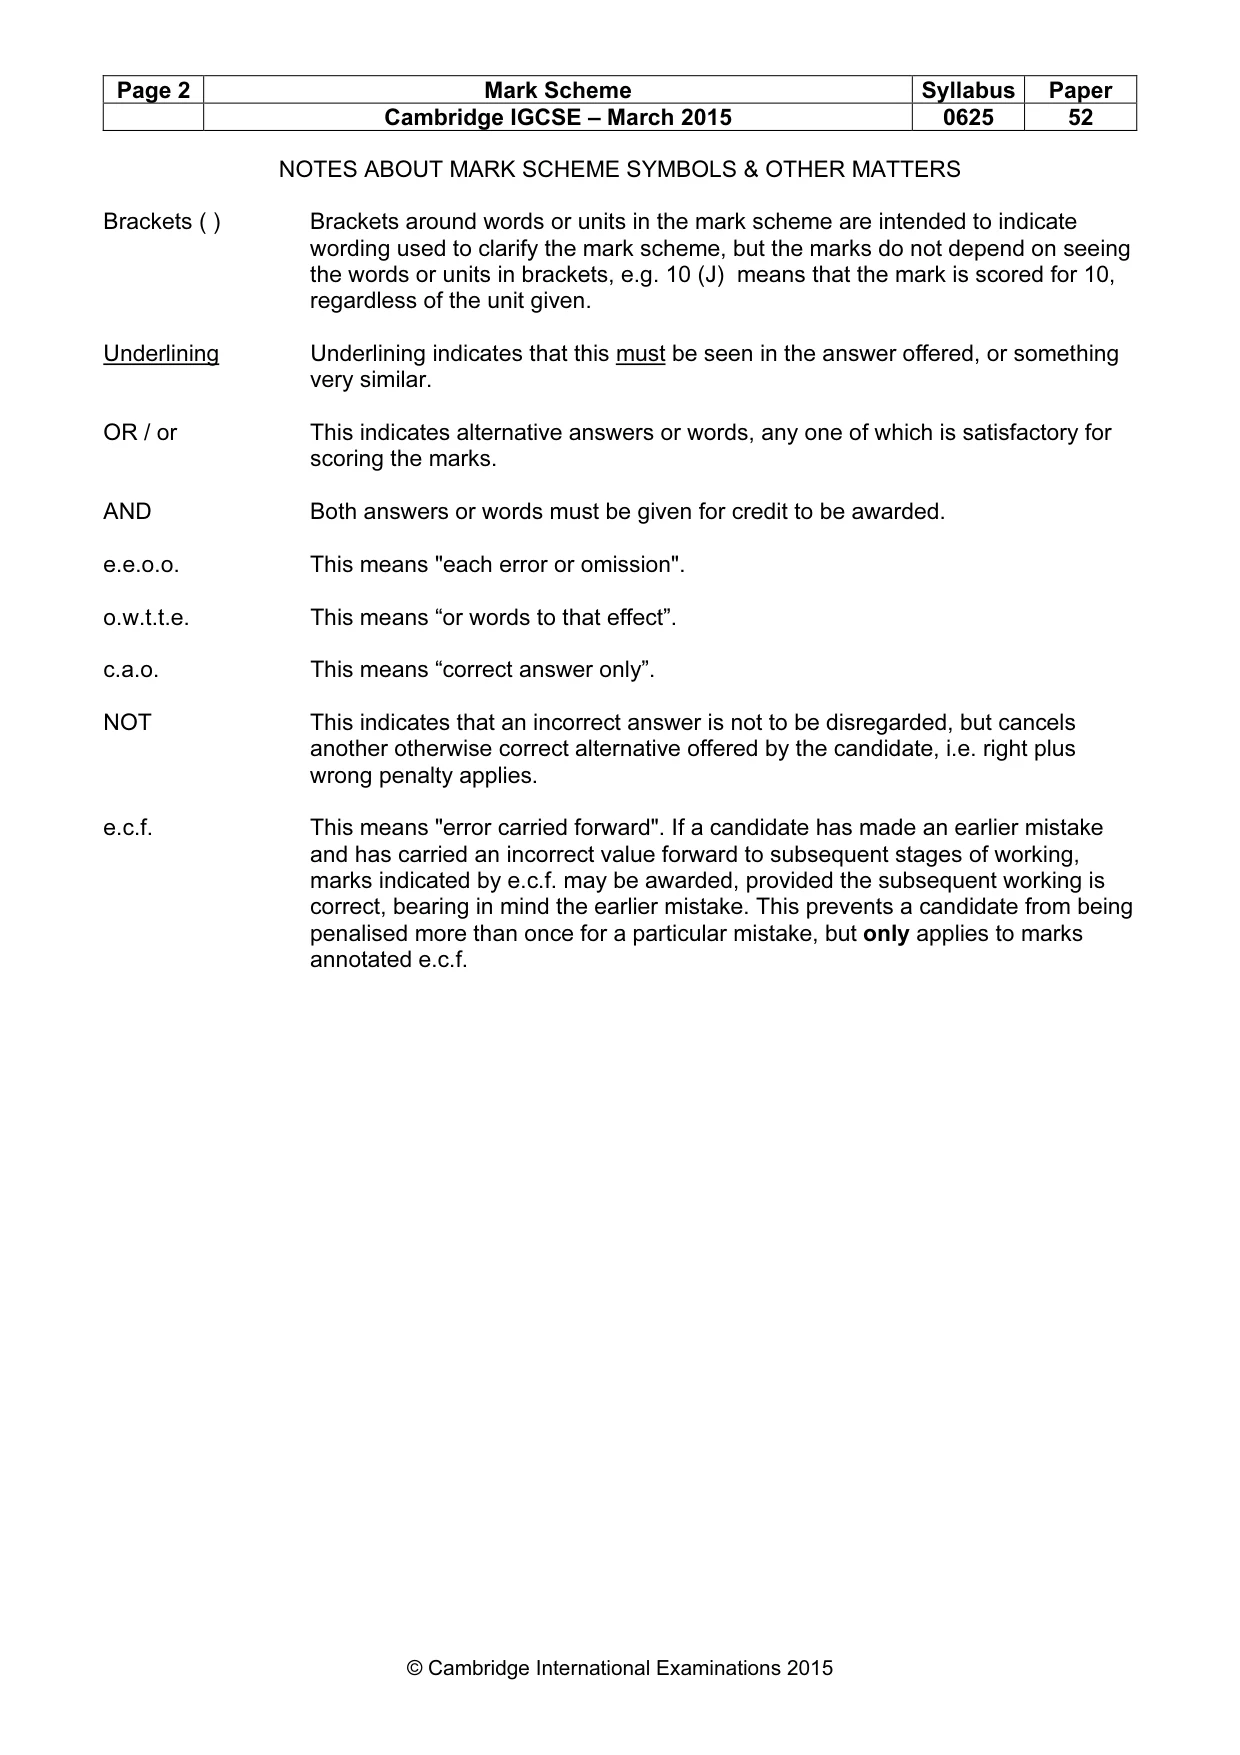
Mark scheme: 1 (a) correct voltmeter symbol with appropriate parallel connection [1] (b) p.d.s all < 3.0 V AND to at least 1d.p. [1] currents decreasing, all < 1.00 A AND to at least 2 d.p. [1] (c) R calculations correct [1] sig. figs. appropriate to data, e.g. consistent 2 or consistent 3 sig. figs. note: allow 1 sig. fig. fewer for data of 1sig. fig. [1] (d) link consistent with results [1] figures to support, matching statement – at least two R values compared [1] (e) increased supply voltage [1] use of variable resistor OR variable voltage supply clearly indicated as such [1] any other suitable point, e.g. [1] • voltmeter with larger range • ammeter with larger range • variable resistor symbol and connection correctly shown [Total: 10]
Q2 · In this experiment, you will determine the focal length of a converging lens
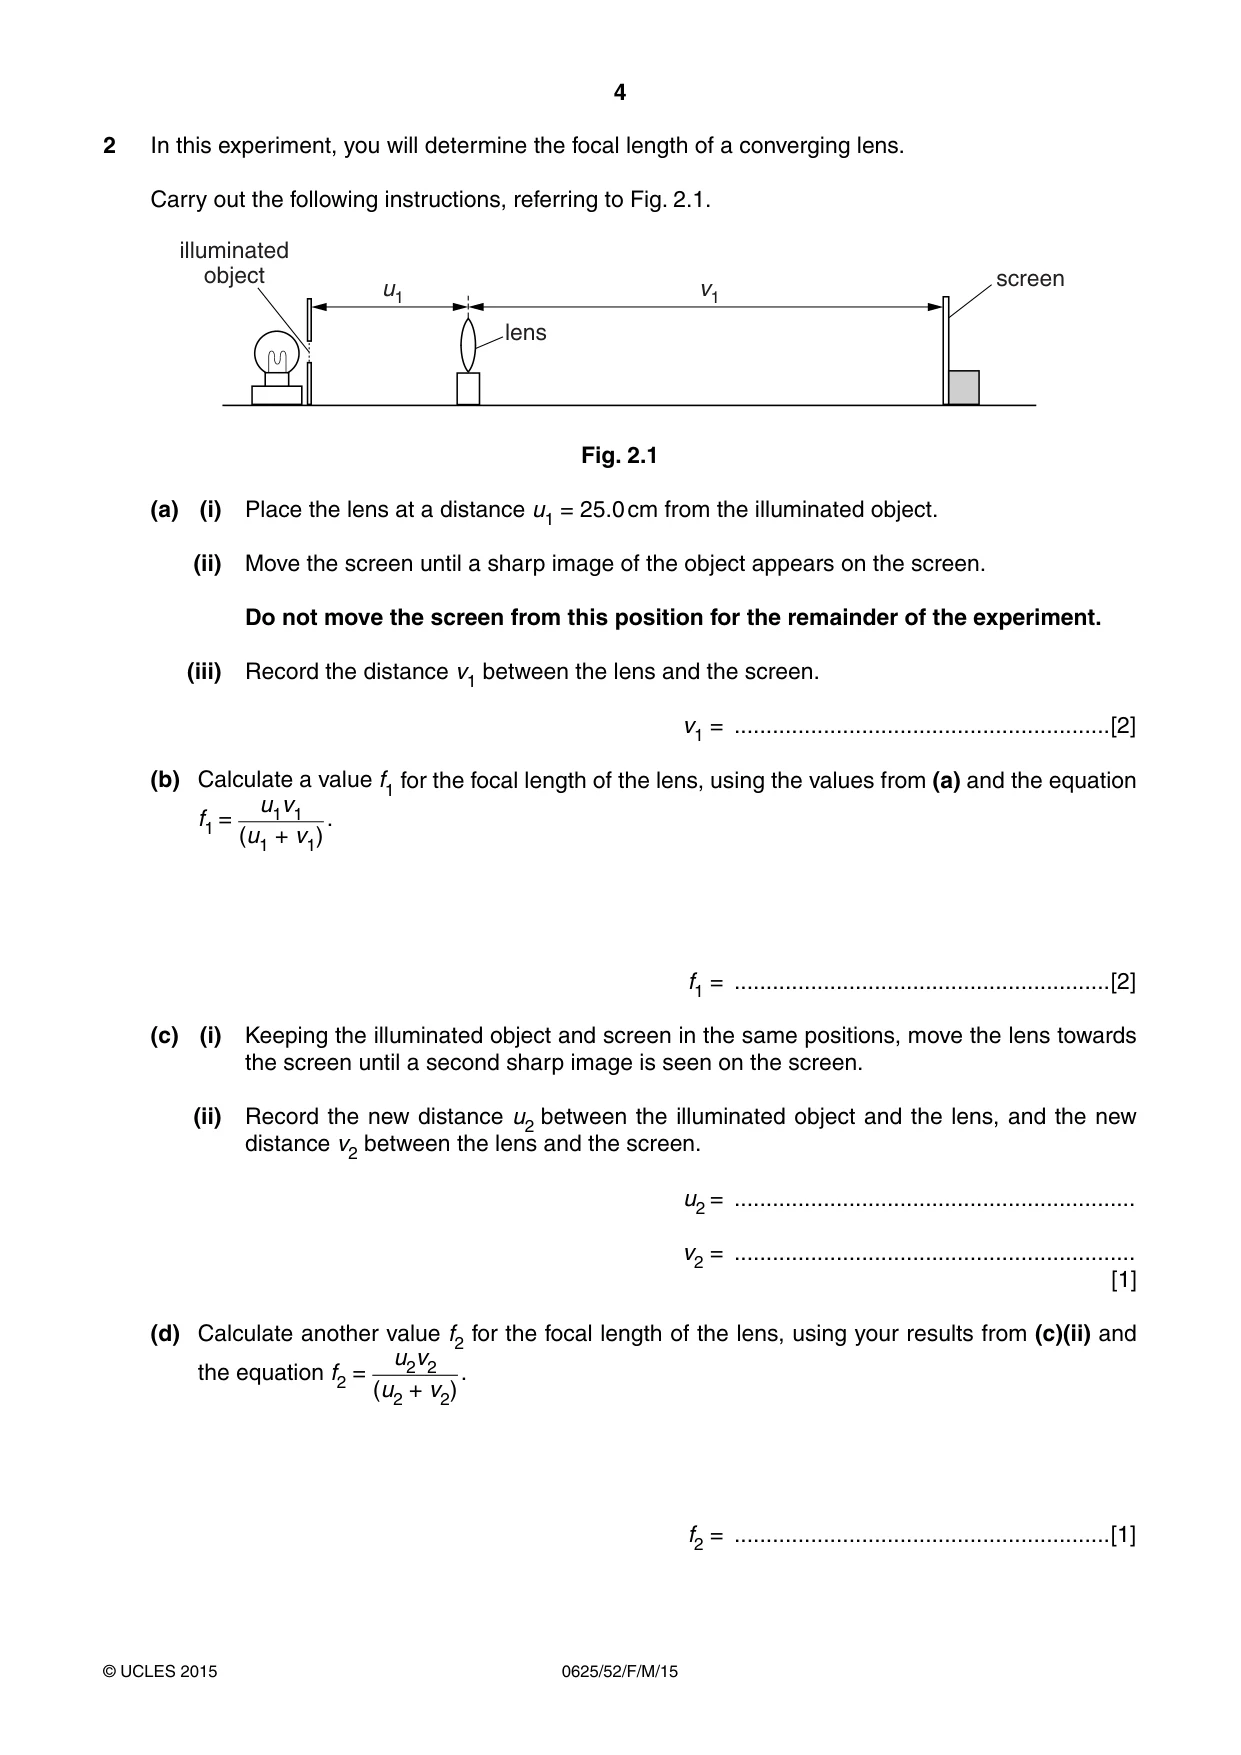
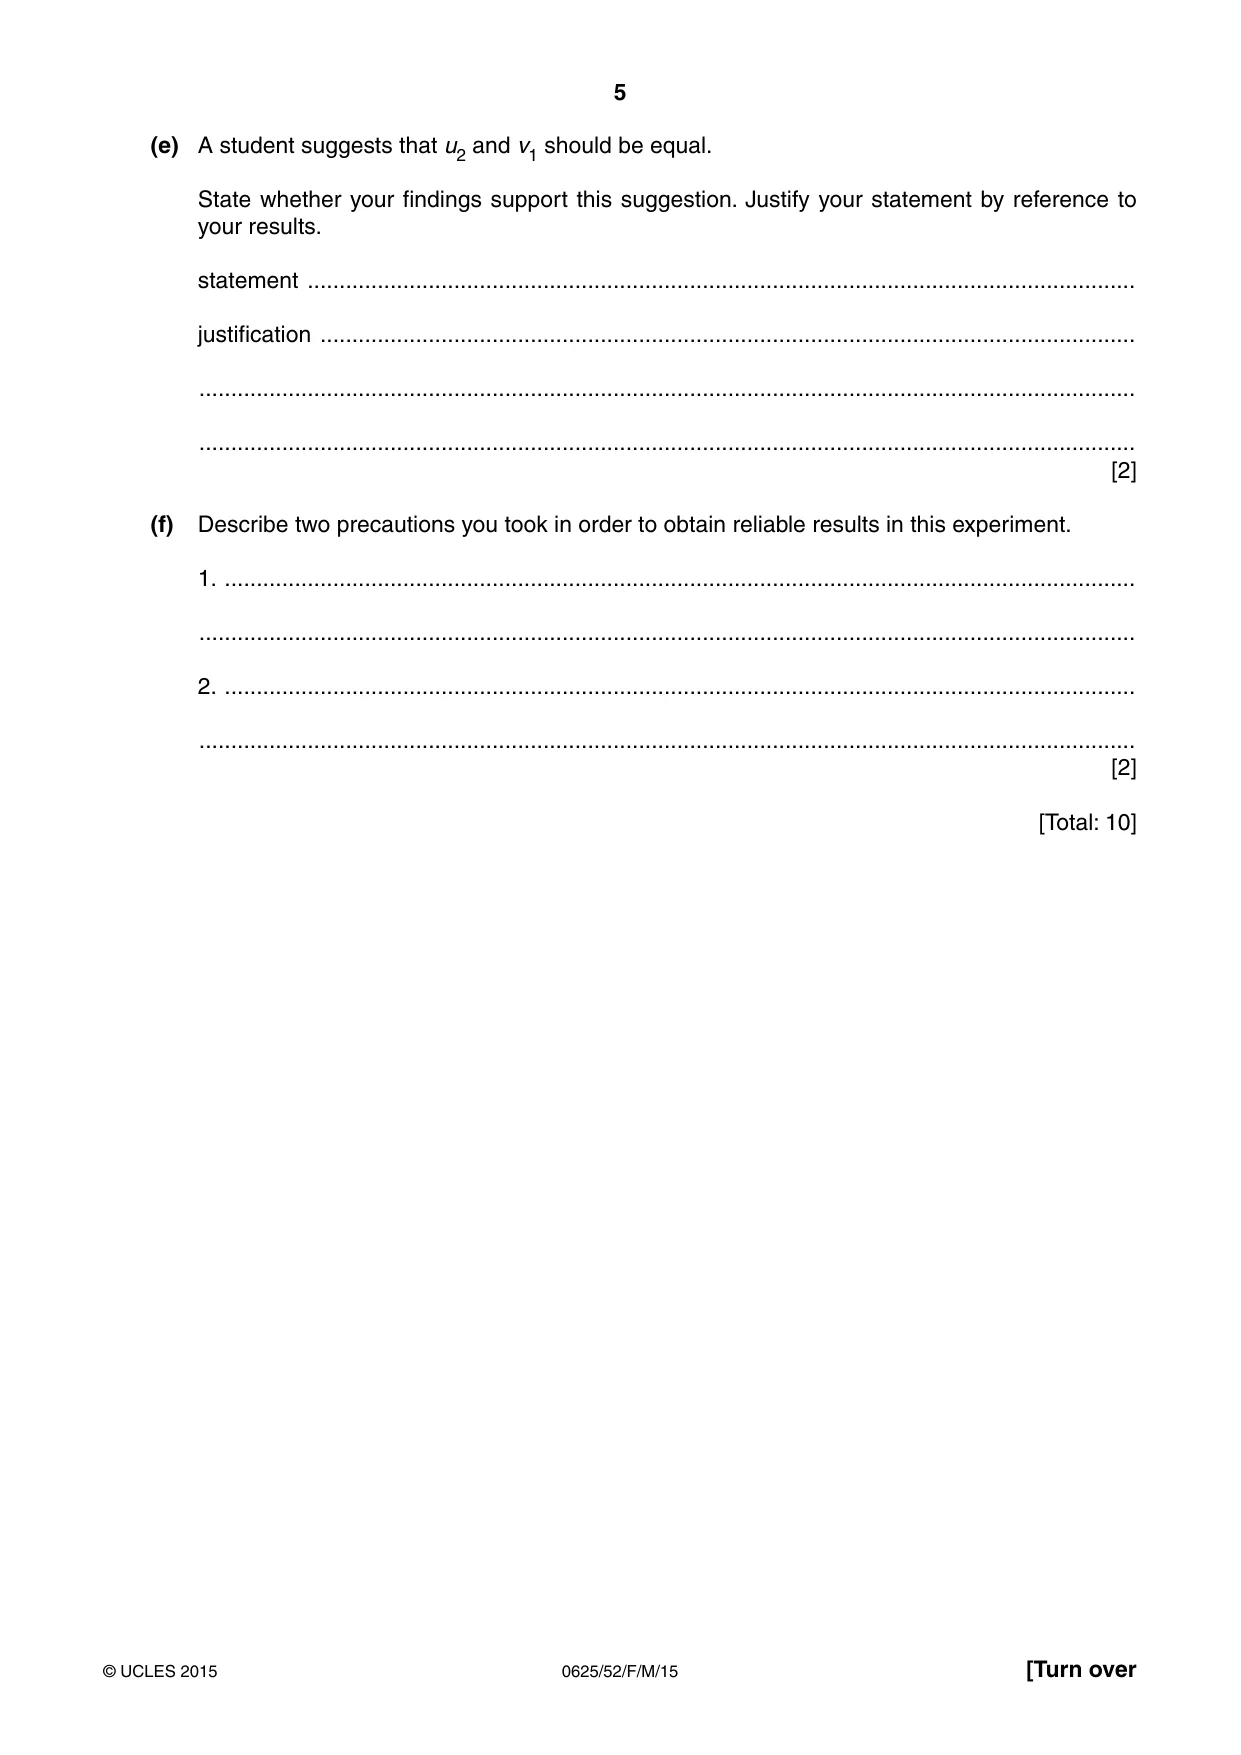
2 In this experiment, you will determine the focal length of a converging lens. Carry out the following instructions, referring to Fig. 2.1. illuminated object screen u1 v1 lens Fig. 2.1 (a) (i) Place the lens at a distance u1 = 25.0 cm from the illuminated object. (ii) Move the screen until a sharp image of the object appears on the screen. Do not move the screen from this position for the remainder of the experiment. (iii) Record the distance v1 between the lens and the screen. v1 = ...........................................................[2] (b) Calculate a value f1 for the focal length of the lens, using the values from (a) and the equation u1v1 f1 = . (u1 + v1) f1 = ...........................................................[2] (c) (i) Keeping the illuminated object and screen in the same positions, move the lens towards the screen until a second sharp image is seen on the screen. (ii) Record the new distance u2 between the illuminated object and the lens, and the new distance v2 between the lens and the screen. u2 = ............................................................... v2 = ............................................................... [1] (d) Calculate another value f2 for the focal length of the lens, using your results from (c)(ii) and u2v2 the equation f2 = . (u2 + v2) f2 = ...........................................................[1] (e) A student suggests that u2 and v1 should be equal. State whether your findings support this suggestion. Justify your statement by reference to your results. statement .................................................................................................................................. justification ................................................................................................................................ ................................................................................................................................................... ................................................................................................................................................... [2] (f) Describe two precautions you took in order to obtain reliable results in this experiment. 1. ............................................................................................................................................... ................................................................................................................................................... 2. ............................................................................................................................................... ................................................................................................................................................... [2] [Total: 10]
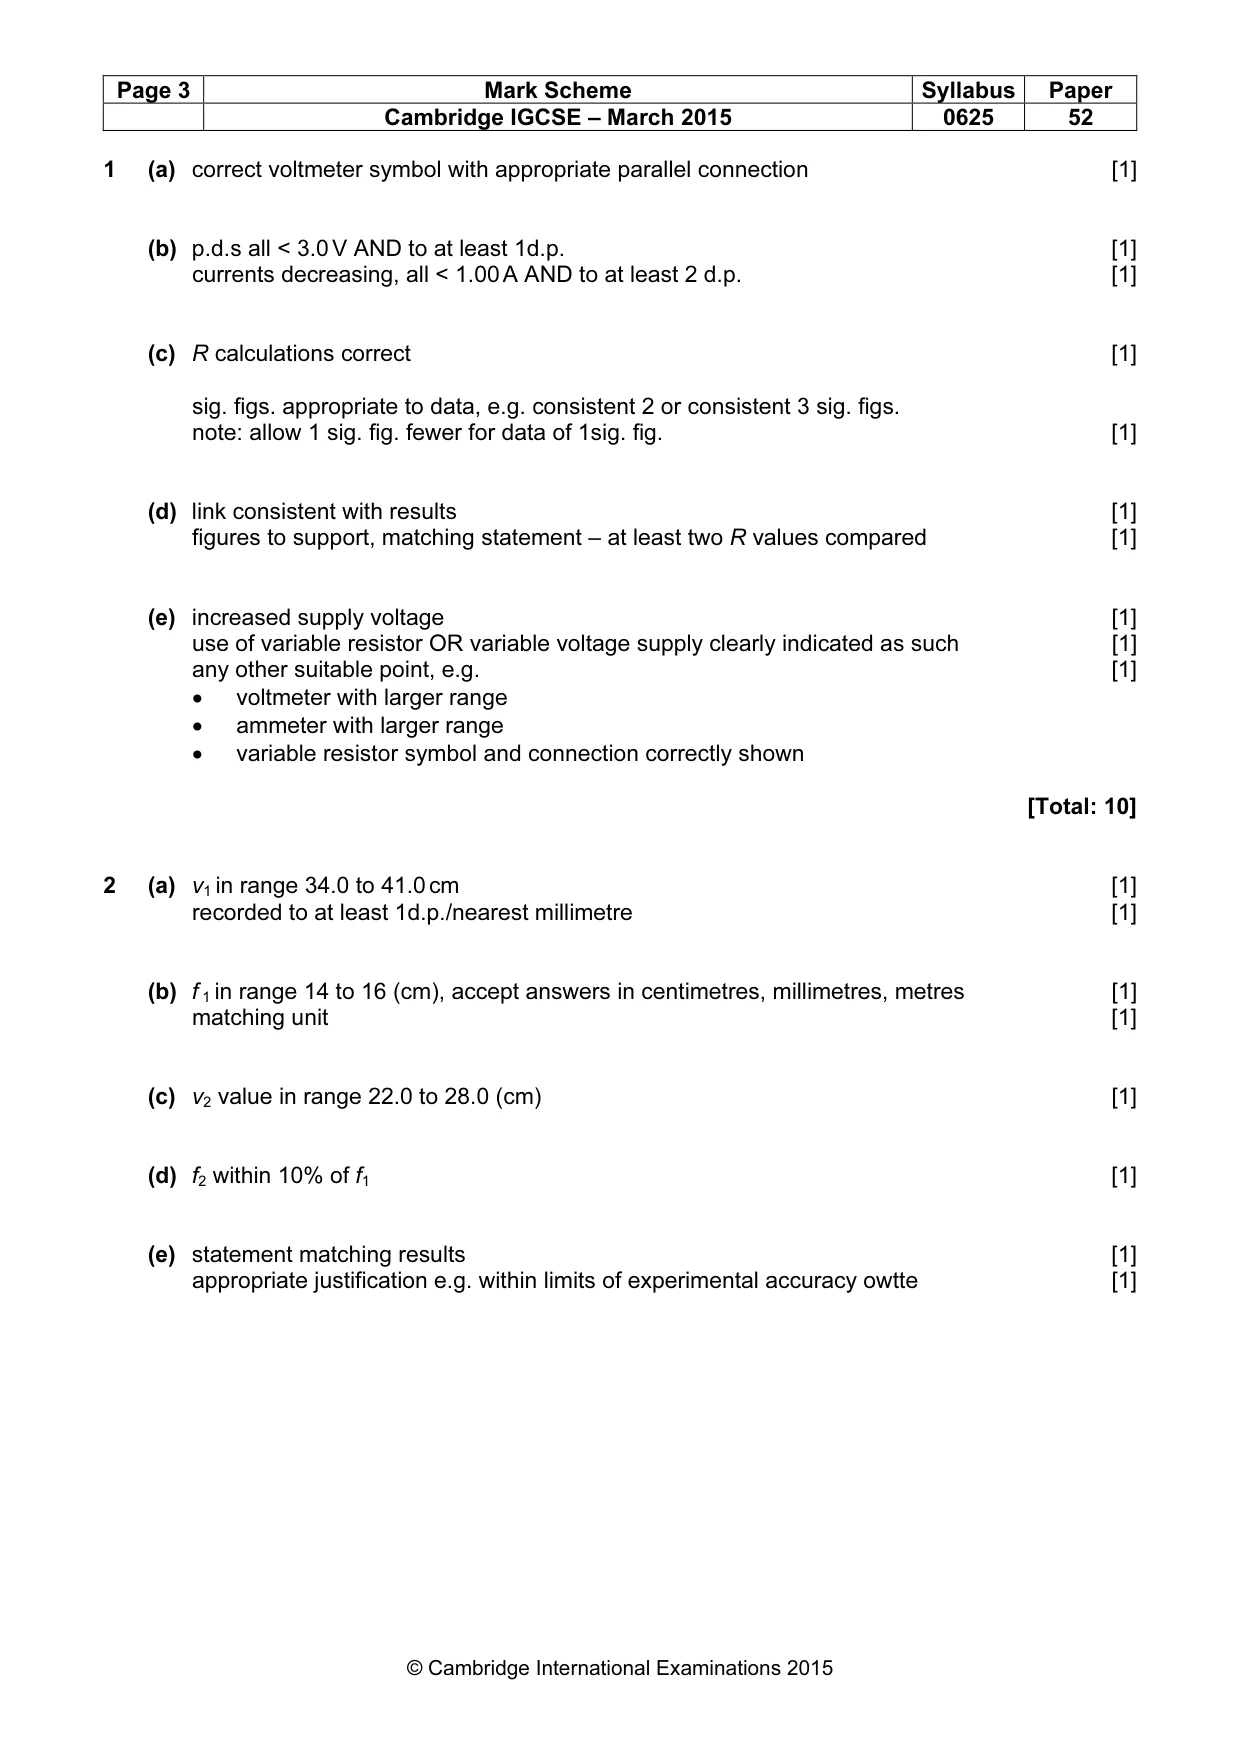
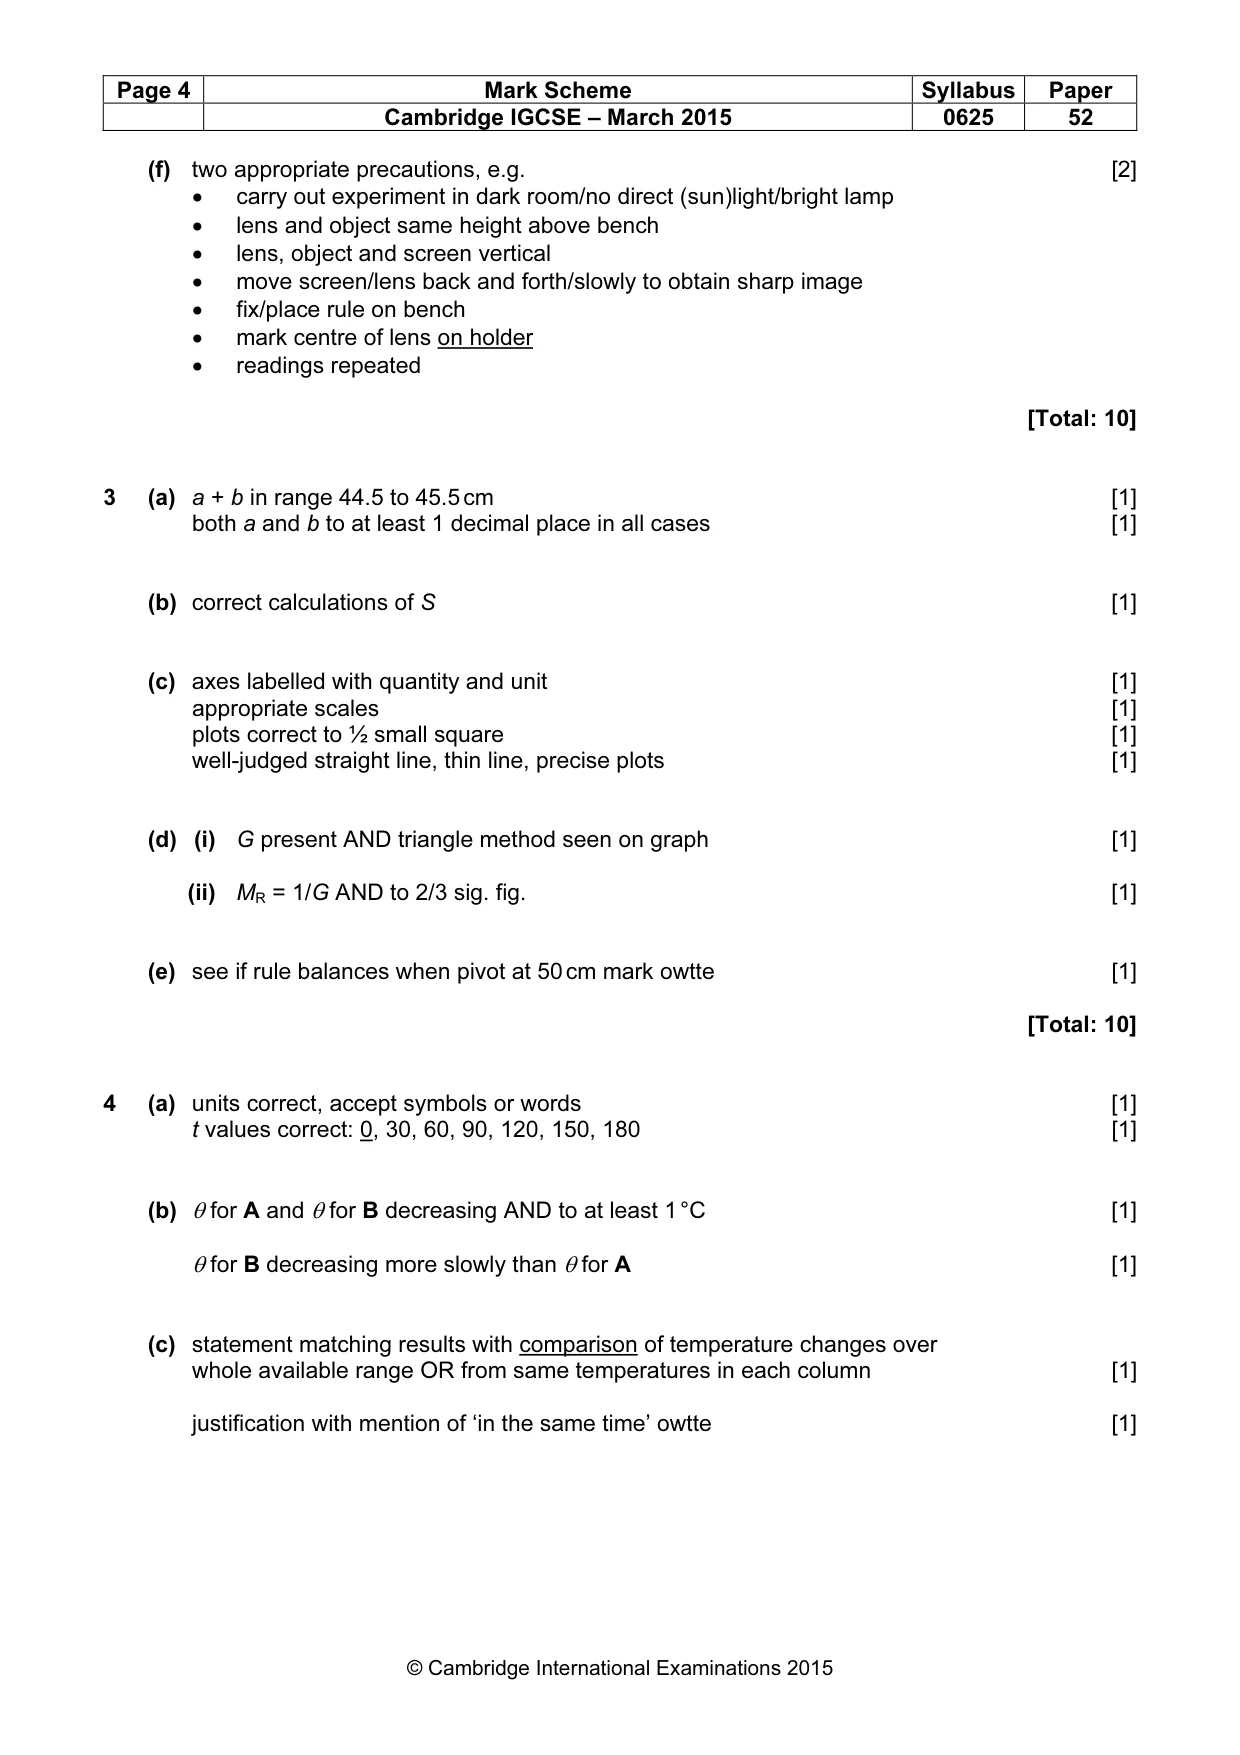
Mark scheme: 2 (a) v1 in range 34.0 to 41.0 cm [1] recorded to at least 1d.p./nearest millimetre [1] (b) f 1 in range 14 to 16 (cm), accept answers in centimetres, millimetres, metres [1] matching unit [1] (c) v2 value in range 22.0 to 28.0 (cm) [1] (d) f2 within 10% of f1 [1] (e) statement matching results [1] appropriate justification e.g. within limits of experimental accuracy owtte [1] (f) two appropriate precautions, e.g. [2] • carry out experiment in dark room/no direct (sun)light/bright lamp • lens and object same height above bench • lens, object and screen vertical • move screen/lens back and forth/slowly to obtain sharp image • fix/place rule on bench • mark centre of lens on holder • readings repeated [Total: 10]
Q3 · In this experiment, you will determine the mass of a metre rule by a balancing method
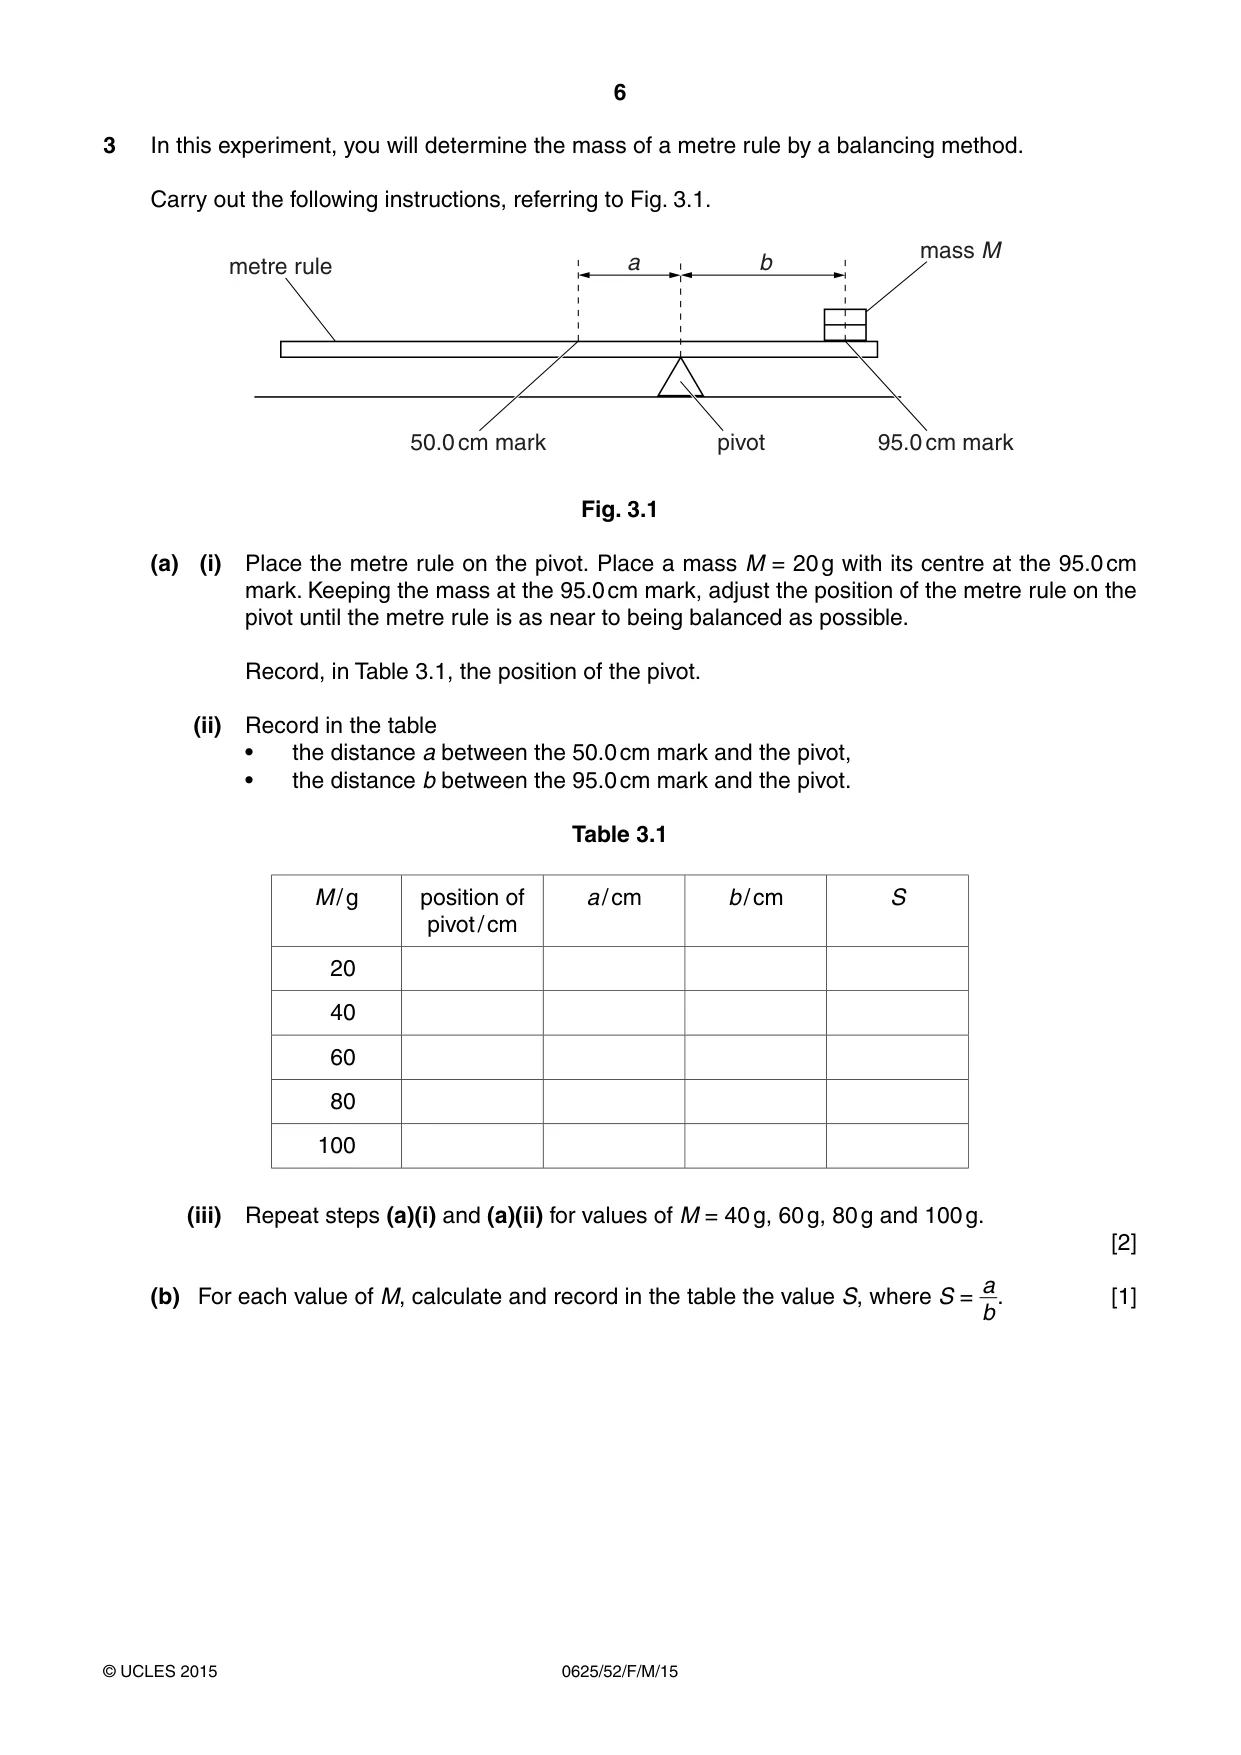
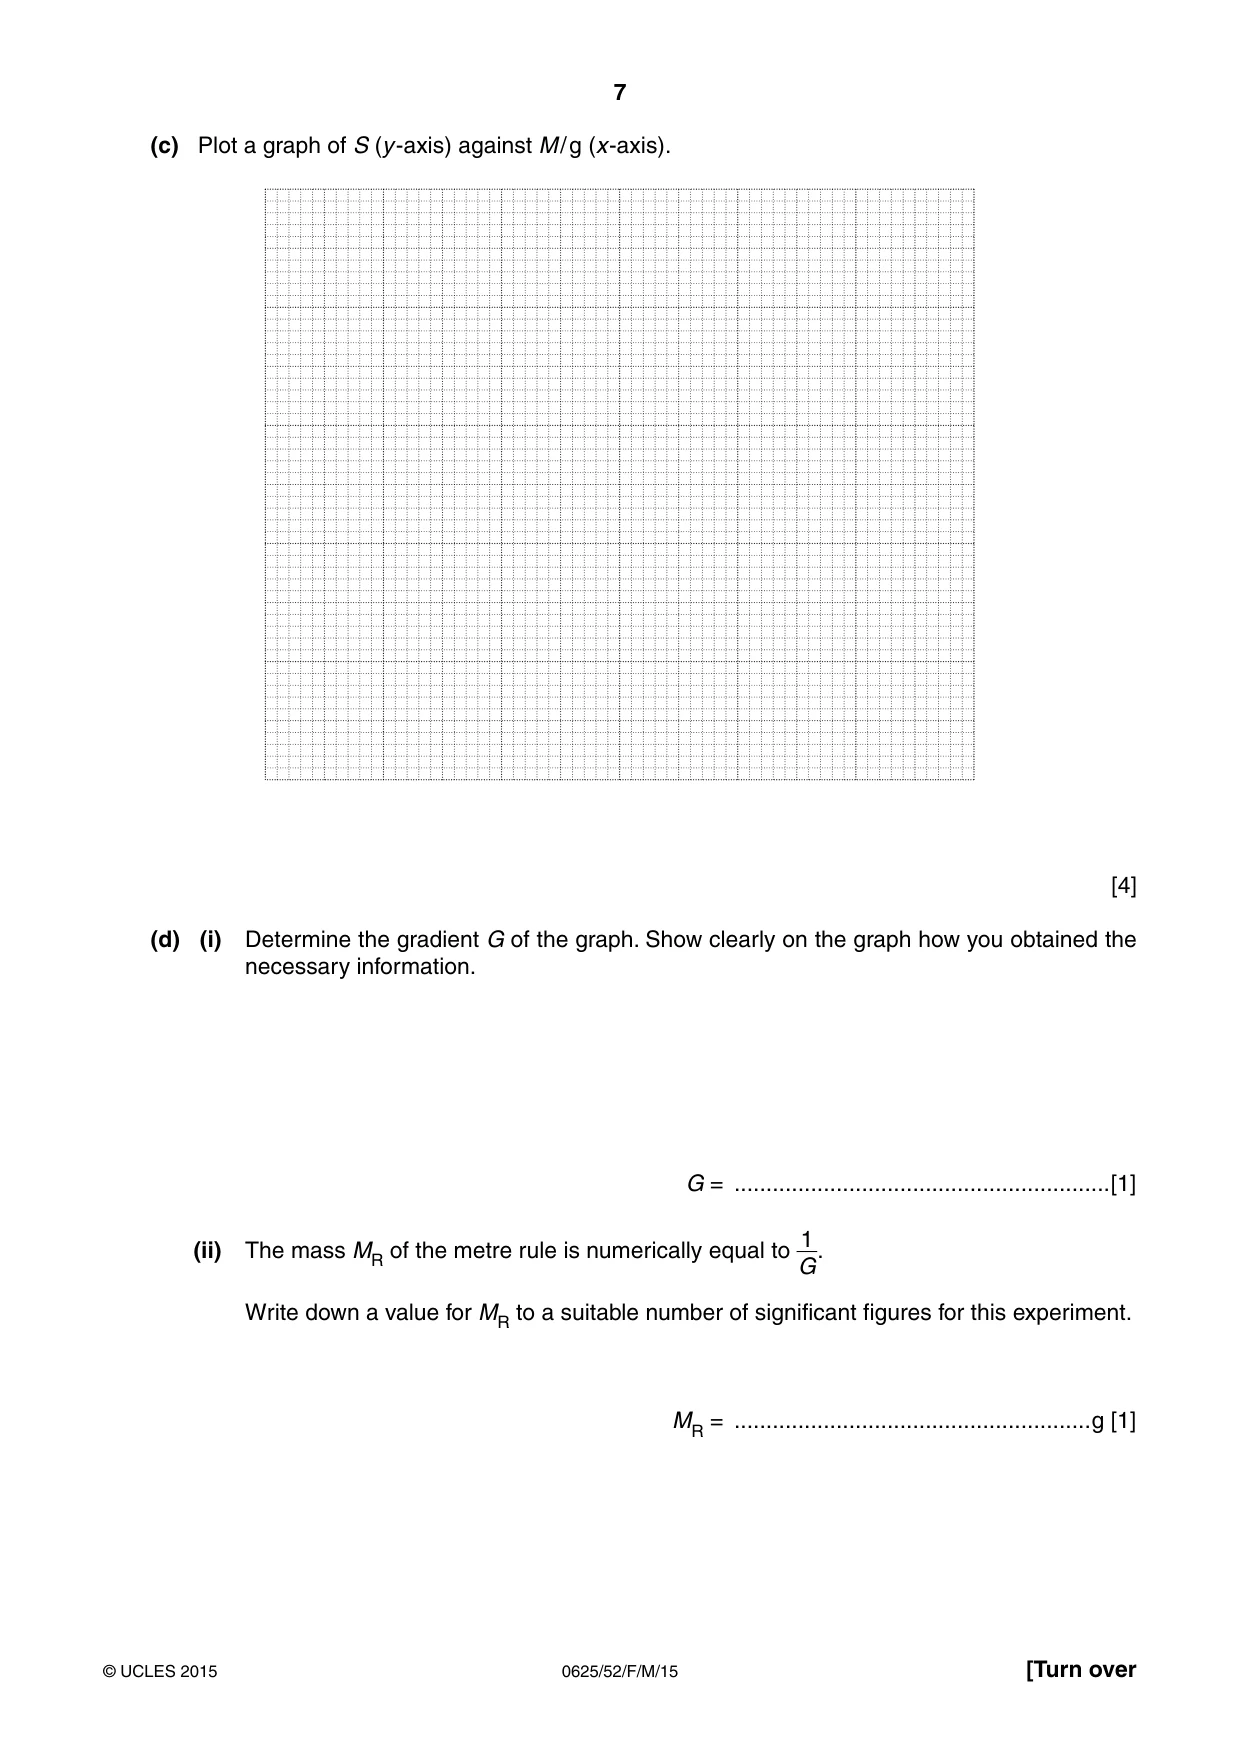
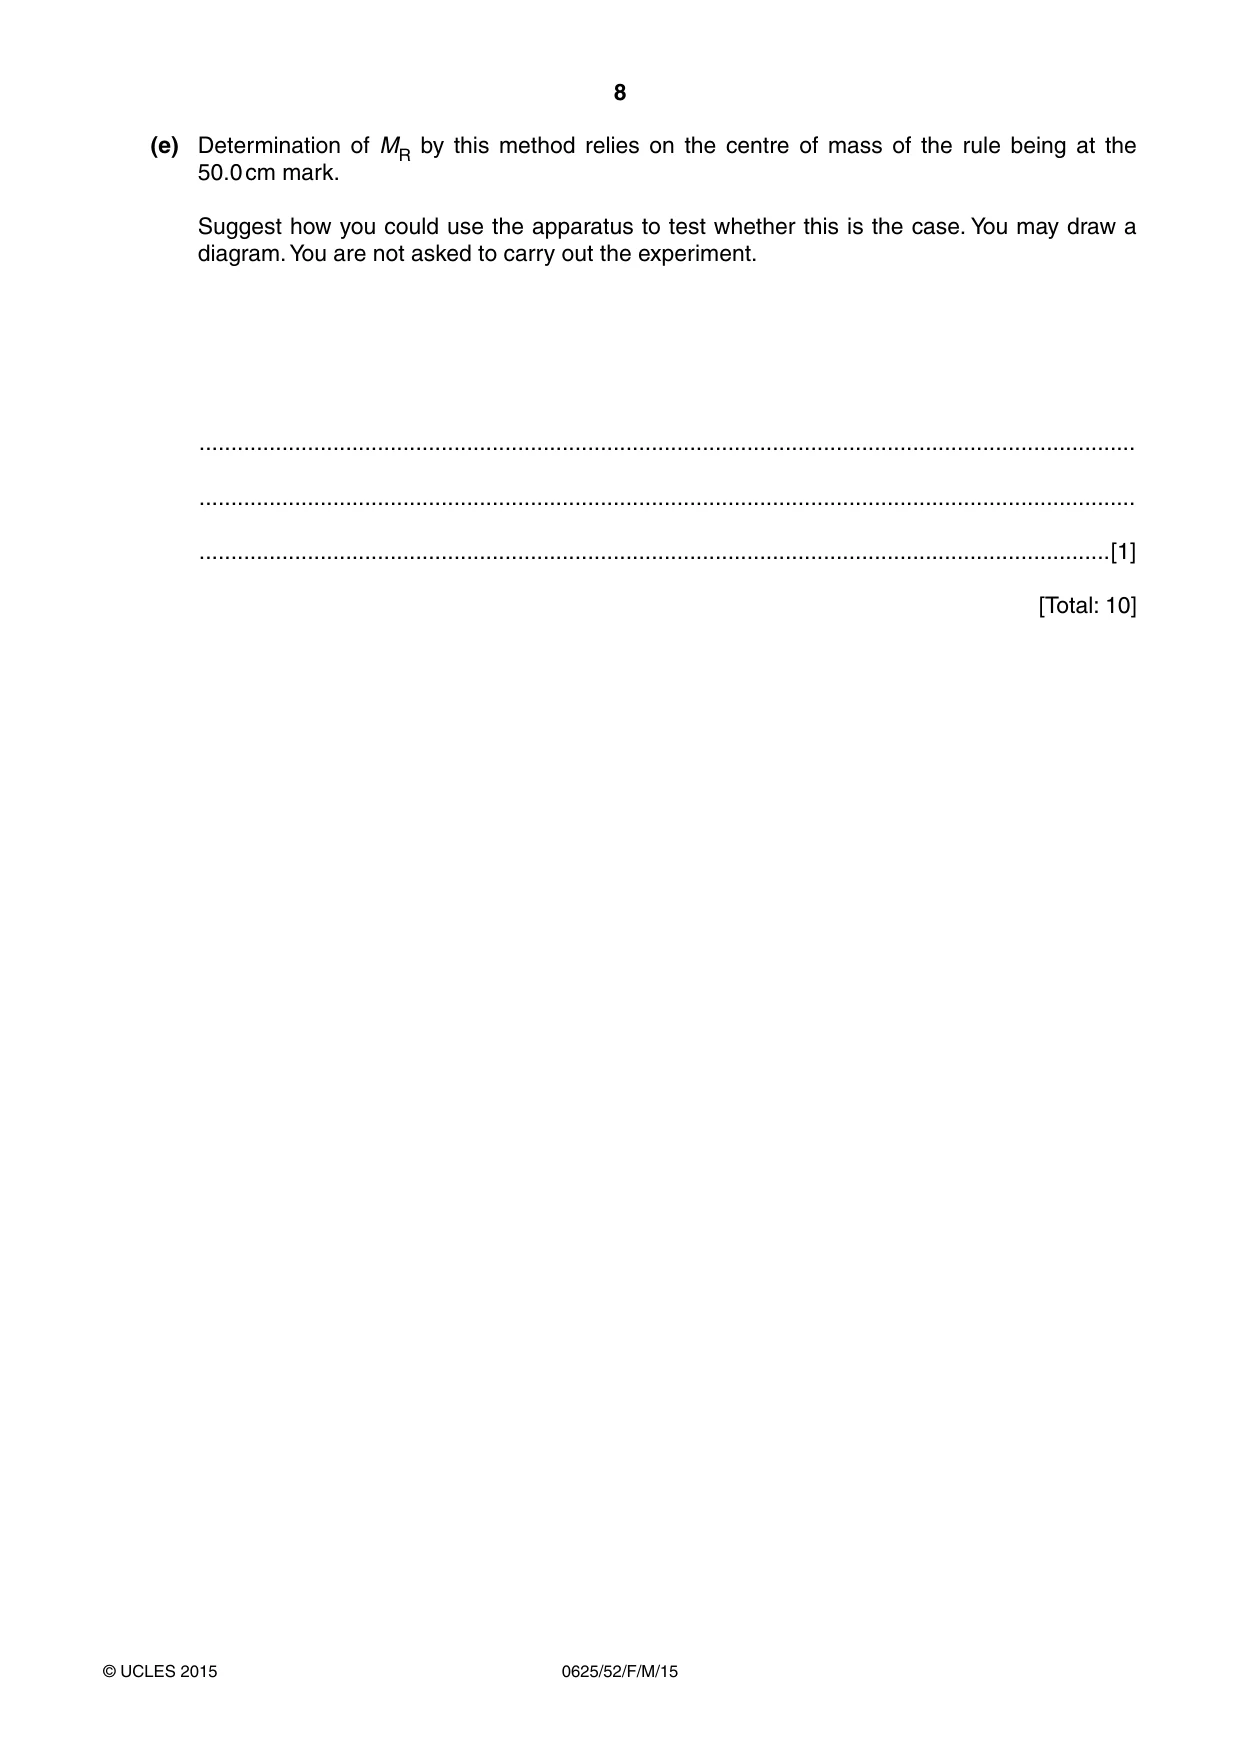
3 In this experiment, you will determine the mass of a metre rule by a balancing method. Carry out the following instructions, referring to Fig. 3.1. mass M metre rule a b 50.0 cm mark pivot 95.0 cm mark Fig. 3.1 (a) (i) Place the metre rule on the pivot. Place a mass M = 20 g with its centre at the 95.0 cm mark. Keeping the mass at the 95.0 cm mark, adjust the position of the metre rule on the pivot until the metre rule is as near to being balanced as possible. Record, in Table 3.1, the position of the pivot. (ii) Record in the table • the distance a between the 50.0 cm mark and the pivot, • the distance b between the 95.0 cm mark and the pivot. Table 3.1 M / g position of a / cm b / cm S pivot / cm 20 40 60 80 100 (iii) Repeat steps (a)(i) and (a)(ii) for values of M = 40 g, 60 g, 80 g and 100 g. [2] a (b) For each value of M, calculate and record in the table the value S, where S = b. [1] (c) Plot a graph of S (y-axis) against M /g (x-axis). [4] (d) (i) Determine the gradient G of the graph. Show clearly on the graph how you obtained the necessary information. G = ...........................................................[1] 1 (ii) The mass MR of the metre rule is numerically equal to G. Write down a value for MR to a suitable number of significant figures for this experiment. MR = ........................................................g [1] (e) Determination of MR by this method relies on the centre of mass of the rule being at the 50.0 cm mark. Suggest how you could use the apparatus to test whether this is the case. You may draw a diagram. You are not asked to carry out the experiment. ................................................................................................................................................... ................................................................................................................................................... ...............................................................................................................................................[1] [Total: 10]
Mark scheme: 3 (a) a + b in range 44.5 to 45.5 cm [1] both a and b to at least 1 decimal place in all cases [1] (b) correct calculations of S [1] (c) axes labelled with quantity and unit [1] appropriate scales [1] plots correct to ½ small square [1] well-judged straight line, thin line, precise plots [1] (d) (i) G present AND triangle method seen on graph [1] (ii) MR = 1/G AND to 2/3 sig. fig. [1] (e) see if rule balances when pivot at 50 cm mark owtte [1] [Total: 10]
Q4 · In this experiment, you will investigate how the insulation around a container affects…
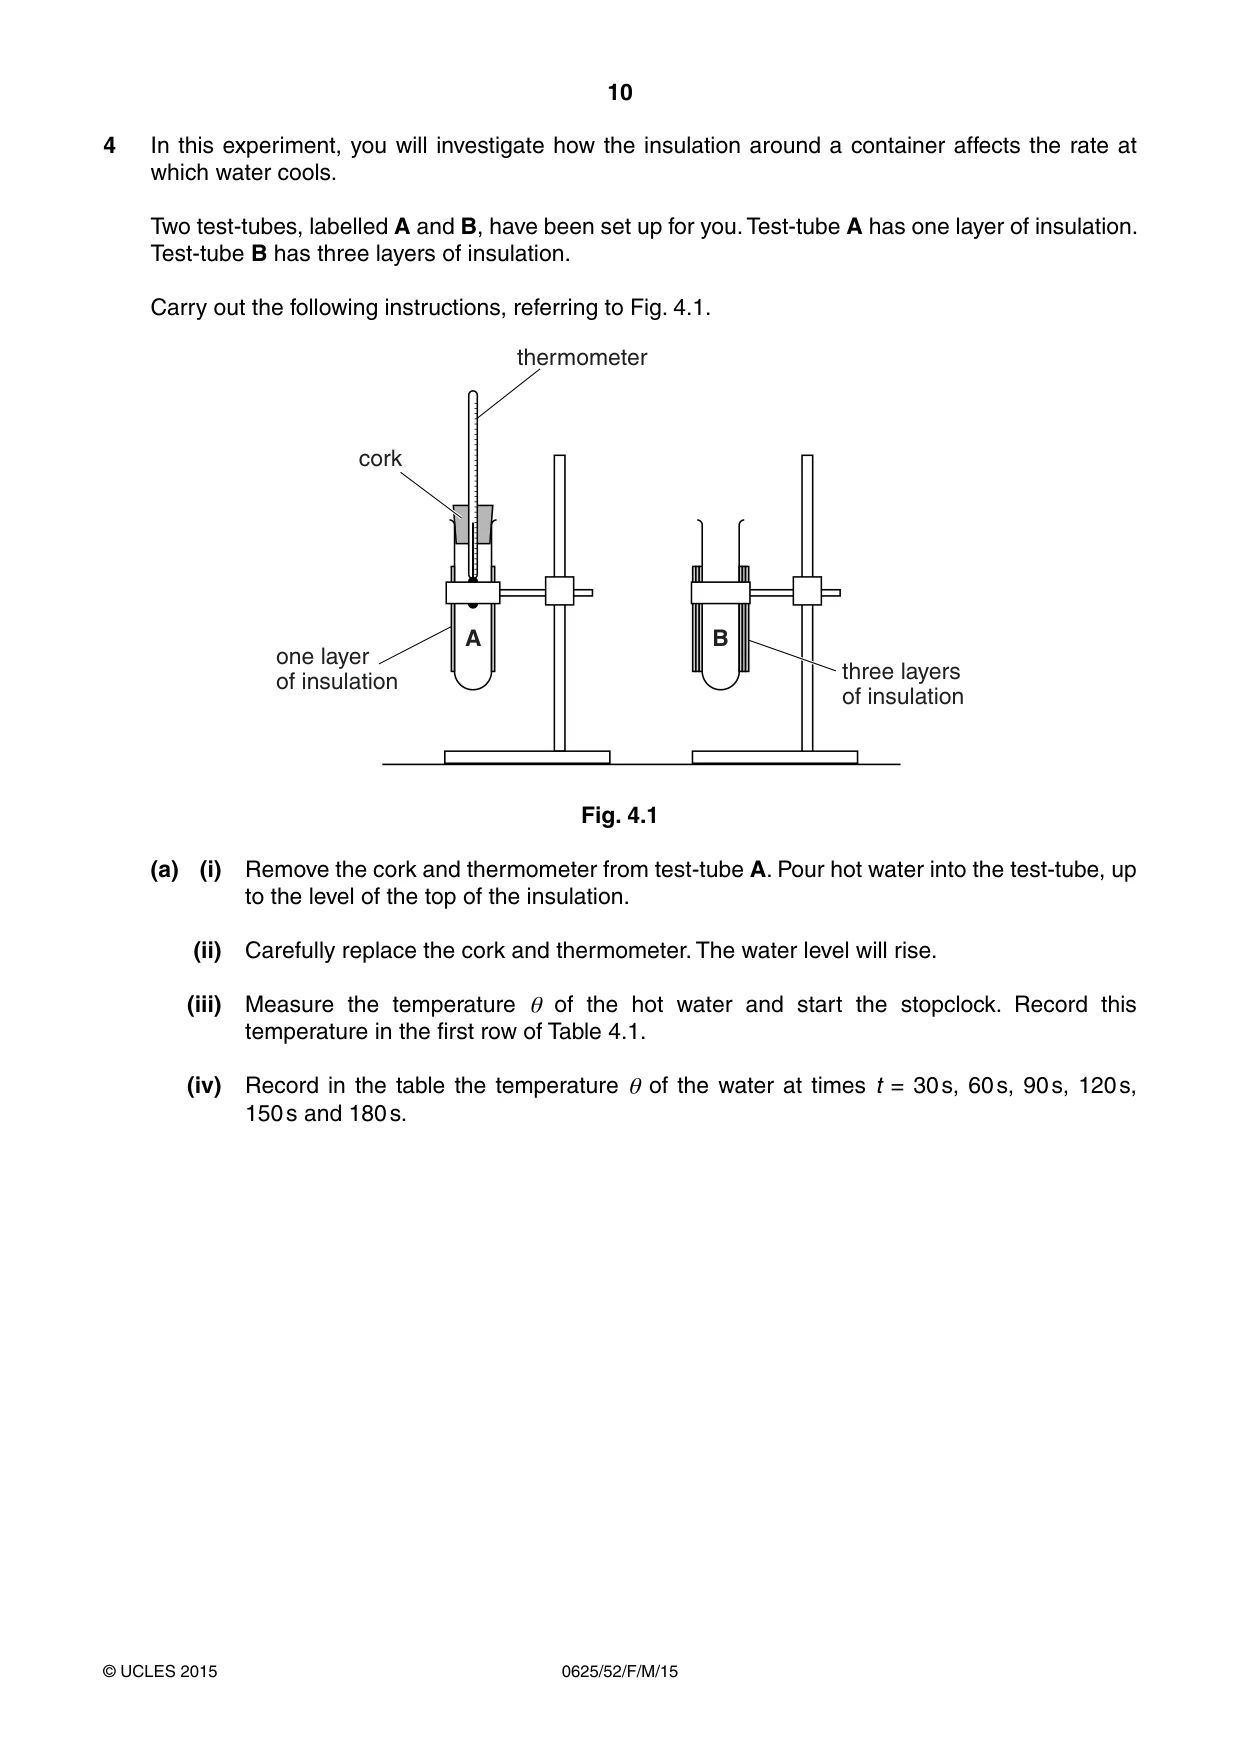
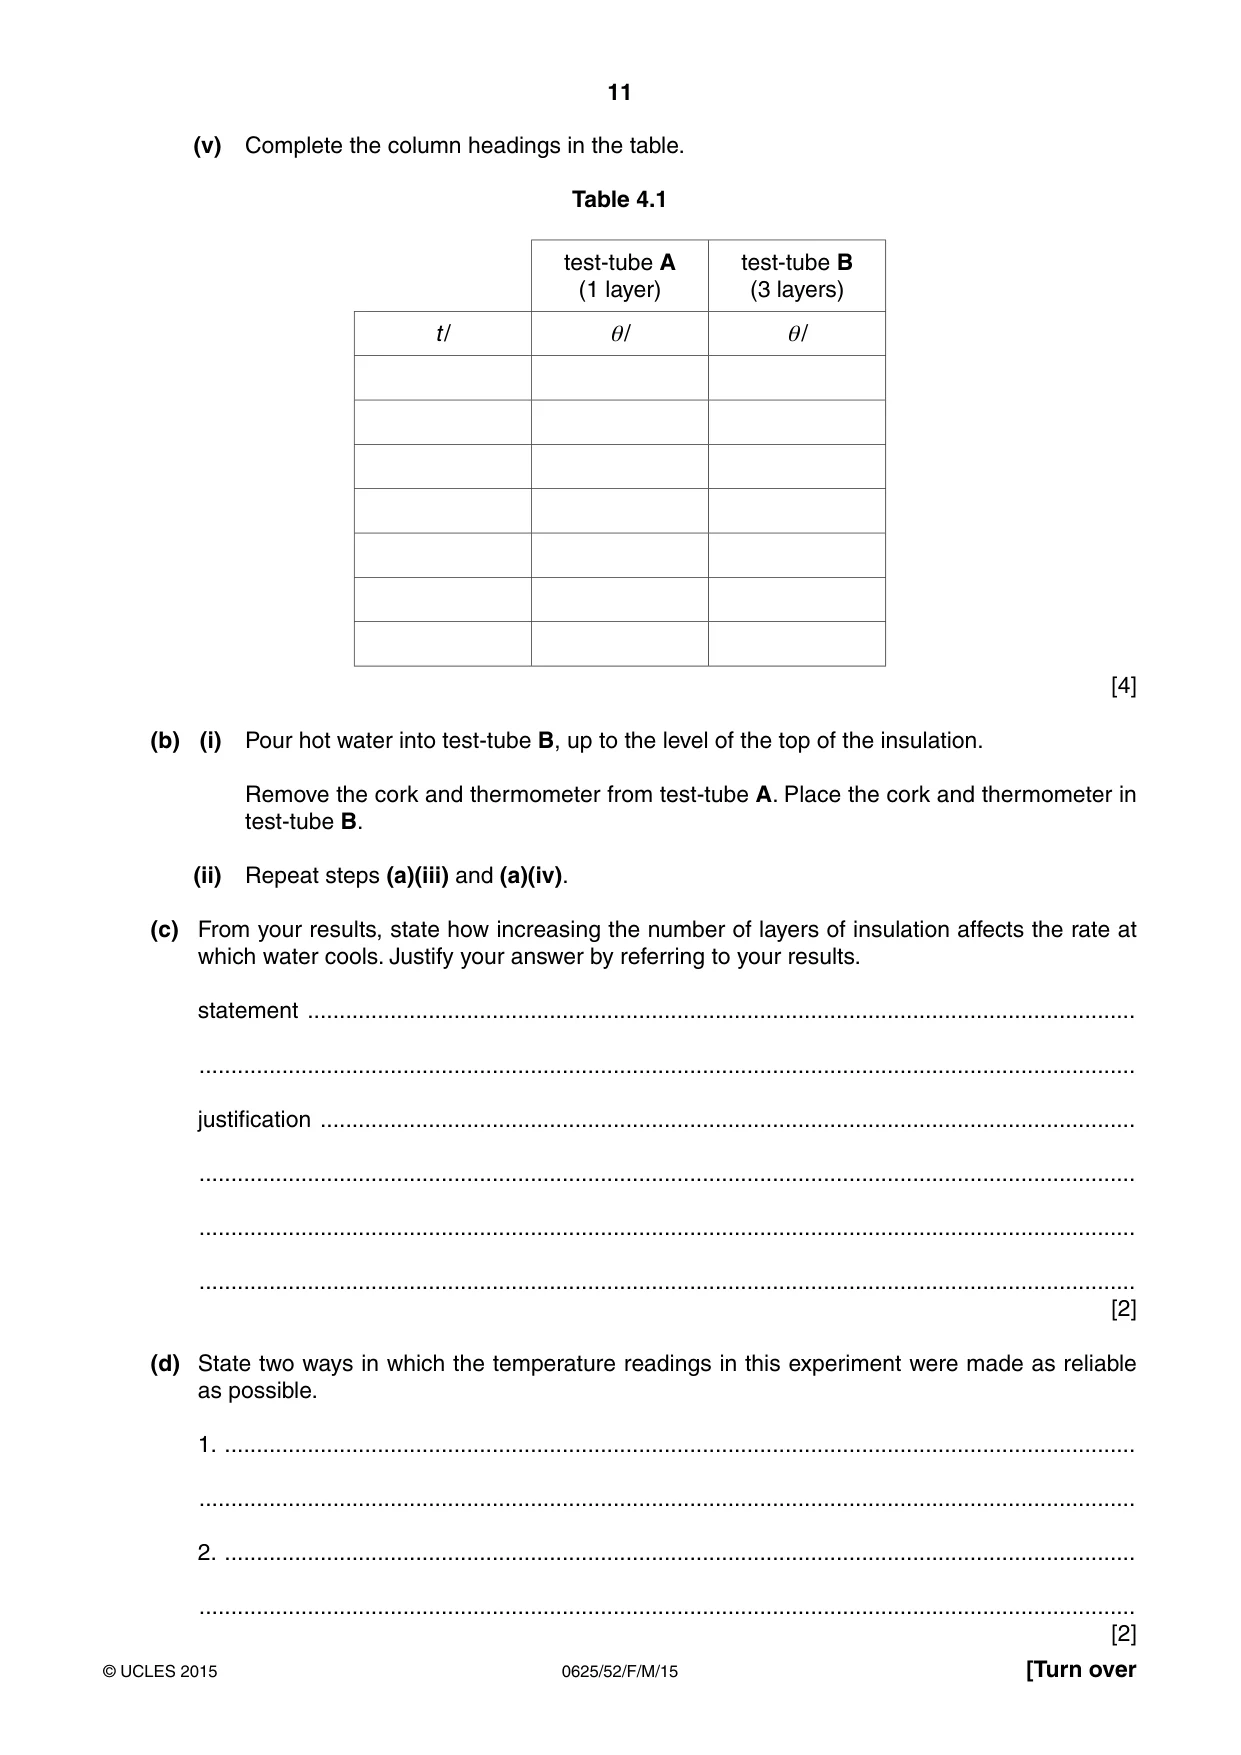
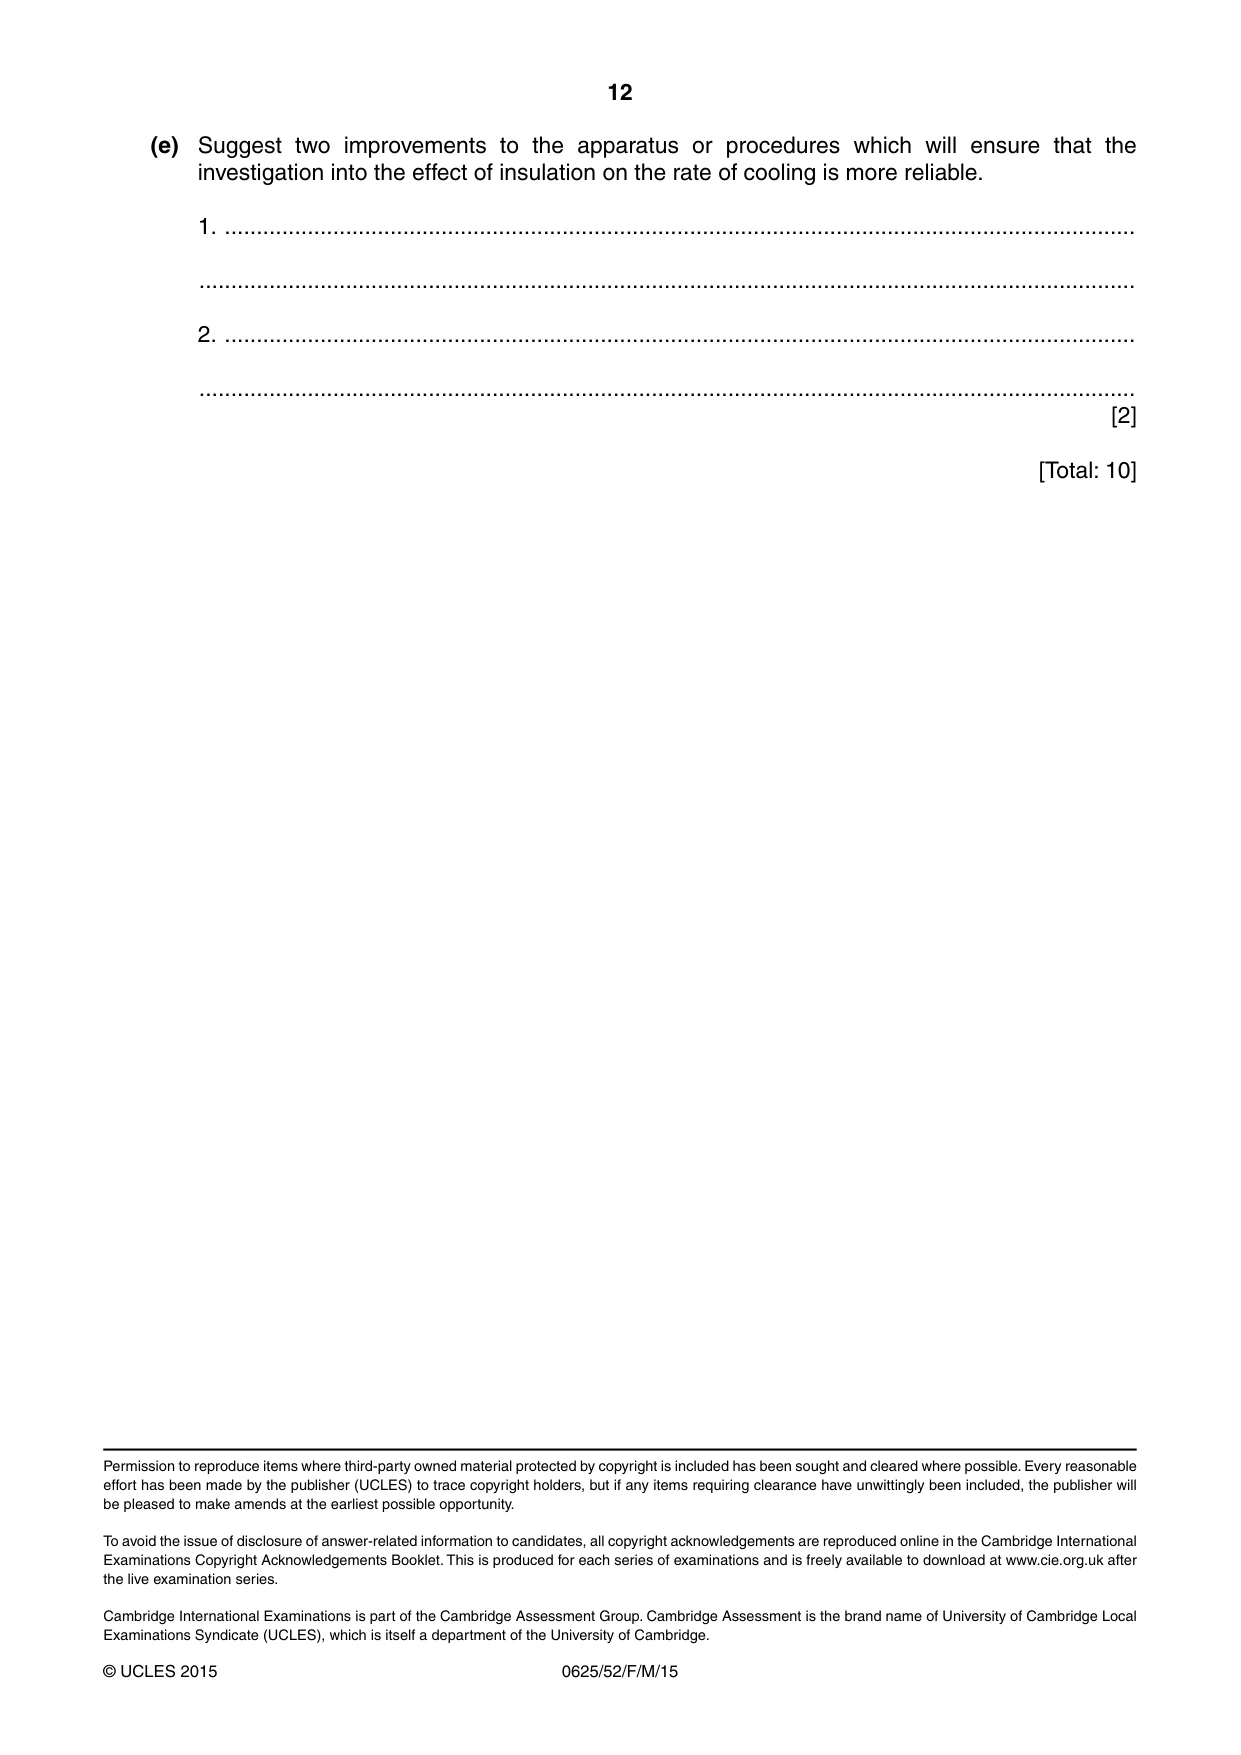
4 In this experiment, you will investigate how the insulation around a container affects the rate at which water cools. Two test-tubes, labelled A and B, have been set up for you. Test-tube A has one layer of insulation. Test-tube B has three layers of insulation. Carry out the following instructions, referring to Fig. 4.1. thermometer cork A B one layer three layers of insulation of insulation Fig. 4.1 (a) (i) Remove the cork and thermometer from test-tube A. Pour hot water into the test-tube, up to the level of the top of the insulation. (ii) Carefully replace the cork and thermometer. The water level will rise. (iii) Measure the temperature θ of the hot water and start the stopclock. Record this temperature in the first row of Table 4.1. (iv) Record in the table the temperature θ of the water at times t = 30 s, 60 s, 90 s, 120 s, 150 s and 180 s. (v) Complete the column headings in the table. Table 4.1 test-tube A test-tube B (1 layer) (3 layers) t / θ/ θ/ [4] (b) (i) Pour hot water into test-tube B, up to the level of the top of the insulation. Remove the cork and thermometer from test-tube A. Place the cork and thermometer in test-tube B. (ii) Repeat steps (a)(iii) and (a)(iv). (c) From your results, state how increasing the number of layers of insulation affects the rate at which water cools. Justify your answer by referring to your results. statement .................................................................................................................................. ................................................................................................................................................... justification ................................................................................................................................ ................................................................................................................................................... ................................................................................................................................................... ................................................................................................................................................... [2] (d) State two ways in which the temperature readings in this experiment were made as reliable as possible. 1. ............................................................................................................................................... ................................................................................................................................................... 2. ............................................................................................................................................... ................................................................................................................................................... [2] (e) Suggest two improvements to the apparatus or procedures which will ensure that the investigation into the effect of insulation on the rate of cooling is more reliable. 1. ............................................................................................................................................... ................................................................................................................................................... 2. ............................................................................................................................................... ................................................................................................................................................... [2] [Total: 10]
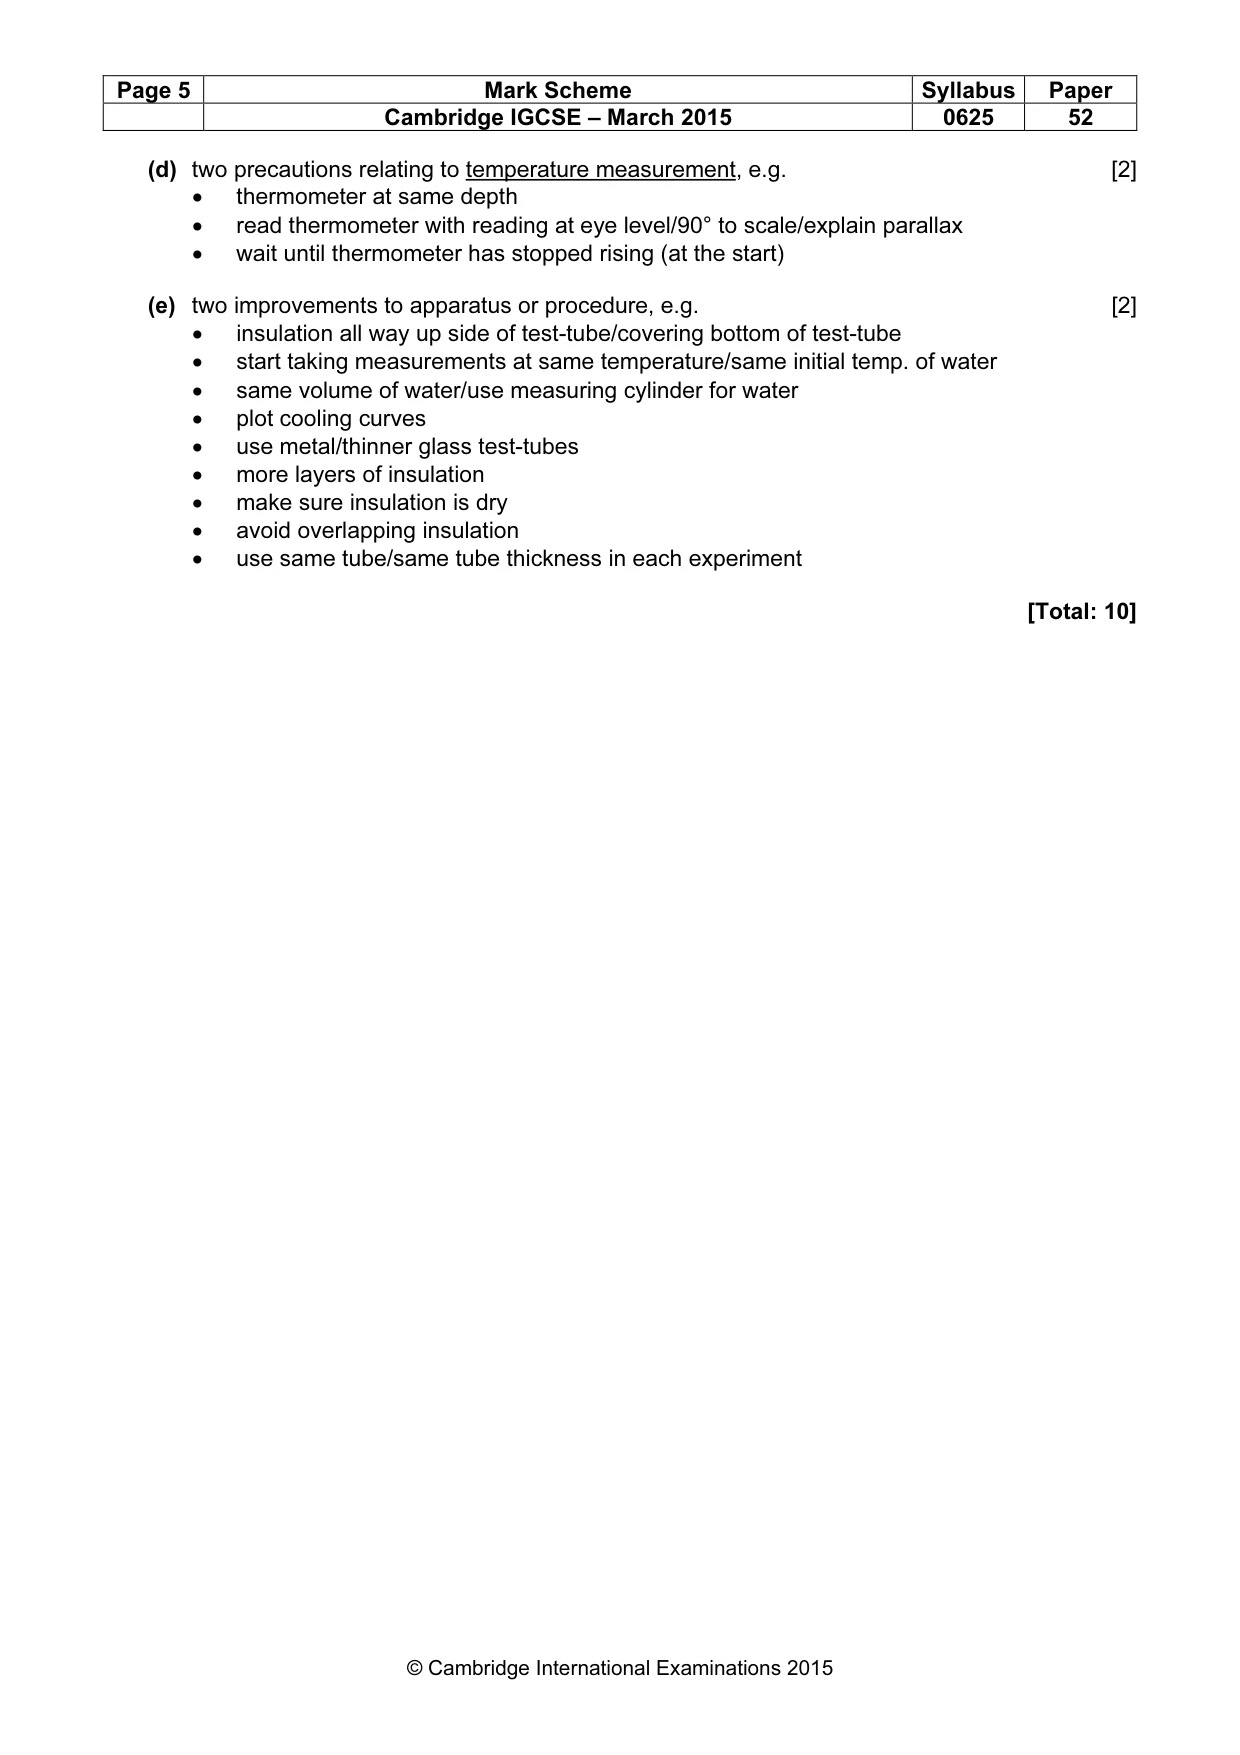
Mark scheme: 4 (a) units correct, accept symbols or words [1] t values correct: 0, 30, 60, 90, 120, 150, 180 [1] (b) θ for A and θ for B decreasing AND to at least 1 °C [1] θ for B decreasing more slowly than θ for A [1] (c) statement matching results with comparison of temperature changes over whole available range OR from same temperatures in each column [1] justification with mention of ‘in the same time’ owtte [1] (d) two precautions relating to temperature measurement, e.g. [2] • thermometer at same depth • read thermometer with reading at eye level/90° to scale/explain parallax • wait until thermometer has stopped rising (at the start) (e) two improvements to apparatus or procedure, e.g. [2] • insulation all way up side of test-tube/covering bottom of test-tube • start taking measurements at same temperature/same initial temp. of water • same volume of water/use measuring cylinder for water • plot cooling curves • use metal/thinner glass test-tubes • more layers of insulation • make sure insulation is dry • avoid overlapping insulation • use same tube/same tube thickness in each experiment [Total: 10]
What was in this paper
The subtopics covered by these 4 questions, and how many questions each got. Open one in a new tab to see every Cambridge question on it.
What you needed in this session
Cambridge’s own grade thresholds for 2015 Feb/March, Paper 5 · Variant 2. A higher threshold means an easier paper — the bar moves with how the cohort did.