Cambridge IGCSE Physics 0625 — 2014 Oct/Nov Paper 6 · Variant 3
0625/63/O/N/14 · 5 questions · 40 marks · ≈45 min
The question paper and its mark scheme, free to read here and free to download. This is Cambridge’s own paper, exactly as it was sat.
Question paper16 pages
Mark scheme4 pages
Answers below. Sit the paper first if you are practising.
Questions as text
Q1 · The IGCSE class is investigating the downward deflection of a metre rule clamped at one…
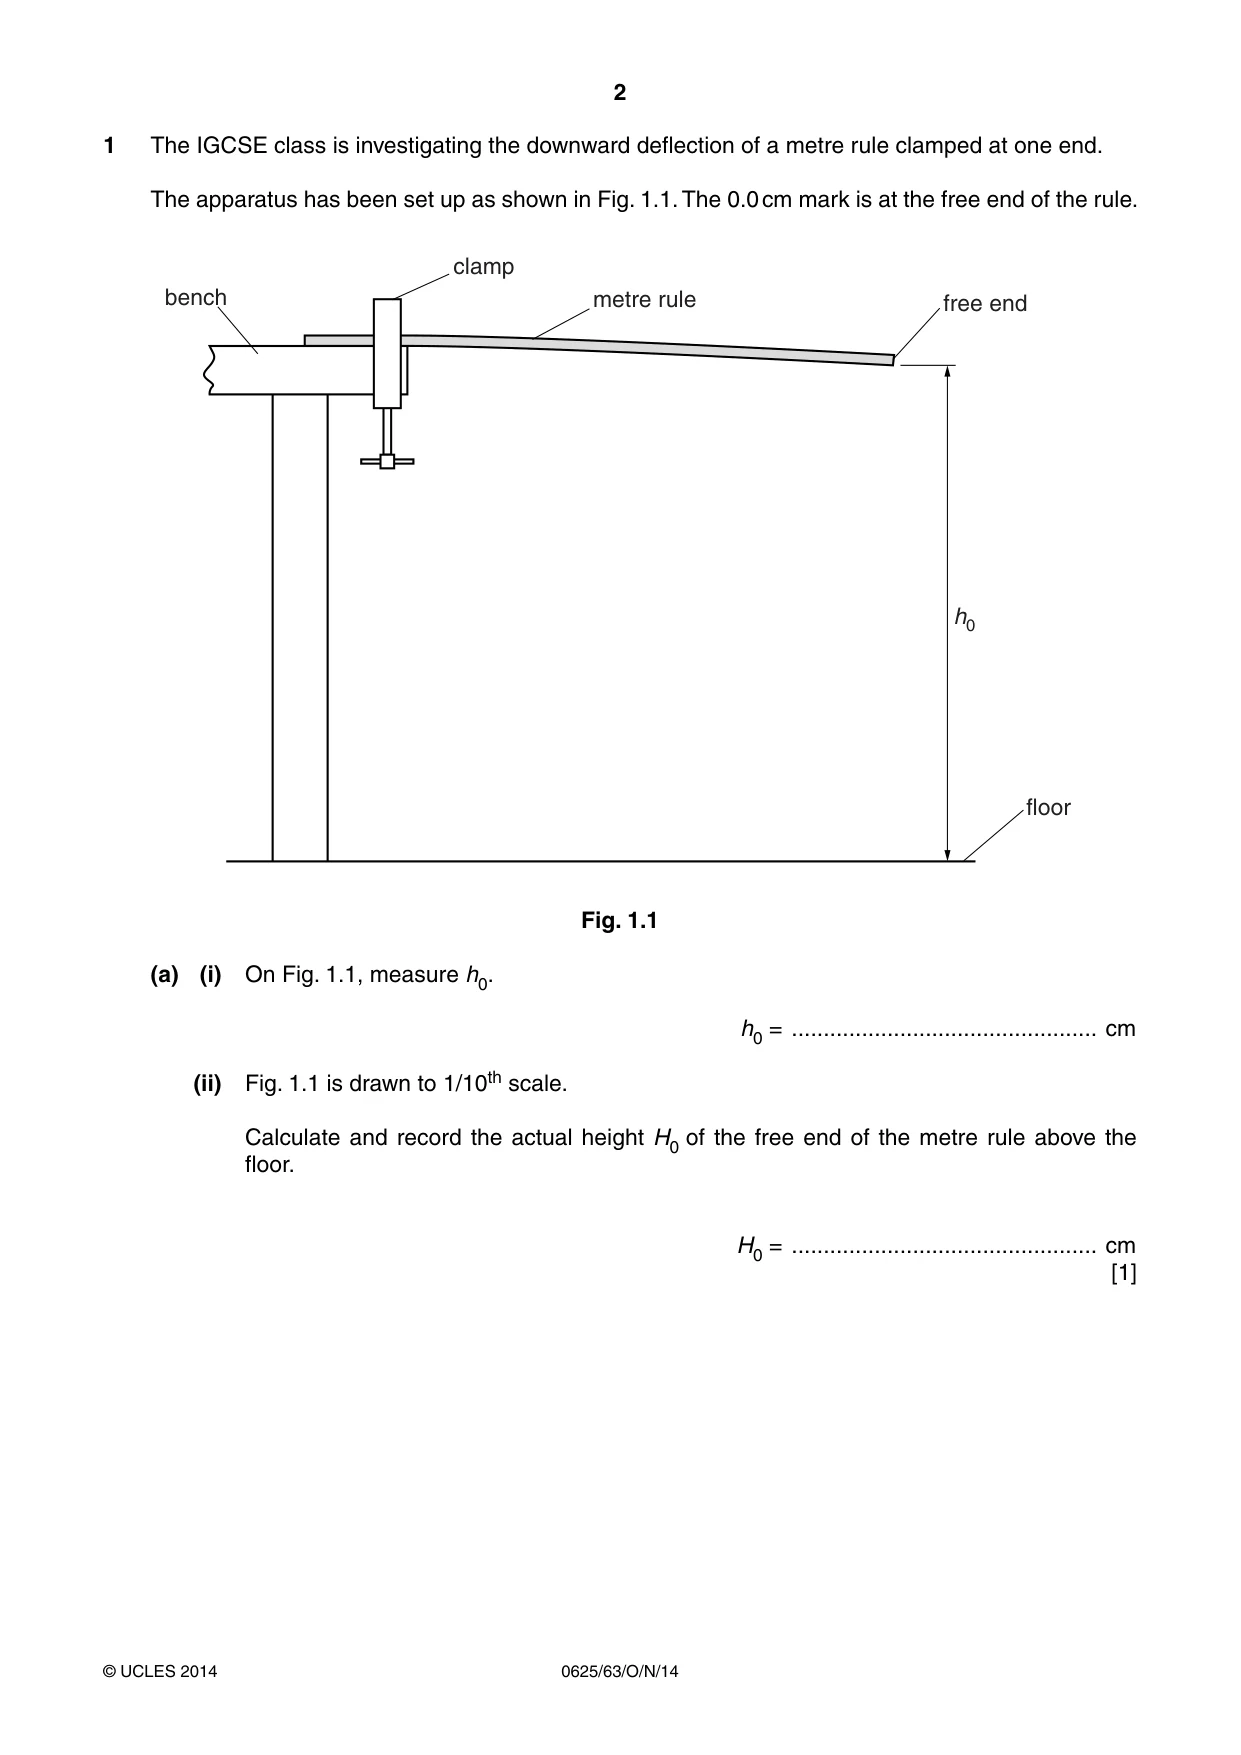
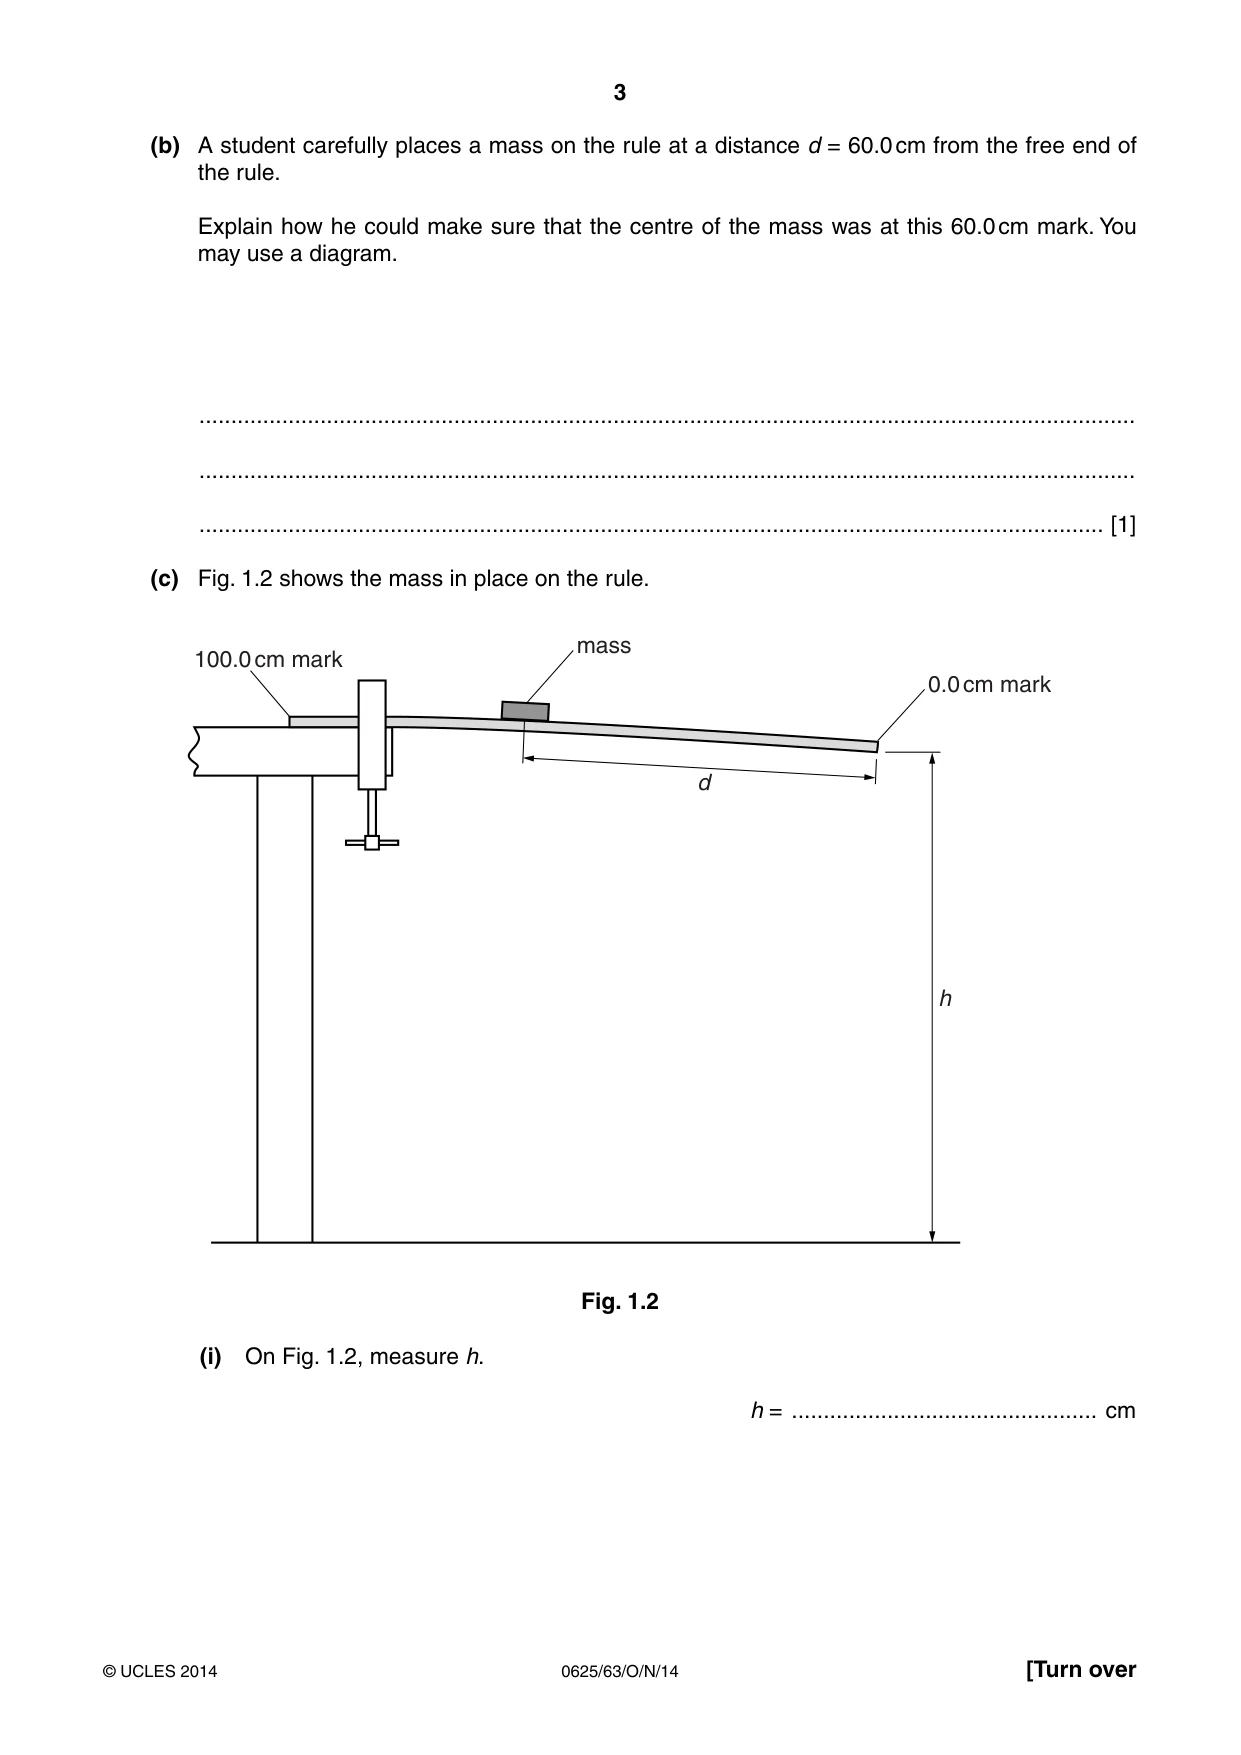
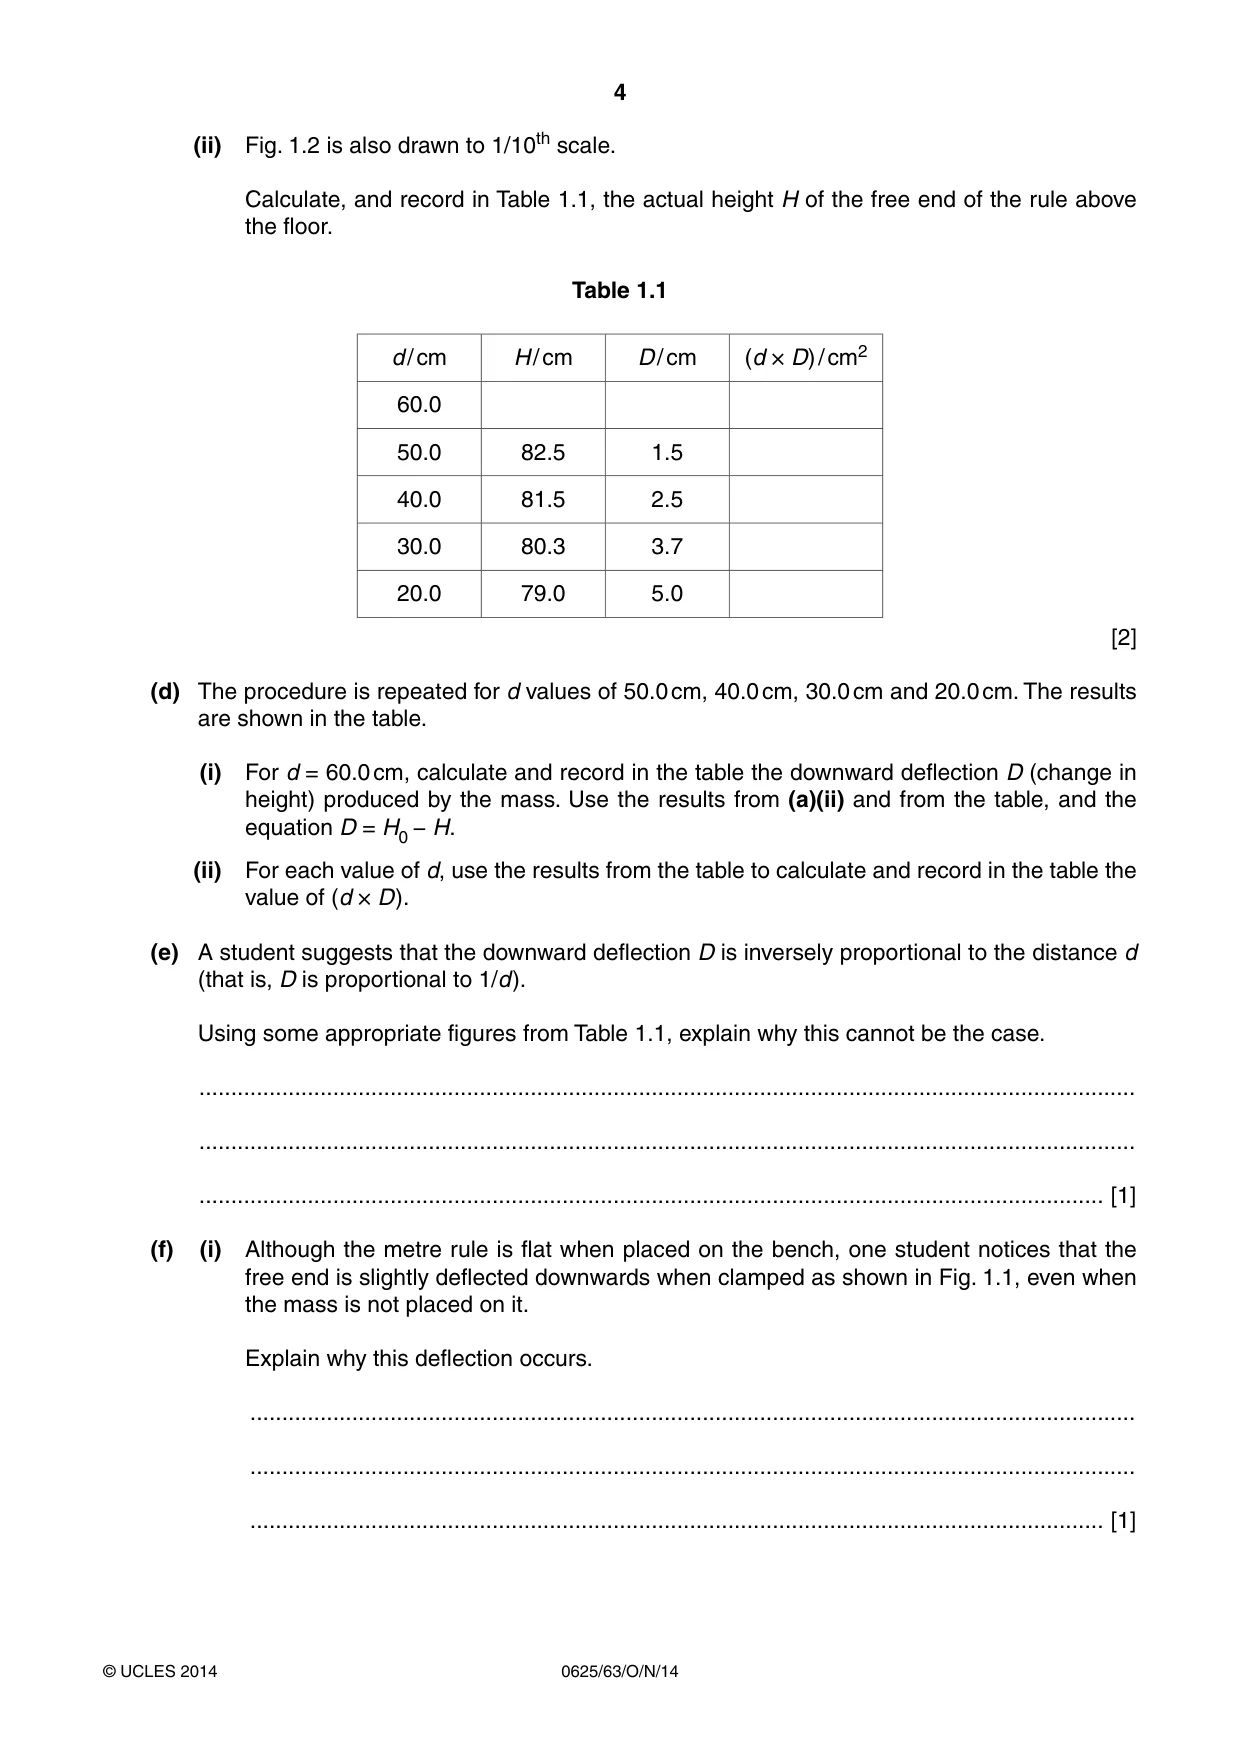
1 The IGCSE class is investigating the downward deflection of a metre rule clamped at one end. The apparatus has been set up as shown in Fig. 1.1. The 0.0 cm mark is at the free end of the rule. clamp bench metre rule free end h0 floor Fig. 1.1 (a) (i) On Fig. 1.1, measure h0. h0 = ................................................ cm (ii) Fig. 1.1 is drawn to 1/10th scale. Calculate and record the actual height H0 of the free end of the metre rule above the floor. H0 = ................................................ cm [1] (b) A student carefully places a mass on the rule at a distance d = 60.0 cm from the free end of the rule. Explain how he could make sure that the centre of the mass was at this 60.0 cm mark. You may use a diagram. ................................................................................................................................................... ................................................................................................................................................... .............................................................................................................................................. [1] (c) Fig. 1.2 shows the mass in place on the rule. mass 100.0 cm mark 0.0 cm mark d h Fig. 1.2 (i) On Fig. 1.2, measure h. h = ................................................ cm (ii) Fig. 1.2 is also drawn to 1/10th scale. Calculate, and record in Table 1.1, the actual height H of the free end of the rule above the floor. Table 1.1 d / cm H / cm D / cm (d × D) / cm2 60.0 50.0 82.5 1.5 40.0 81.5 2.5 30.0 80.3 3.7 20.0 79.0 5.0 [2] (d) The procedure is repeated for d values of 50.0 cm, 40.0 cm, 30.0 cm and 20.0 cm. The results are shown in the table. (i) For d = 60.0 cm, calculate and record in the table the downward deflection D (change in height) produced by the mass. Use the results from (a)(ii) and from the table, and the equation D = H0 − H. (ii) For each value of d, use the results from the table to calculate and record in the table the value of (d × D). (e) A student suggests that the downward deflection D is inversely proportional to the distance d (that is, D is proportional to 1/d). Using some appropriate figures from Table 1.1, explain why this cannot be the case. ................................................................................................................................................... ................................................................................................................................................... .............................................................................................................................................. [1] (f) (i) Although the metre rule is flat when placed on the bench, one student notices that the free end is slightly deflected downwards when clamped as shown in Fig. 1.1, even when the mass is not placed on it. Explain why this deflection occurs. ........................................................................................................................................... ........................................................................................................................................... ...................................................................................................................................... [1] (ii) Suggest how to find the value of this deflection. You may draw a diagram. ........................................................................................................................................... ........................................................................................................................................... ...................................................................................................................................... [2] [Total: 8]
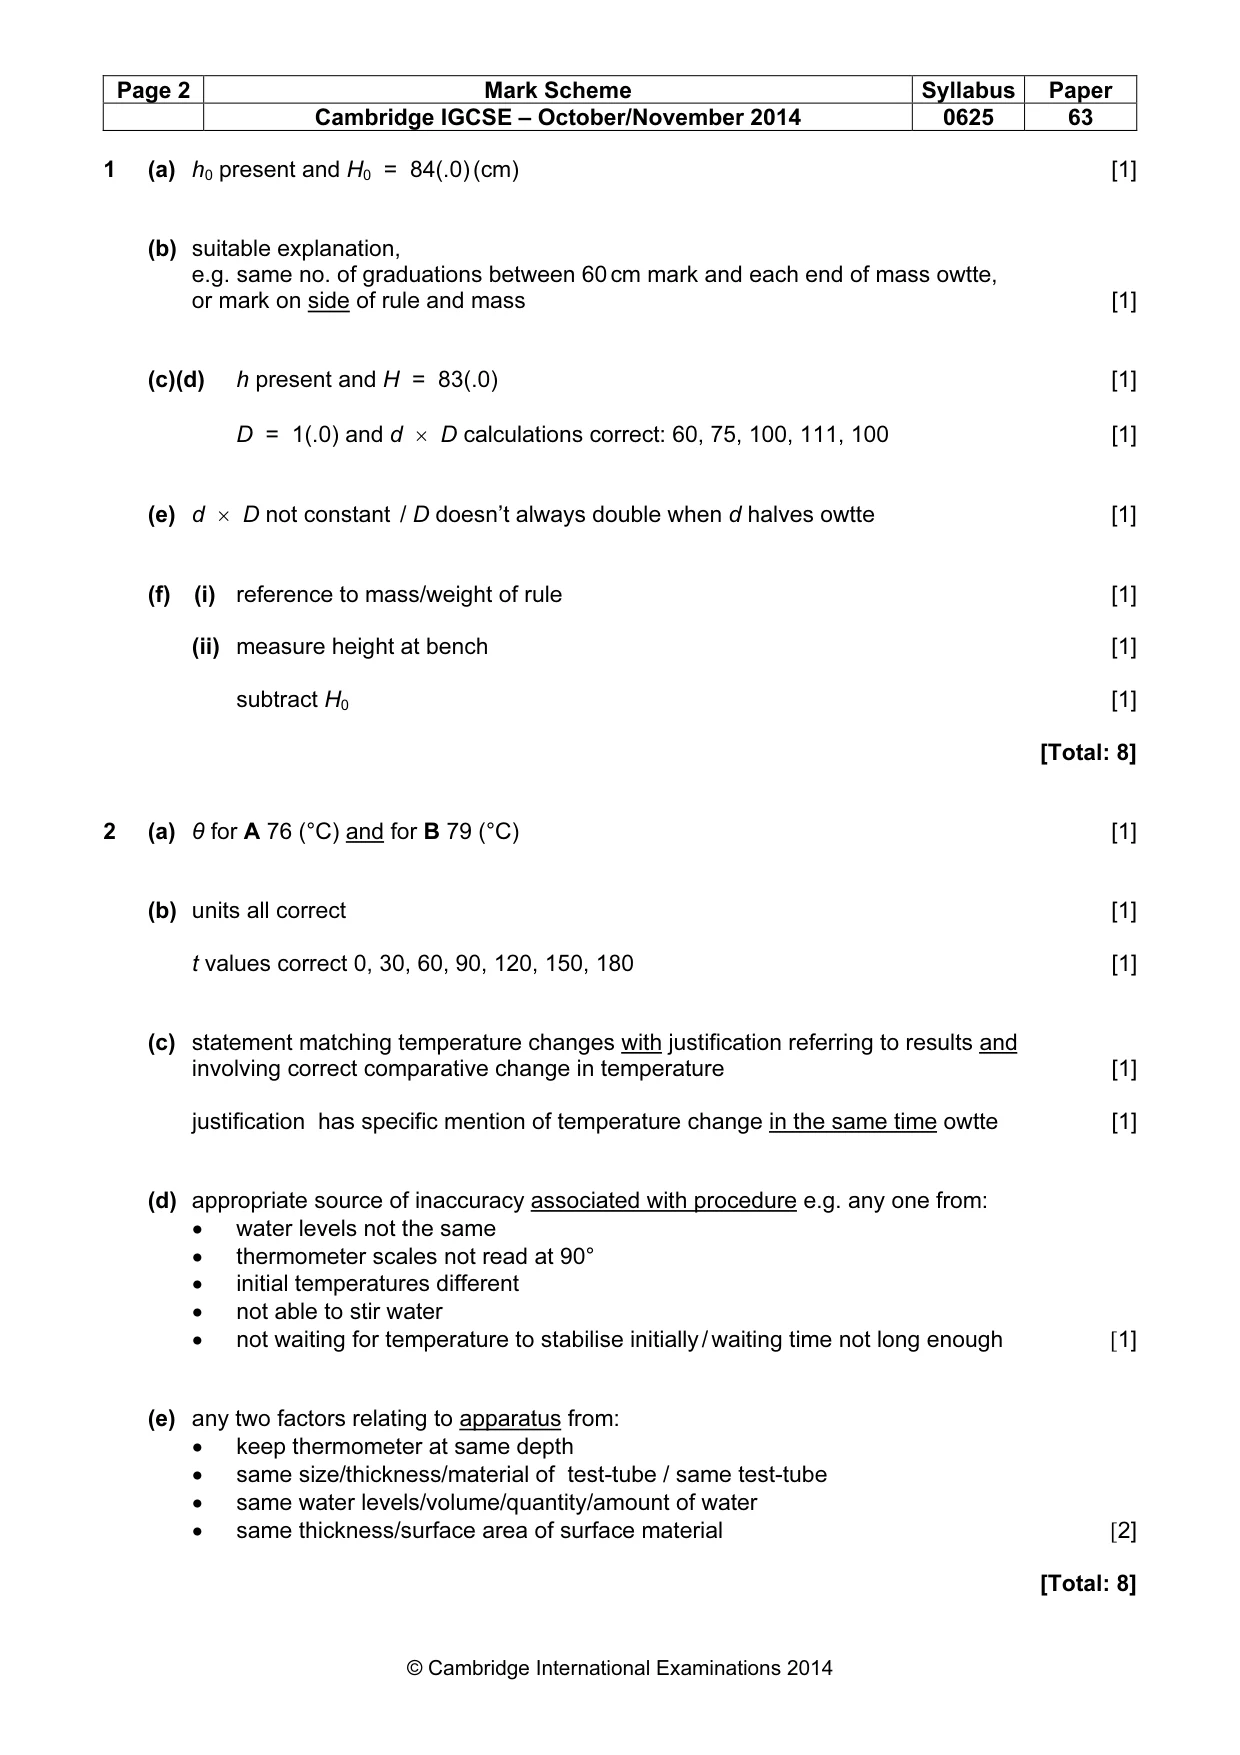
Mark scheme: 1 (a) h0 present and H0 = 84(.0) (cm) [1] (b) suitable explanation, e.g. same no. of graduations between 60 cm mark and each end of mass owtte, or mark on side of rule and mass [1] (c)(d) h present and H = 83(.0) [1] D = 1(.0) and d × D calculations correct: 60, 75, 100, 111, 100 [1] (e) d × D not constant / D doesn’t always double when d halves owtte [1] (f) (i) reference to mass/weight of rule [1] (ii) measure height at bench [1] subtract H0 [1] [Total: 8]
Q2 · An IGCSE student is investigating how the surface of a container affects the rate at…
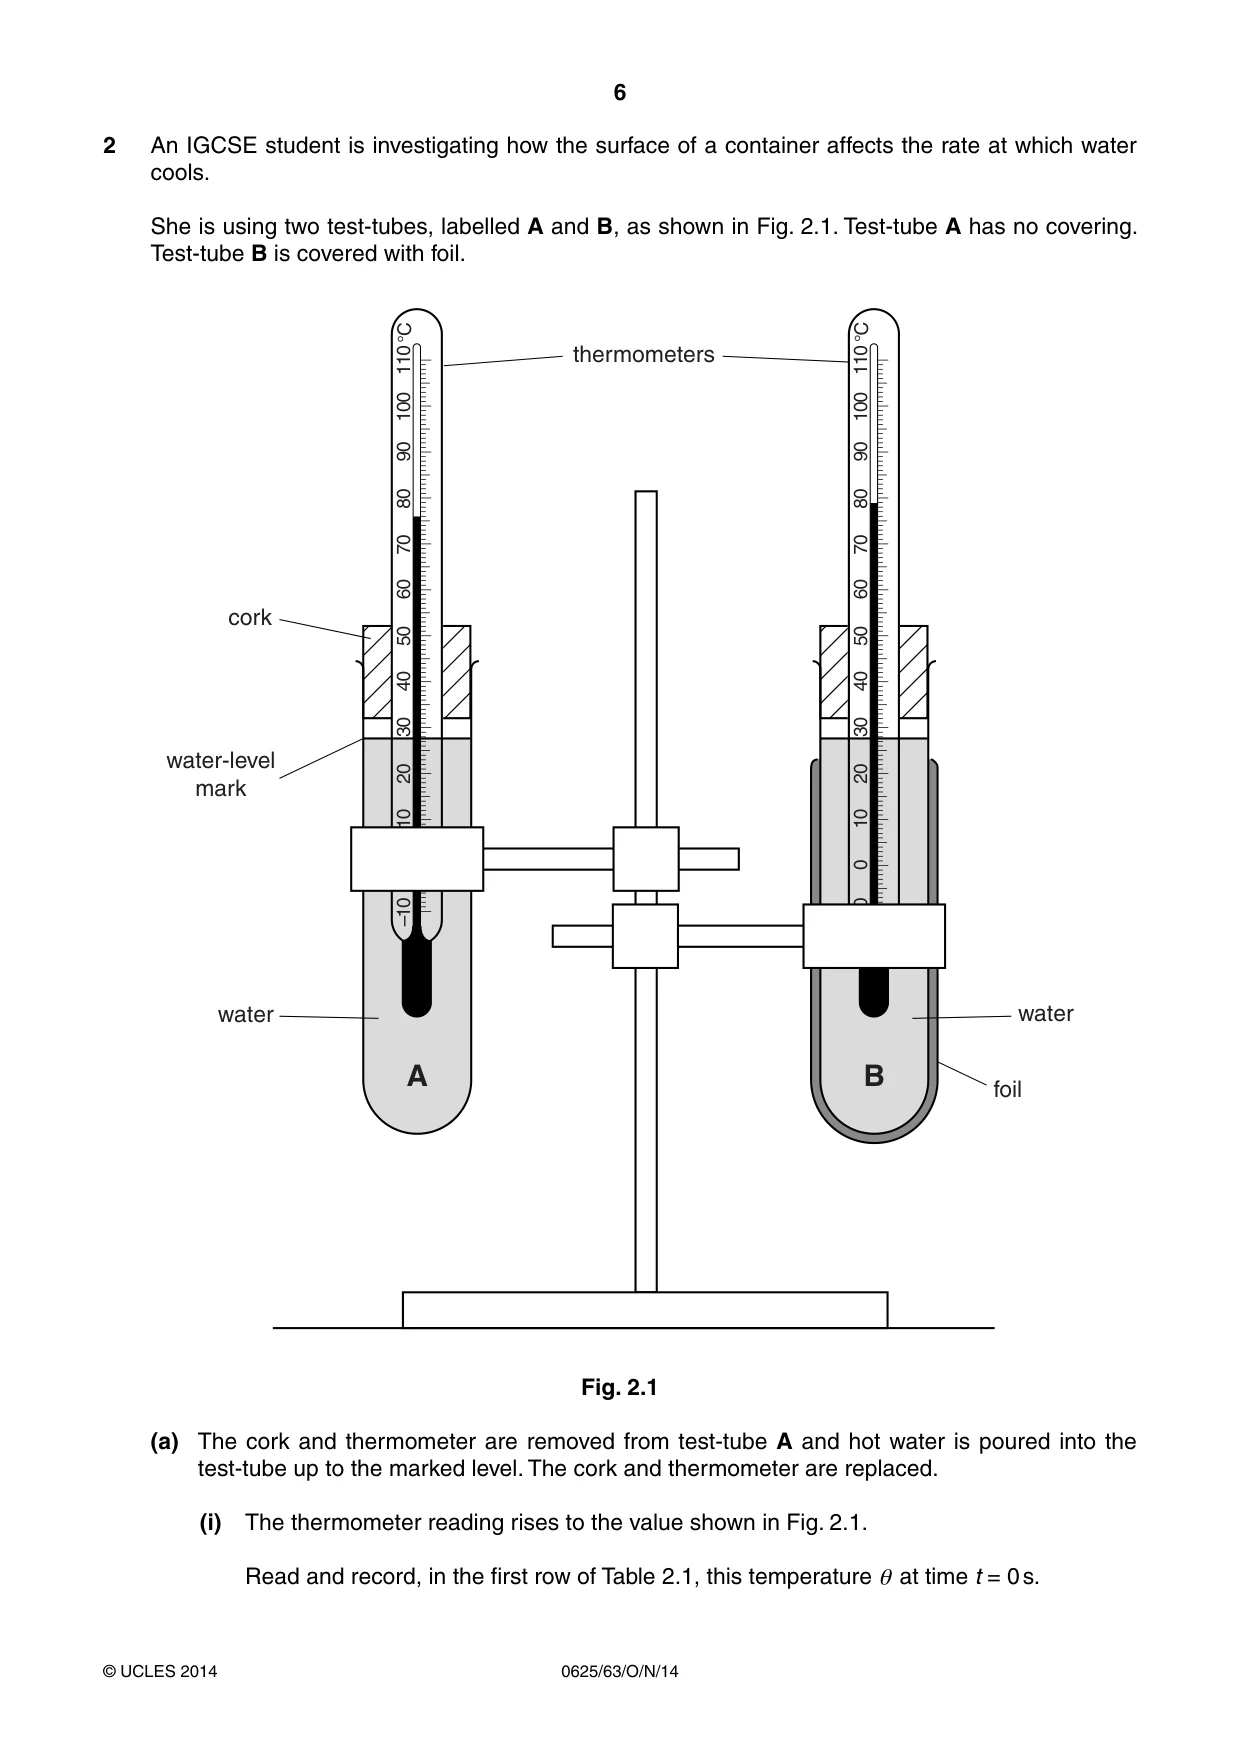
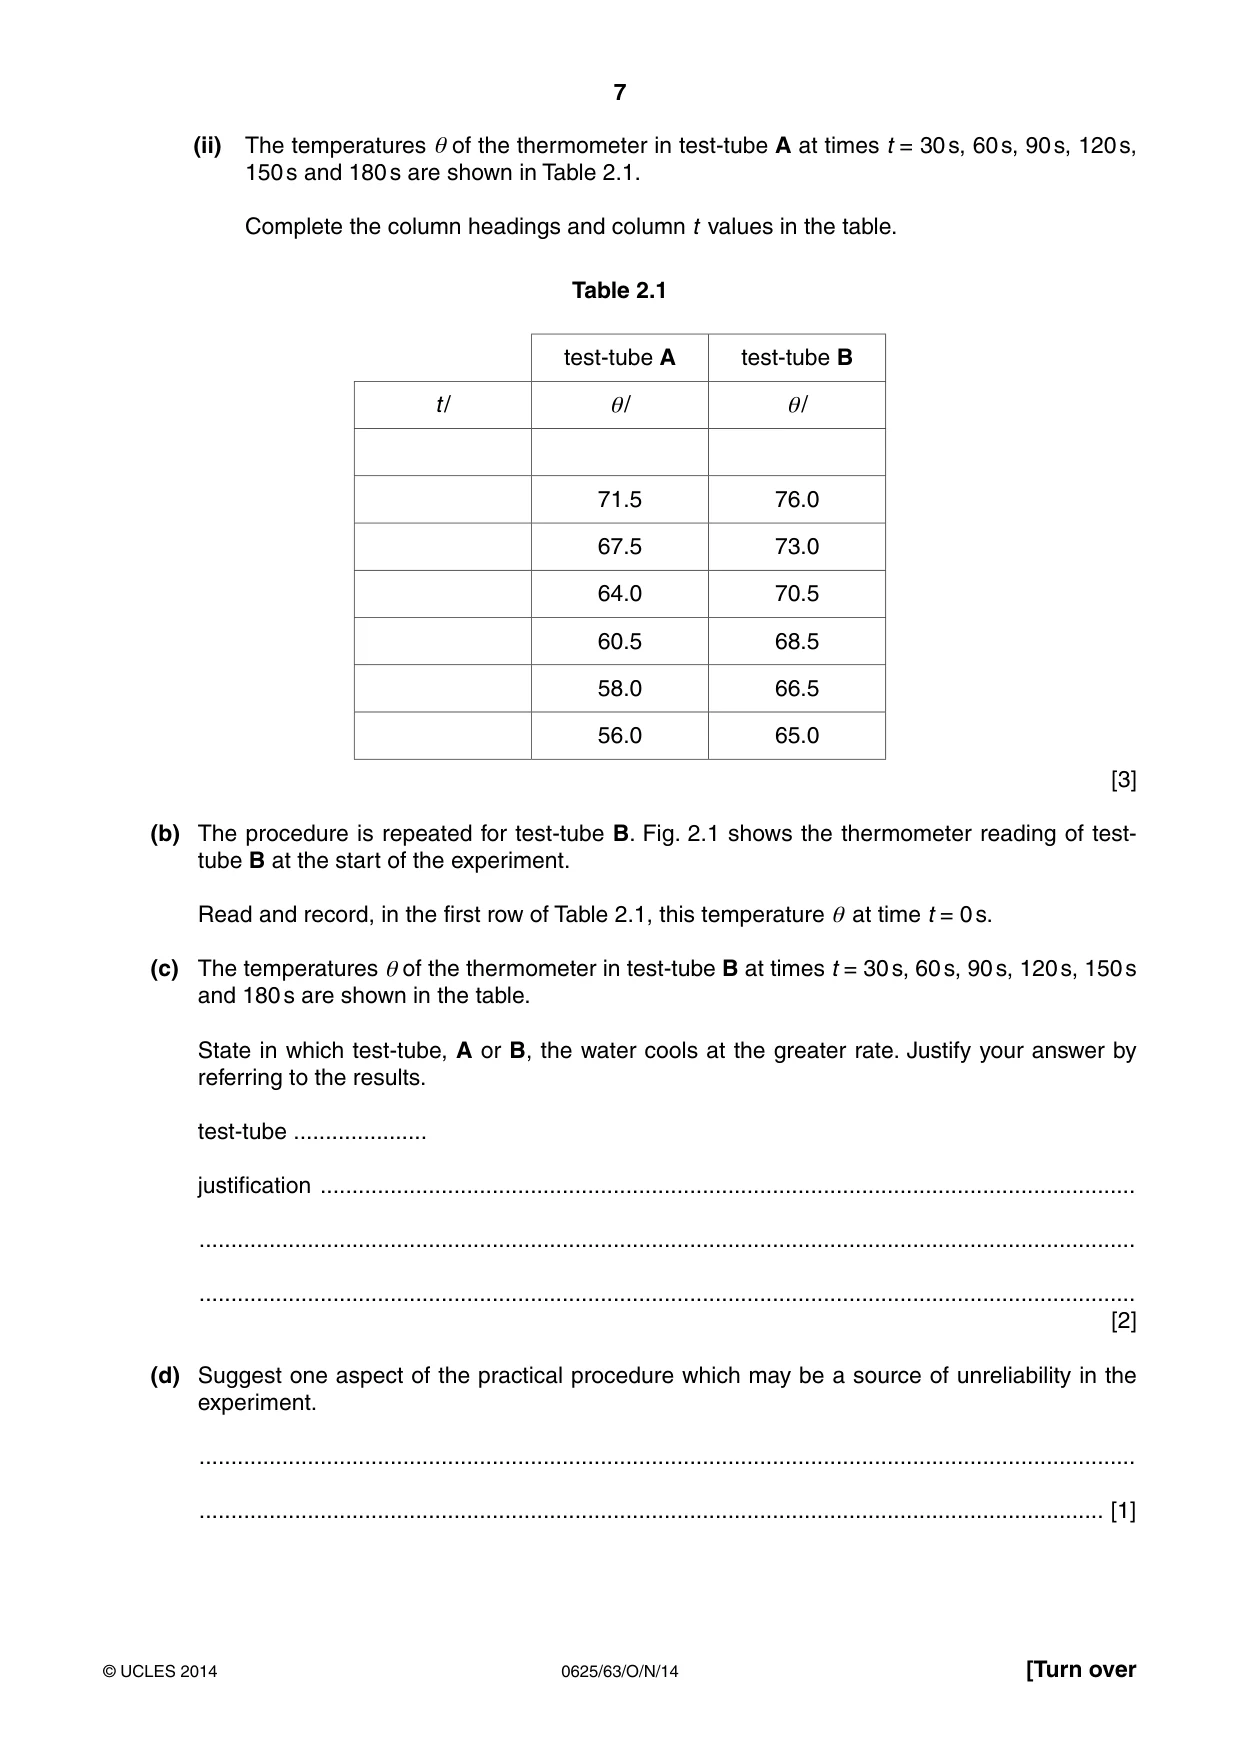
2 An IGCSE student is investigating how the surface of a container affects the rate at which water cools. She is using two test-tubes, labelled A and B, as shown in Fig. 2.1. Test-tube A has no covering. Test-tube B is covered with foil. thermometers 110 110°C °C 100 100 90 90 80 80 70 70 60 60 cork 50 50 40 40 30 30 water-level 20 20 mark 10 10 0 0 –10 –10 water water A B foil Fig. 2.1 (a) The cork and thermometer are removed from test-tube A and hot water is poured into the test-tube up to the marked level. The cork and thermometer are replaced. (i) The thermometer reading rises to the value shown in Fig. 2.1. Read and record, in the first row of Table 2.1, this temperature θ at time t = 0 s. (ii) The temperatures θ of the thermometer in test-tube A at times t = 30 s, 60 s, 90 s, 120 s, 150 s and 180 s are shown in Table 2.1. Complete the column headings and column t values in the table. Table 2.1 test-tube A test-tube B t / θ/ θ/ 71.5 76.0 67.5 73.0 64.0 70.5 60.5 68.5 58.0 66.5 56.0 65.0 [3] (b) The procedure is repeated for test-tube B. Fig. 2.1 shows the thermometer reading of test- tube B at the start of the experiment. Read and record, in the first row of Table 2.1, this temperature θ at time t = 0 s. (c) The temperatures θ of the thermometer in test-tube B at times t = 30 s, 60 s, 90 s, 120 s, 150 s and 180 s are shown in the table. State in which test-tube, A or B, the water cools at the greater rate. Justify your answer by referring to the results. test-tube ..................... justification ................................................................................................................................ ................................................................................................................................................... ................................................................................................................................................... [2] (d) Suggest one aspect of the practical procedure which may be a source of unreliability in the experiment. ................................................................................................................................................... .............................................................................................................................................. [1] (e) Another IGCSE student wants to extend the experiment in order to test the effects of other surface materials. Suggest two factors relating to the apparatus which he should keep the same in order for the tests to be fair. 1. .............................................................................................................................................. ................................................................................................................................................... 2. .............................................................................................................................................. ................................................................................................................................................... [2] [Total: 8]
Mark scheme: 2 (a) θ for A 76 (°C) and for B 79 (°C) [1] (b) units all correct [1] t values correct 0, 30, 60, 90, 120, 150, 180 [1] (c) statement matching temperature changes with justification referring to results and involving correct comparative change in temperature [1] justification has specific mention of temperature change in the same time owtte [1] (d) appropriate source of inaccuracy associated with procedure e.g. any one from: • water levels not the same • thermometer scales not read at 90° • initial temperatures different • not able to stir water • not waiting for temperature to stabilise initially / waiting time not long enough [1] (e) any two factors relating to apparatus from: • keep thermometer at same depth • same size/thickness/material of test-tube / same test-tube • same water levels/volume/quantity/amount of water • same thickness/surface area of surface material [2] [Total: 8]
Q3 · The IGCSE class is investigating the magnification produced by a converging lens
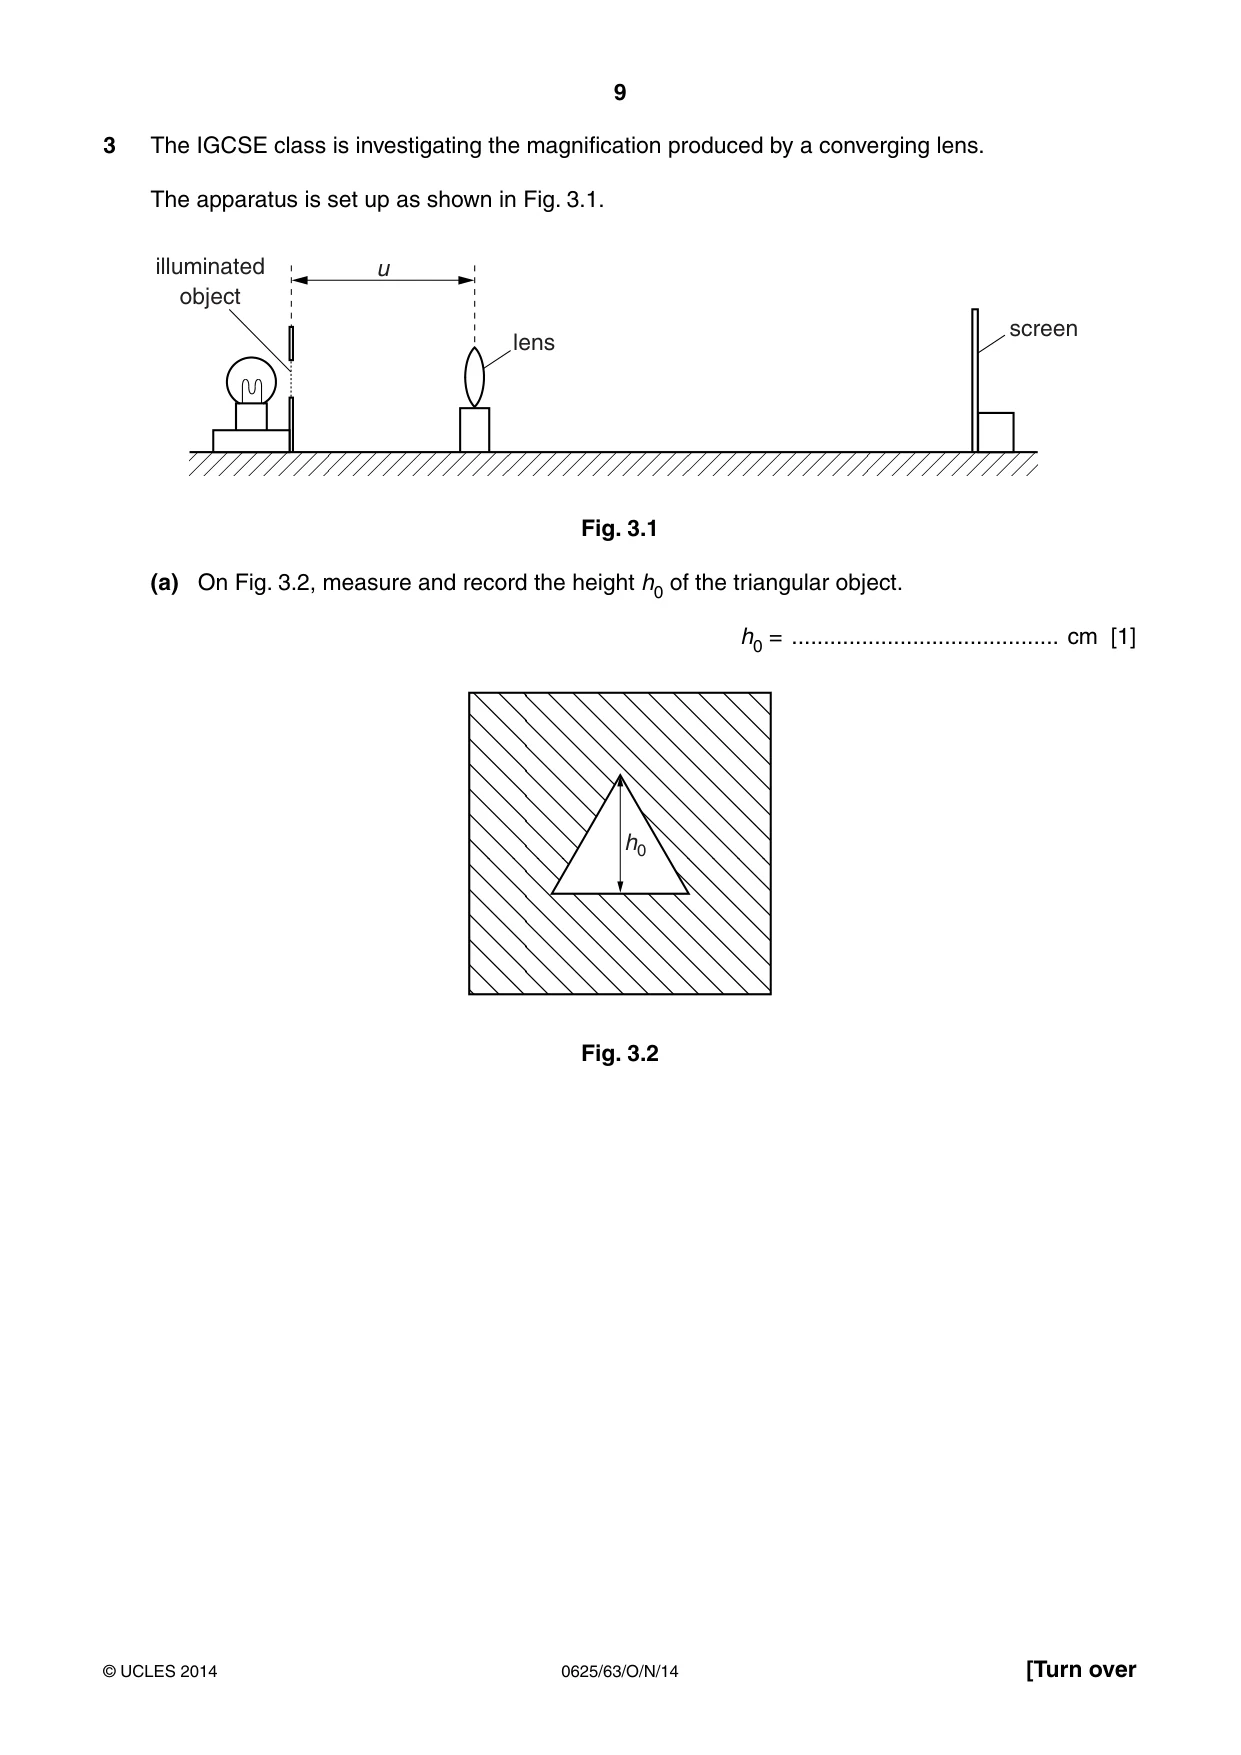
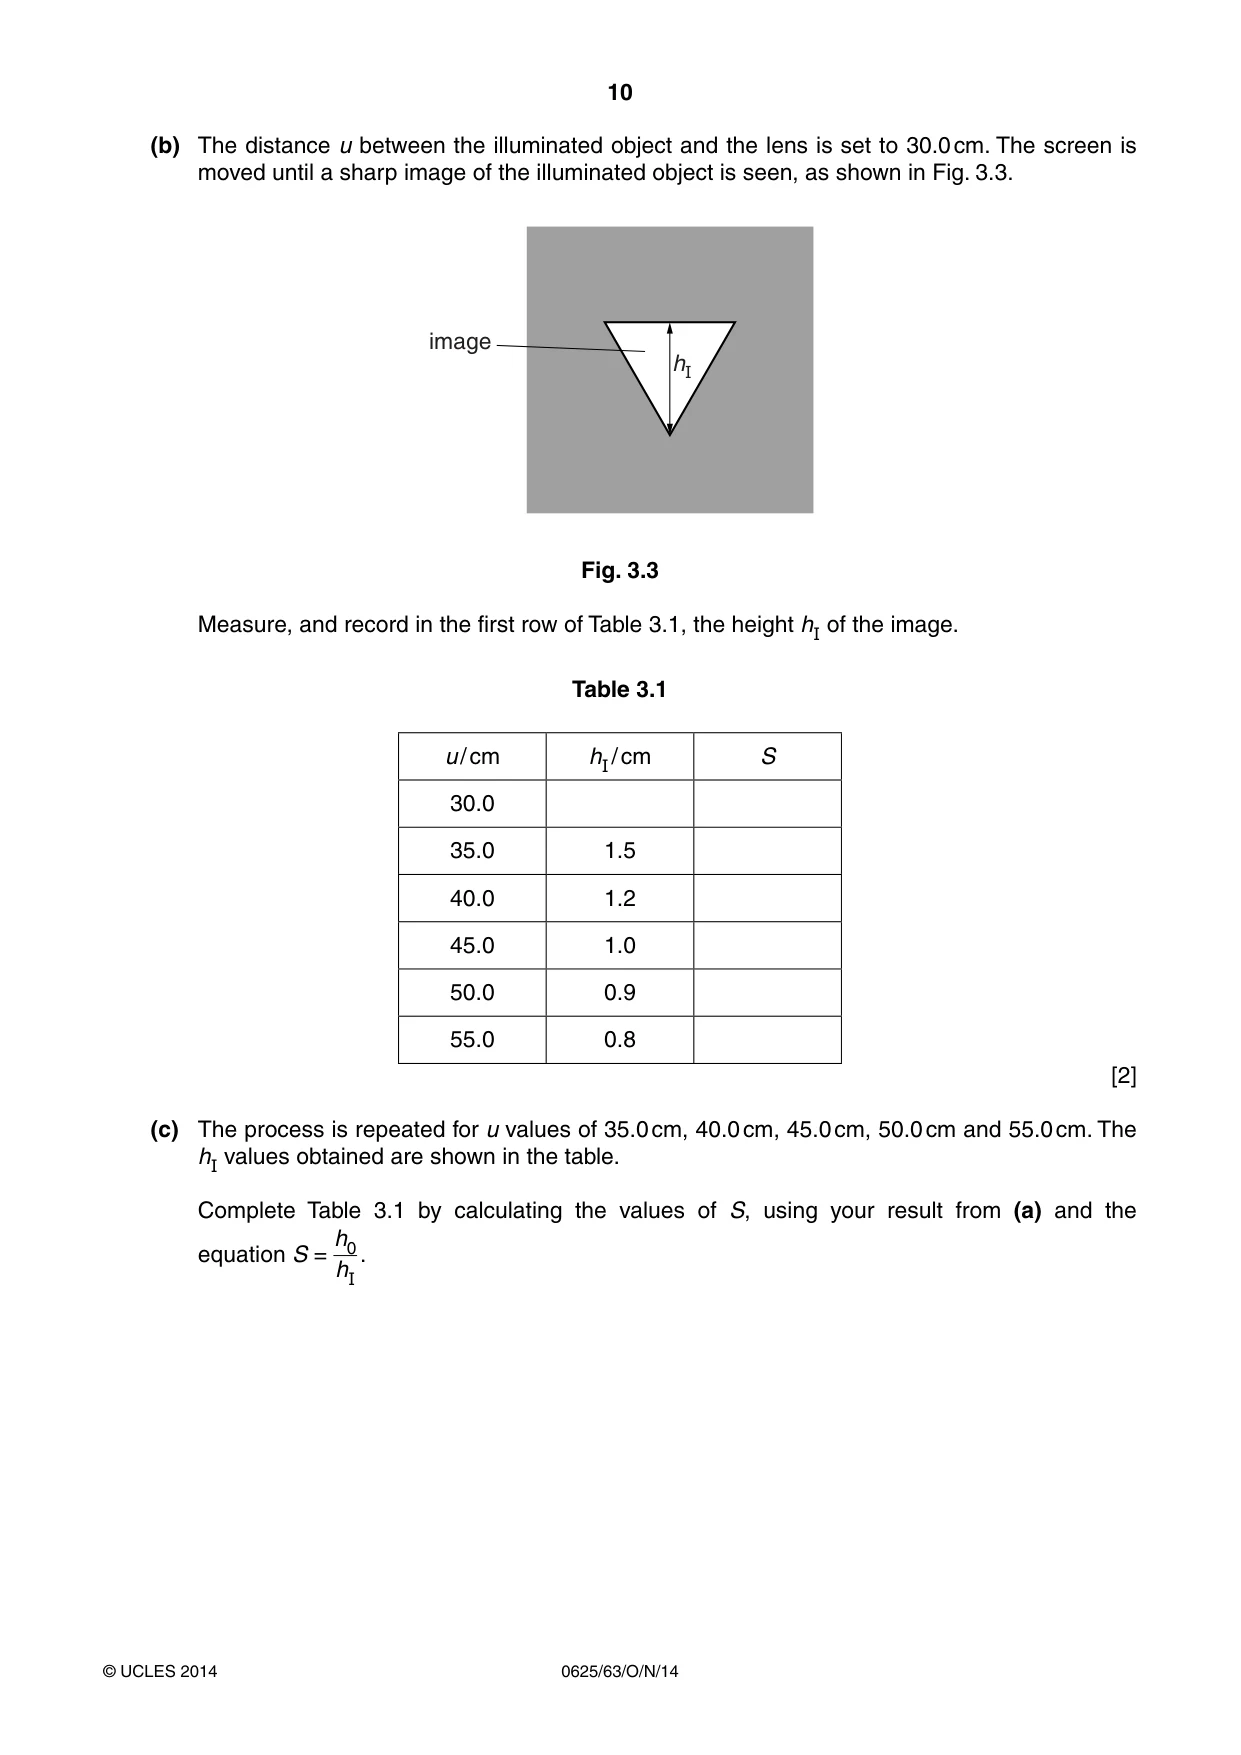
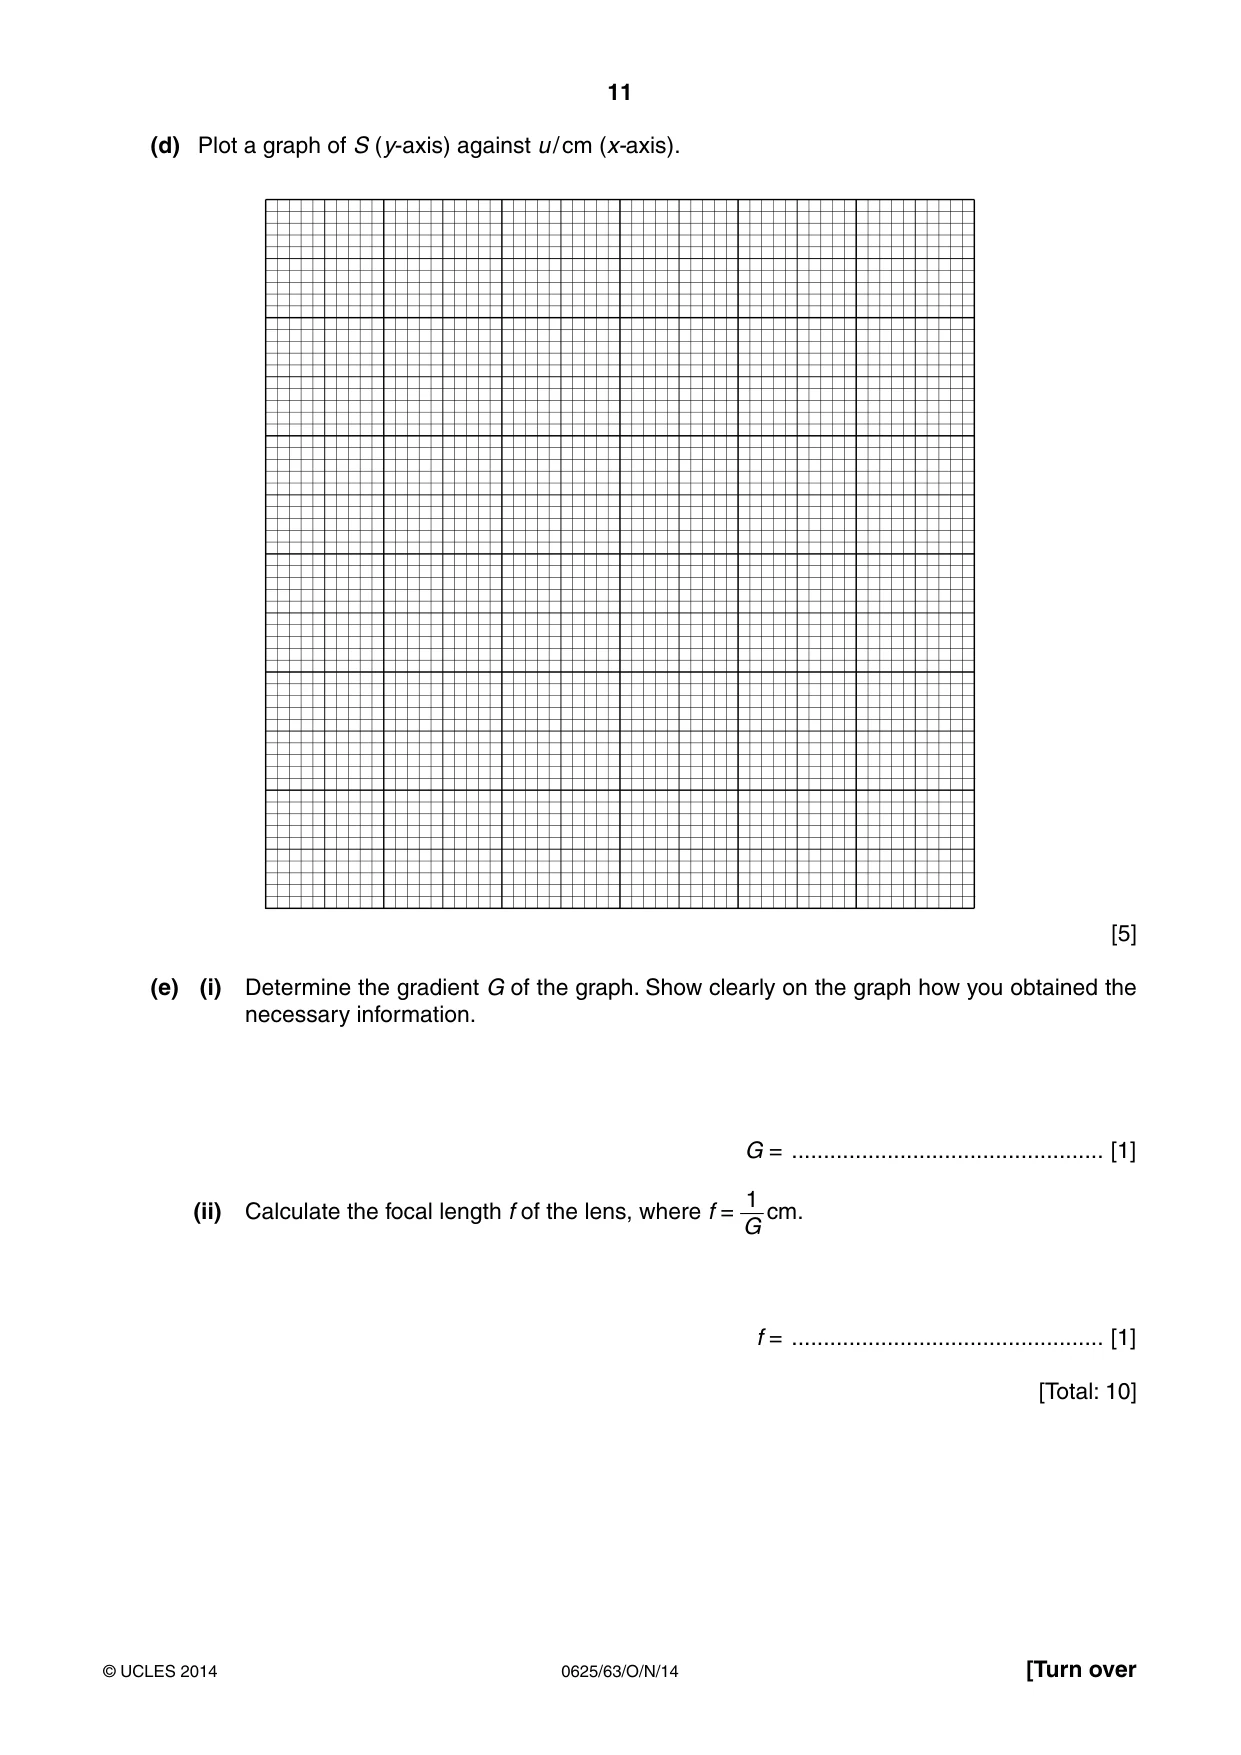
3 The IGCSE class is investigating the magnification produced by a converging lens. The apparatus is set up as shown in Fig. 3.1. illuminated u object screen lens Fig. 3.1 (a) On Fig. 3.2, measure and record the height h0 of the triangular object. h0 = .......................................... cm [1] h0 Fig. 3.2 (b) The distance u between the illuminated object and the lens is set to 30.0 cm. The screen is moved until a sharp image of the illuminated object is seen, as shown in Fig. 3.3. image hI Fig. 3.3 Measure, and record in the first row of Table 3.1, the height hI of the image. Table 3.1 u / cm hI / cm S 30.0 35.0 1.5 40.0 1.2 45.0 1.0 50.0 0.9 55.0 0.8 [2] (c) The process is repeated for u values of 35.0 cm, 40.0 cm, 45.0 cm, 50.0 cm and 55.0 cm. The hI values obtained are shown in the table. Complete Table 3.1 by calculating the values of S, using your result from (a) and the h0 equation S = . hI (d) Plot a graph of S (y-axis) against u / cm (x-axis). [5] (e) (i) Determine the gradient G of the graph. Show clearly on the graph how you obtained the necessary information. G = ................................................. [1] 1 (ii) Calculate the focal length f of the lens, where f = cm. G f = ................................................. [1] [Total: 10]
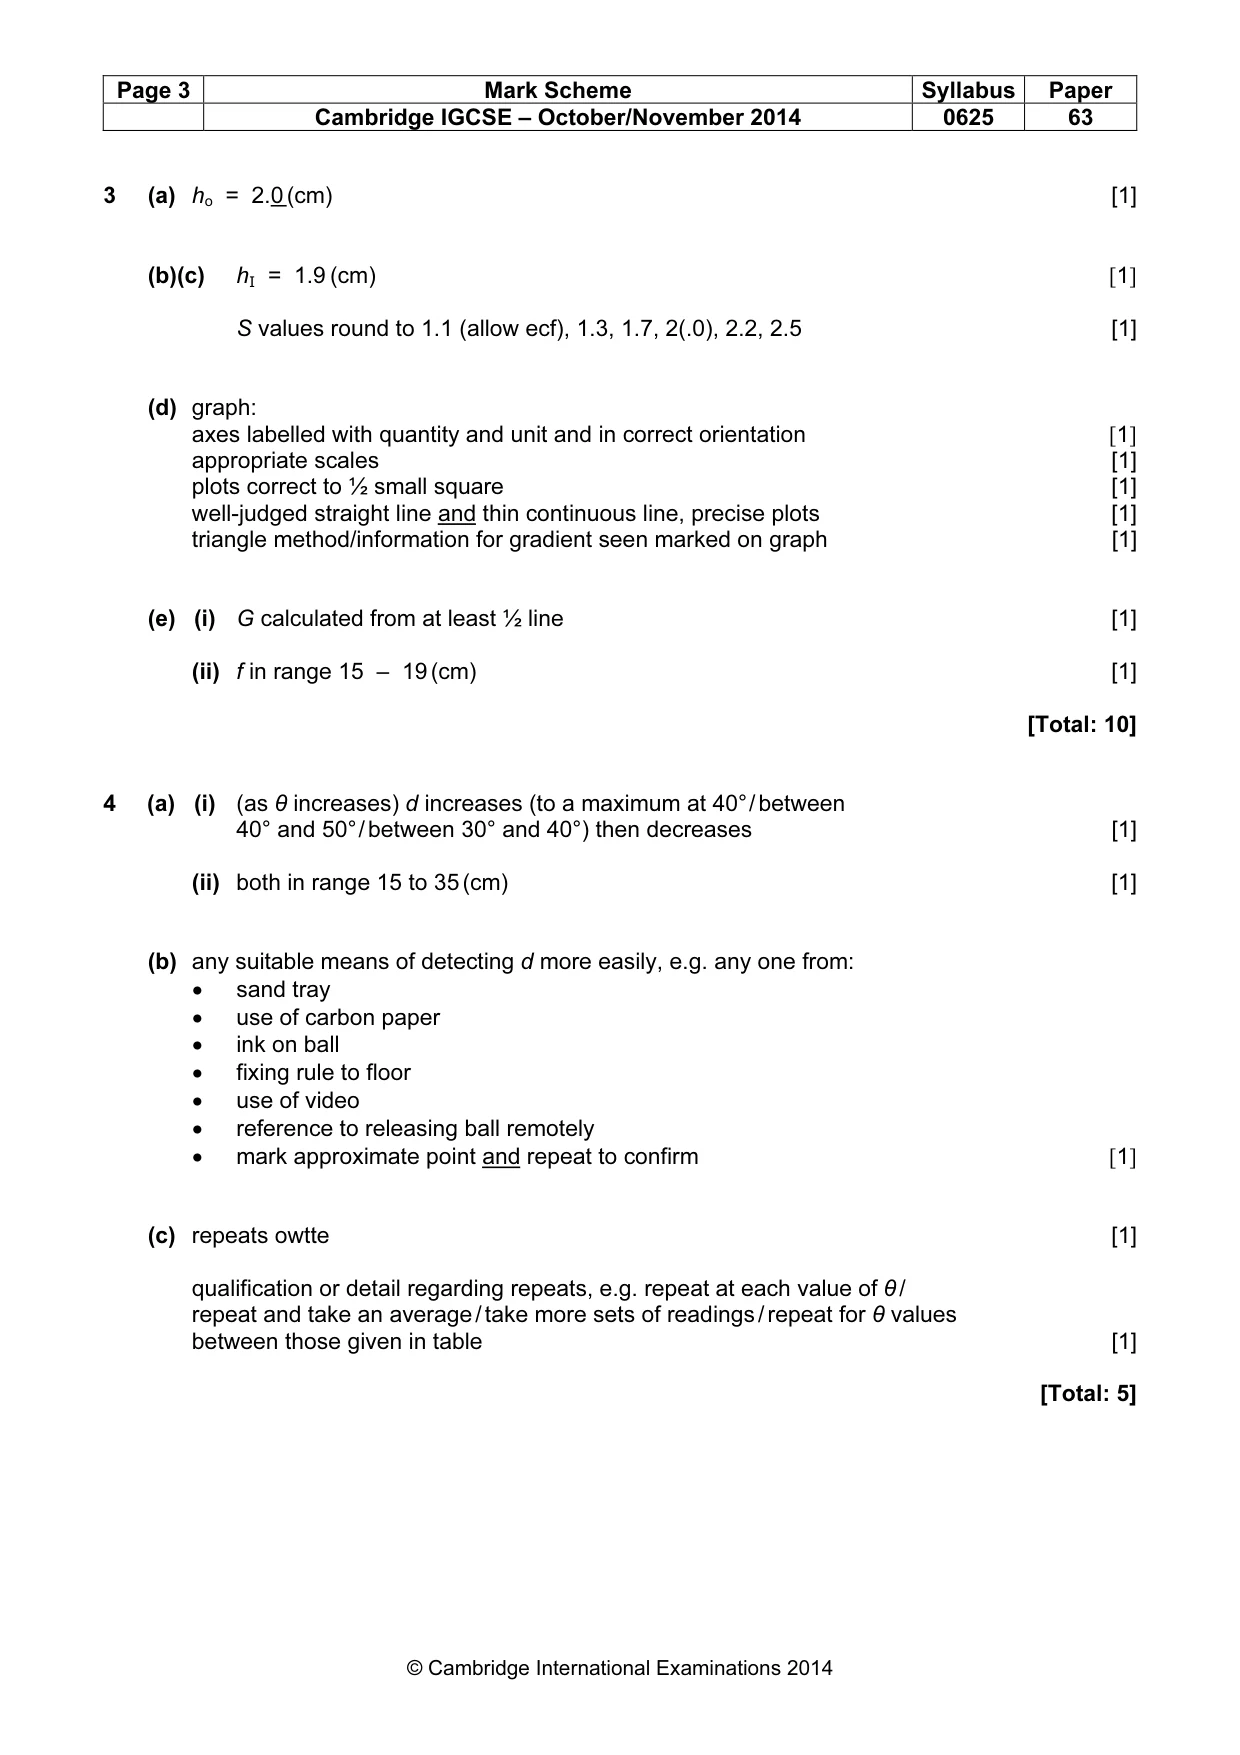
Mark scheme: 3 (a) ho = 2.0 (cm) [1] (b)(c) hI = 1.9 (cm) [1] S values round to 1.1 (allow ecf), 1.3, 1.7, 2(.0), 2.2, 2.5 [1] (d) graph: axes labelled with quantity and unit and in correct orientation [1] appropriate scales [1] plots correct to ½ small square [1] well-judged straight line and thin continuous line, precise plots [1] triangle method/information for gradient seen marked on graph [1] (e) (i) G calculated from at least ½ line [1] (ii) f in range 15 – 19 (cm) [1] [Total: 10]
More questions on Physical quantities and measurement techniques
Q4 · An IGCSE student is investigating the motion of a ball down a slope
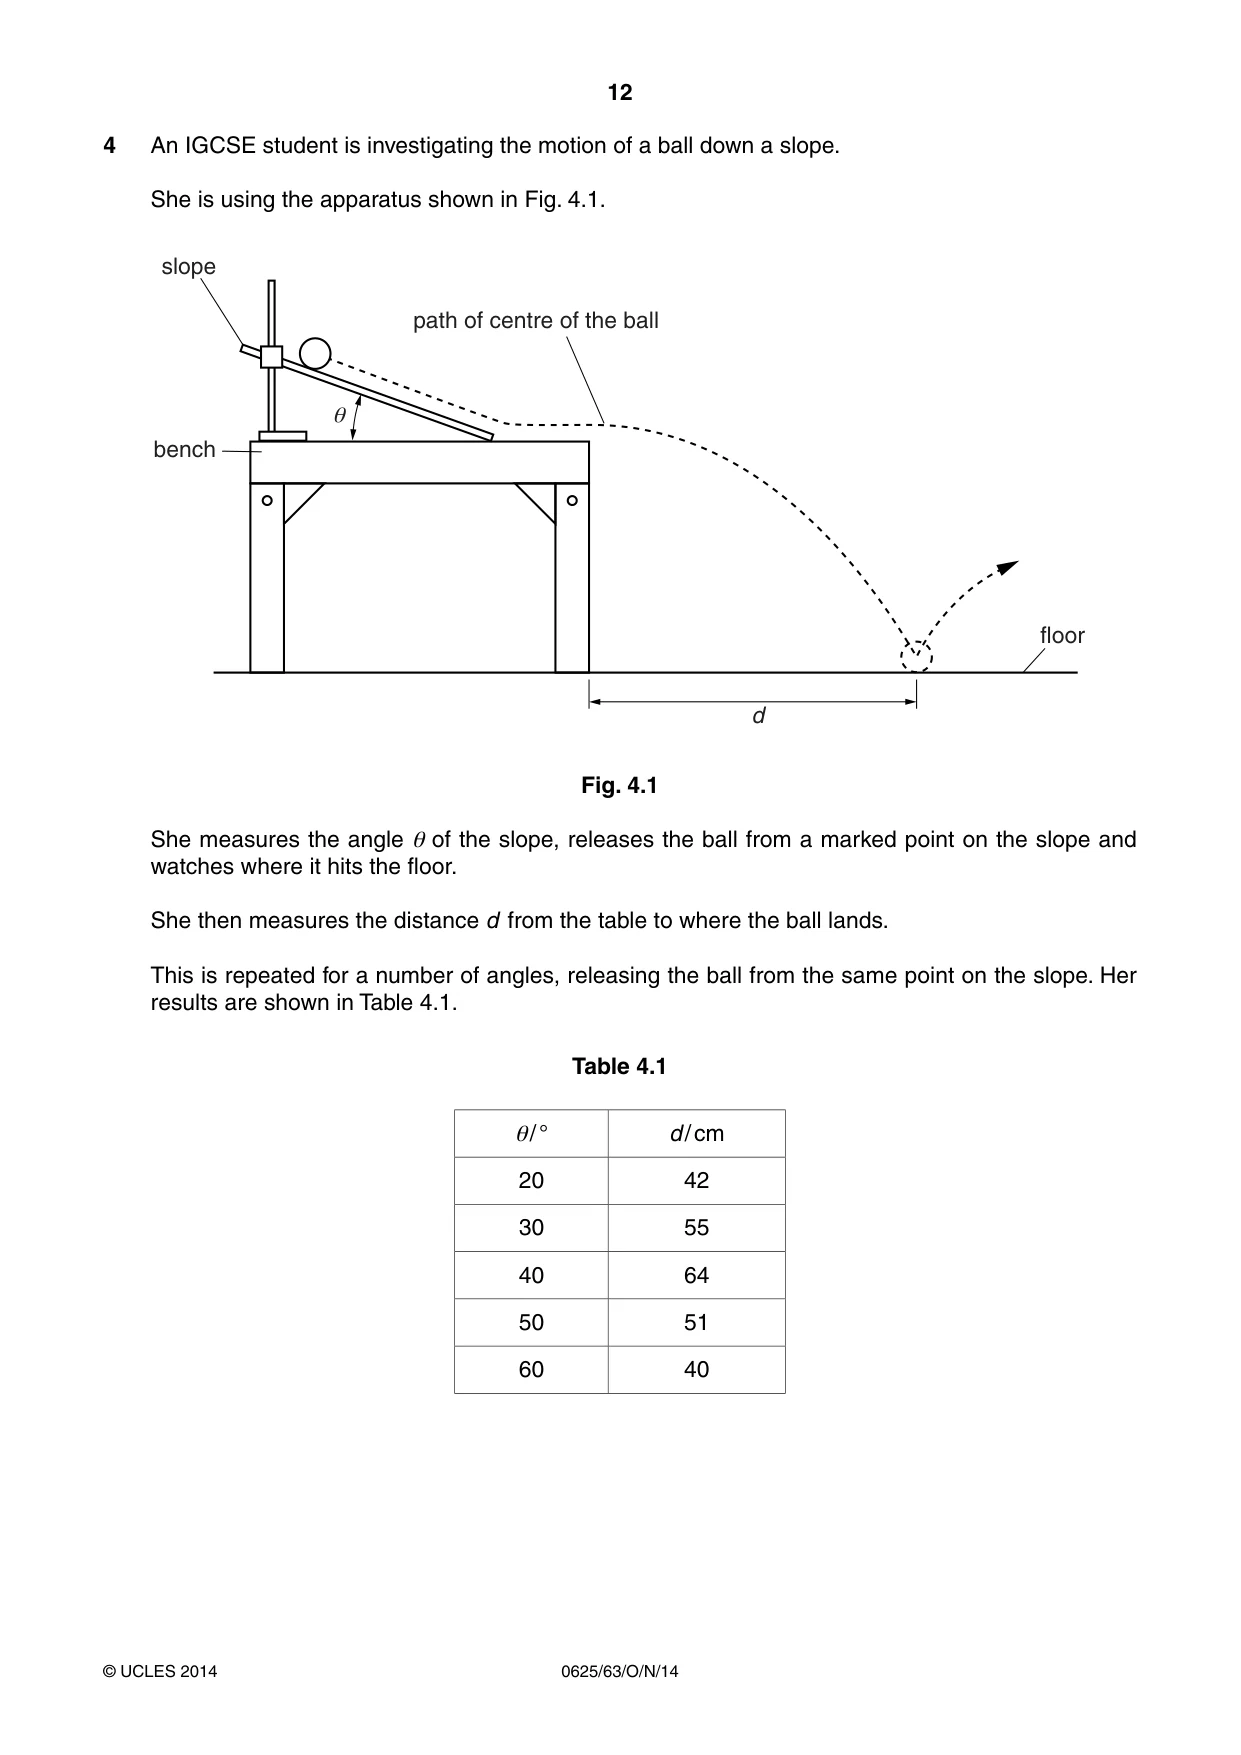
4 An IGCSE student is investigating the motion of a ball down a slope. She is using the apparatus shown in Fig. 4.1. slope path of centre of the ball e bench floor d Fig. 4.1 She measures the angle θ of the slope, releases the ball from a marked point on the slope and watches where it hits the floor. She then measures the distance d from the table to where the ball lands. This is repeated for a number of angles, releasing the ball from the same point on the slope. Her results are shown in Table 4.1. Table 4.1 θ/ ° d / cm 20 42 30 55 40 64 50 51 60 40 (a) (i) Describe the pattern in the values of d as θ is increased. ........................................................................................................................................... ........................................................................................................................................... ...................................................................................................................................... [1] (ii) From the pattern of results, predict what the d values may be for slope angles of 10 ° and 70 °. 10 ° ....................................................... 70 ° ....................................................... [1] (b) The student is being assessed and must carry out the experiment on her own. She says that it is difficult to release the ball carefully and then be able to see exactly where it lands. Suggest an improvement she might make to the experiment, so that she could obtain a more accurate measurement of d. ................................................................................................................................................... ................................................................................................................................................... .............................................................................................................................................. [1] (c) Suggest how she might make sure that the results of the experiment are reliable. ................................................................................................................................................... ................................................................................................................................................... .............................................................................................................................................. [2] [Total: 5]
Mark scheme: 4 (a) (i) (as θ increases) d increases (to a maximum at 40° / between 40° and 50° / between 30° and 40°) then decreases [1] (ii) both in range 15 to 35 (cm) [1] (b) any suitable means of detecting d more easily, e.g. any one from: • sand tray • use of carbon paper • ink on ball • fixing rule to floor • use of video • reference to releasing ball remotely • mark approximate point and repeat to confirm [1] (c) repeats owtte [1] qualification or detail regarding repeats, e.g. repeat at each value of θ / repeat and take an average / take more sets of readings / repeat for θ values between those given in table [1] [Total: 5]
Q5 · Some IGCSE students are finding the resistance of a lamp in two different electrical…
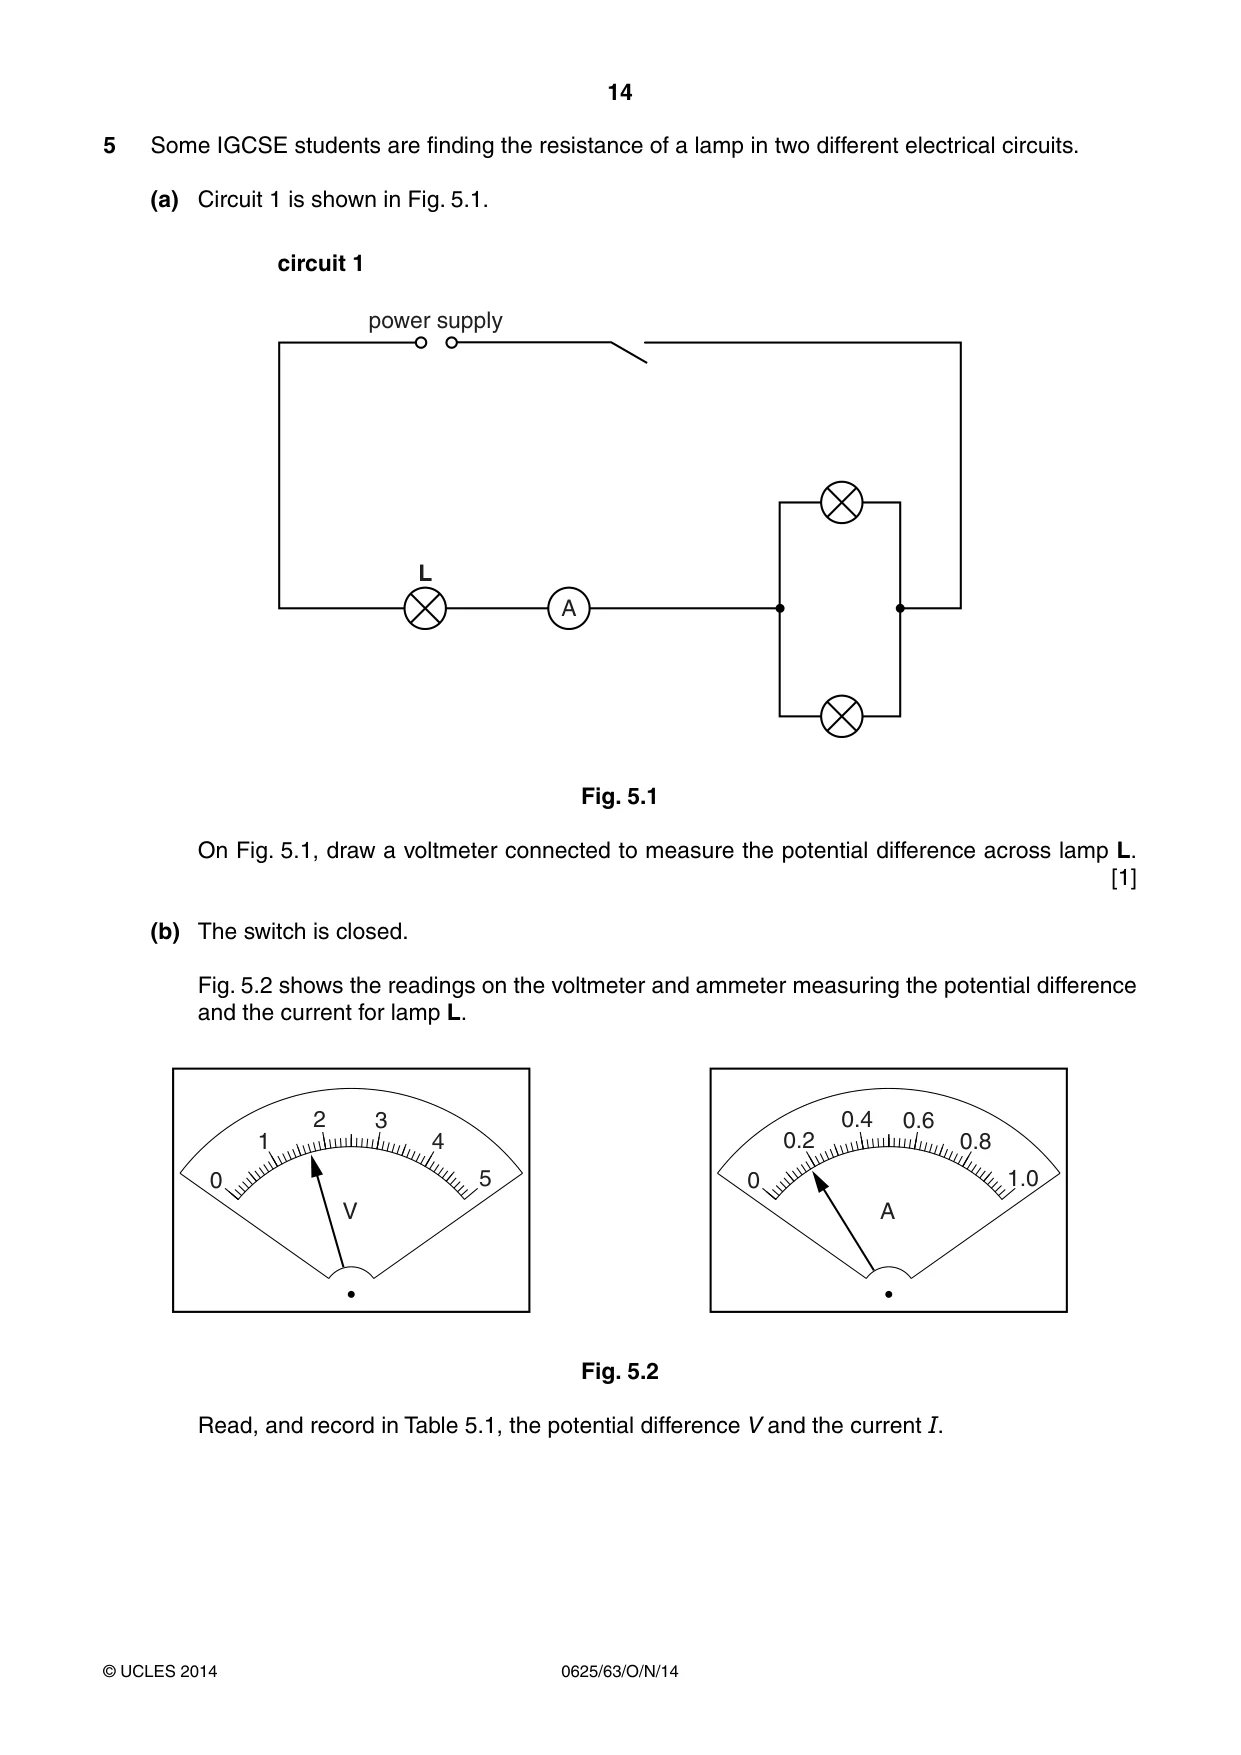
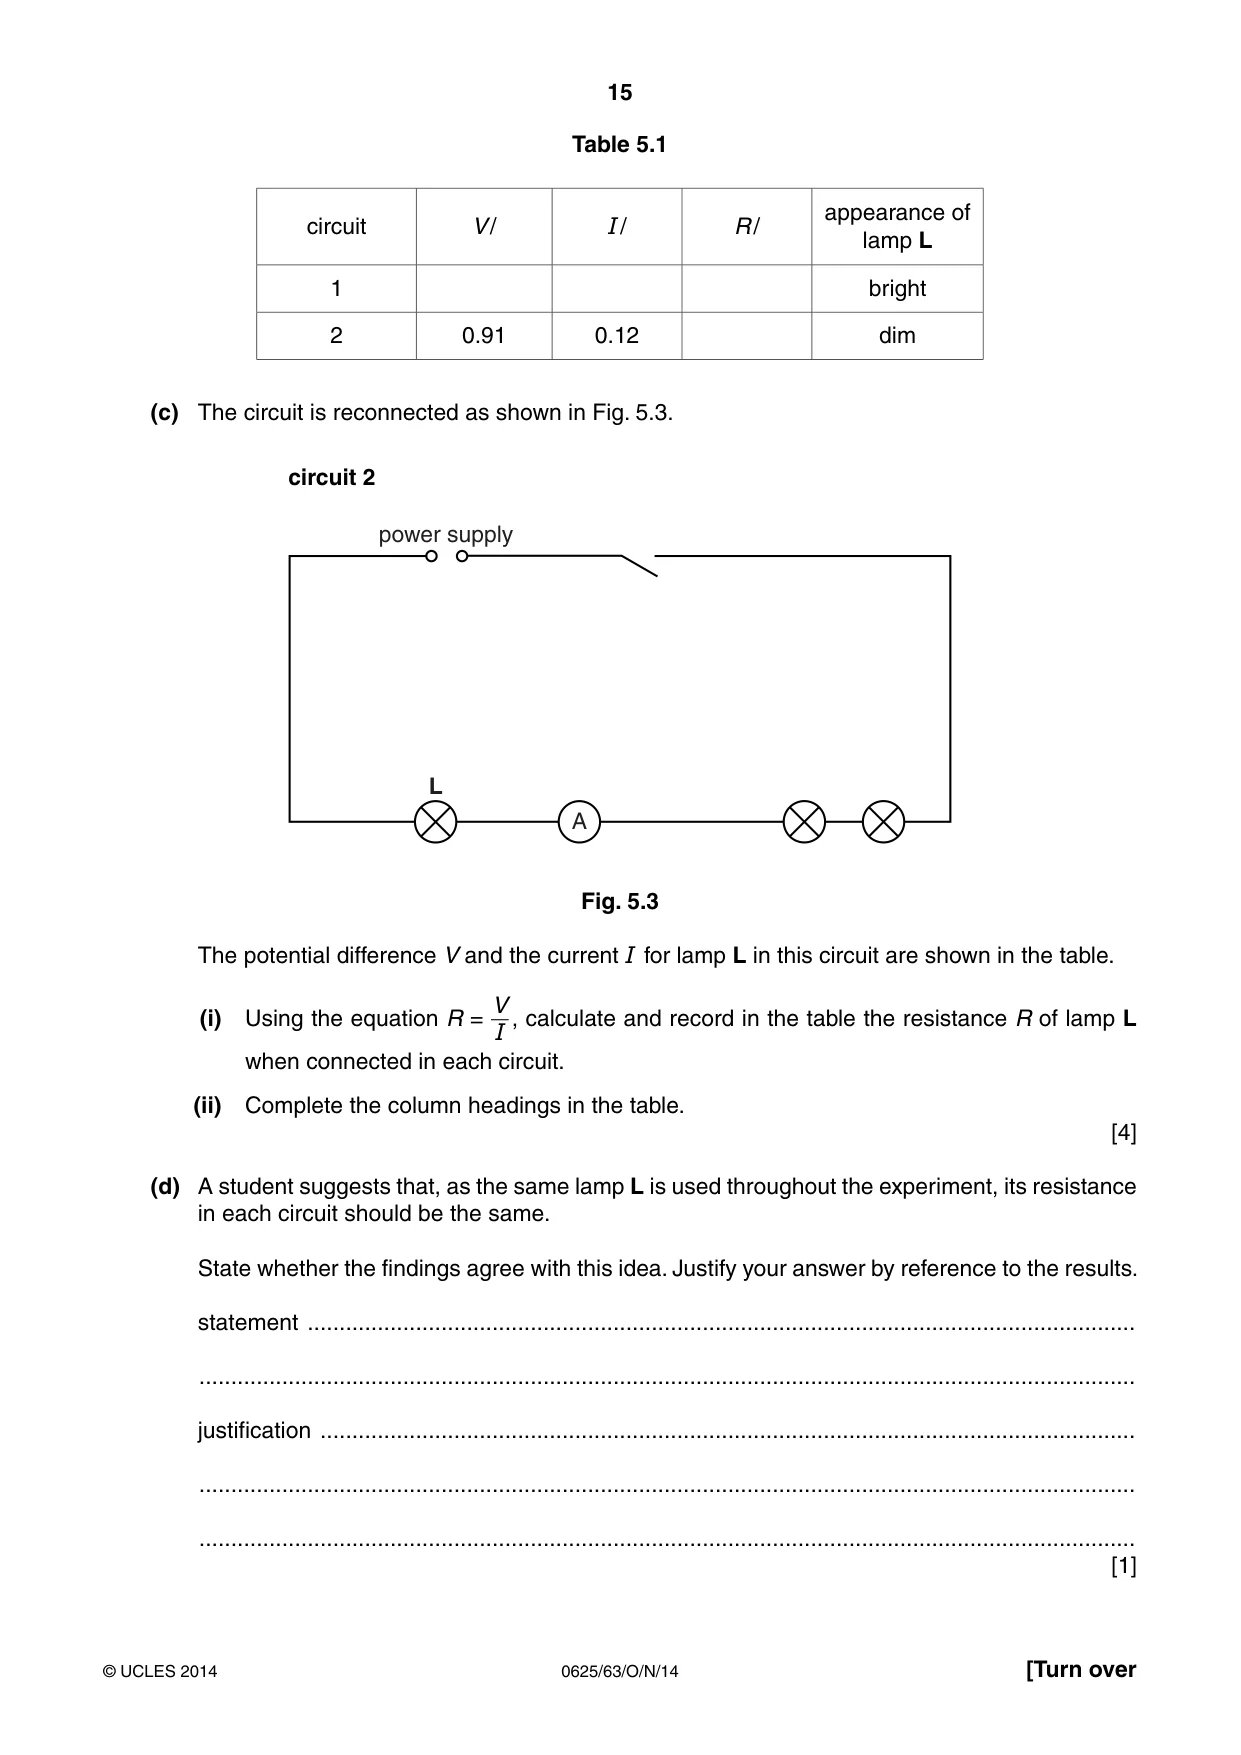
5 Some IGCSE students are finding the resistance of a lamp in two different electrical circuits. (a) Circuit 1 is shown in Fig. 5.1. circuit 1 power supply L A Fig. 5.1 On Fig. 5.1, draw a voltmeter connected to measure the potential difference across lamp L. [1] (b) The switch is closed. Fig. 5.2 shows the readings on the voltmeter and ammeter measuring the potential difference and the current for lamp L. 2 3 0.4 0.6 1 4 0.2 0.8 0 5 0 1.0 V A Fig. 5.2 Read, and record in Table 5.1, the potential difference V and the current I. Table 5.1 appearance of circuit V / I / R / lamp L 1 bright 2 0.91 0.12 dim (c) The circuit is reconnected as shown in Fig. 5.3. circuit 2 power supply L A Fig. 5.3 The potential difference V and the current I for lamp L in this circuit are shown in the table. V (i) Using the equation R = , calculate and record in the table the resistance R of lamp L I when connected in each circuit. (ii) Complete the column headings in the table. [4] (d) A student suggests that, as the same lamp L is used throughout the experiment, its resistance in each circuit should be the same. State whether the findings agree with this idea. Justify your answer by reference to the results. statement .................................................................................................................................. ................................................................................................................................................... justification ................................................................................................................................ ................................................................................................................................................... ................................................................................................................................................... [1] (e) Theory suggests that the resistance of a lamp increases when its temperature rises. Explain whether the observations in Table 5.1 support this. ................................................................................................................................................... ................................................................................................................................................... .............................................................................................................................................. [1] (f) It is possible to change the current in this type of experiment by using a variable resistor rather than rearranging the circuit. In the space below, draw a circuit with a power supply, a lamp, an ammeter and a variable resistor used for this purpose. [2] [Total: 9]
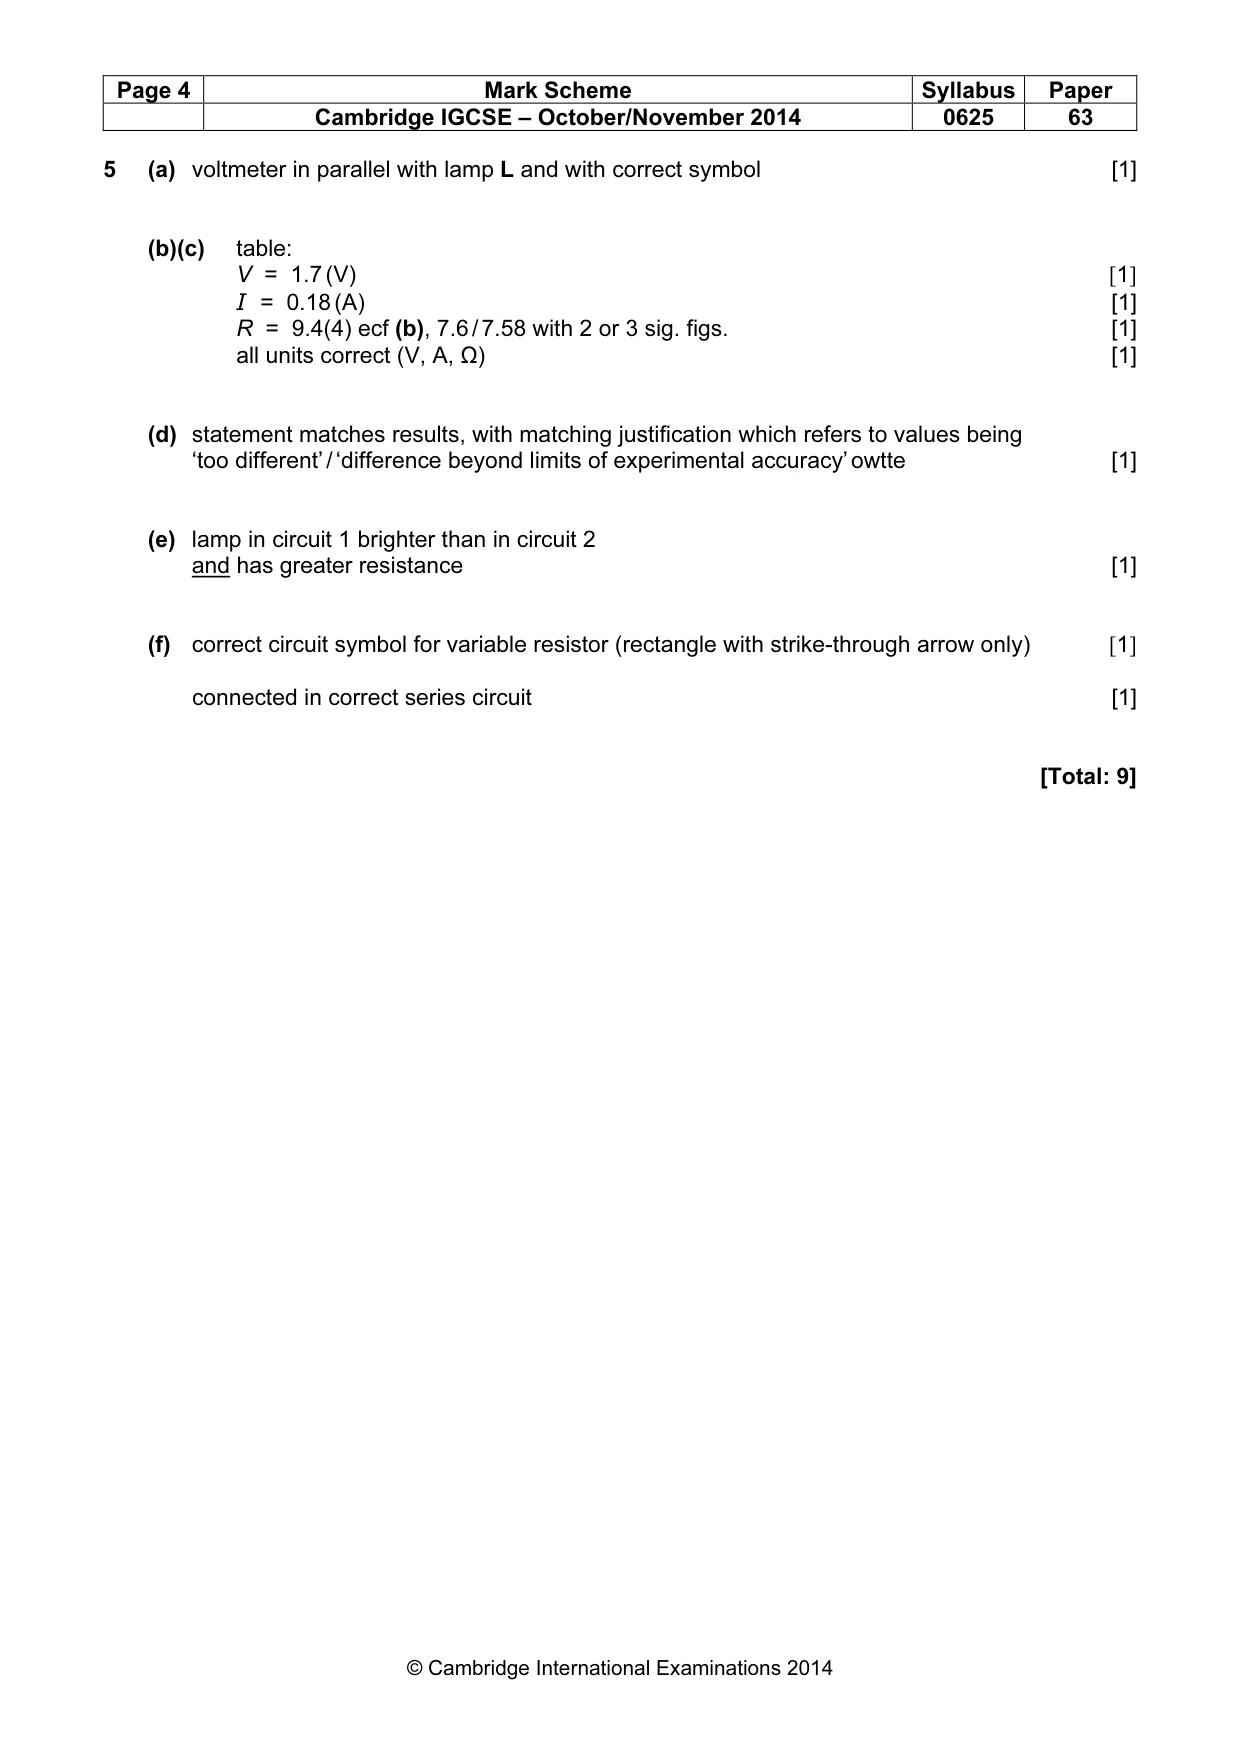
Mark scheme: 5 (a) voltmeter in parallel with lamp L and with correct symbol [1] (b)(c) table: V = 1.7 (V) [1] I = 0.18 (A) [1] R = 9.4(4) ecf (b), 7.6 / 7.58 with 2 or 3 sig. figs. [1] all units correct (V, A, Ω) [1] (d) statement matches results, with matching justification which refers to values being ‘too different’ / ‘difference beyond limits of experimental accuracy’ owtte [1] (e) lamp in circuit 1 brighter than in circuit 2 and has greater resistance [1] (f) correct circuit symbol for variable resistor (rectangle with strike-through arrow only) [1] connected in correct series circuit [1] [Total: 9]
What was in this paper
The subtopics covered by these 5 questions, and how many questions each got. Open one in a new tab to see every Cambridge question on it.
What you needed in this session
Cambridge’s own grade thresholds for 2014 Oct/Nov, Paper 6 · Variant 3. A higher threshold means an easier paper — the bar moves with how the cohort did.