Cambridge IGCSE Physics 0625 — 2014 Oct/Nov Paper 6 · Variant 1
0625/61/O/N/14 · 5 questions · 40 marks · ≈45 min
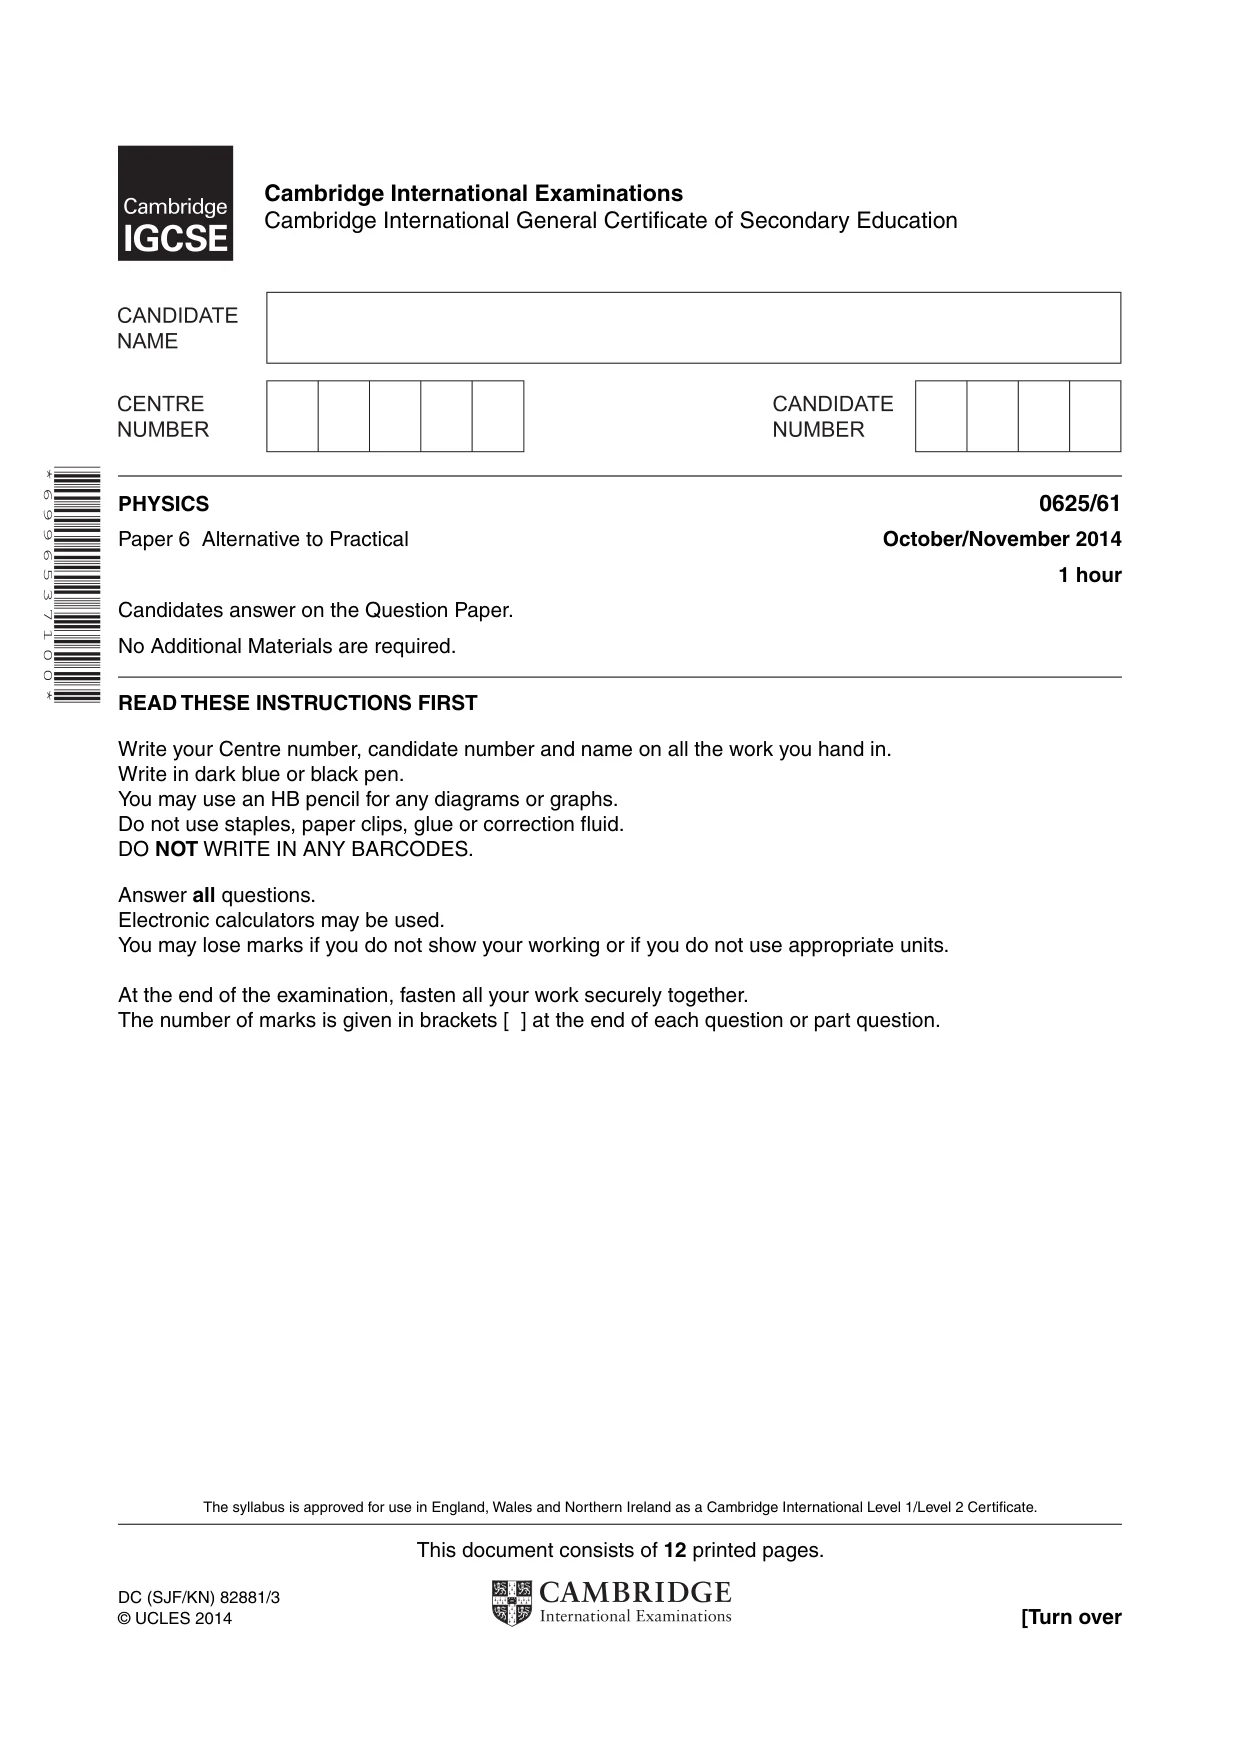
The question paper and its mark scheme, free to read here and free to download. This is Cambridge’s own paper, exactly as it was sat.
Question paper12 pages
Mark scheme5 pages
Answers below. Sit the paper first if you are practising.
Questions as text
Q1 · The IGCSE class is investigating the reflection of light by a plane mirror
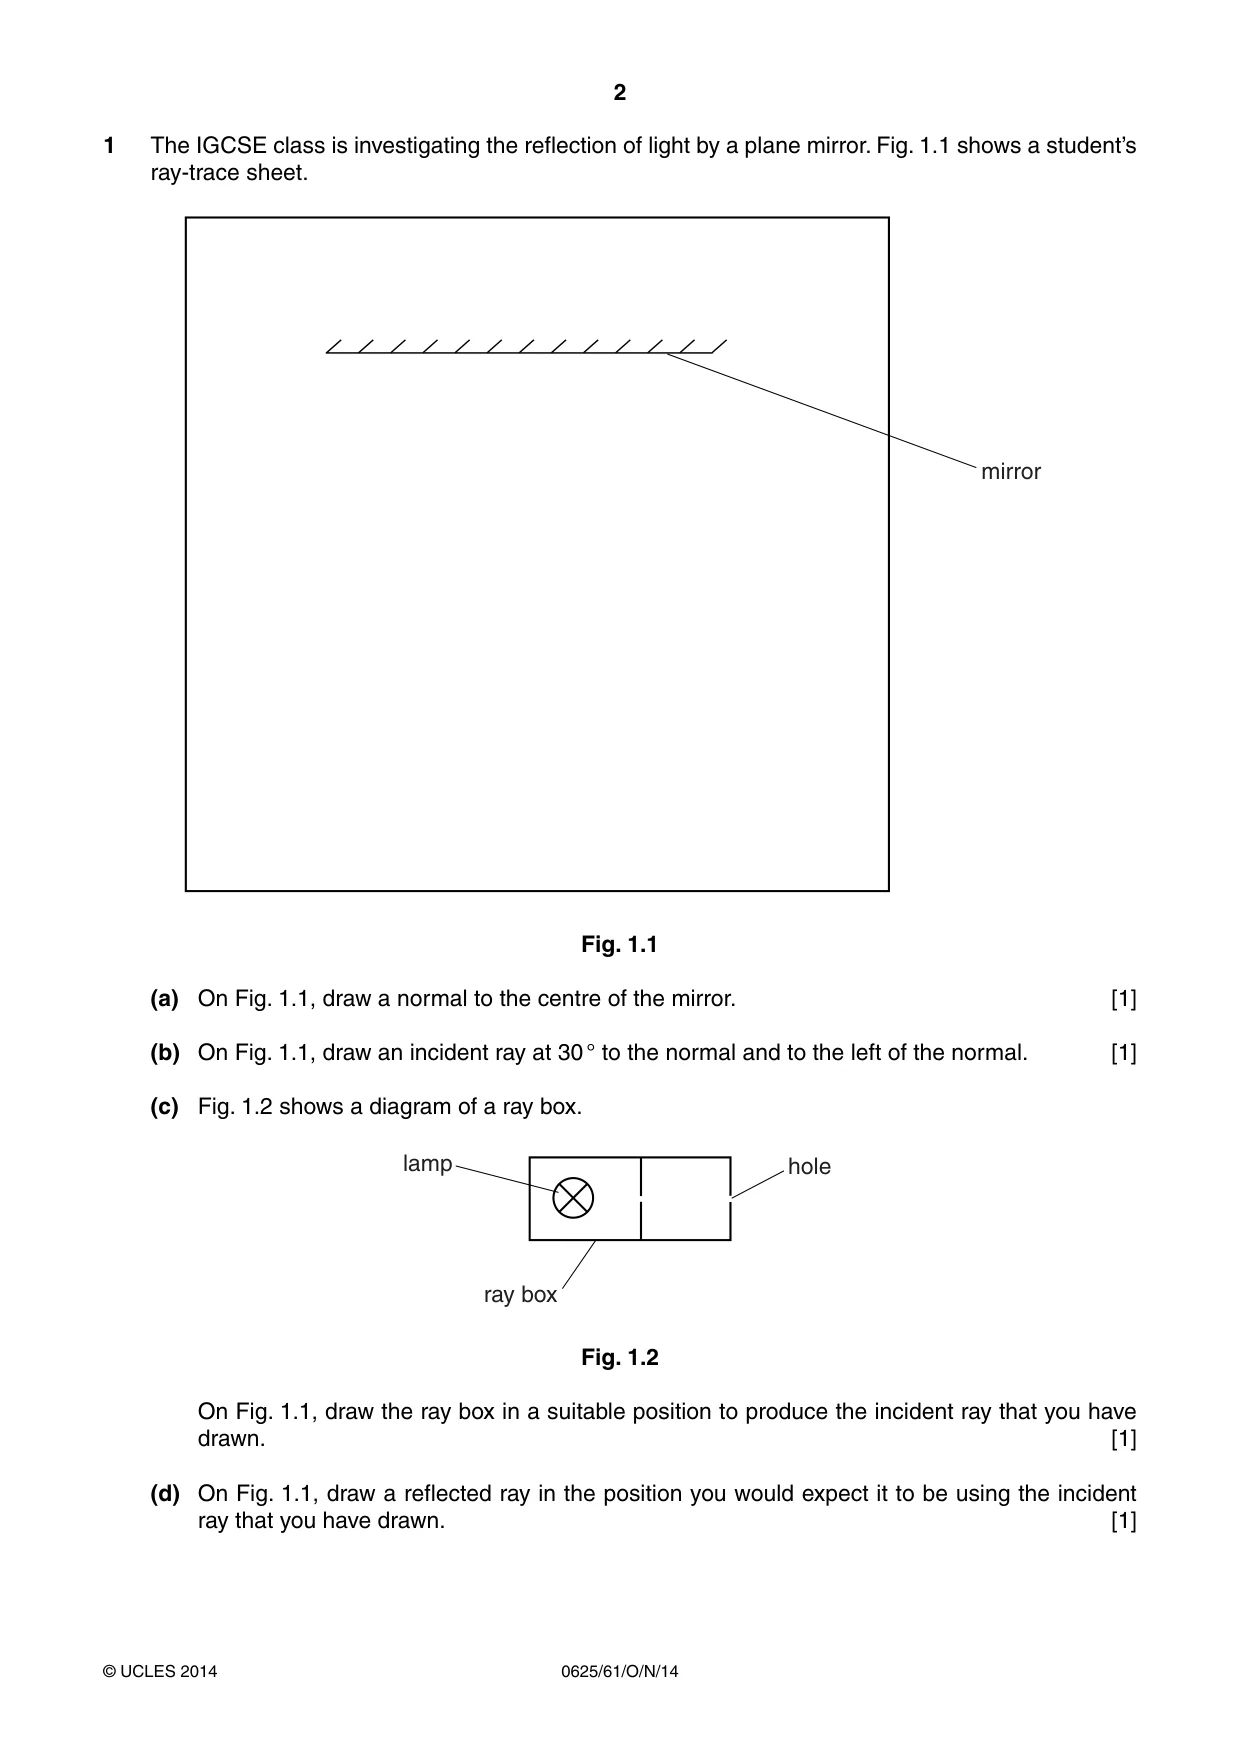
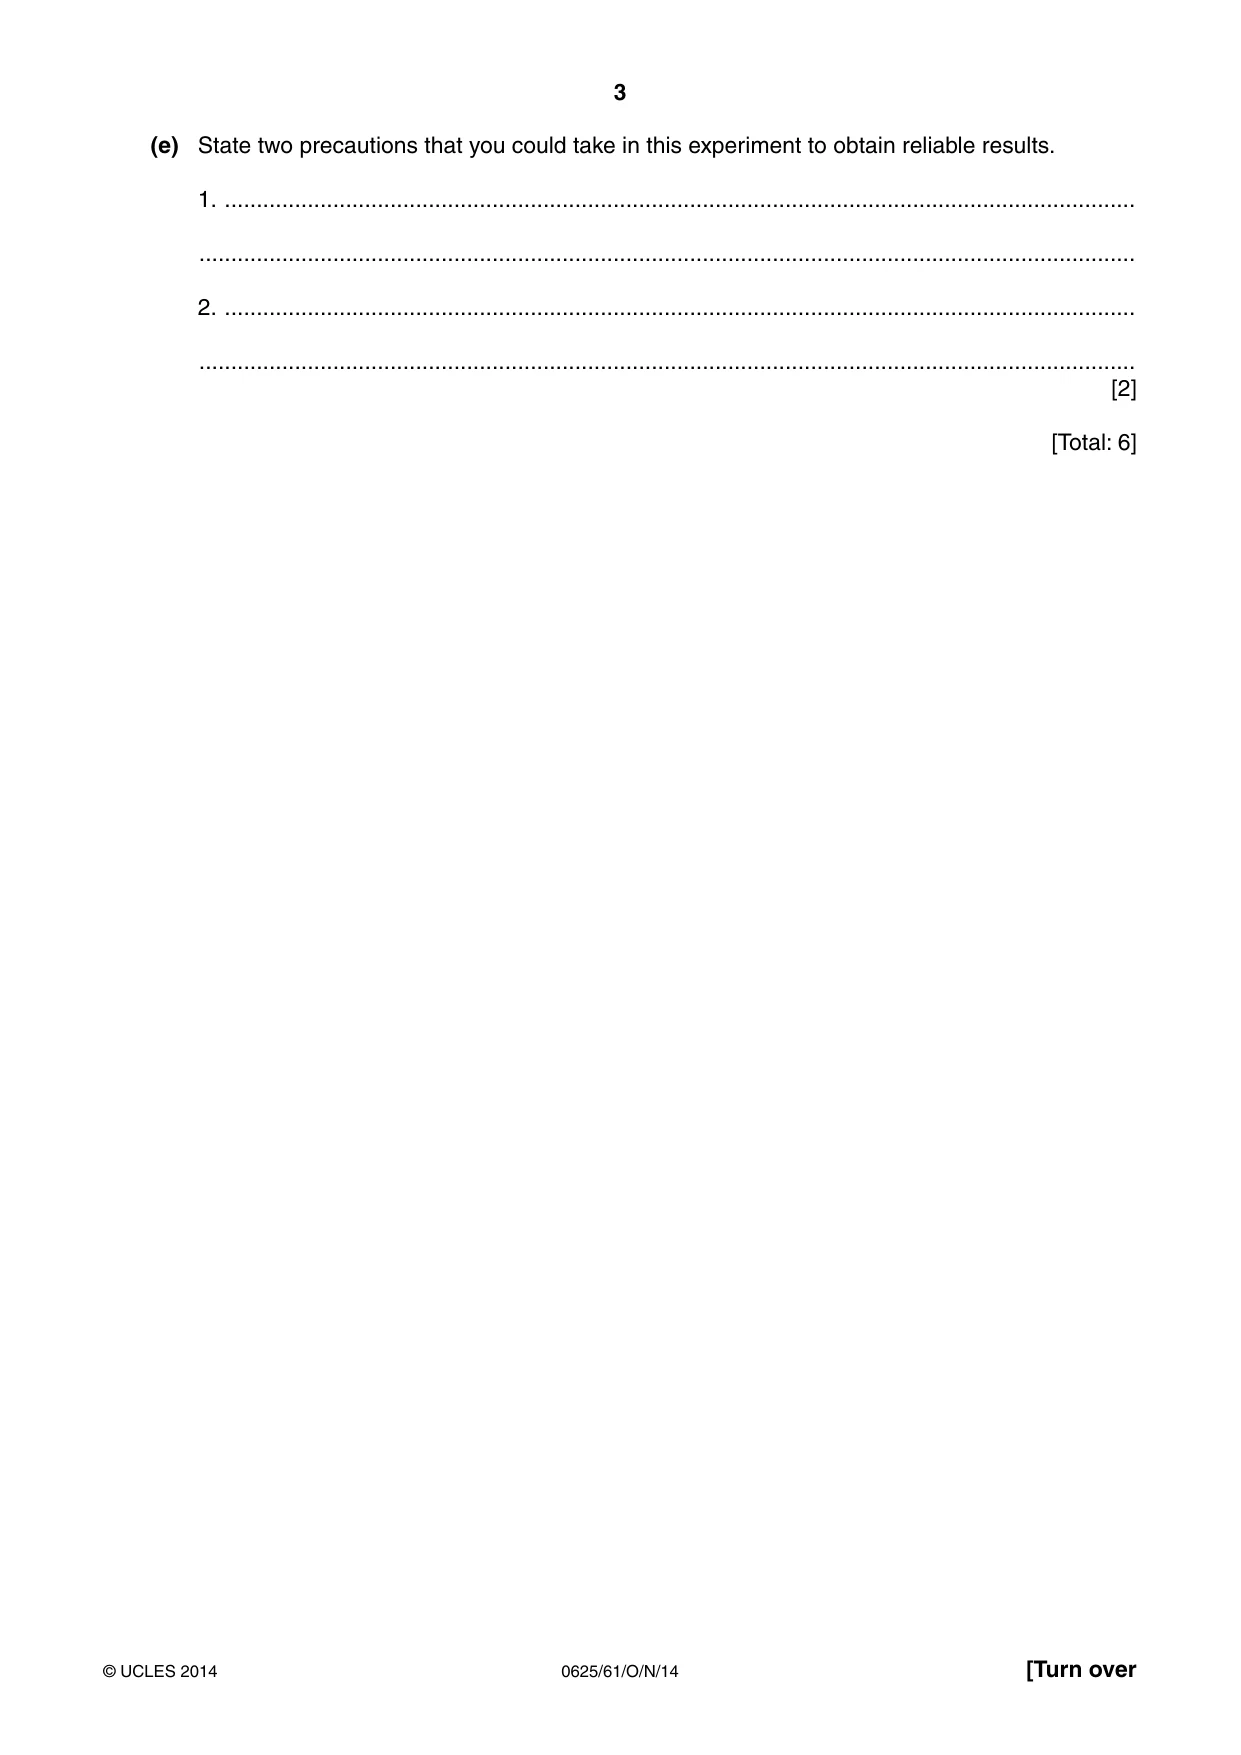
1 The IGCSE class is investigating the reflection of light by a plane mirror. Fig. 1.1 shows a student’s ray-trace sheet. mirror Fig. 1.1 (a) On Fig. 1.1, draw a normal to the centre of the mirror. [1] (b) On Fig. 1.1, draw an incident ray at 30 ° to the normal and to the left of the normal. [1] (c) Fig. 1.2 shows a diagram of a ray box. lamp hole ray box Fig. 1.2 On Fig. 1.1, draw the ray box in a suitable position to produce the incident ray that you have drawn. [1] (d) On Fig. 1.1, draw a reflected ray in the position you would expect it to be using the incident ray that you have drawn. [1] (e) State two precautions that you could take in this experiment to obtain reliable results. 1. ............................................................................................................................................... ................................................................................................................................................... 2. ............................................................................................................................................... ................................................................................................................................................... [2] [Total: 6]
Mark scheme: 1 (a) normal at 90°, straight, at centre [1] (b) incident ray at 30° on left of normal, straight [1] (c) ray box near beginning of incident ray and pointing along it [1] (d) reflected ray at angle of reflection approximately 30° [1] (e) any two from: darkened room / brighter ray box owtte mark rays at centre / edge of beam use sharp pencil thin ray / small slit in ray box perpendicular viewing of protractor [2] [Total: 6]
Q2 · The IGCSE class is investigating the cooling of hot water under different conditions
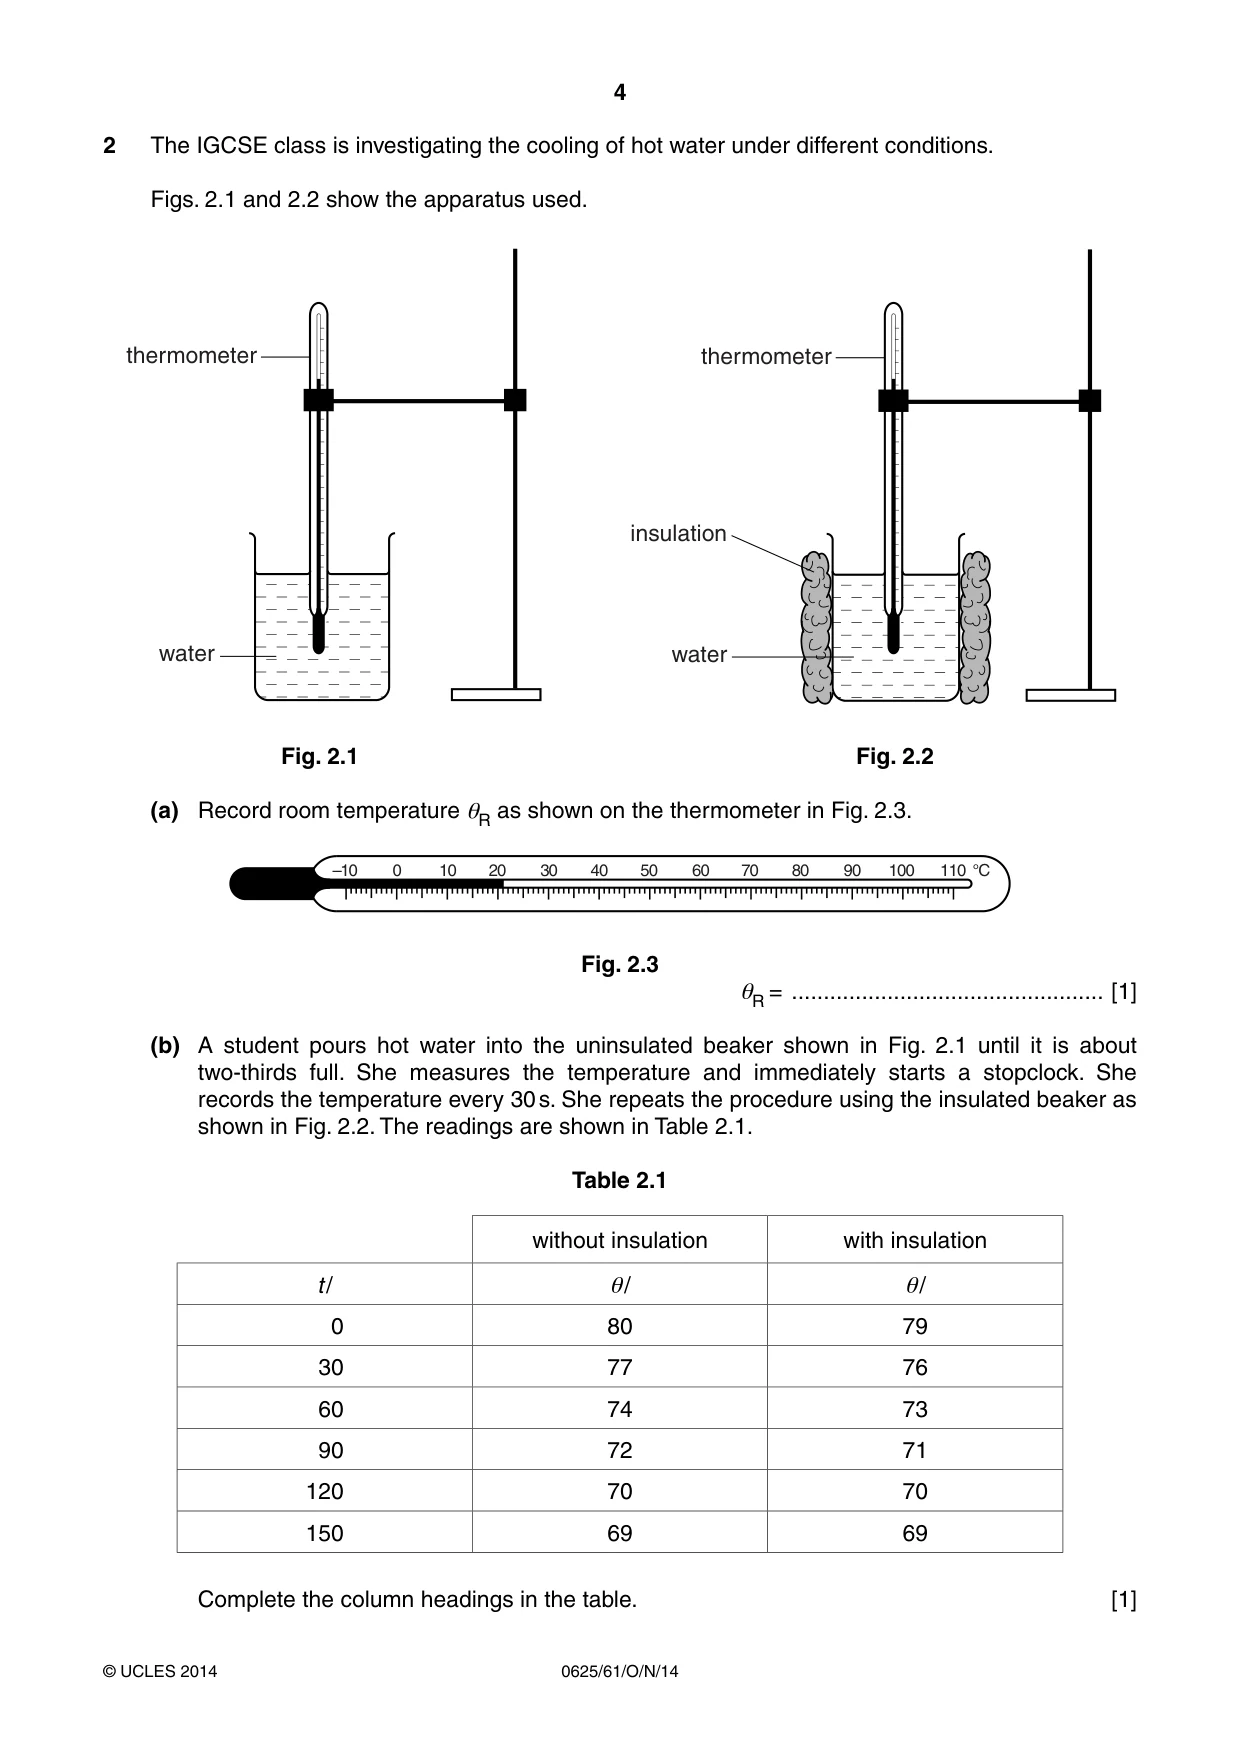
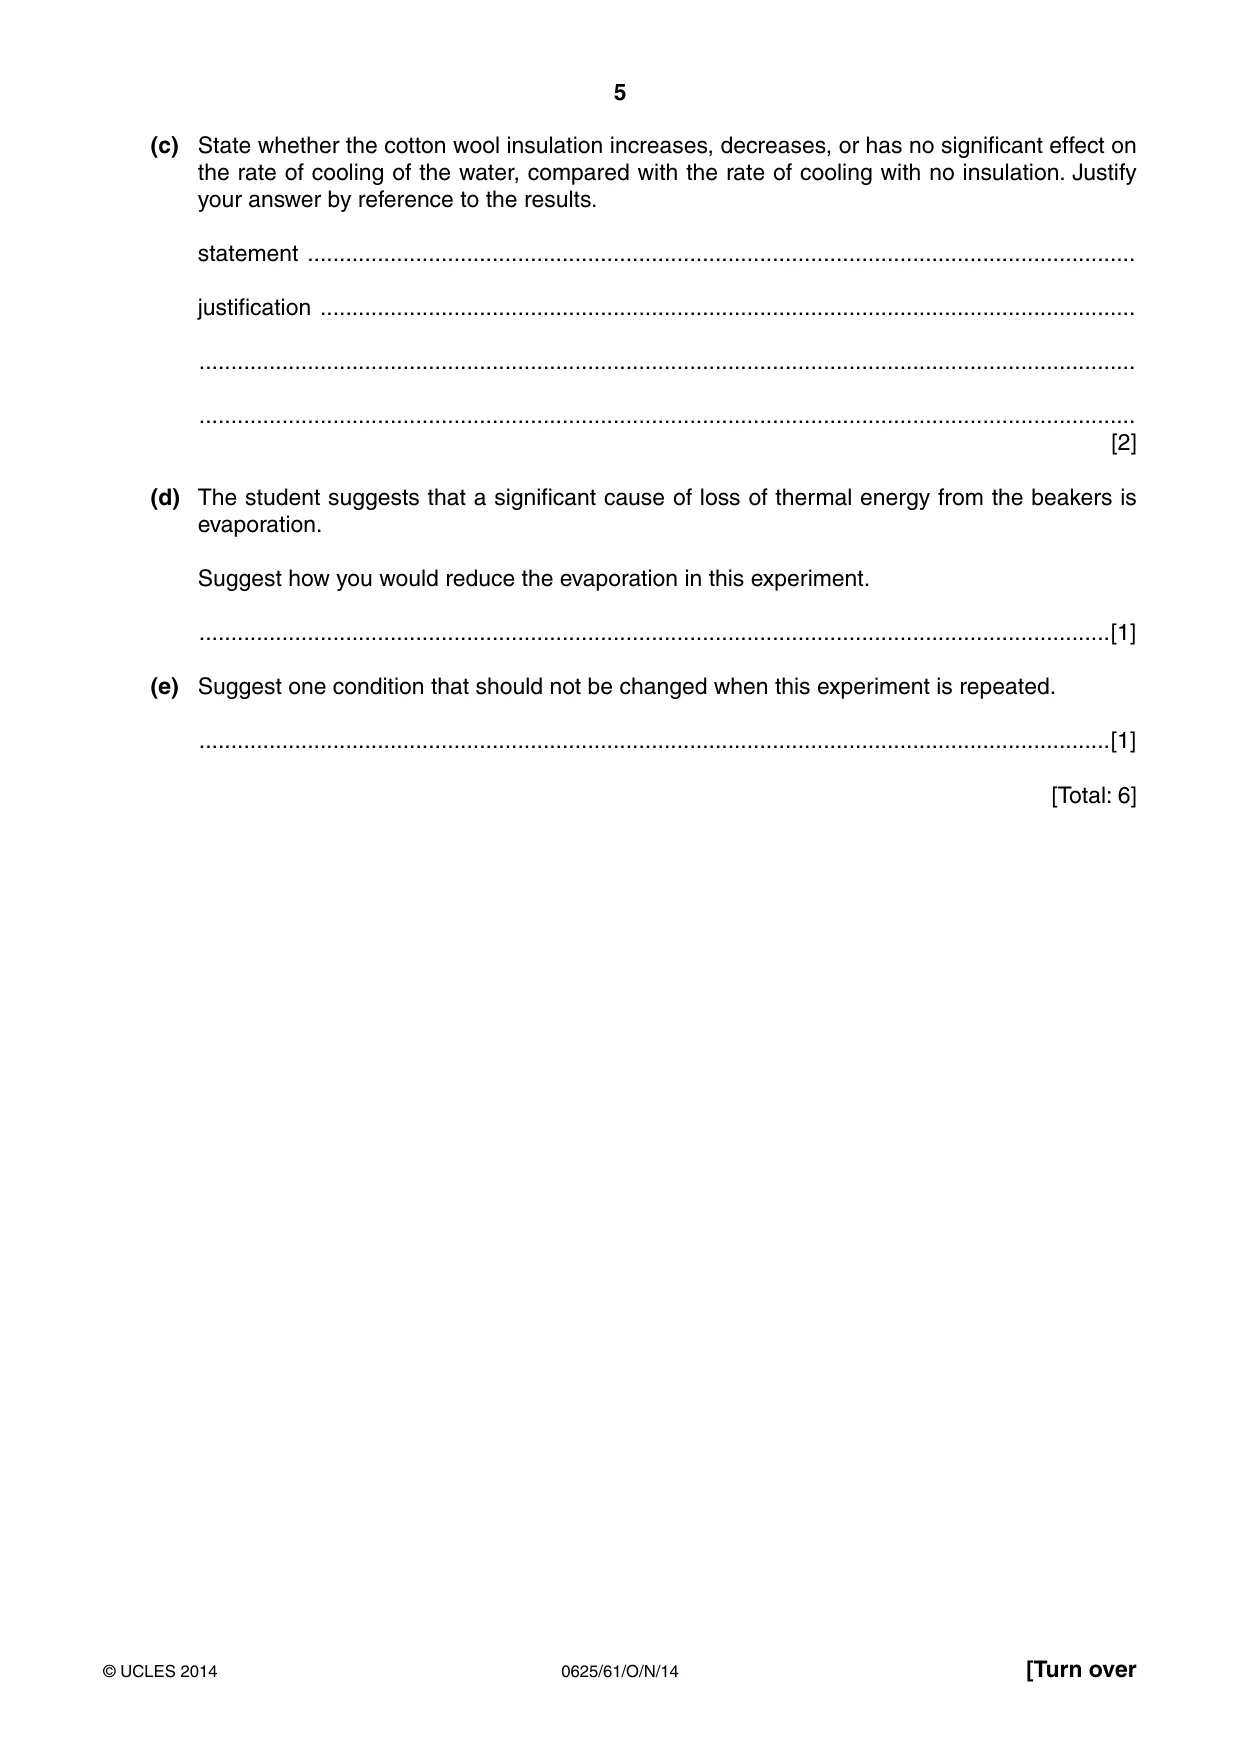
2 The IGCSE class is investigating the cooling of hot water under different conditions. Figs. 2.1 and 2.2 show the apparatus used. thermometer thermometer insulation water water Fig. 2.1 Fig. 2.2 (a) Record room temperature θR as shown on the thermometer in Fig. 2.3. –10 0 10 20 30 40 50 60 70 80 90 100 110 °C Fig. 2.3 θR = ................................................. [1] (b) A student pours hot water into the uninsulated beaker shown in Fig. 2.1 until it is about two-thirds full. She measures the temperature and immediately starts a stopclock. She records the temperature every 30 s. She repeats the procedure using the insulated beaker as shown in Fig. 2.2. The readings are shown in Table 2.1. Table 2.1 without insulation with insulation t / θ/ θ/ 0 80 79 30 77 76 60 74 73 90 72 71 120 70 70 150 69 69 Complete the column headings in the table. [1] (c) State whether the cotton wool insulation increases, decreases, or has no significant effect on the rate of cooling of the water, compared with the rate of cooling with no insulation. Justify your answer by reference to the results. statement .................................................................................................................................. justification ................................................................................................................................ ................................................................................................................................................... ................................................................................................................................................... [2] (d) The student suggests that a significant cause of loss of thermal energy from the beakers is evaporation. Suggest how you would reduce the evaporation in this experiment. ...............................................................................................................................................[1] (e) Suggest one condition that should not be changed when this experiment is repeated. ...............................................................................................................................................[1] [Total: 6]
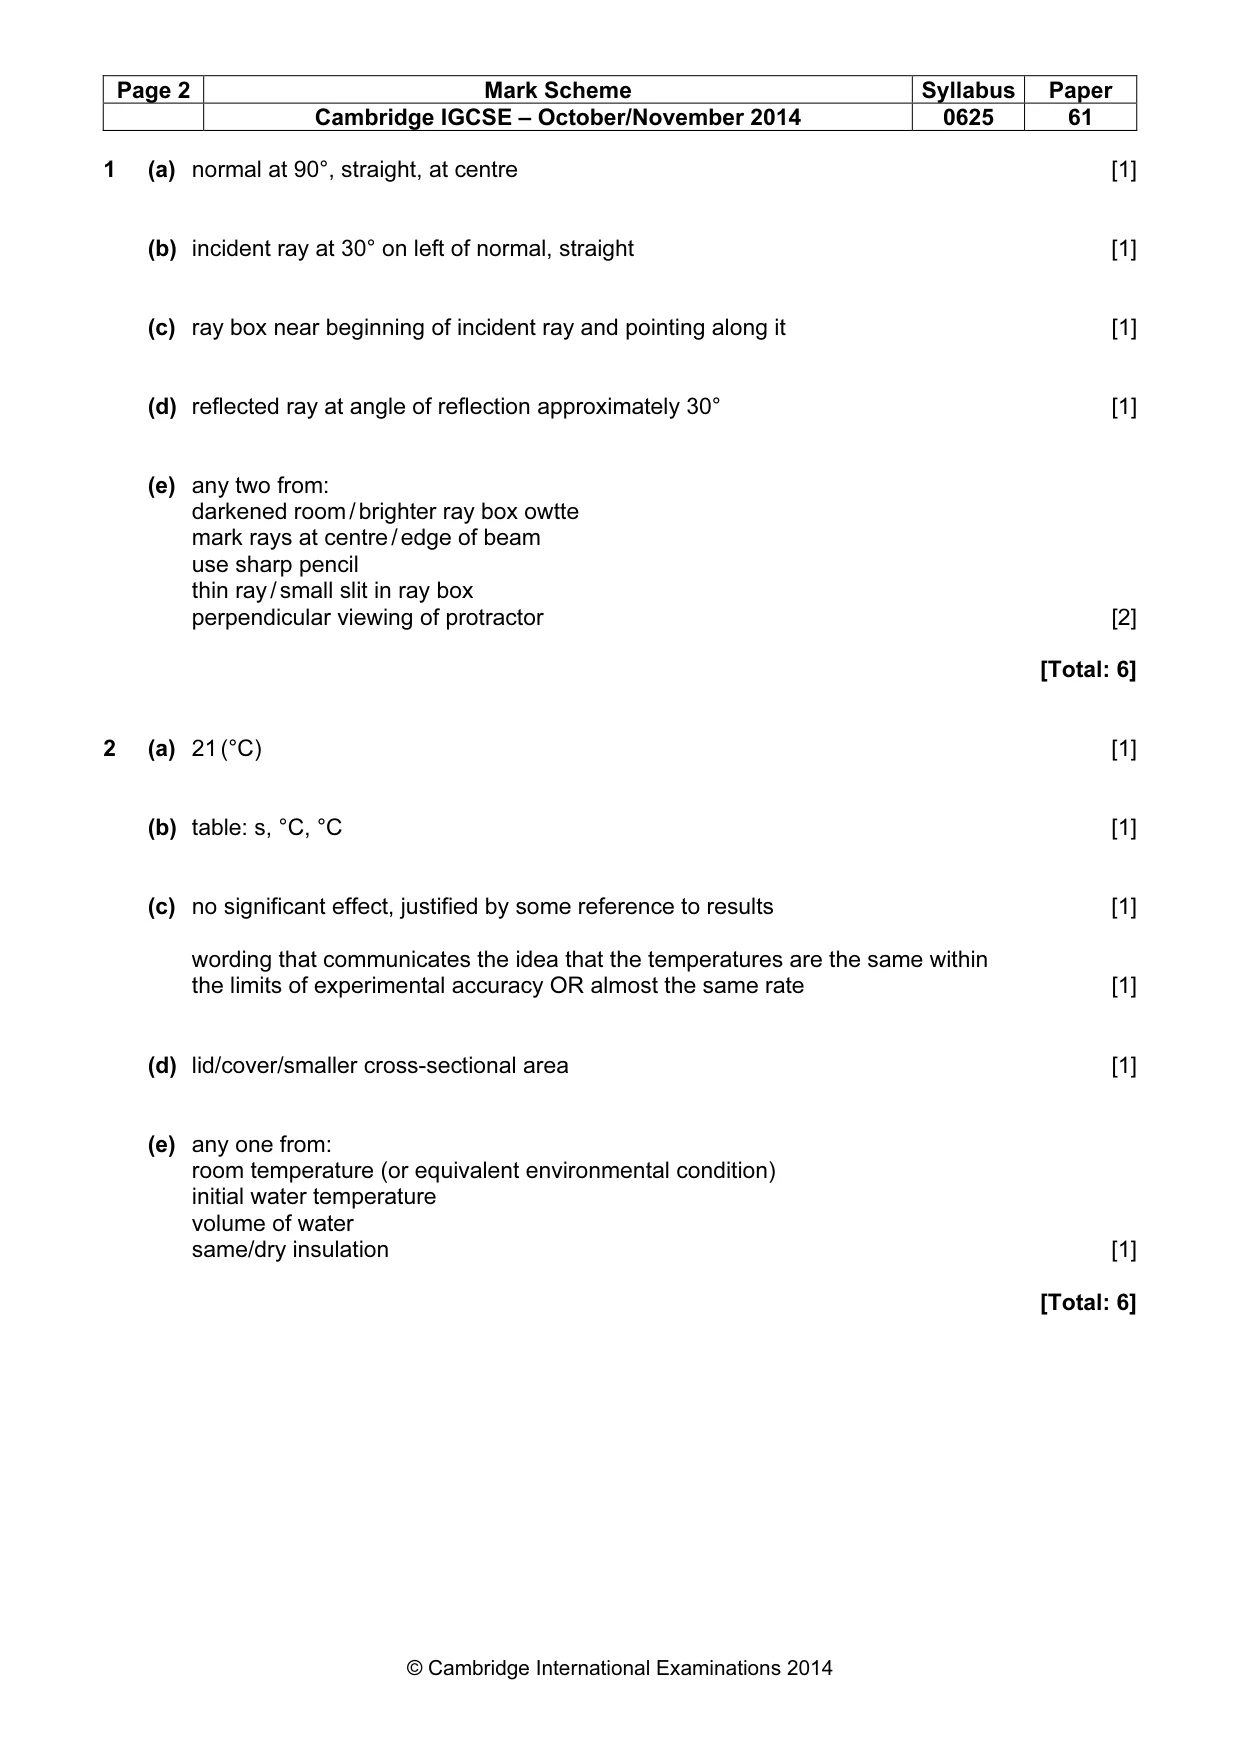
Mark scheme: 2 (a) 21 (°C) [1] (b) table: s, °C, °C [1] (c) no significant effect, justified by some reference to results [1] wording that communicates the idea that the temperatures are the same within the limits of experimental accuracy OR almost the same rate [1] (d) lid/cover/smaller cross-sectional area [1] (e) any one from: room temperature (or equivalent environmental condition) initial water temperature volume of water same/dry insulation [1] [Total: 6]
Q3 · The IGCSE class is investigating the resistance of a wire
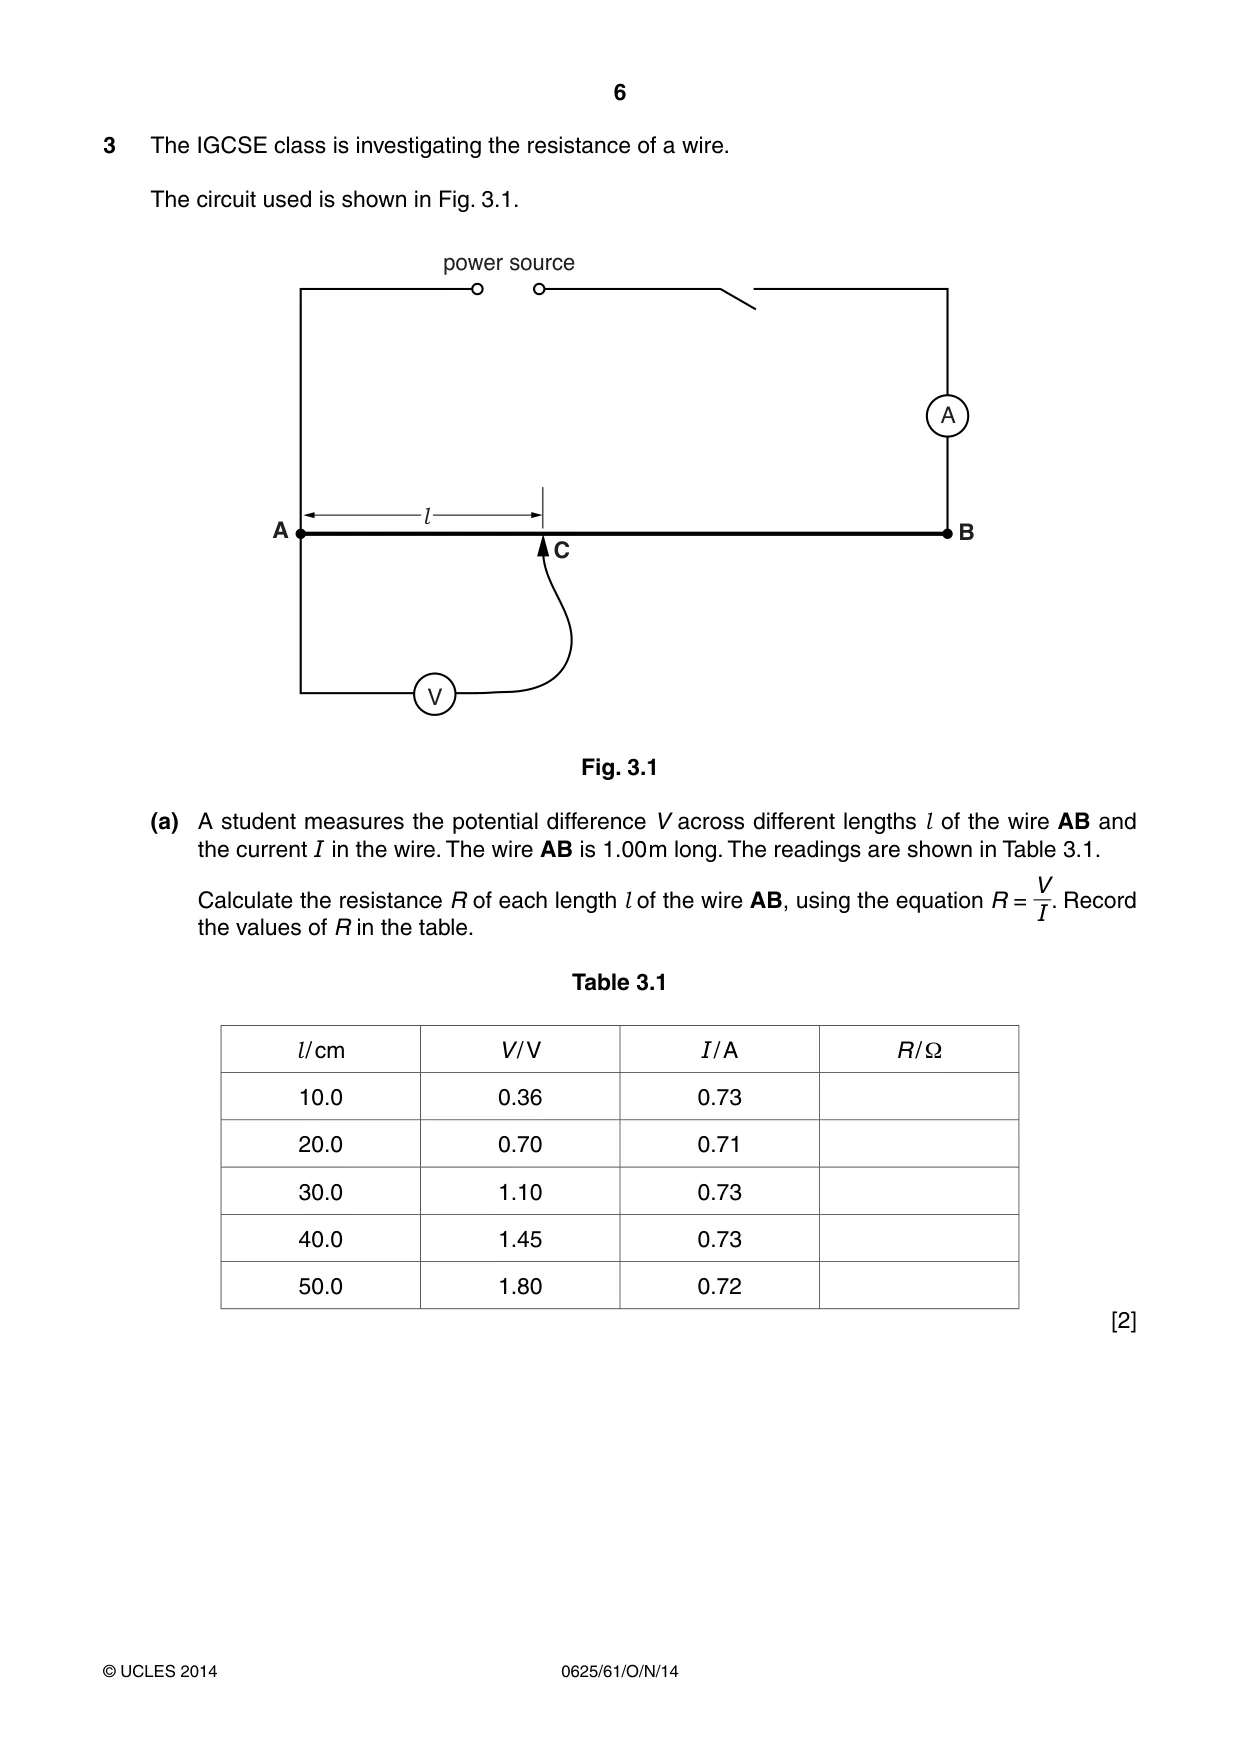
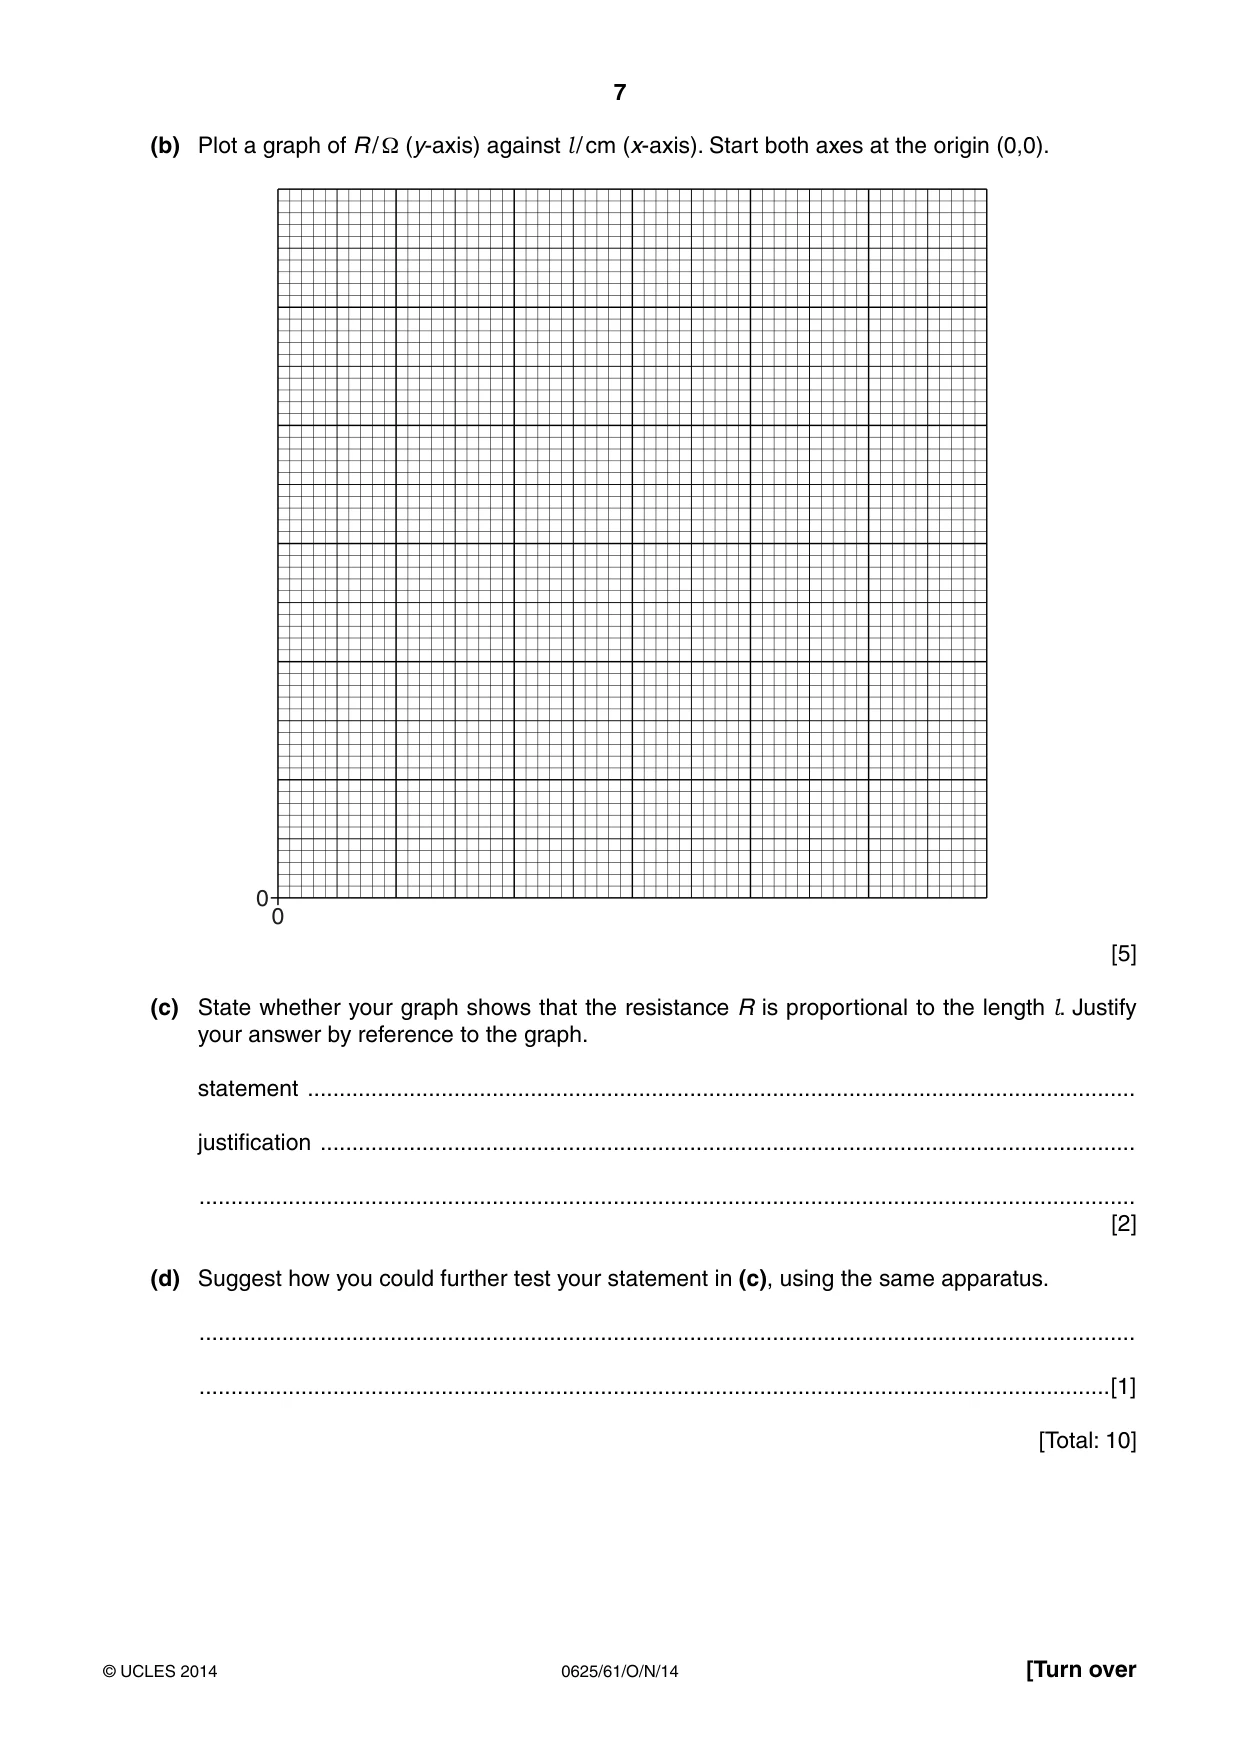
3 The IGCSE class is investigating the resistance of a wire. The circuit used is shown in Fig. 3.1. SRZHU VRXUFH $ l $ % & 9 Fig. 3.1 (a) A student measures the potential difference V across different lengths l of the wire AB and the current I in the wire. The wire AB is 1.00 m long. The readings are shown in Table 3.1. V Calculate the resistance R of each length l of the wire AB, using the equation R = . Record I the values of R in the table. Table 3.1 l / cm V / V I / A R / Ω 10.0 0.36 0.73 20.0 0.70 0.71 30.0 1.10 0.73 40.0 1.45 0.73 50.0 1.80 0.72 [2] (b) Plot a graph of R / Ω (y-axis) against l / cm (x-axis). Start both axes at the origin (0,0). 0 0 [5] (c) State whether your graph shows that the resistance R is proportional to the length l. Justify your answer by reference to the graph. statement .................................................................................................................................. justification ................................................................................................................................ ................................................................................................................................................... [2] (d) Suggest how you could further test your statement in (c), using the same apparatus. ................................................................................................................................................... ...............................................................................................................................................[1] [Total: 10]
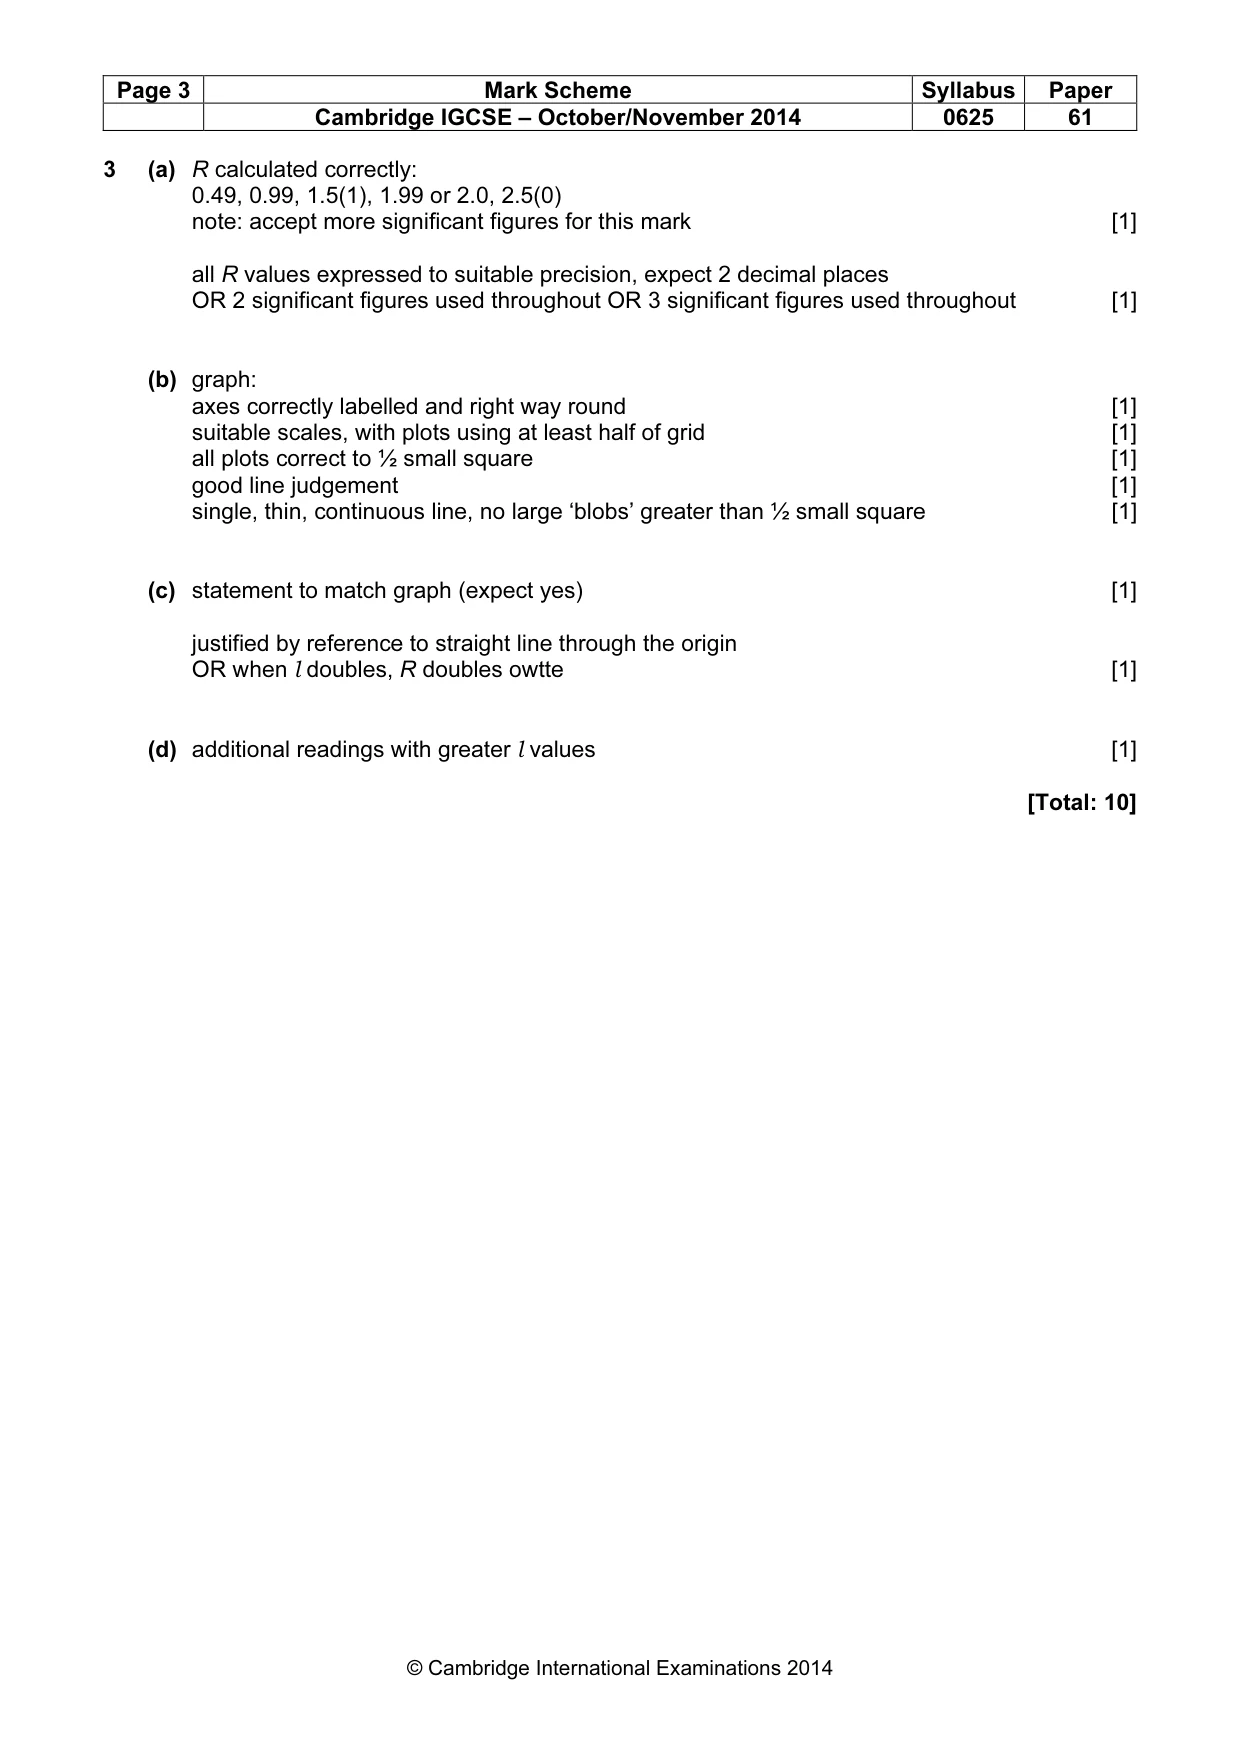
Mark scheme: 3 (a) R calculated correctly: 0.49, 0.99, 1.5(1), 1.99 or 2.0, 2.5(0) note: accept more significant figures for this mark [1] all R values expressed to suitable precision, expect 2 decimal places OR 2 significant figures used throughout OR 3 significant figures used throughout [1] (b) graph: axes correctly labelled and right way round [1] suitable scales, with plots using at least half of grid [1] all plots correct to ½ small square [1] good line judgement [1] single, thin, continuous line, no large ‘blobs’ greater than ½ small square [1] (c) statement to match graph (expect yes) [1] justified by reference to straight line through the origin OR when l doubles, R doubles owtte [1] (d) additional readings with greater l values [1] [Total: 10]
Q4 · The IGCSE class is determining the magnification of an image produced by a lens
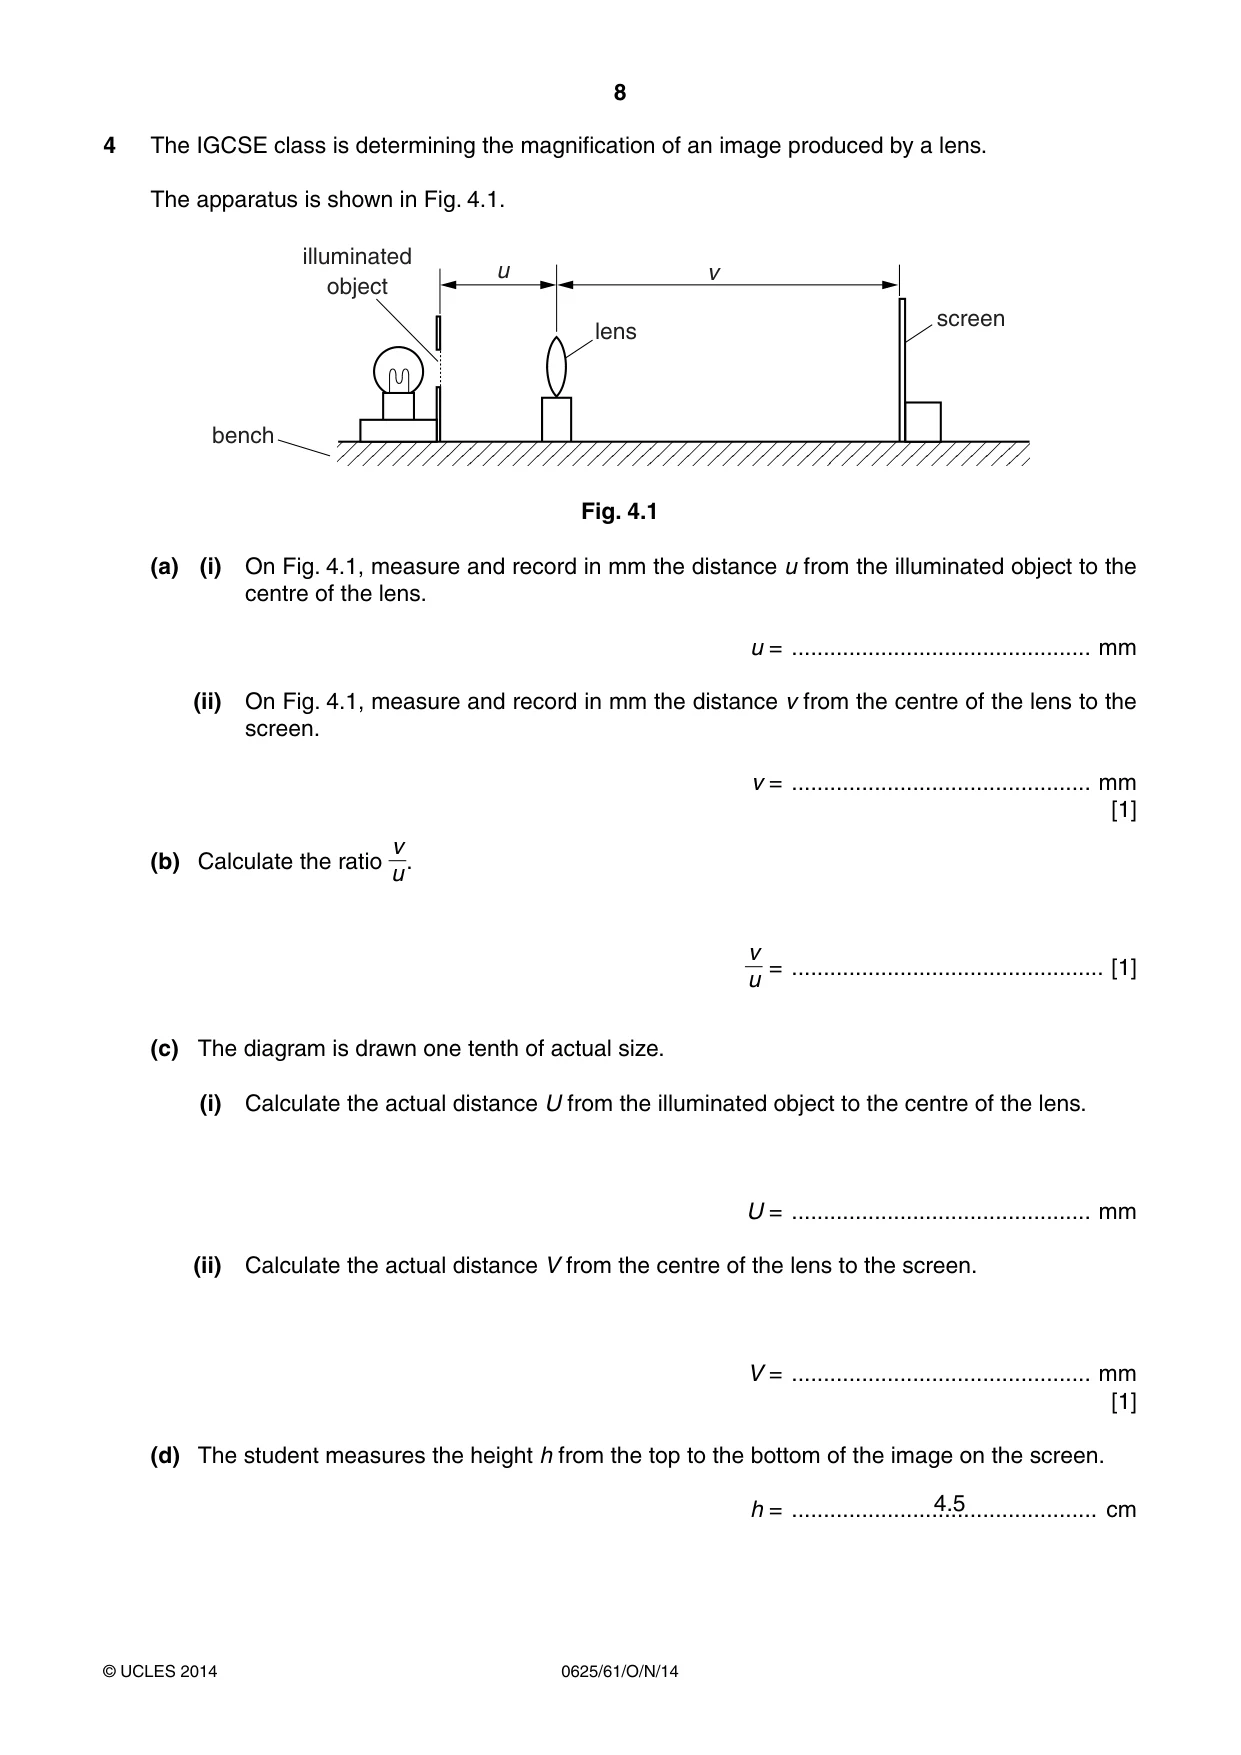
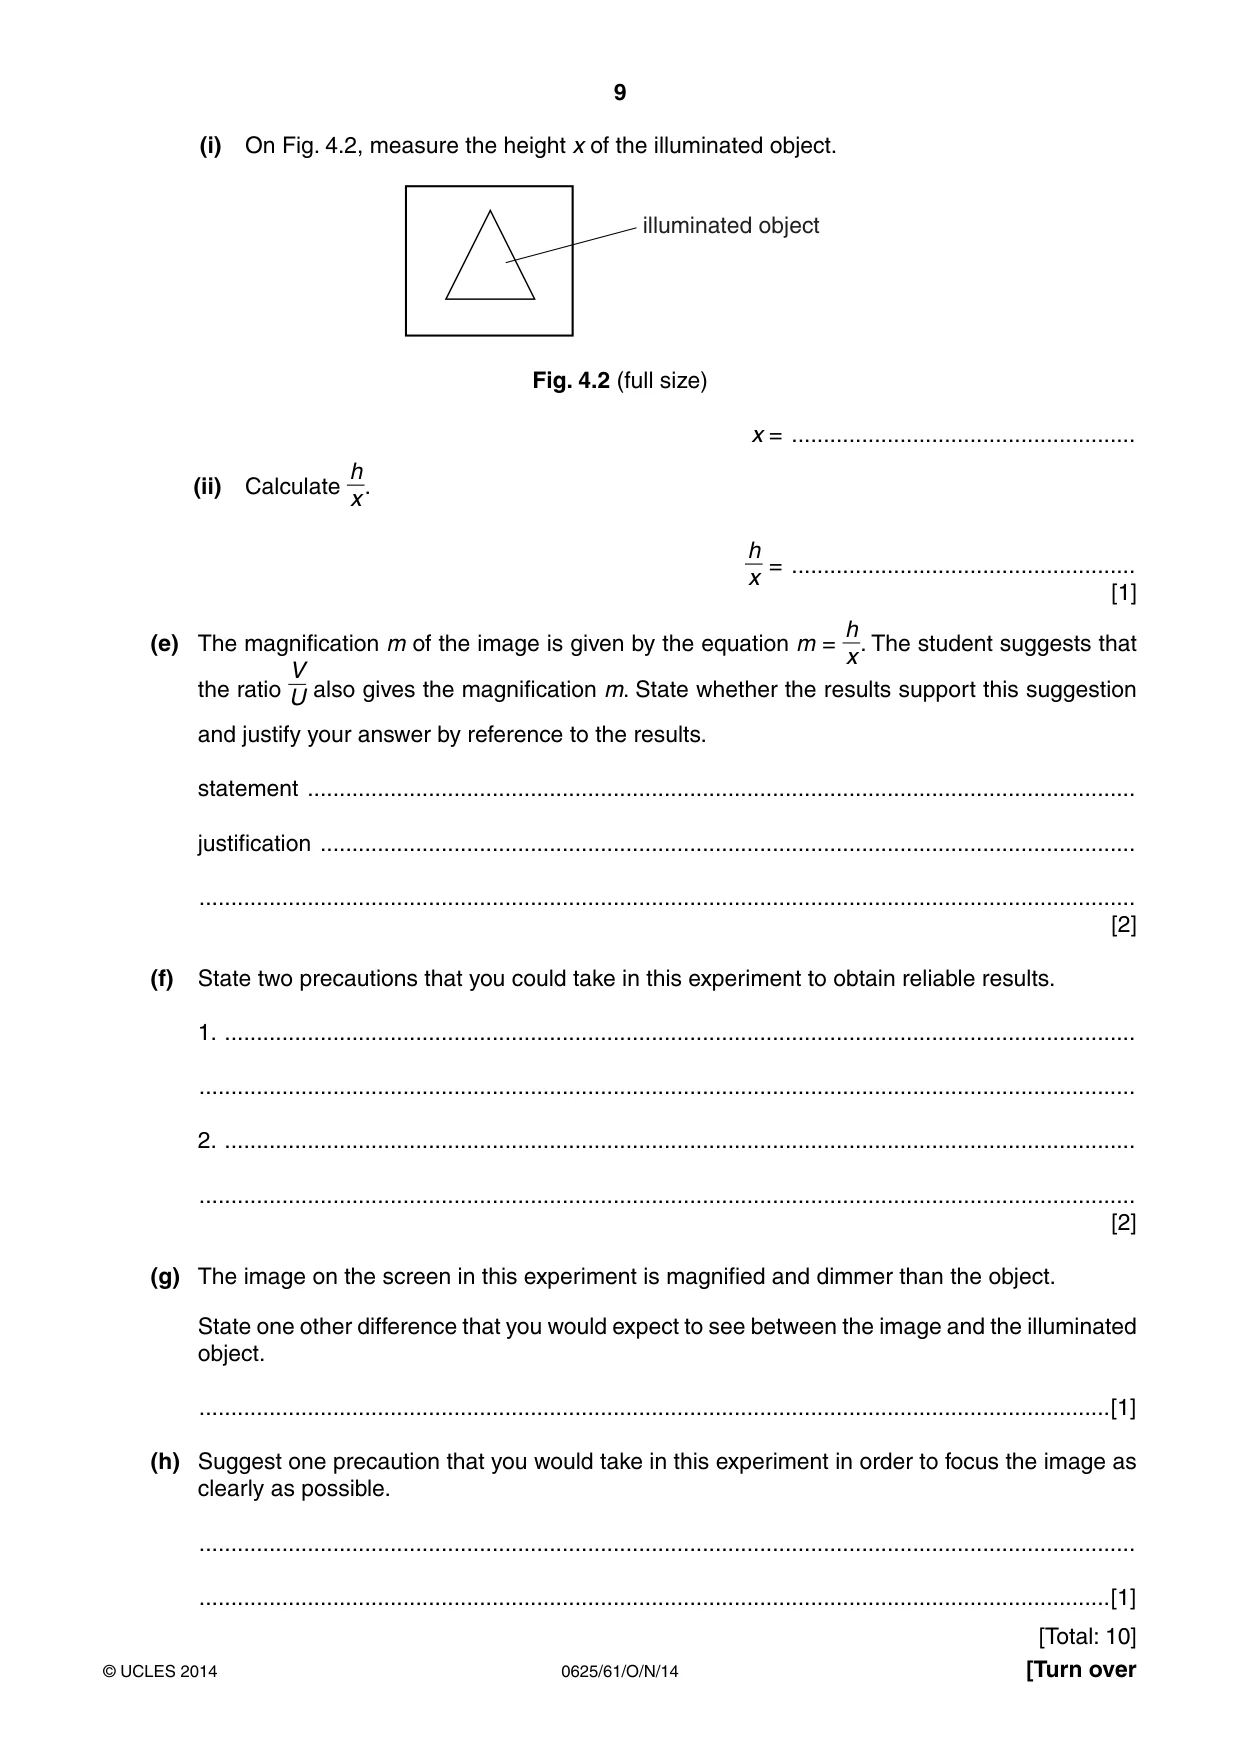
4 The IGCSE class is determining the magnification of an image produced by a lens. The apparatus is shown in Fig. 4.1. illuminated u v object screen lens bench Fig. 4.1 (a) (i) On Fig. 4.1, measure and record in mm the distance u from the illuminated object to the centre of the lens. u = ............................................... mm (ii) On Fig. 4.1, measure and record in mm the distance v from the centre of the lens to the screen. v = ............................................... mm [1] v (b) Calculate the ratio u. v = ................................................. [1] u (c) The diagram is drawn one tenth of actual size. (i) Calculate the actual distance U from the illuminated object to the centre of the lens. U = ............................................... mm (ii) Calculate the actual distance V from the centre of the lens to the screen. V = ............................................... mm [1] (d) The student measures the height h from the top to the bottom of the image on the screen. h = ................................................4.5 cm (i) On Fig. 4.2, measure the height x of the illuminated object. illuminated object Fig. 4.2 (full size) x = ...................................................... h (ii) Calculate x. h = ...................................................... x [1] h (e) The magnification m of the image is given by the equation m = x. The student suggests that V the ratio also gives the magnification m. State whether the results support this suggestion U and justify your answer by reference to the results. statement .................................................................................................................................. justification ................................................................................................................................ ................................................................................................................................................... [2] (f) State two precautions that you could take in this experiment to obtain reliable results. 1. ............................................................................................................................................... ................................................................................................................................................... 2. ............................................................................................................................................... ................................................................................................................................................... [2] (g) The image on the screen in this experiment is magnified and dimmer than the object. State one other difference that you would expect to see between the image and the illuminated object. ...............................................................................................................................................[1] (h) Suggest one precaution that you would take in this experiment in order to focus the image as clearly as possible. ................................................................................................................................................... ...............................................................................................................................................[1] [Total: 10]
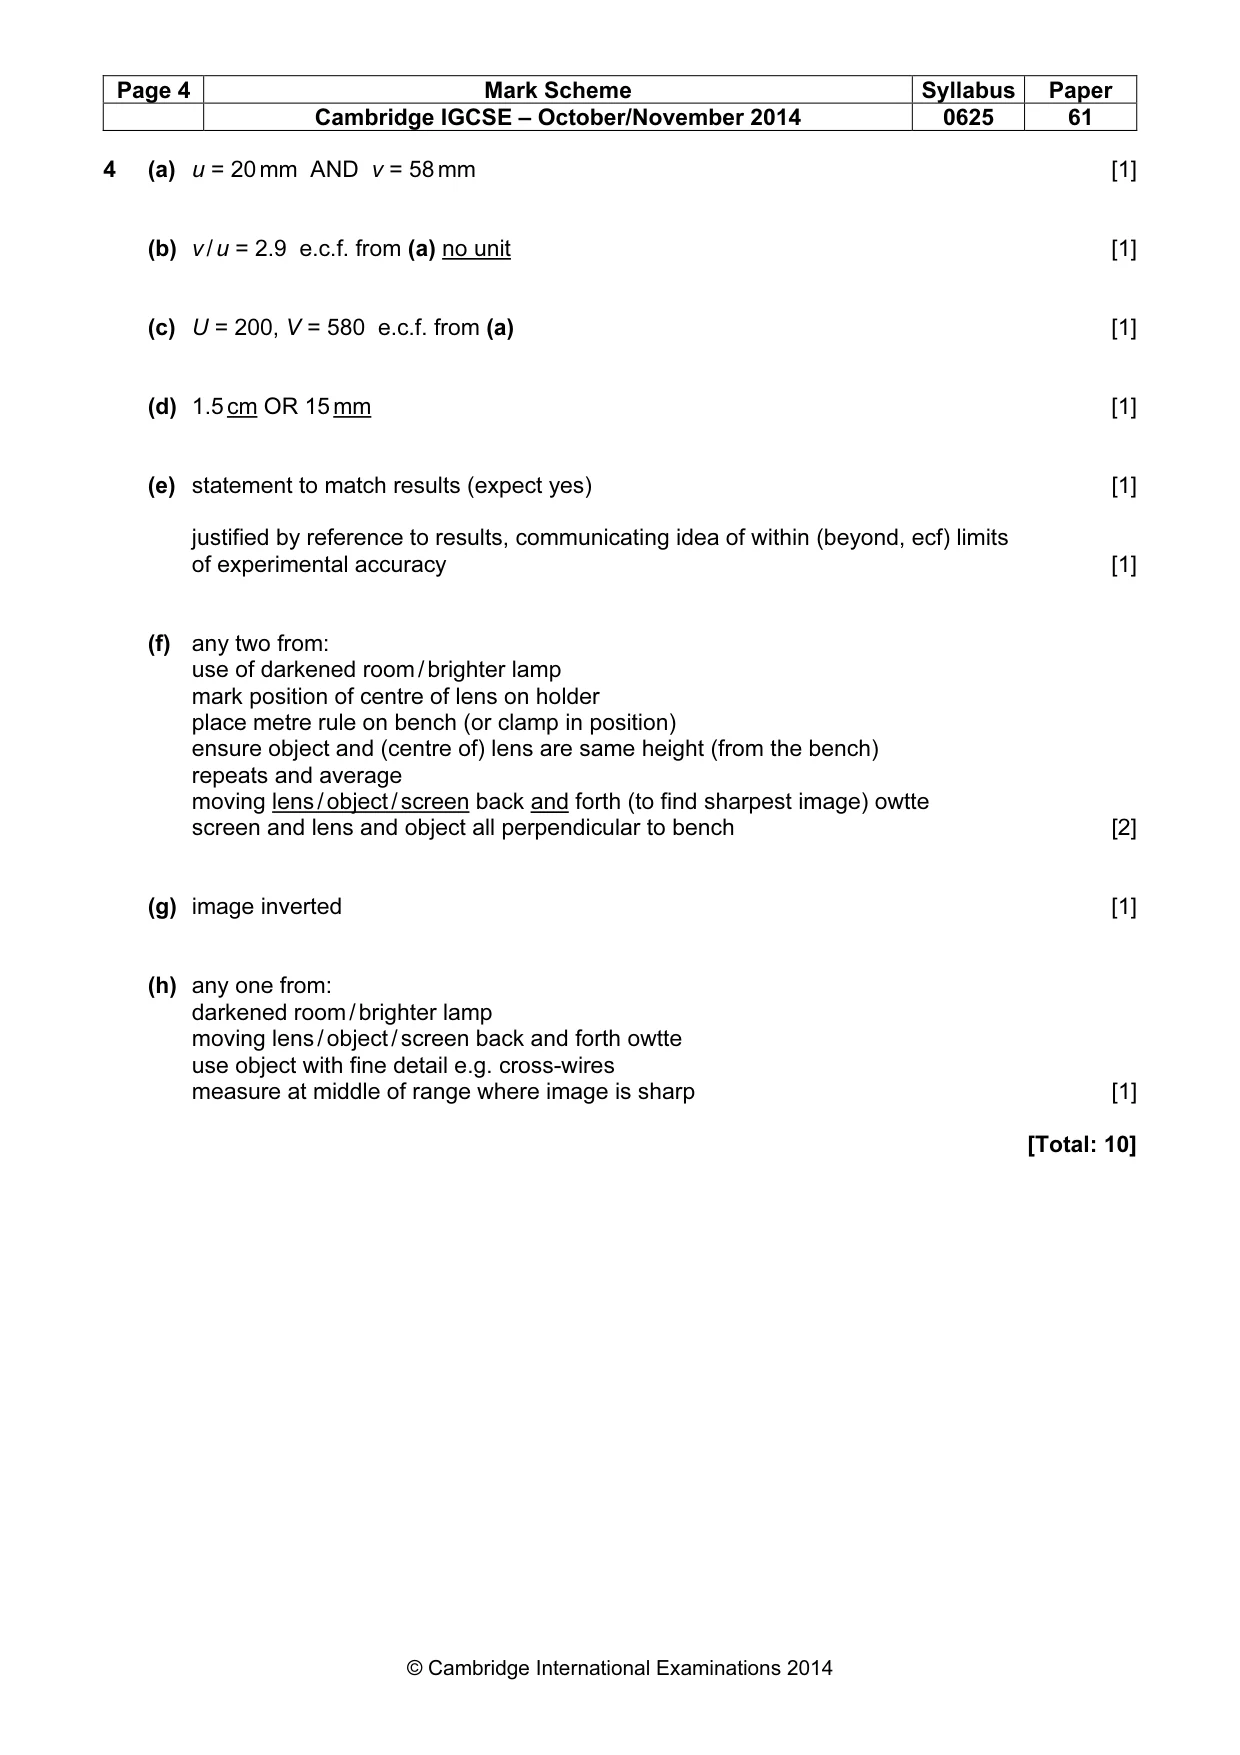
Mark scheme: 4 (a) u = 20 mm AND v = 58 mm [1] (b) v / u = 2.9 e.c.f. from (a) no unit [1] (c) U = 200, V = 580 e.c.f. from (a) [1] (d) 1.5 cm OR 15 mm [1] (e) statement to match results (expect yes) [1] justified by reference to results, communicating idea of within (beyond, ecf) limits of experimental accuracy [1] (f) any two from: use of darkened room / brighter lamp mark position of centre of lens on holder place metre rule on bench (or clamp in position) ensure object and (centre of) lens are same height (from the bench) repeats and average moving lens / object / screen back and forth (to find sharpest image) owtte screen and lens and object all perpendicular to bench [2] (g) image inverted [1] (h) any one from: darkened room / brighter lamp moving lens / object / screen back and forth owtte use object with fine detail e.g. cross-wires measure at middle of range where image is sharp [1] [Total: 10]
More questions on Physical quantities and measurement techniques
Q5 · An IGCSE student is taking measurements of a drinks cup
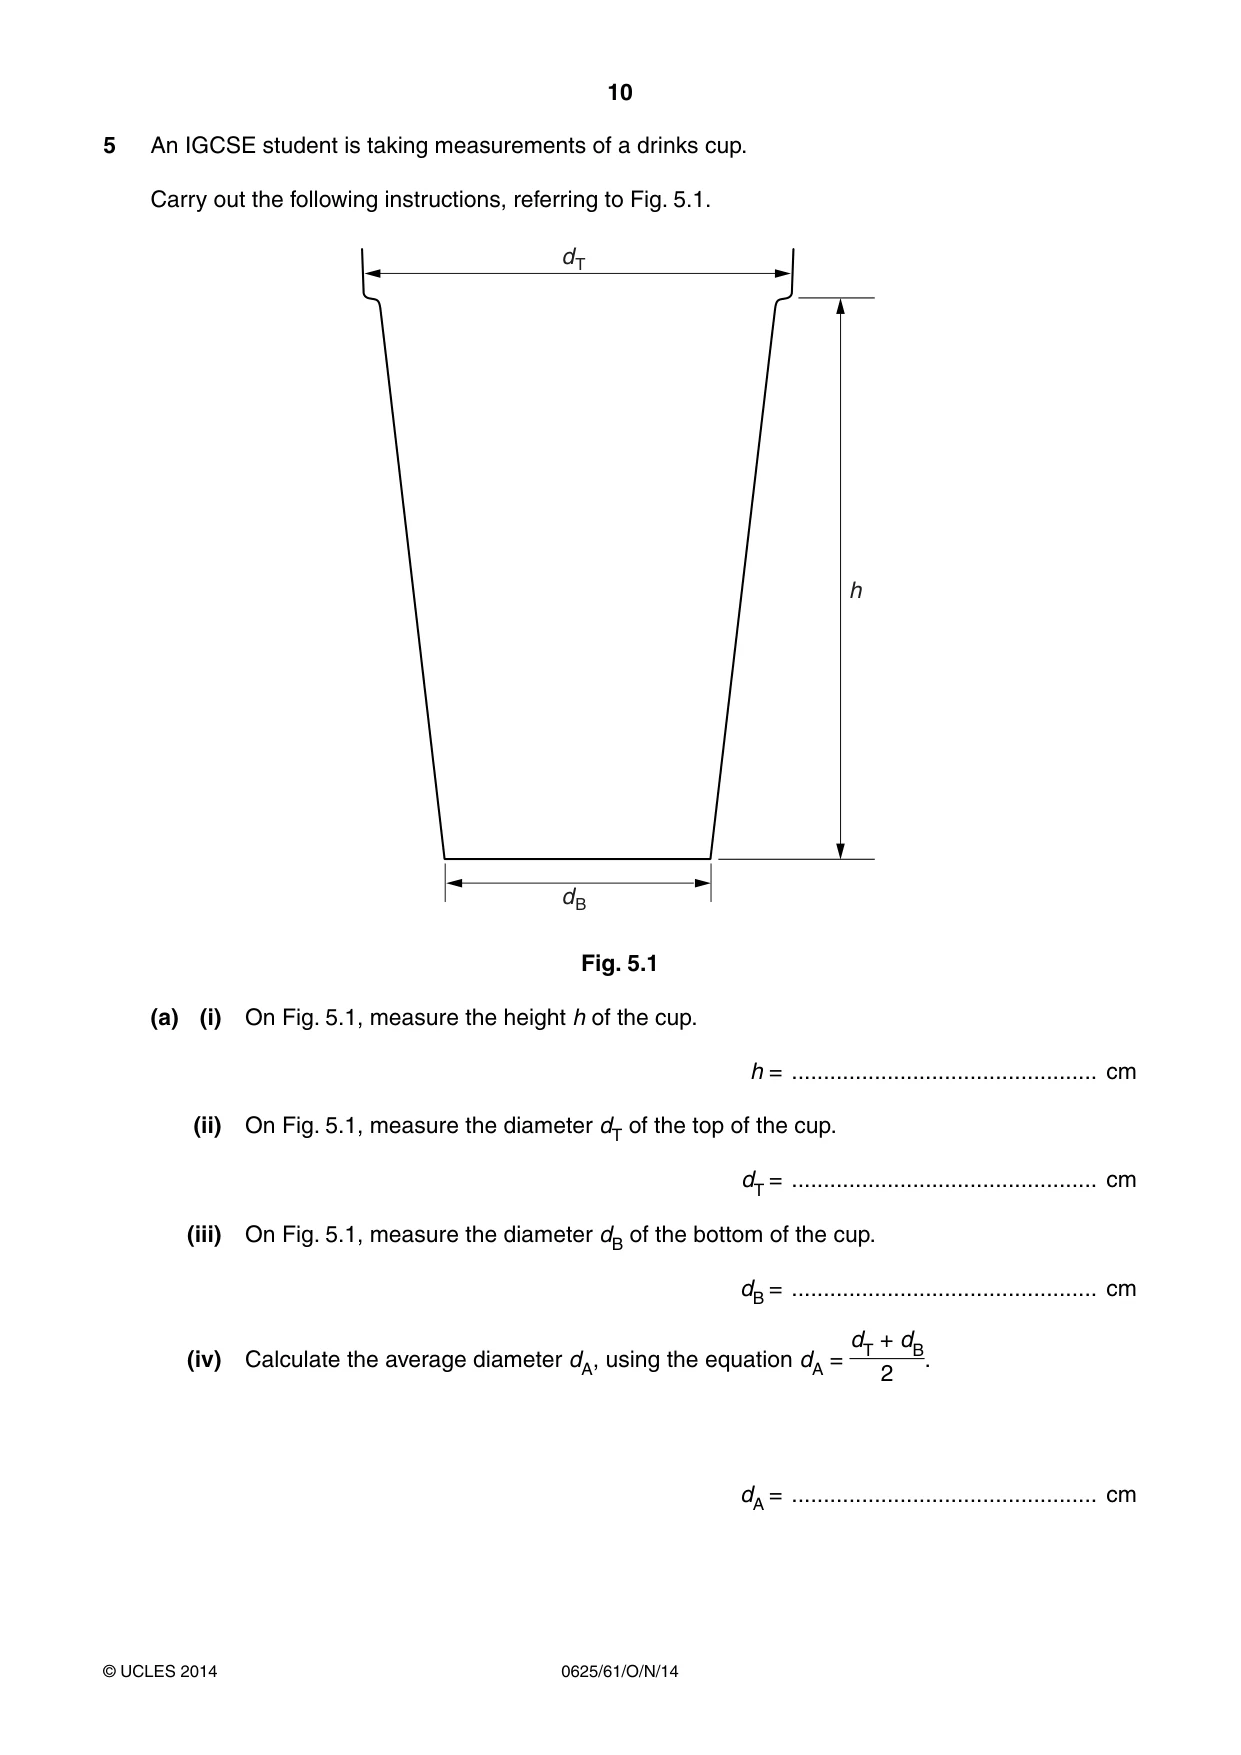
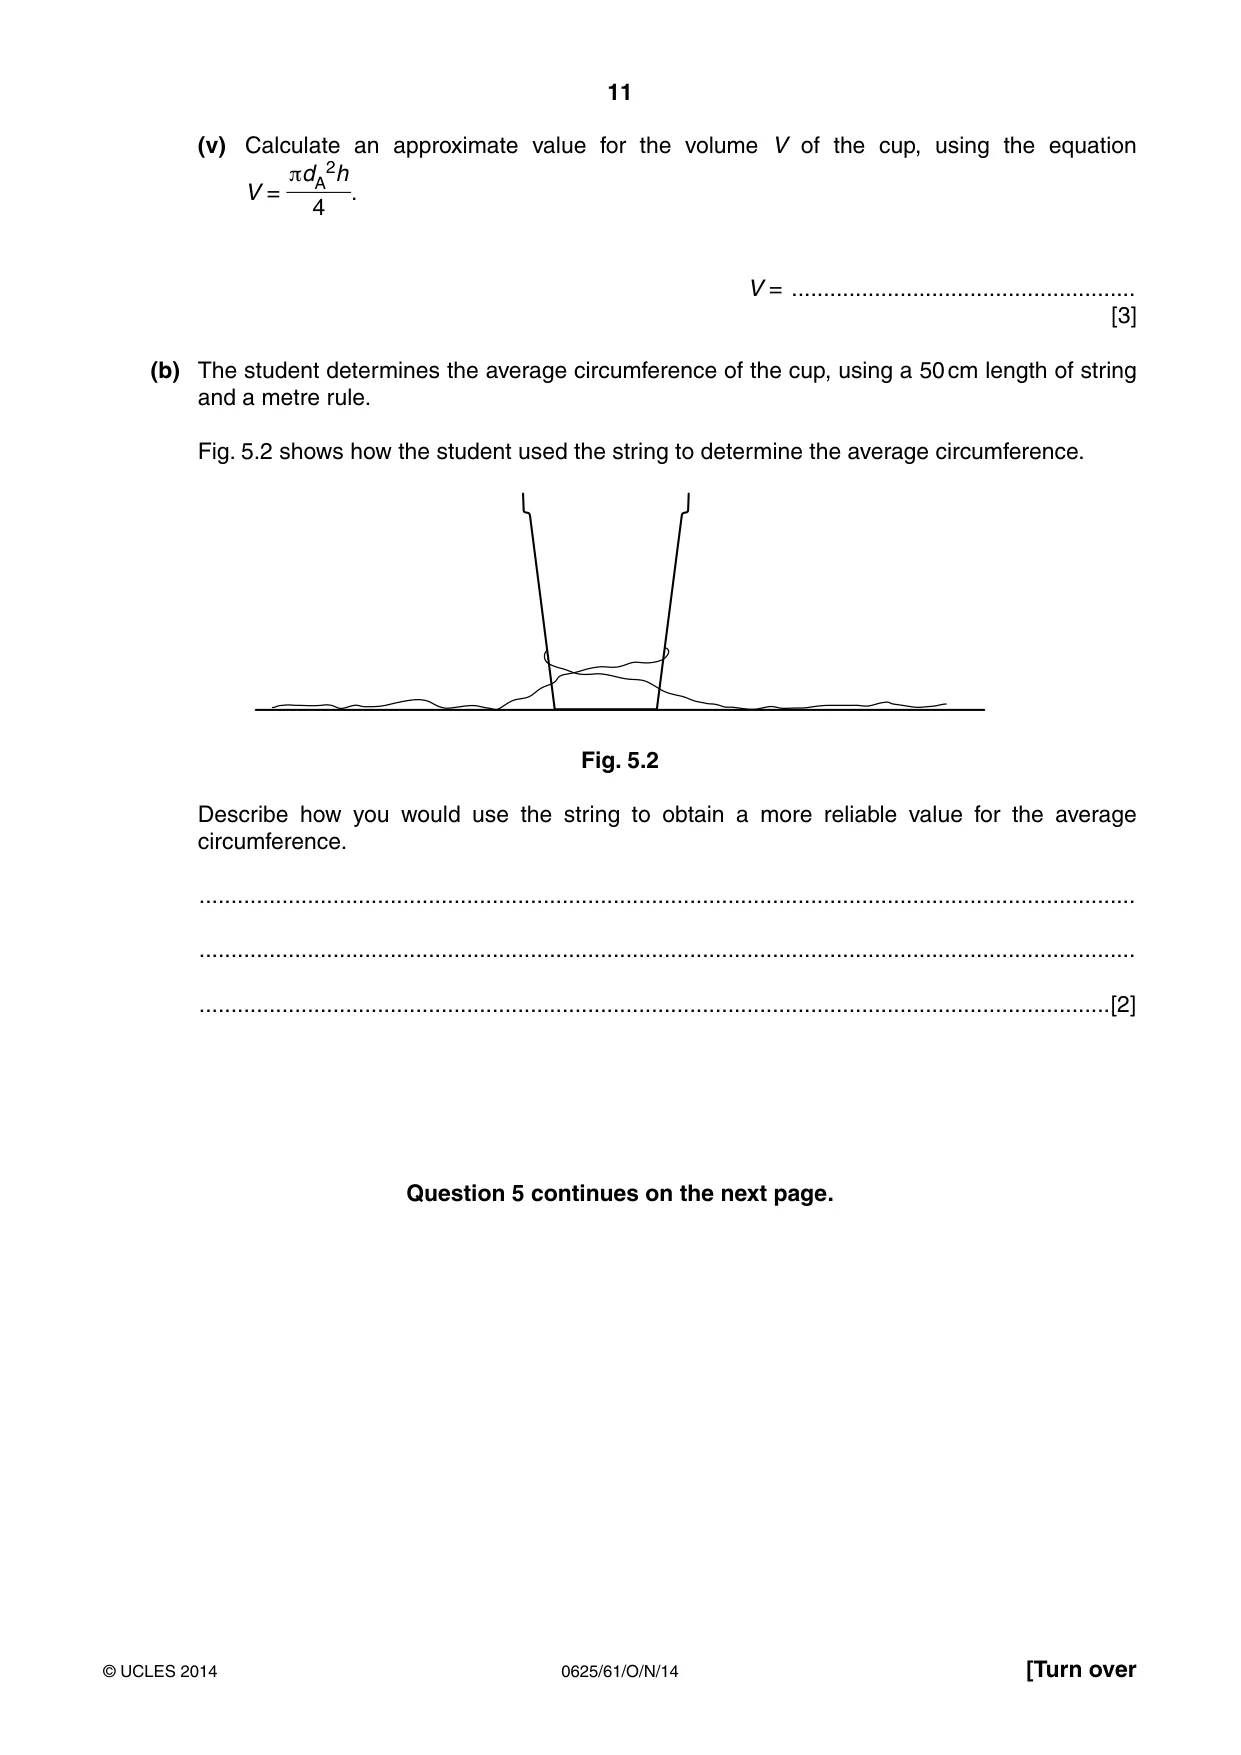
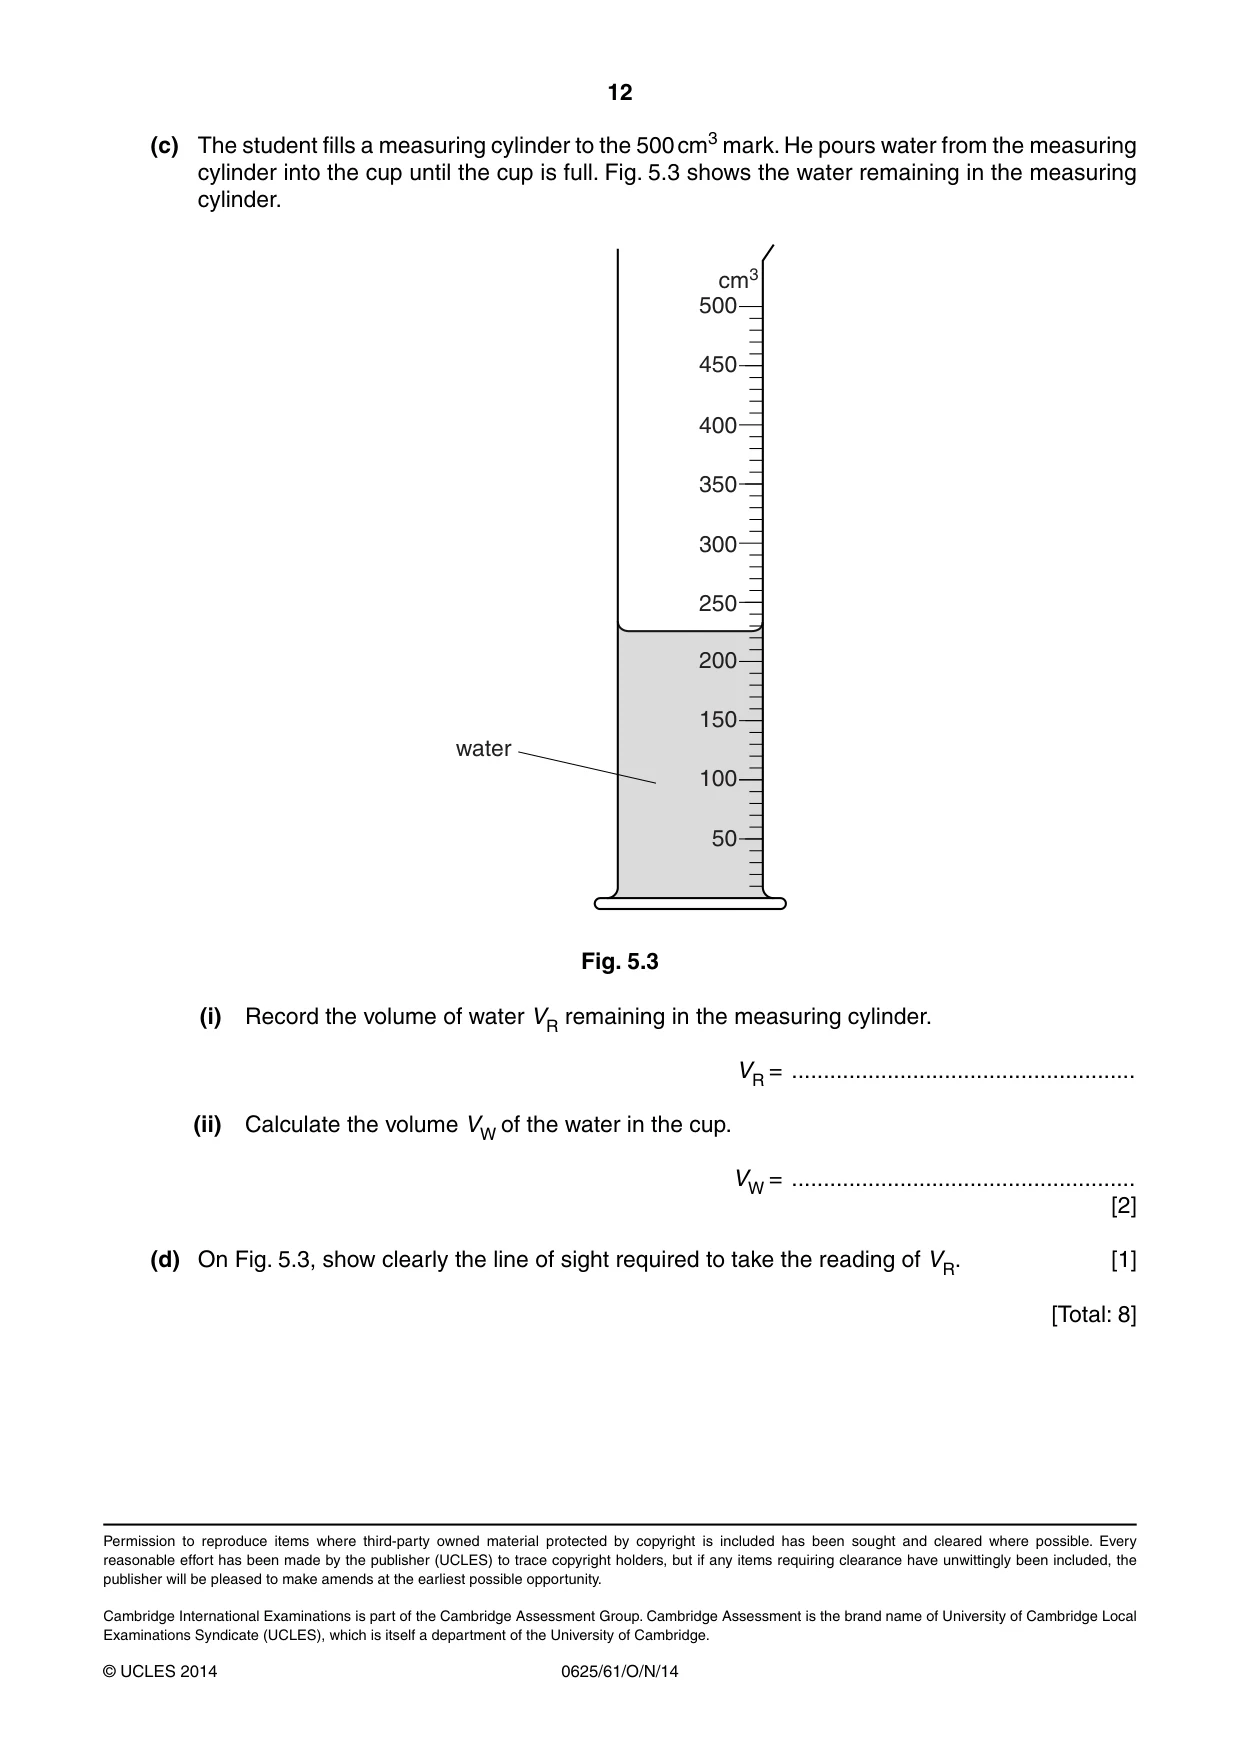
5 An IGCSE student is taking measurements of a drinks cup. Carry out the following instructions, referring to Fig. 5.1. d T h d B Fig. 5.1 (a) (i) On Fig. 5.1, measure the height h of the cup. h = ................................................ cm (ii) On Fig. 5.1, measure the diameter dT of the top of the cup. dT = ................................................ cm (iii) On Fig. 5.1, measure the diameter dB of the bottom of the cup. dB = ................................................ cm dT + dB (iv) Calculate the average diameter dA, using the equation dA = . 2 dA = ................................................ cm (v) Calculate an approximate value for the volume V of the cup, using the equation πdA2h V = . 4 V = ...................................................... [3] (b) The student determines the average circumference of the cup, using a 50 cm length of string and a metre rule. Fig. 5.2 shows how the student used the string to determine the average circumference. Fig. 5.2 Describe how you would use the string to obtain a more reliable value for the average circumference. ................................................................................................................................................... ................................................................................................................................................... ...............................................................................................................................................[2] Question 5 continues on the next page. (c) The student fills a measuring cylinder to the 500 cm3 mark. He pours water from the measuring cylinder into the cup until the cup is full. Fig. 5.3 shows the water remaining in the measuring cylinder. cm3 500 450 400 350 300 250 200 150 water 100 50 Fig. 5.3 (i) Record the volume of water VR remaining in the measuring cylinder. VR = ...................................................... (ii) Calculate the volume VW of the water in the cup. VW = ...................................................... [2] (d) On Fig. 5.3, show clearly the line of sight required to take the reading of VR. [1] [Total: 8]
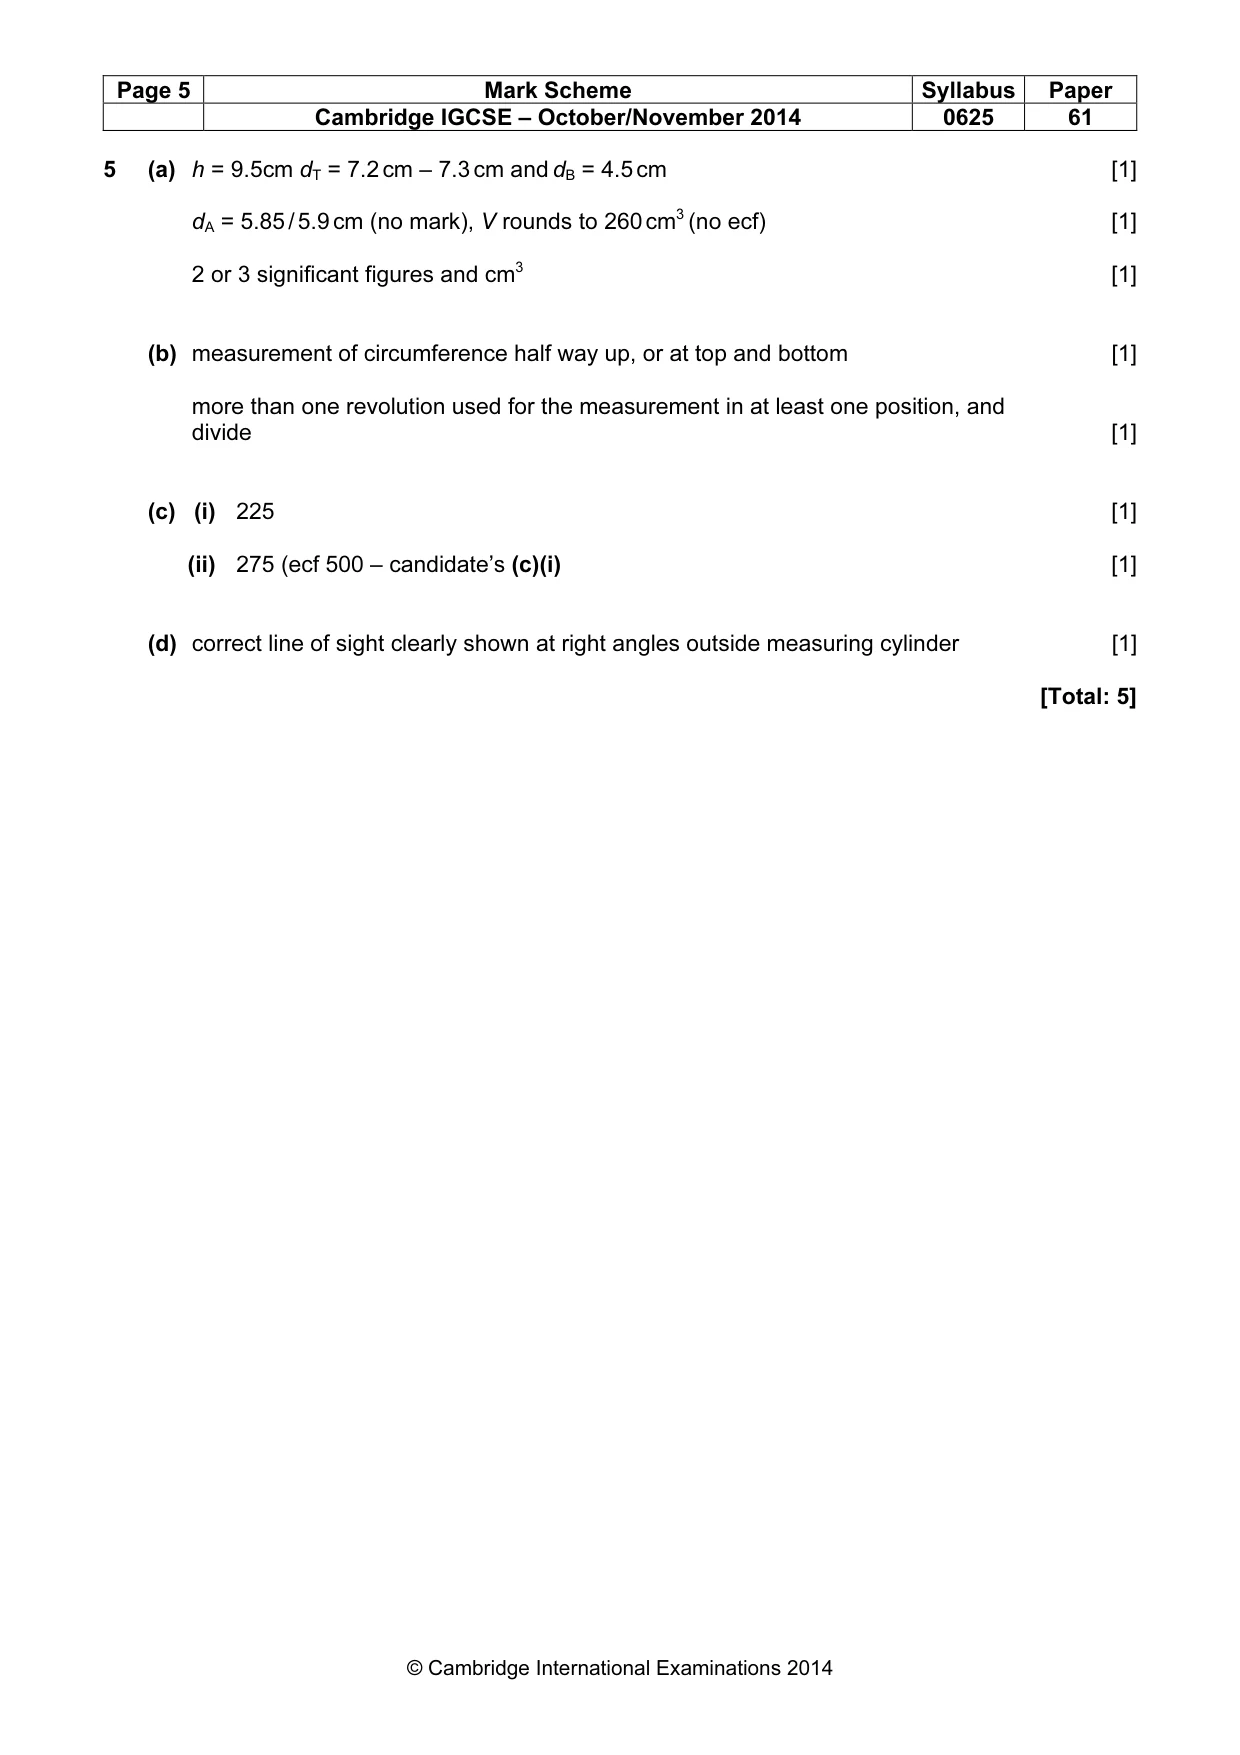
Mark scheme: 5 (a) h = 9.5cm dT = 7.2 cm – 7.3 cm and dB = 4.5 cm [1] dA = 5.85 / 5.9 cm (no mark), V rounds to 260 cm3 (no ecf) [1] 2 or 3 significant figures and cm3 [1] (b) measurement of circumference half way up, or at top and bottom [1] more than one revolution used for the measurement in at least one position, and divide [1] (c) (i) 225 [1] (ii) 275 (ecf 500 – candidate’s (c)(i) [1] (d) correct line of sight clearly shown at right angles outside measuring cylinder [1] [Total: 5]
More questions on Physical quantities and measurement techniques
What was in this paper
The subtopics covered by these 5 questions, and how many questions each got. Open one in a new tab to see every Cambridge question on it.
What you needed in this session
Cambridge’s own grade thresholds for 2014 Oct/Nov, Paper 6 · Variant 1. A higher threshold means an easier paper — the bar moves with how the cohort did.