Cambridge IGCSE Physics 0625 — 2014 Oct/Nov Paper 6 · Variant 2
0625/62/O/N/14 · 5 questions · 40 marks · ≈45 min
The question paper and its mark scheme, free to read here and free to download. This is Cambridge’s own paper, exactly as it was sat.
Question paper16 pages

Mark scheme5 pages
Answers below. Sit the paper first if you are practising.
Questions as text
Q1 · An IGCSE student is taking measurements of a sample of modelling clay
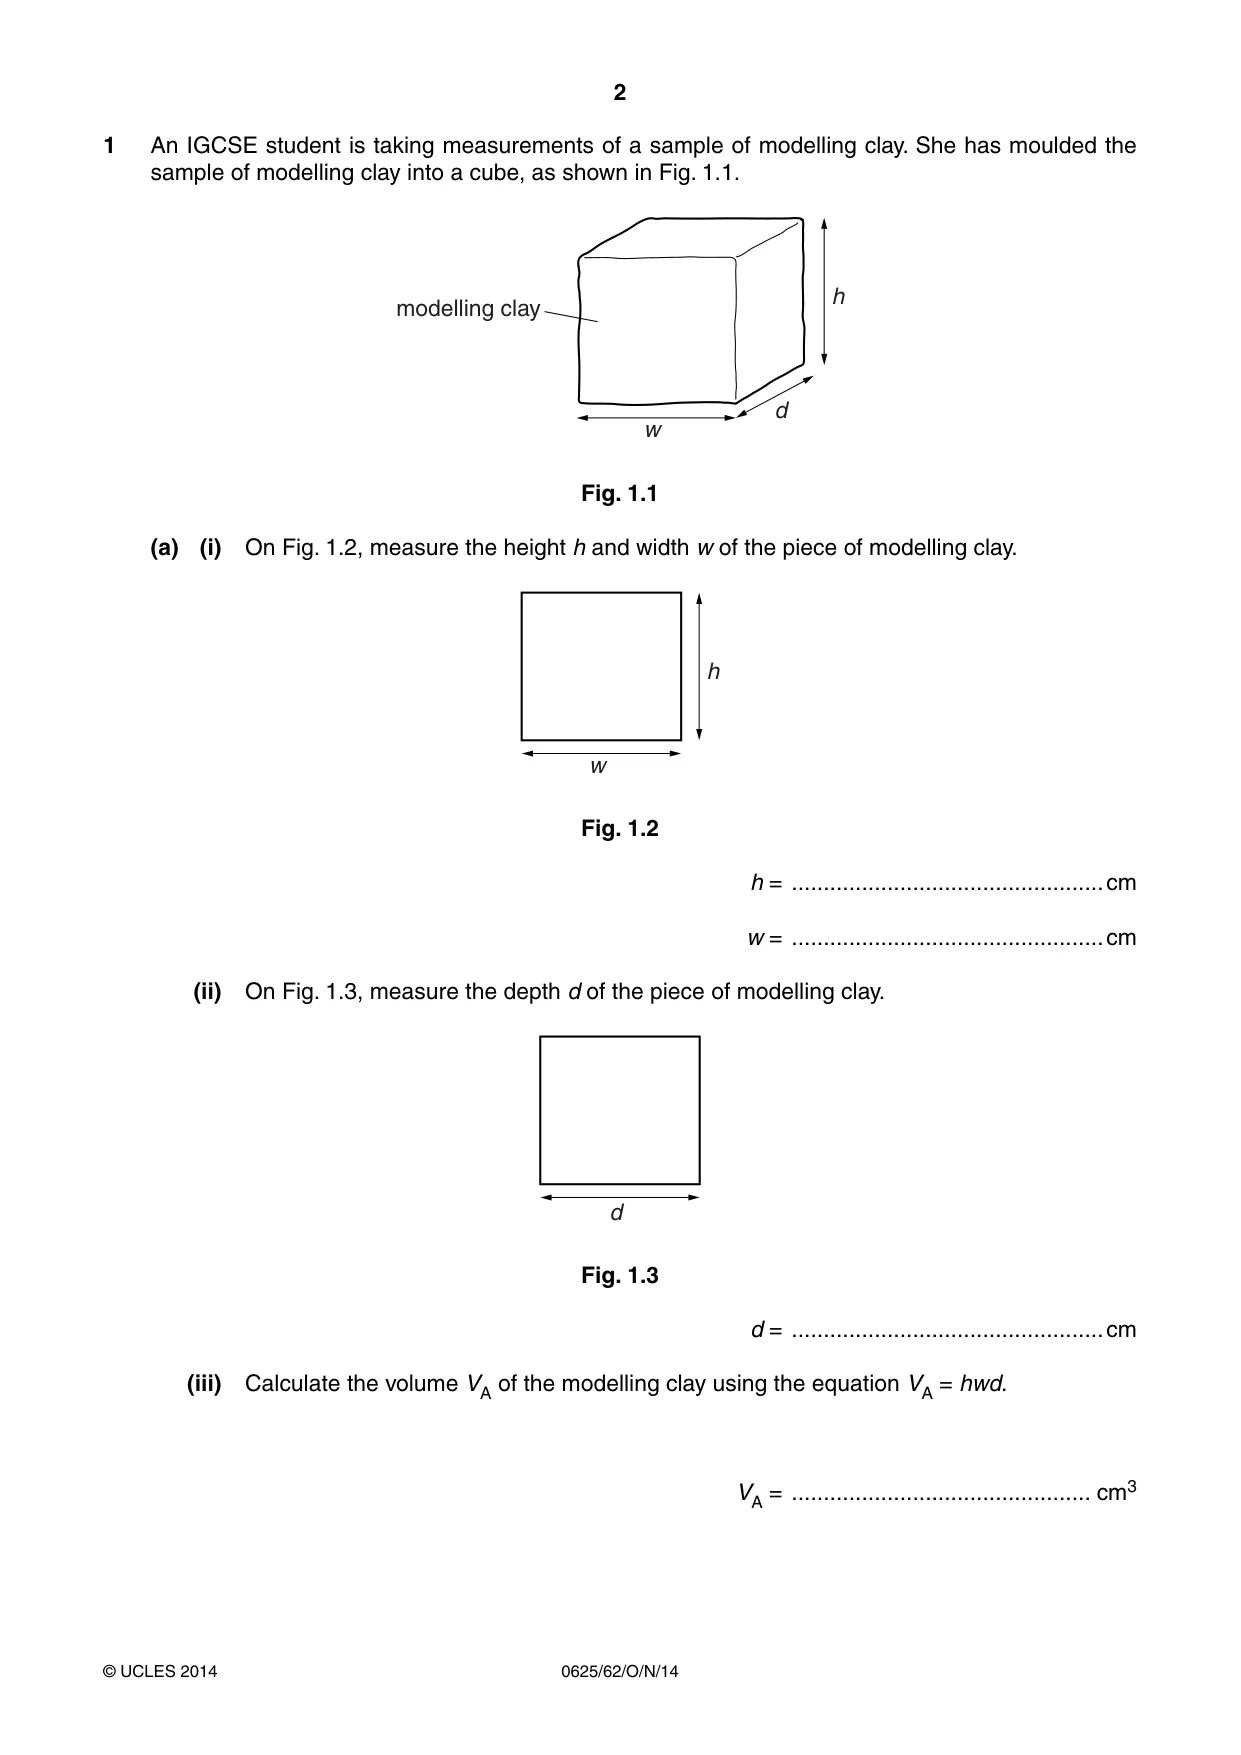
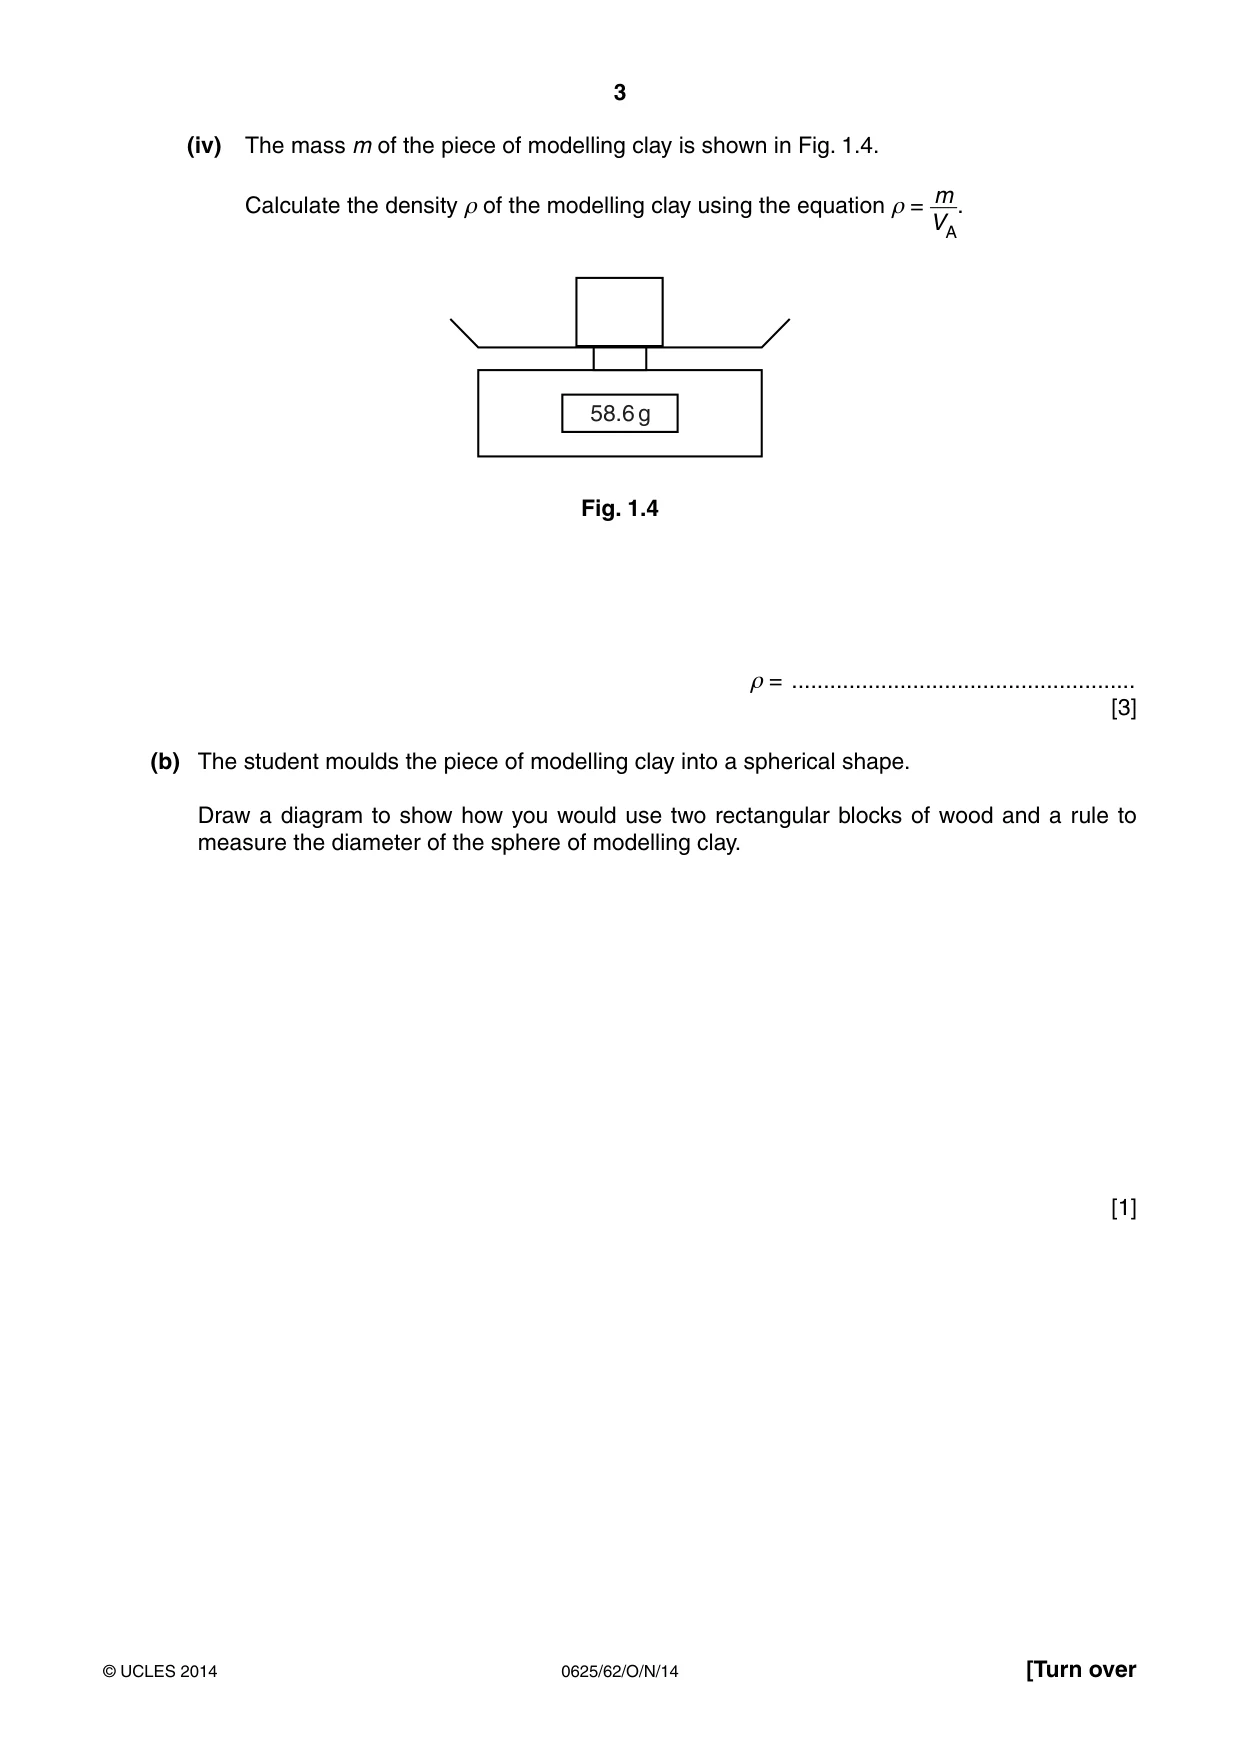
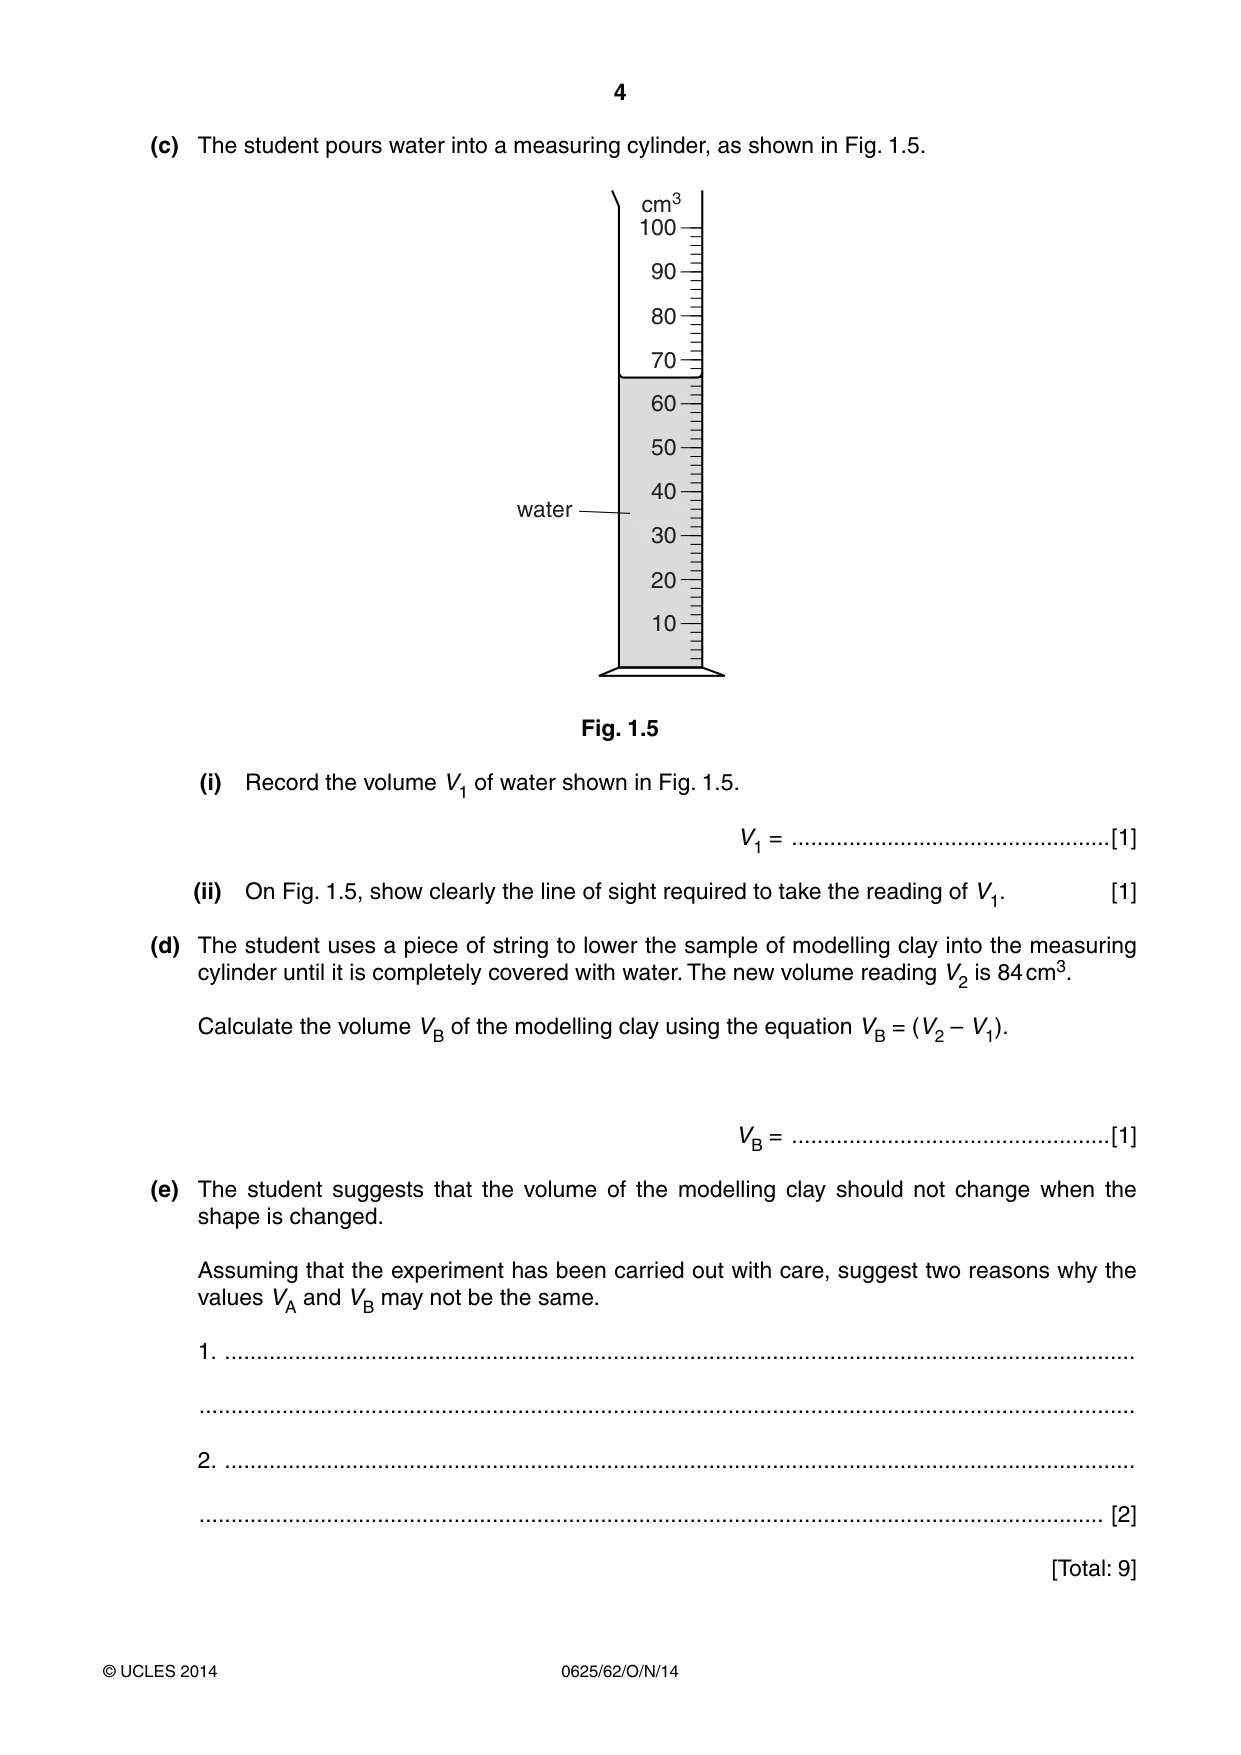
1 An IGCSE student is taking measurements of a sample of modelling clay. She has moulded the sample of modelling clay into a cube, as shown in Fig. 1.1. h modelling clay d w Fig. 1.1 (a) (i) On Fig. 1.2, measure the height h and width w of the piece of modelling clay. h w Fig. 1.2 h = .................................................cm w = .................................................cm (ii) On Fig. 1.3, measure the depth d of the piece of modelling clay. d Fig. 1.3 d = .................................................cm (iii) Calculate the volume VA of the modelling clay using the equation VA = hwd. VA = ............................................... cm3 (iv) The mass m of the piece of modelling clay is shown in Fig. 1.4. m Calculate the density ρ of the modelling clay using the equation ρ = . VA 58.6 g Fig. 1.4 ρ = ...................................................... [3] (b) The student moulds the piece of modelling clay into a spherical shape. Draw a diagram to show how you would use two rectangular blocks of wood and a rule to measure the diameter of the sphere of modelling clay. [1] (c) The student pours water into a measuring cylinder, as shown in Fig. 1.5. cm3 100 90 80 70 60 50 40 water 30 20 10 Fig. 1.5 (i) Record the volume V1 of water shown in Fig. 1.5. V1 = ..................................................[1] (ii) On Fig. 1.5, show clearly the line of sight required to take the reading of V1. [1] (d) The student uses a piece of string to lower the sample of modelling clay into the measuring cylinder until it is completely covered with water. The new volume reading V2 is 84 cm3. Calculate the volume VB of the modelling clay using the equation VB = (V2 – V1). VB = ..................................................[1] (e) The student suggests that the volume of the modelling clay should not change when the shape is changed. Assuming that the experiment has been carried out with care, suggest two reasons why the values VA and VB may not be the same. 1. ............................................................................................................................................... ................................................................................................................................................... 2. ............................................................................................................................................... .............................................................................................................................................. [2] [Total: 9]
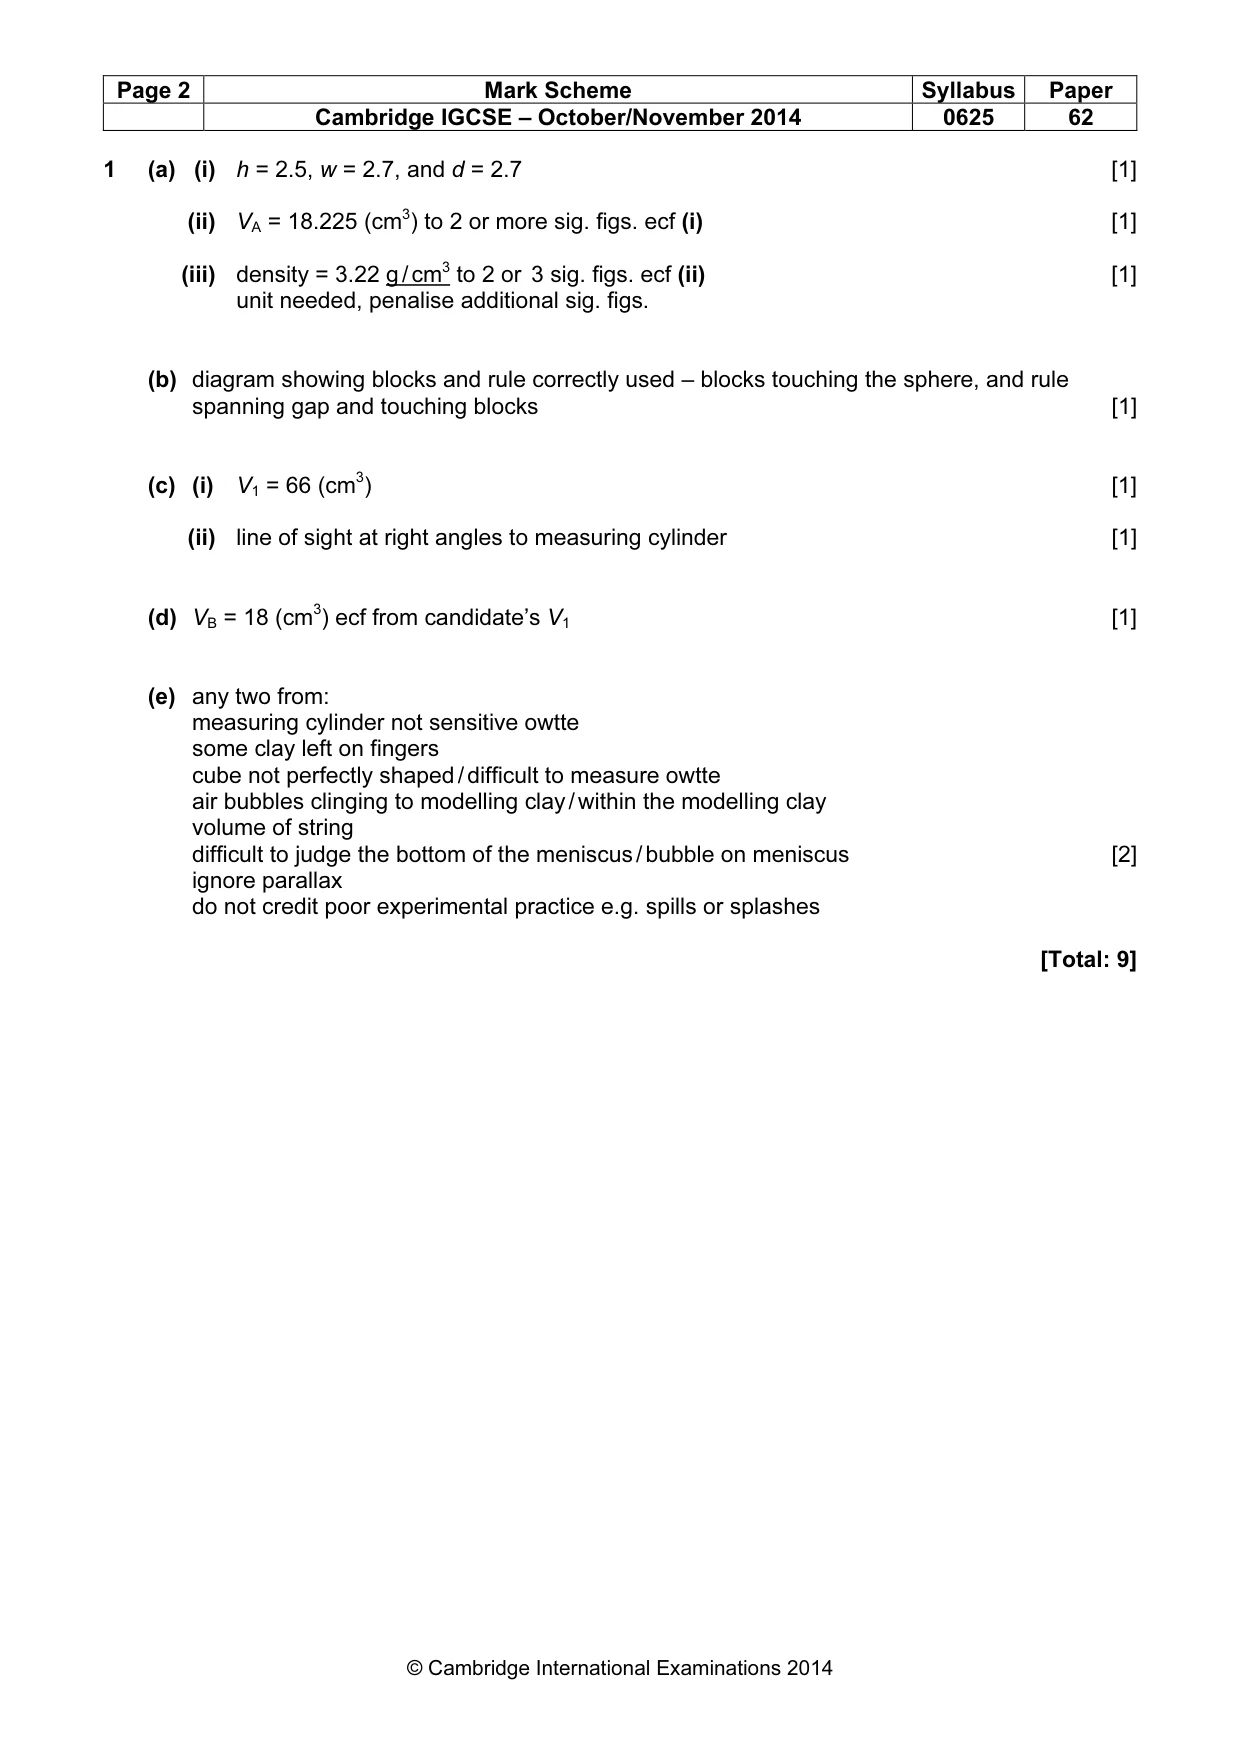
Mark scheme: 1 (a) (i) h = 2.5, w = 2.7, and d = 2.7 [1] (ii) VA = 18.225 (cm3) to 2 or more sig. figs. ecf (i) [1] (iii) density = 3.22 g / cm3 to 2 or 3 sig. figs. ecf (ii) [1] unit needed, penalise additional sig. figs. (b) diagram showing blocks and rule correctly used – blocks touching the sphere, and rule spanning gap and touching blocks [1] (c) (i) V1 = 66 (cm3) [1] (ii) line of sight at right angles to measuring cylinder [1] (d) VB = 18 (cm3) ecf from candidate’s V1 [1] (e) any two from: measuring cylinder not sensitive owtte some clay left on fingers cube not perfectly shaped / difficult to measure owtte air bubbles clinging to modelling clay / within the modelling clay volume of string difficult to judge the bottom of the meniscus / bubble on meniscus [2] ignore parallax do not credit poor experimental practice e.g. spills or splashes [Total: 9]
Q2 · The IGCSE class is investigating the cooling of hot water as cold water is added
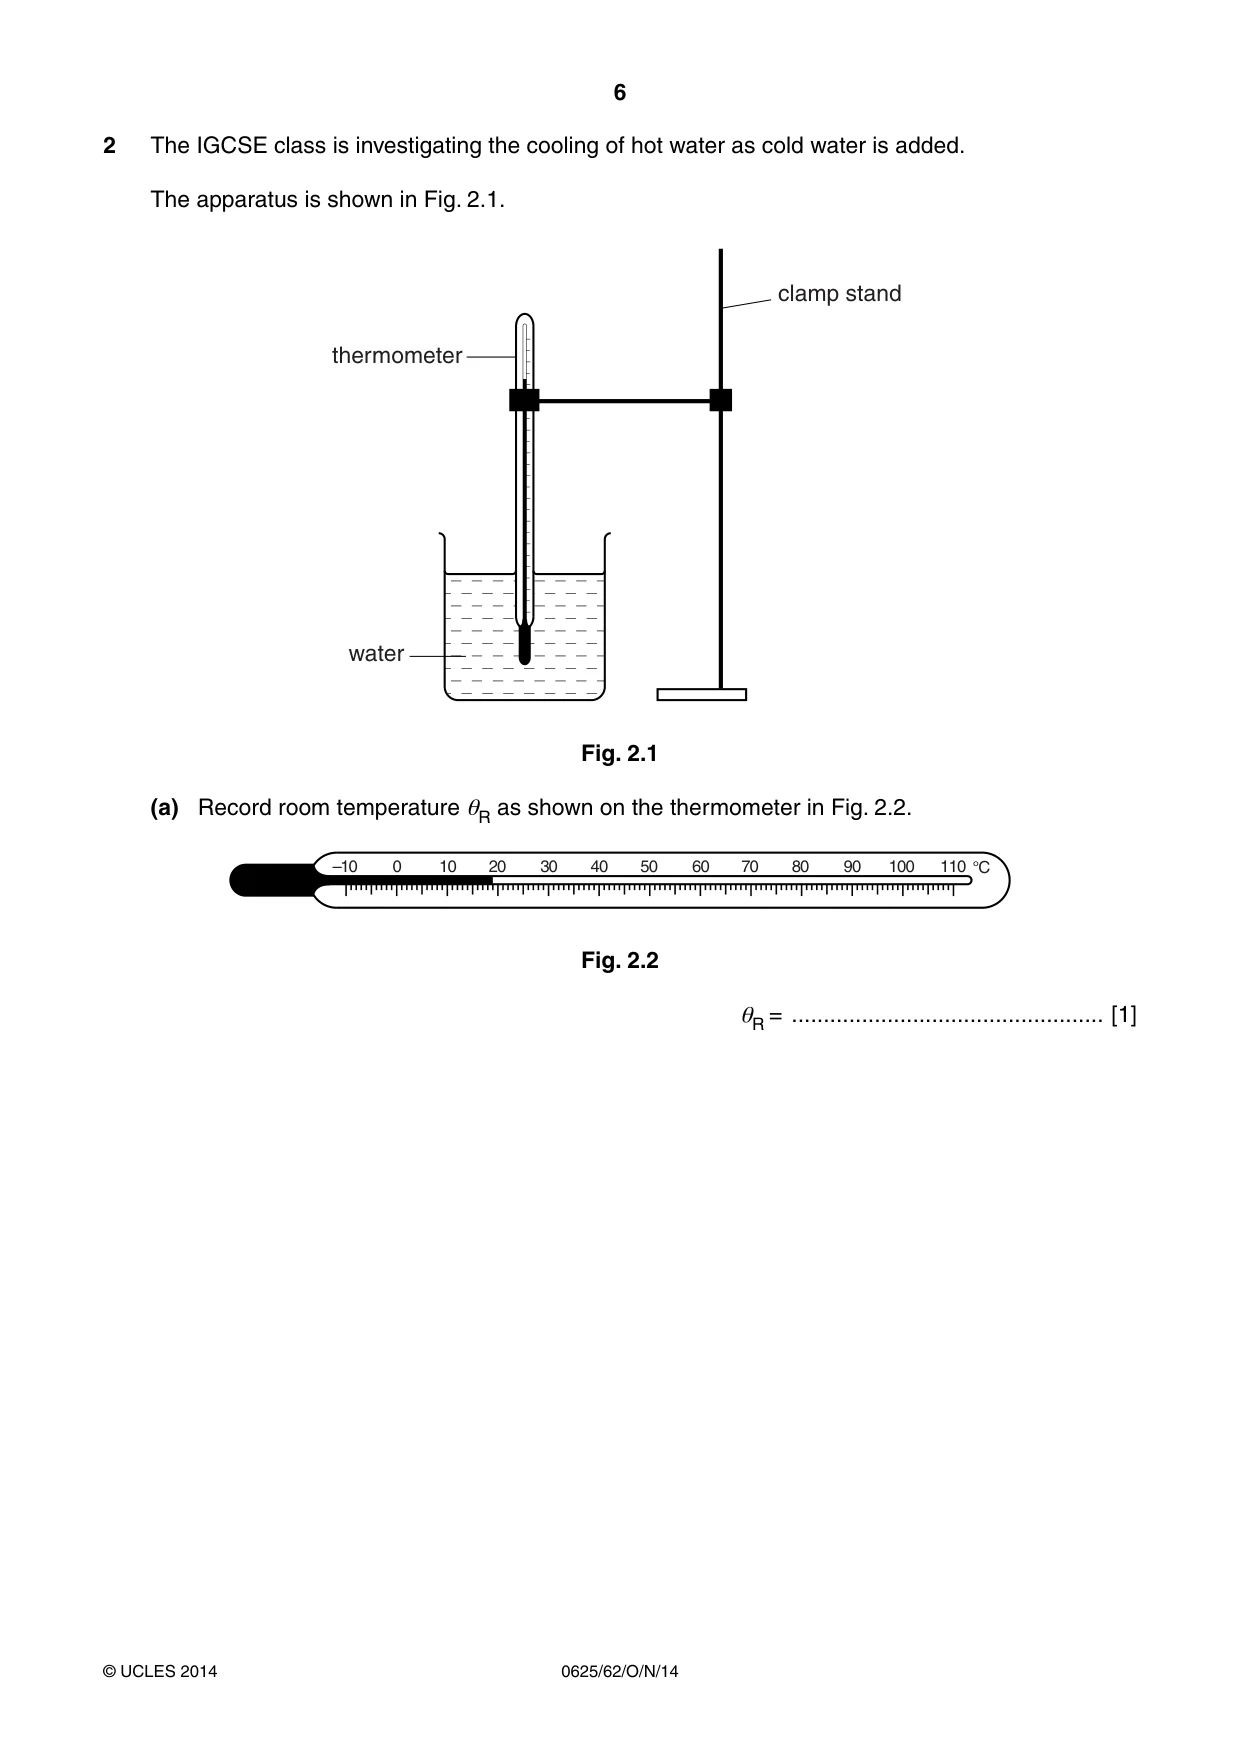
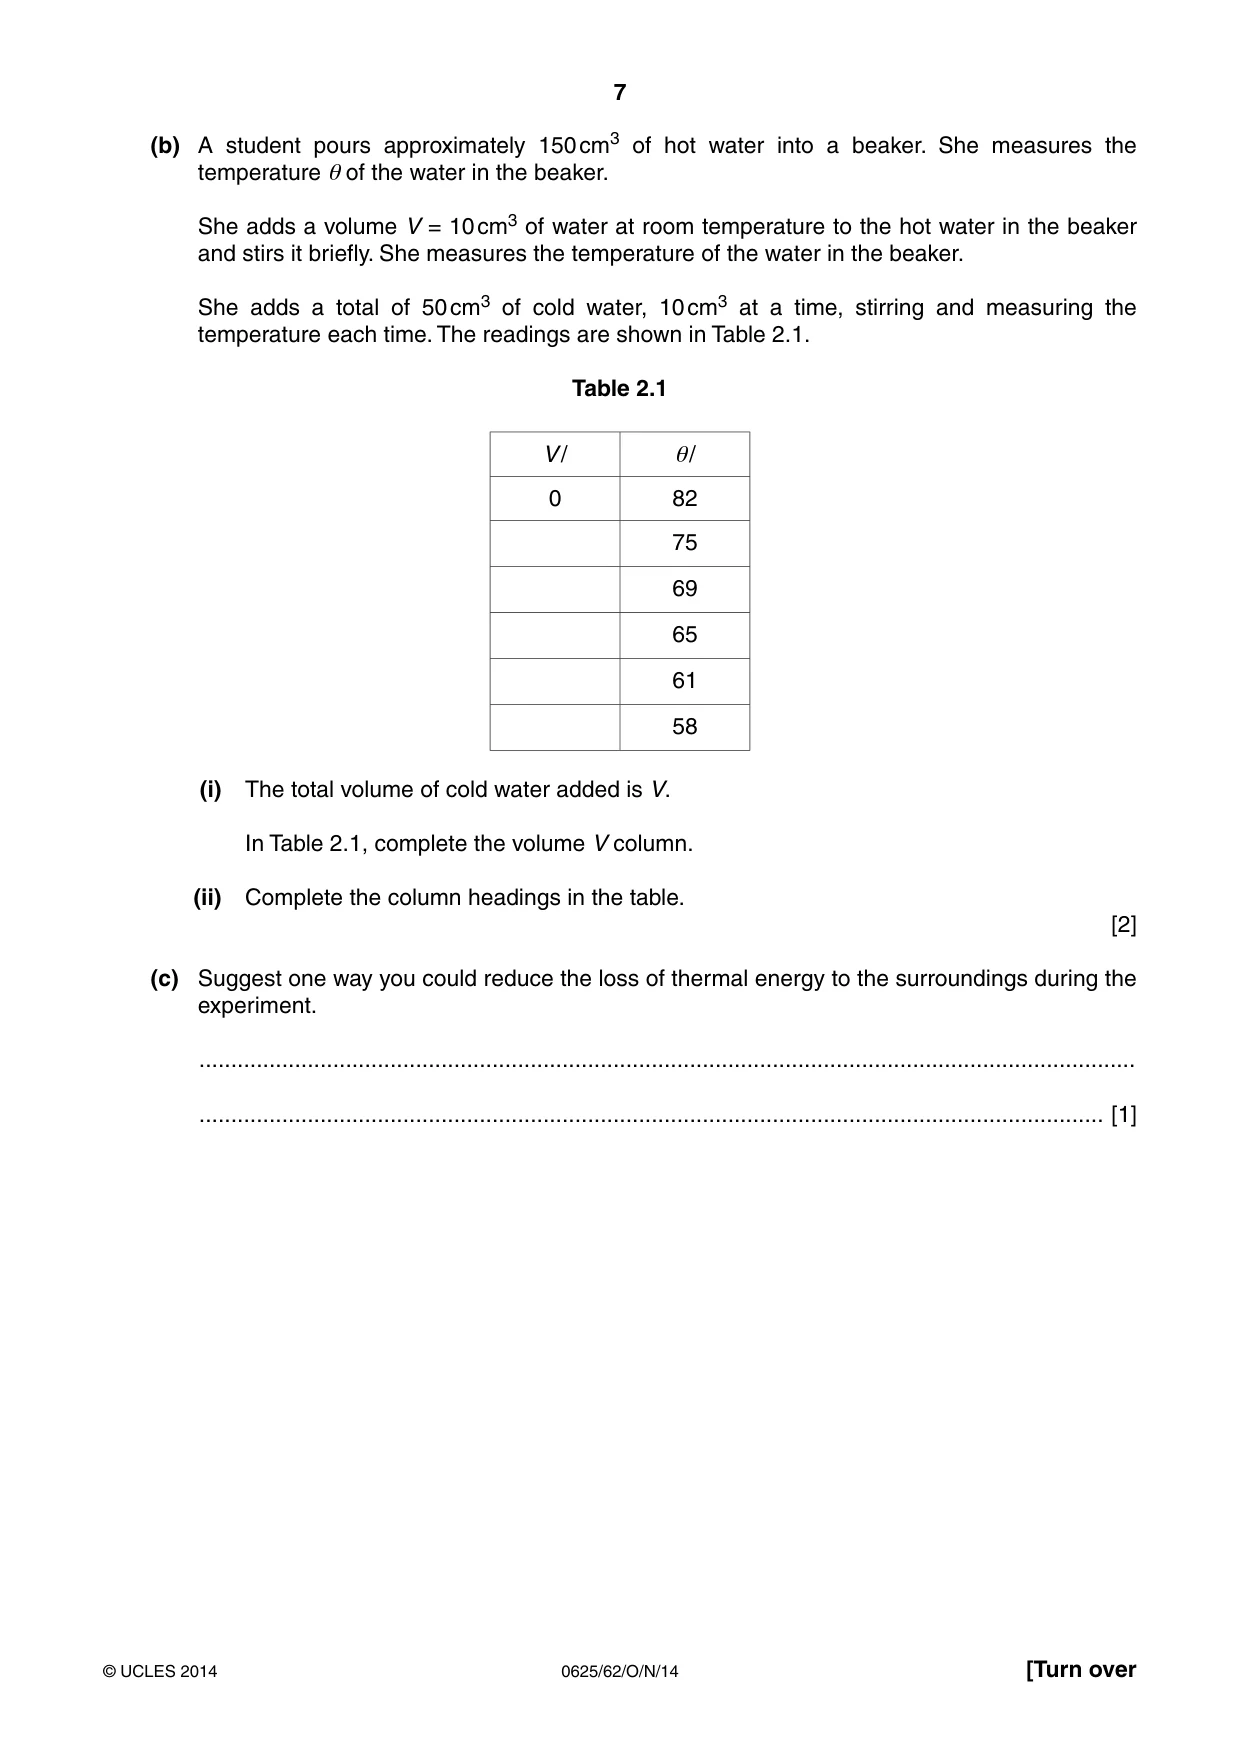
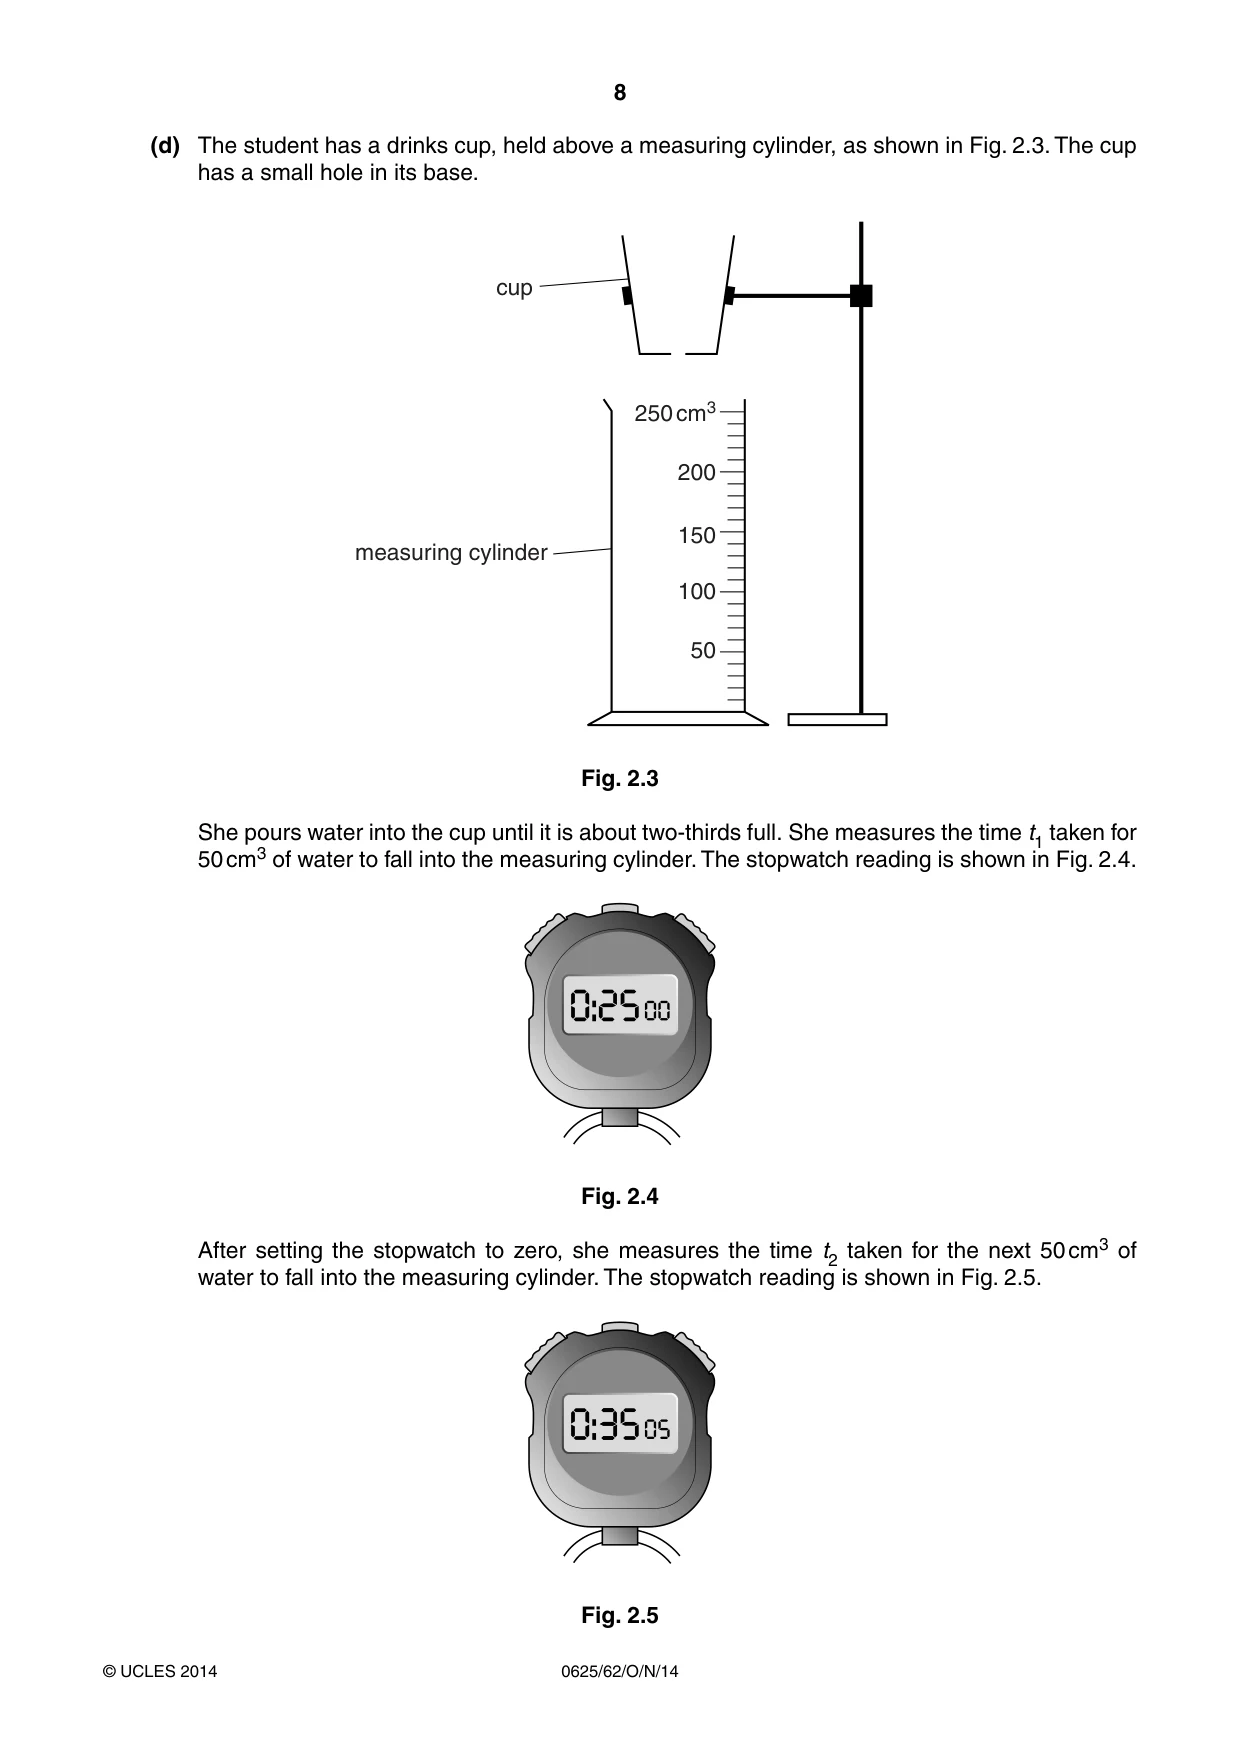
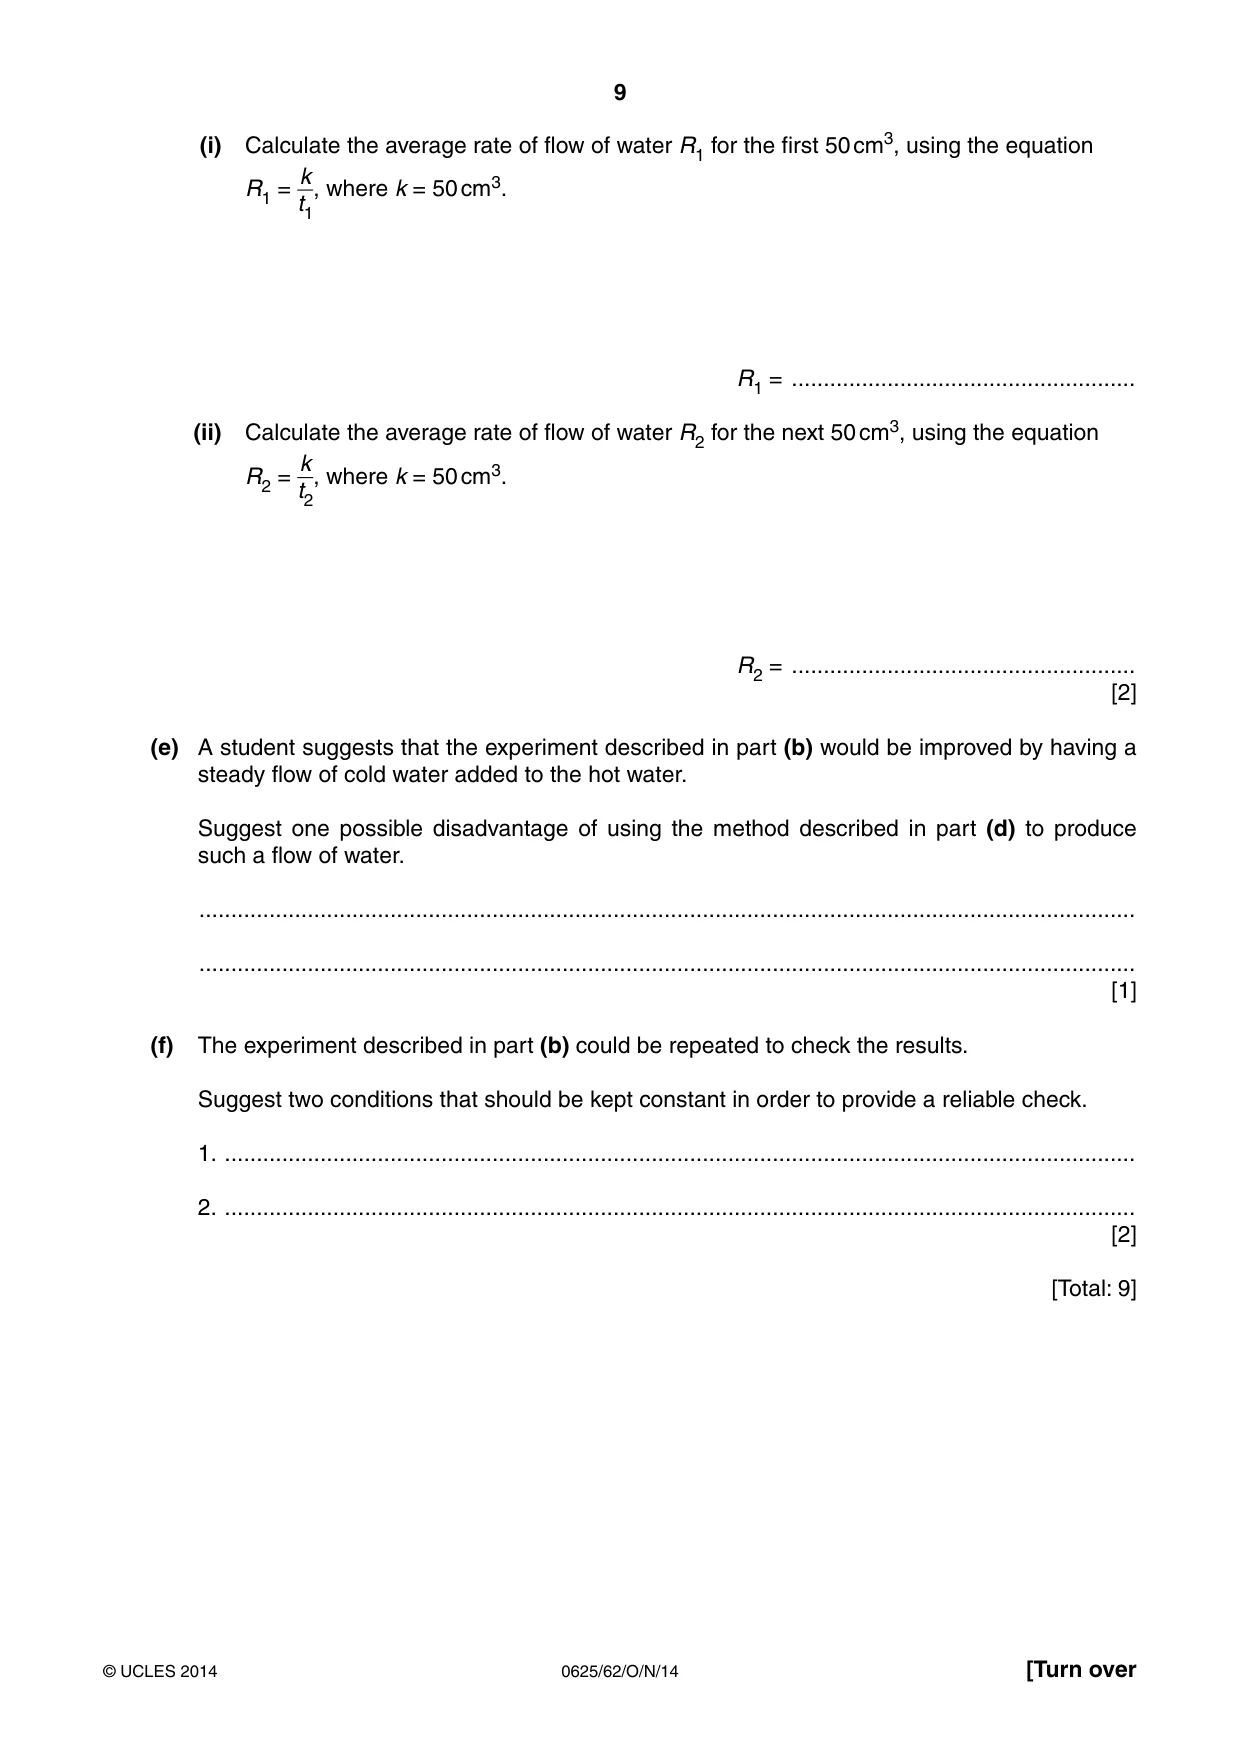
2 The IGCSE class is investigating the cooling of hot water as cold water is added. The apparatus is shown in Fig. 2.1. clamp stand thermometer water Fig. 2.1 (a) Record room temperature θR as shown on the thermometer in Fig. 2.2. –10 0 10 20 30 40 50 60 70 80 90 100 110 °C Fig. 2.2 θR = ................................................. [1] (b) A student pours approximately 150 cm3 of hot water into a beaker. She measures the temperature θ of the water in the beaker. She adds a volume V = 10 cm3 of water at room temperature to the hot water in the beaker and stirs it briefly. She measures the temperature of the water in the beaker. She adds a total of 50 cm3 of cold water, 10 cm3 at a time, stirring and measuring the temperature each time. The readings are shown in Table 2.1. Table 2.1 V / θ/ 0 82 75 69 65 61 58 (i) The total volume of cold water added is V. In Table 2.1, complete the volume V column. (ii) Complete the column headings in the table. [2] (c) Suggest one way you could reduce the loss of thermal energy to the surroundings during the experiment. ................................................................................................................................................... .............................................................................................................................................. [1] (d) The student has a drinks cup, held above a measuring cylinder, as shown in Fig. 2.3. The cup has a small hole in its base. cup 250 cm3 200 150 measuring cylinder 100 50 Fig. 2.3 She pours water into the cup until it is about two-thirds full. She measures the time t1 taken for 50 cm3 of water to fall into the measuring cylinder. The stopwatch reading is shown in Fig. 2.4. Fig. 2.4 After setting the stopwatch to zero, she measures the time t2 taken for the next 50 cm3 of water to fall into the measuring cylinder. The stopwatch reading is shown in Fig. 2.5. Fig. 2.5 (i) Calculate the average rate of flow of water R1 for the first 50 cm3, using the equation k R1 = , where k = 50 cm3. t1 R1 = ...................................................... (ii) Calculate the average rate of flow of water R2 for the next 50 cm3, using the equation k R2 = , where k = 50 cm3. t2 R2 = ...................................................... [2] (e) A student suggests that the experiment described in part (b) would be improved by having a steady flow of cold water added to the hot water. Suggest one possible disadvantage of using the method described in part (d) to produce such a flow of water. ................................................................................................................................................... ................................................................................................................................................... [1] (f) The experiment described in part (b) could be repeated to check the results. Suggest two conditions that should be kept constant in order to provide a reliable check. 1. ............................................................................................................................................... 2. ............................................................................................................................................... [2] [Total: 9]
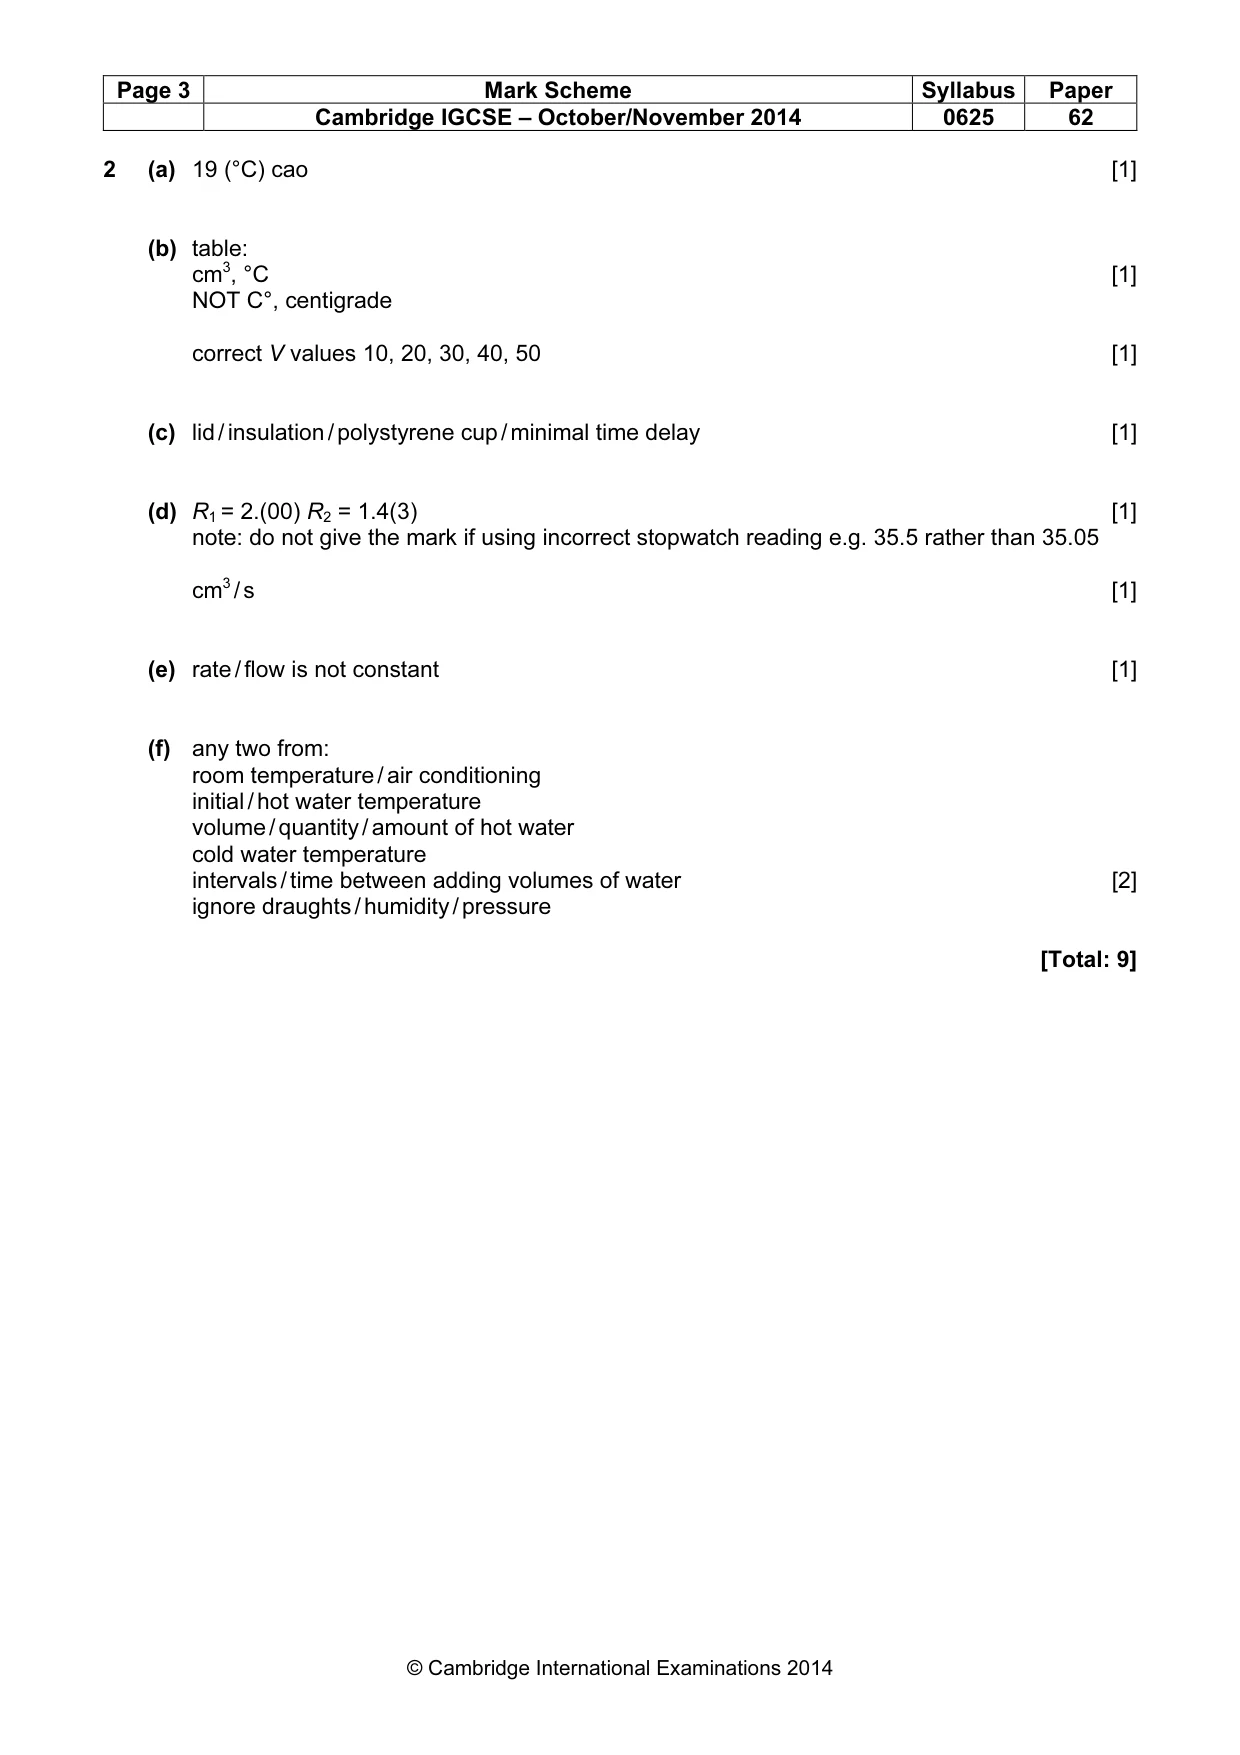
Mark scheme: 2 (a) 19 (°C) cao [1] (b) table: cm3, °C [1] NOT C°, centigrade correct V values 10, 20, 30, 40, 50 [1] (c) lid / insulation / polystyrene cup / minimal time delay [1] (d) R1 = 2.(00) R2 = 1.4(3) [1] note: do not give the mark if using incorrect stopwatch reading e.g. 35.5 rather than 35.05 cm3 / s [1] (e) rate / flow is not constant [1] (f) any two from: room temperature / air conditioning initial / hot water temperature volume / quantity / amount of hot water cold water temperature intervals / time between adding volumes of water [2] ignore draughts / humidity / pressure [Total: 9]
More questions on Physical quantities and measurement techniques
Q3 · The IGCSE class is investigating the resistance of a wire
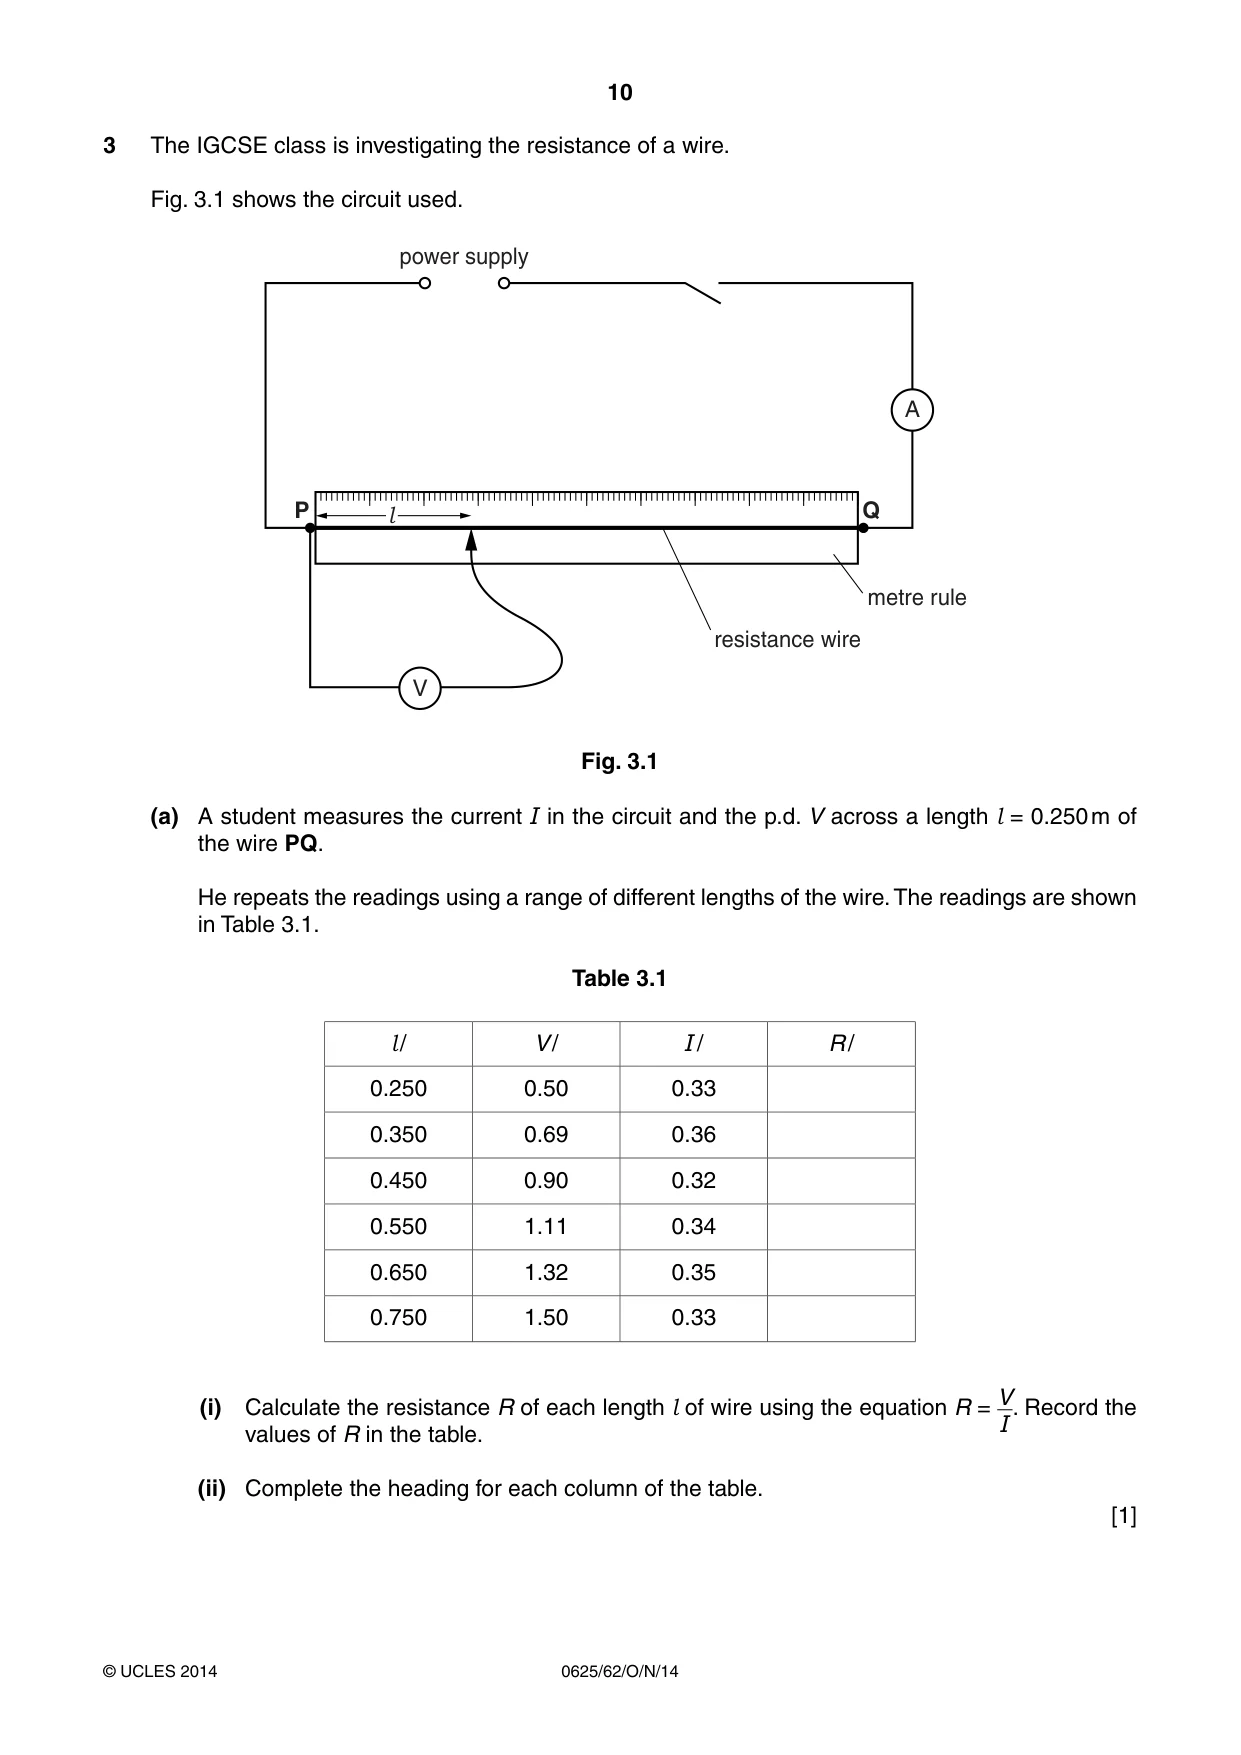
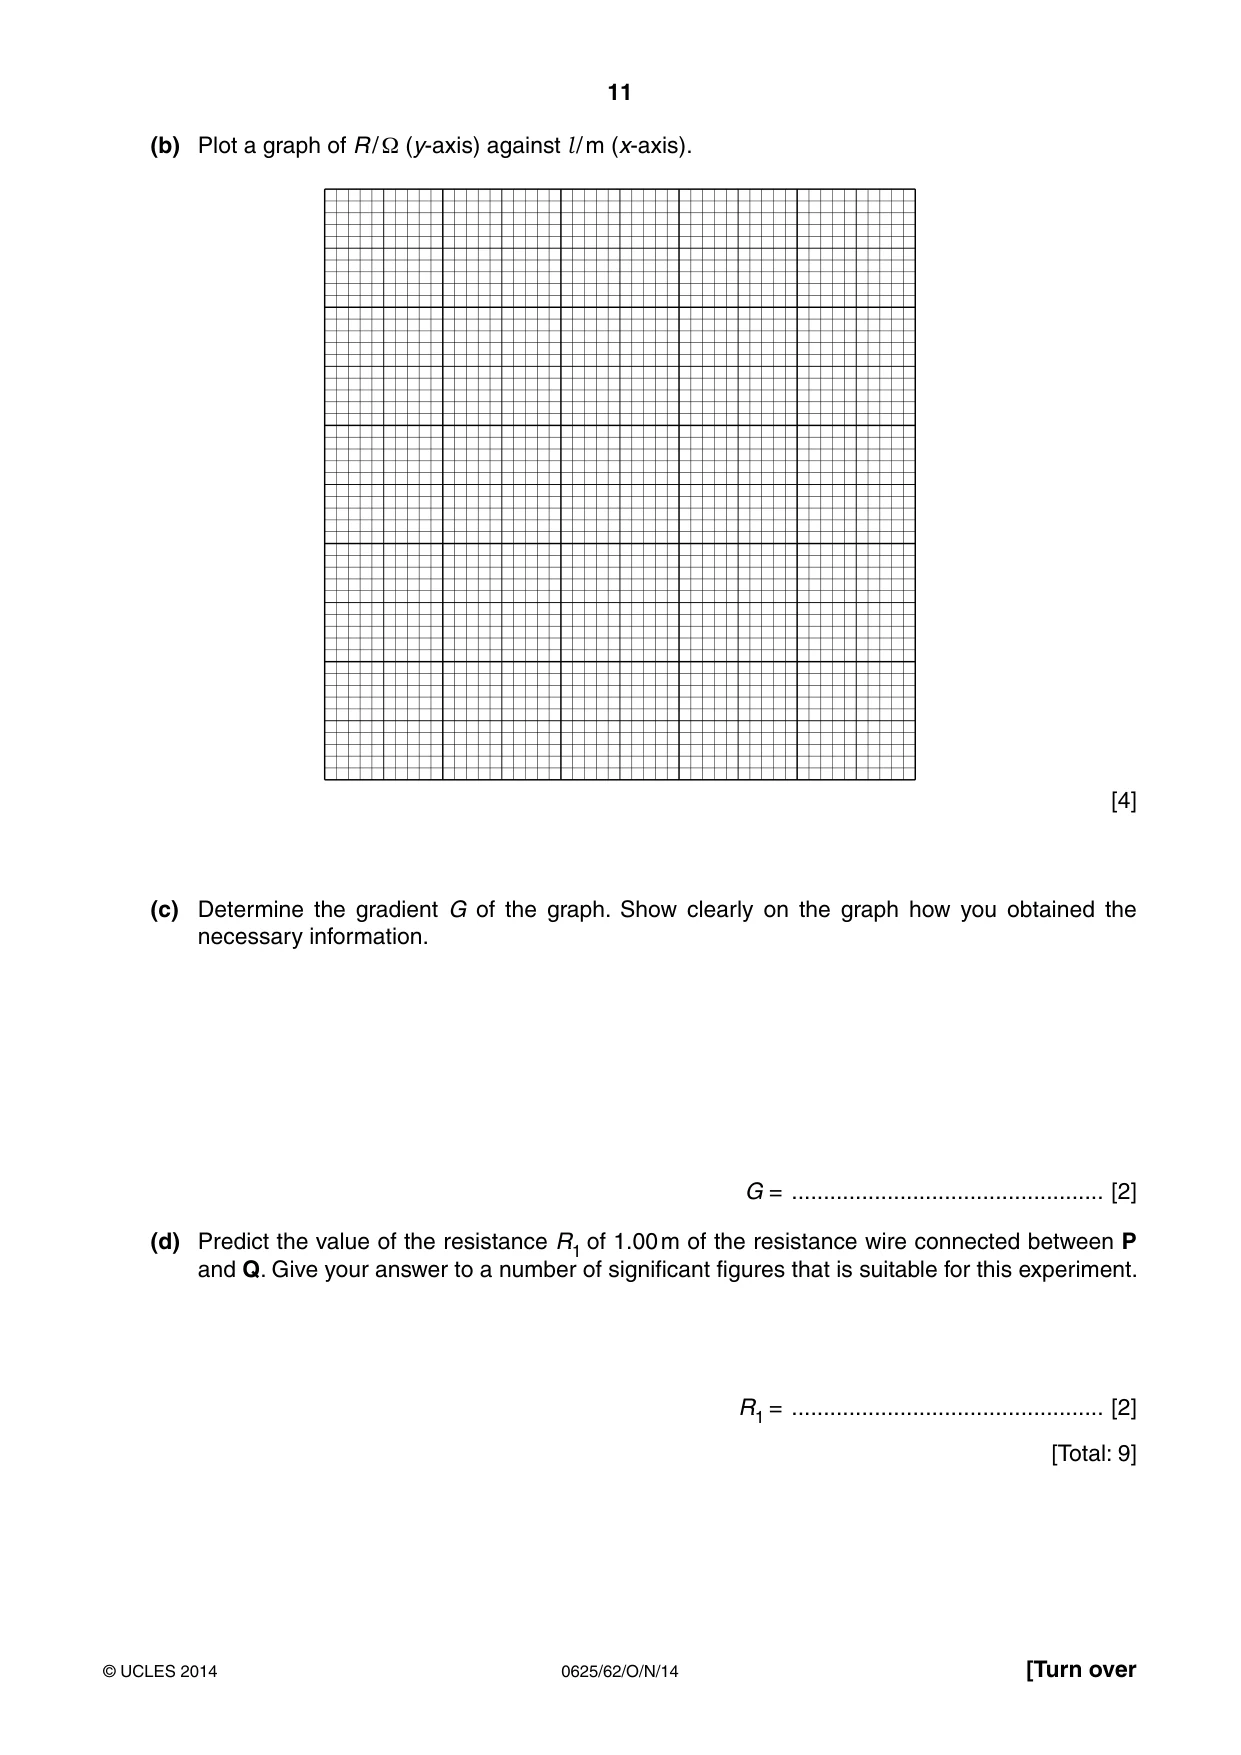
3 The IGCSE class is investigating the resistance of a wire. Fig. 3.1 shows the circuit used. power supply A P l Q metre rule resistance wire V Fig. 3.1 (a) A student measures the current I in the circuit and the p.d. V across a length l = 0.250 m of the wire PQ. He repeats the readings using a range of different lengths of the wire. The readings are shown in Table 3.1. Table 3.1 l / V / I / R / 0.250 0.50 0.33 0.350 0.69 0.36 0.450 0.90 0.32 0.550 1.11 0.34 0.650 1.32 0.35 0.750 1.50 0.33 V (i) Calculate the resistance R of each length l of wire using the equation R = I. Record the values of R in the table. (ii) Complete the heading for each column of the table. [1] (b) Plot a graph of R / Ω (y-axis) against l / m (x-axis). [4] (c) Determine the gradient G of the graph. Show clearly on the graph how you obtained the necessary information. G = ................................................. [2] (d) Predict the value of the resistance R1 of 1.00 m of the resistance wire connected between P and Q. Give your answer to a number of significant figures that is suitable for this experiment. R1 = ................................................. [2] [Total: 9]
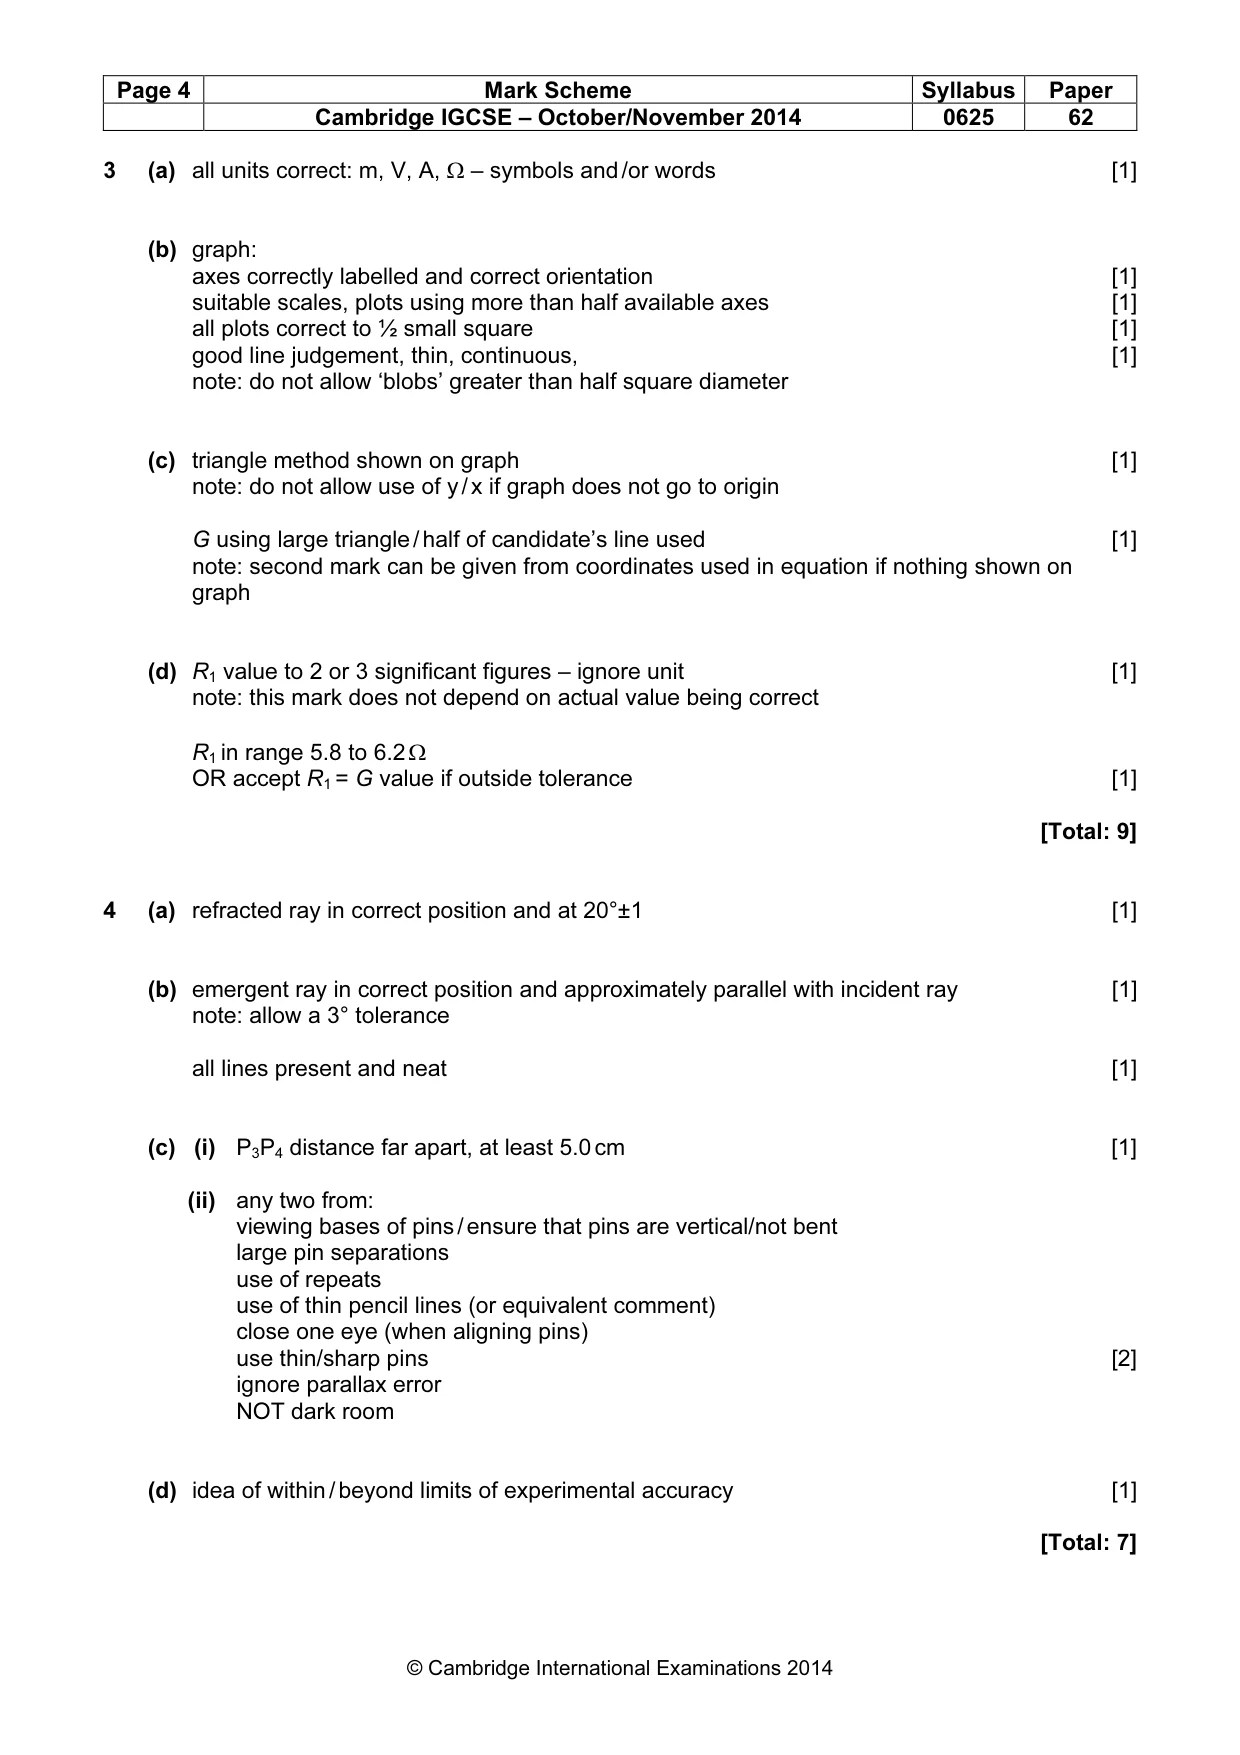
Mark scheme: 3 (a) all units correct: m, V, A, Ω – symbols and /or words [1] (b) graph: axes correctly labelled and correct orientation [1] suitable scales, plots using more than half available axes [1] all plots correct to ½ small square [1] good line judgement, thin, continuous, [1] note: do not allow ‘blobs’ greater than half square diameter (c) triangle method shown on graph [1] note: do not allow use of y / x if graph does not go to origin G using large triangle / half of candidate’s line used [1] note: second mark can be given from coordinates used in equation if nothing shown on graph (d) R1 value to 2 or 3 significant figures – ignore unit [1] note: this mark does not depend on actual value being correct R1 in range 5.8 to 6.2 Ω OR accept R1 = G value if outside tolerance [1] [Total: 9]
Q4 · The IGCSE class is investigating refraction of light through a transparent block
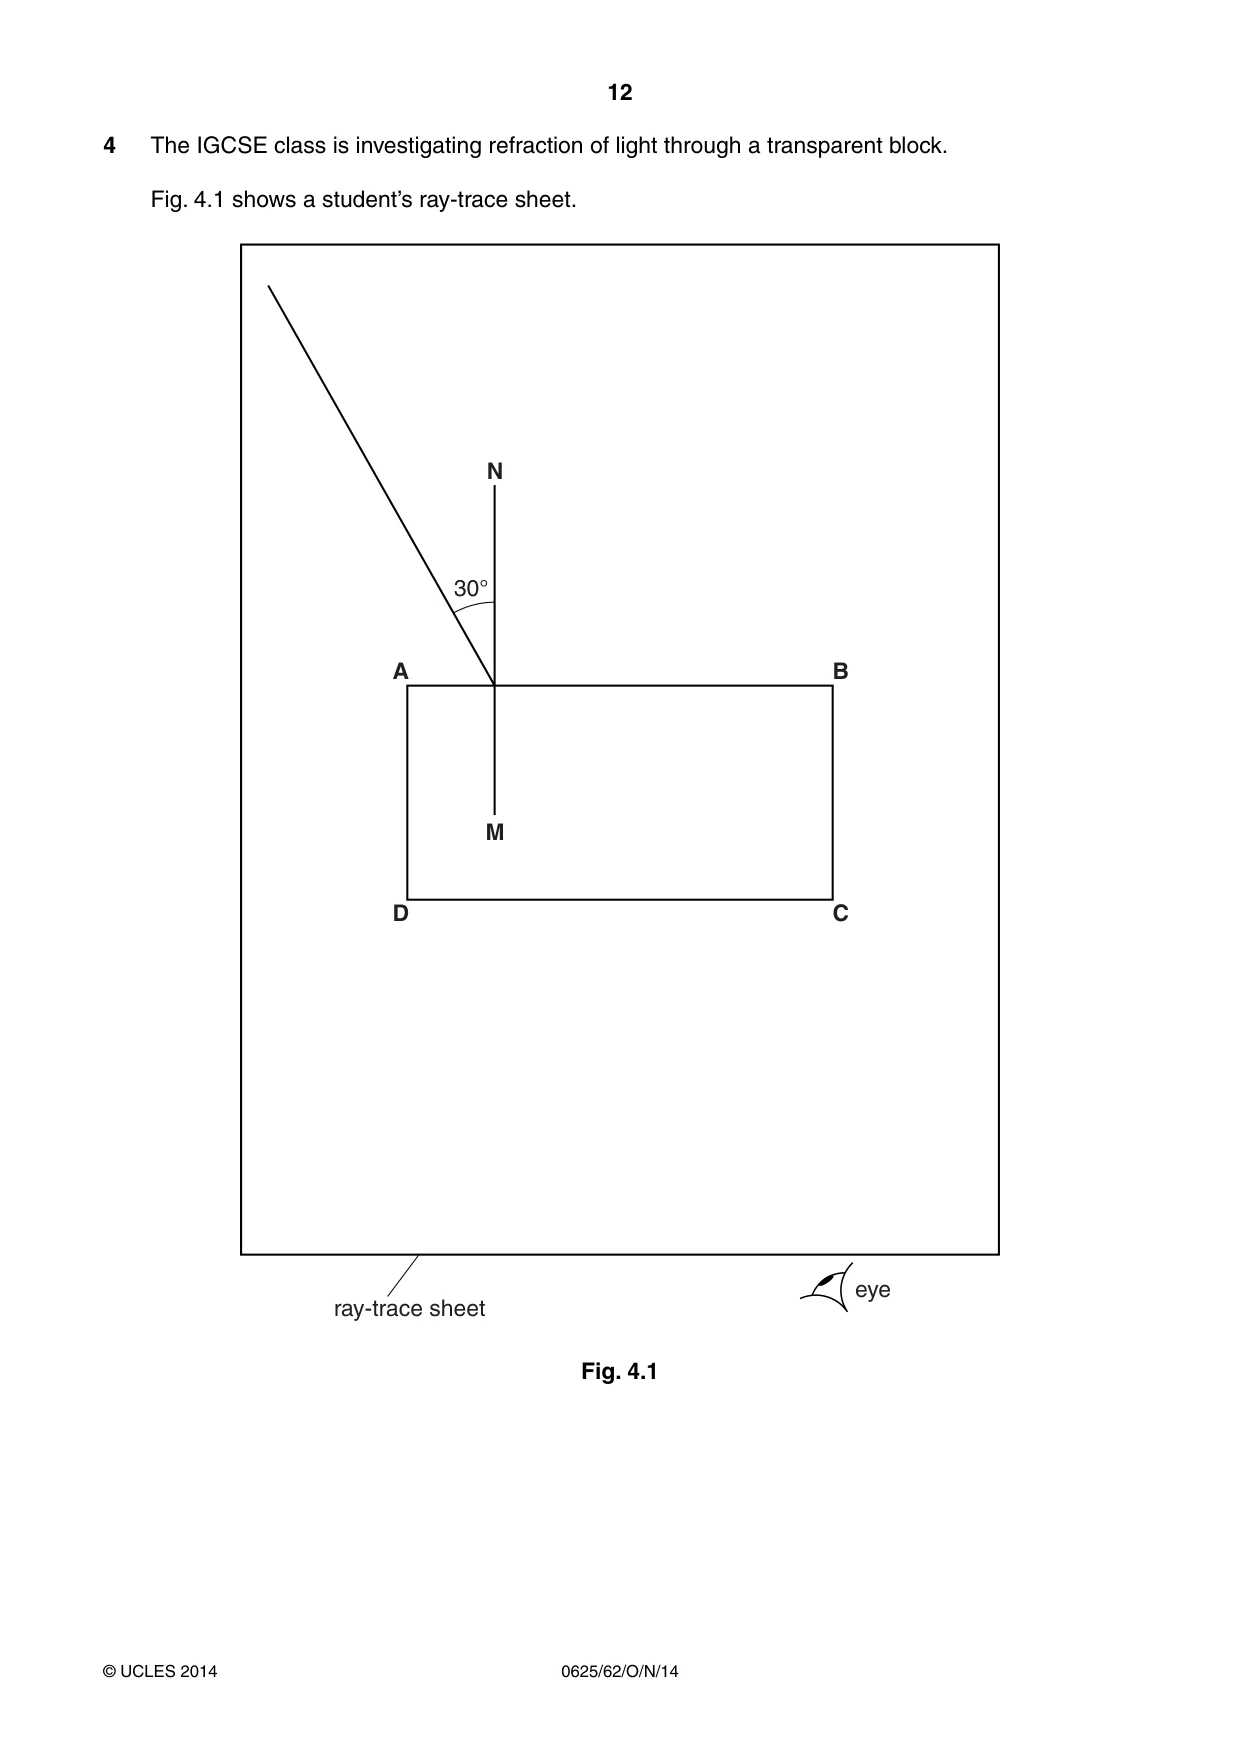
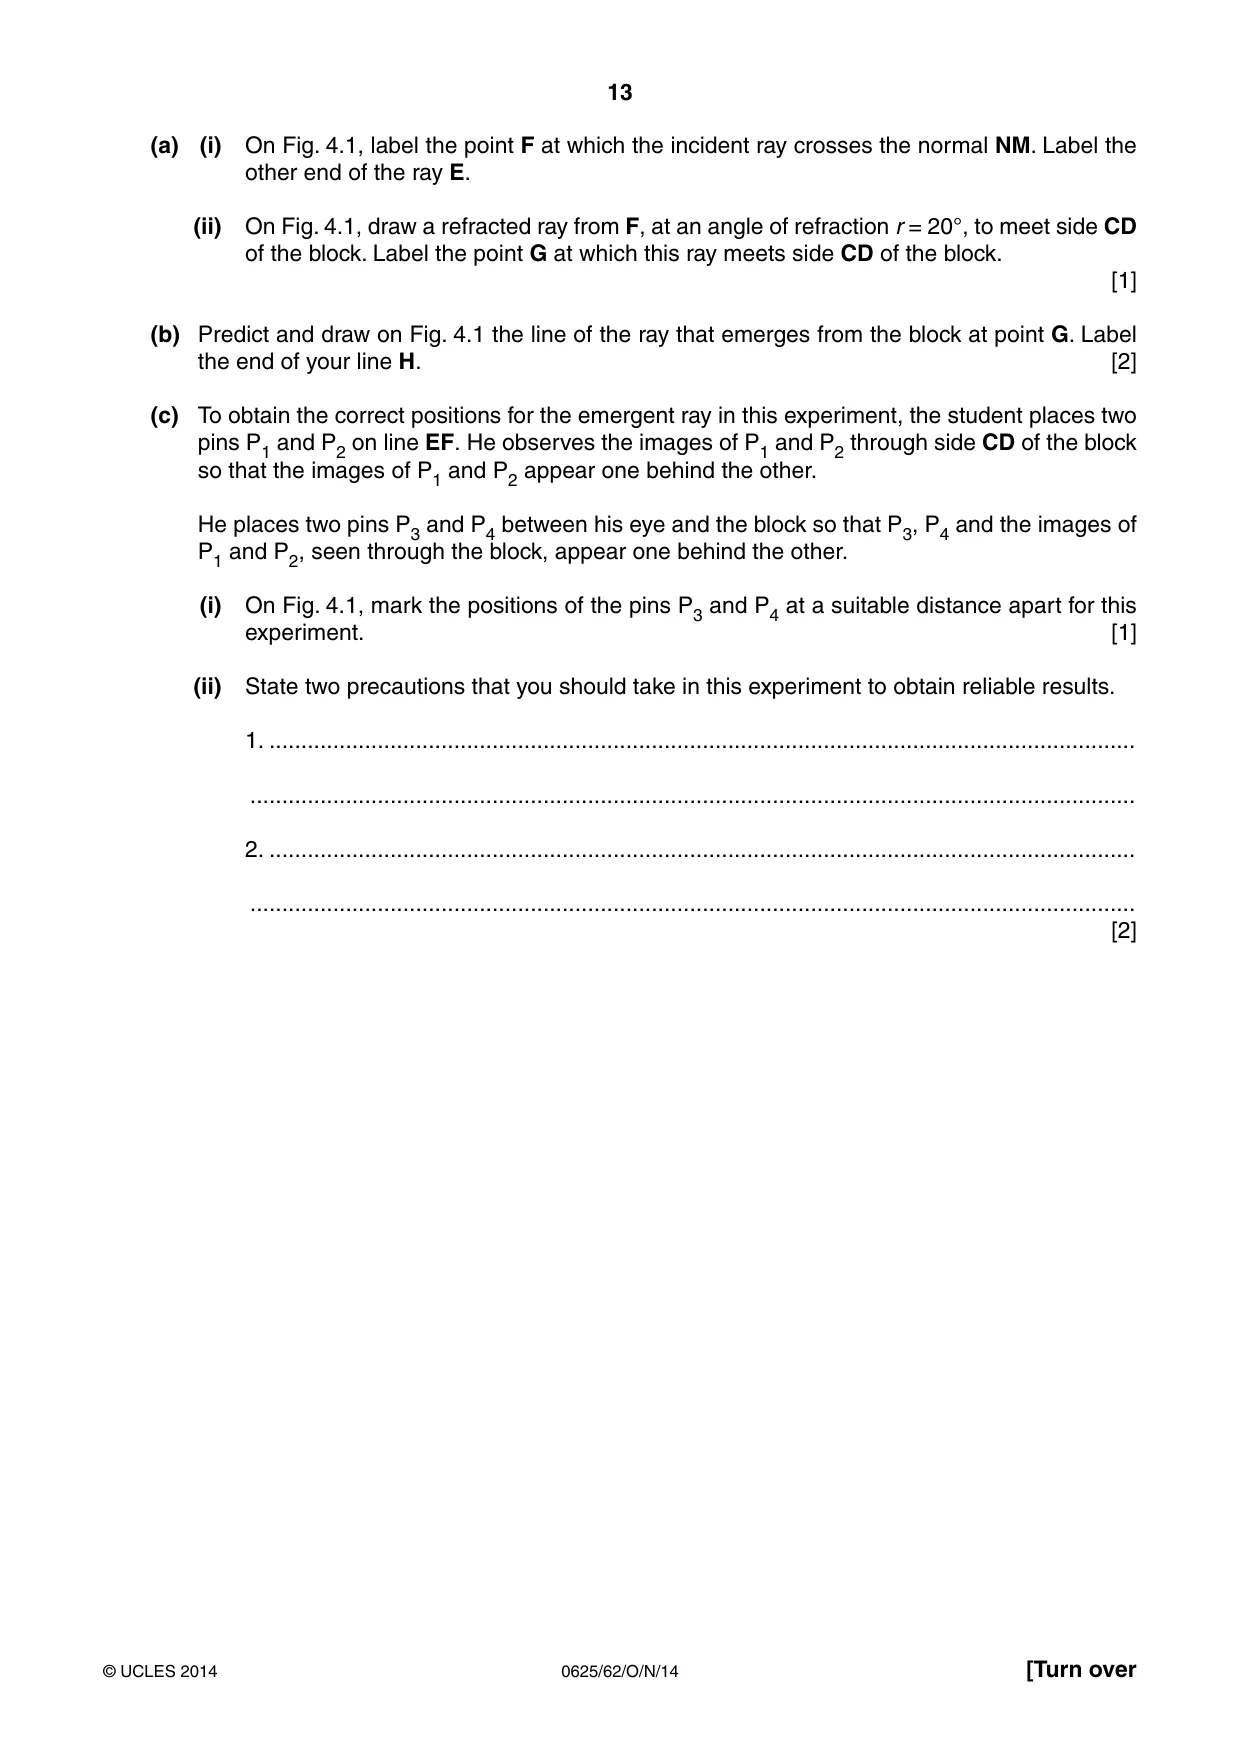
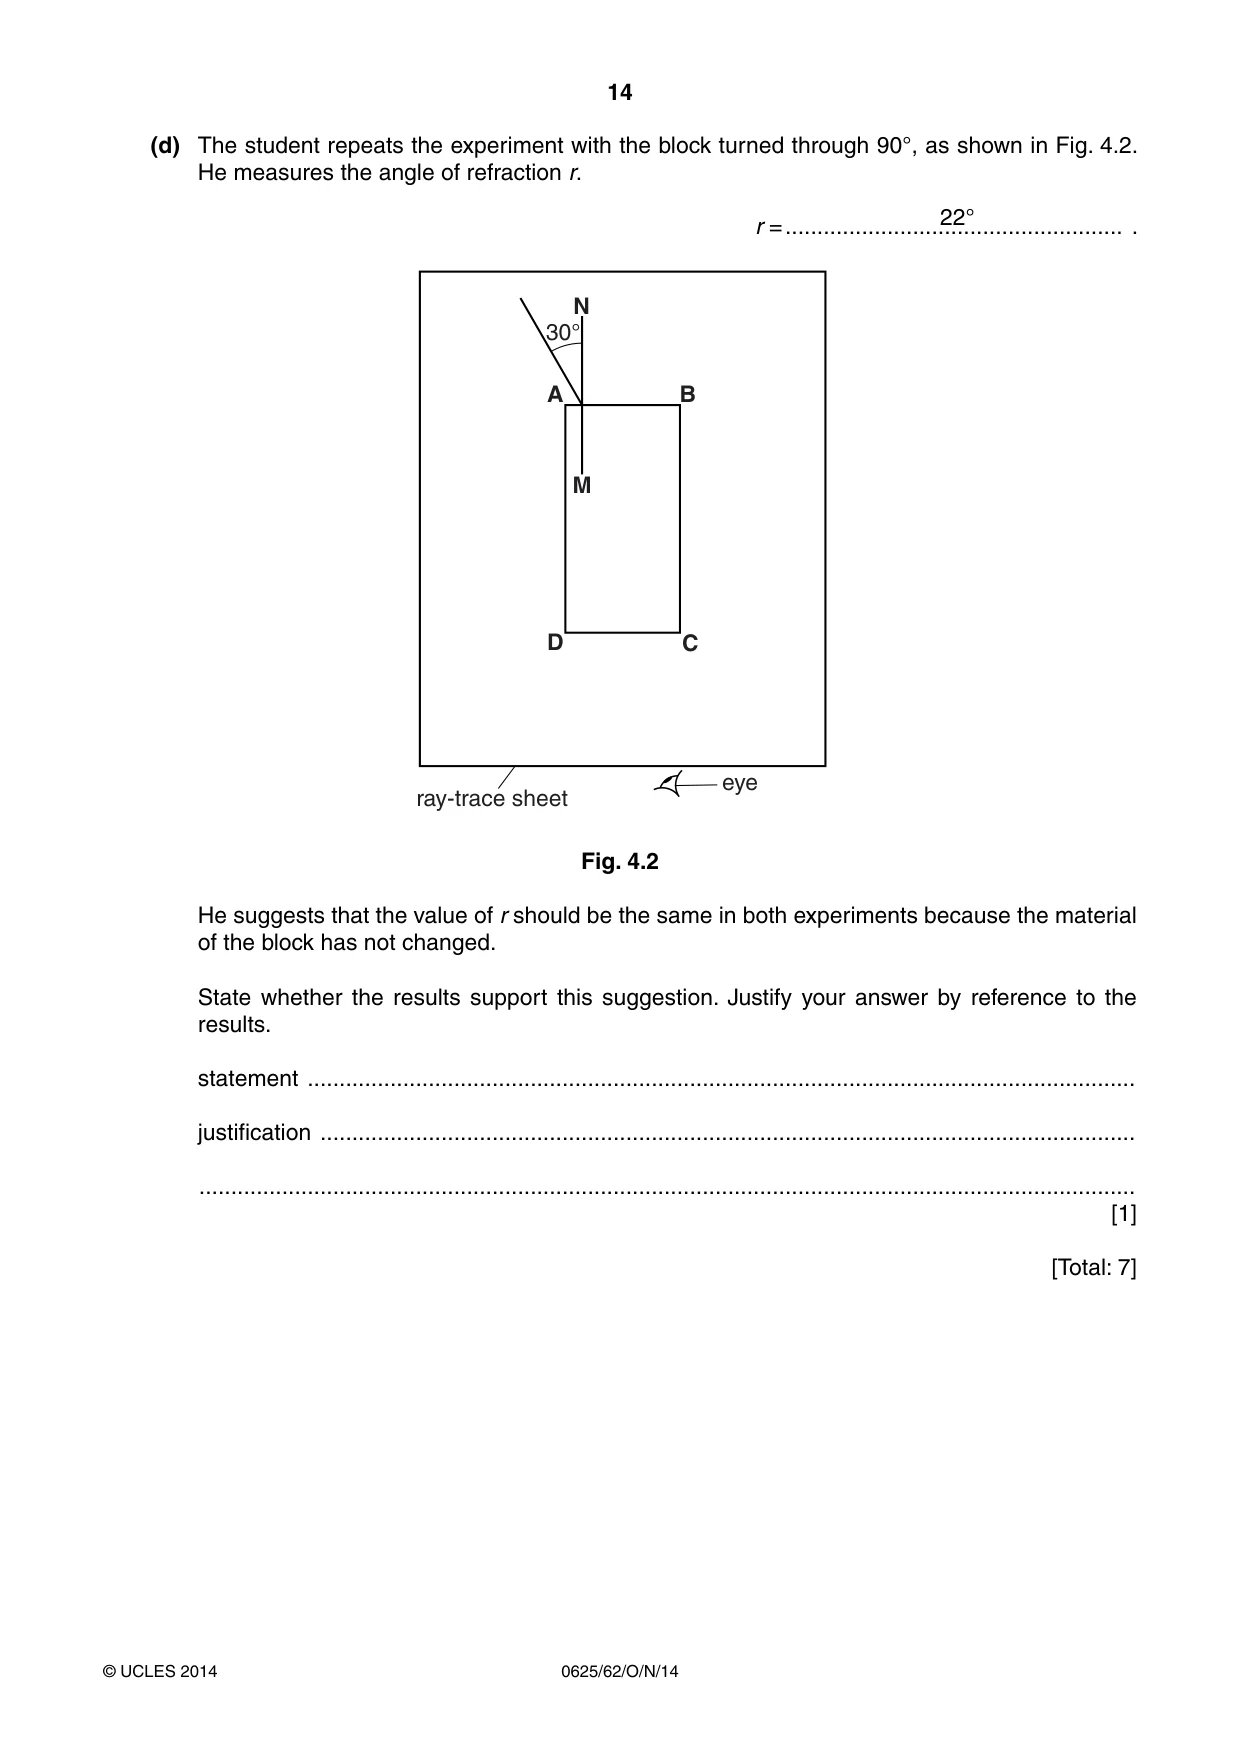
4 The IGCSE class is investigating refraction of light through a transparent block. Fig. 4.1 shows a student’s ray-trace sheet. N 30° A B M D C eye ray-trace sheet Fig. 4.1 (a) (i) On Fig. 4.1, label the point F at which the incident ray crosses the normal NM. Label the other end of the ray E. (ii) On Fig. 4.1, draw a refracted ray from F, at an angle of refraction r = 20°, to meet side CD of the block. Label the point G at which this ray meets side CD of the block. [1] (b) Predict and draw on Fig. 4.1 the line of the ray that emerges from the block at point G. Label the end of your line H. [2] (c) To obtain the correct positions for the emergent ray in this experiment, the student places two pins P1 and P2 on line EF. He observes the images of P1 and P2 through side CD of the block so that the images of P1 and P2 appear one behind the other. He places two pins P3 and P4 between his eye and the block so that P3, P4 and the images of P1 and P2, seen through the block, appear one behind the other. (i) On Fig. 4.1, mark the positions of the pins P3 and P4 at a suitable distance apart for this experiment. [1] (ii) State two precautions that you should take in this experiment to obtain reliable results. 1. ........................................................................................................................................ ........................................................................................................................................... 2. ........................................................................................................................................ ........................................................................................................................................... [2] (d) The student repeats the experiment with the block turned through 90°, as shown in Fig. 4.2. He measures the angle of refraction r. 22° r = ..................................................... . N 30° A B M D C eye ray-trace sheet Fig. 4.2 He suggests that the value of r should be the same in both experiments because the material of the block has not changed. State whether the results support this suggestion. Justify your answer by reference to the results. statement .................................................................................................................................. justification ................................................................................................................................ ................................................................................................................................................... [1] [Total: 7]
Mark scheme: 4 (a) refracted ray in correct position and at 20°±1 [1] (b) emergent ray in correct position and approximately parallel with incident ray [1] note: allow a 3° tolerance all lines present and neat [1] (c) (i) P3P4 distance far apart, at least 5.0 cm [1] (ii) any two from: viewing bases of pins / ensure that pins are vertical/not bent large pin separations use of repeats use of thin pencil lines (or equivalent comment) close one eye (when aligning pins) use thin/sharp pins [2] ignore parallax error NOT dark room (d) idea of within / beyond limits of experimental accuracy [1] [Total: 7]
Q5 · The IGCSE class is investigating the current in copper wires
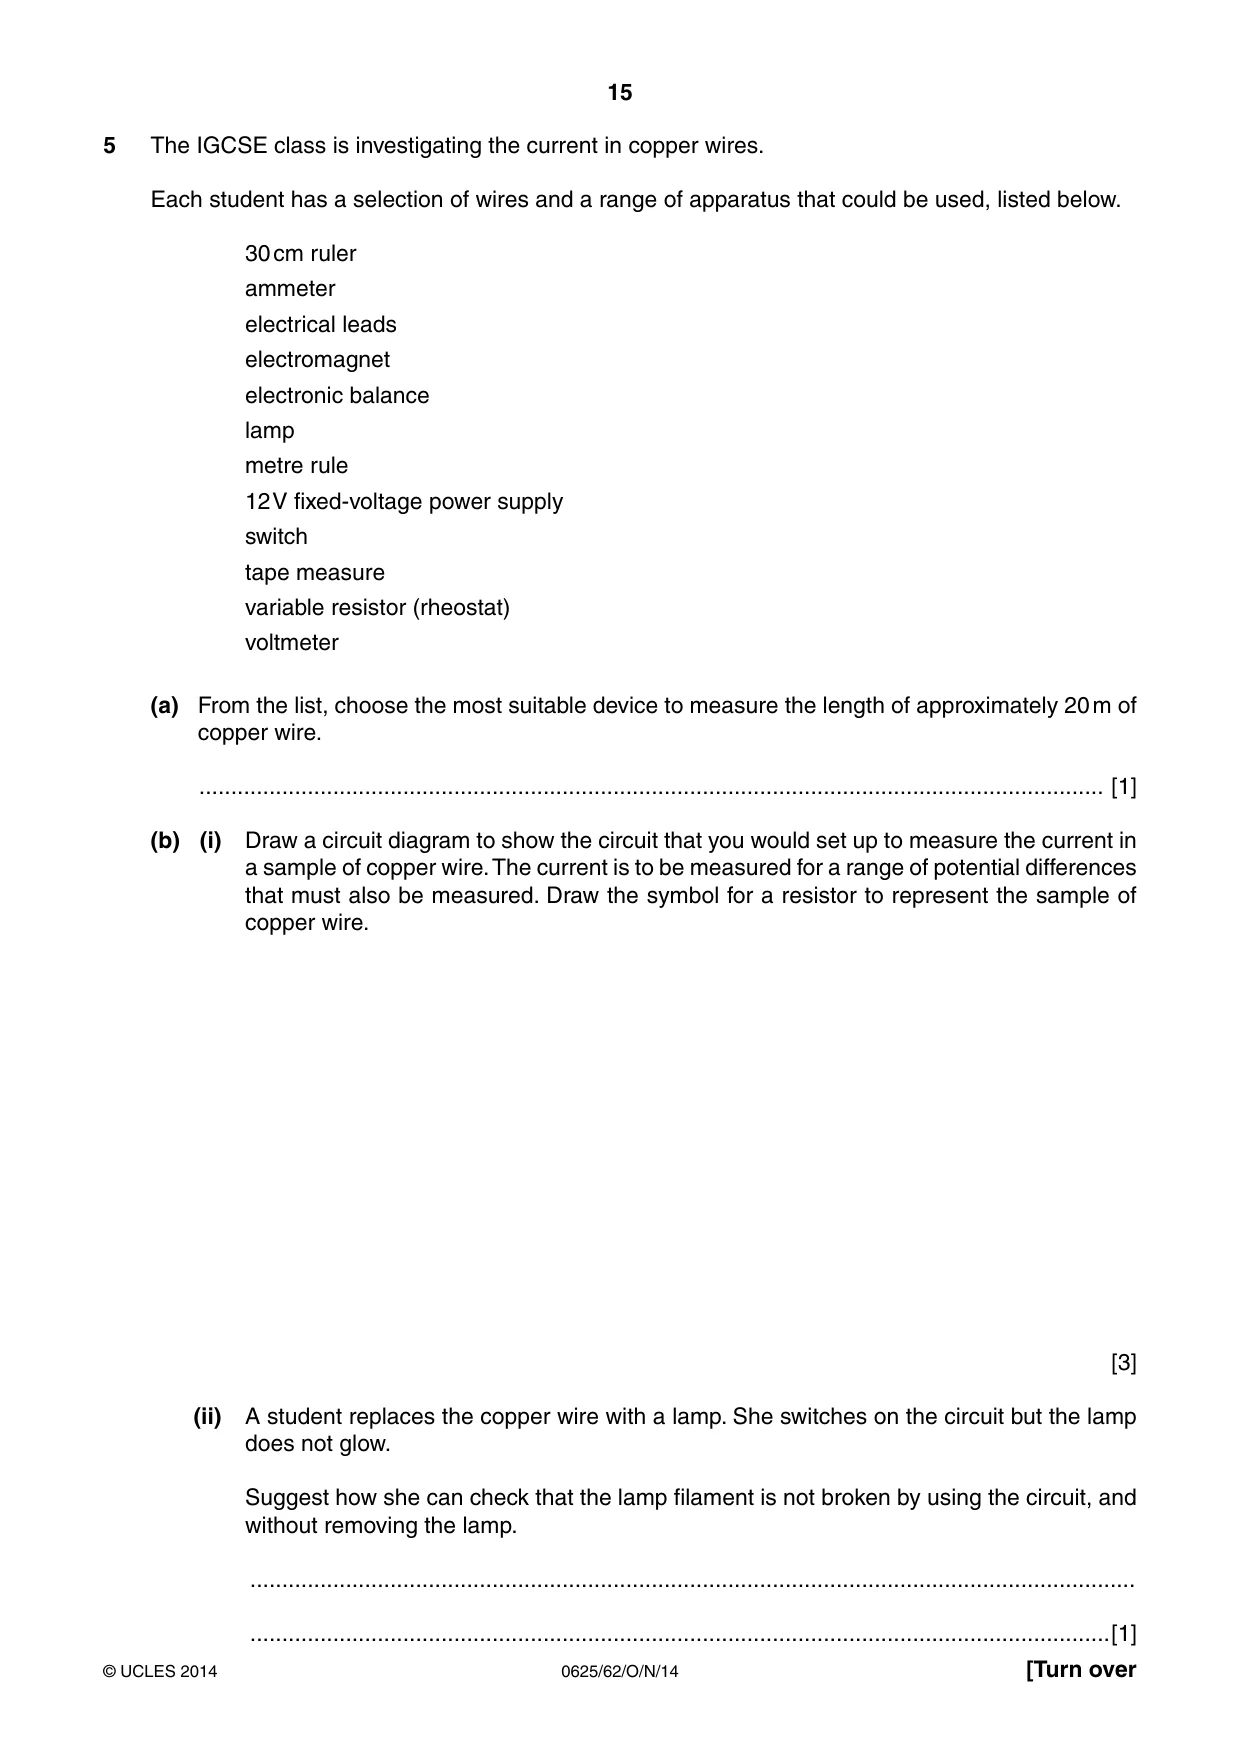
5 The IGCSE class is investigating the current in copper wires. Each student has a selection of wires and a range of apparatus that could be used, listed below. 30 cm ruler ammeter electrical leads electromagnet electronic balance lamp metre rule 12 V fixed-voltage power supply switch tape measure variable resistor (rheostat) voltmeter (a) From the list, choose the most suitable device to measure the length of approximately 20 m of copper wire. .............................................................................................................................................. [1] (b) (i) Draw a circuit diagram to show the circuit that you would set up to measure the current in a sample of copper wire. The current is to be measured for a range of potential differences that must also be measured. Draw the symbol for a resistor to represent the sample of copper wire. [3] (ii) A student replaces the copper wire with a lamp. She switches on the circuit but the lamp does not glow. Suggest how she can check that the lamp filament is not broken by using the circuit, and without removing the lamp. ........................................................................................................................................... .......................................................................................................................................[1] (iii) State whether a 0 – 300 V voltmeter is suitable for measuring a potential difference in the circuit you have drawn in part (b)(i). Give a reason for your answer. statement .......................................................................................................................... reason ............................................................................................................................... ........................................................................................................................................... ........................................................................................................................................... [1] [Total: 6]
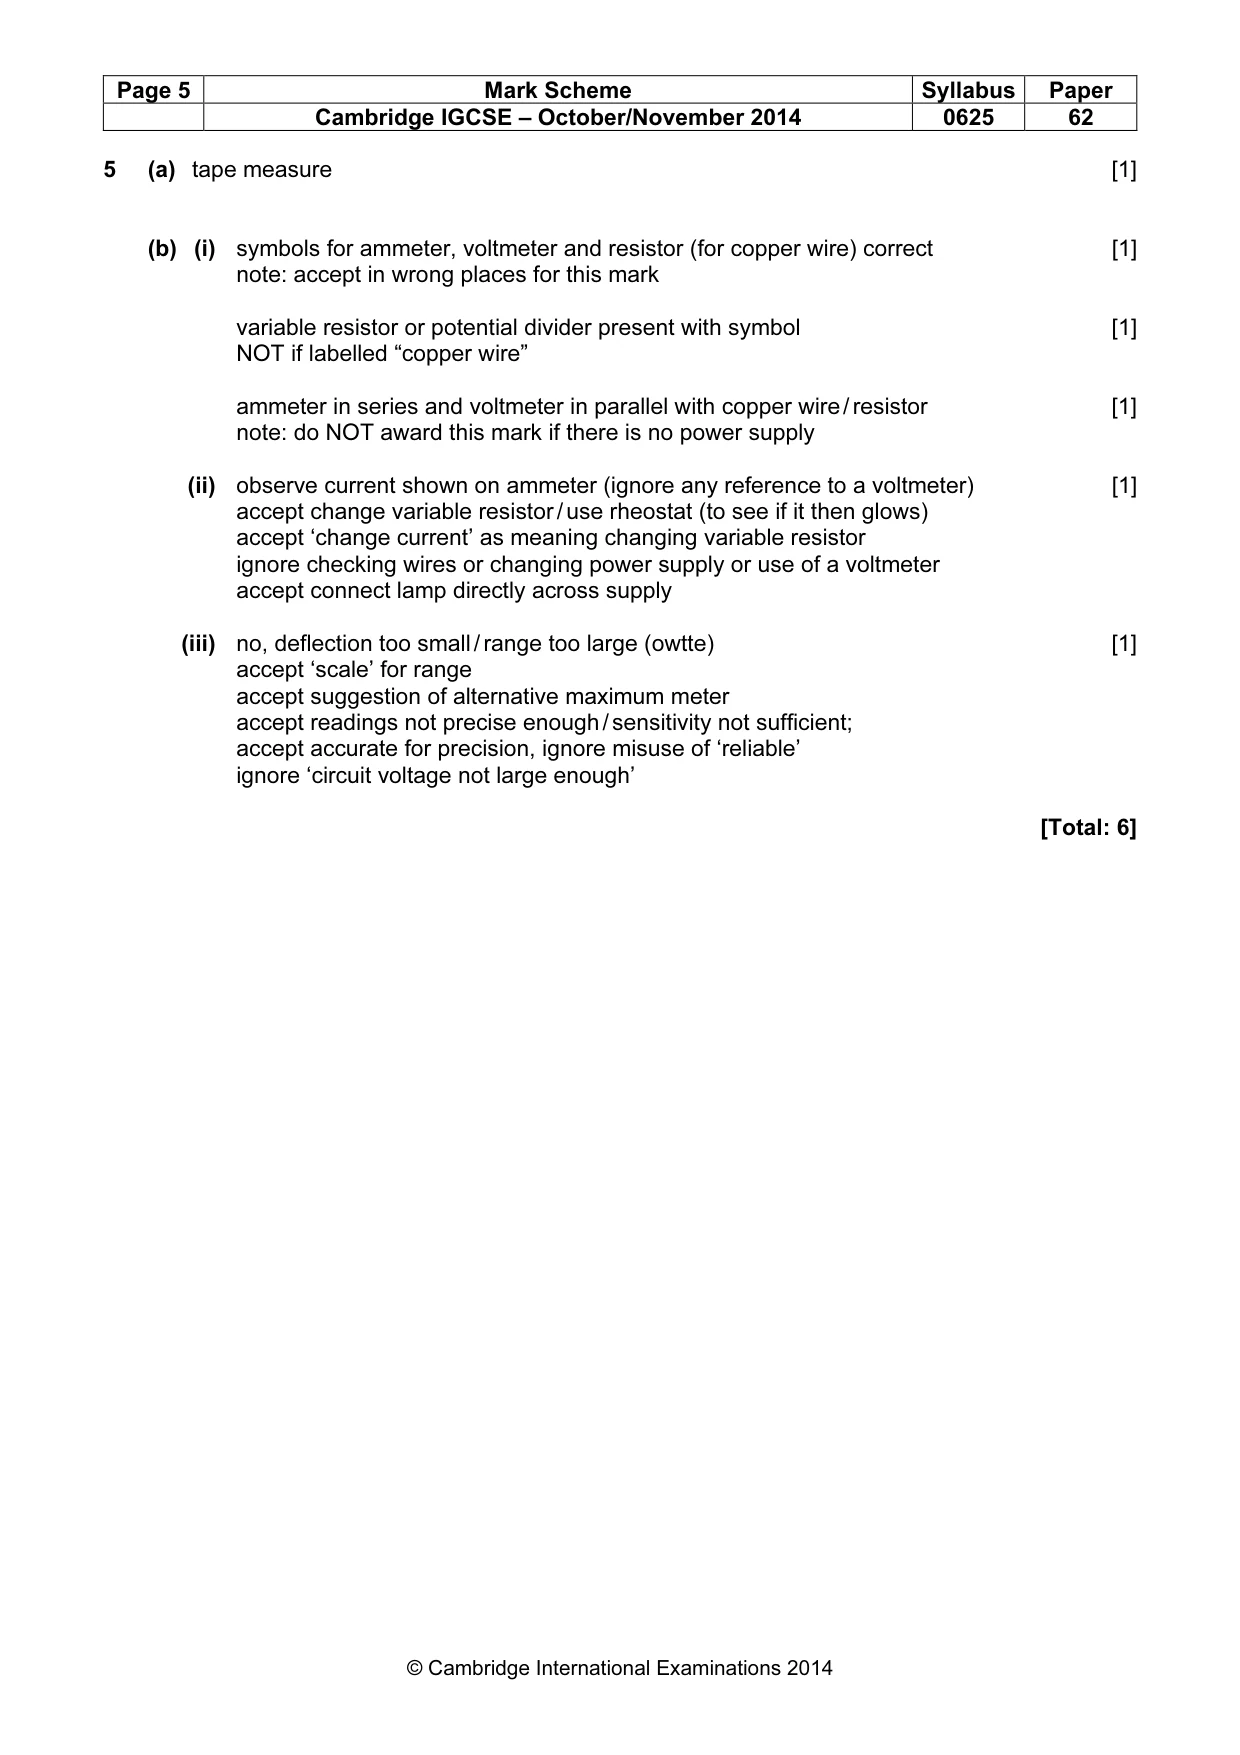
Mark scheme: 5 (a) tape measure [1] (b) (i) symbols for ammeter, voltmeter and resistor (for copper wire) correct [1] note: accept in wrong places for this mark variable resistor or potential divider present with symbol [1] NOT if labelled “copper wire” ammeter in series and voltmeter in parallel with copper wire / resistor [1] note: do NOT award this mark if there is no power supply (ii) observe current shown on ammeter (ignore any reference to a voltmeter) [1] accept change variable resistor / use rheostat (to see if it then glows) accept ‘change current’ as meaning changing variable resistor ignore checking wires or changing power supply or use of a voltmeter accept connect lamp directly across supply (iii) no, deflection too small / range too large (owtte) [1] accept ‘scale’ for range accept suggestion of alternative maximum meter accept readings not precise enough / sensitivity not sufficient; accept accurate for precision, ignore misuse of ‘reliable’ ignore ‘circuit voltage not large enough’ [Total: 6]
What was in this paper
The subtopics covered by these 5 questions, and how many questions each got. Open one in a new tab to see every Cambridge question on it.
What you needed in this session
Cambridge’s own grade thresholds for 2014 Oct/Nov, Paper 6 · Variant 2. A higher threshold means an easier paper — the bar moves with how the cohort did.