Cambridge IGCSE Physics 0625 — 2024 May/June Paper 6 · Variant 1
0625/61/M/J/24 · 4 questions · 40 marks · ≈45 min
The question paper and its mark scheme, free to read here and free to download. This is Cambridge’s own paper, exactly as it was sat.
Question paper12 pages

Mark scheme9 pages
Answers below. Sit the paper first if you are practising.
Questions as text
Q1 · A student investigates the stretching of a spring
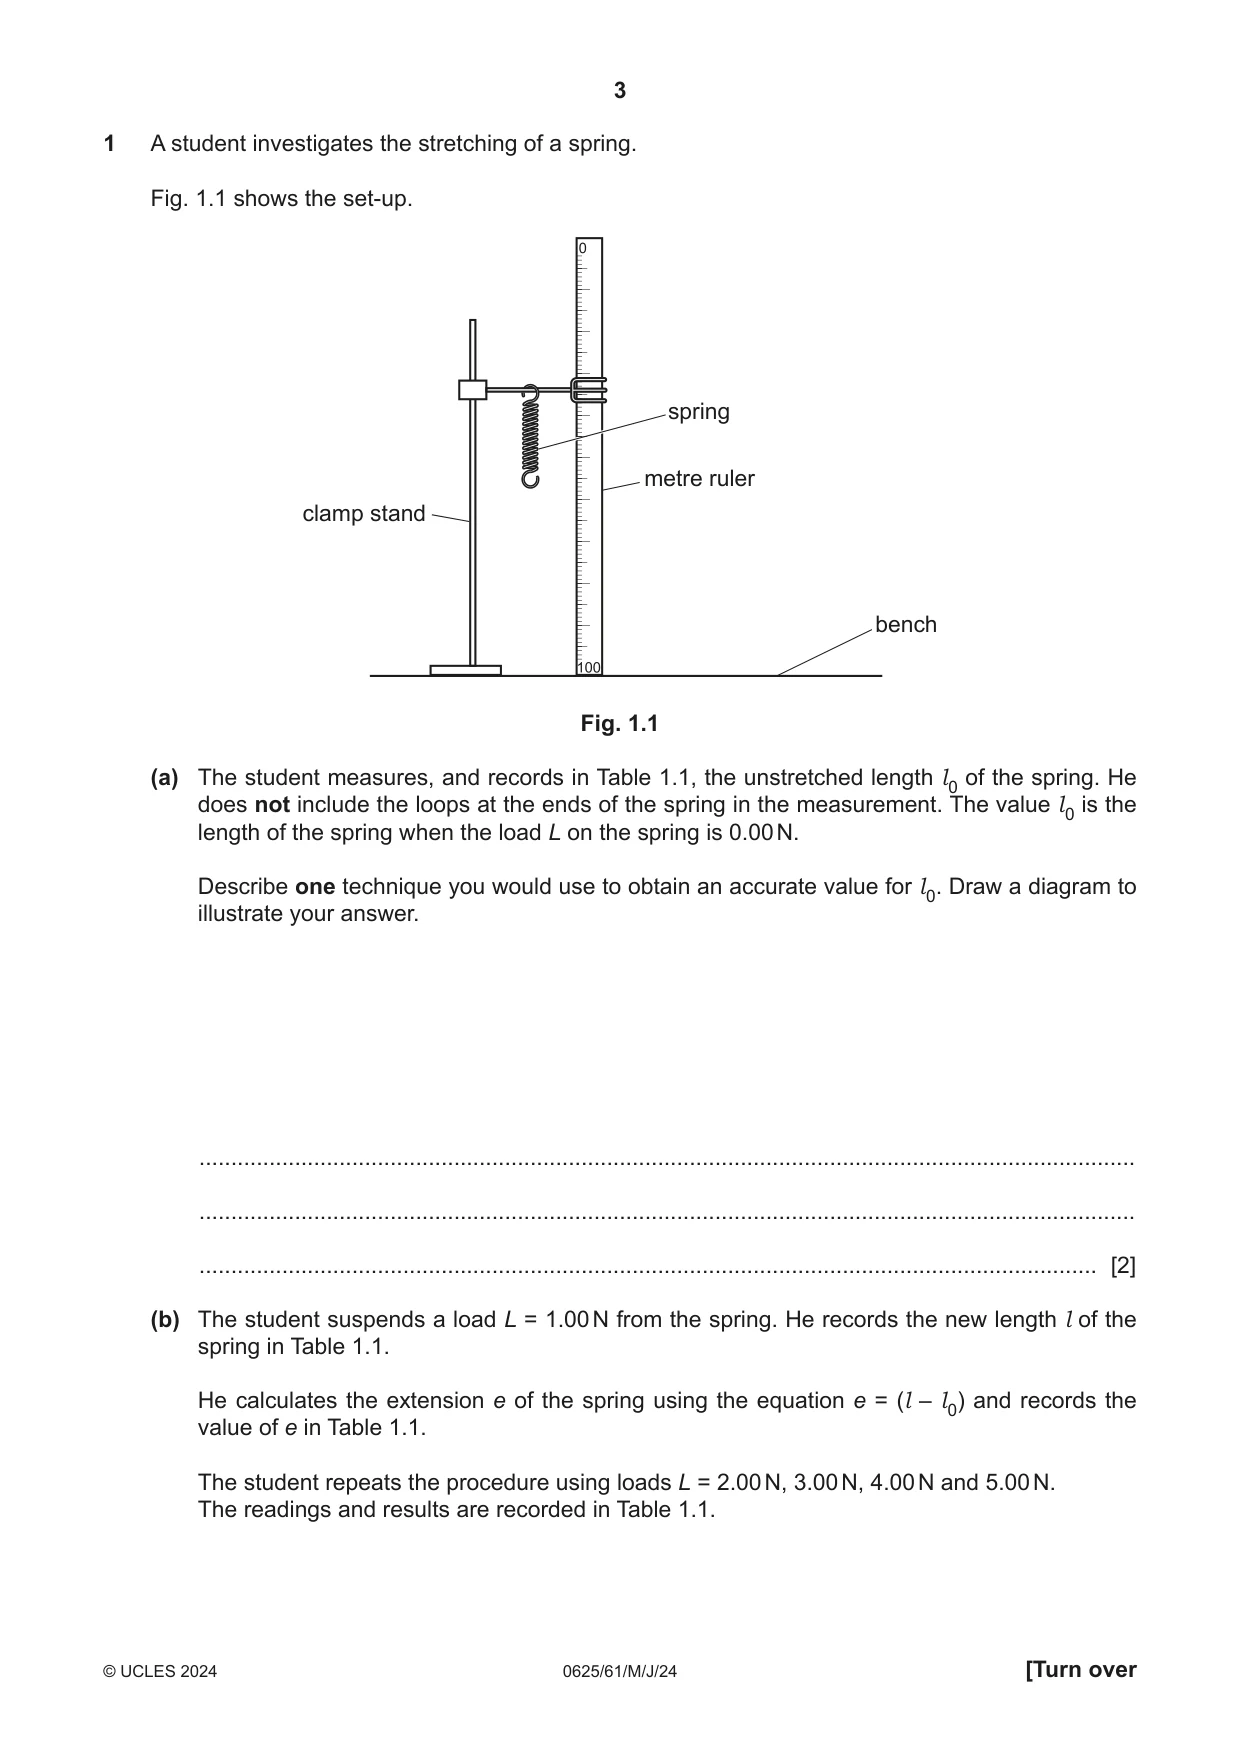
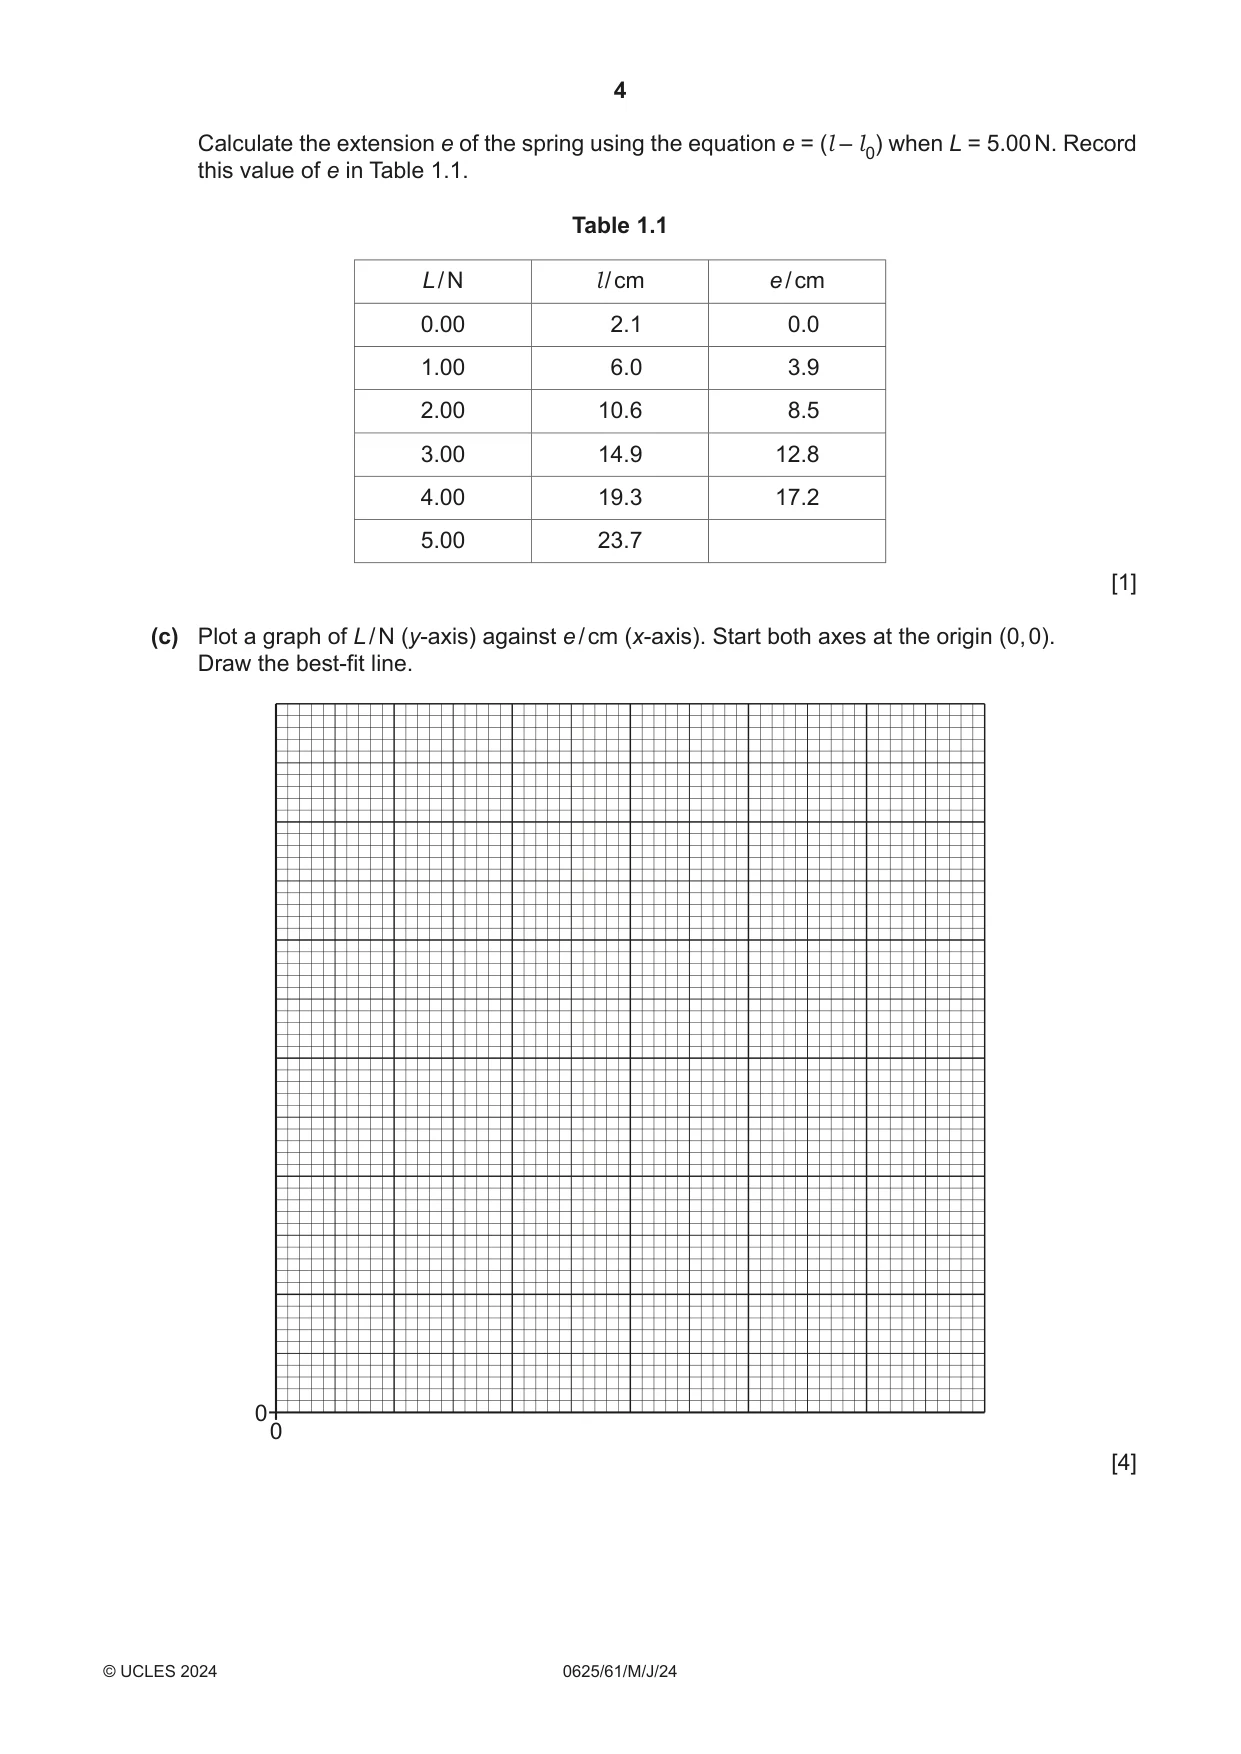
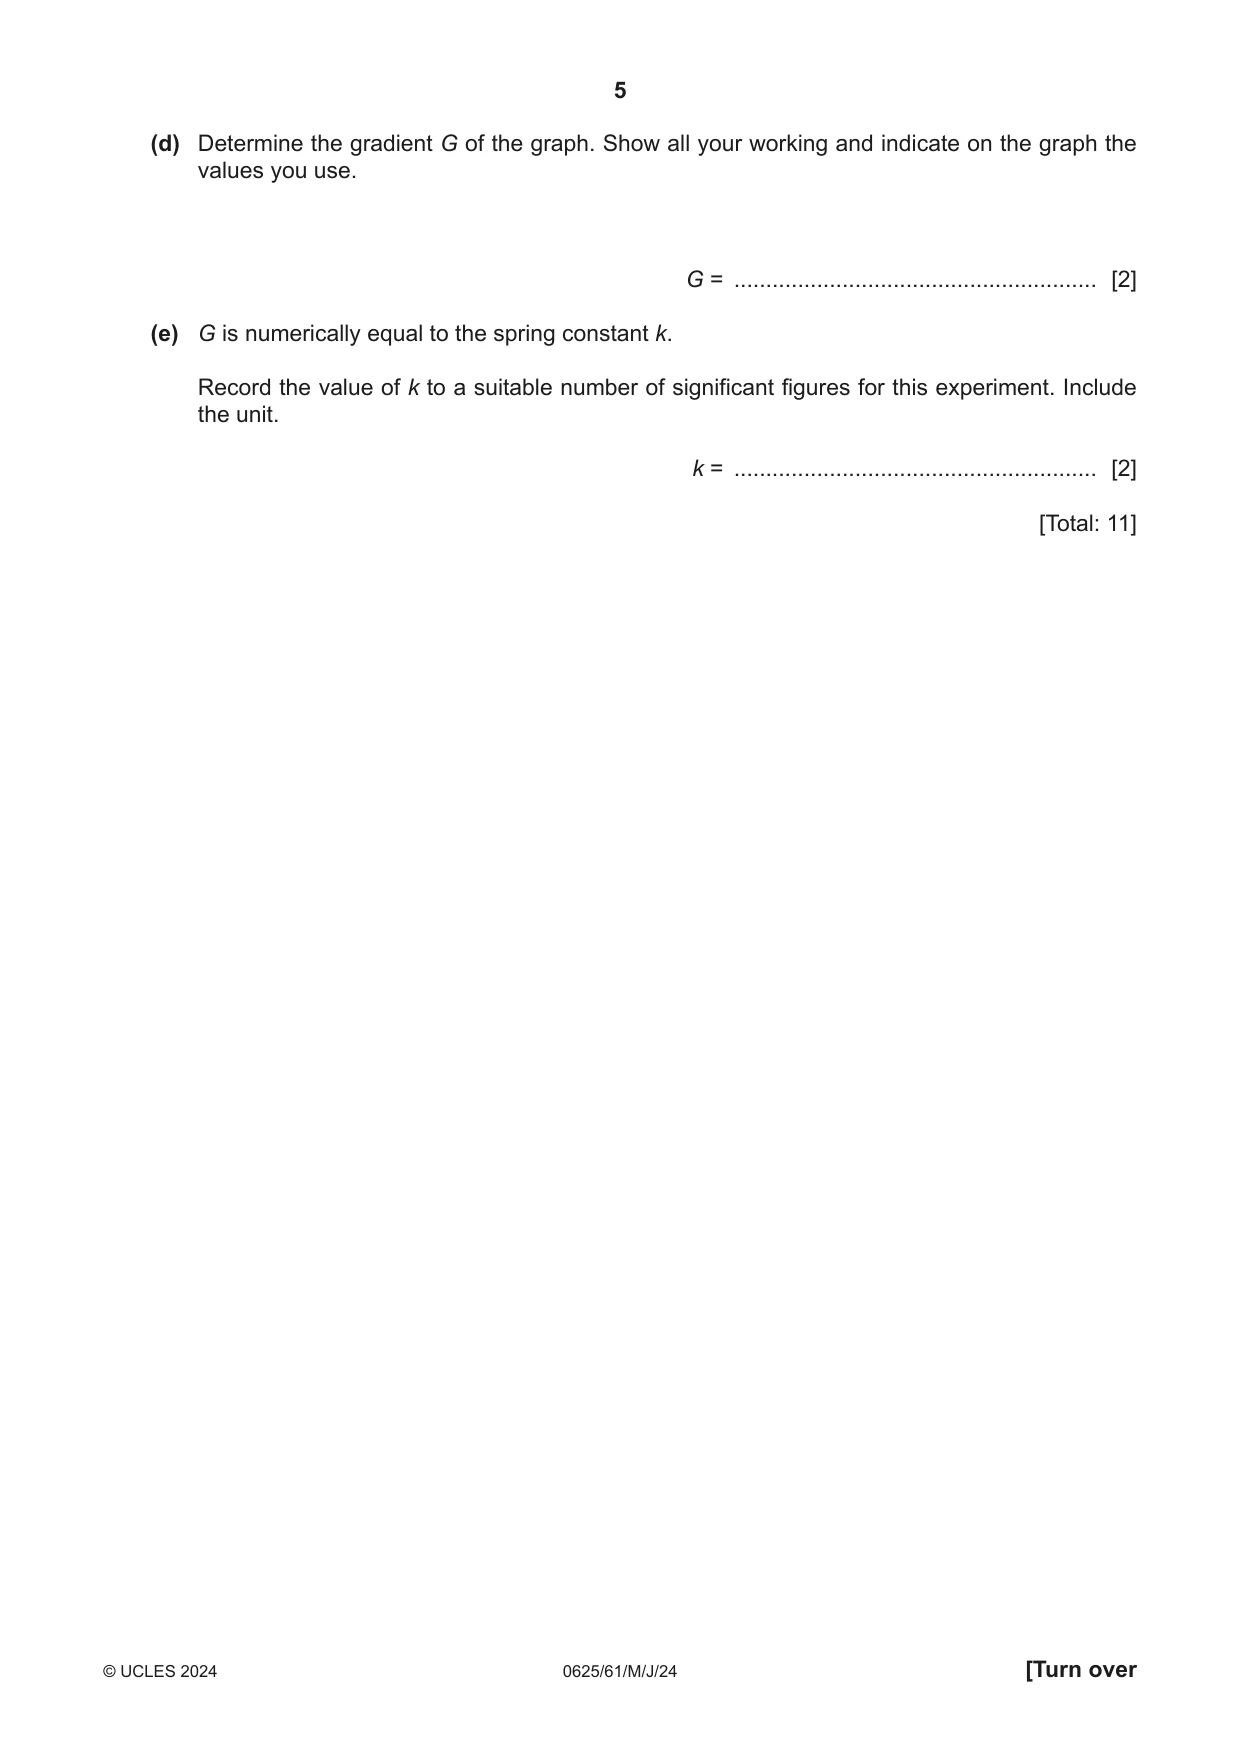
1 A student investigates the stretching of a spring. Fig. 1.1 shows the set-up. spring metre ruler clamp stand bench Fig. 1.1 (a) The student measures, and records in Table 1.1, the unstretched length l 0 of the spring. He does not include the loops at the ends of the spring in the measurement. The value l 0 is the length of the spring when the load L on the spring is 0.00 N. Describe one technique you would use to obtain an accurate value for l 0. Draw a diagram to illustrate your answer. ................................................................................................................................................... ................................................................................................................................................... ............................................................................................................................................. [2] (b) The student suspends a load L = 1.00 N from the spring. He records the new length l of the spring in Table 1.1. He calculates the extension e of the spring using the equation e = (l – l 0) and records the value of e in Table 1.1. The student repeats the procedure using loads L = 2.00 N, 3.00 N, 4.00 N and 5.00 N. The readings and results are recorded in Table 1.1. Calculate the extension e of the spring using the equation e = (l – l 0) when L = 5.00 N. Record this value of e in Table 1.1. Table 1.1 L / N l / cm e / cm 0.00 2.1 0.0 1.00 6.0 3.9 2.00 10.6 8.5 3.00 14.9 12.8 4.00 19.3 17.2 5.00 23.7 [1] (c) Plot a graph of L / N (y-axis) against e / cm (x-axis). Start both axes at the origin (0, 0). Draw the best-fit line. 00 [4] (d) Determine the gradient G of the graph. Show all your working and indicate on the graph the values you use. G = ......................................................... [2] (e) G is numerically equal to the spring constant k. Record the value of k to a suitable number of significant figures for this experiment. Include the unit. k = ......................................................... [2] [Total: 11]
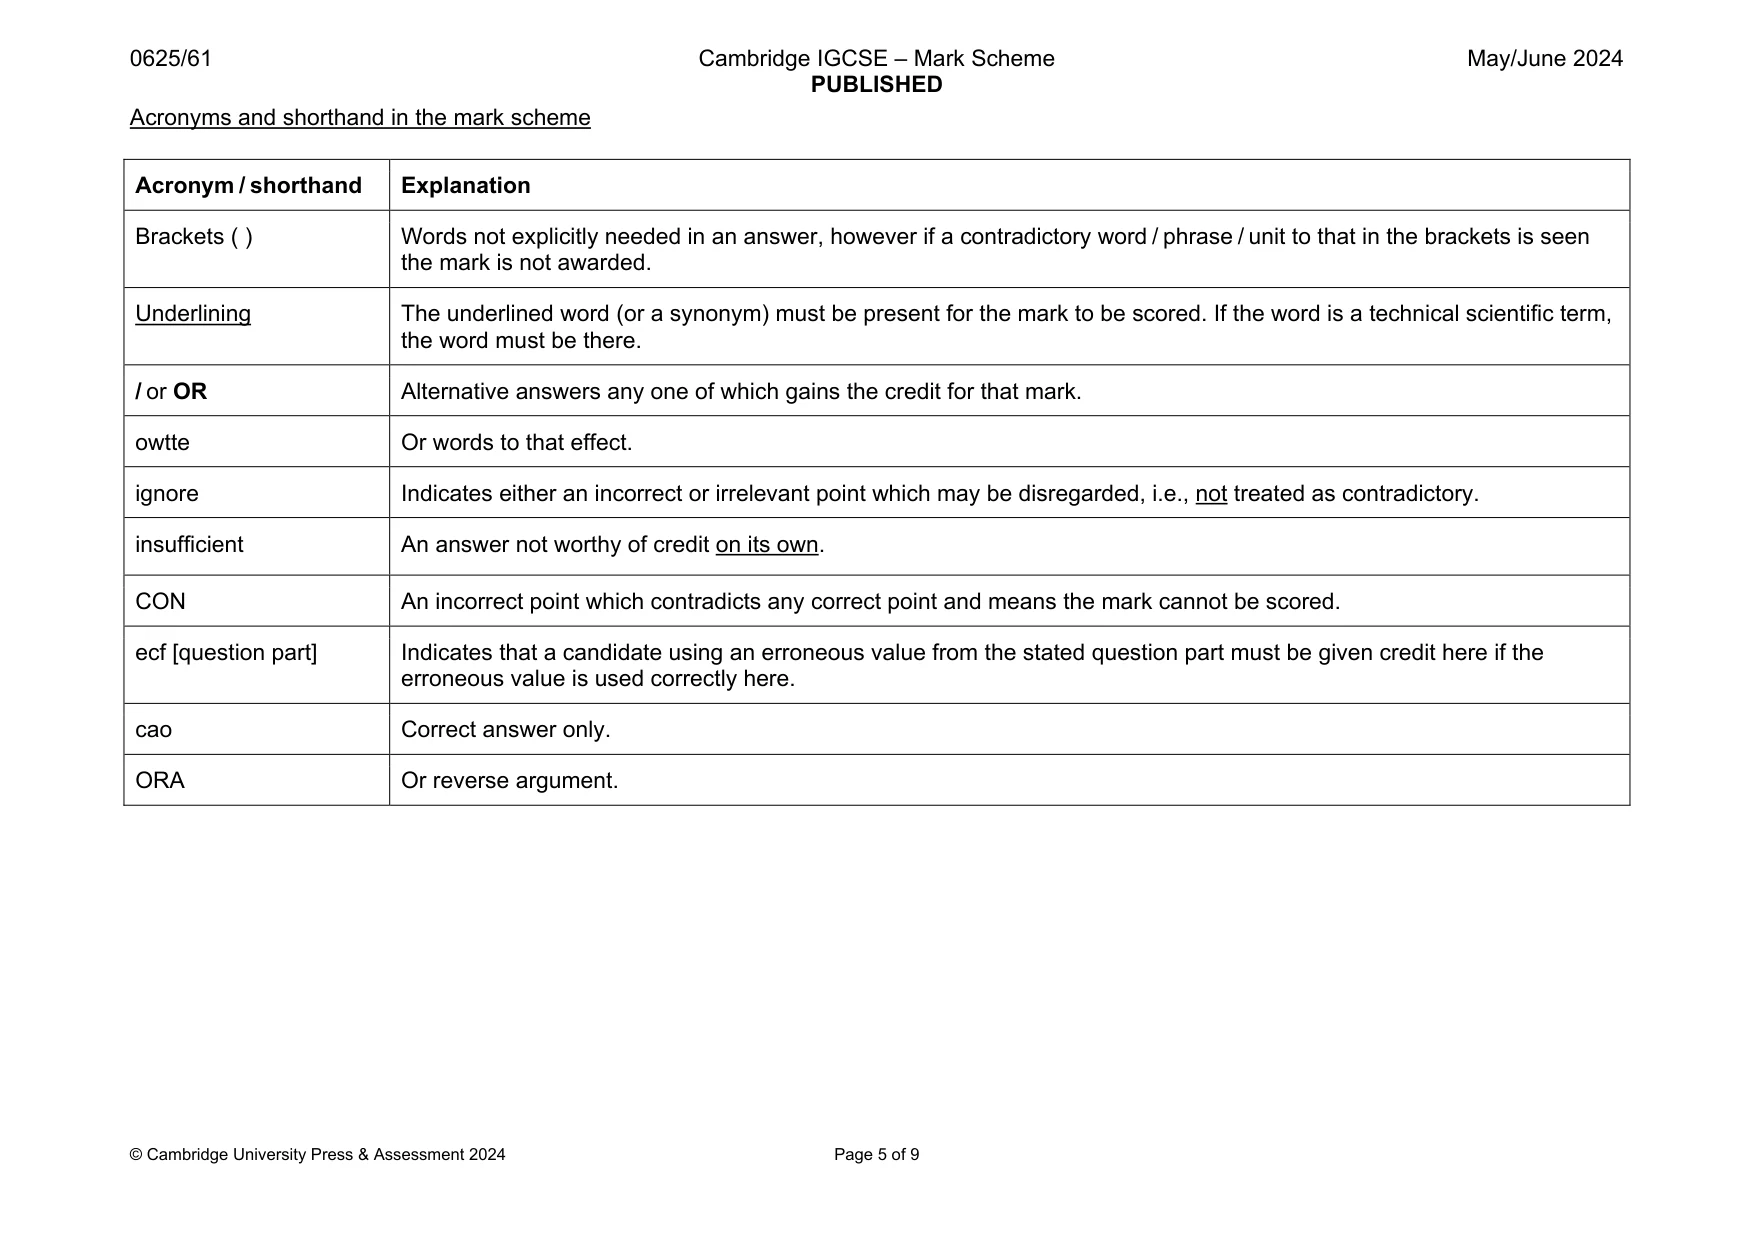
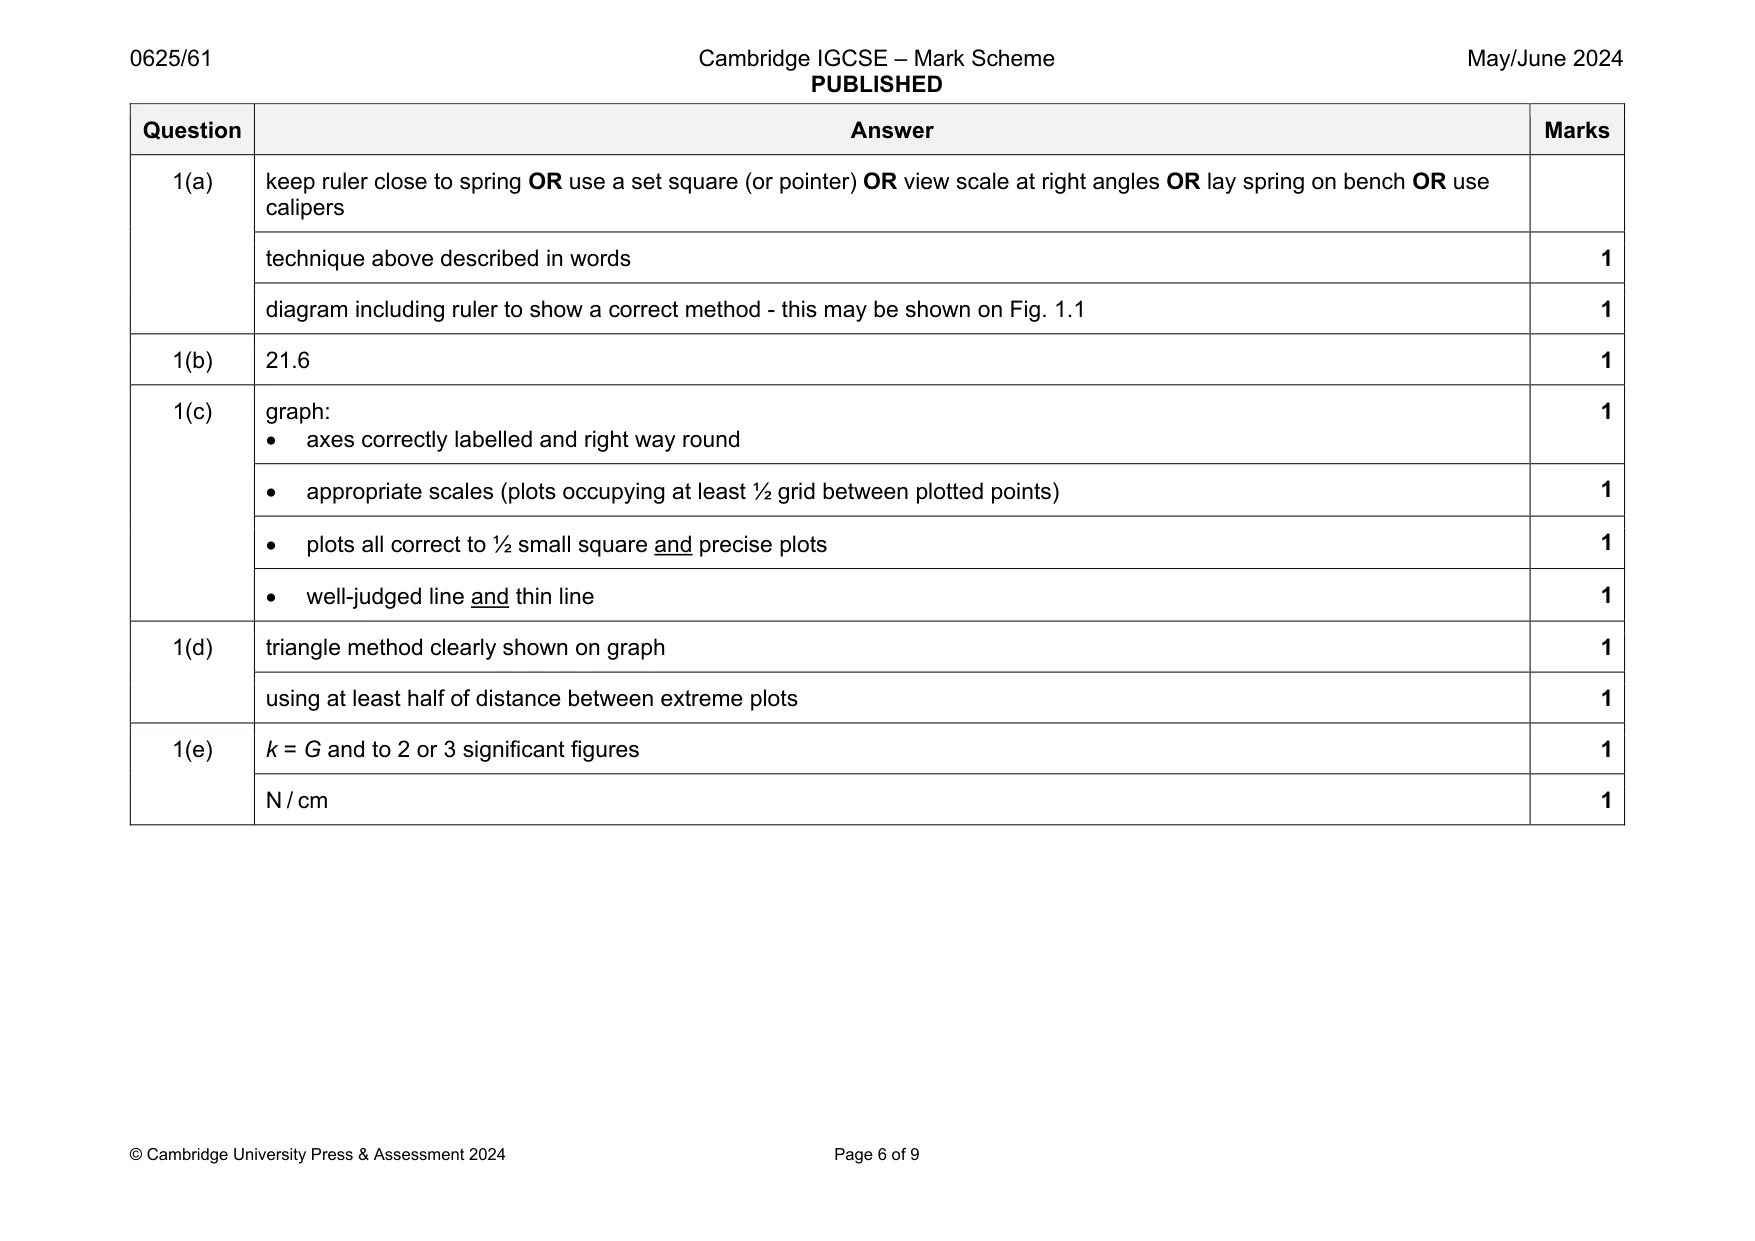
Mark scheme: 1(a) keep ruler close to spring OR use a set square (or pointer) OR view scale at right angles OR lay spring on bench OR use calipers technique above described in words 1 diagram including ruler to show a correct method - this may be shown on Fig. 1.1 1 1(b) 21.6 1 1(c) graph: axes correctly labelled and right way round 1 appropriate scales (plots occupying at least ½ grid between plotted points) 1 plots all correct to ½ small square and precise plots 1 well-judged line and thin line 1 1(d) triangle method clearly shown on graph 1 using at least half of distance between extreme plots 1 1(e) k = G and to 2 or 3 significant figures 1 N / cm 1
Q2 · A student investigates the resistance of a wire
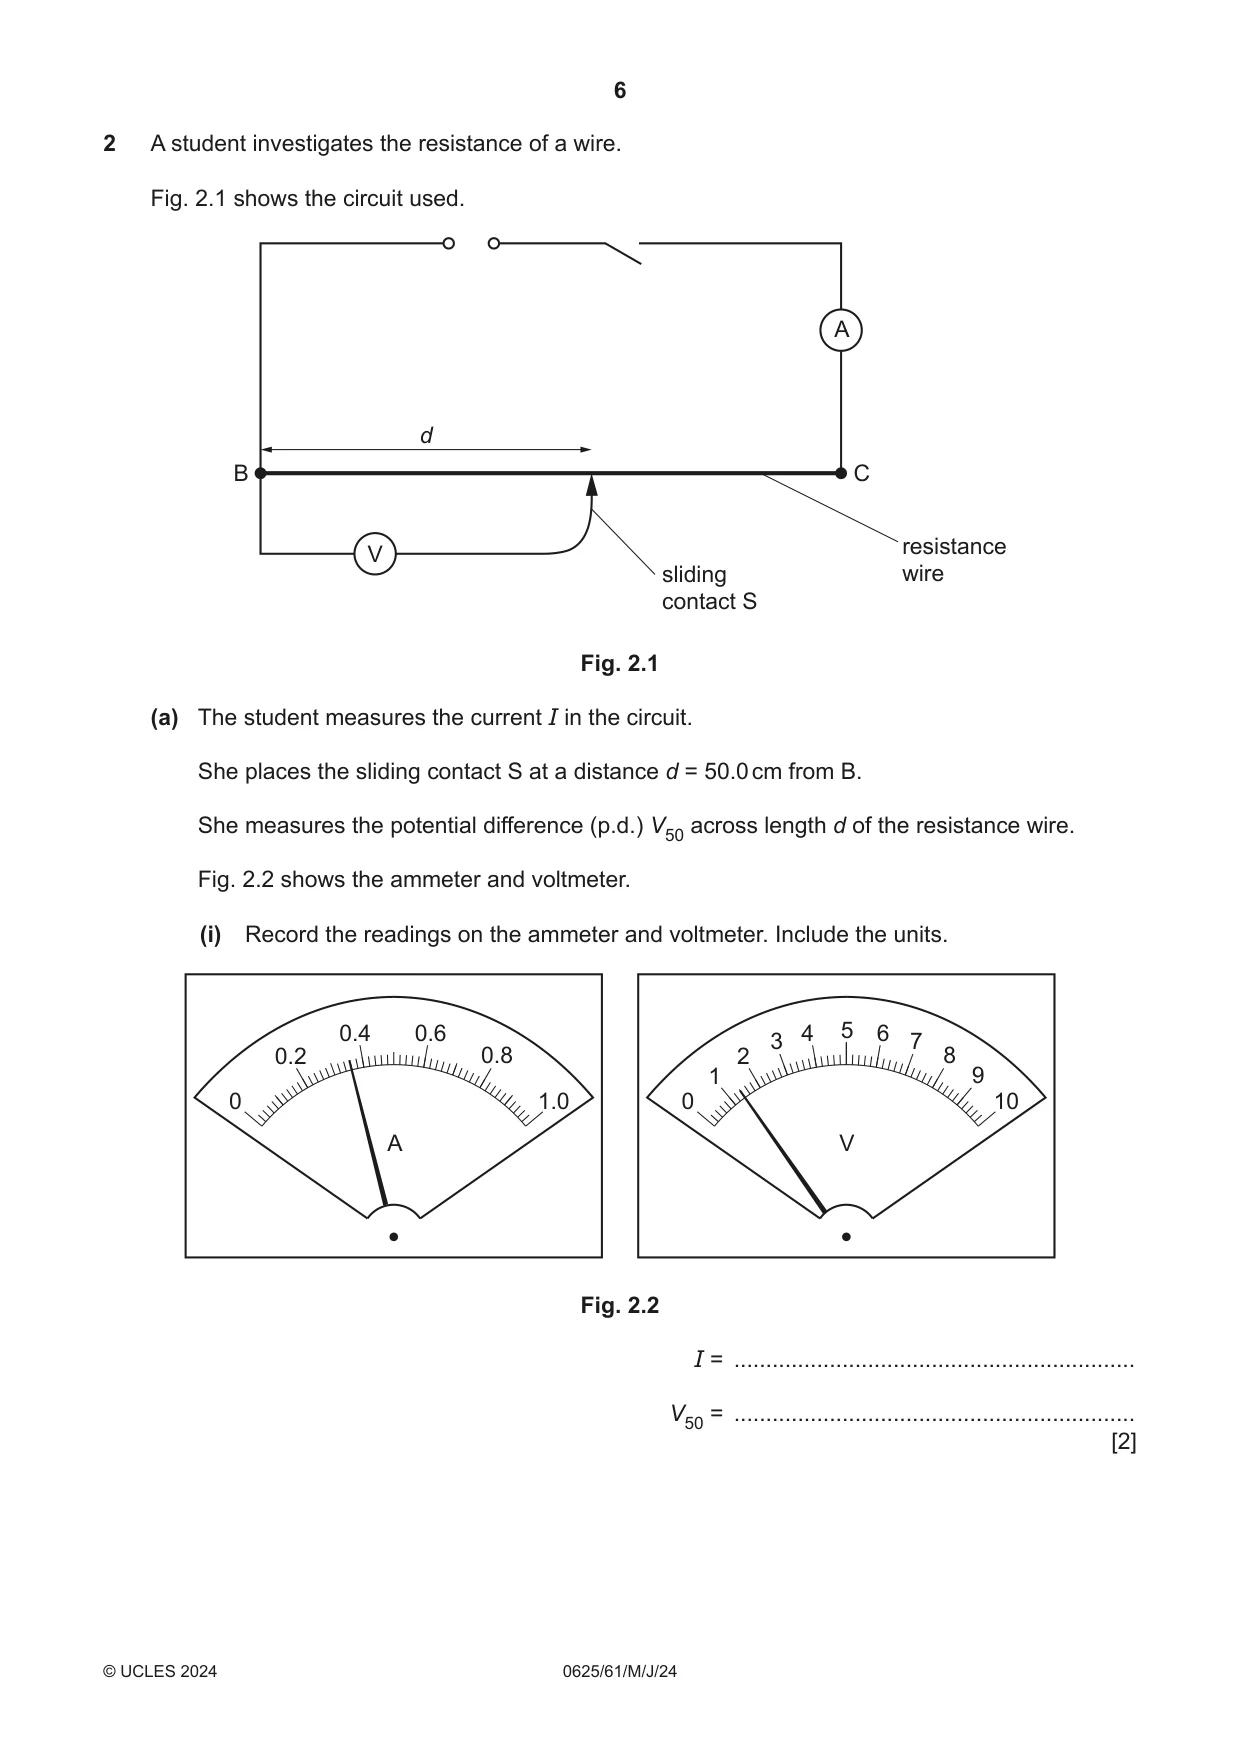
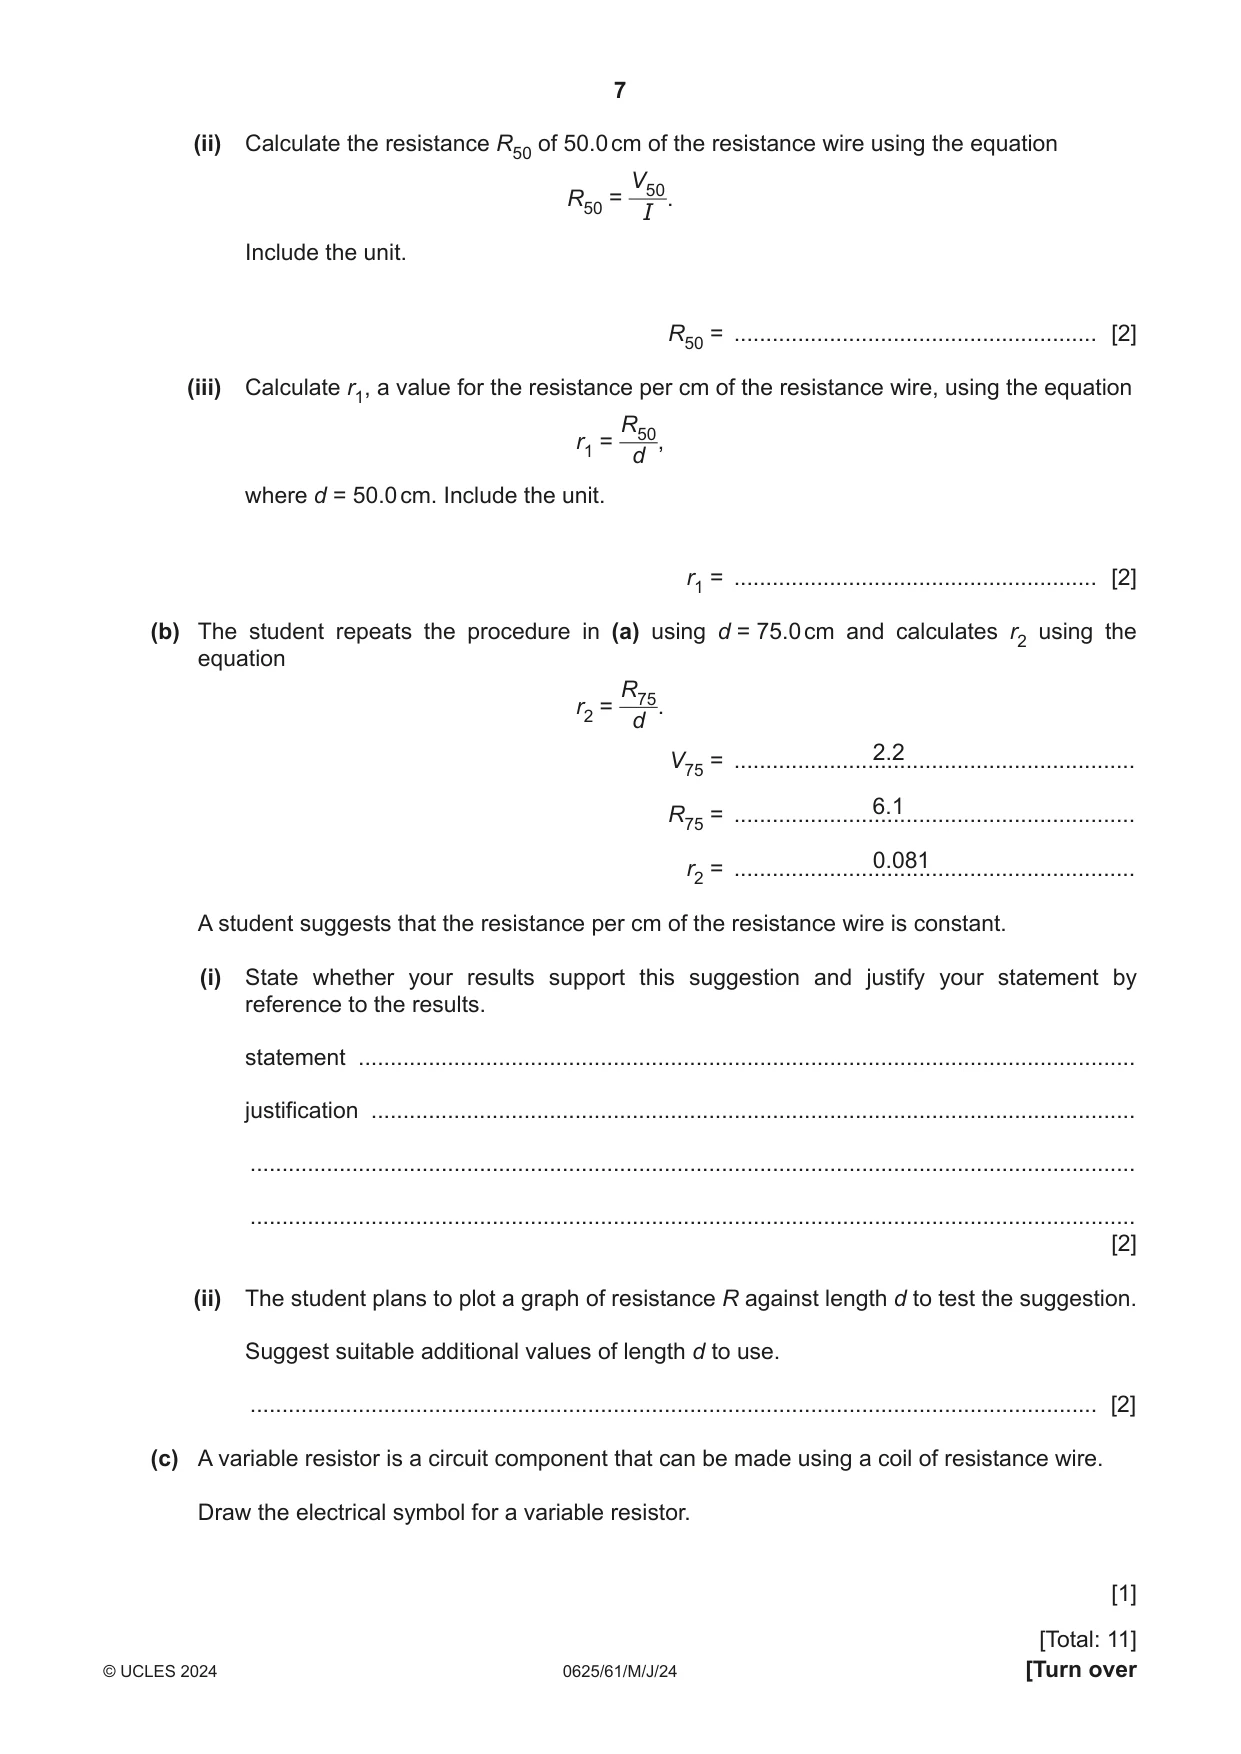
2 A student investigates the resistance of a wire. Fig. 2.1 shows the circuit used. A d B C resistance V sliding wire contact S Fig. 2.1 (a) The student measures the current I in the circuit. She places the sliding contact S at a distance d = 50.0 cm from B. She measures the potential difference (p.d.) V50 across length d of the resistance wire. Fig. 2.2 shows the ammeter and voltmeter. (i) Record the readings on the ammeter and voltmeter. Include the units. 0.4 0.6 4 5 6 3 7 0.2 0.8 2 8 1 9 0 1.0 0 10 A V Fig. 2.2 I = ............................................................... V50 = ............................................................... [2] (ii) Calculate the resistance R50 of 50.0 cm of the resistance wire using the equation V50 R50 = . I Include the unit. R50 = ......................................................... [2] (iii) Calculate r1, a value for the resistance per cm of the resistance wire, using the equation R50 r1 = , d where d = 50.0 cm. Include the unit. r1 = ......................................................... [2] (b) The student repeats the procedure in (a) using d = 75.0 cm and calculates r2 using the equation R75 r2 = . d 2.2 V75 = ............................................................... 6.1 R75 = ............................................................... 0.081 r2 = ............................................................... A student suggests that the resistance per cm of the resistance wire is constant. (i) State whether your results support this suggestion and justify your statement by reference to the results. statement .......................................................................................................................... justification ........................................................................................................................ ........................................................................................................................................... ........................................................................................................................................... [2] (ii) The student plans to plot a graph of resistance R against length d to test the suggestion. Suggest suitable additional values of length d to use. ..................................................................................................................................... [2] (c) A variable resistor is a circuit component that can be made using a coil of resistance wire. Draw the electrical symbol for a variable resistor. [1] [Total: 11]
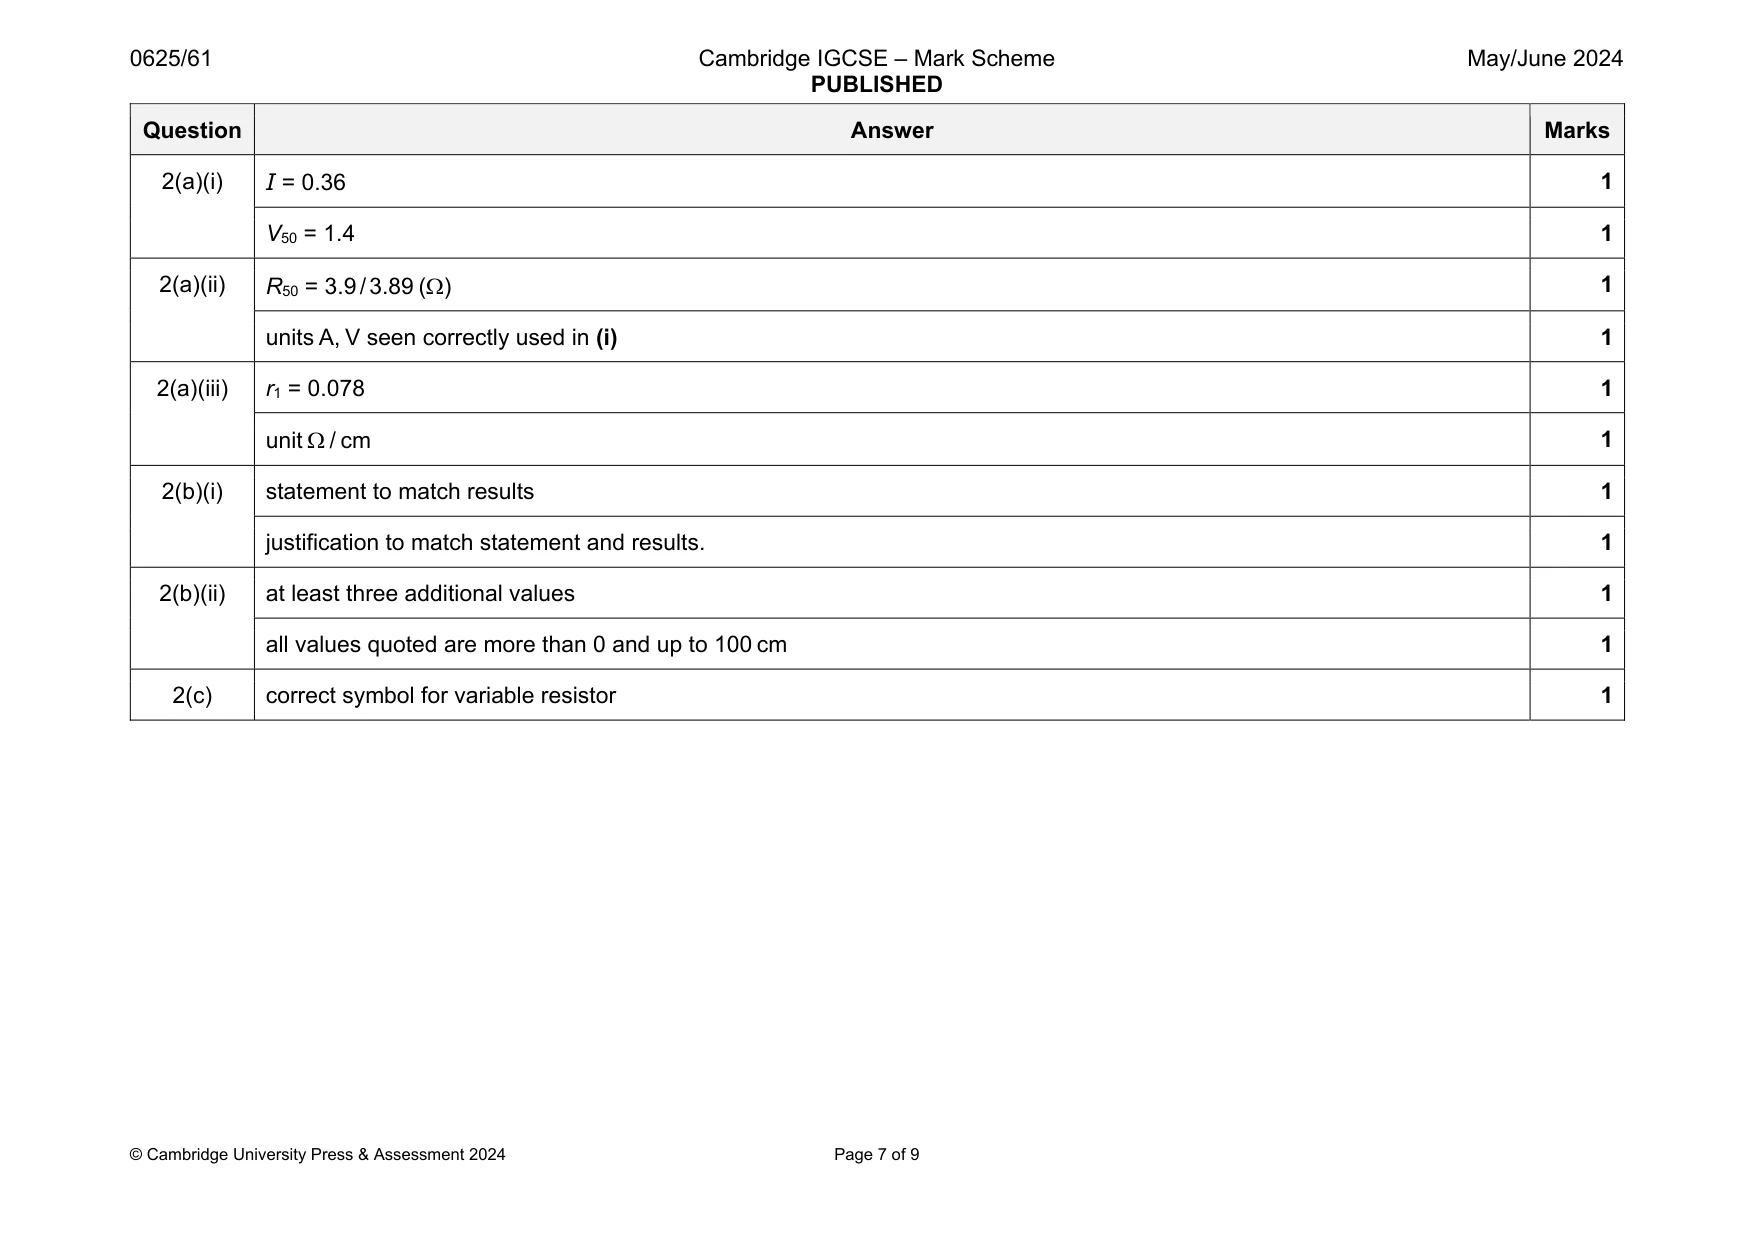
Mark scheme: 2(a)(i) 1 V50 = 1.4 1 2(a)(ii) R50 = 3.9 / 3.89 () 1 units A, V seen correctly used in (i) 1 2(a)(iii) r1 = 0.078 1 unit / cm 1 2(b)(i) statement to match results 1 justification to match statement and results. 1 2(b)(ii) at least three additional values 1 all values quoted are more than 0 and up to 100 cm 1 2(c) correct symbol for variable resistor 1
Q3 · A student investigates the image produced by a lens
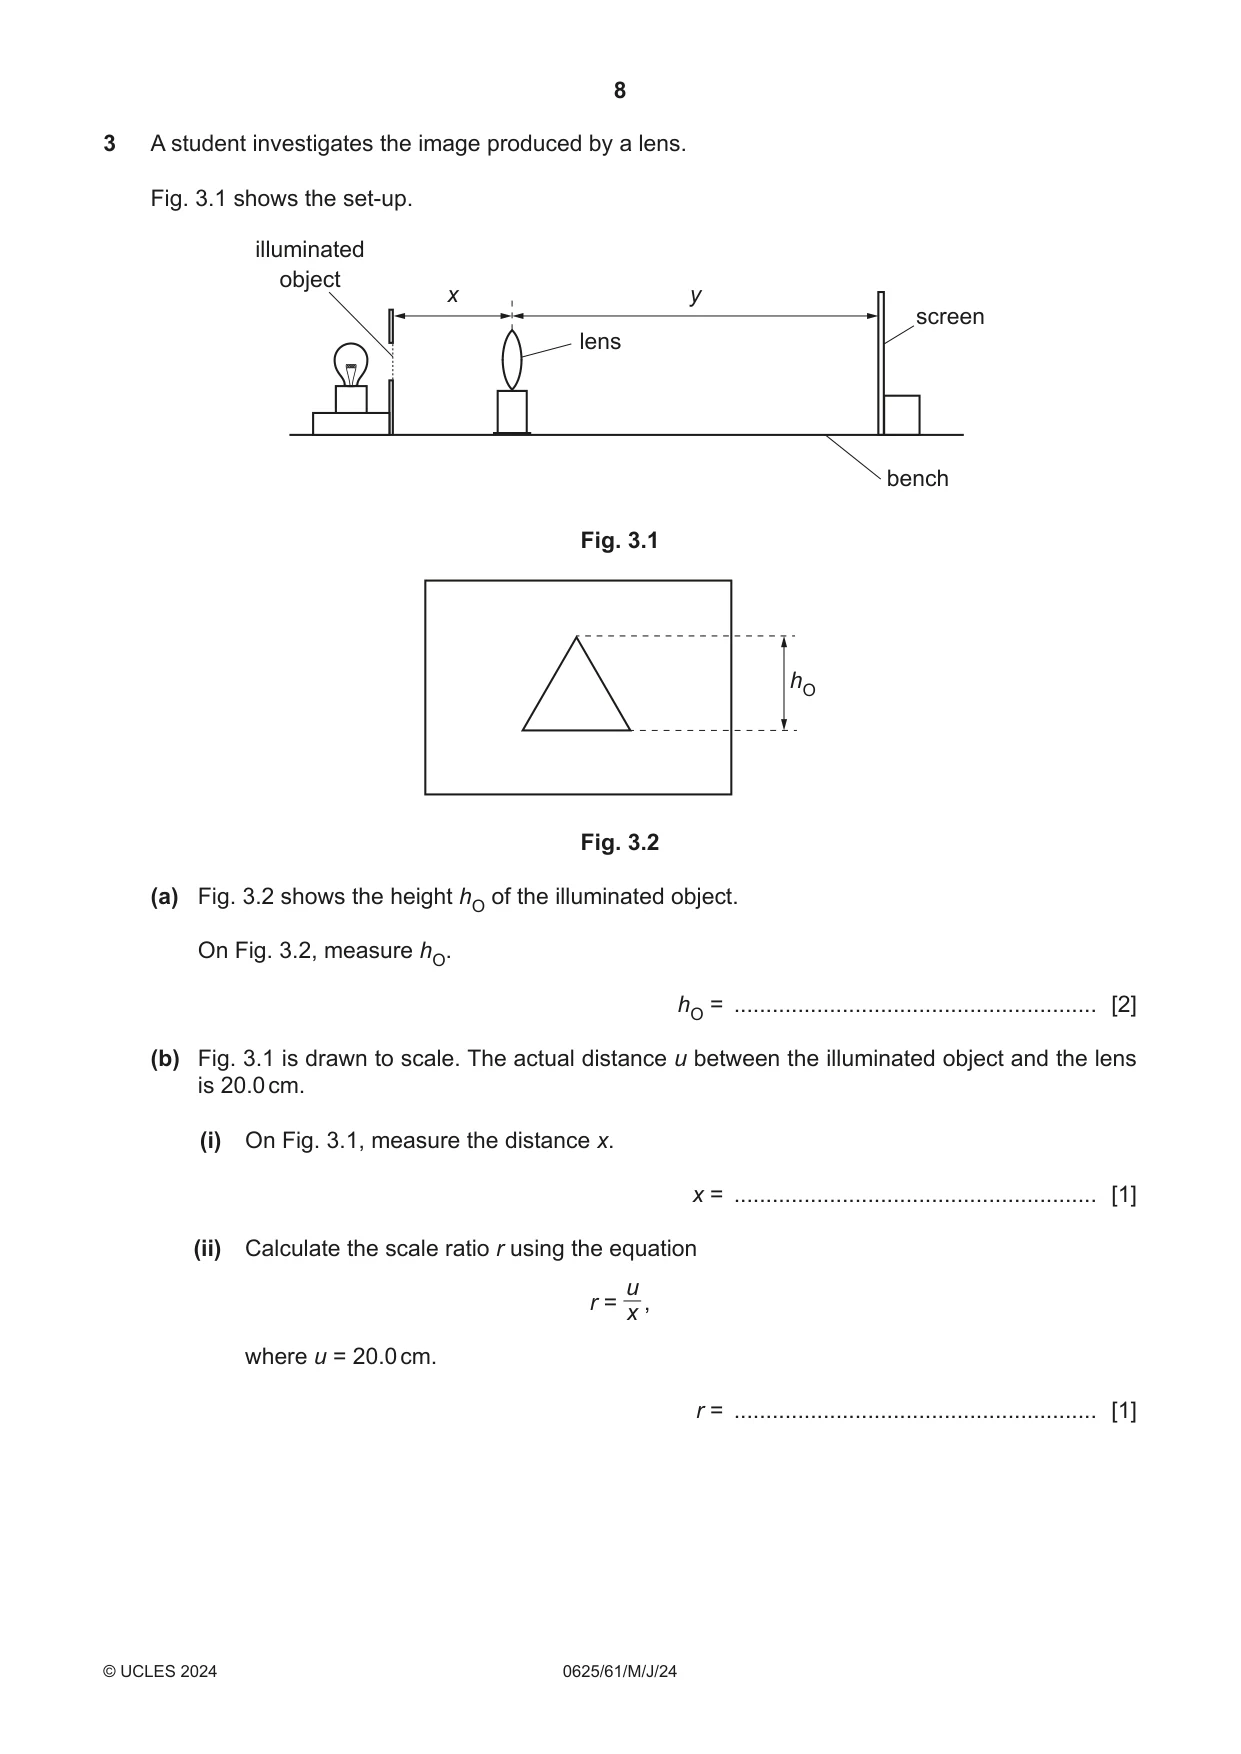
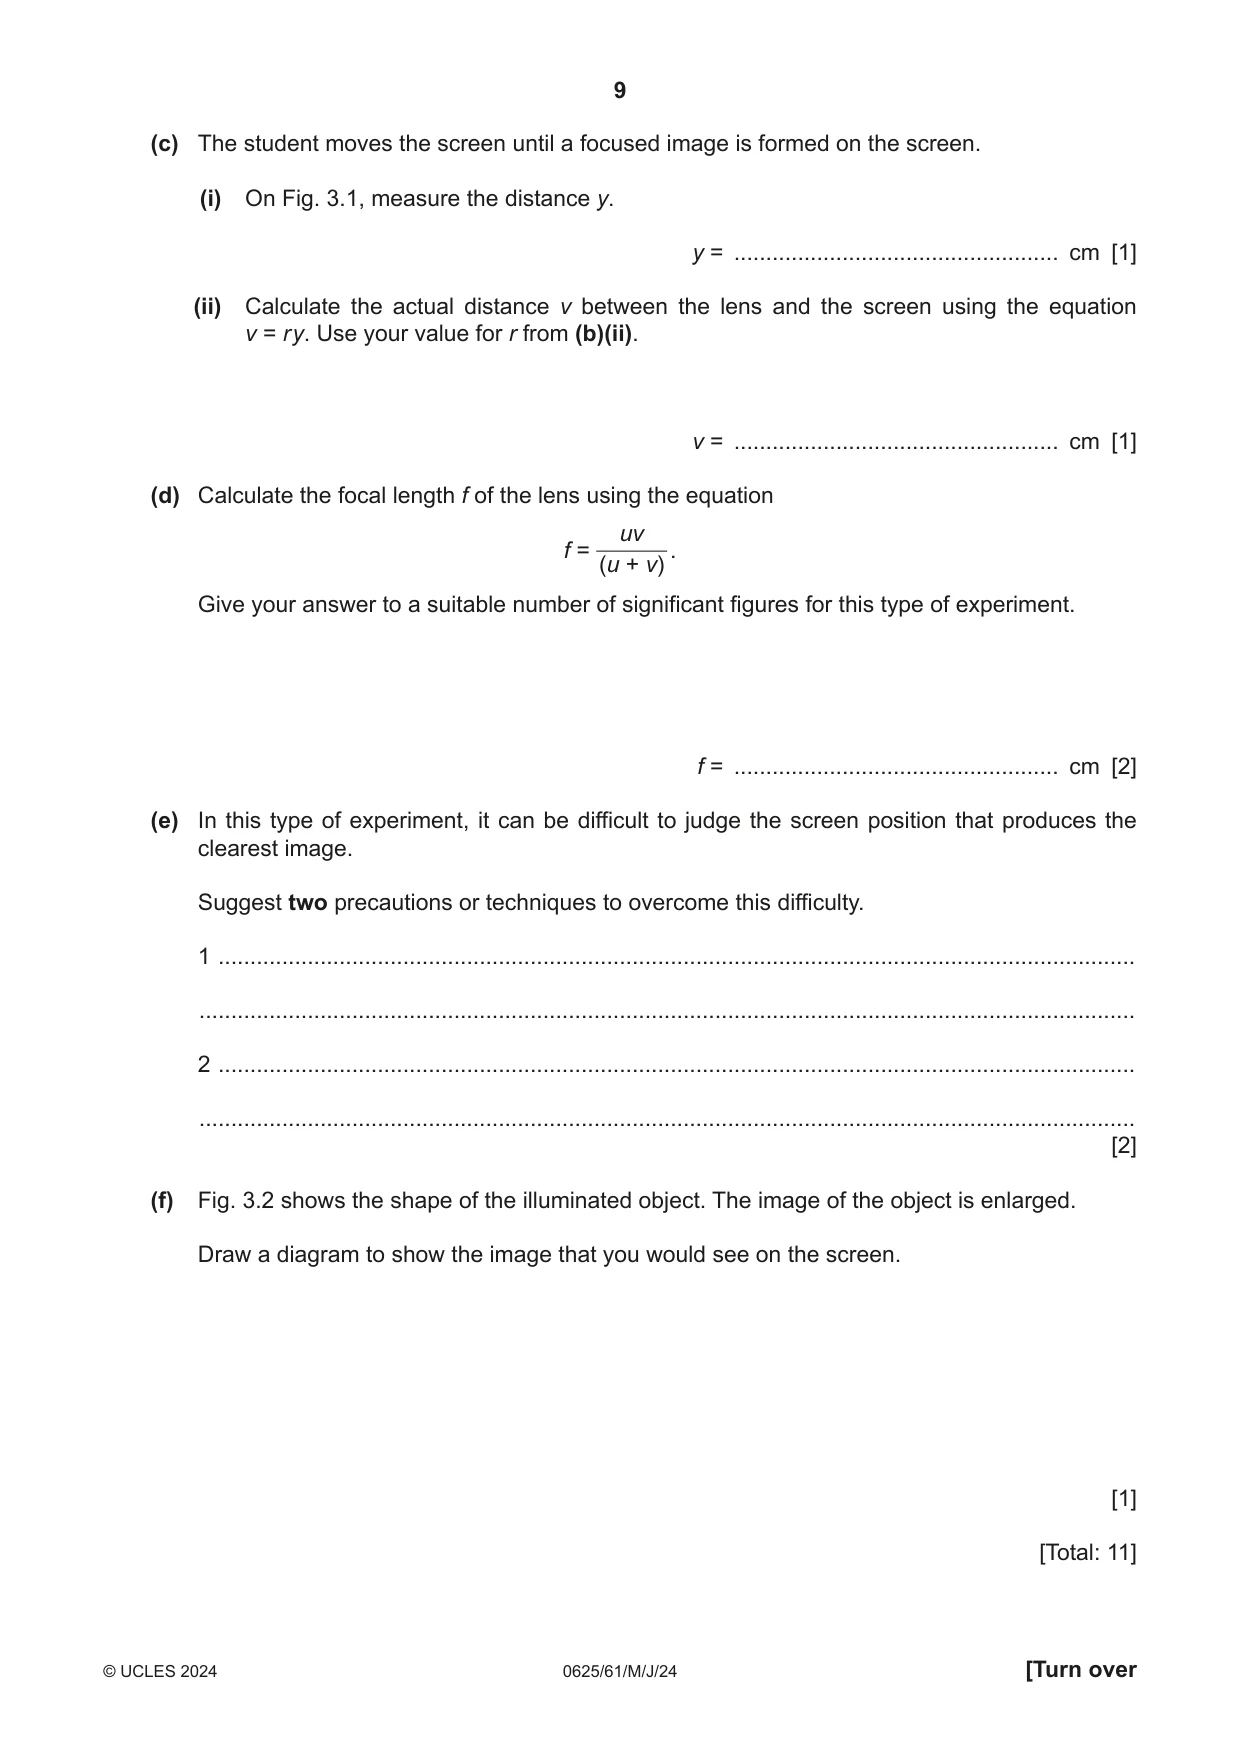
3 A student investigates the image produced by a lens. Fig. 3.1 shows the set-up. illuminated object x y screen lens bench Fig. 3.1 hO Fig. 3.2 (a) Fig. 3.2 shows the height hO of the illuminated object. On Fig. 3.2, measure hO. hO = ......................................................... [2] (b) Fig. 3.1 is drawn to scale. The actual distance u between the illuminated object and the lens is 20.0 cm. (i) On Fig. 3.1, measure the distance x. x = ......................................................... [1] (ii) Calculate the scale ratio r using the equation u r = , x where u = 20.0 cm. r = ......................................................... [1] (c) The student moves the screen until a focused image is formed on the screen. (i) On Fig. 3.1, measure the distance y. y = ................................................... cm [1] (ii) Calculate the actual distance v between the lens and the screen using the equation v = r y. Use your value for r from (b)(ii). v = ................................................... cm [1] (d) Calculate the focal length f of the lens using the equation uv f = . (u + v) Give your answer to a suitable number of significant figures for this type of experiment. f = ................................................... cm [2] (e) In this type of experiment, it can be difficult to judge the screen position that produces the clearest image. Suggest two precautions or techniques to overcome this difficulty. 1 ................................................................................................................................................ ................................................................................................................................................... 2 ................................................................................................................................................ ................................................................................................................................................... [2] (f) Fig. 3.2 shows the shape of the illuminated object. The image of the object is enlarged. Draw a diagram to show the image that you would see on the screen. [1] [Total: 11]
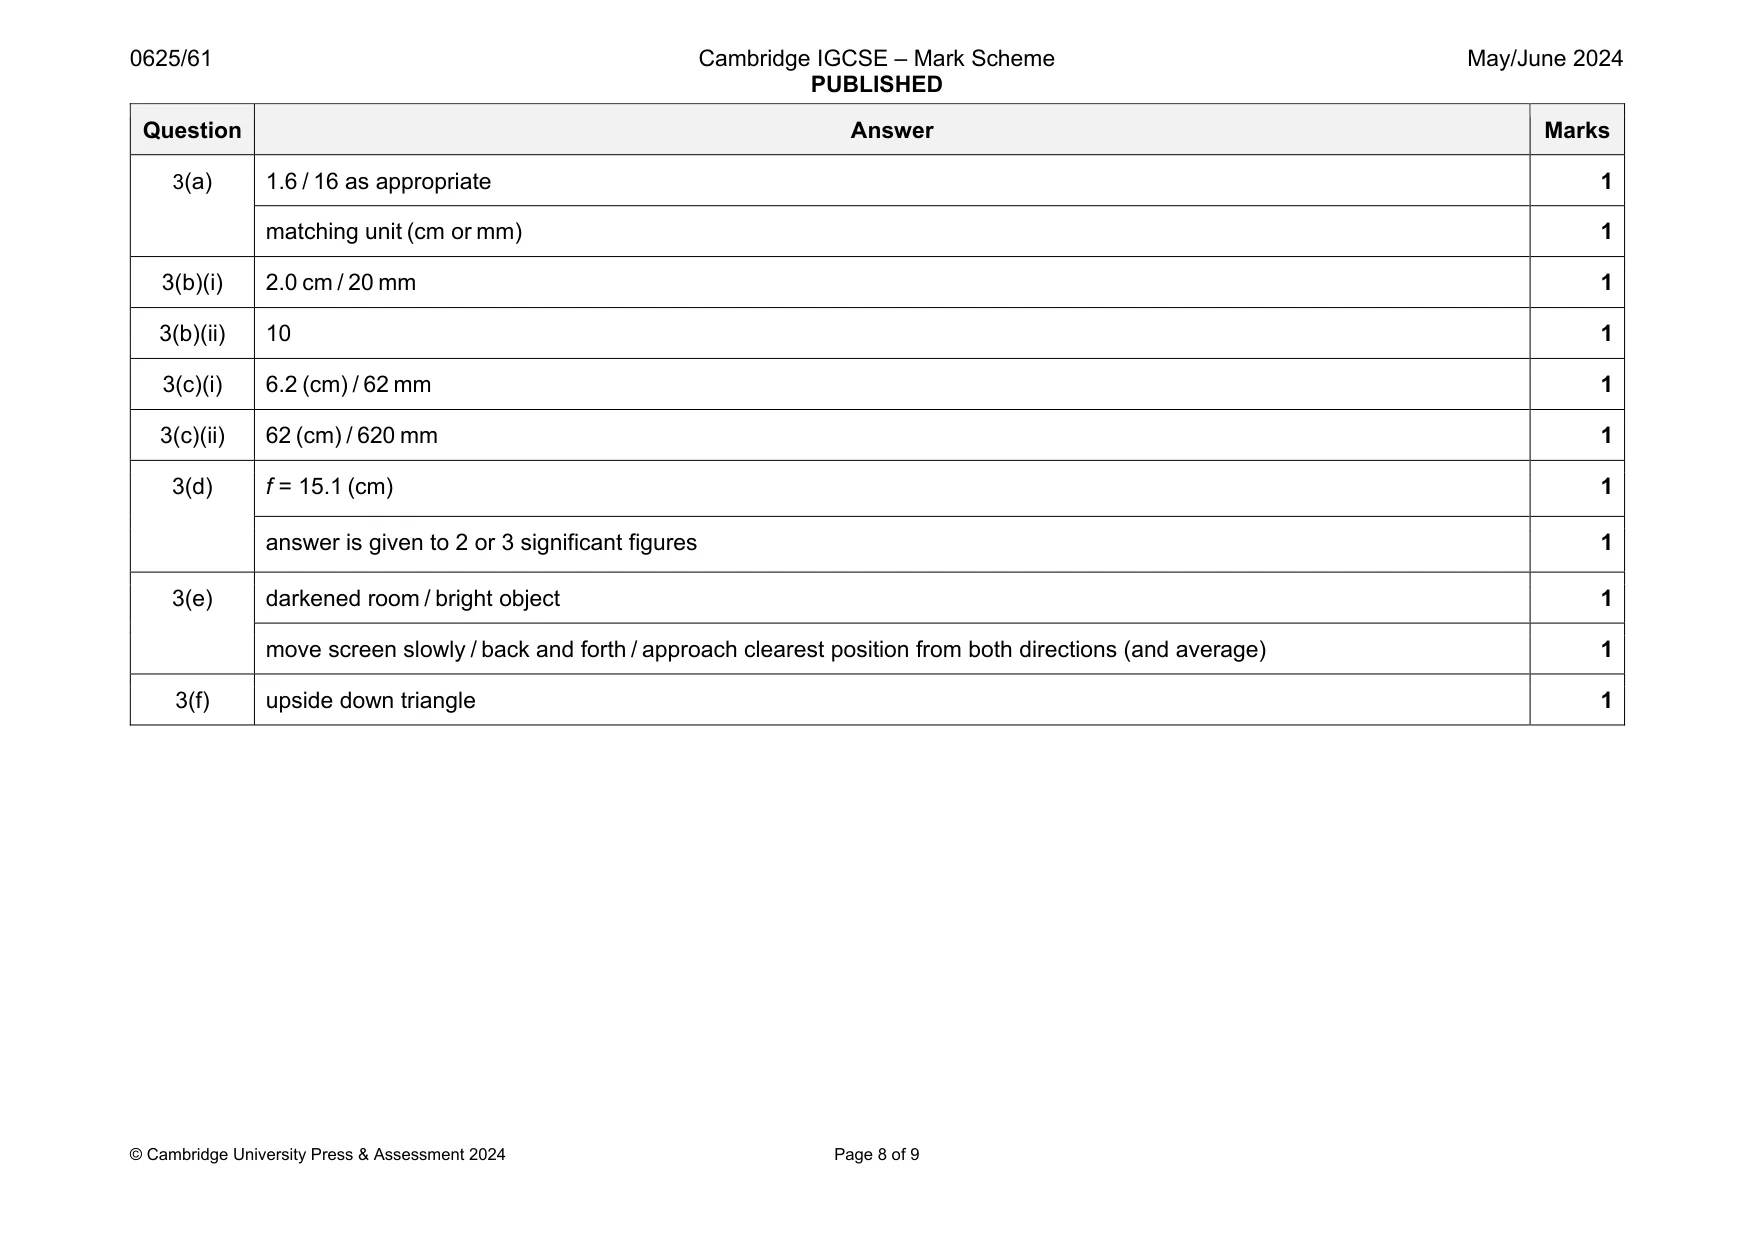
Mark scheme: 3(a) 1.6 / 16 as appropriate 1 matching unit (cm or mm) 1 3(b)(i) 2.0 cm / 20 mm 1 3(b)(ii) 10 1 3(c)(i) 6.2 (cm) / 62 mm 1 3(c)(ii) 62 (cm) / 620 mm 1 3(d) f = 15.1 (cm) 1 answer is given to 2 or 3 significant figures 1 3(e) darkened room / bright object 1 move screen slowly / back and forth / approach clearest position from both directions (and average) 1 3(f) upside down triangle 1
Q4 · A student investigates the bending of composite strips of wood when they are loaded at…
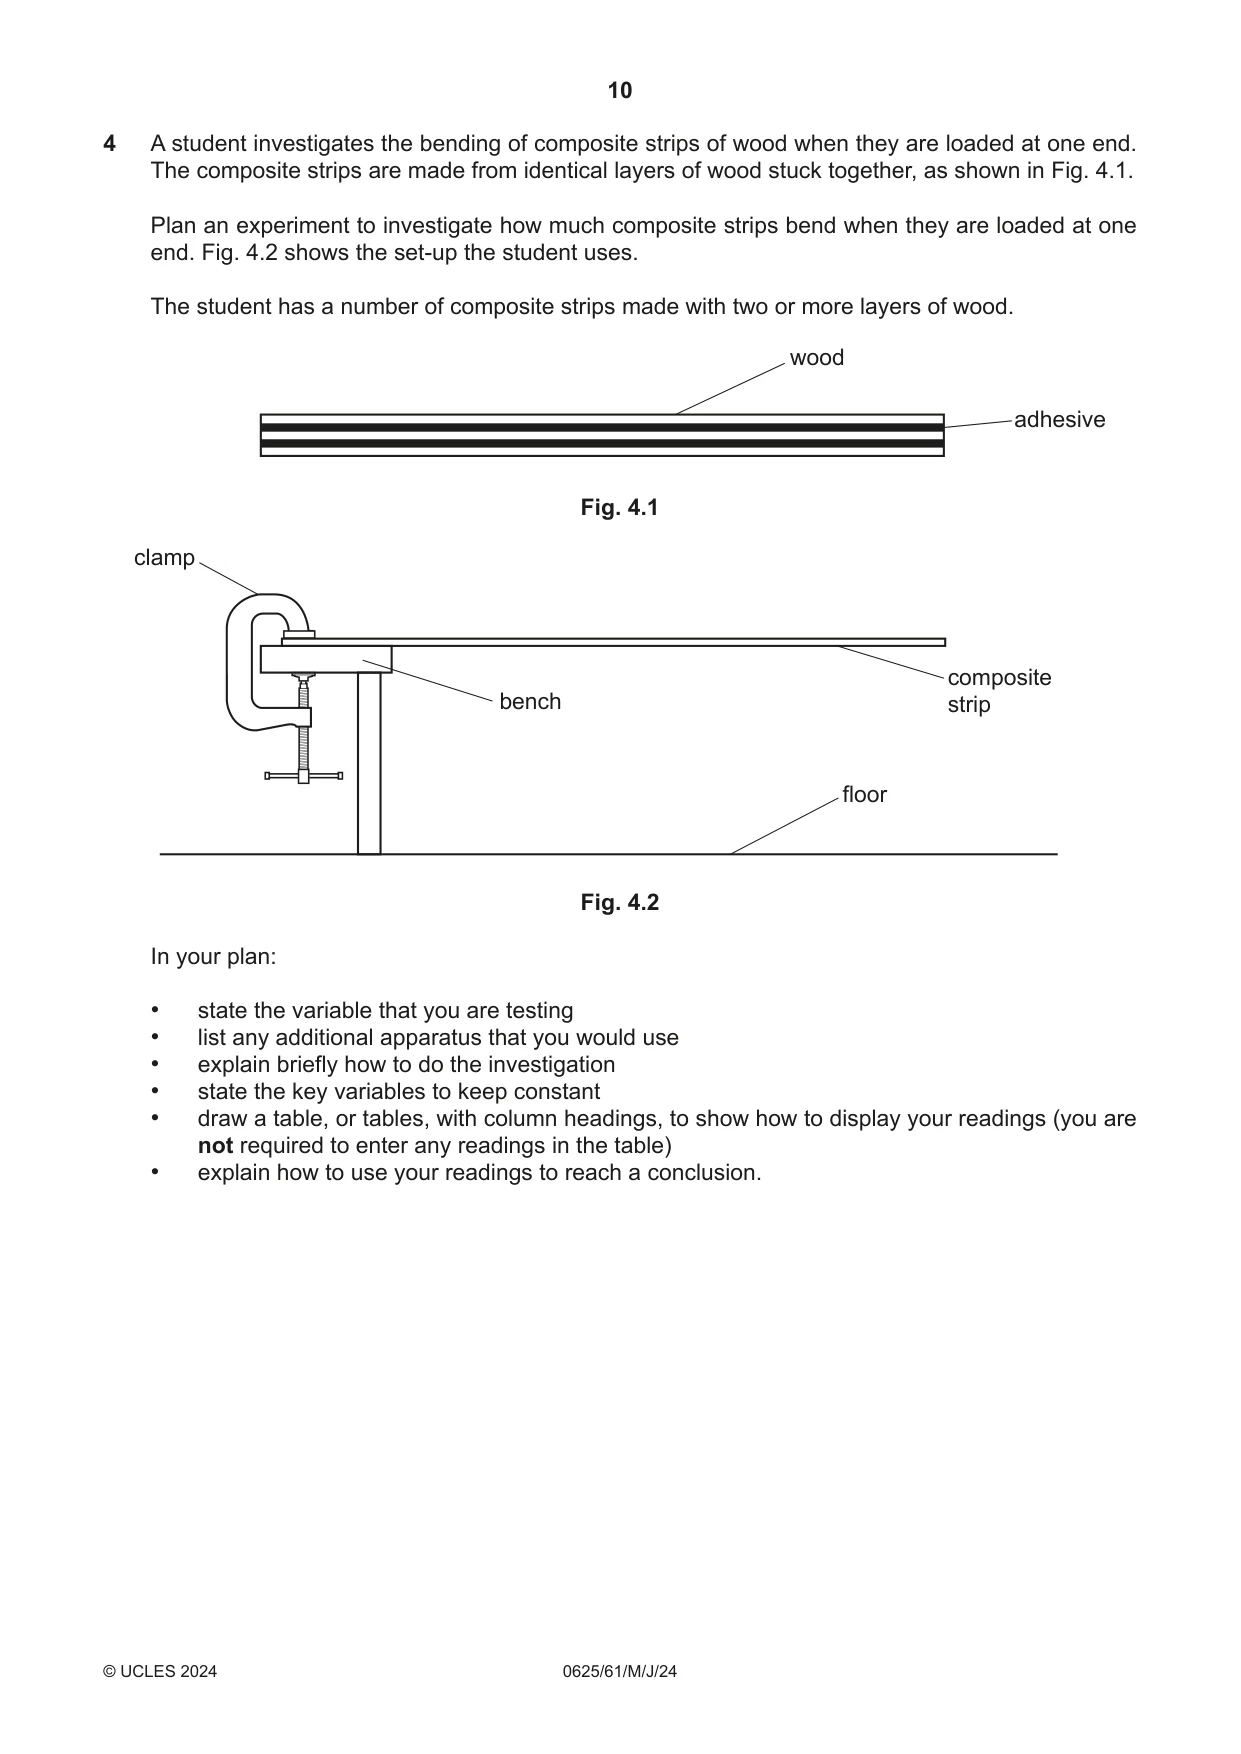
4 A student investigates the bending of composite strips of wood when they are loaded at one end. The composite strips are made from identical layers of wood stuck together, as shown in Fig. 4.1. Plan an experiment to investigate how much composite strips bend when they are loaded at one end. Fig. 4.2 shows the set-up the student uses. The student has a number of composite strips made with two or more layers of wood. wood adhesive Fig. 4.1 clamp composite bench strip floor Fig. 4.2 In your plan: • state the variable that you are testing • list any additional apparatus that you would use • explain briefly how to do the investigation • state the key variables to keep constant • draw a table, or tables, with column headings, to show how to display your readings (you are not required to enter any readings in the table) • explain how to use your readings to reach a conclusion. .......................................................................................................................................................... .......................................................................................................................................................... .......................................................................................................................................................... .......................................................................................................................................................... .......................................................................................................................................................... .......................................................................................................................................................... .......................................................................................................................................................... .......................................................................................................................................................... .......................................................................................................................................................... .......................................................................................................................................................... .......................................................................................................................................................... .......................................................................................................................................................... .......................................................................................................................................................... .......................................................................................................................................................... .......................................................................................................................................................... .......................................................................................................................................................... .......................................................................................................................................................... .......................................................................................................................................................... .......................................................................................................................................................... .................................................................................................................................................... [7]
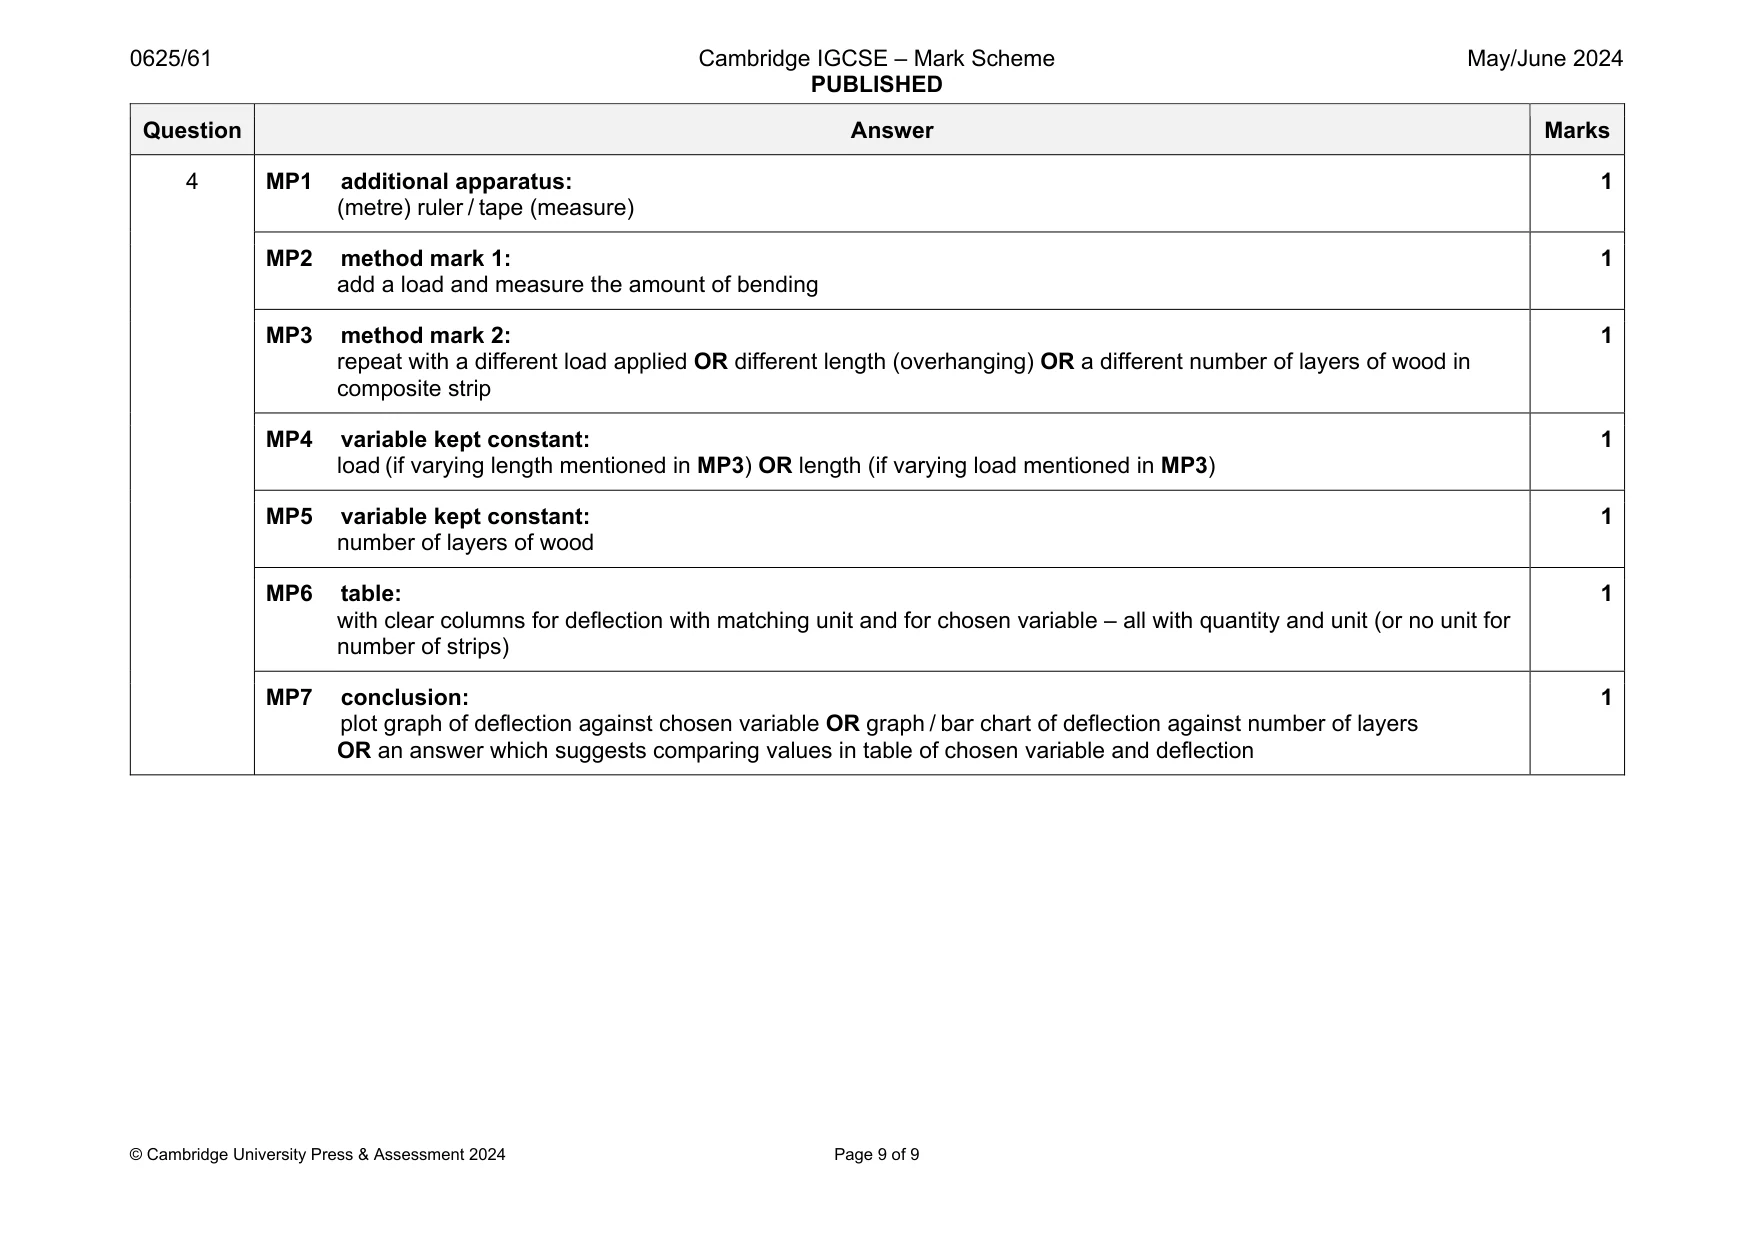
Mark scheme: 4 MP1 additional apparatus: (metre) ruler / tape (measure) 1 MP2 method mark 1: add a load and measure the amount of bending 1 MP3 method mark 2: repeat with a different load applied OR different length (overhanging) OR a different number of layers of wood in composite strip 1 MP4 variable kept constant: load (if varying length mentioned in MP3) OR length (if varying load mentioned in MP3) 1 MP5 variable kept constant: number of layers of wood 1 MP6 table: with clear columns for deflection with matching unit and for chosen variable – all with quantity and unit (or no unit for number of strips) 1 MP7 conclusion: plot graph of deflection against chosen variable OR graph / bar chart of deflection against number of layers OR an answer which suggests comparing values in table of chosen variable and deflection 1
What was in this paper
The subtopics covered by these 4 questions, and how many questions each got. Open one in a new tab to see every Cambridge question on it.
What you needed in this session
Cambridge’s own grade thresholds for 2024 May/June, Paper 6 · Variant 1. A higher threshold means an easier paper — the bar moves with how the cohort did.