Cambridge IGCSE Physics 0625 — 2014 May/June Paper 6 · Variant 3
0625/63/M/J/14 · 5 questions · 40 marks · ≈45 min
The question paper and its mark scheme, free to read here and free to download. This is Cambridge’s own paper, exactly as it was sat.
Question paper16 pages


Mark scheme4 pages
Answers below. Sit the paper first if you are practising.
Questions as text
Q1 · The IGCSE students are carrying out measurements in order to determine the density of…
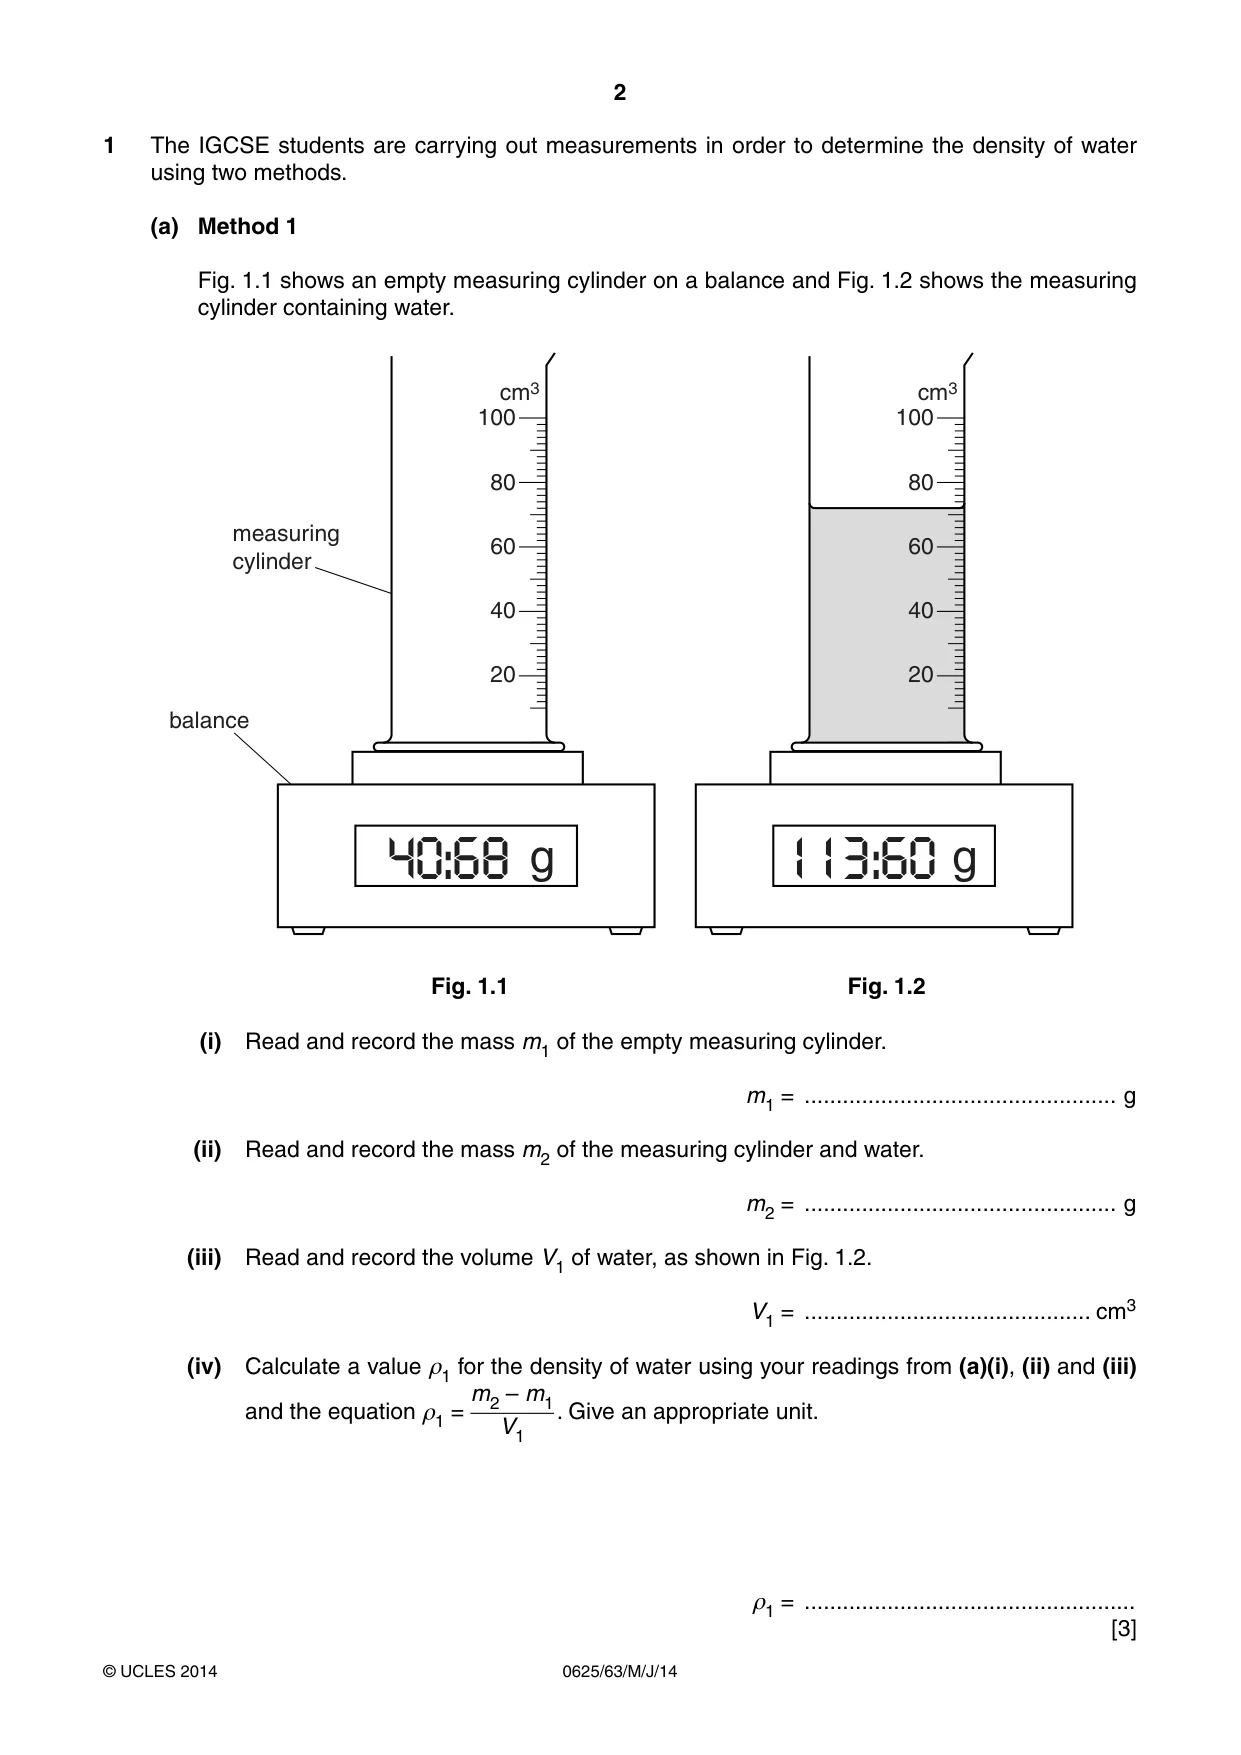
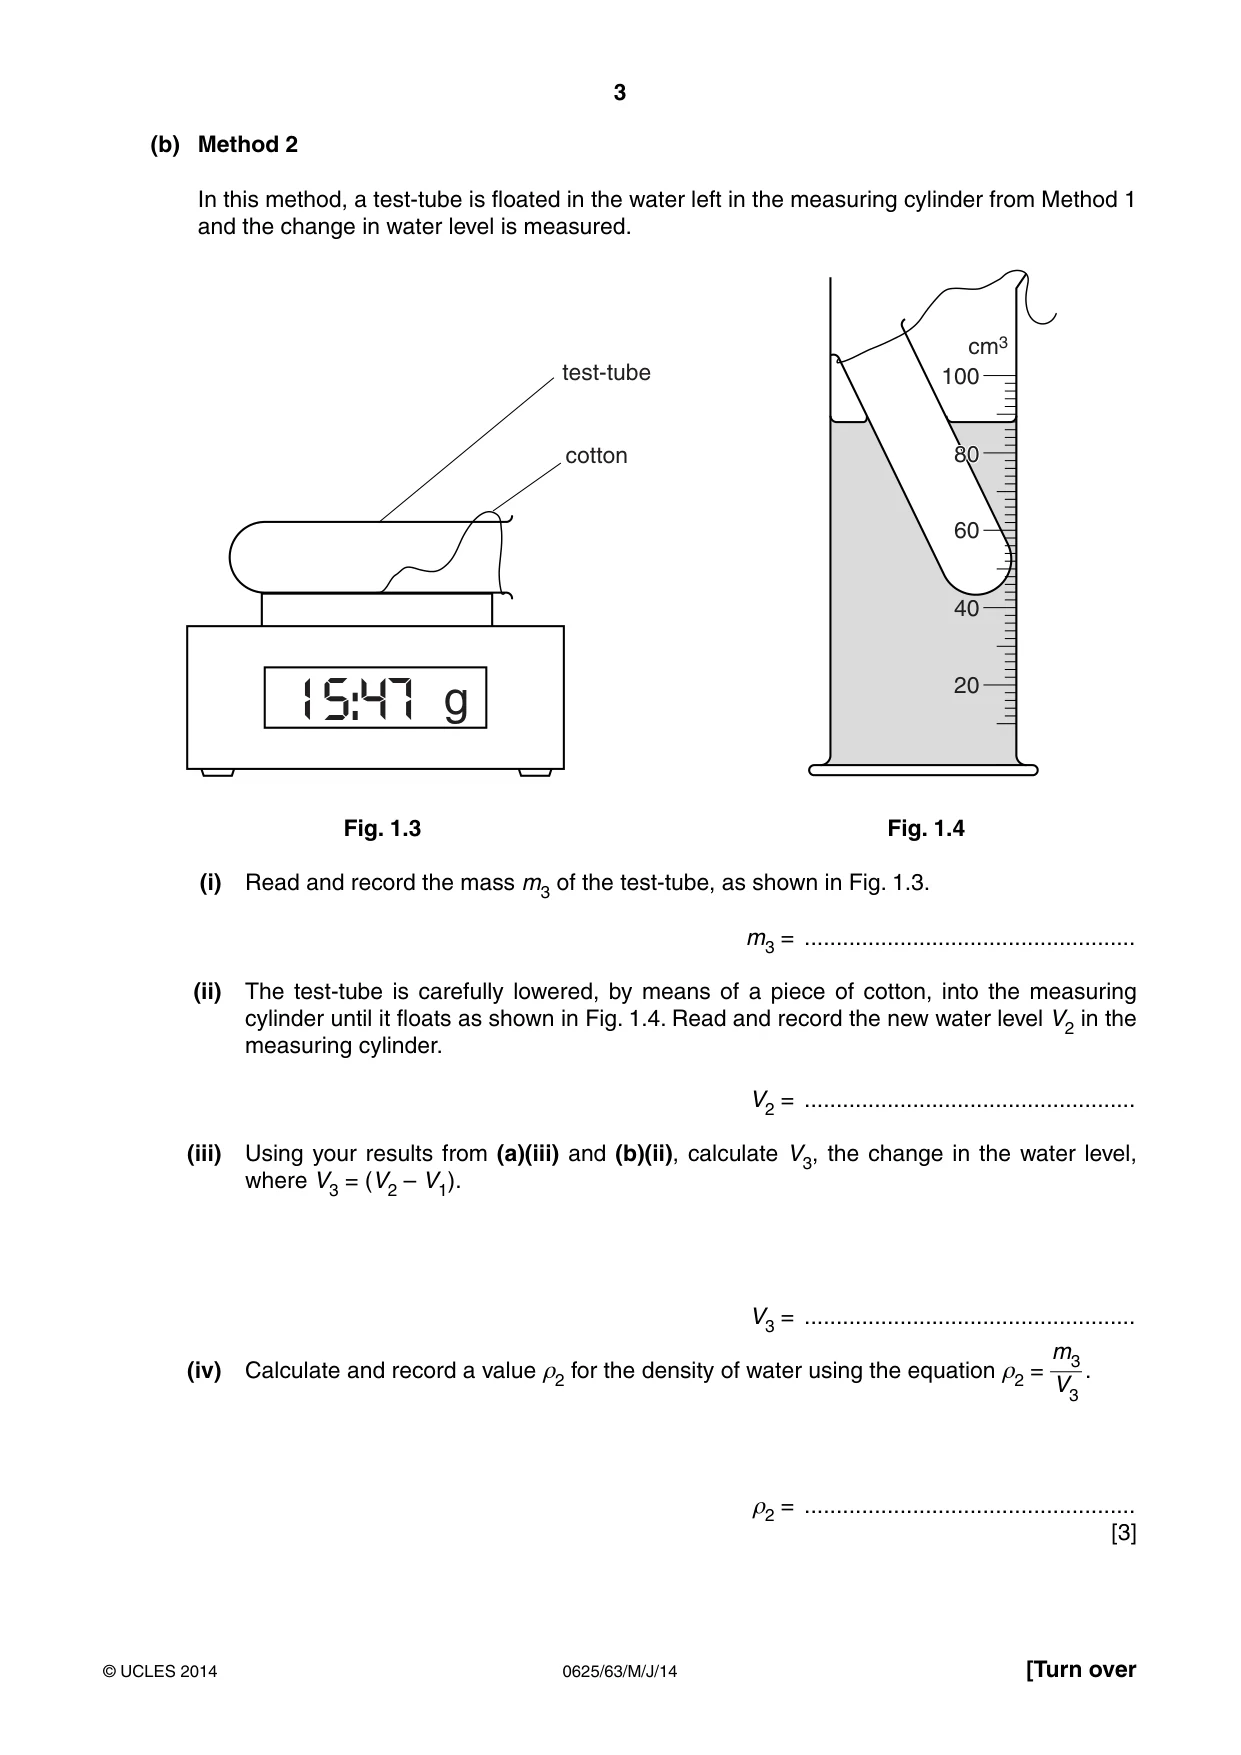
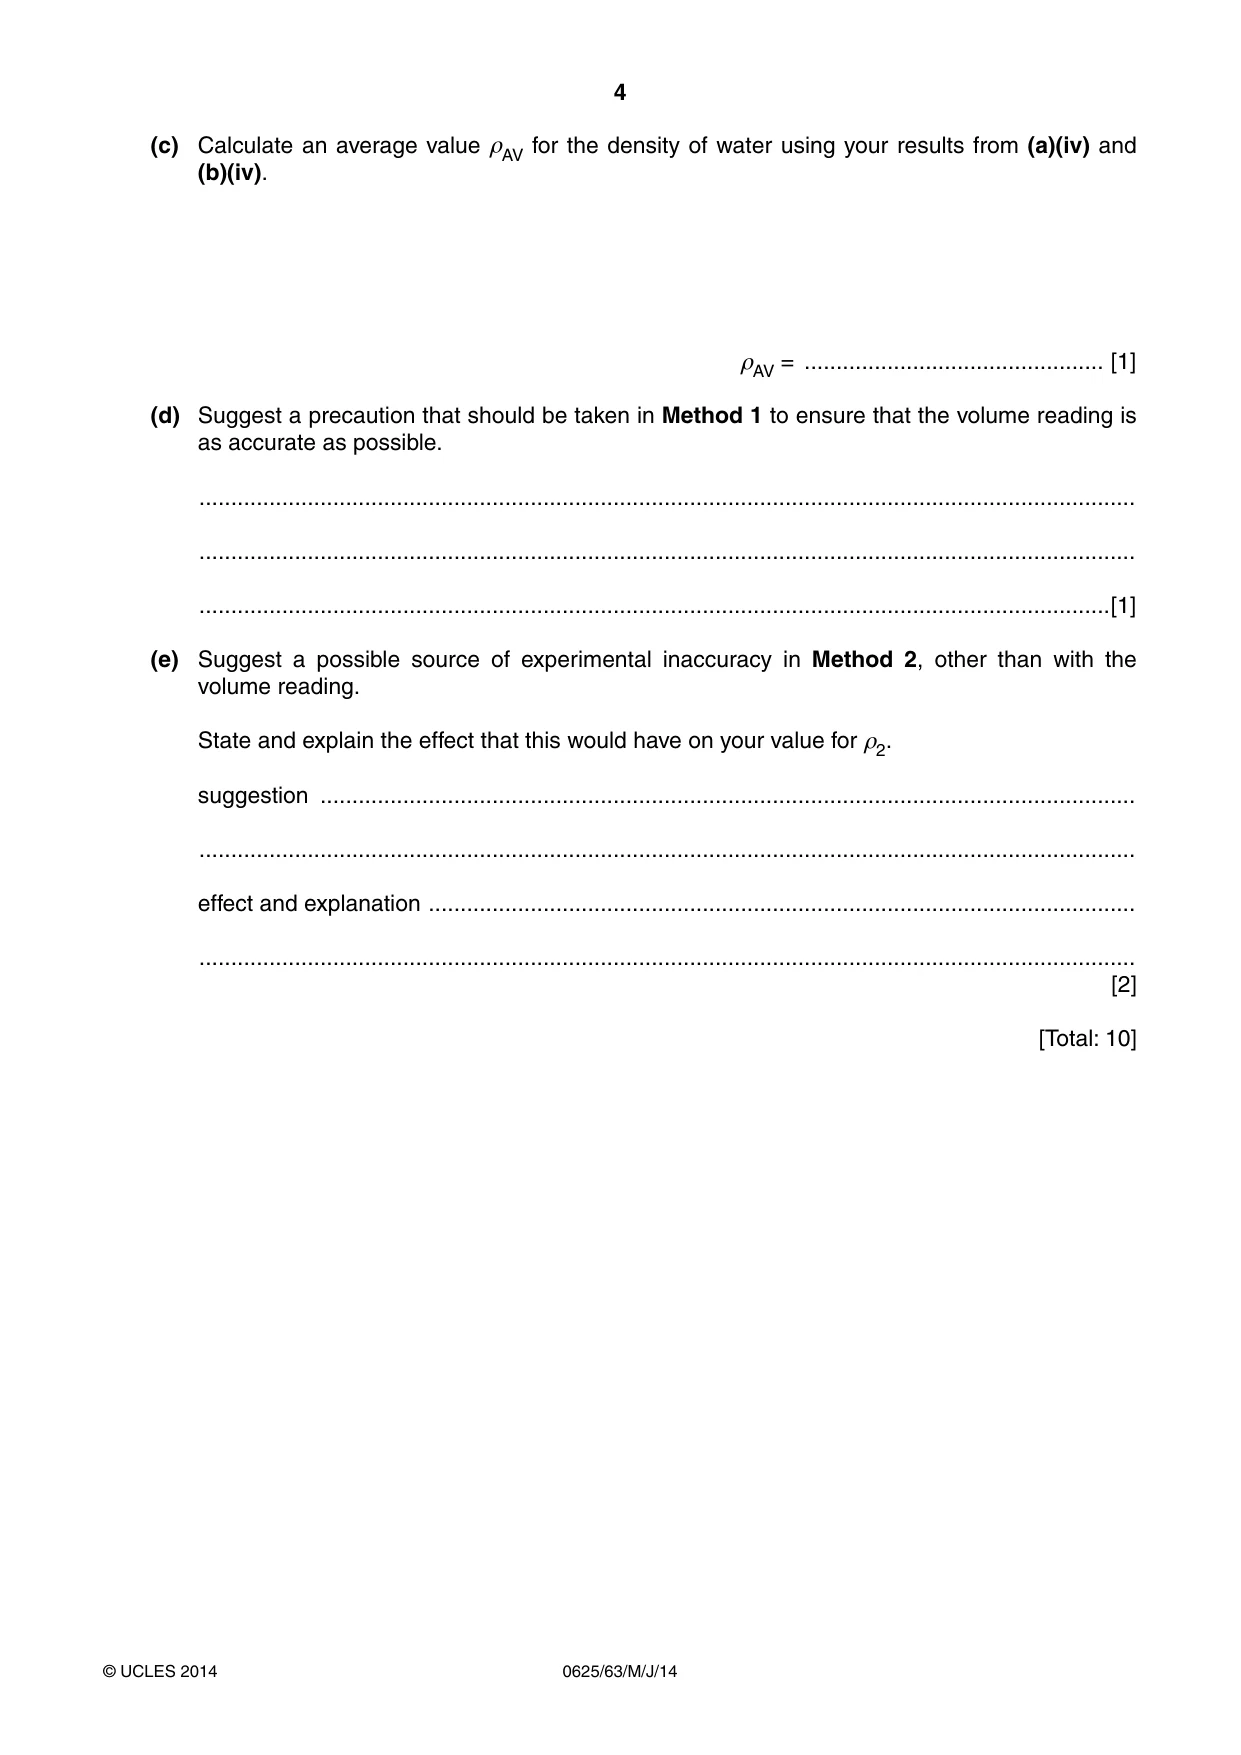
1 The IGCSE students are carrying out measurements in order to determine the density of water using two methods. (a) Method 1 Fig. 1.1 shows an empty measuring cylinder on a balance and Fig. 1.2 shows the measuring cylinder containing water. cm3 cm3 100 100 80 80 measuring 60 60 cylinder 40 40 20 20 balance g g 40:68 113:60 Fig. 1.1 Fig. 1.2 (i) Read and record the mass m1 of the empty measuring cylinder. m1 = ................................................. g (ii) Read and record the mass m2 of the measuring cylinder and water. m2 = ................................................. g (iii) Read and record the volume V1 of water, as shown in Fig. 1.2. V1 = ............................................. cm3 (iv) Calculate a value ρ1 for the density of water using your readings from (a)(i), (ii) and (iii) m2 – m1 and the equation ρ1 = . Give an appropriate unit. V1 ρ1 = .................................................... [3] (b) Method 2 In this method, a test-tube is floated in the water left in the measuring cylinder from Method 1 and the change in water level is measured. cm3 test-tube 100 cotton 8080 60 40 g 20 15:47 Fig. 1.3 Fig. 1.4 (i) Read and record the mass m3 of the test-tube, as shown in Fig. 1.3. m3 = .................................................... (ii) The test-tube is carefully lowered, by means of a piece of cotton, into the measuring cylinder until it floats as shown in Fig. 1.4. Read and record the new water level V2 in the measuring cylinder. V2 = .................................................... (iii) Using your results from (a)(iii) and (b)(ii), calculate V3, the change in the water level, where V3 = (V2 – V1). V3 = .................................................... m3 (iv) Calculate and record a value ρ2 for the density of water using the equation ρ2 = . V3 ρ2 = .................................................... [3] (c) Calculate an average value ρAV for the density of water using your results from (a)(iv) and (b)(iv). ρAV = ............................................... [1] (d) Suggest a precaution that should be taken in Method 1 to ensure that the volume reading is as accurate as possible. ................................................................................................................................................... ................................................................................................................................................... ...............................................................................................................................................[1] (e) Suggest a possible source of experimental inaccuracy in Method 2, other than with the volume reading. State and explain the effect that this would have on your value for ρ2. suggestion ................................................................................................................................ ................................................................................................................................................... effect and explanation ............................................................................................................... ................................................................................................................................................... [2] [Total: 10]
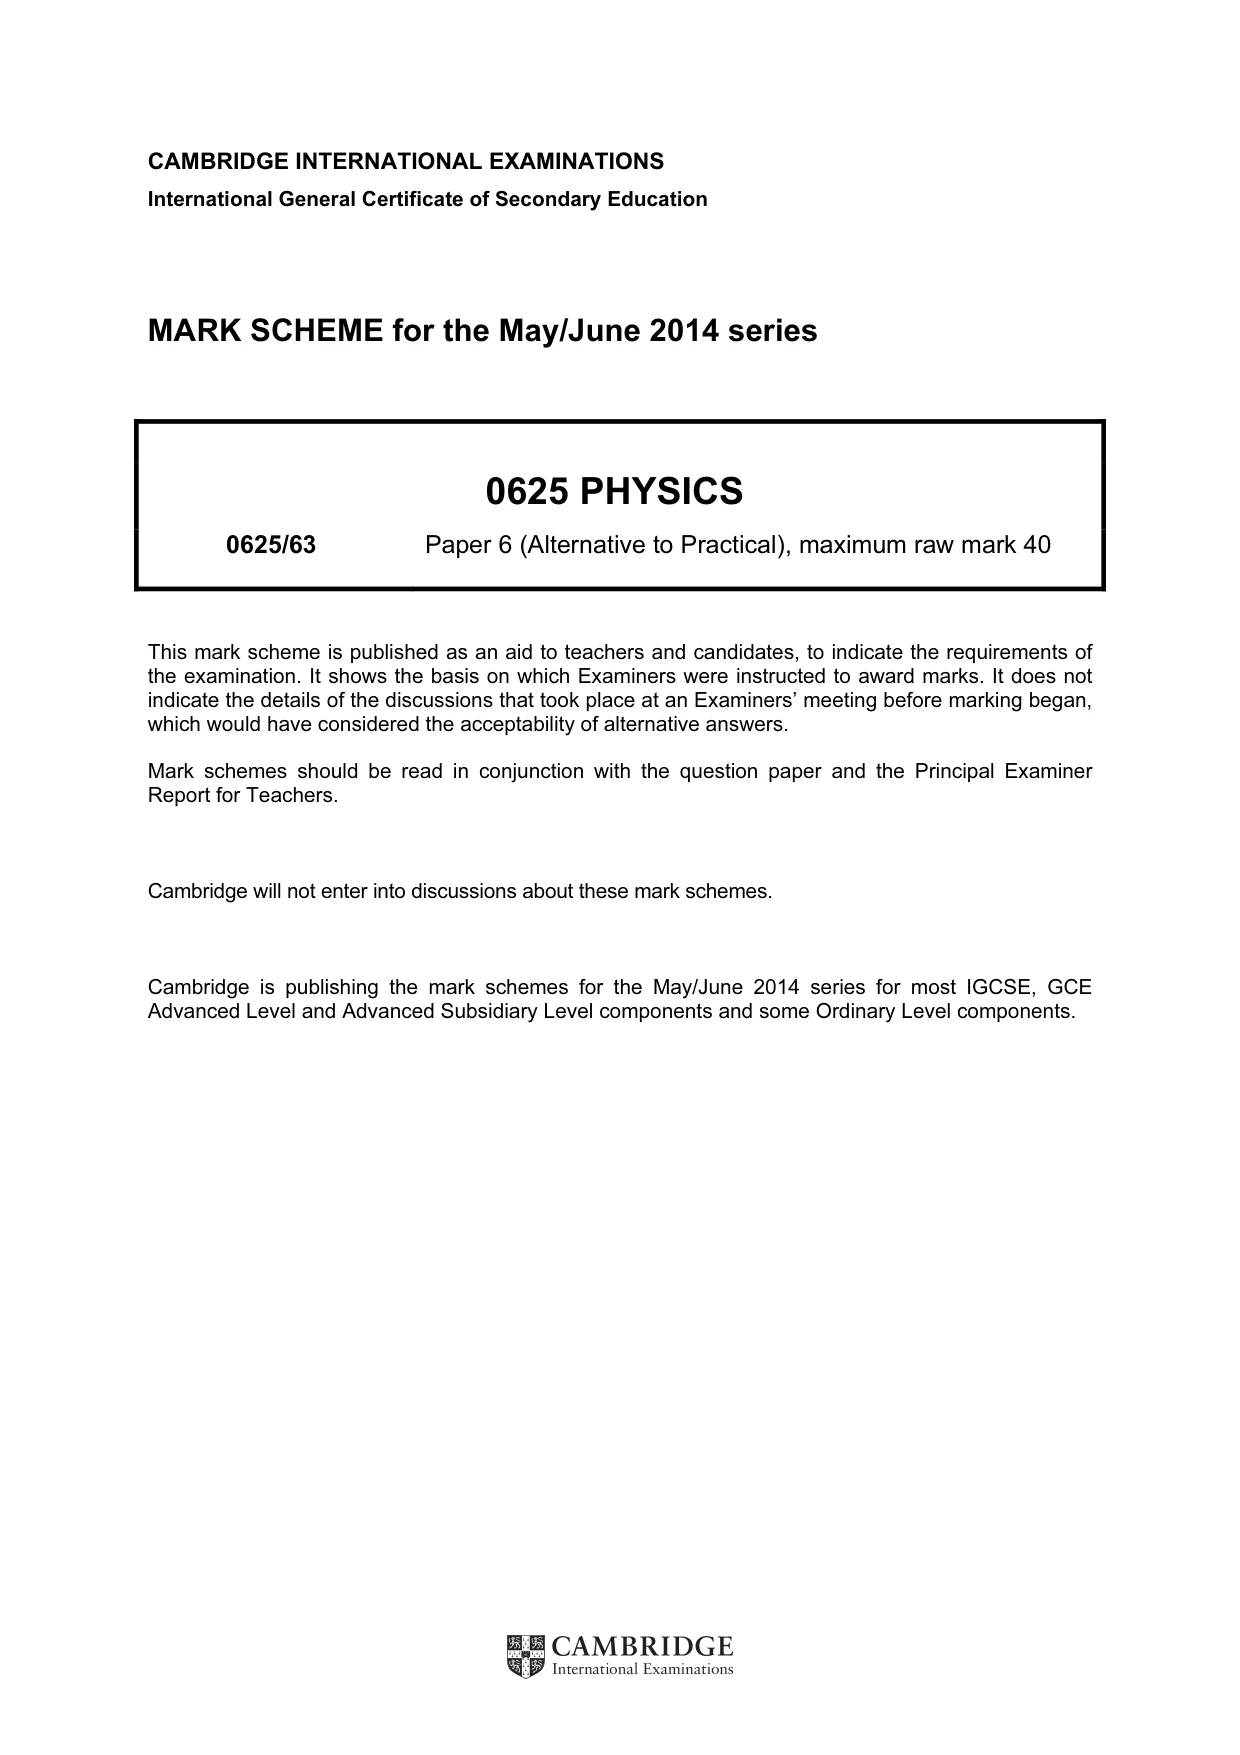
Mark scheme: 1 (a)(i)(ii) m1 R 40.68 (g) and m2 R113.60 (g) correct answer only (not 40:68, 113:60) [1] (iii) V1 R 72 (cm3) correct answer only [1] (iv) ρ1 with unit of g / cm3 or kg / m3 seen in (a), (b) or (c) and not contradicted (unit must match value) [1] (b)(i)(ii) m3 R 15.47 (g) and V2 R 88 (cm3) correct answer only [1] (iii) V3 R 16 (cm3) / ecf [1] (iv) ρ2 to 2 / 3 sig. figs. [1] (c) ρAV 0.99(1) (g / cm3) or 991 / 990 (kg / m3) or ecf from (a) and (b) [1] (d) any one from: • take reading perpendicularly / at right angles to scale • read bottom of meniscus • other suitable precaution [1] (e) appropriate source of inaccuracy, other than in (d) e.g. balance not at zero / test-tube catches on side of measuring cylinder [1] matching effect on ρ with explanation e.g. ρ greater as mass reading larger / ρ greater as volume smaller [1] [Total: 10]
Q2 · The IGCSE class is investigating the cooling of water
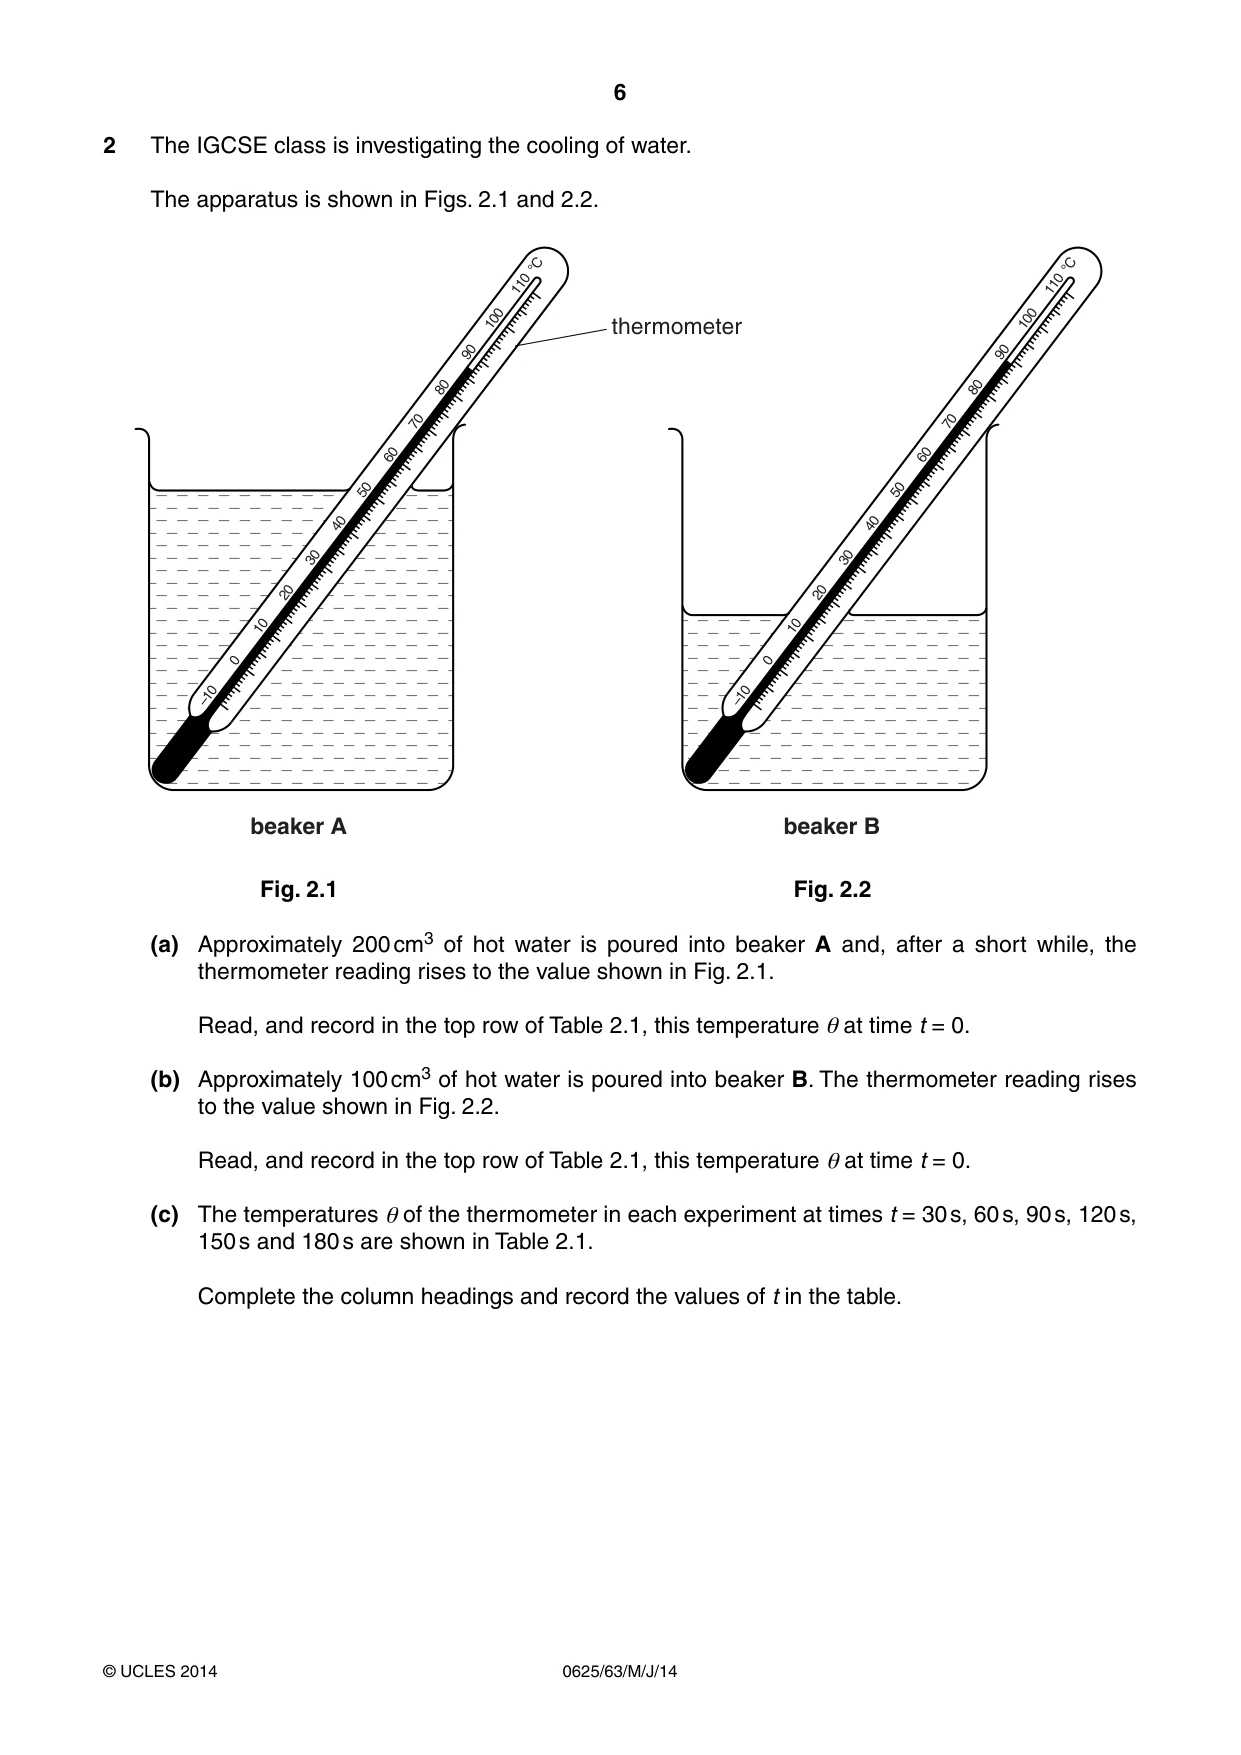
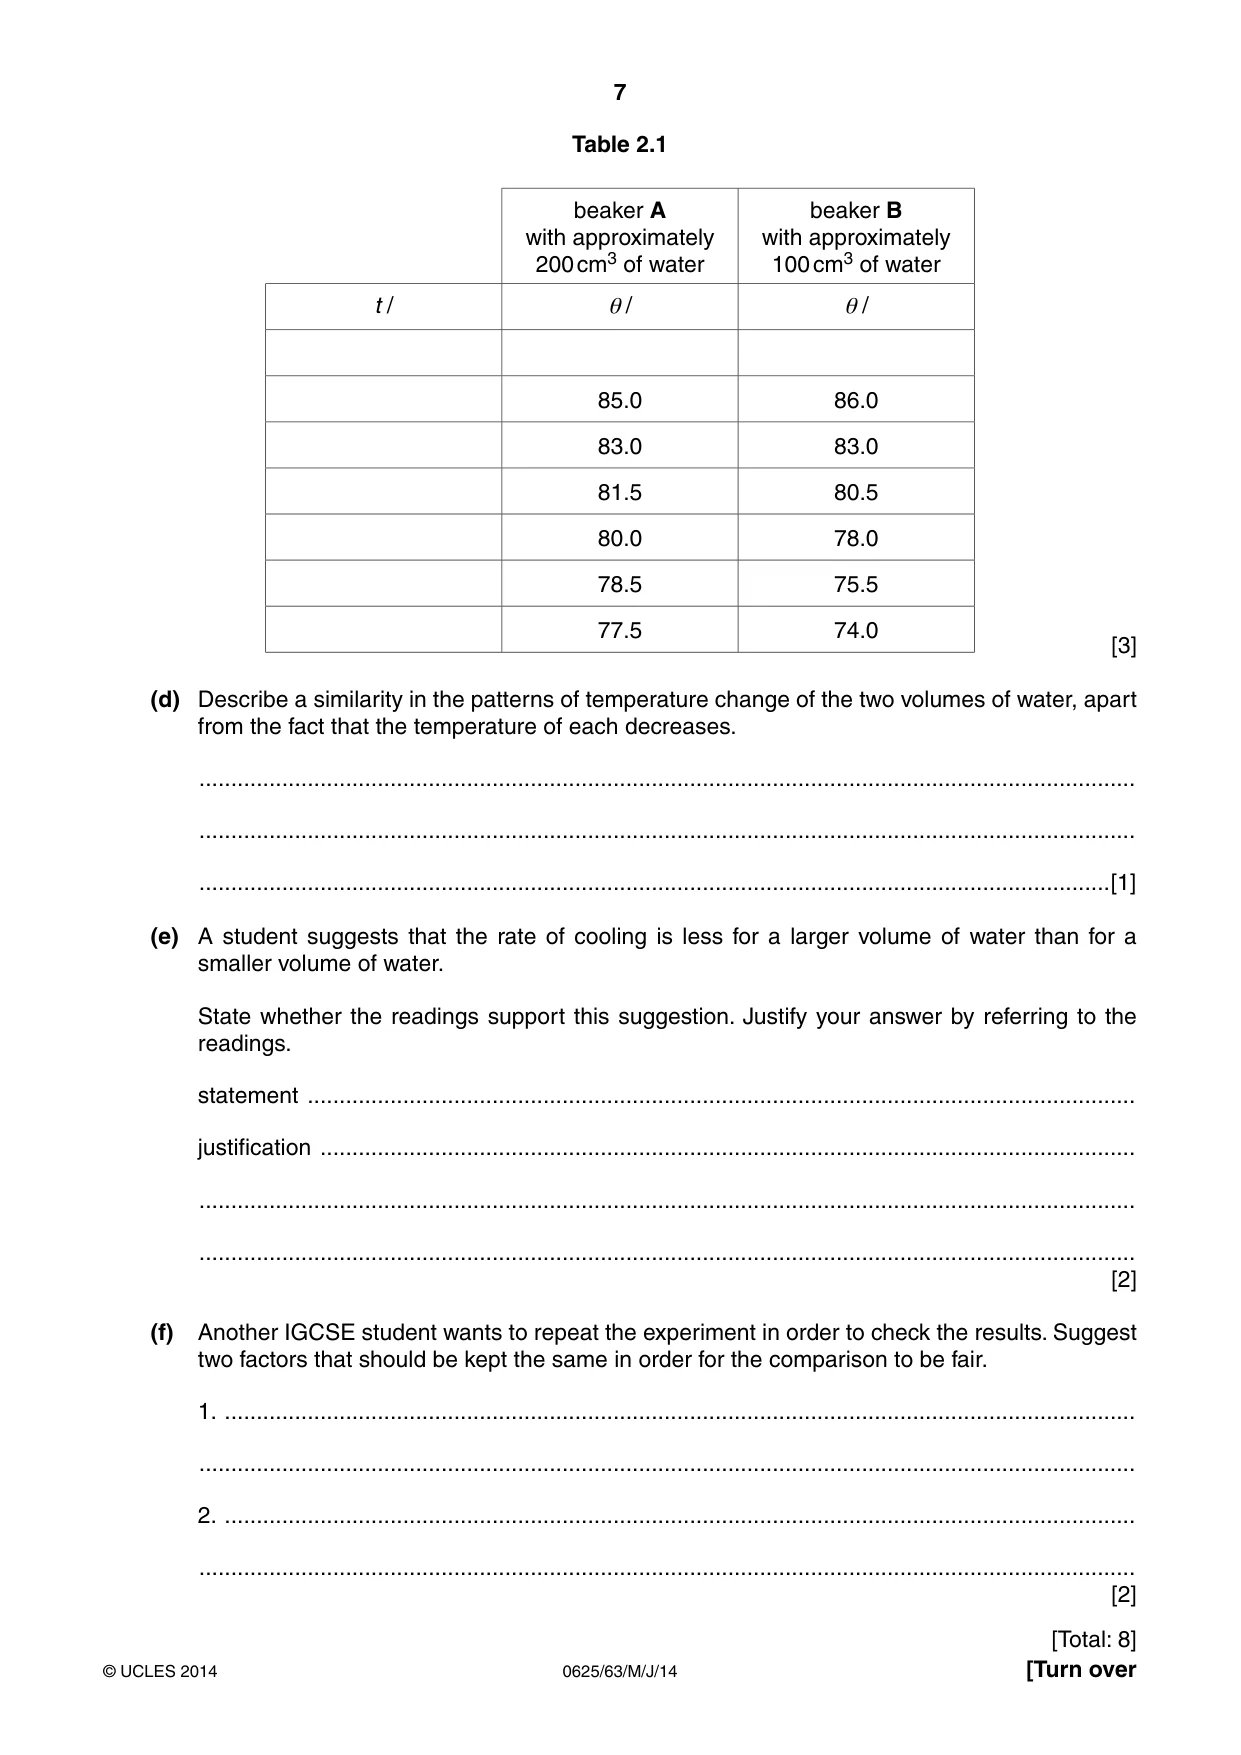
2 The IGCSE class is investigating the cooling of water. The apparatus is shown in Figs. 2.1 and 2.2. °C °C 110 110 100 100 thermometer 90 90 80 80 70 70 60 60 50 50 40 40 30 30 20 20 10 10 0 0 –10 –10 beaker A beaker B Fig. 2.1 Fig. 2.2 (a) Approximately 200 cm3 of hot water is poured into beaker A and, after a short while, the thermometer reading rises to the value shown in Fig. 2.1. Read, and record in the top row of Table 2.1, this temperature θ at time t = 0. (b) Approximately 100 cm3 of hot water is poured into beaker B. The thermometer reading rises to the value shown in Fig. 2.2. Read, and record in the top row of Table 2.1, this temperature θ at time t = 0. (c) The temperatures θ of the thermometer in each experiment at times t = 30 s, 60 s, 90 s, 120 s, 150 s and 180 s are shown in Table 2.1. Complete the column headings and record the values of t in the table. Table 2.1 beaker A beaker B with approximately with approximately 200 cm3 of water 100 cm3 of water t / θ / θ / 85.0 86.0 83.0 83.0 81.5 80.5 80.0 78.0 78.5 75.5 77.5 74.0 [3] (d) Describe a similarity in the patterns of temperature change of the two volumes of water, apart from the fact that the temperature of each decreases. ................................................................................................................................................... ................................................................................................................................................... ...............................................................................................................................................[1] (e) A student suggests that the rate of cooling is less for a larger volume of water than for a smaller volume of water. State whether the readings support this suggestion. Justify your answer by referring to the readings. statement .................................................................................................................................. justification ................................................................................................................................ ................................................................................................................................................... ................................................................................................................................................... [2] (f) Another IGCSE student wants to repeat the experiment in order to check the results. Suggest two factors that should be kept the same in order for the comparison to be fair. 1. ............................................................................................................................................... ................................................................................................................................................... 2. ............................................................................................................................................... ................................................................................................................................................... [2] [Total: 8]
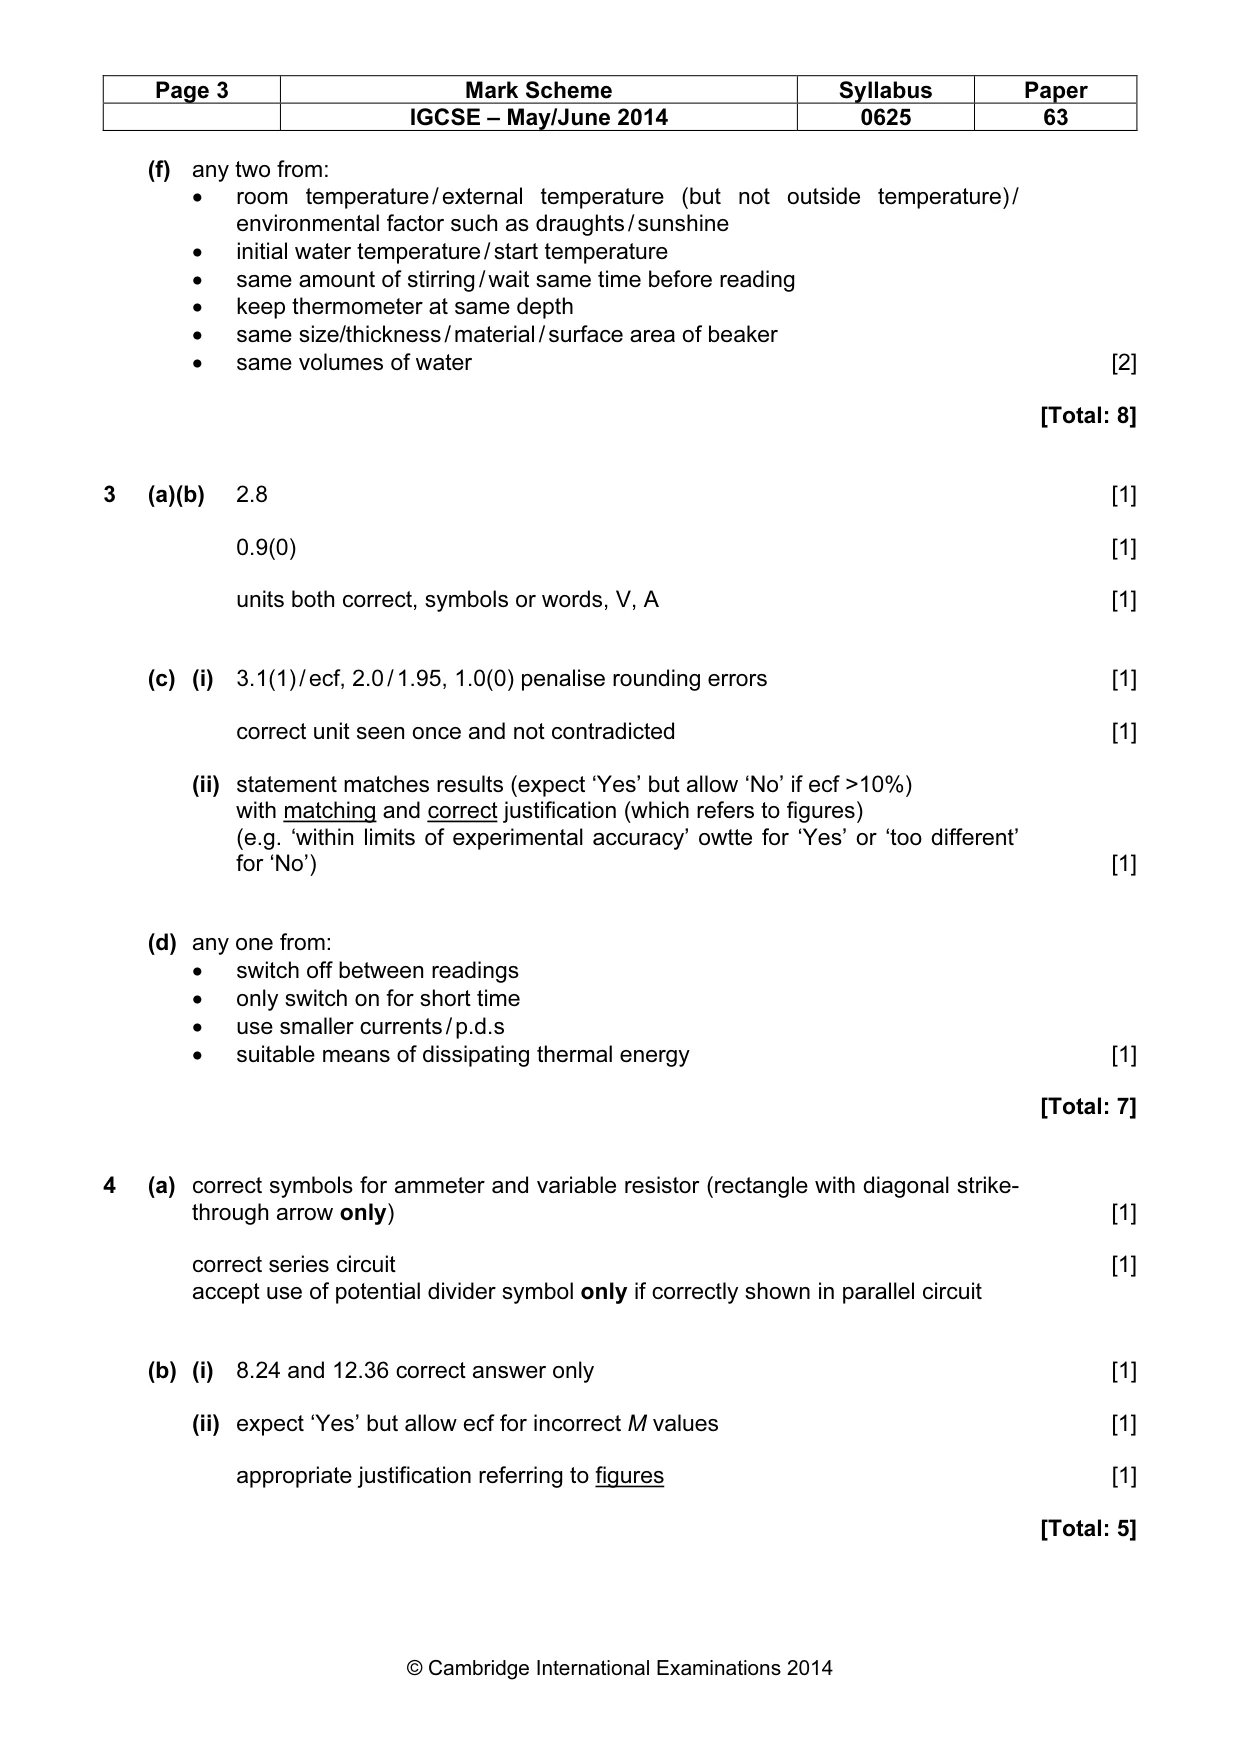
Mark scheme: 2 (a)(b) 87 and 89, both correct answer only [1] (c) units correct in symbols or words, s, UC, UC [1] t values correct 0, 30, 60, 90, 120, 150, 180 [1] (d) appropriate pattern which fully matches results e.g. rate of temperature drop greater at start than at end NOT stated pattern which partly matches results [1] (e) statement matching temperature changes (expect ‘Yes’ but accept ‘No’ or ‘no significant difference’ if ecf) [1] justification referring to results and involving comparative change in temperature with specific mention of in the same time [1] IGCSE – May/June 2014 0625 63 (f) any two from: • room temperature / external temperature (but not outside temperature) / environmental factor such as draughts / sunshine • initial water temperature / start temperature • same amount of stirring / wait same time before reading • keep thermometer at same depth • same size/thickness / material / surface area of beaker • same volumes of water [2] [Total: 8]
Q3 · Some IGCSE students are investigating resistance using a set of wires
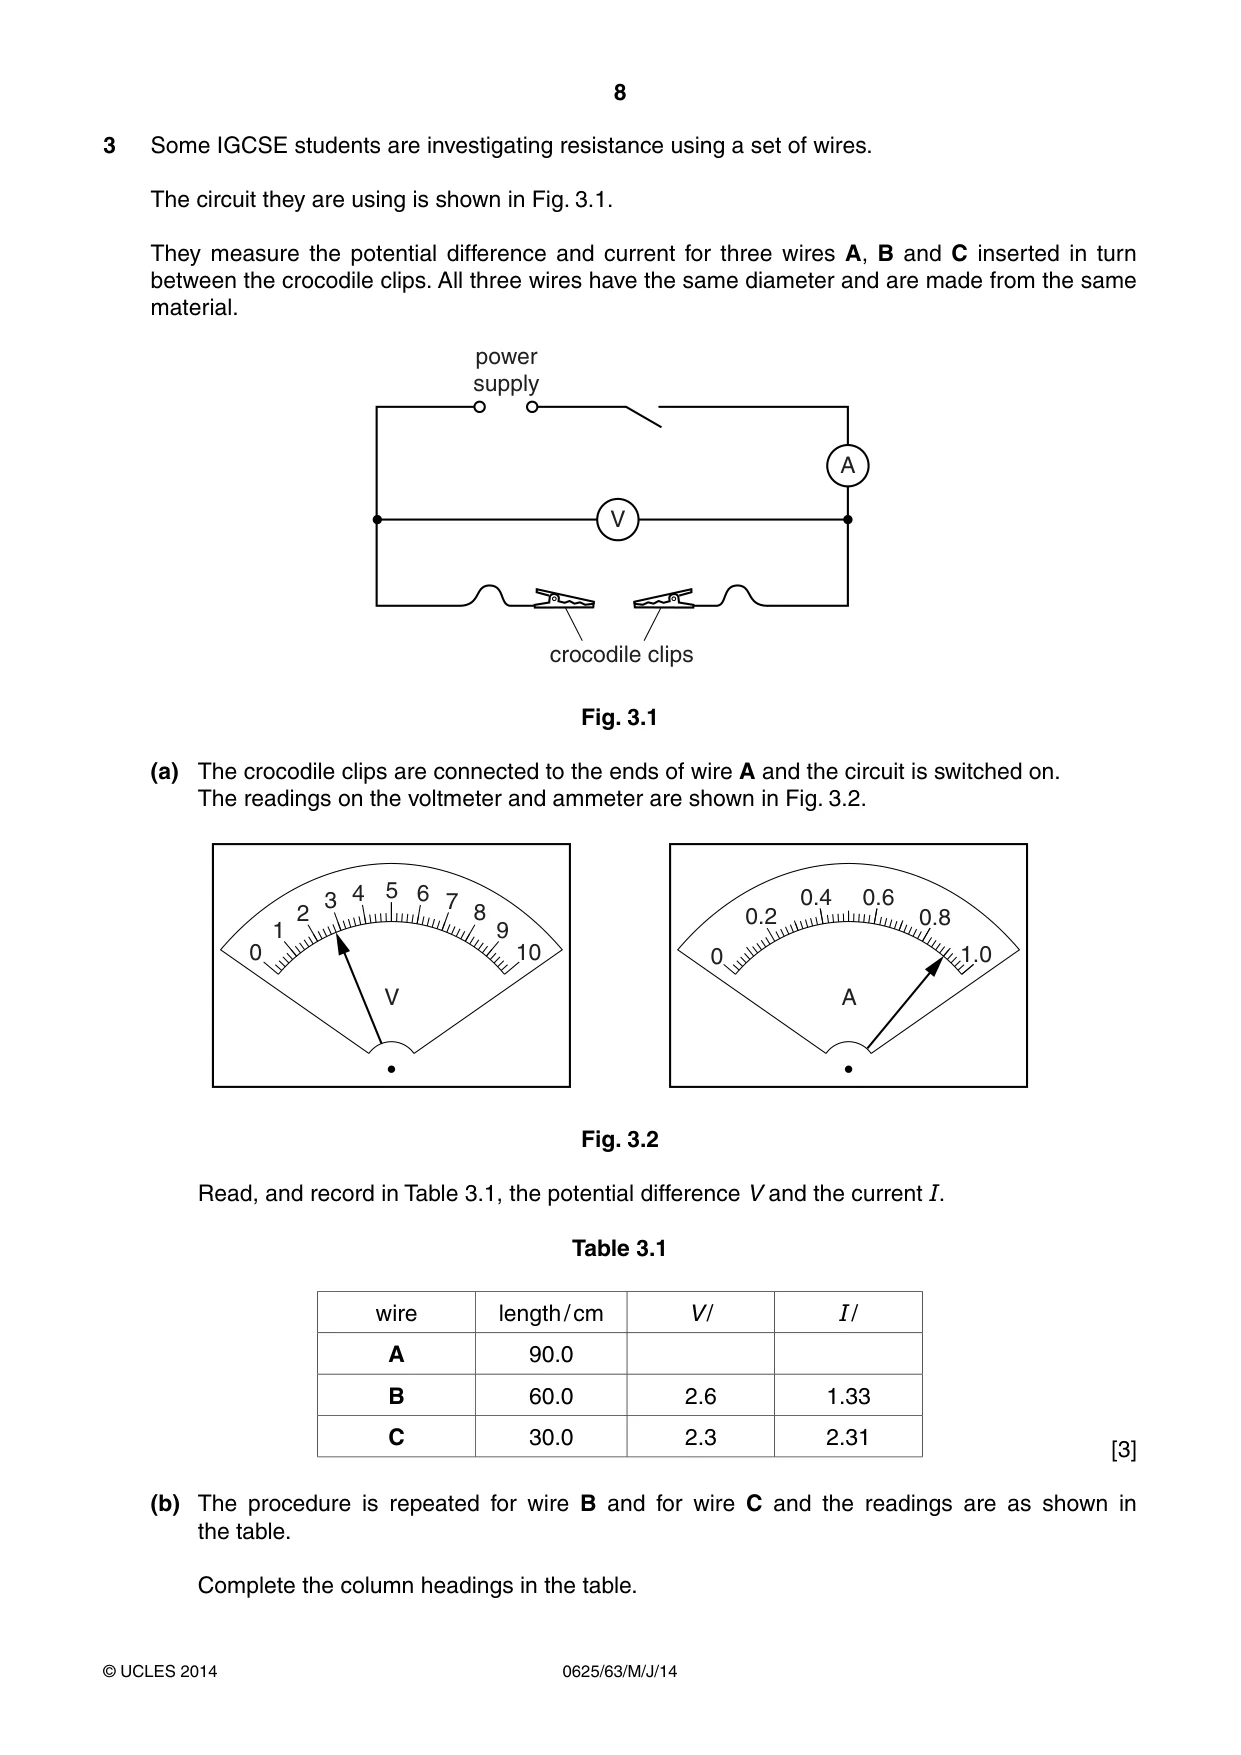
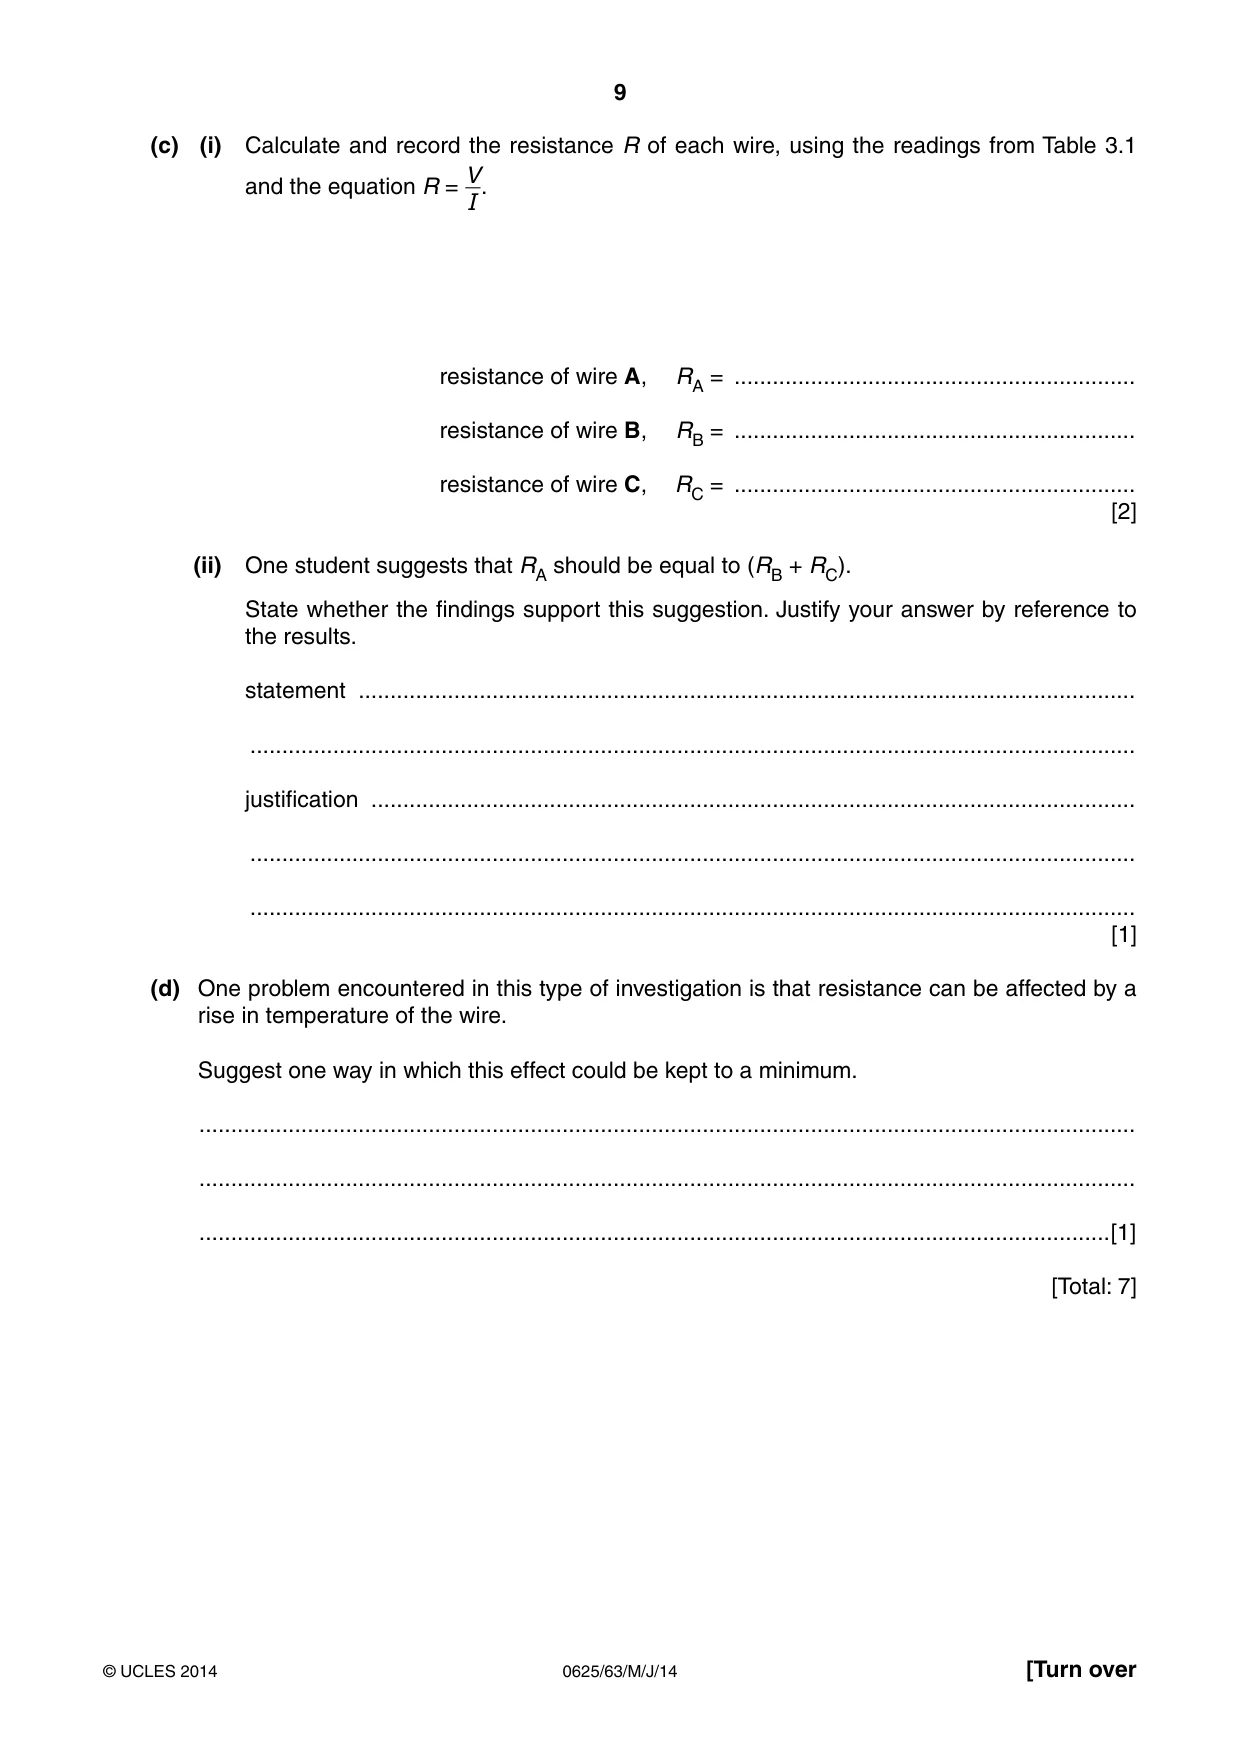
3 Some IGCSE students are investigating resistance using a set of wires. The circuit they are using is shown in Fig. 3.1. They measure the potential difference and current for three wires A, B and C inserted in turn between the crocodile clips. All three wires have the same diameter and are made from the same material. power supply A V crocodile clips Fig. 3.1 (a) The crocodile clips are connected to the ends of wire A and the circuit is switched on. The readings on the voltmeter and ammeter are shown in Fig. 3.2. 4 5 6 3 7 0.4 0.6 2 8 0.2 0.8 1 9 0 10 0 1.0 V A Fig. 3.2 Read, and record in Table 3.1, the potential difference V and the current I. Table 3.1 wire length / cm V / I / A 90.0 B 60.0 2.6 1.33 C 30.0 2.3 2.31 [3] (b) The procedure is repeated for wire B and for wire C and the readings are as shown in the table. Complete the column headings in the table. (c) (i) Calculate and record the resistance R of each wire, using the readings from Table 3.1 V and the equation R = I. resistance of wire A, RA = ............................................................... resistance of wire B, RB = ............................................................... resistance of wire C, RC = ............................................................... [2] (ii) One student suggests that RA should be equal to (RB + RC). State whether the findings support this suggestion. Justify your answer by reference to the results. statement .......................................................................................................................... ........................................................................................................................................... justification ........................................................................................................................ ........................................................................................................................................... ........................................................................................................................................... [1] (d) One problem encountered in this type of investigation is that resistance can be affected by a rise in temperature of the wire. Suggest one way in which this effect could be kept to a minimum. ................................................................................................................................................... ................................................................................................................................................... ...............................................................................................................................................[1] [Total: 7]
Mark scheme: 3 (a)(b) 2.8 [1] 0.9(0) [1] units both correct, symbols or words, V, A [1] (c) (i) 3.1(1) / ecf, 2.0 / 1.95, 1.0(0) penalise rounding errors [1] correct unit seen once and not contradicted [1] (ii) statement matches results (expect ‘Yes’ but allow ‘No’ if ecf >10%) with matching and correct justification (which refers to figures) (e.g. ‘within limits of experimental accuracy’ owtte for ‘Yes’ or ‘too different’ for ‘No’) [1] (d) any one from: • switch off between readings • only switch on for short time • use smaller currents / p.d.s • suitable means of dissipating thermal energy [1] [Total: 7]
Q4 · The IGCSE students are investigating the effect of an electromagnet
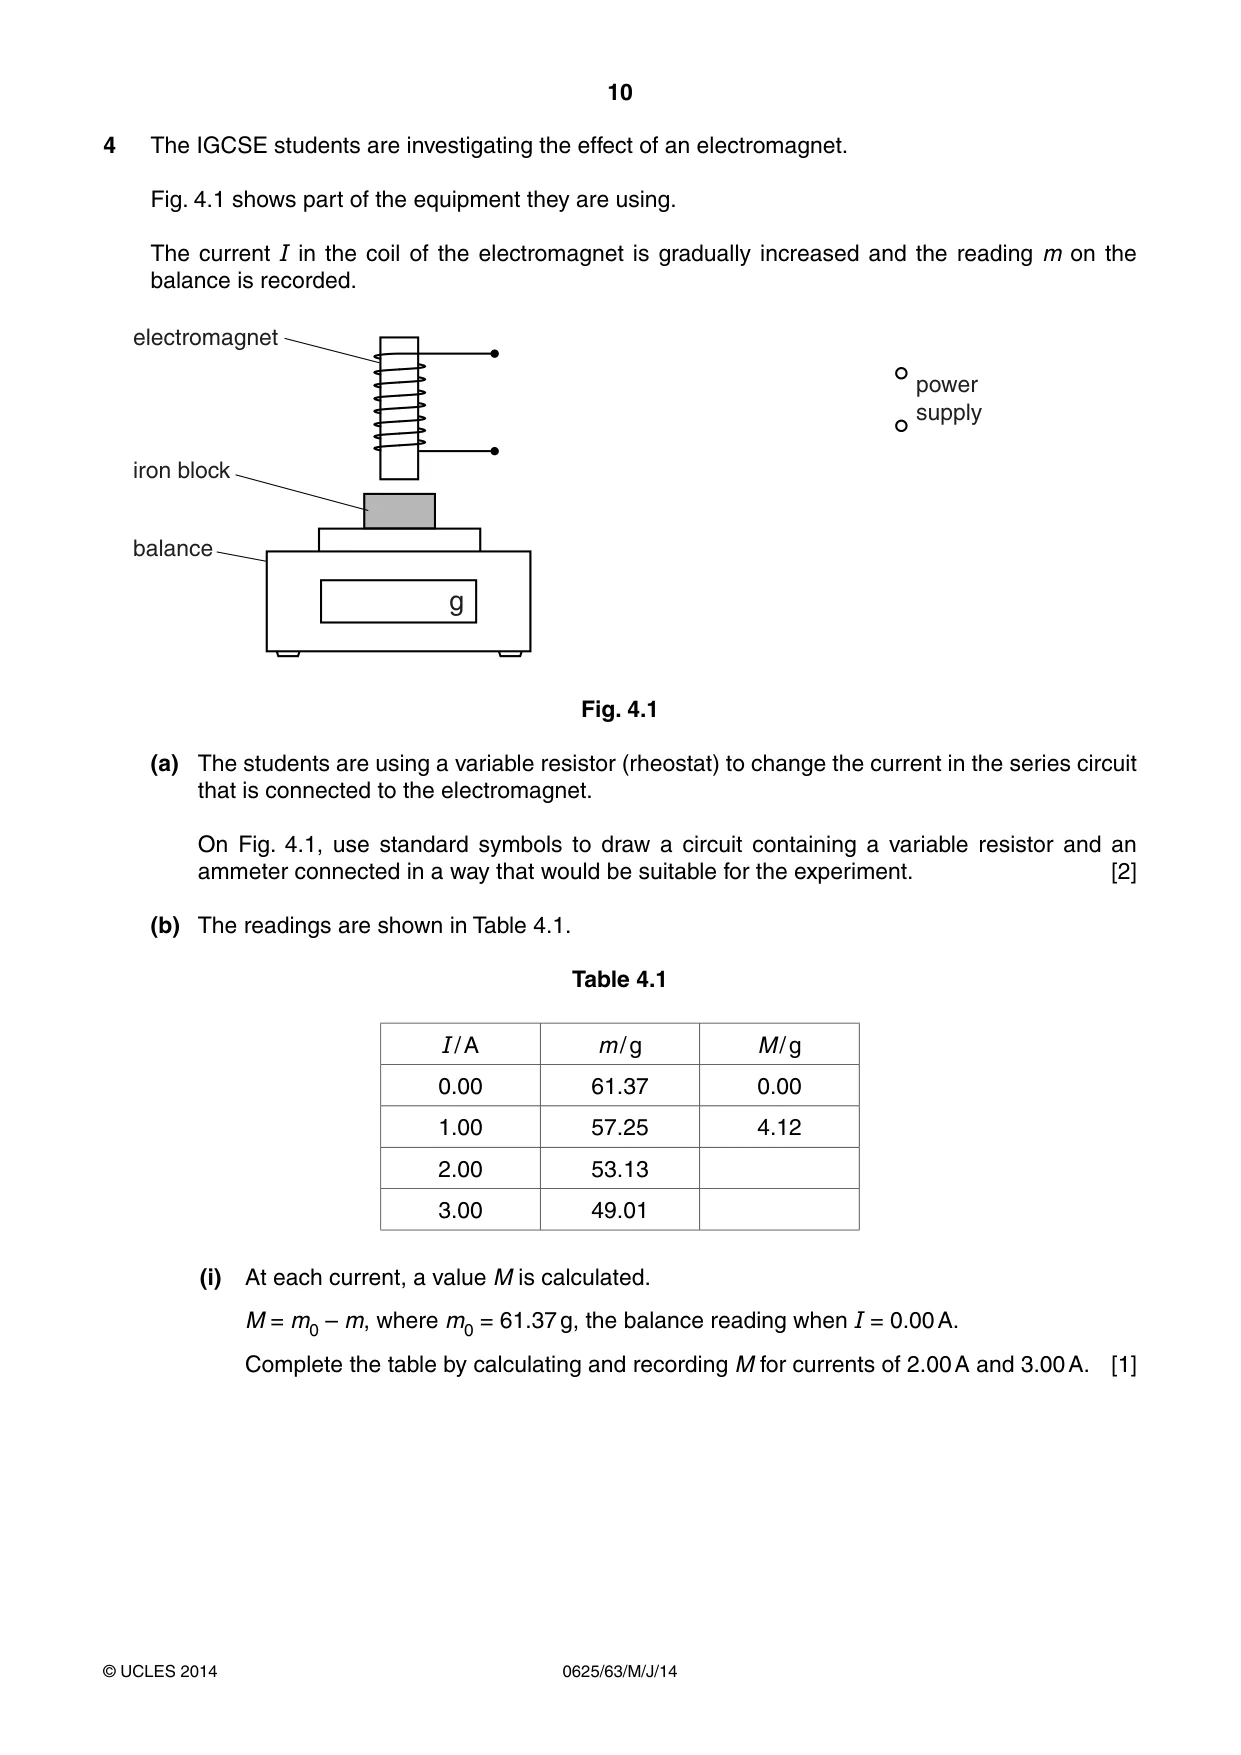
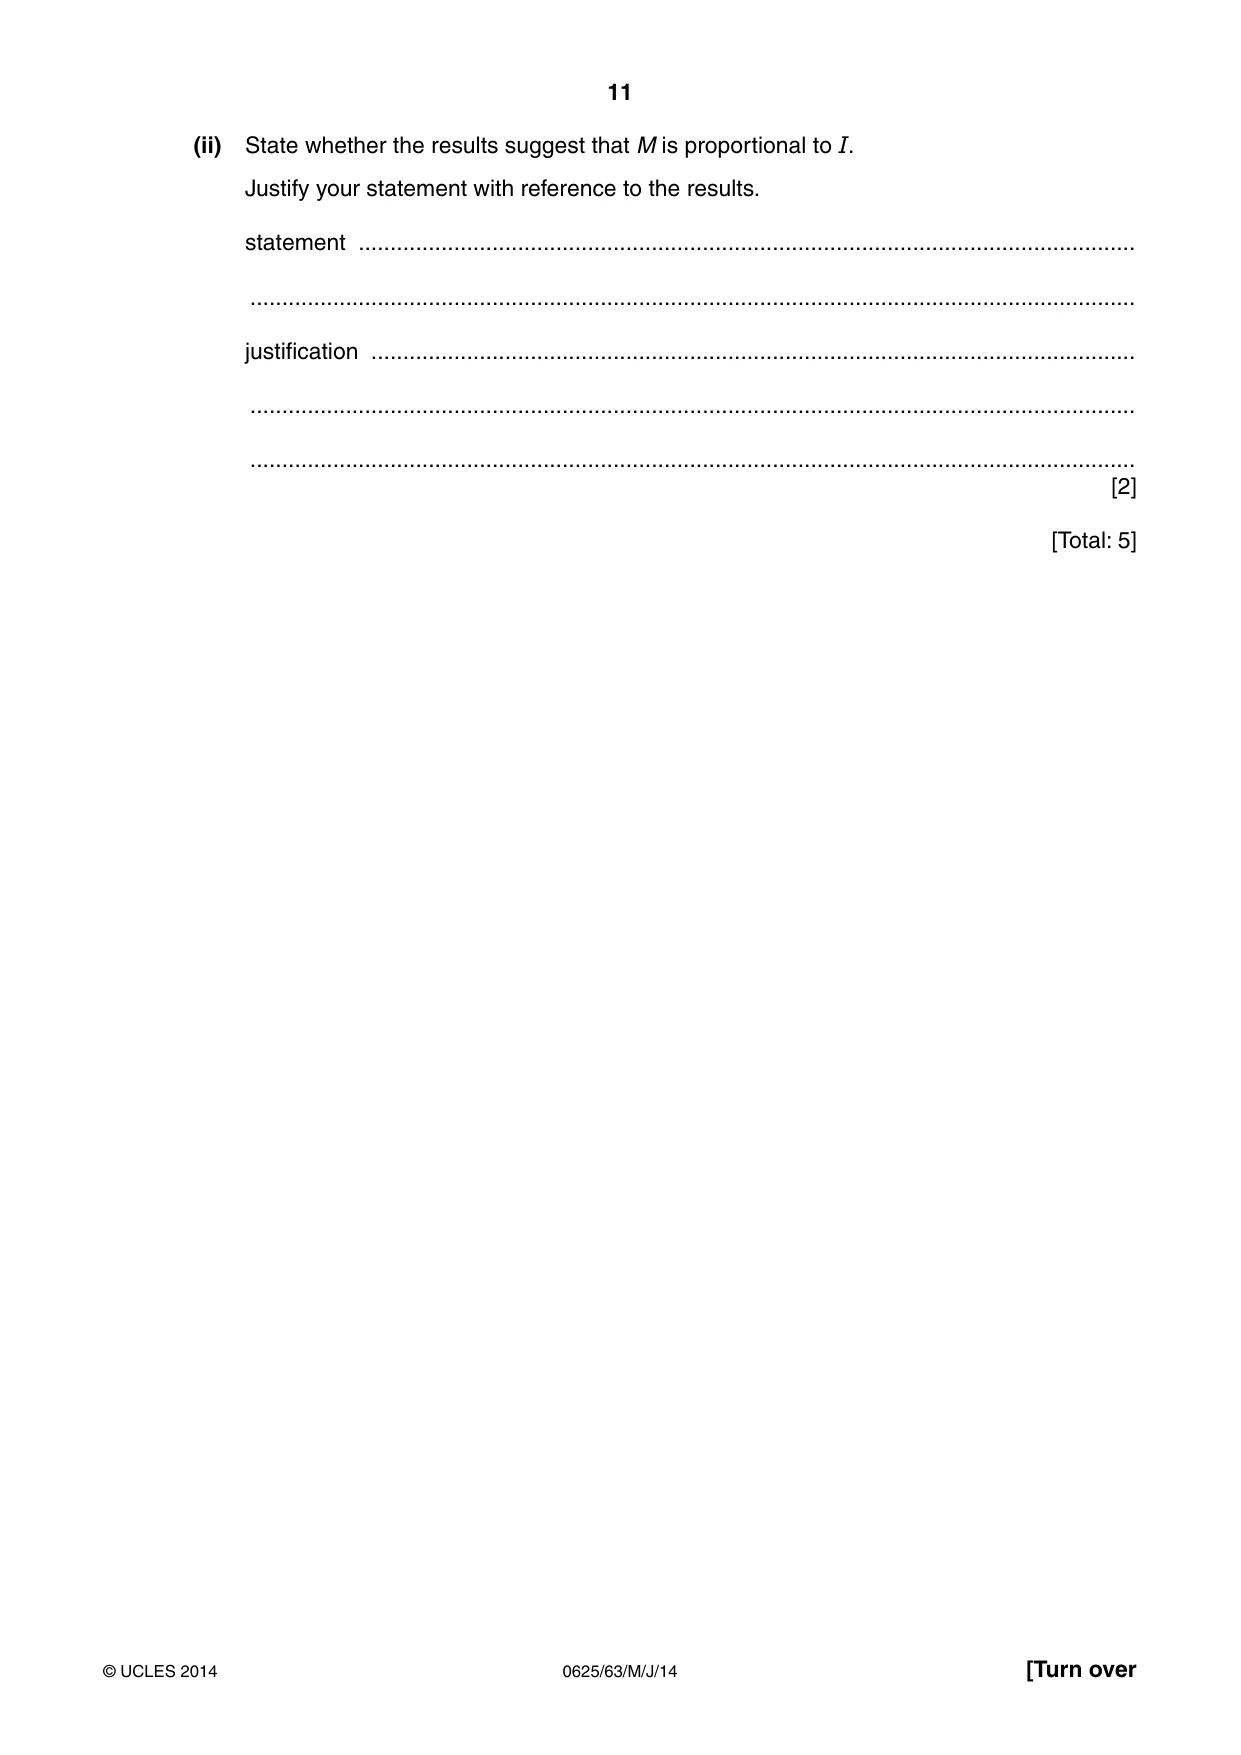
4 The IGCSE students are investigating the effect of an electromagnet. Fig. 4.1 shows part of the equipment they are using. The current I in the coil of the electromagnet is gradually increased and the reading m on the balance is recorded. electromagnet power supply iron block balance g Fig. 4.1 (a) The students are using a variable resistor (rheostat) to change the current in the series circuit that is connected to the electromagnet. On Fig. 4.1, use standard symbols to draw a circuit containing a variable resistor and an ammeter connected in a way that would be suitable for the experiment. [2] (b) The readings are shown in Table 4.1. Table 4.1 I / A m / g M / g 0.00 61.37 0.00 1.00 57.25 4.12 2.00 53.13 3.00 49.01 (i) At each current, a value M is calculated. M = m0 – m, where m0 = 61.37 g, the balance reading when I = 0.00 A. Complete the table by calculating and recording M for currents of 2.00 A and 3.00 A. [1] (ii) State whether the results suggest that M is proportional to I. Justify your statement with reference to the results. statement .......................................................................................................................... ........................................................................................................................................... justification ........................................................................................................................ ........................................................................................................................................... ........................................................................................................................................... [2] [Total: 5]
Mark scheme: 4 (a) correct symbols for ammeter and variable resistor (rectangle with diagonal strike- through arrow only) [1] correct series circuit [1] accept use of potential divider symbol only if correctly shown in parallel circuit (b) (i) 8.24 and 12.36 correct answer only [1] (ii) expect ‘Yes’ but allow ecf for incorrect M values [1] appropriate justification referring to figures [1] [Total: 5] IGCSE – May/June 2014 0625 63
Q5 · An IGCSE student is investigating shadows
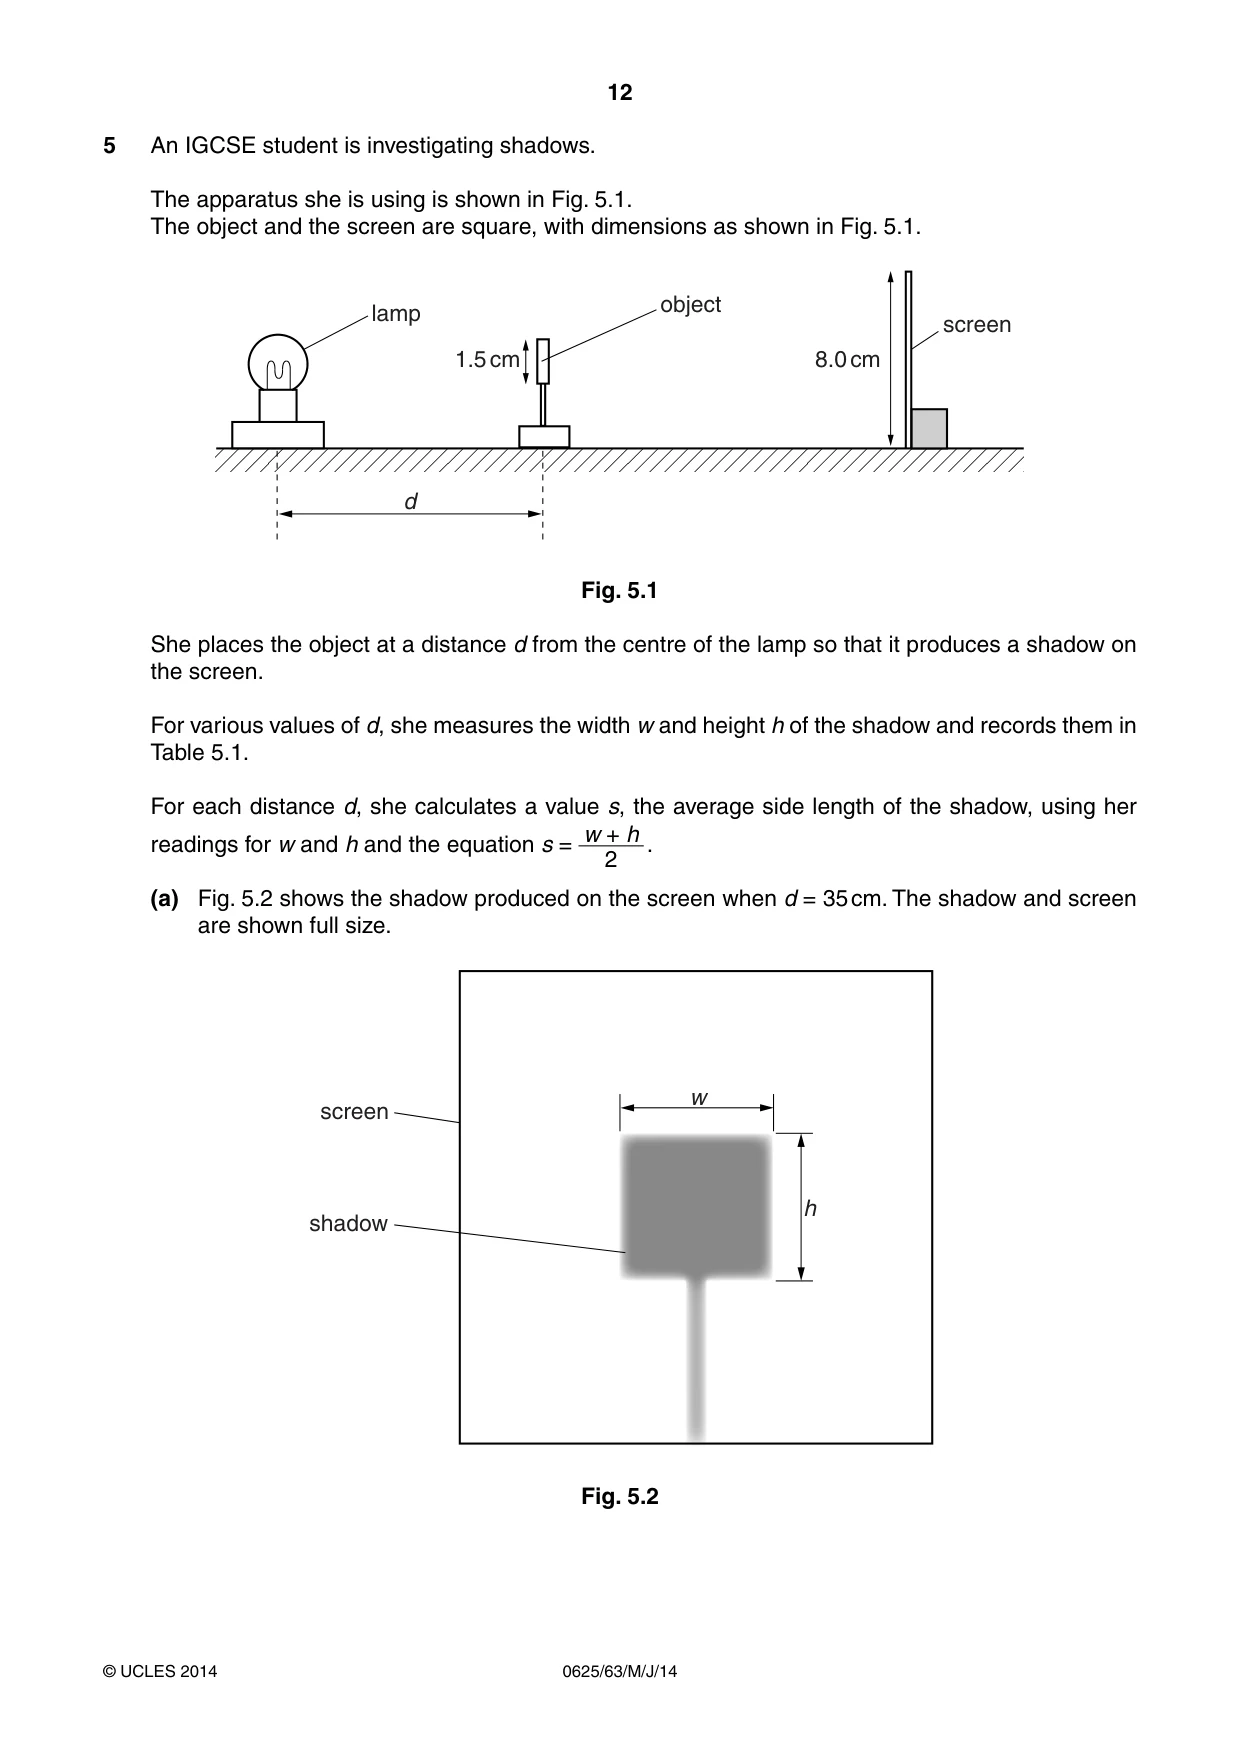
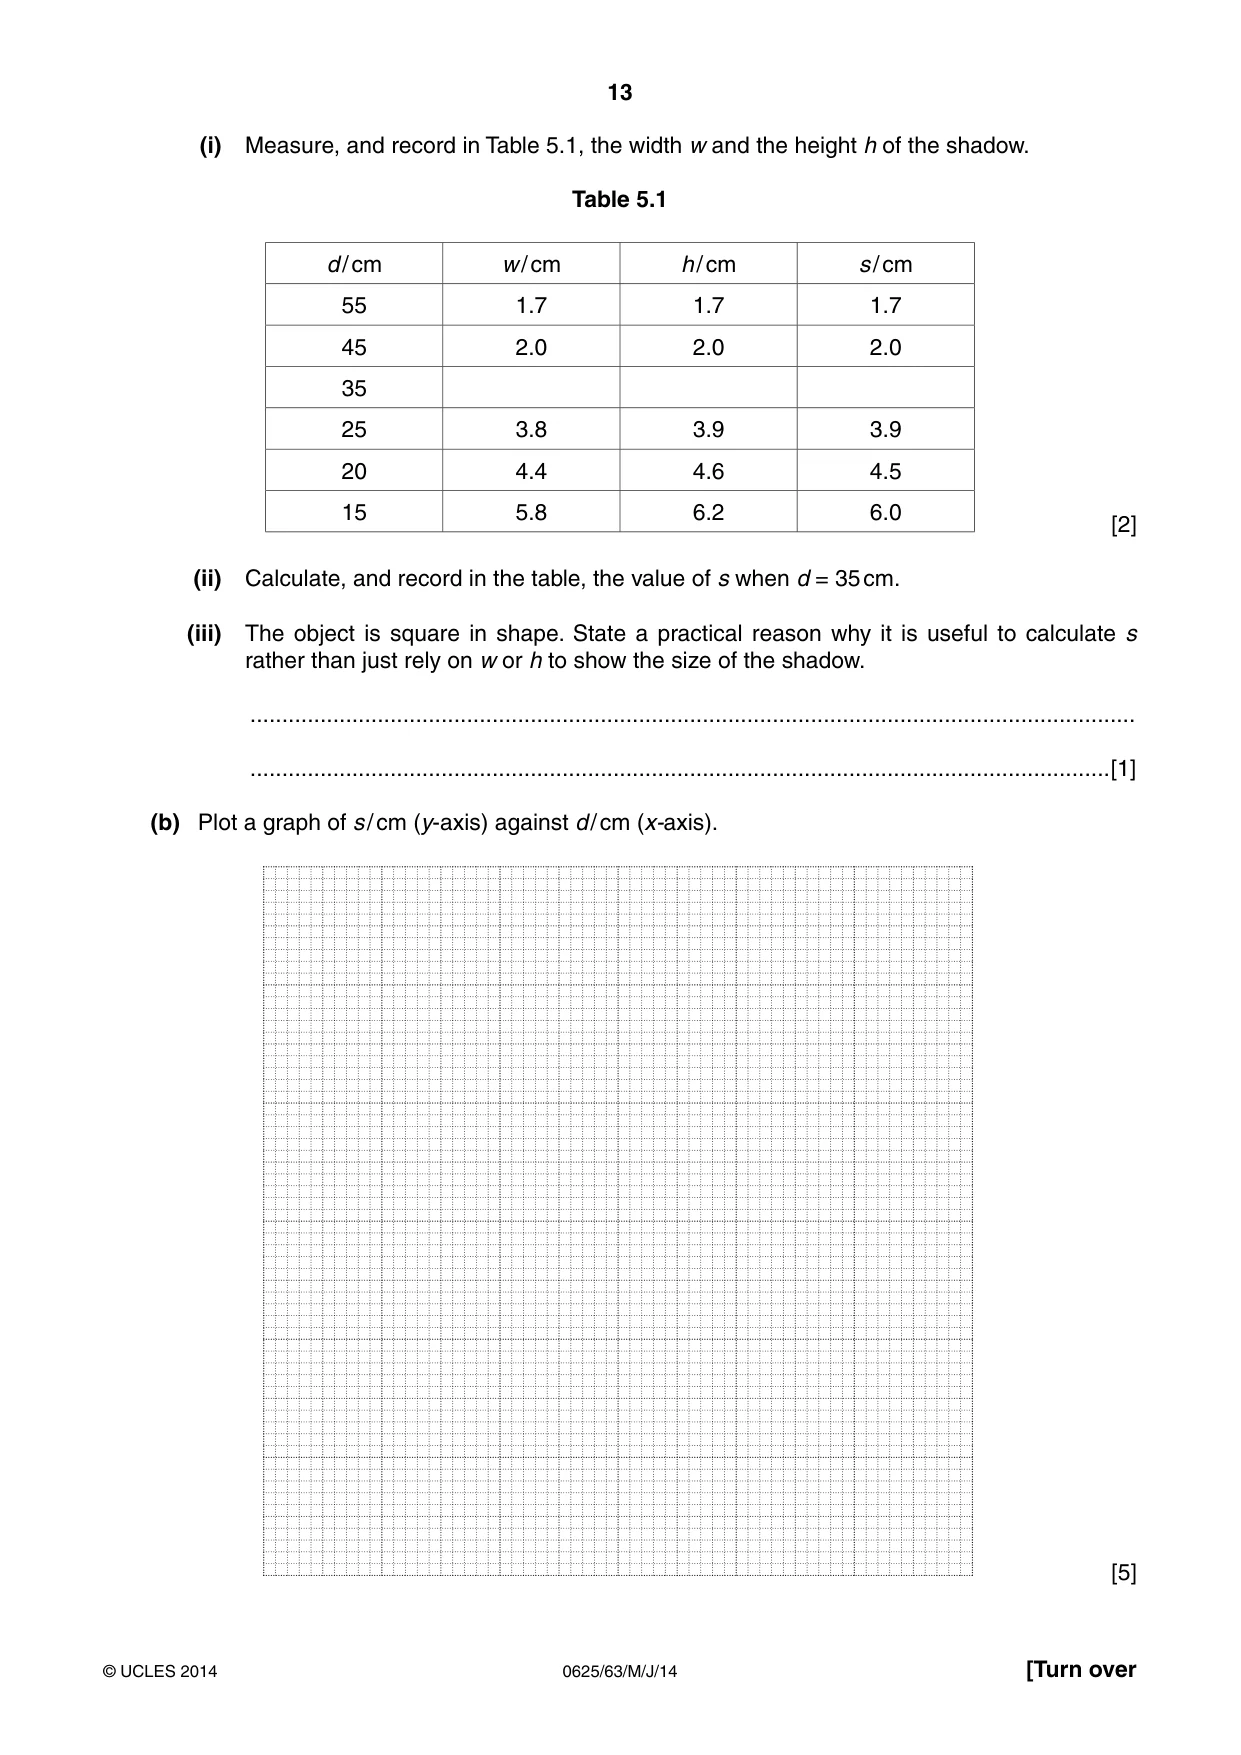
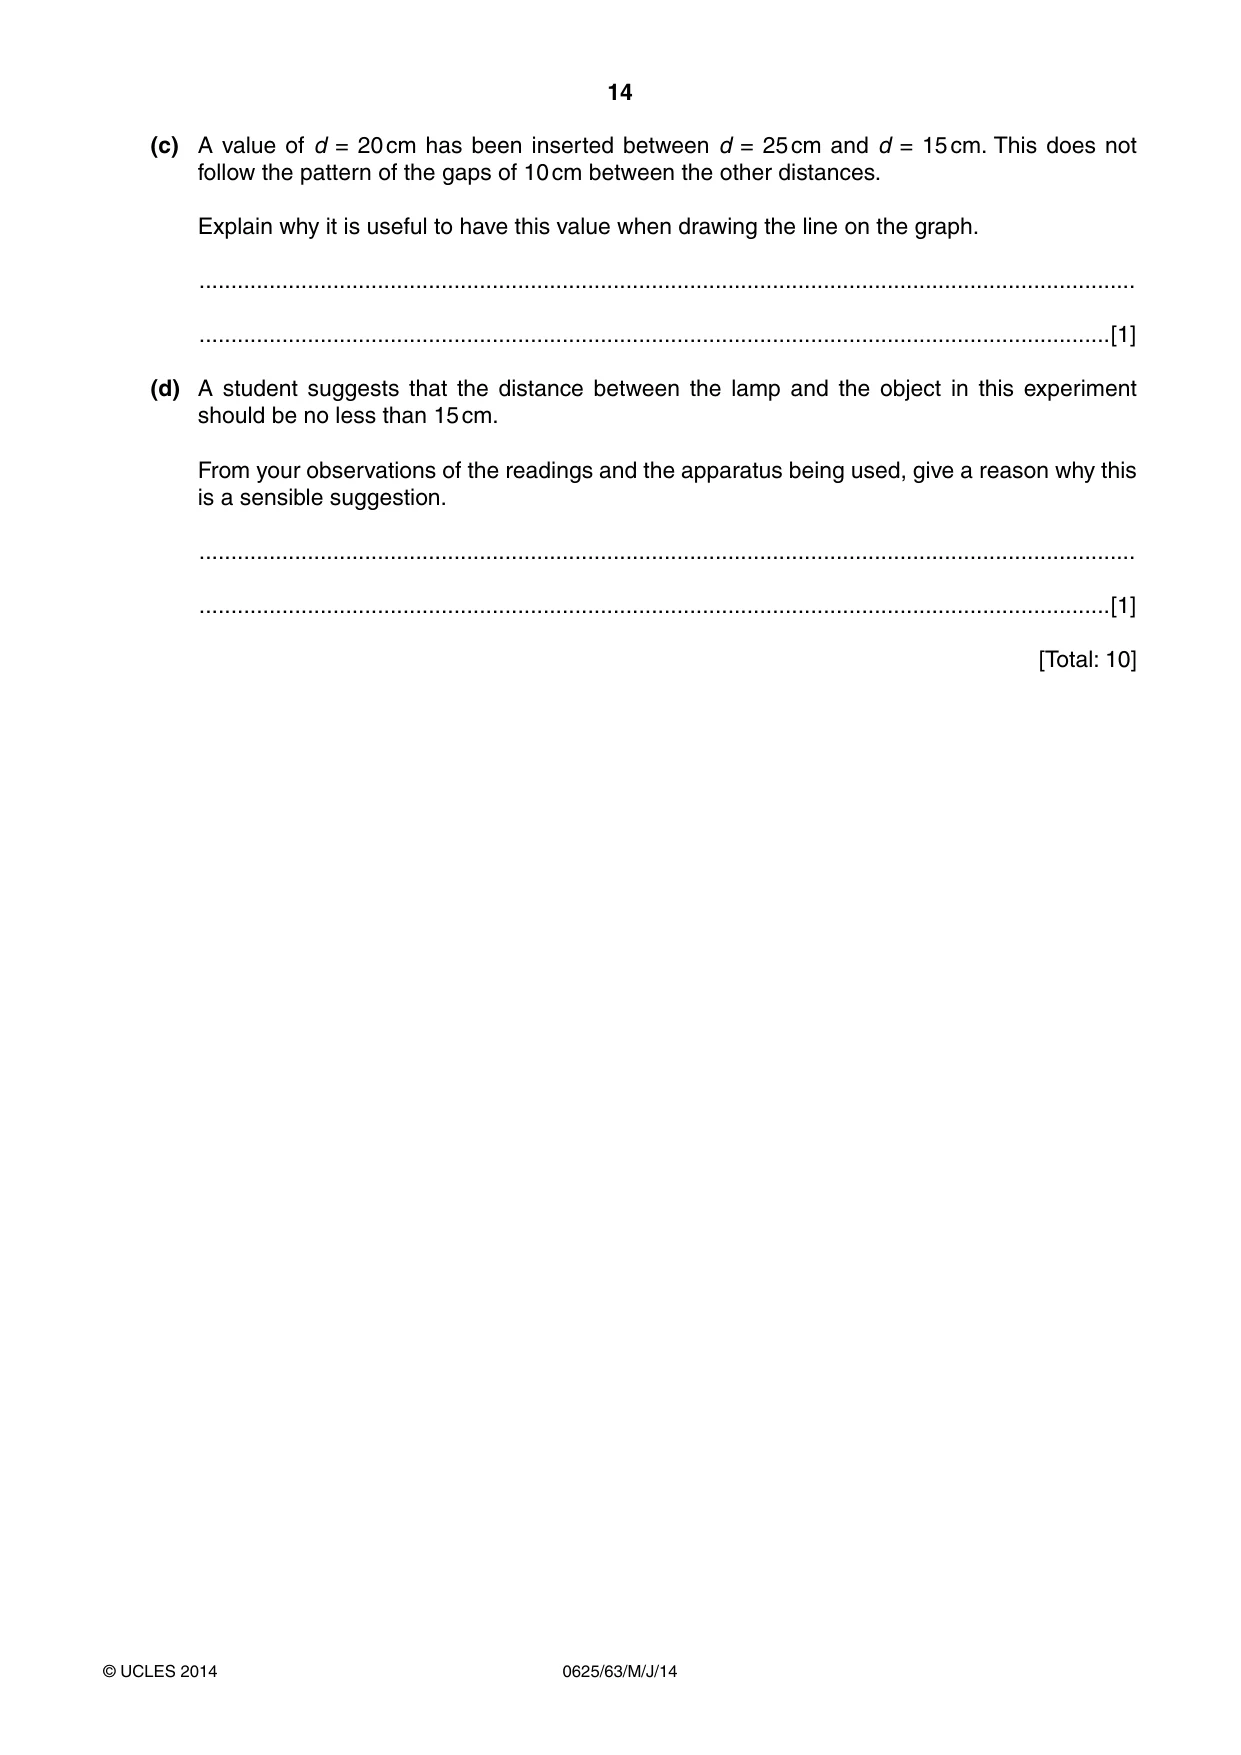
5 An IGCSE student is investigating shadows. The apparatus she is using is shown in Fig. 5.1. The object and the screen are square, with dimensions as shown in Fig. 5.1. object lamp screen 1.5 cm 8.0 cm d Fig. 5.1 She places the object at a distance d from the centre of the lamp so that it produces a shadow on the screen. For various values of d, she measures the width w and height h of the shadow and records them in Table 5.1. For each distance d, she calculates a value s, the average side length of the shadow, using her w + h readings for w and h and the equation s = . 2 (a) Fig. 5.2 shows the shadow produced on the screen when d = 35 cm. The shadow and screen are shown full size. w screen h shadow Fig. 5.2 (i) Measure, and record in Table 5.1, the width w and the height h of the shadow. Table 5.1 d / cm w / cm h / cm s / cm 55 1.7 1.7 1.7 45 2.0 2.0 2.0 35 25 3.8 3.9 3.9 20 4.4 4.6 4.5 15 5.8 6.2 6.0 [2] (ii) Calculate, and record in the table, the value of s when d = 35 cm. (iii) The object is square in shape. State a practical reason why it is useful to calculate s rather than just rely on w or h to show the size of the shadow. ........................................................................................................................................... .......................................................................................................................................[1] (b) Plot a graph of s / cm (y-axis) against d / cm (x-axis). [5] (c) A value of d = 20 cm has been inserted between d = 25 cm and d = 15 cm. This does not follow the pattern of the gaps of 10 cm between the other distances. Explain why it is useful to have this value when drawing the line on the graph. ................................................................................................................................................... ...............................................................................................................................................[1] (d) A student suggests that the distance between the lamp and the object in this experiment should be no less than 15 cm. From your observations of the readings and the apparatus being used, give a reason why this is a sensible suggestion. ................................................................................................................................................... ...............................................................................................................................................[1] [Total: 10]
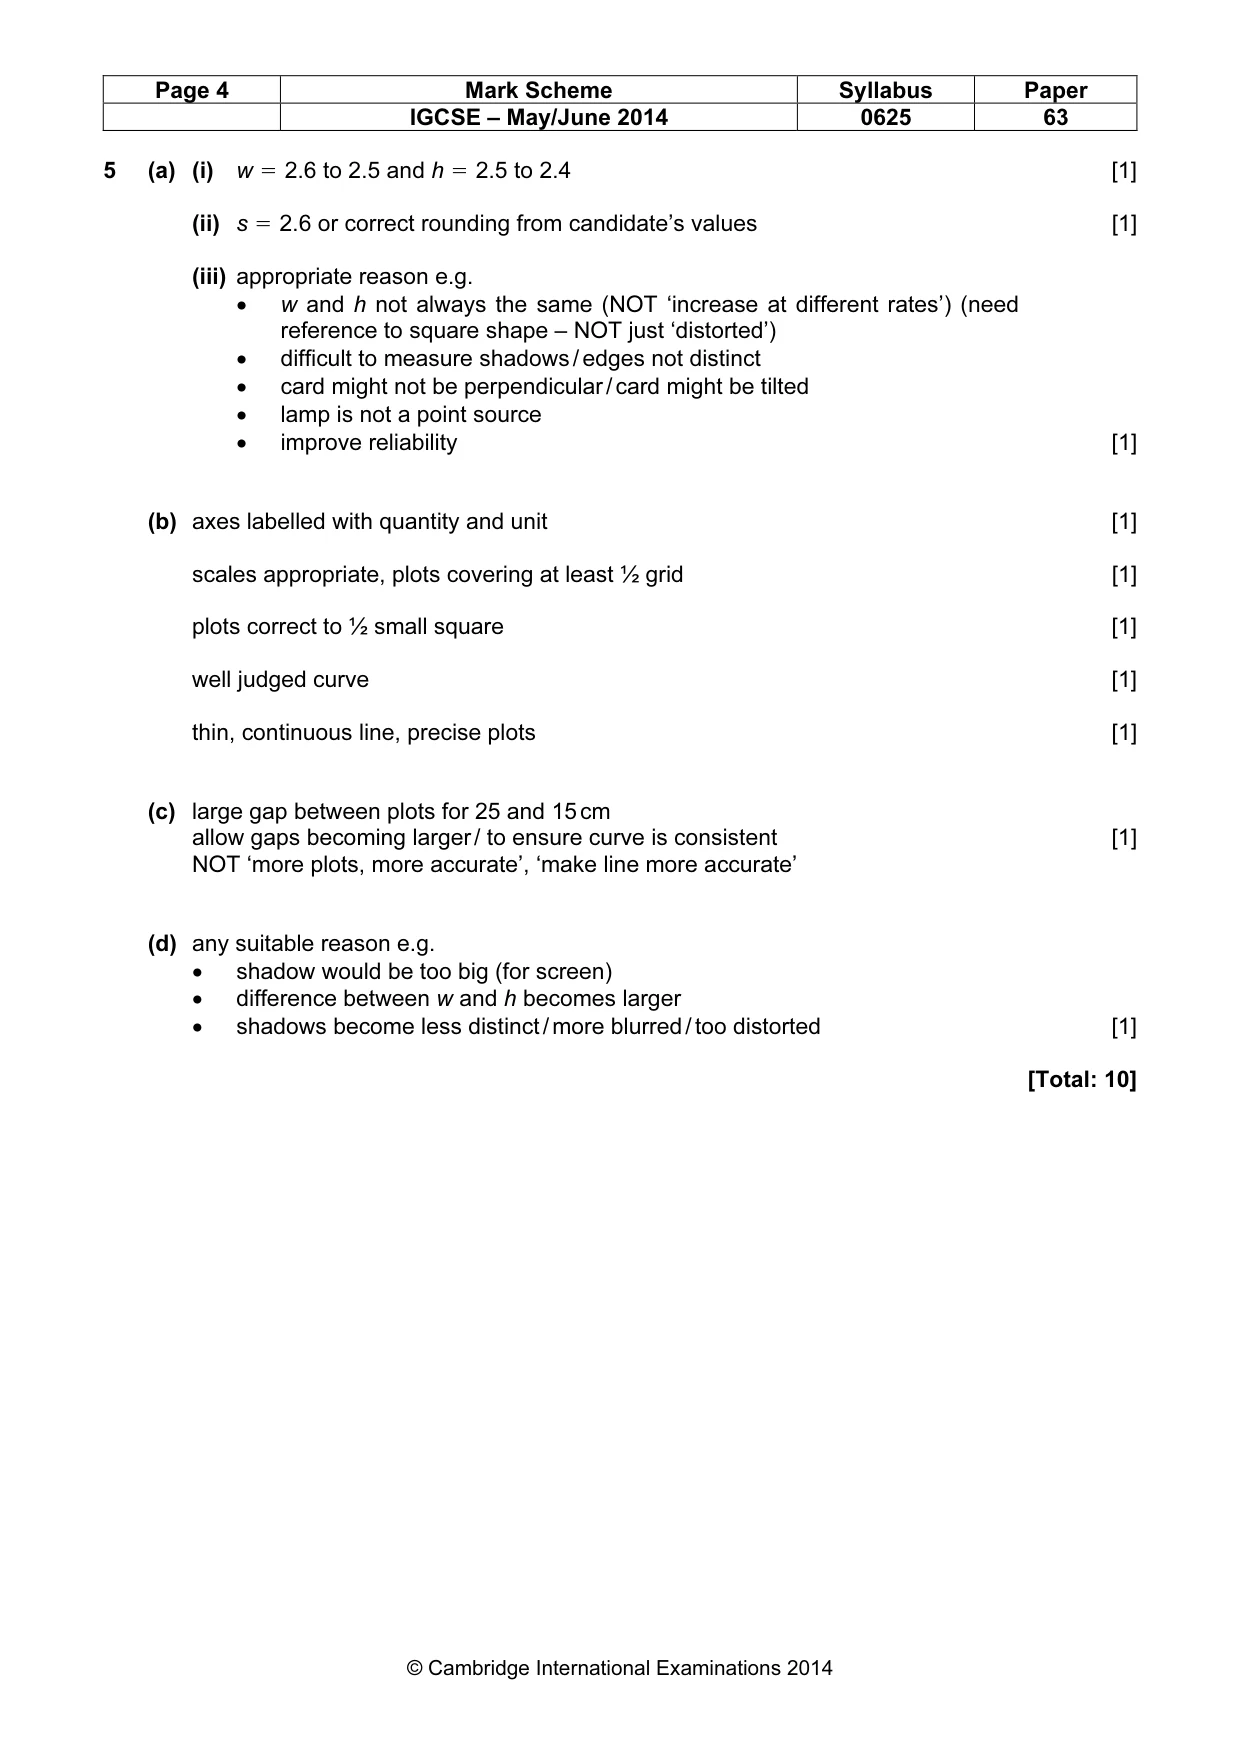
Mark scheme: 5 (a) (i) w R 2.6 to 2.5 and h R 2.5 to 2.4 [1] (ii) s R 2.6 or correct rounding from candidate’s values [1] (iii) appropriate reason e.g. • w and h not always the same (NOT ‘increase at different rates’) (need reference to square shape – NOT just ‘distorted’) • difficult to measure shadows / edges not distinct • card might not be perpendicular / card might be tilted • lamp is not a point source • improve reliability [1] (b) axes labelled with quantity and unit [1] scales appropriate, plots covering at least ½ grid [1] plots correct to ½ small square [1] well judged curve [1] thin, continuous line, precise plots [1] (c) large gap between plots for 25 and 15 cm allow gaps becoming larger / to ensure curve is consistent [1] NOT ‘more plots, more accurate’, ‘make line more accurate’ (d) any suitable reason e.g. • shadow would be too big (for screen) • difference between w and h becomes larger • shadows become less distinct / more blurred / too distorted [1] [Total: 10]
What was in this paper
The subtopics covered by these 5 questions, and how many questions each got. Open one in a new tab to see every Cambridge question on it.
What you needed in this session
Cambridge’s own grade thresholds for 2014 May/June, Paper 6 · Variant 3. A higher threshold means an easier paper — the bar moves with how the cohort did.