Cambridge IGCSE Physics 0625 — 2014 May/June Paper 6 · Variant 2
0625/62/M/J/14 · 5 questions · 40 marks · ≈45 min
The question paper and its mark scheme, free to read here and free to download. This is Cambridge’s own paper, exactly as it was sat.
Question paper12 pages

Mark scheme4 pages
Answers below. Sit the paper first if you are practising.
Questions as text
Q1 · An IGCSE student is taking measurements of a pencil
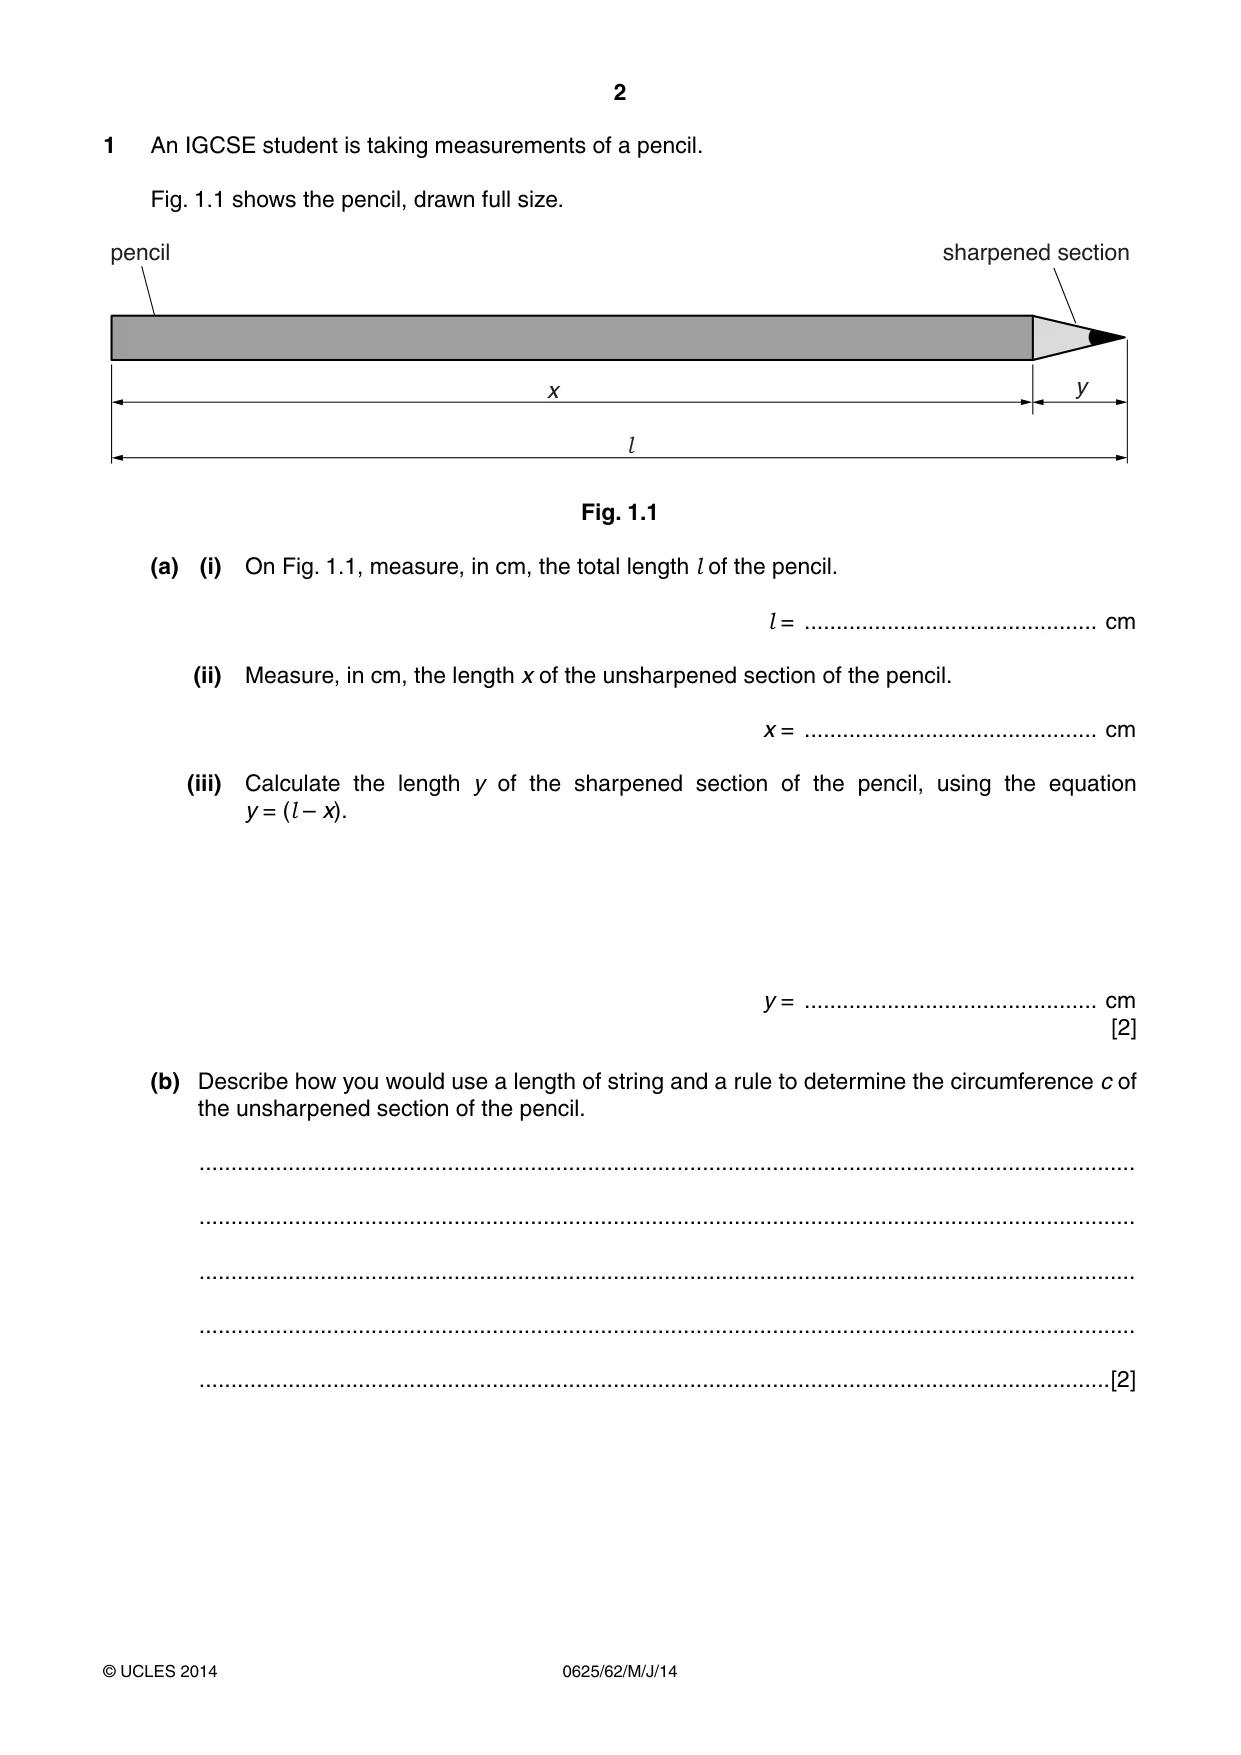
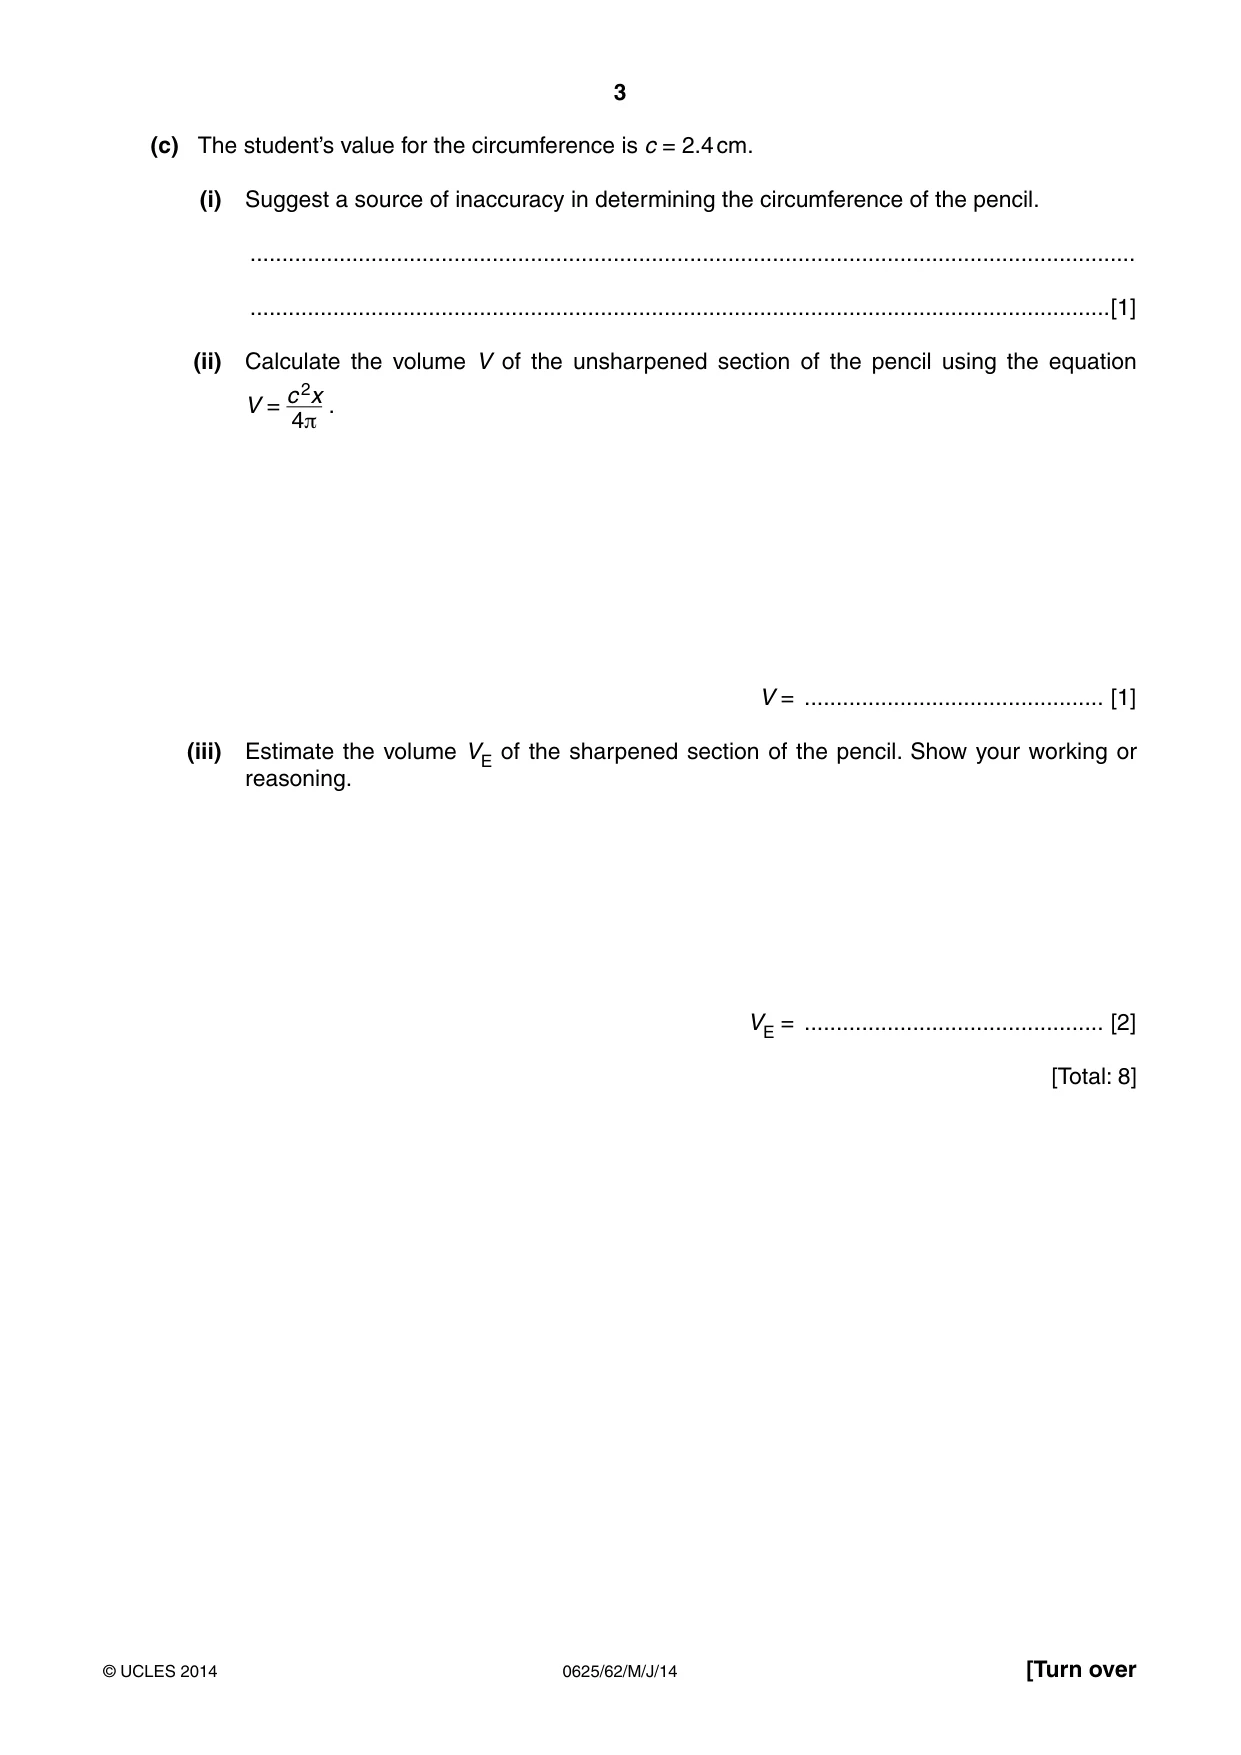
1 An IGCSE student is taking measurements of a pencil. Fig. 1.1 shows the pencil, drawn full size. SHQFLO VKDUSHQHG VHFWLRQ [ \ l Fig. 1.1 (a) (i) On Fig. 1.1, measure, in cm, the total length l of the pencil. l = .............................................. cm (ii) Measure, in cm, the length x of the unsharpened section of the pencil. x = .............................................. cm (iii) Calculate the length y of the sharpened section of the pencil, using the equation y = (l – x). y = .............................................. cm [2] (b) Describe how you would use a length of string and a rule to determine the circumference c of the unsharpened section of the pencil. ................................................................................................................................................... ................................................................................................................................................... ................................................................................................................................................... ................................................................................................................................................... ...............................................................................................................................................[2] (c) The student’s value for the circumference is c = 2.4 cm. (i) Suggest a source of inaccuracy in determining the circumference of the pencil. ........................................................................................................................................... .......................................................................................................................................[1] (ii) Calculate the volume V of the unsharpened section of the pencil using the equation c 2x V = . 4π V = ............................................... [1] (iii) Estimate the volume VE of the sharpened section of the pencil. Show your working or reasoning. VE = ............................................... [2] [Total: 8]
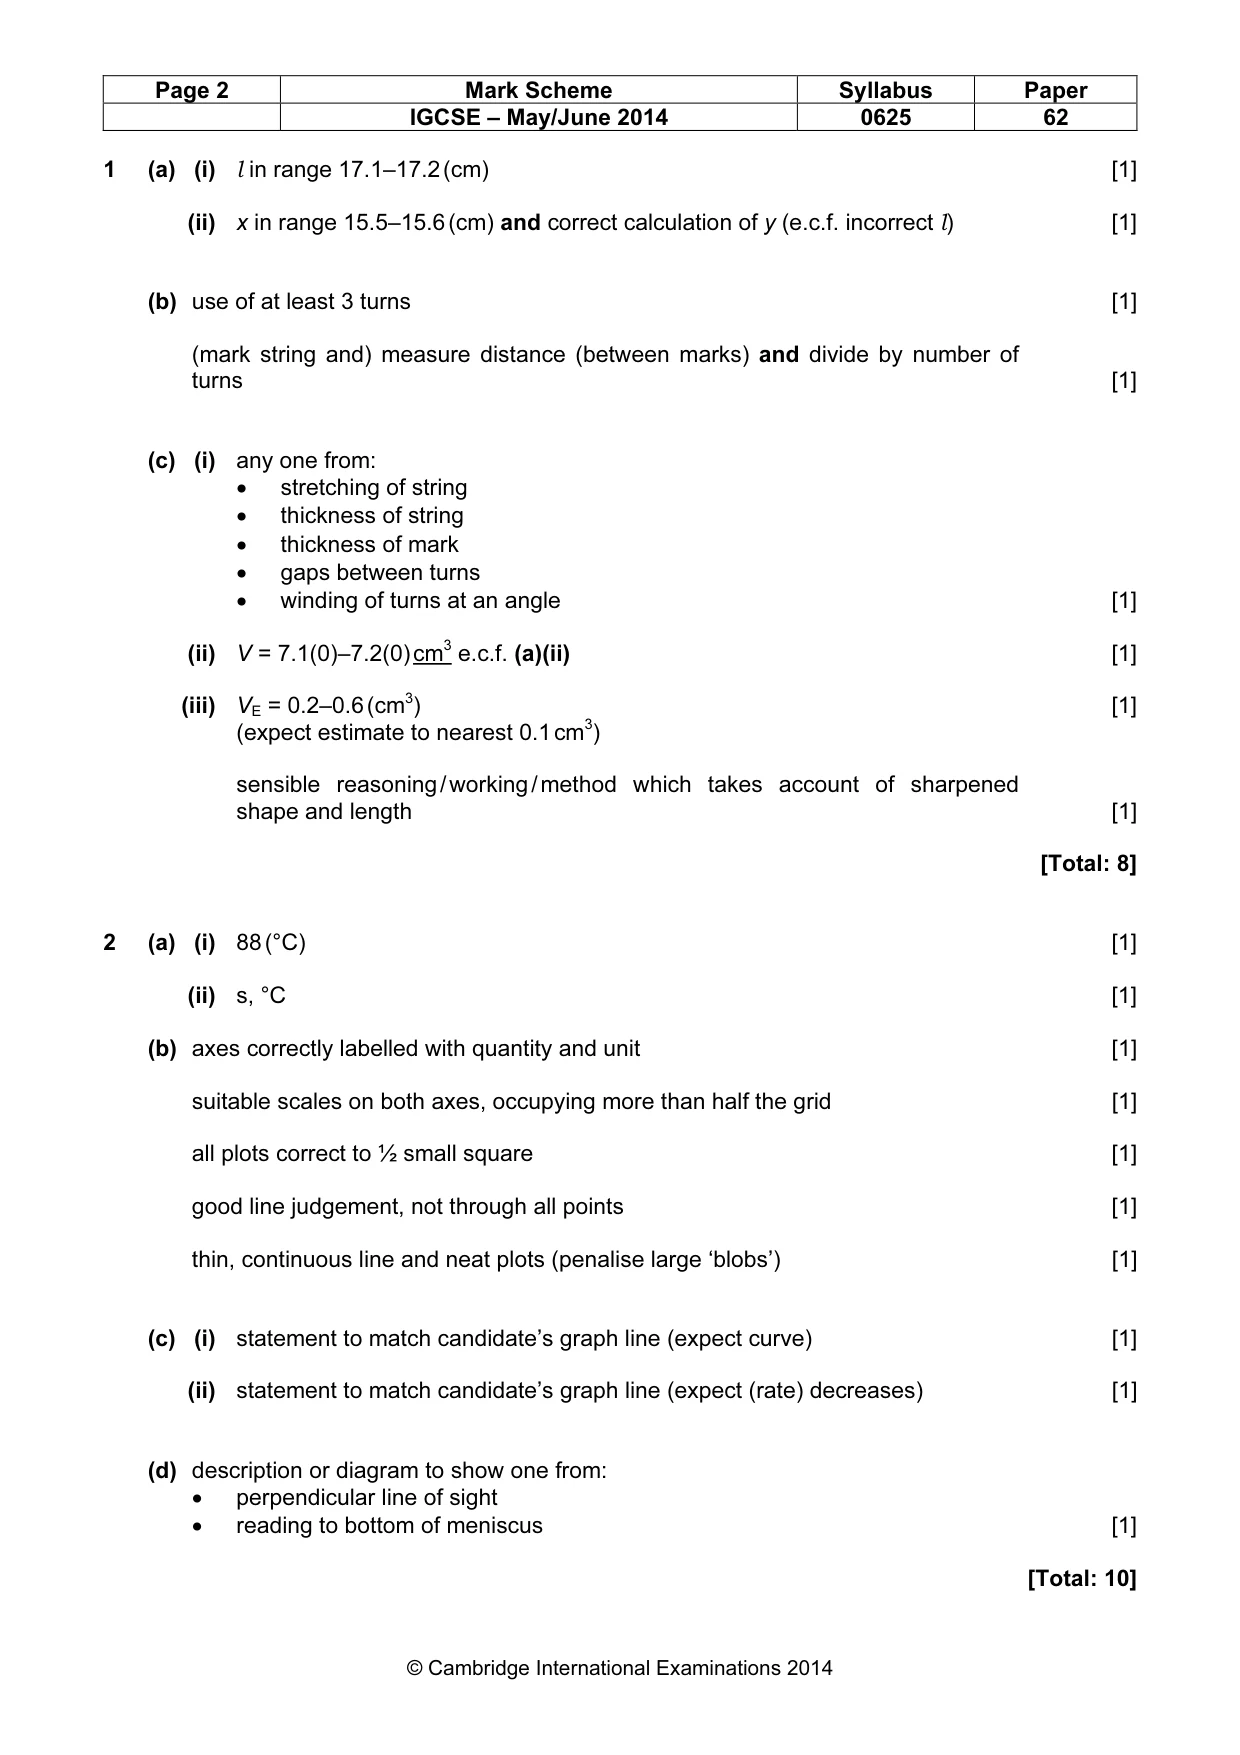
Mark scheme: 1 (a) (i) l in range 17.1–17.2 (cm) [1] (ii) x in range 15.5–15.6 (cm) and correct calculation of y (e.c.f. incorrect l) [1] (b) use of at least 3 turns [1] (mark string and) measure distance (between marks) and divide by number of turns [1] (c) (i) any one from: • stretching of string • thickness of string • thickness of mark • gaps between turns • winding of turns at an angle [1] (ii) V = 7.1(0)–7.2(0) cm3 e.c.f. (a)(ii) [1] (iii) VE = 0.2–0.6 (cm3) [1] (expect estimate to nearest 0.1 cm3) sensible reasoning / working / method which takes account of sharpened shape and length [1] [Total: 8]
More questions on Physical quantities and measurement techniques
Q2 · The IGCSE class is investigating the cooling of water
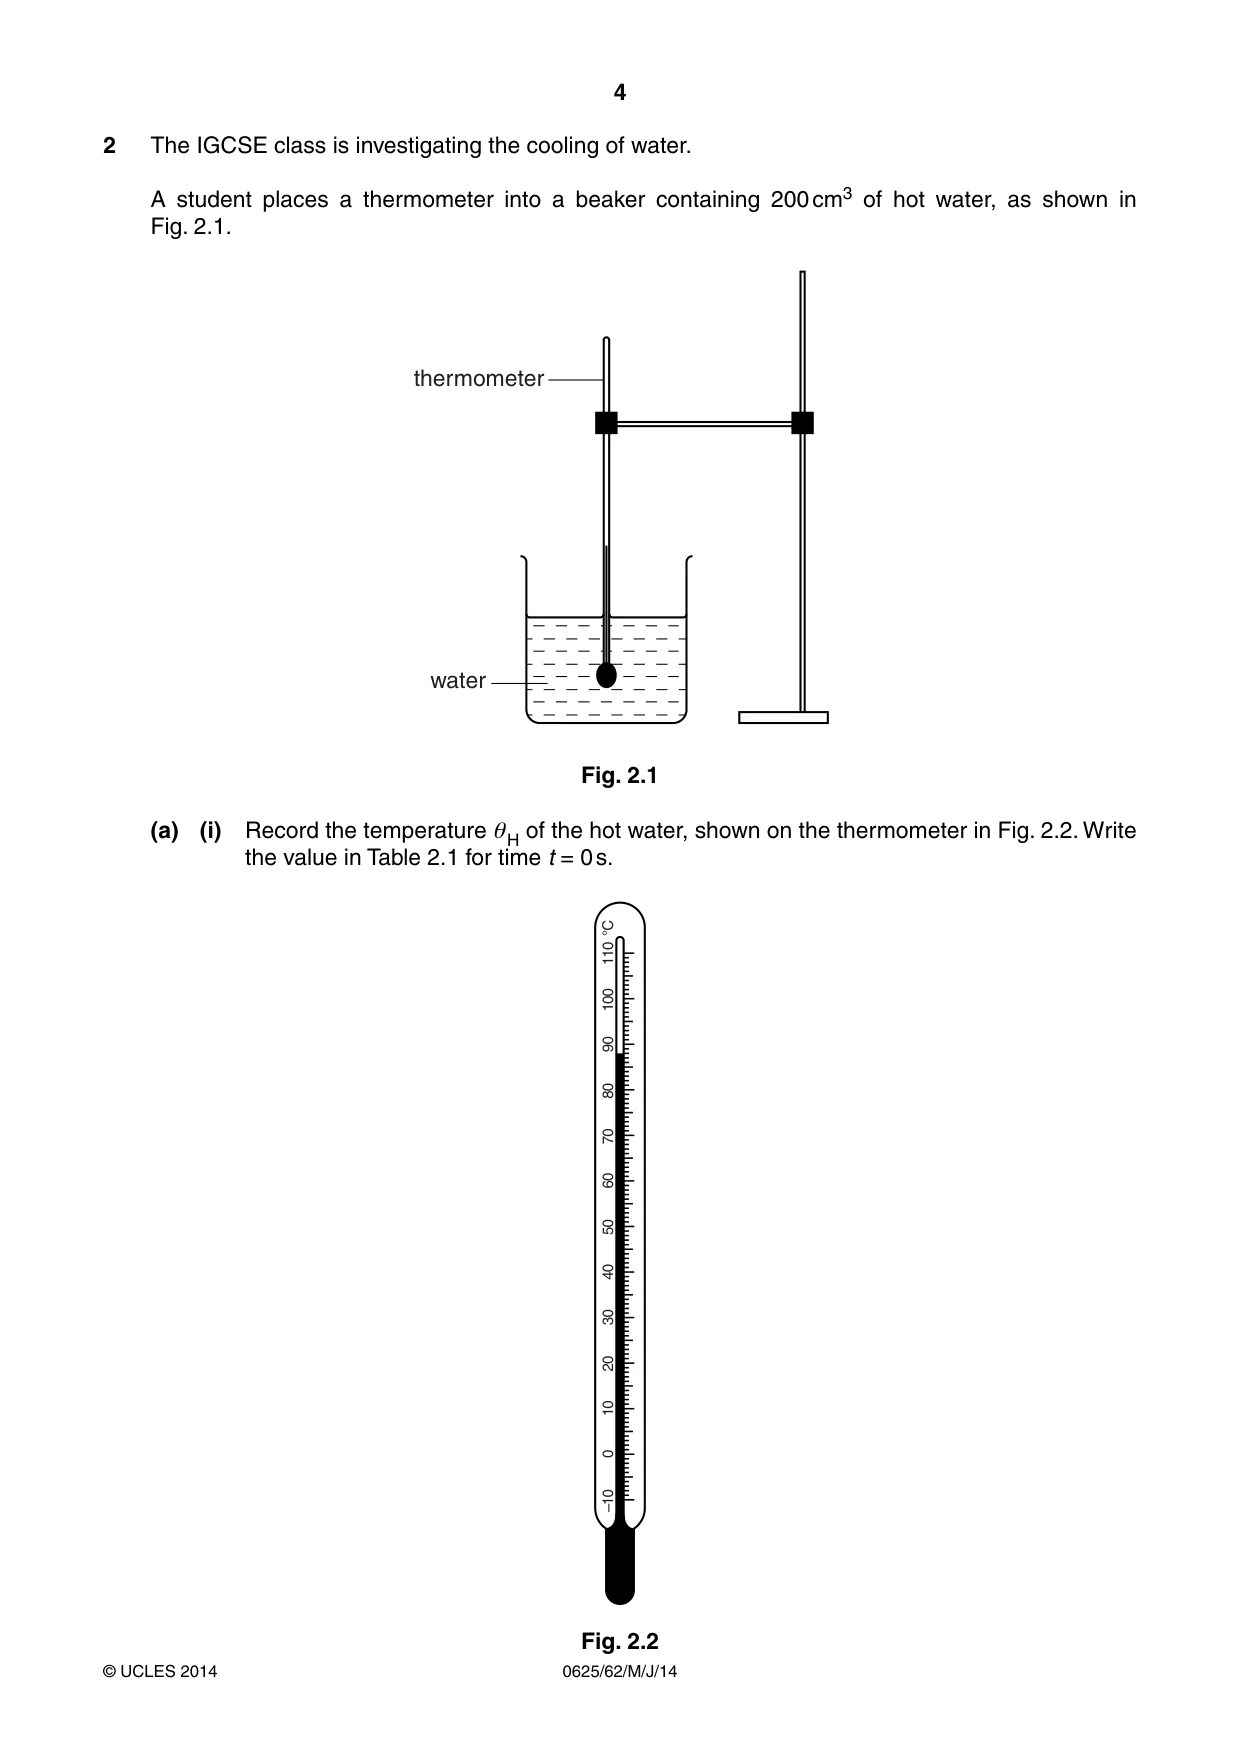
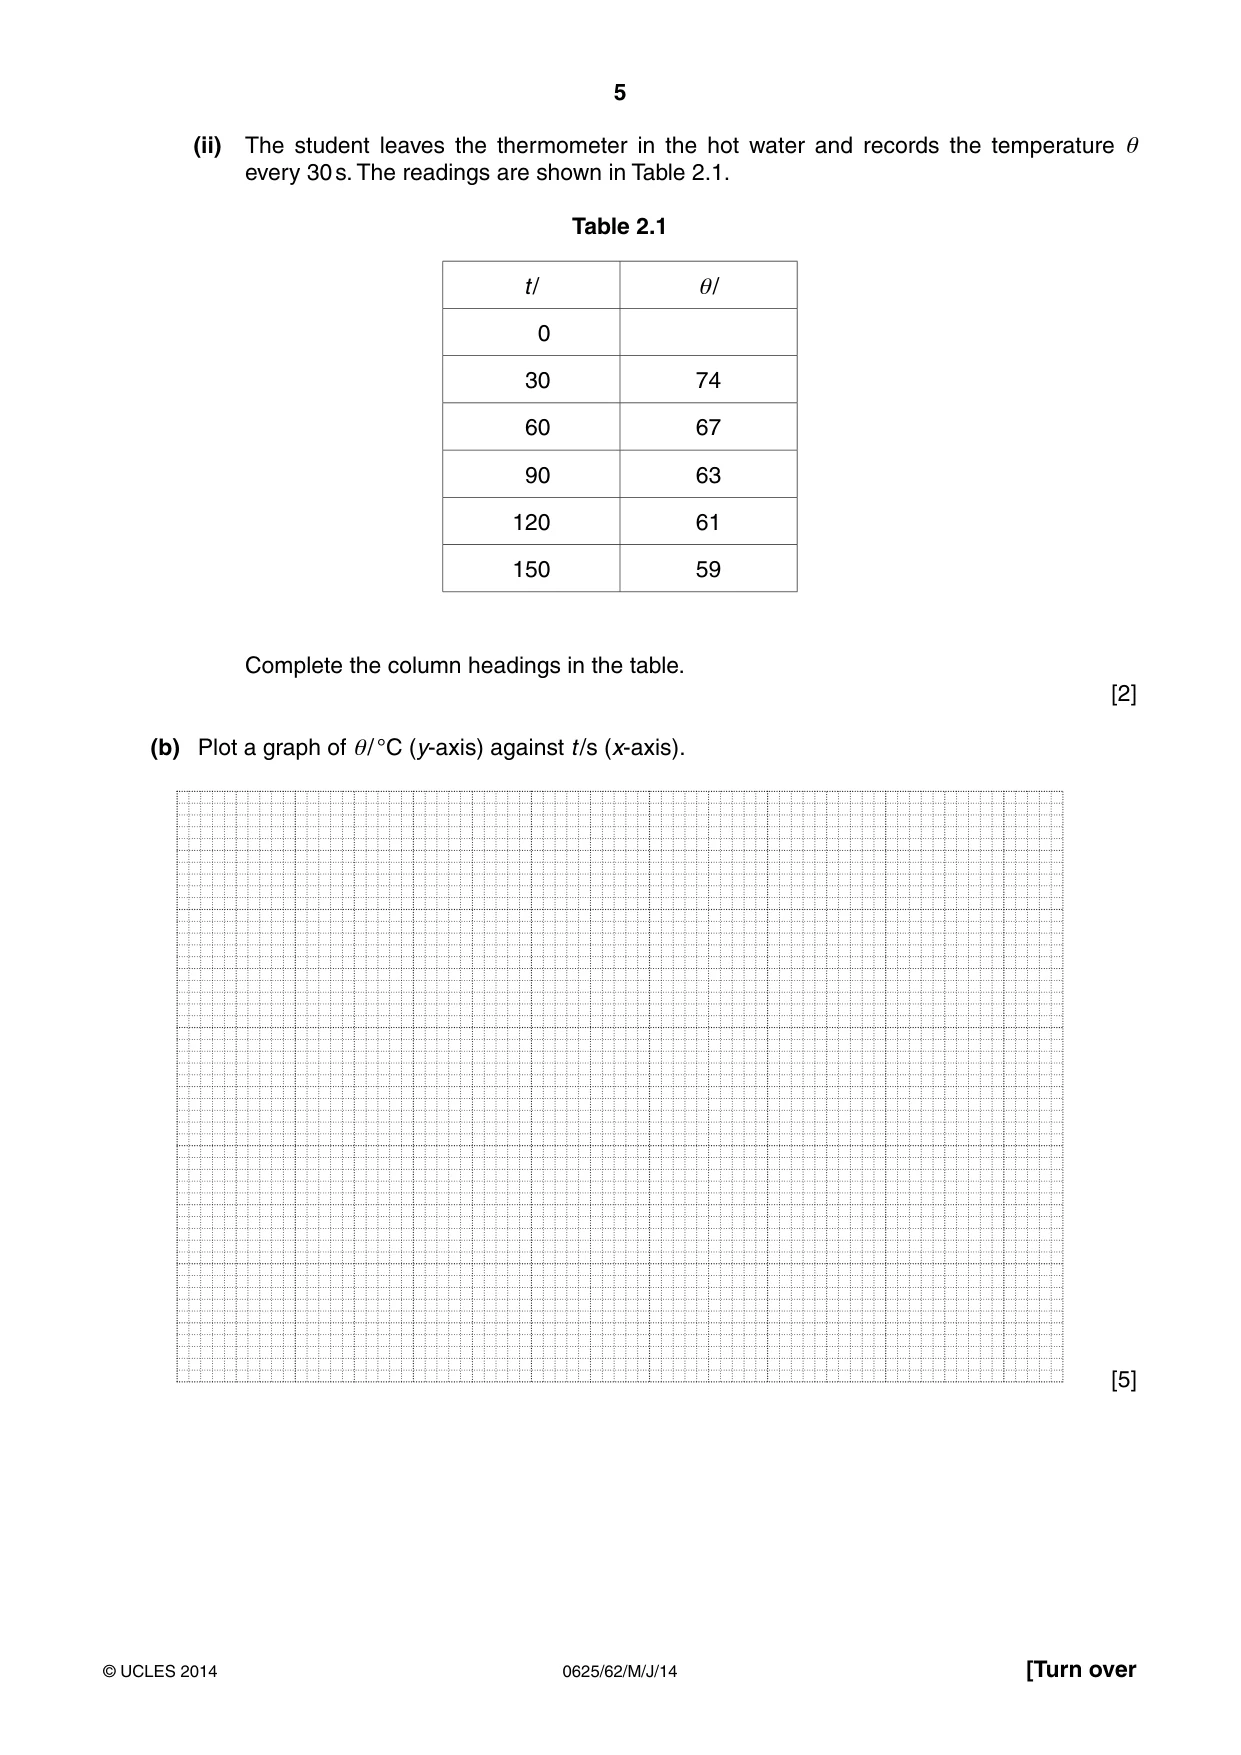
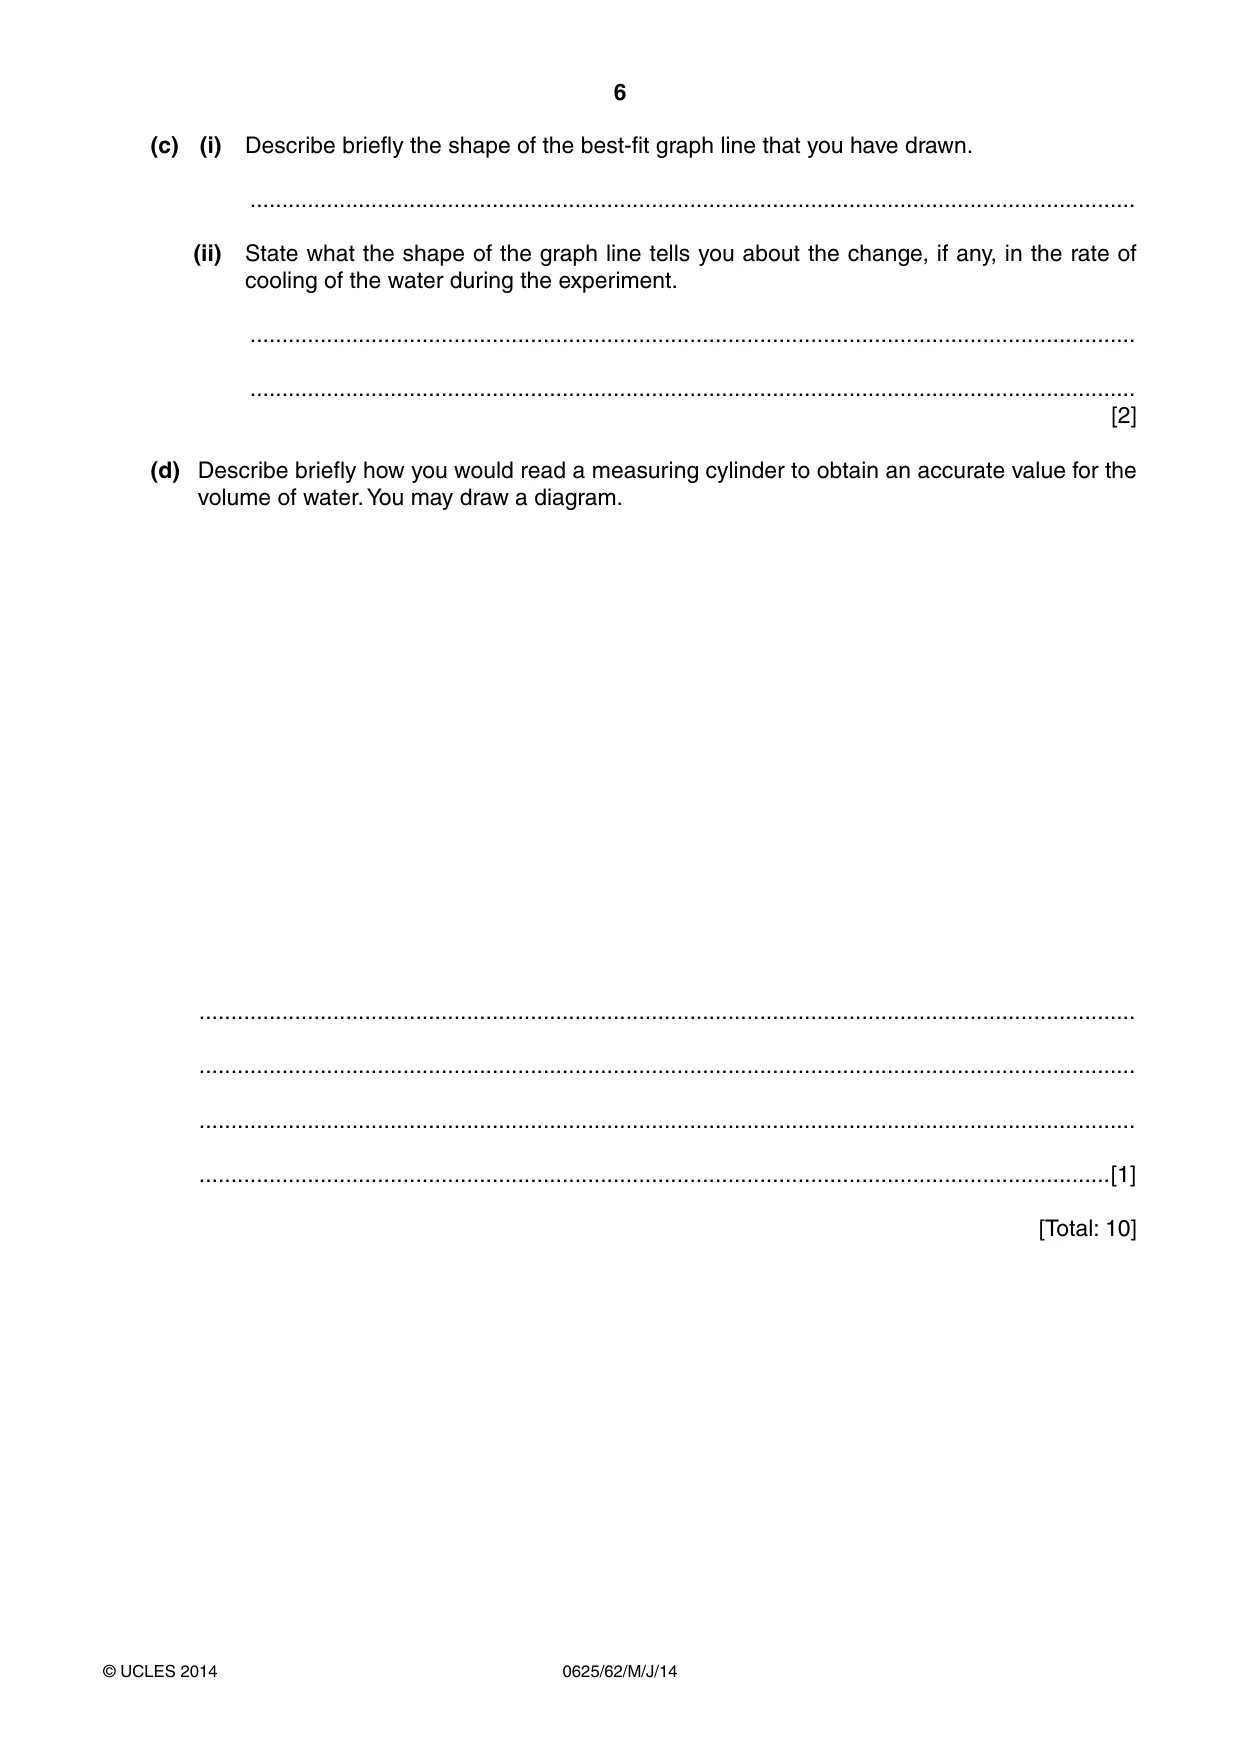
2 The IGCSE class is investigating the cooling of water. A student places a thermometer into a beaker containing 200 cm3 of hot water, as shown in Fig. 2.1. thermometer water Fig. 2.1 (a) (i) Record the temperature θH of the hot water, shown on the thermometer in Fig. 2.2. Write the value in Table 2.1 for time t = 0 s. °C 110 100 90 80 70 60 50 40 30 20 10 0 –10 Fig. 2.2 (ii) The student leaves the thermometer in the hot water and records the temperature θ every 30 s. The readings are shown in Table 2.1. Table 2.1 t / θ/ 0 30 74 60 67 90 63 120 61 150 59 Complete the column headings in the table. [2] (b) Plot a graph of θ/ °C (y-axis) against t /s (x-axis). [5] (c) (i) Describe briefly the shape of the best-fit graph line that you have drawn. ........................................................................................................................................... (ii) State what the shape of the graph line tells you about the change, if any, in the rate of cooling of the water during the experiment. ........................................................................................................................................... ........................................................................................................................................... [2] (d) Describe briefly how you would read a measuring cylinder to obtain an accurate value for the volume of water. You may draw a diagram. ................................................................................................................................................... ................................................................................................................................................... ................................................................................................................................................... ...............................................................................................................................................[1] [Total: 10]
Mark scheme: 2 (a) (i) 88 (°C) [1] (ii) s, °C [1] (b) axes correctly labelled with quantity and unit [1] suitable scales on both axes, occupying more than half the grid [1] all plots correct to ½ small square [1] good line judgement, not through all points [1] thin, continuous line and neat plots (penalise large ‘blobs’) [1] (c) (i) statement to match candidate’s graph line (expect curve) [1] (ii) statement to match candidate’s graph line (expect (rate) decreases) [1] (d) description or diagram to show one from: • perpendicular line of sight • reading to bottom of meniscus [1] [Total: 10] IGCSE – May/June 2014 0625 62
Q3 · The IGCSE class is investigating the resistance of a resistor
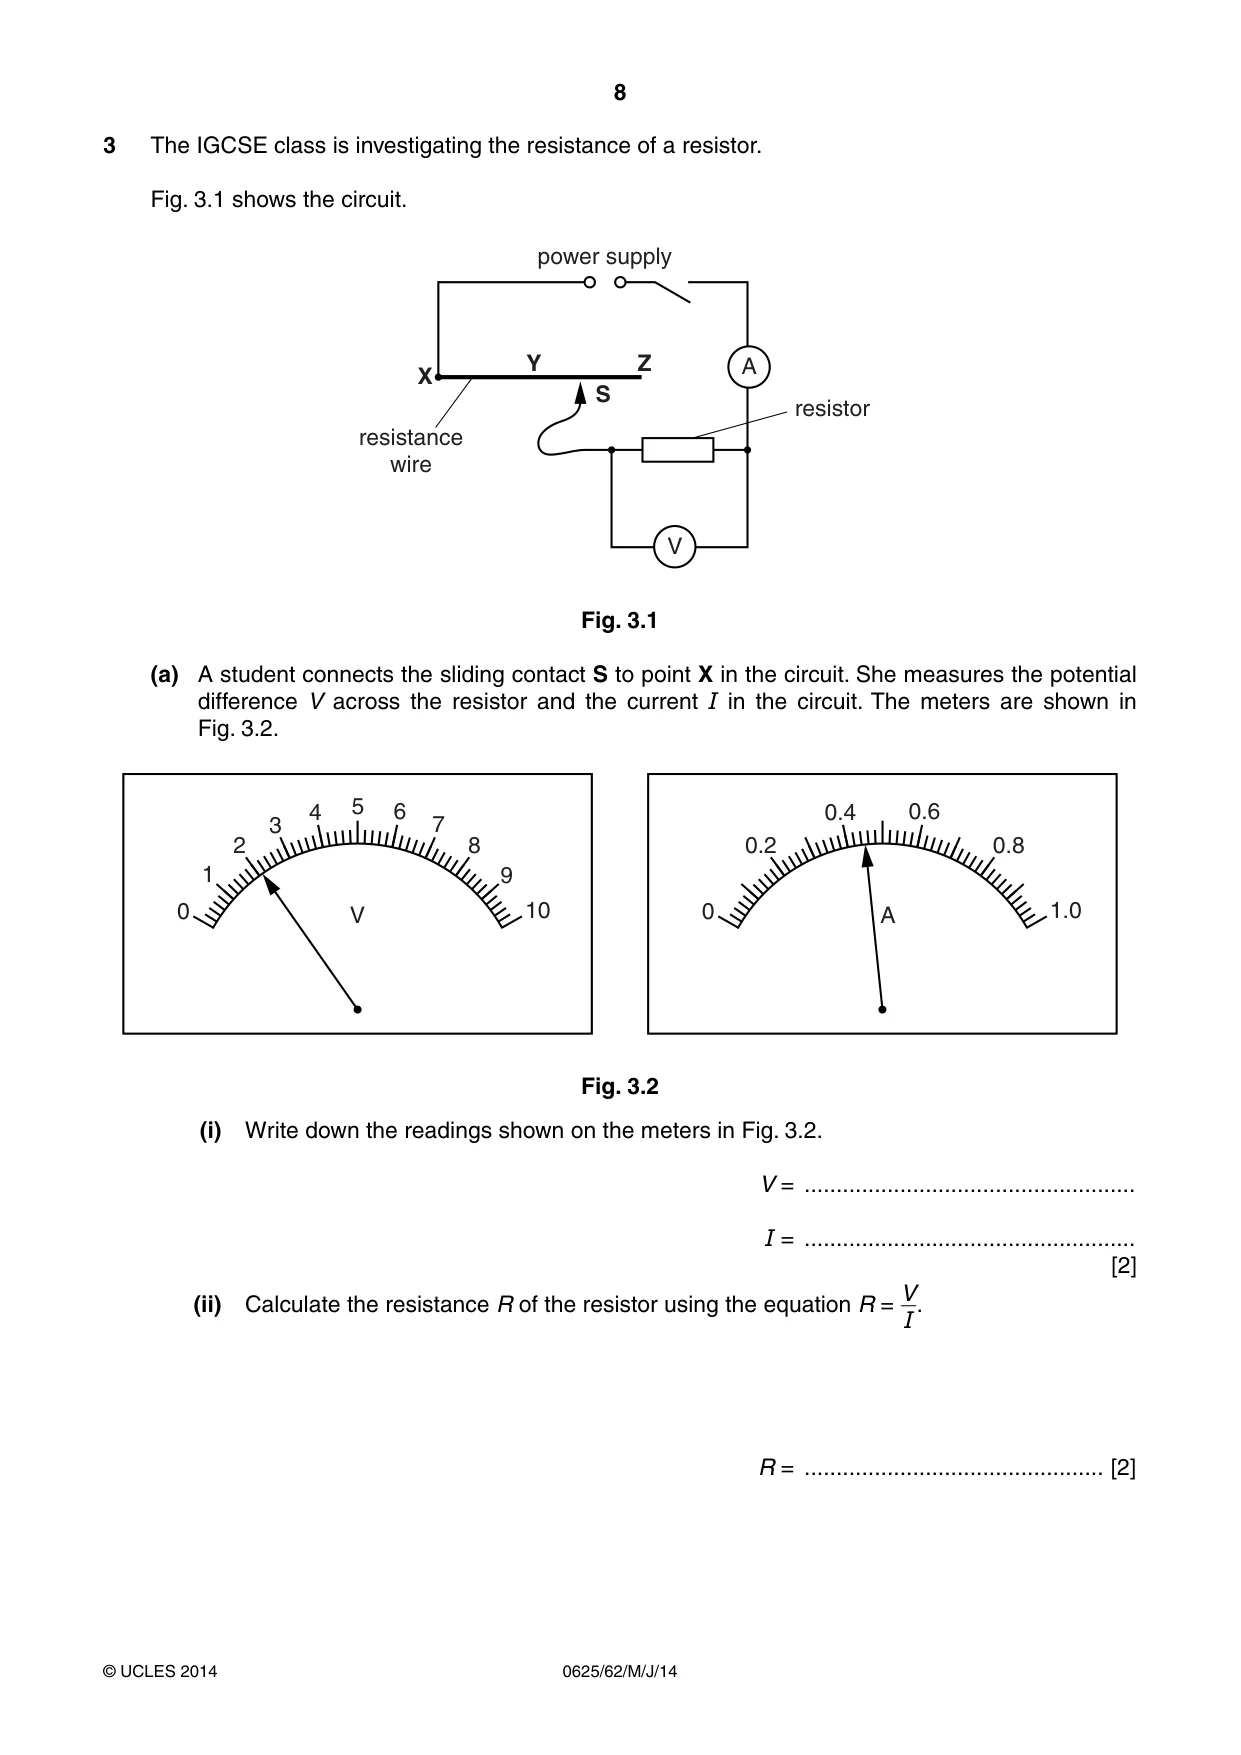
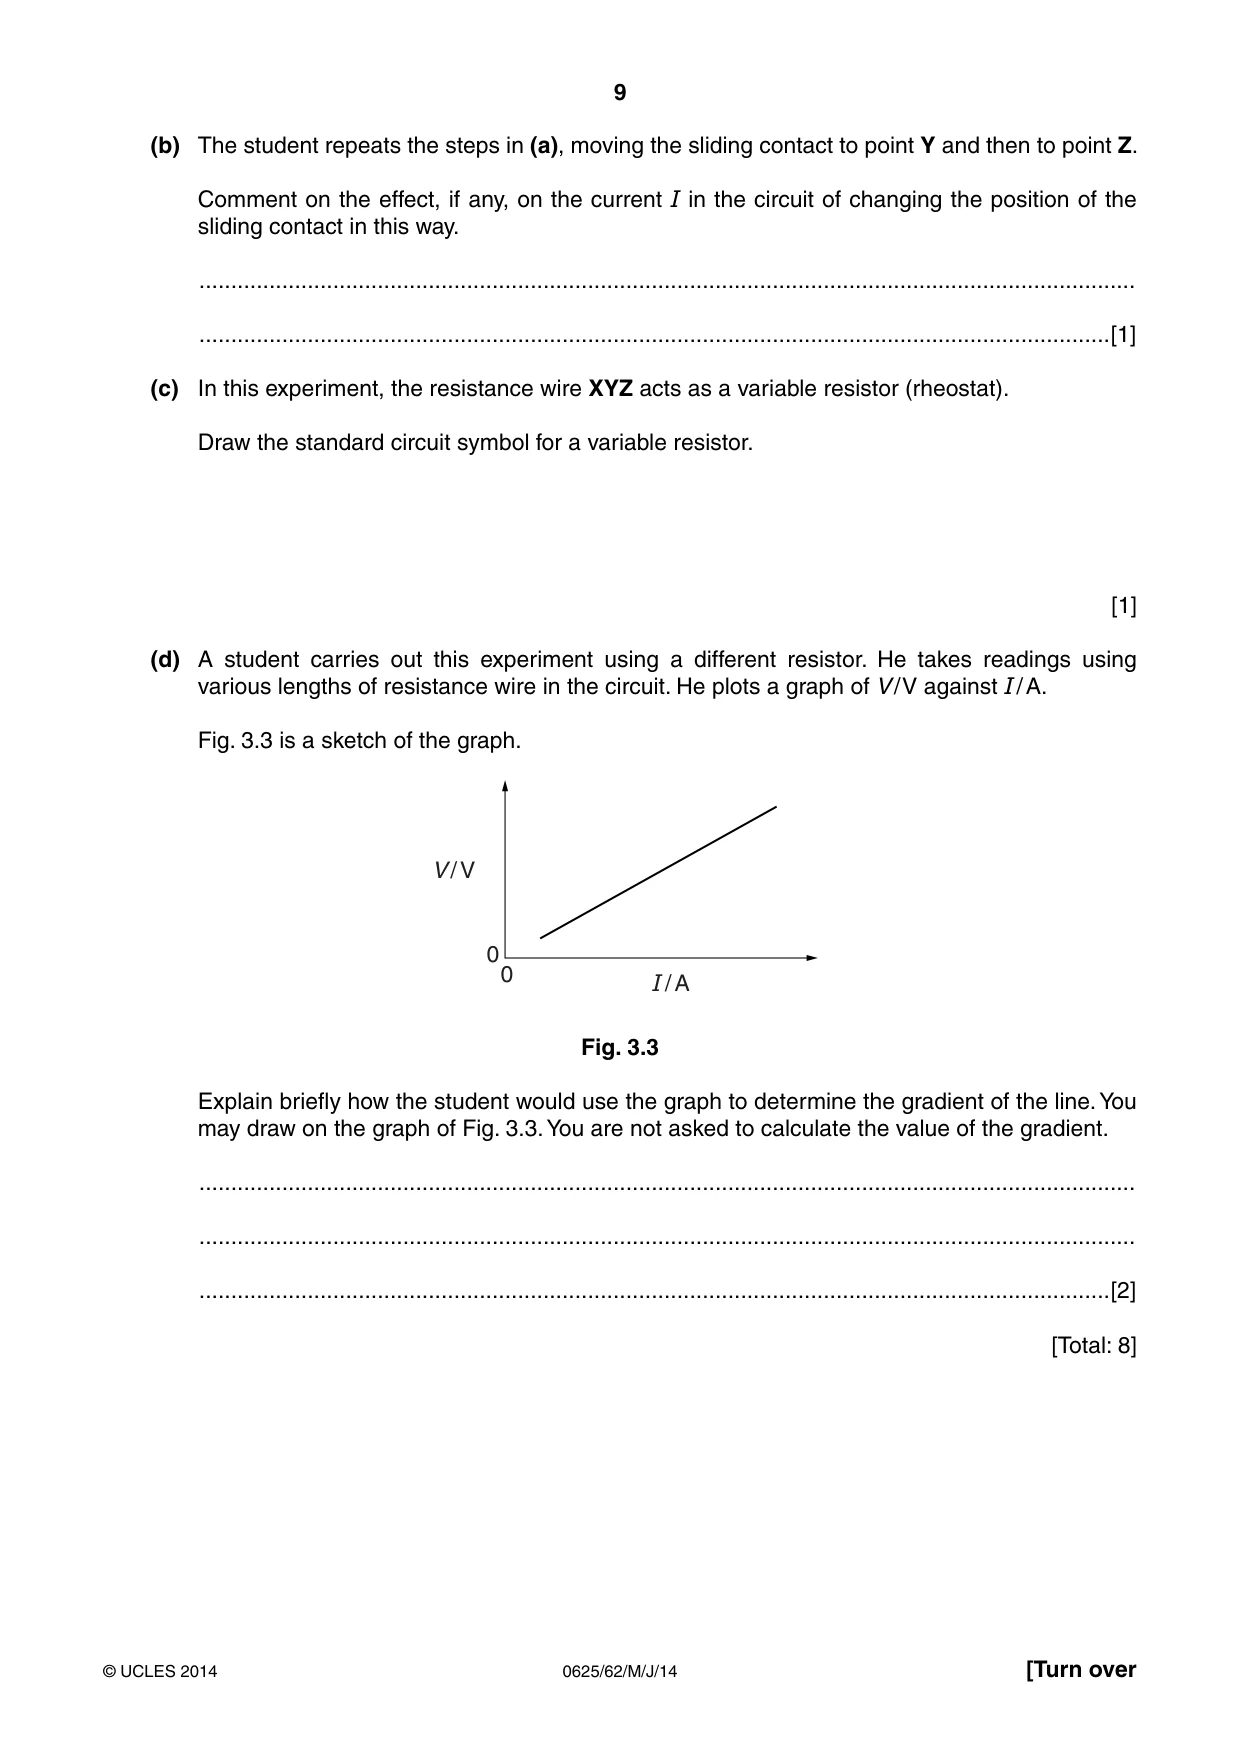
3 The IGCSE class is investigating the resistance of a resistor. Fig. 3.1 shows the circuit. power supply Y Z A X S resistor resistance wire V Fig. 3.1 (a) A student connects the sliding contact S to point X in the circuit. She measures the potential difference V across the resistor and the current I in the circuit. The meters are shown in Fig. 3.2. 4 5 6 0.4 0.6 3 7 2 8 0.2 0.8 1 9 0 V 10 0 A 1.0 Fig. 3.2 (i) Write down the readings shown on the meters in Fig. 3.2. V = .................................................... I = .................................................... [2] V (ii) Calculate the resistance R of the resistor using the equation R = I. R = ............................................... [2] (b) The student repeats the steps in (a), moving the sliding contact to point Y and then to point Z. Comment on the effect, if any, on the current I in the circuit of changing the position of the sliding contact in this way. ................................................................................................................................................... ...............................................................................................................................................[1] (c) In this experiment, the resistance wire XYZ acts as a variable resistor (rheostat). Draw the standard circuit symbol for a variable resistor. [1] (d) A student carries out this experiment using a different resistor. He takes readings using various lengths of resistance wire in the circuit. He plots a graph of V / V against I / A. Fig. 3.3 is a sketch of the graph. V / V 0 0 I / A Fig. 3.3 Explain briefly how the student would use the graph to determine the gradient of the line. You may draw on the graph of Fig. 3.3. You are not asked to calculate the value of the gradient. ................................................................................................................................................... ................................................................................................................................................... ...............................................................................................................................................[2] [Total: 8]
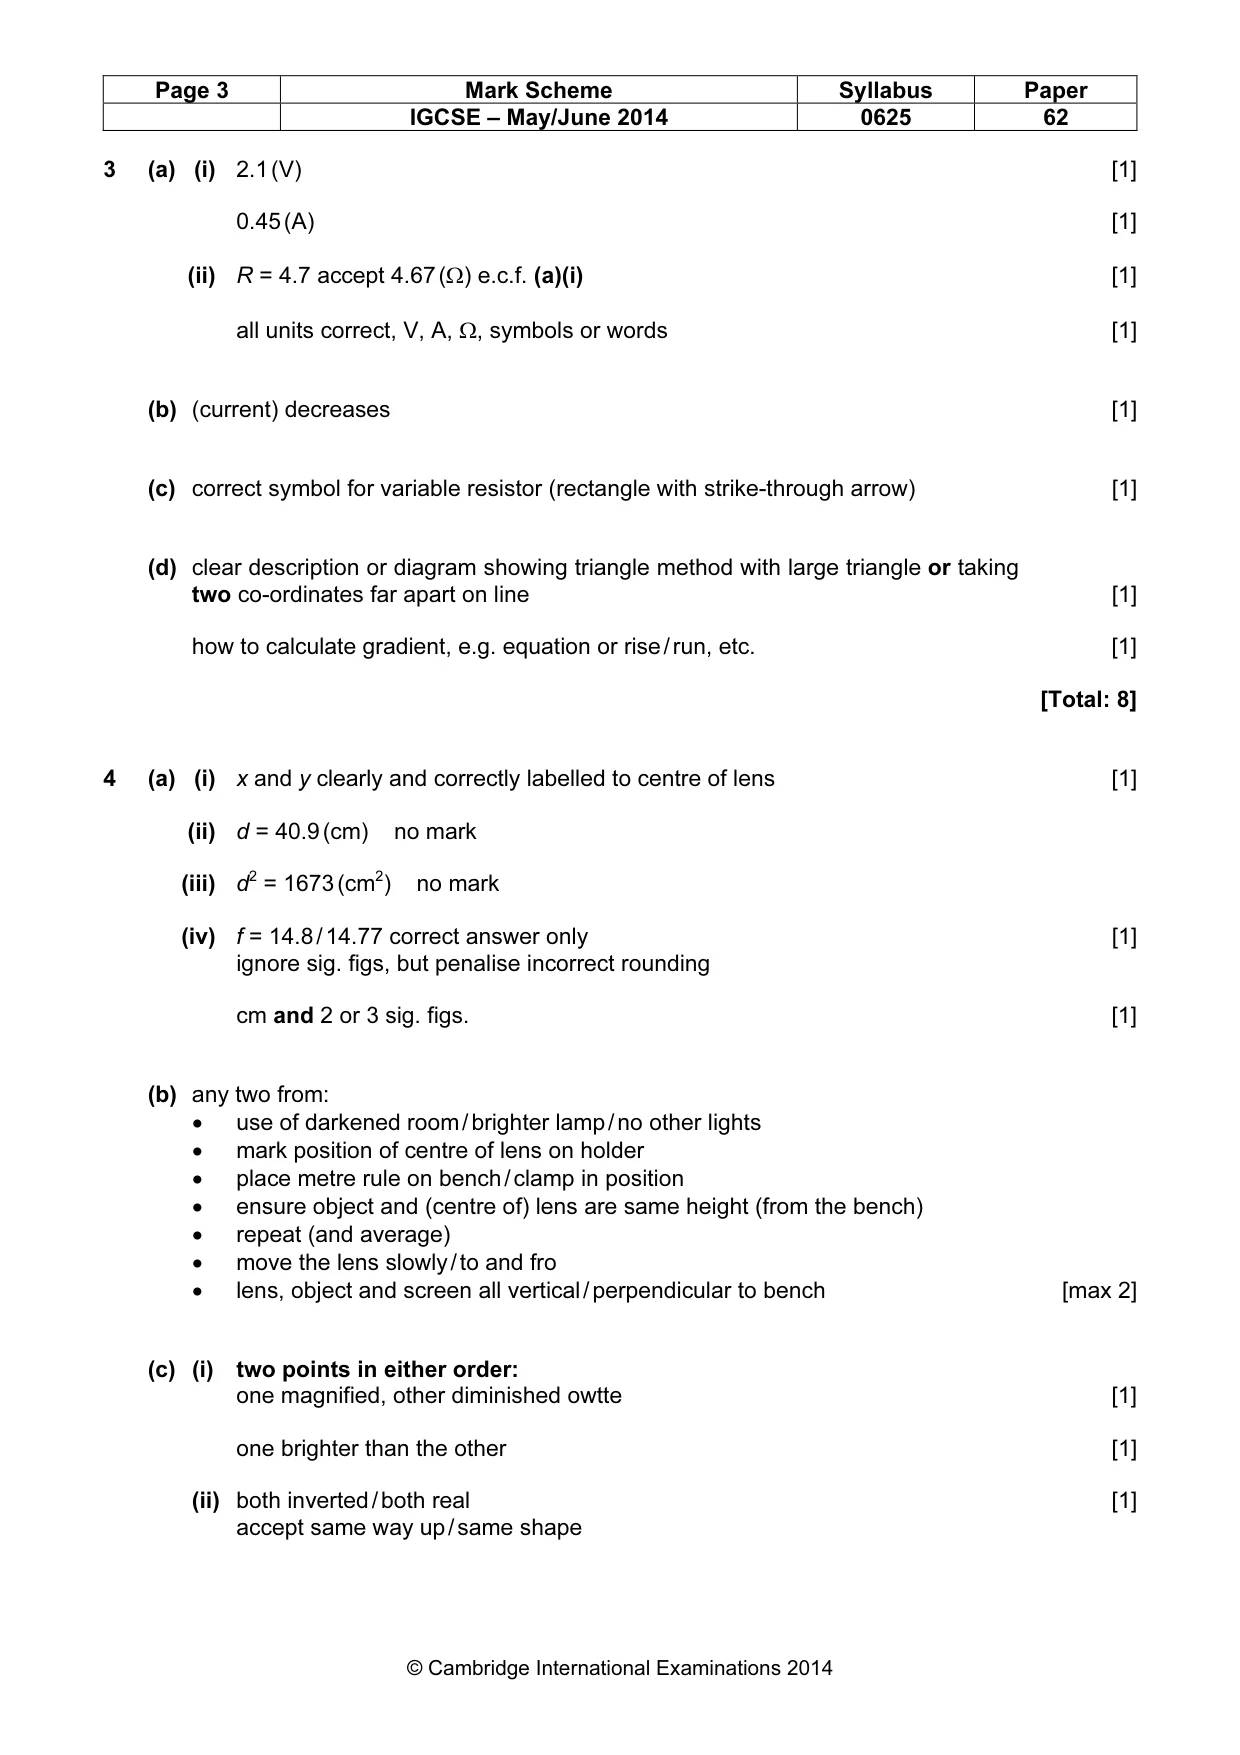
Mark scheme: 3 (a) (i) 2.1 (V) [1] 0.45 (A) [1] (ii) R = 4.7 accept 4.67 (Ω) e.c.f. (a)(i) [1] all units correct, V, A, Ω, symbols or words [1] (b) (current) decreases [1] (c) correct symbol for variable resistor (rectangle with strike-through arrow) [1] (d) clear description or diagram showing triangle method with large triangle or taking two co-ordinates far apart on line [1] how to calculate gradient, e.g. equation or rise / run, etc. [1] [Total: 8]
Q4 · An IGCSE student is determining the focal length of a lens
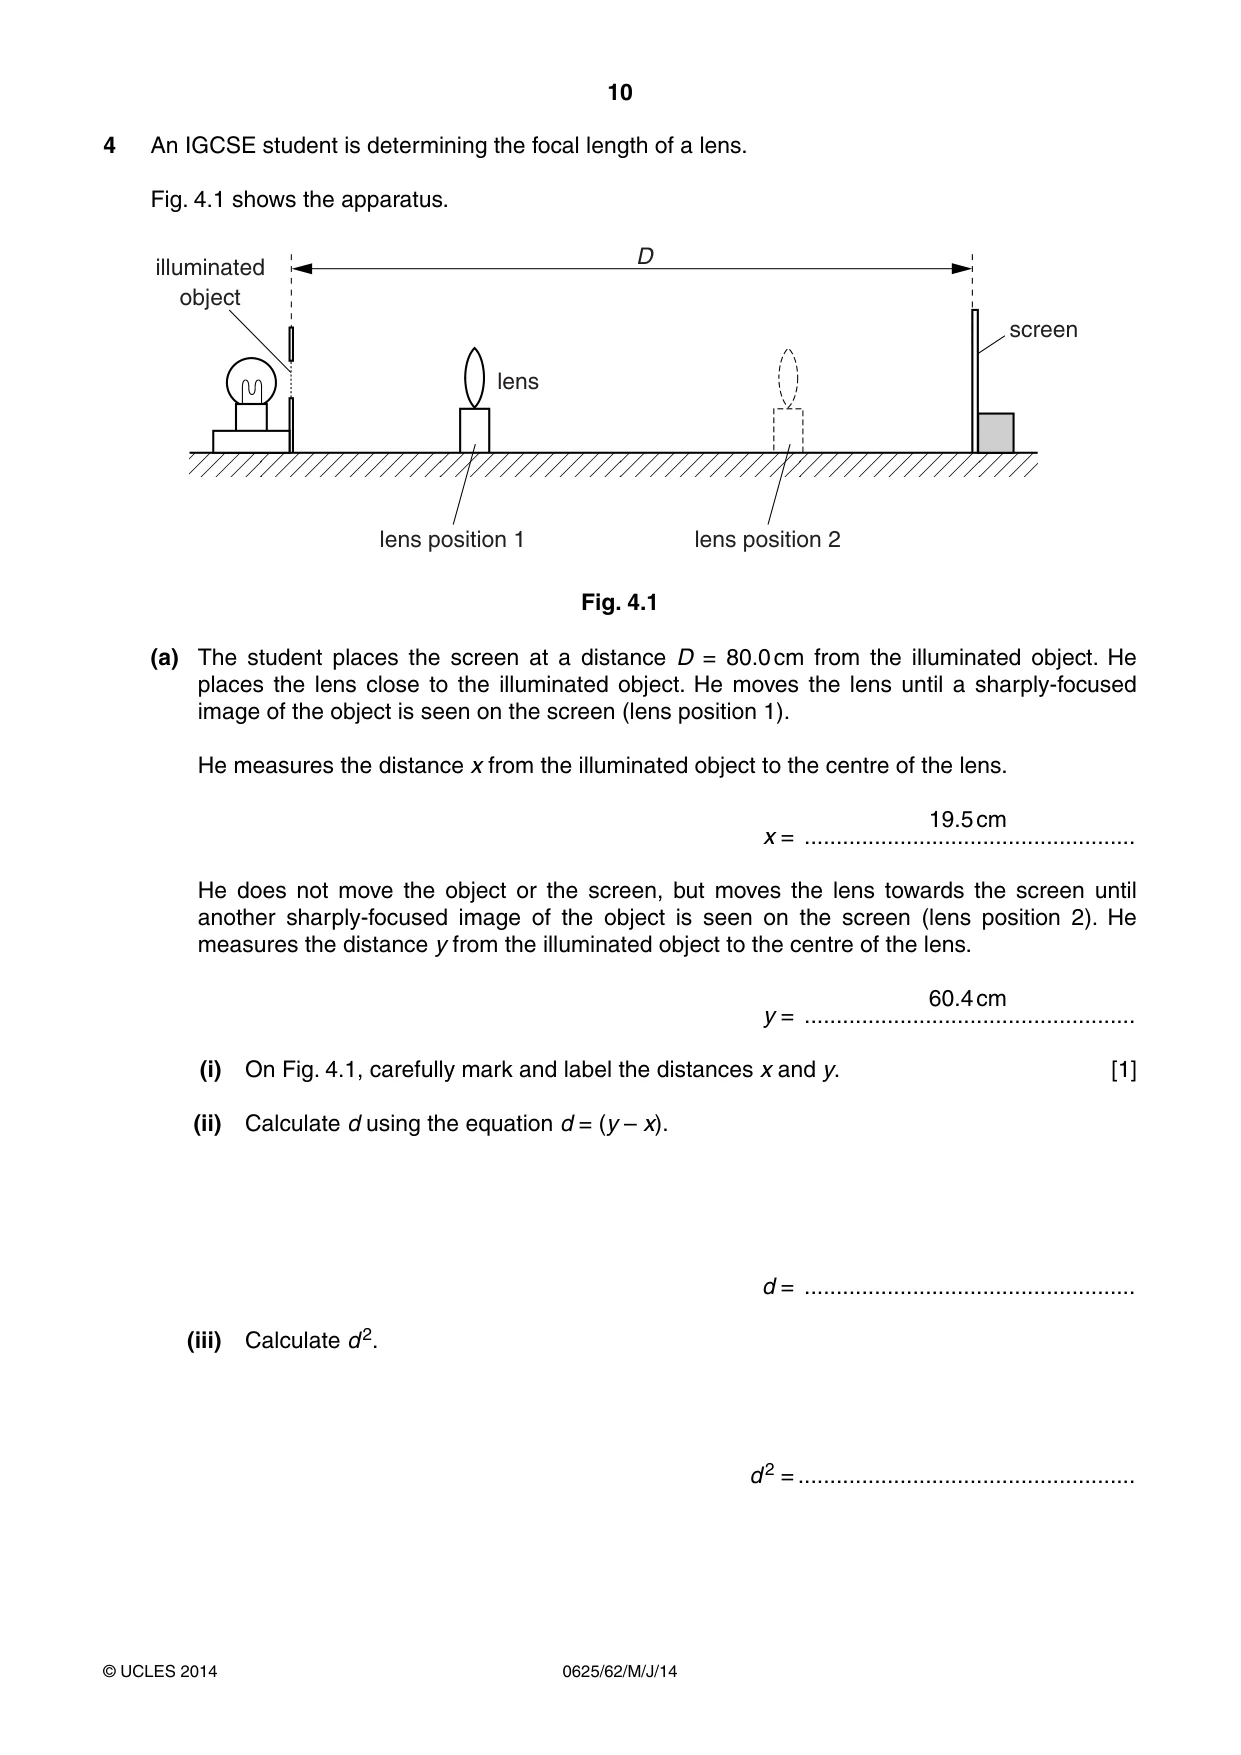
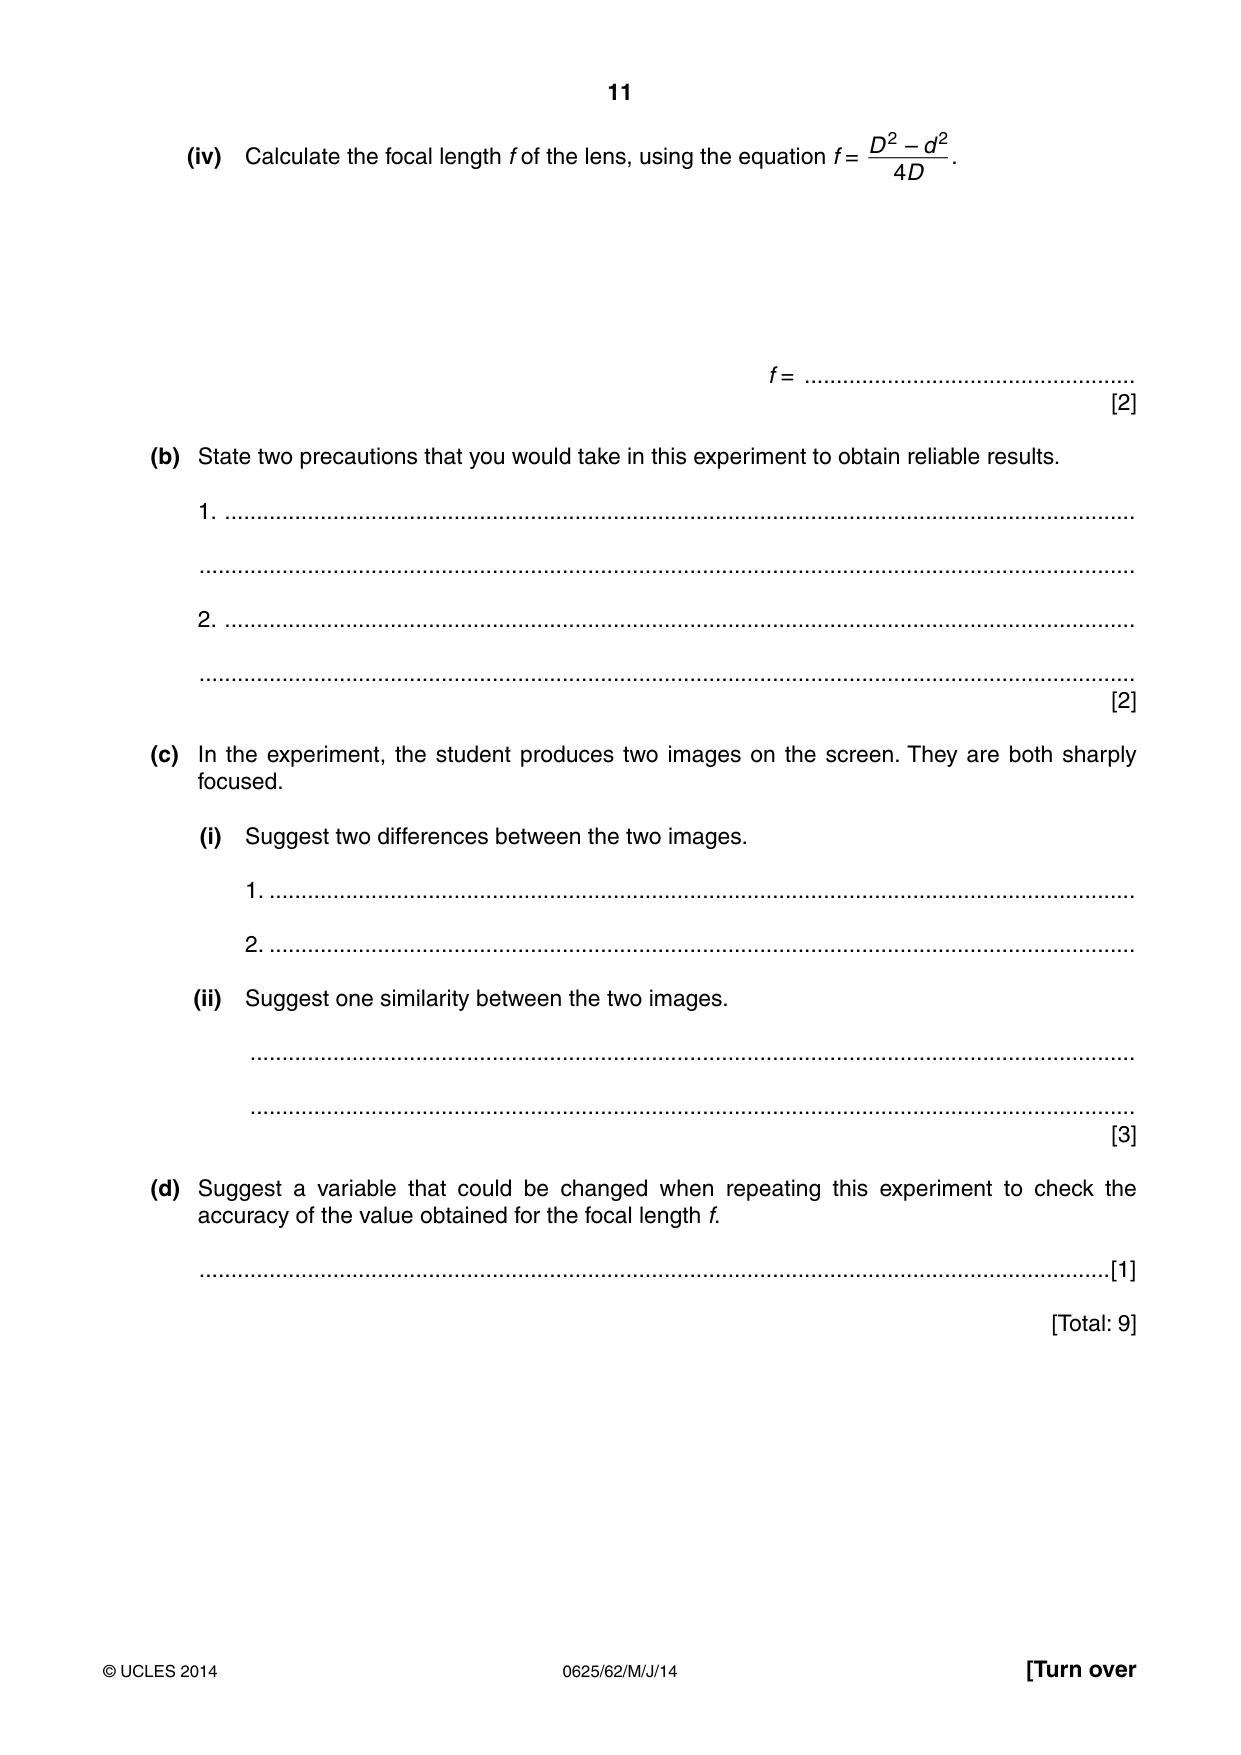
4 An IGCSE student is determining the focal length of a lens. Fig. 4.1 shows the apparatus. D illuminated object screen lens lens position 1 lens position 2 Fig. 4.1 (a) The student places the screen at a distance D = 80.0 cm from the illuminated object. He places the lens close to the illuminated object. He moves the lens until a sharply-focused image of the object is seen on the screen (lens position 1). He measures the distance x from the illuminated object to the centre of the lens. 19.5 cm x = .................................................... He does not move the object or the screen, but moves the lens towards the screen until another sharply-focused image of the object is seen on the screen (lens position 2). He measures the distance y from the illuminated object to the centre of the lens. 60.4 cm y = .................................................... (i) On Fig. 4.1, carefully mark and label the distances x and y. [1] (ii) Calculate d using the equation d = (y – x). d = .................................................... (iii) Calculate d 2. d 2 = ..................................................... D 2 – d 2 (iv) Calculate the focal length f of the lens, using the equation f = . 4D f = .................................................... [2] (b) State two precautions that you would take in this experiment to obtain reliable results. 1. ............................................................................................................................................... ................................................................................................................................................... 2. ............................................................................................................................................... ................................................................................................................................................... [2] (c) In the experiment, the student produces two images on the screen. They are both sharply focused. (i) Suggest two differences between the two images. 1. ........................................................................................................................................ 2. ........................................................................................................................................ (ii) Suggest one similarity between the two images. ........................................................................................................................................... ........................................................................................................................................... [3] (d) Suggest a variable that could be changed when repeating this experiment to check the accuracy of the value obtained for the focal length f. ...............................................................................................................................................[1] [Total: 9]
Mark scheme: 4 (a) (i) x and y clearly and correctly labelled to centre of lens [1] (ii) d = 40.9 (cm) no mark (iii) d2 = 1673 (cm2) no mark (iv) f = 14.8 / 14.77 correct answer only [1] ignore sig. figs, but penalise incorrect rounding cm and 2 or 3 sig. figs. [1] (b) any two from: • use of darkened room / brighter lamp / no other lights • mark position of centre of lens on holder • place metre rule on bench / clamp in position • ensure object and (centre of) lens are same height (from the bench) • repeat (and average) • move the lens slowly / to and fro • lens, object and screen all vertical / perpendicular to bench [max 2] (c) (i) two points in either order: one magnified, other diminished owtte [1] one brighter than the other [1] (ii) both inverted / both real [1] accept same way up / same shape IGCSE – May/June 2014 0625 62 (d) distance between object and screen / D / change position of screen [1] [Total: 9]
Q5 · An IGCSE student is investigating the average speed of a toy car travelling down a slope
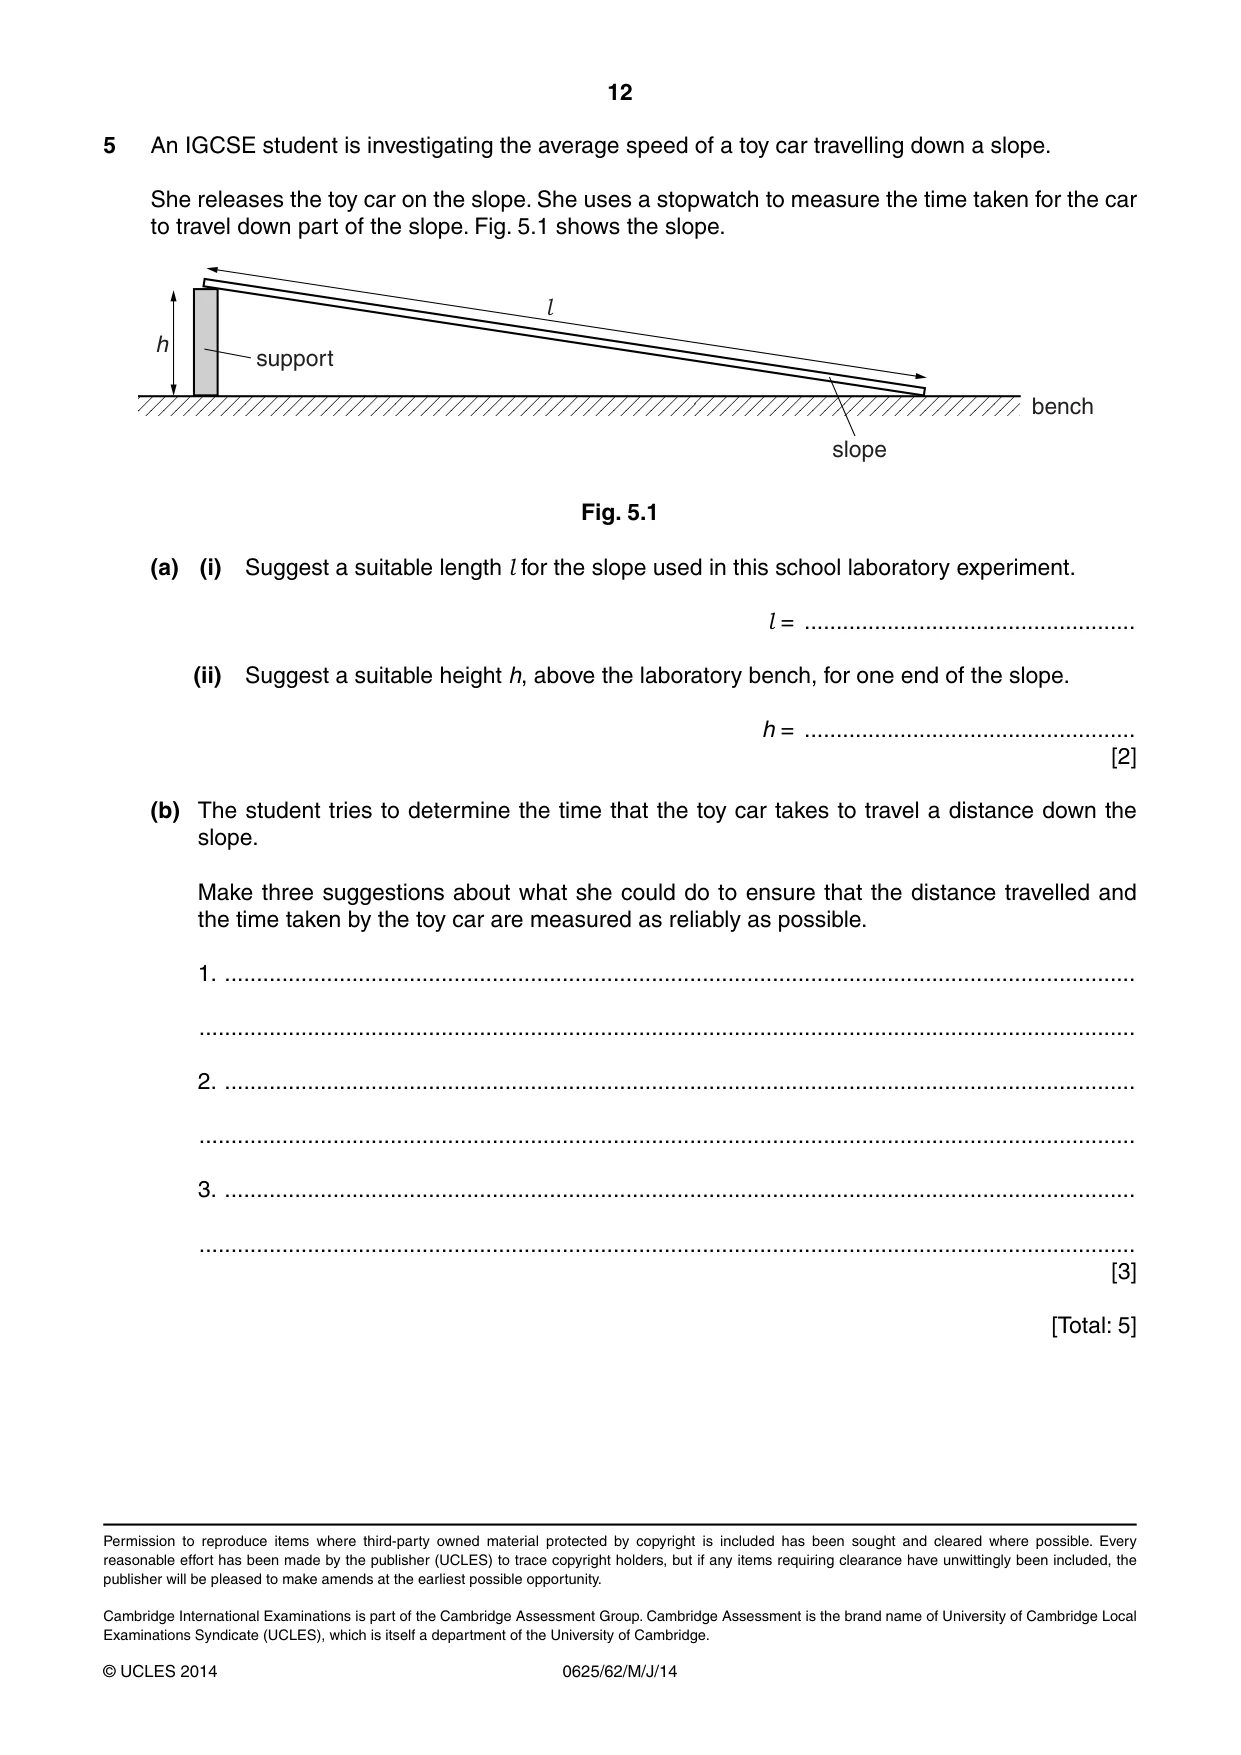
5 An IGCSE student is investigating the average speed of a toy car travelling down a slope. She releases the toy car on the slope. She uses a stopwatch to measure the time taken for the car to travel down part of the slope. Fig. 5.1 shows the slope. l h support bench slope Fig. 5.1 (a) (i) Suggest a suitable length l for the slope used in this school laboratory experiment. l = .................................................... (ii) Suggest a suitable height h, above the laboratory bench, for one end of the slope. h = .................................................... [2] (b) The student tries to determine the time that the toy car takes to travel a distance down the slope. Make three suggestions about what she could do to ensure that the distance travelled and the time taken by the toy car are measured as reliably as possible. 1. ............................................................................................................................................... ................................................................................................................................................... 2. ............................................................................................................................................... ................................................................................................................................................... 3. ............................................................................................................................................... ................................................................................................................................................... [3] [Total: 5]
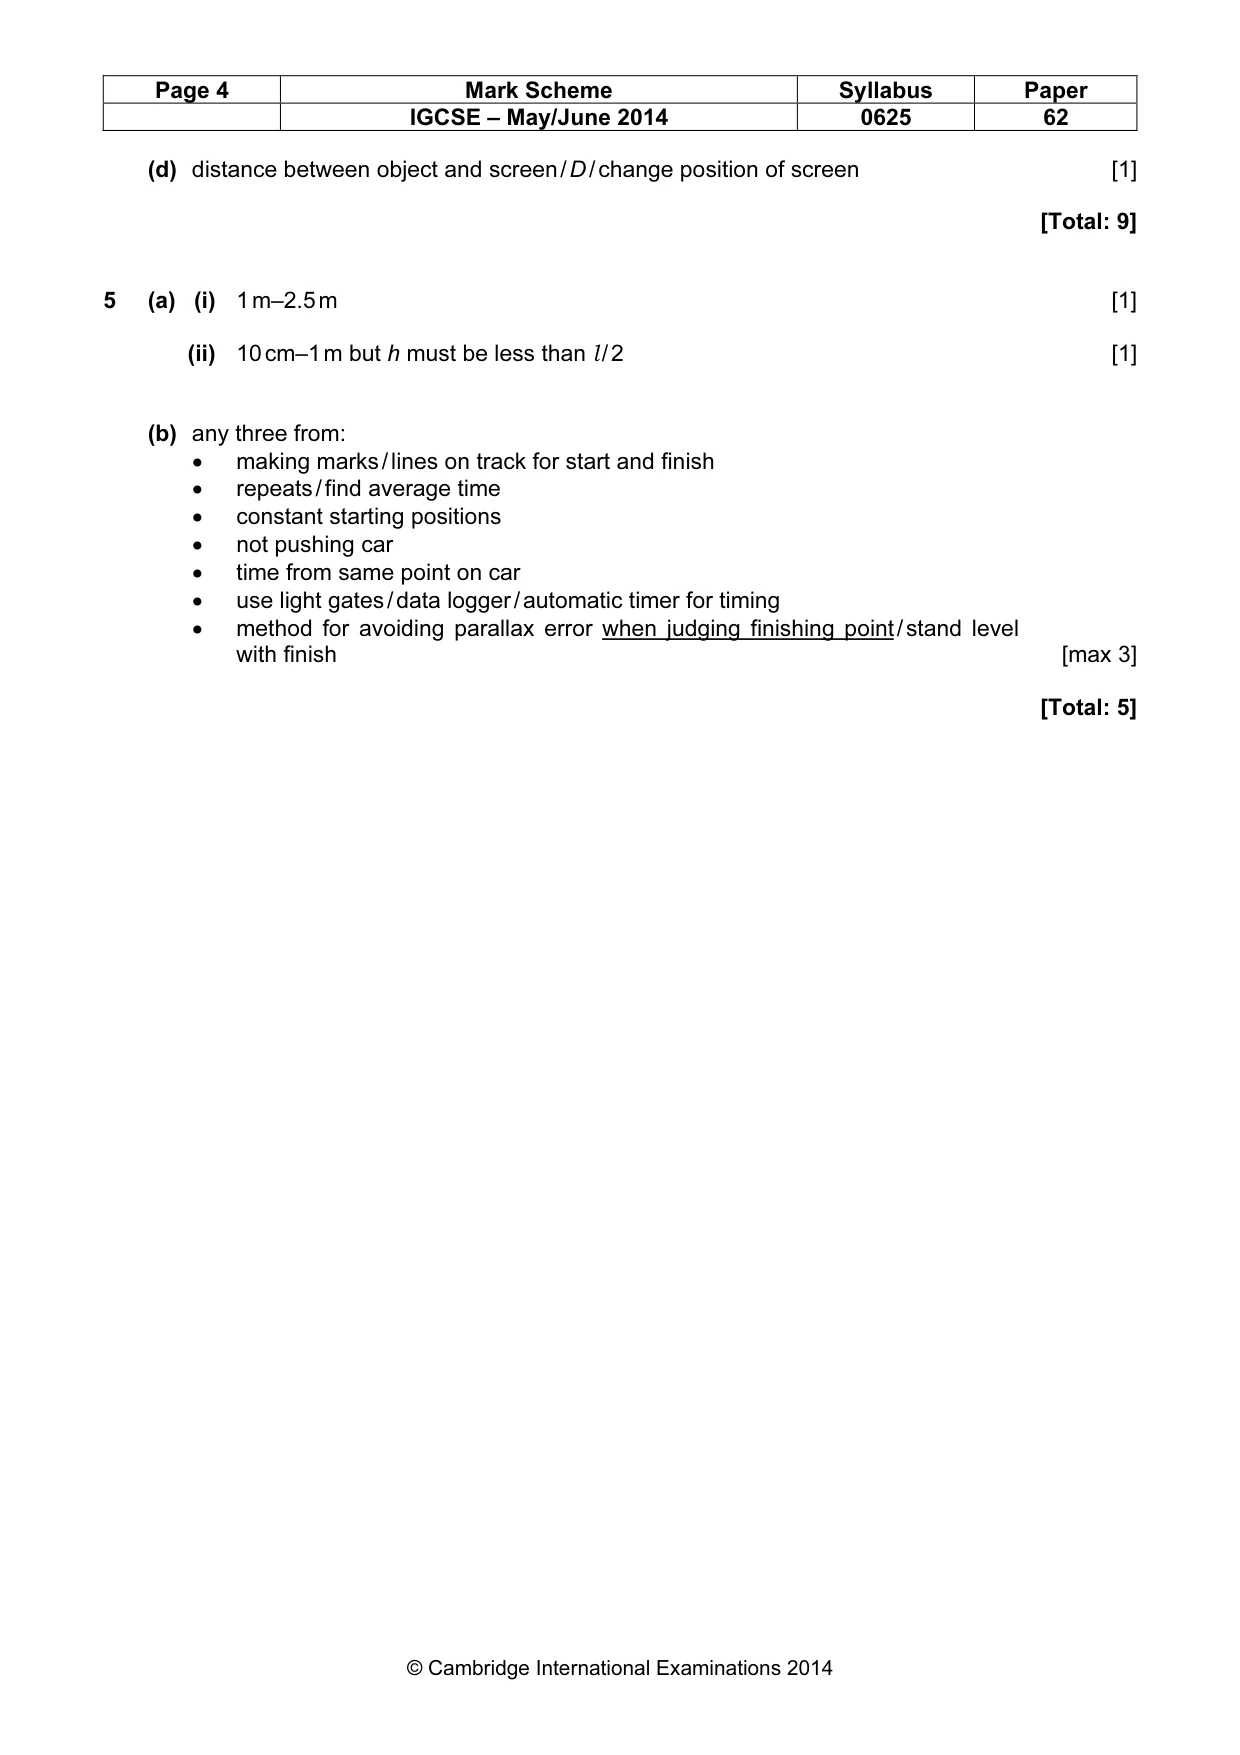
Mark scheme: 5 (a) (i) 1 m–2.5 m [1] (ii) 10 cm–1 m but h must be less than l / 2 [1] (b) any three from: • making marks / lines on track for start and finish • repeats / find average time • constant starting positions • not pushing car • time from same point on car • use light gates / data logger / automatic timer for timing • method for avoiding parallax error when judging finishing point / stand level with finish [max 3] [Total: 5]
More questions on Physical quantities and measurement techniques
What was in this paper
The subtopics covered by these 5 questions, and how many questions each got. Open one in a new tab to see every Cambridge question on it.
What you needed in this session
Cambridge’s own grade thresholds for 2014 May/June, Paper 6 · Variant 2. A higher threshold means an easier paper — the bar moves with how the cohort did.