Cambridge IGCSE Physics 0625 — 2014 May/June Paper 6 · Variant 1
0625/61/M/J/14 · 5 questions · 40 marks · ≈45 min
The question paper and its mark scheme, free to read here and free to download. This is Cambridge’s own paper, exactly as it was sat.
Question paper12 pages
Mark scheme4 pages
Answers below. Sit the paper first if you are practising.
Questions as text
Q1 · The IGCSE class is investigating the motion of a mass hanging on a spring
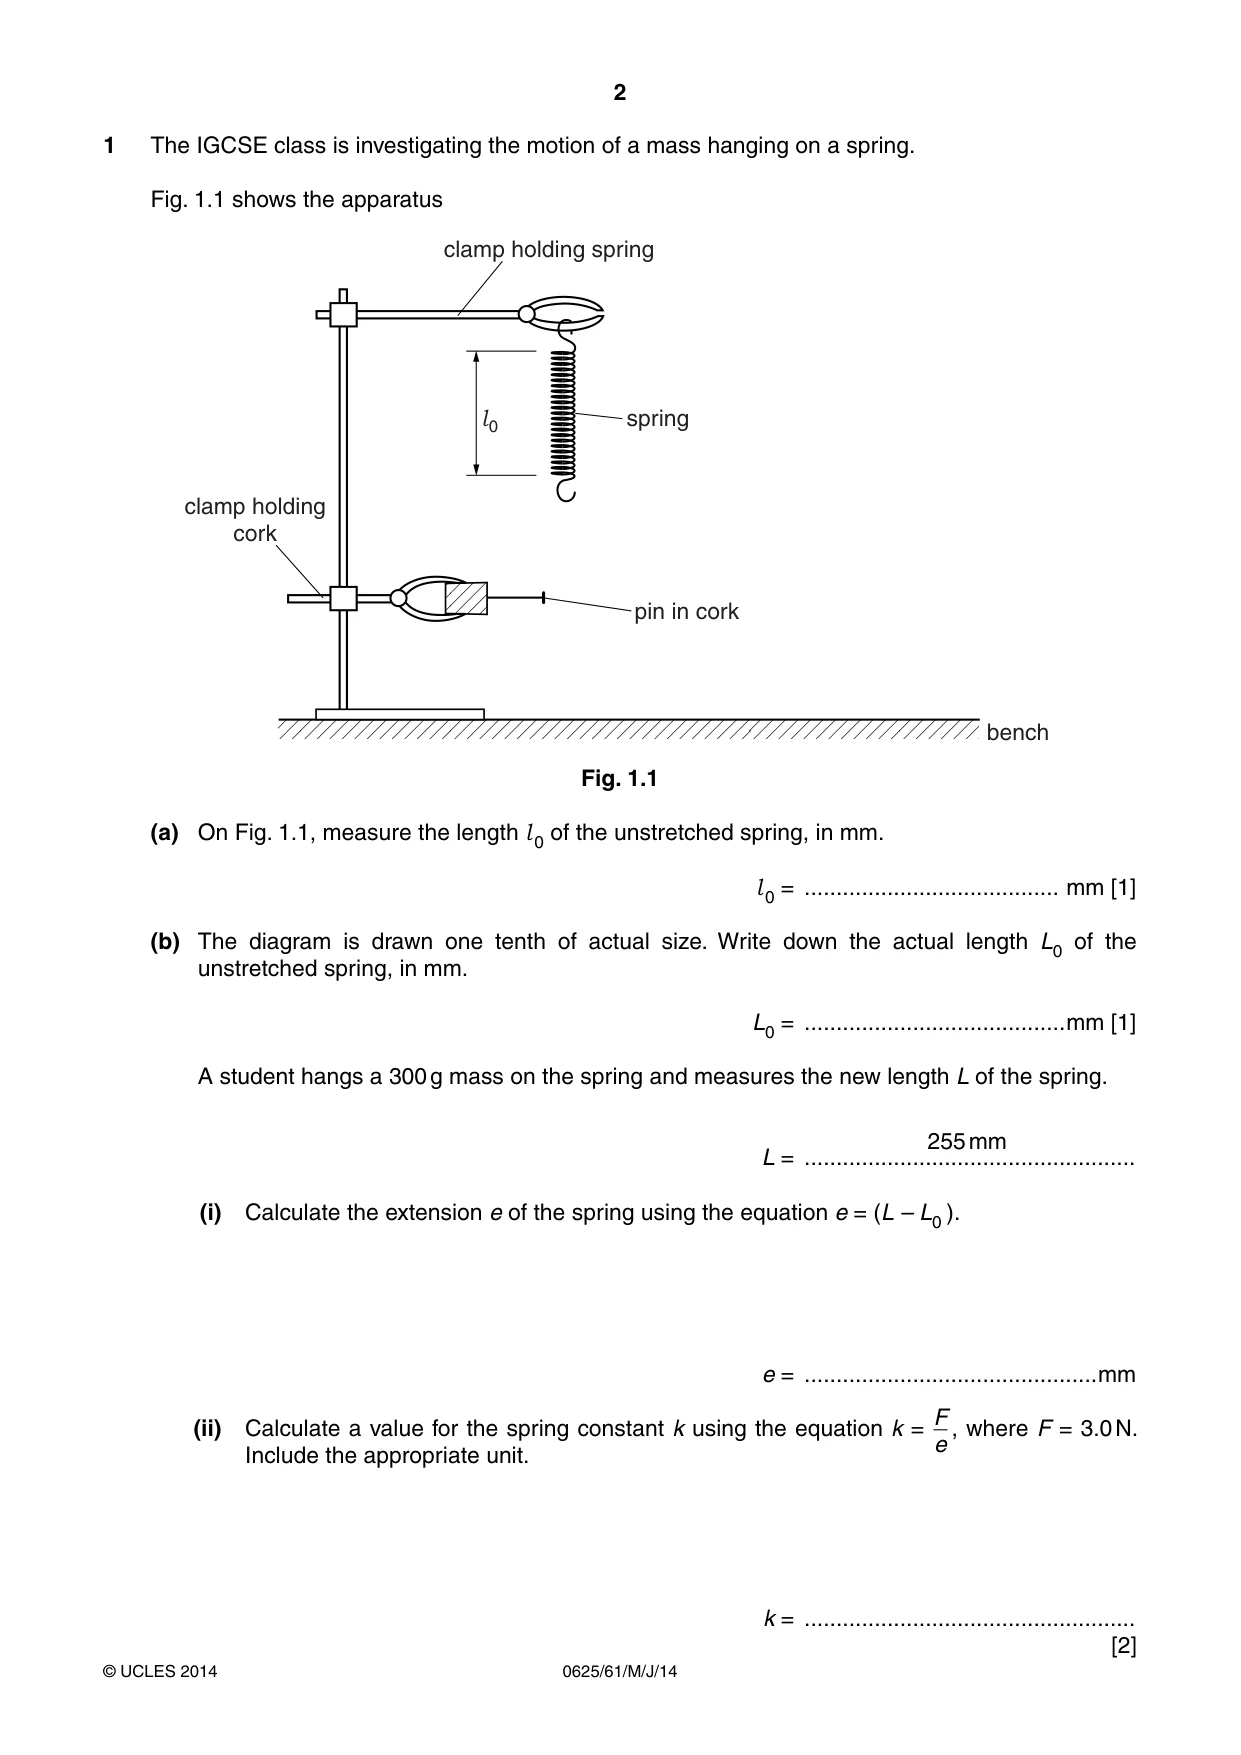
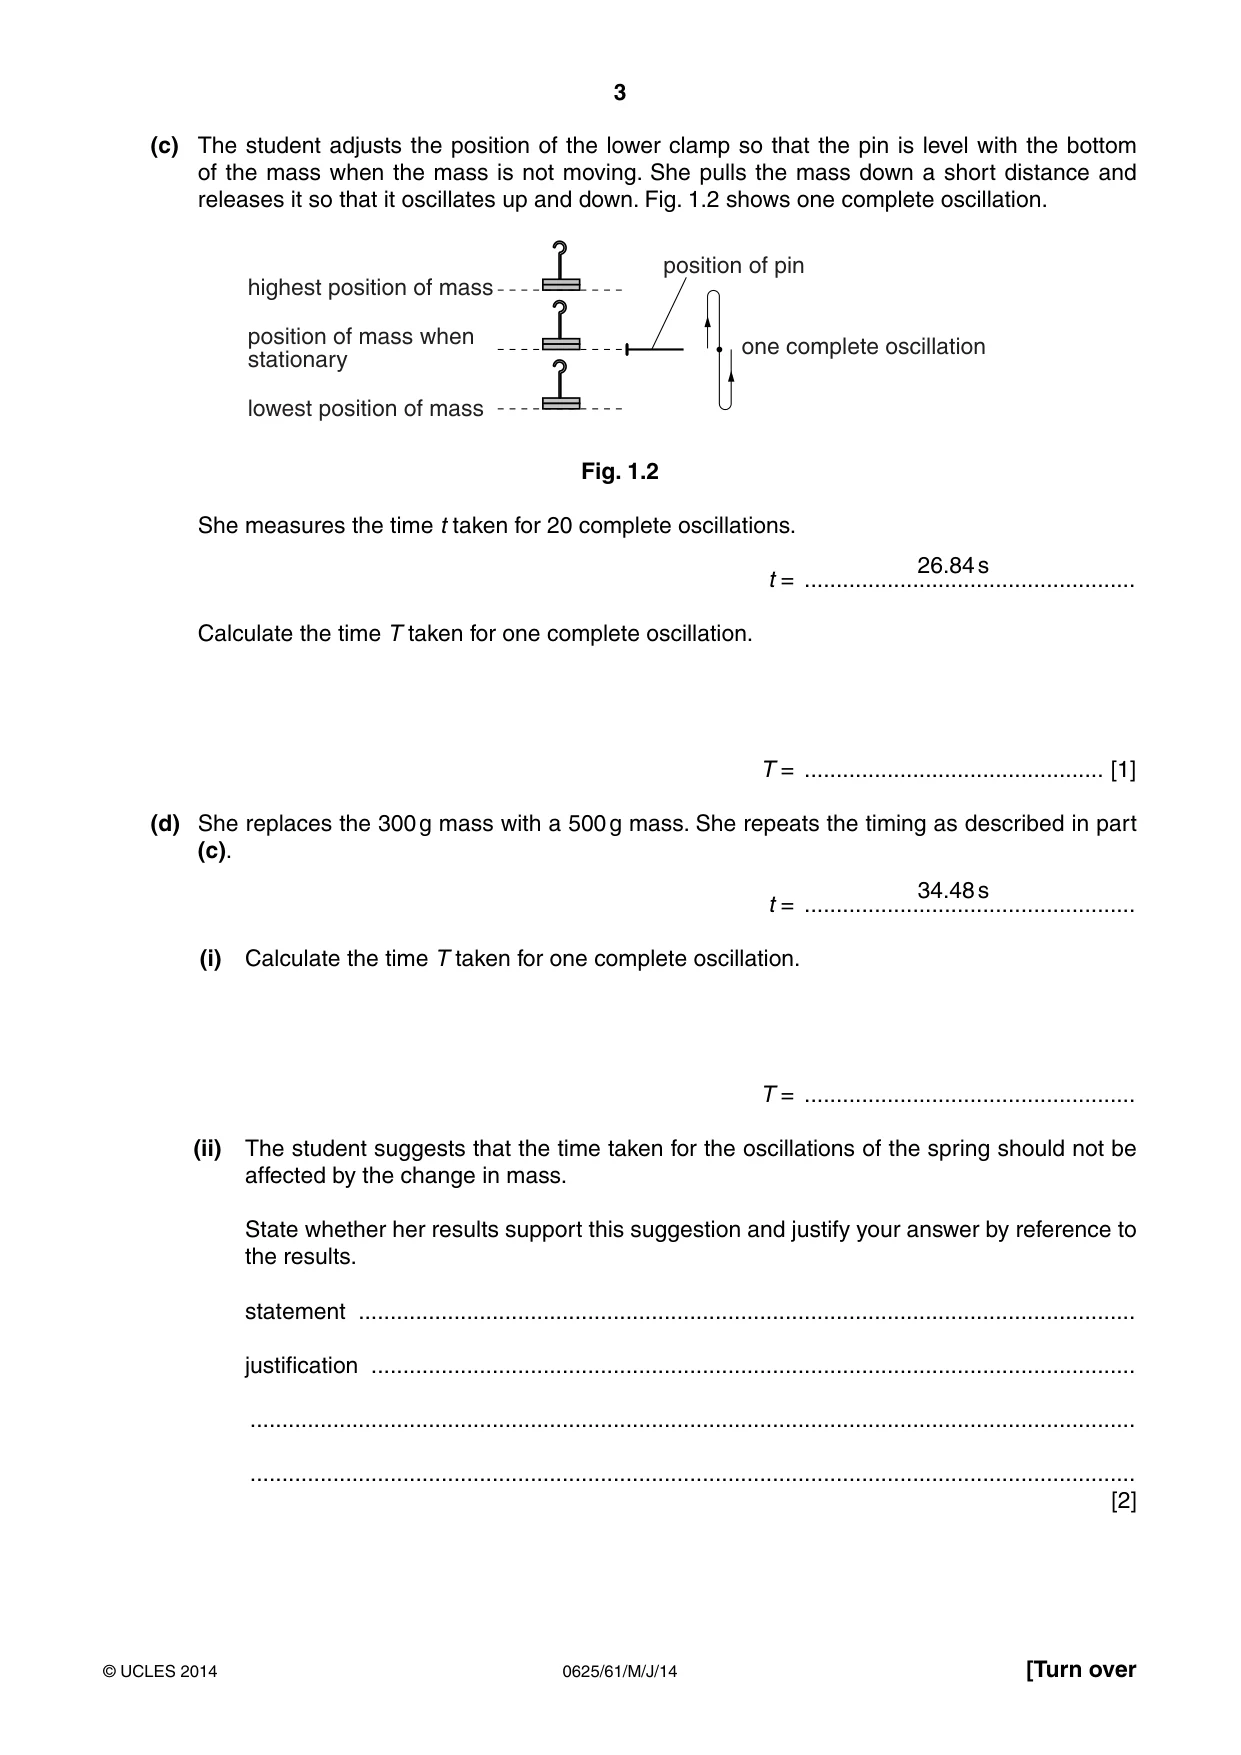
1 The IGCSE class is investigating the motion of a mass hanging on a spring. Fig. 1.1 shows the apparatus clamp holding spring l 0 spring clamp holding cork pin in cork bench Fig. 1.1 (a) On Fig. 1.1, measure the length l of the unstretched spring, in mm. 0 l = ........................................ mm [1] 0 (b) The diagram is drawn one tenth of actual size. Write down the actual length L0 of the unstretched spring, in mm. L0 = .........................................mm [1] A student hangs a 300 g mass on the spring and measures the new length L of the spring. 255 mm L = .................................................... (i) Calculate the extension e of the spring using the equation e = (L – L0 ). e = ..............................................mm F (ii) Calculate a value for the spring constant k using the equation k = , where F = 3.0 N. e Include the appropriate unit. k = .................................................... [2] (c) The student adjusts the position of the lower clamp so that the pin is level with the bottom of the mass when the mass is not moving. She pulls the mass down a short distance and releases it so that it oscillates up and down. Fig. 1.2 shows one complete oscillation. position of pin highest position of mass position of mass when one complete oscillation stationary lowest position of mass Fig. 1.2 She measures the time t taken for 20 complete oscillations. 26.84 s t = .................................................... Calculate the time T taken for one complete oscillation. T = ............................................... [1] (d) She replaces the 300 g mass with a 500 g mass. She repeats the timing as described in part (c). 34.48 s t = .................................................... (i) Calculate the time T taken for one complete oscillation. T = .................................................... (ii) The student suggests that the time taken for the oscillations of the spring should not be affected by the change in mass. State whether her results support this suggestion and justify your answer by reference to the results. statement .......................................................................................................................... justification ........................................................................................................................ ........................................................................................................................................... ........................................................................................................................................... [2] (e) Explain briefly how you avoid a line-of-sight (parallax) error when measuring the length of a spring in this type of experiment. You may draw a diagram. ................................................................................................................................................... ................................................................................................................................................... ...............................................................................................................................................[1] [Total: 8]
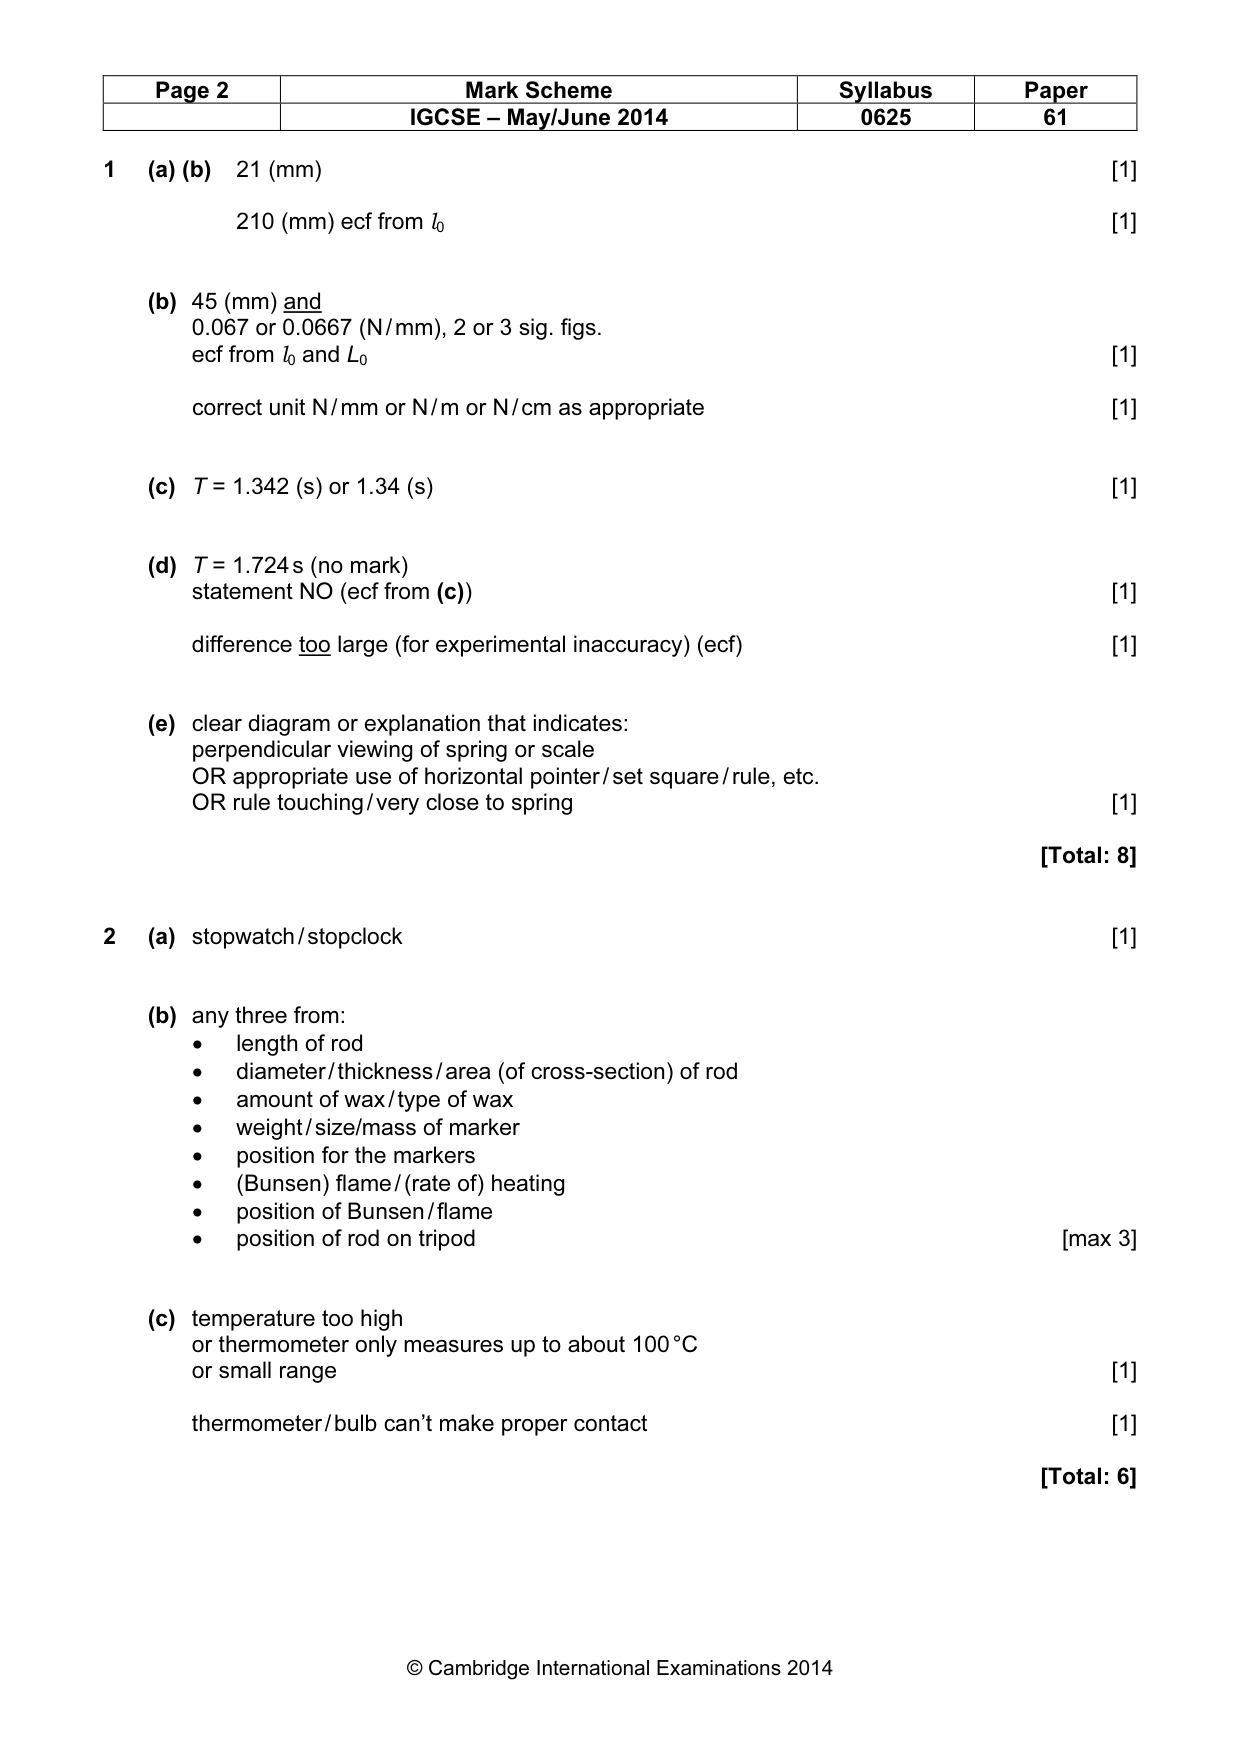
Mark scheme: 1 (a) (b) 21 (mm) [1] 210 (mm) ecf from l0 [1] (b) 45 (mm) and 0.067 or 0.0667 (N / mm), 2 or 3 sig. figs. ecf from l0 and L0 [1] correct unit N / mm or N / m or N / cm as appropriate [1] (c) T = 1.342 (s) or 1.34 (s) [1] (d) T = 1.724 s (no mark) statement NO (ecf from (c)) [1] difference too large (for experimental inaccuracy) (ecf) [1] (e) clear diagram or explanation that indicates: perpendicular viewing of spring or scale OR appropriate use of horizontal pointer / set square / rule, etc. OR rule touching / very close to spring [1] [Total: 8]
More questions on Physical quantities and measurement techniques
Q2 · A student carries out an experiment to compare how quickly thermal energy is conducted…
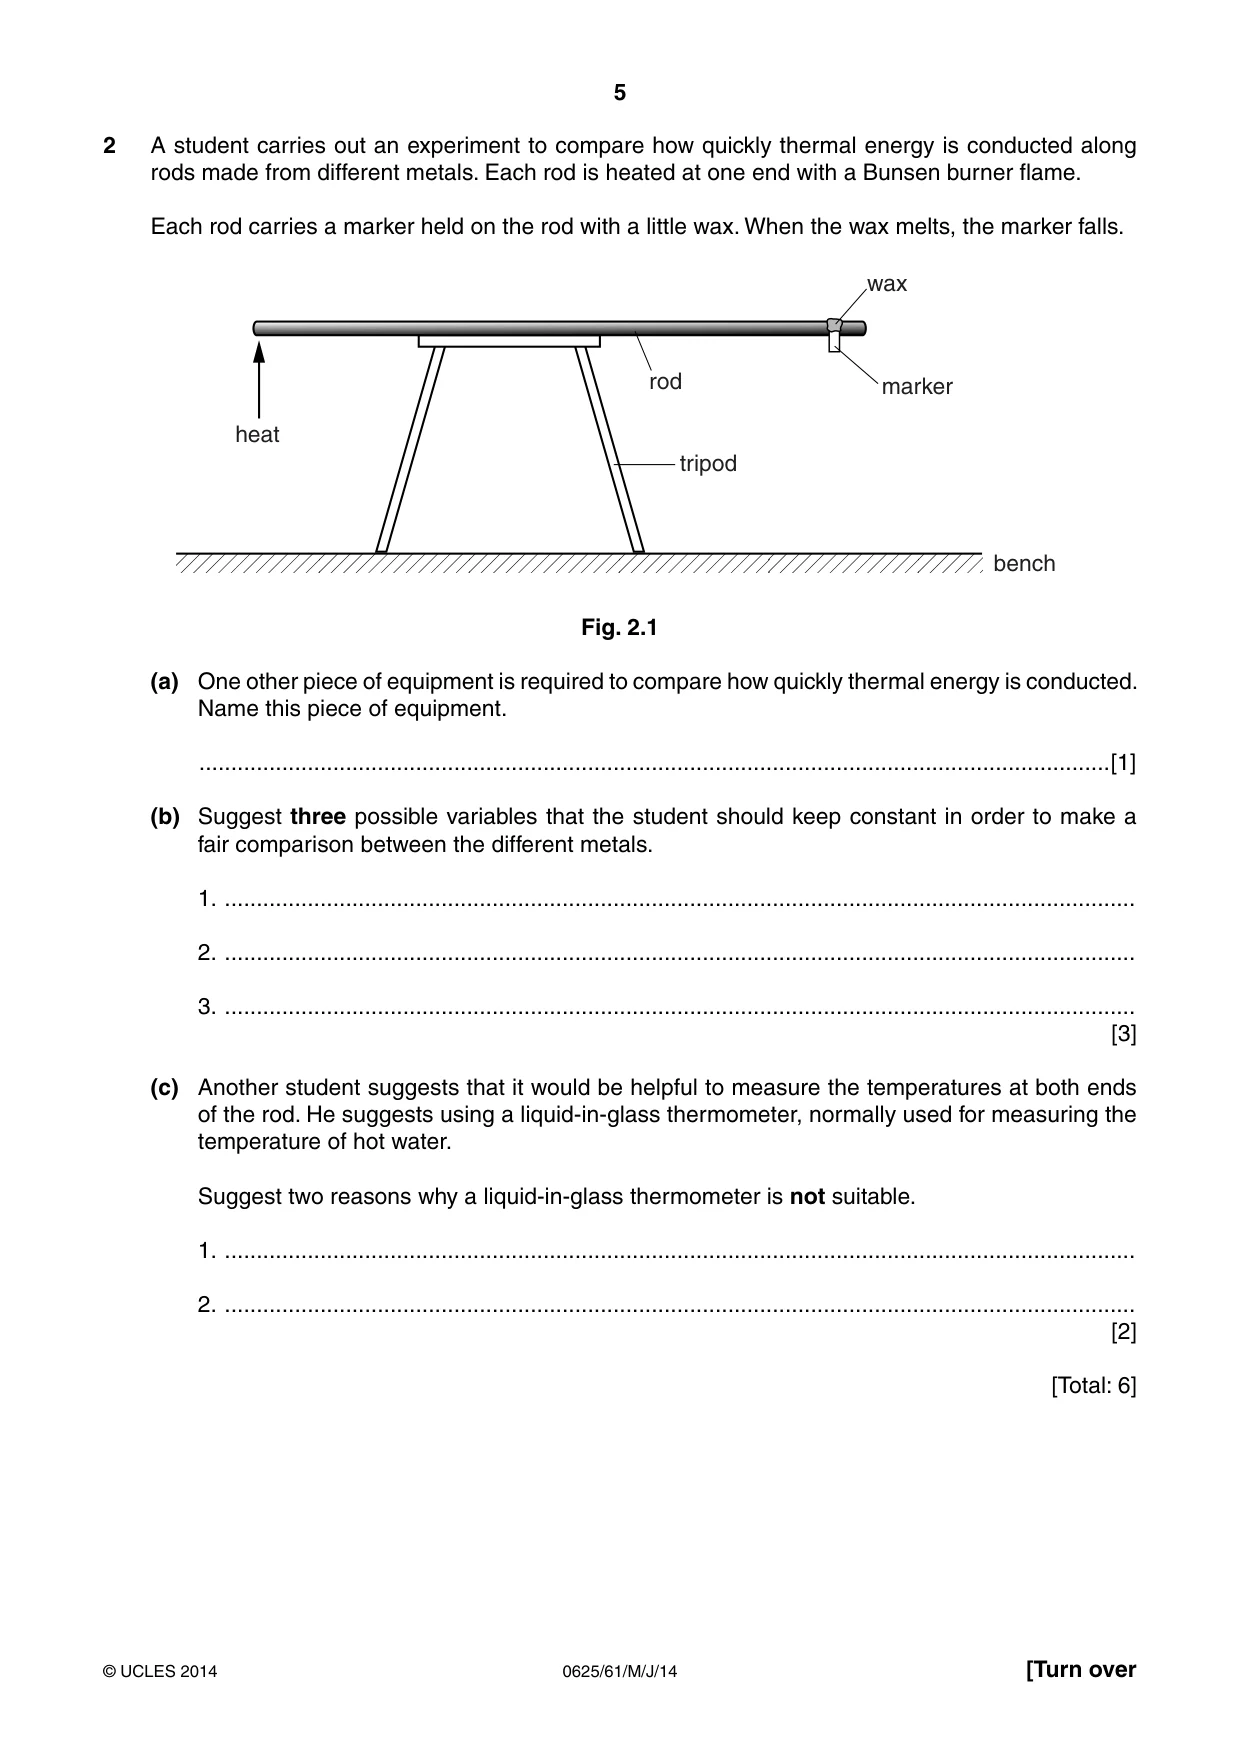
2 A student carries out an experiment to compare how quickly thermal energy is conducted along rods made from different metals. Each rod is heated at one end with a Bunsen burner flame. Each rod carries a marker held on the rod with a little wax. When the wax melts, the marker falls. wax rod marker heat tripod bench Fig. 2.1 (a) One other piece of equipment is required to compare how quickly thermal energy is conducted. Name this piece of equipment. ...............................................................................................................................................[1] (b) Suggest three possible variables that the student should keep constant in order to make a fair comparison between the different metals. 1. ............................................................................................................................................... 2. ............................................................................................................................................... 3. ............................................................................................................................................... [3] (c) Another student suggests that it would be helpful to measure the temperatures at both ends of the rod. He suggests using a liquid-in-glass thermometer, normally used for measuring the temperature of hot water. Suggest two reasons why a liquid-in-glass thermometer is not suitable. 1. ............................................................................................................................................... 2. ............................................................................................................................................... [2] [Total: 6]
Mark scheme: 2 (a) stopwatch / stopclock [1] (b) any three from: • length of rod • diameter / thickness / area (of cross-section) of rod • amount of wax / type of wax • weight / size/mass of marker • position for the markers • (Bunsen) flame / (rate of) heating • position of Bunsen / flame • position of rod on tripod [max 3] (c) temperature too high or thermometer only measures up to about 100 °C or small range [1] thermometer / bulb can’t make proper contact [1] [Total: 6] IGCSE – May/June 2014 0625 61
Q3 · The IGCSE class is investigating the cooling of a thermometer bulb under different…
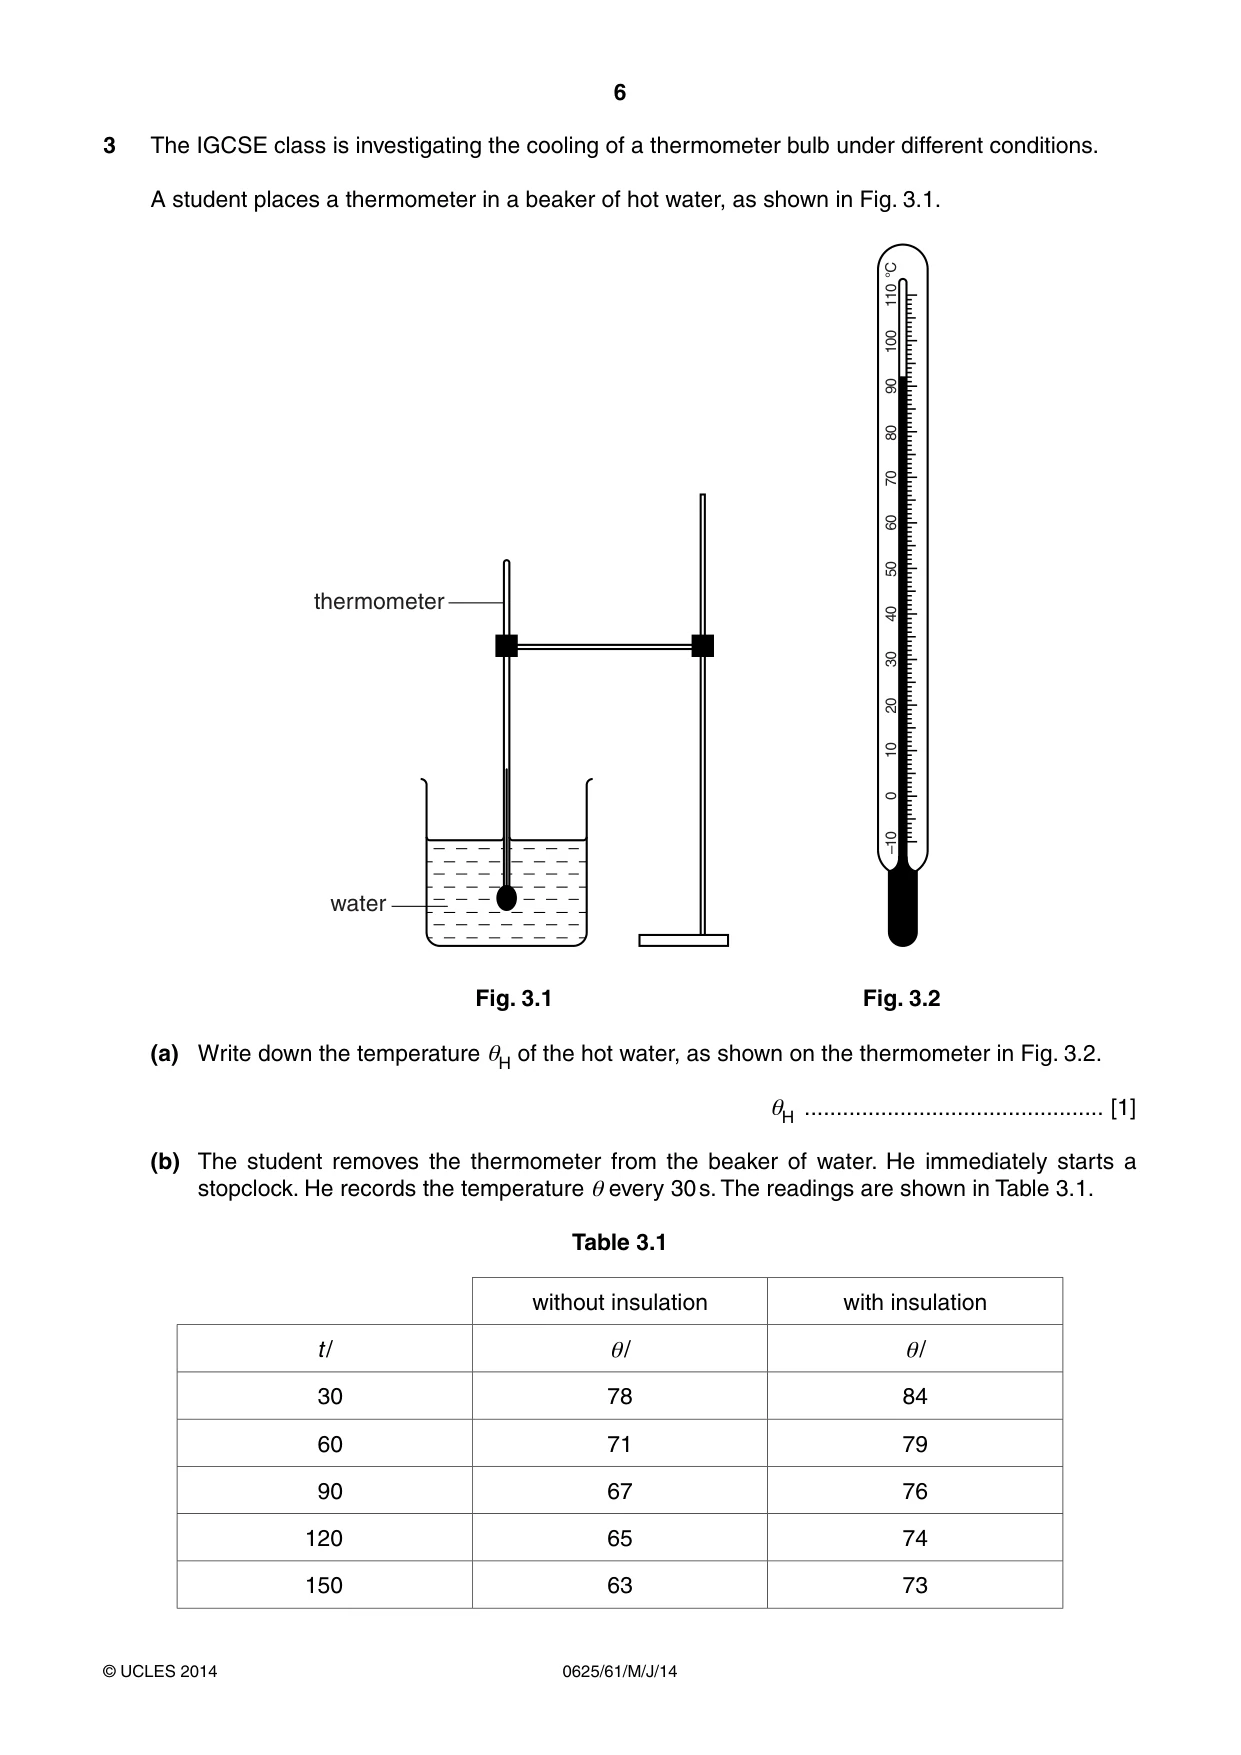
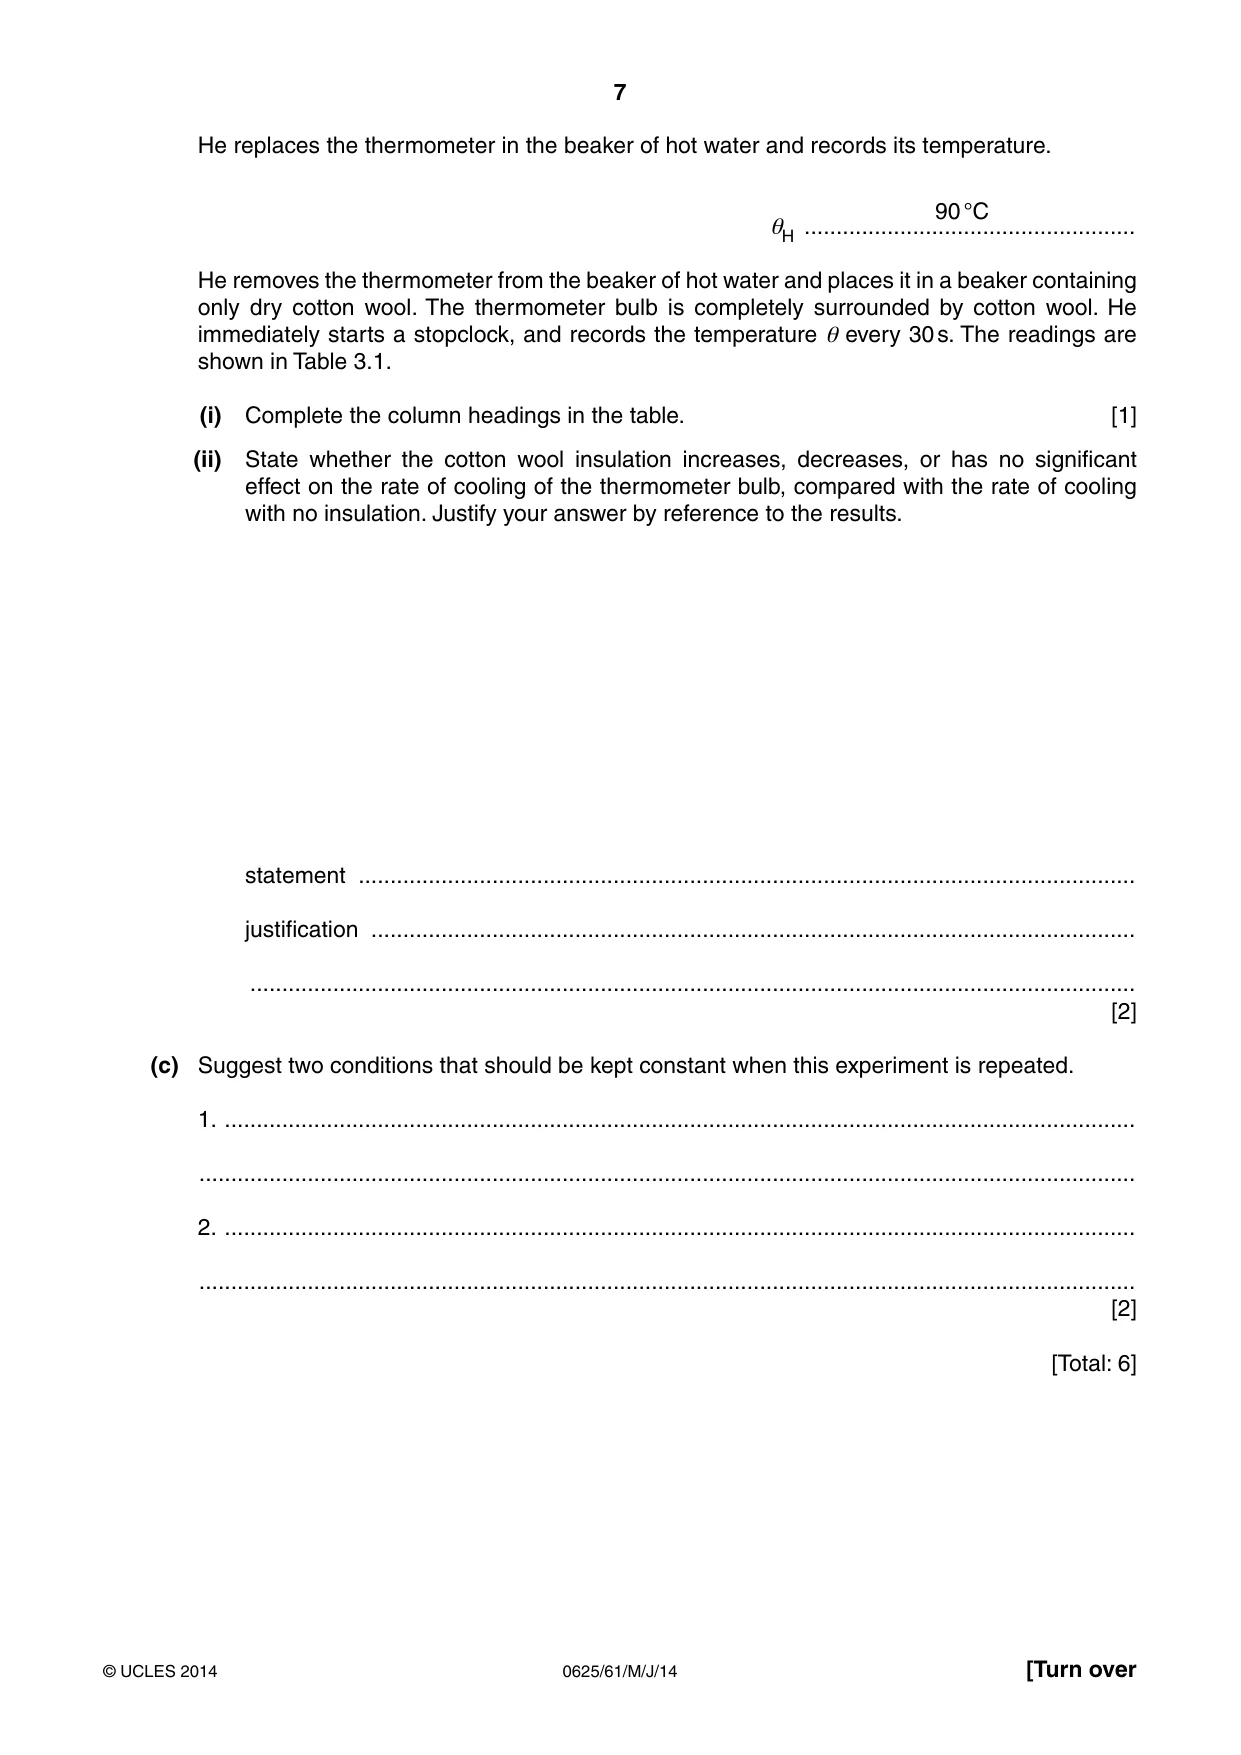
3 The IGCSE class is investigating the cooling of a thermometer bulb under different conditions. A student places a thermometer in a beaker of hot water, as shown in Fig. 3.1. °C 110 100 90 80 70 60 50 thermometer 40 30 20 10 0 –10 water Fig. 3.1 Fig. 3.2 (a) Write down the temperature θH of the hot water, as shown on the thermometer in Fig. 3.2. θH ............................................... [1] (b) The student removes the thermometer from the beaker of water. He immediately starts a stopclock. He records the temperature θ every 30 s. The readings are shown in Table 3.1. Table 3.1 without insulation with insulation t / θ/ θ/ 30 78 84 60 71 79 90 67 76 120 65 74 150 63 73 He replaces the thermometer in the beaker of hot water and records its temperature. 90 °C θH .................................................... He removes the thermometer from the beaker of hot water and places it in a beaker containing only dry cotton wool. The thermometer bulb is completely surrounded by cotton wool. He immediately starts a stopclock, and records the temperature θ every 30 s. The readings are shown in Table 3.1. (i) Complete the column headings in the table. [1] (ii) State whether the cotton wool insulation increases, decreases, or has no significant effect on the rate of cooling of the thermometer bulb, compared with the rate of cooling with no insulation. Justify your answer by reference to the results. statement .......................................................................................................................... justification ........................................................................................................................ ........................................................................................................................................... [2] (c) Suggest two conditions that should be kept constant when this experiment is repeated. 1. ............................................................................................................................................... ................................................................................................................................................... 2. ............................................................................................................................................... ................................................................................................................................................... [2] [Total: 6]
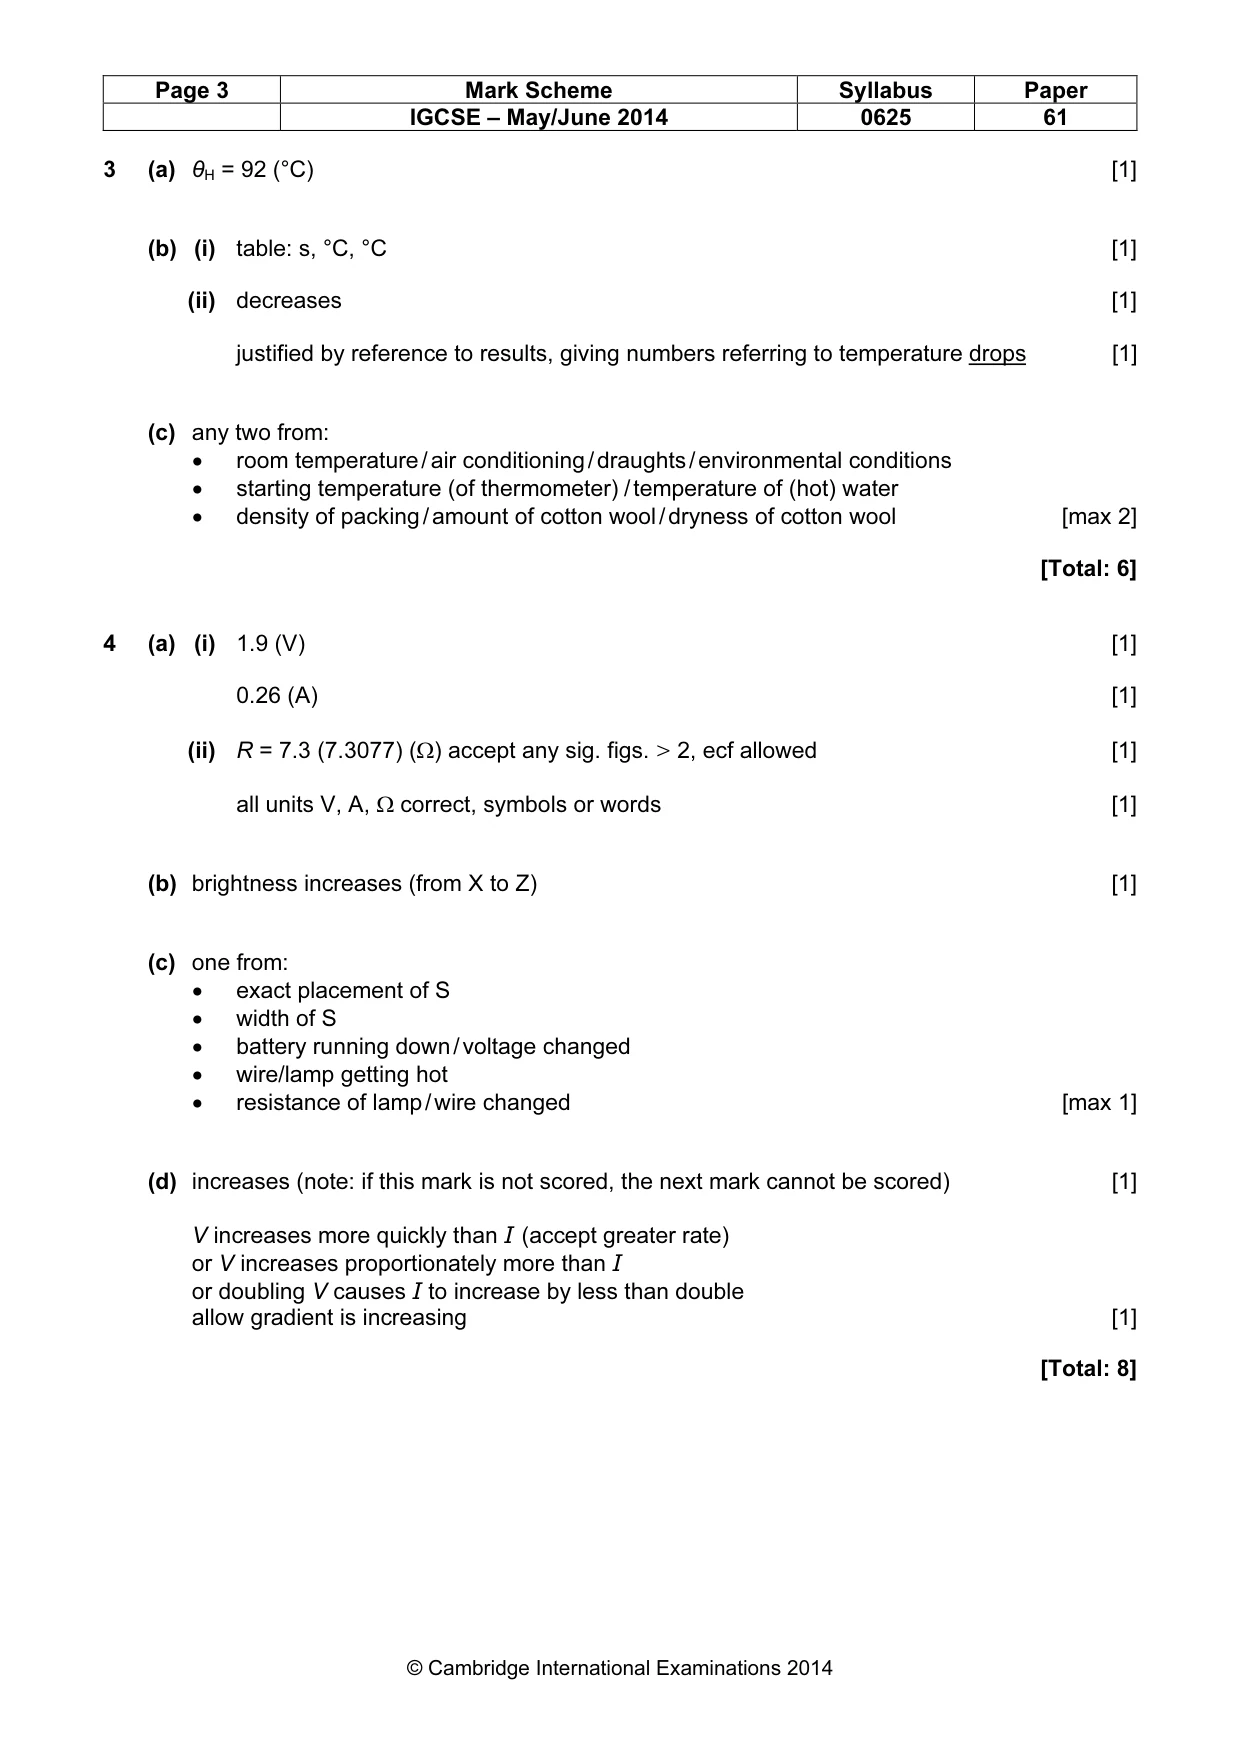
Mark scheme: 3 (a) θH = 92 (°C) [1] (b) (i) table: s, °C, °C [1] (ii) decreases [1] justified by reference to results, giving numbers referring to temperature drops [1] (c) any two from: • room temperature / air conditioning / draughts / environmental conditions • starting temperature (of thermometer) / temperature of (hot) water • density of packing / amount of cotton wool / dryness of cotton wool [max 2] [Total: 6]
Q4 · The IGCSE class is investigating the resistance of a lamp filament
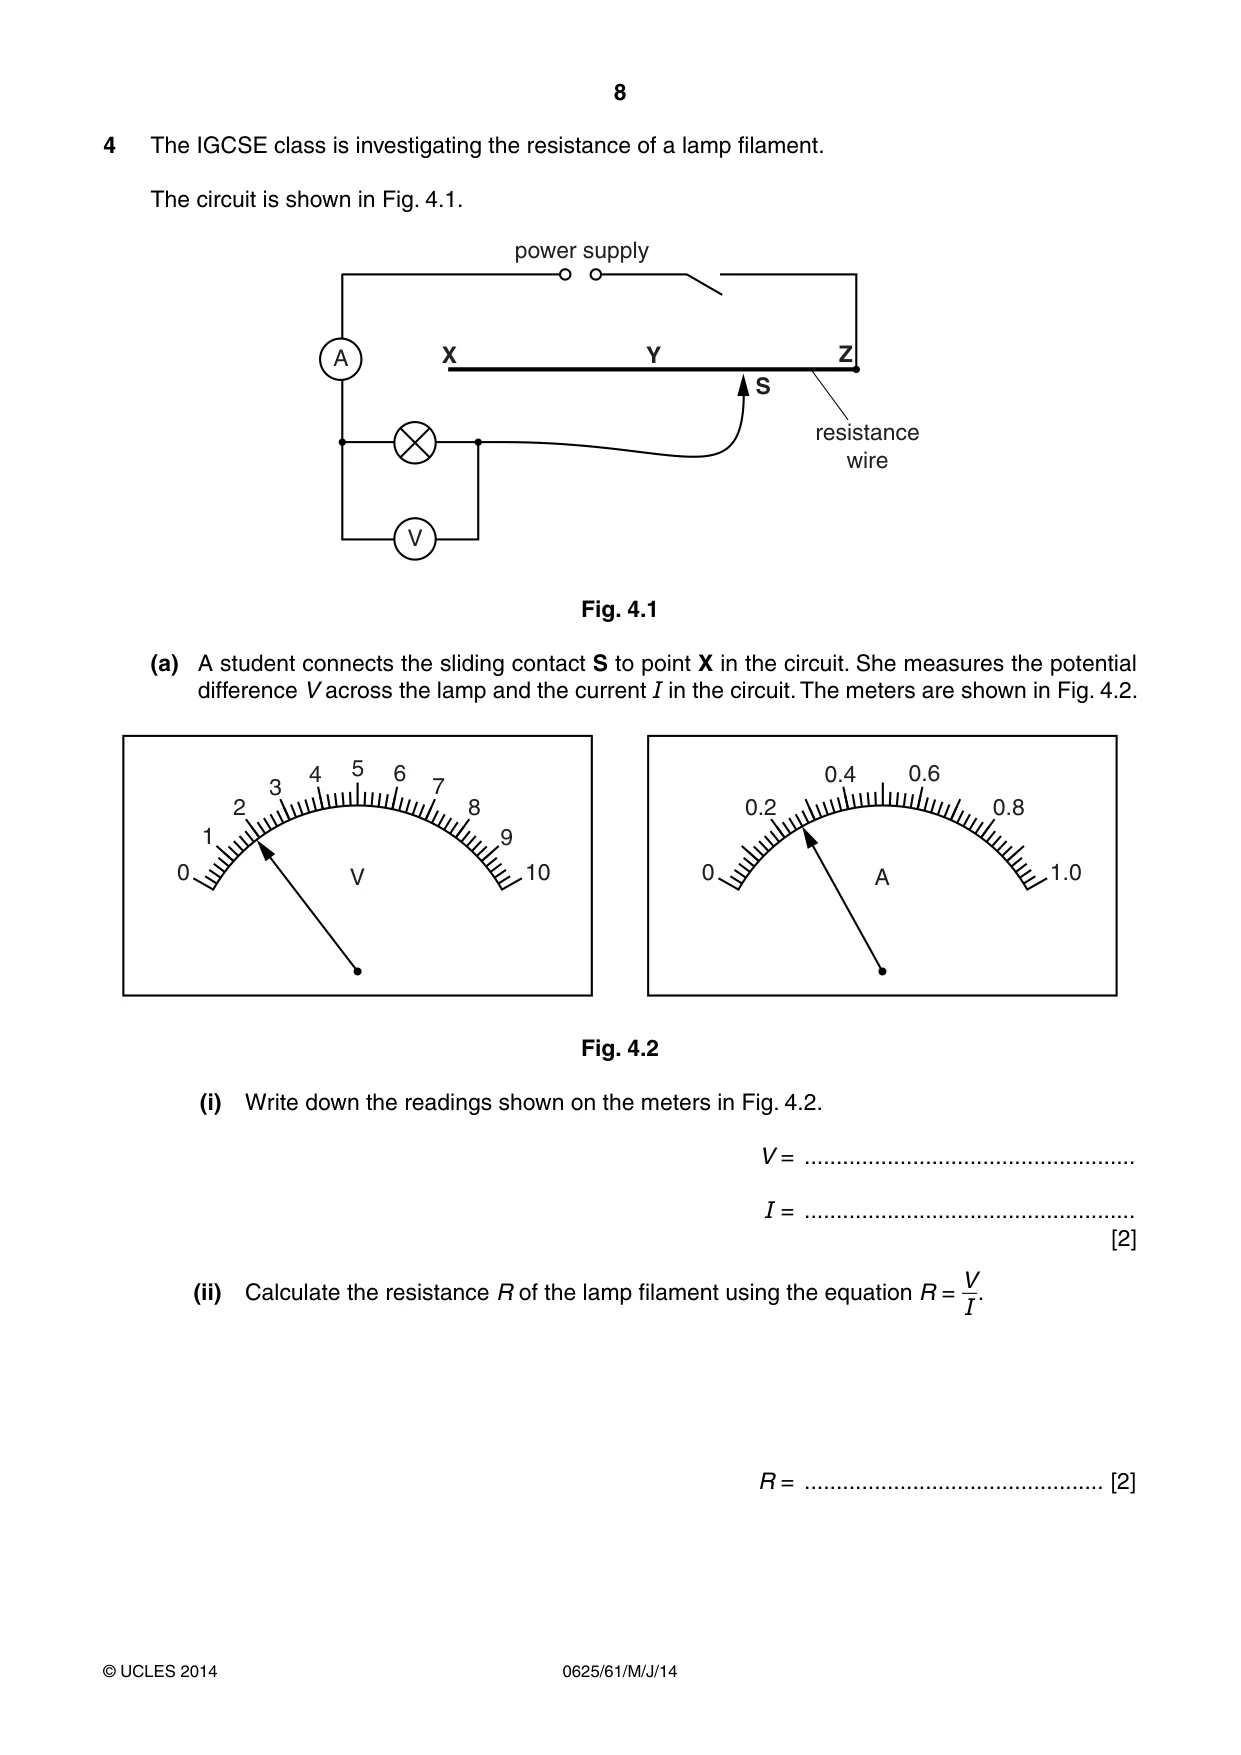
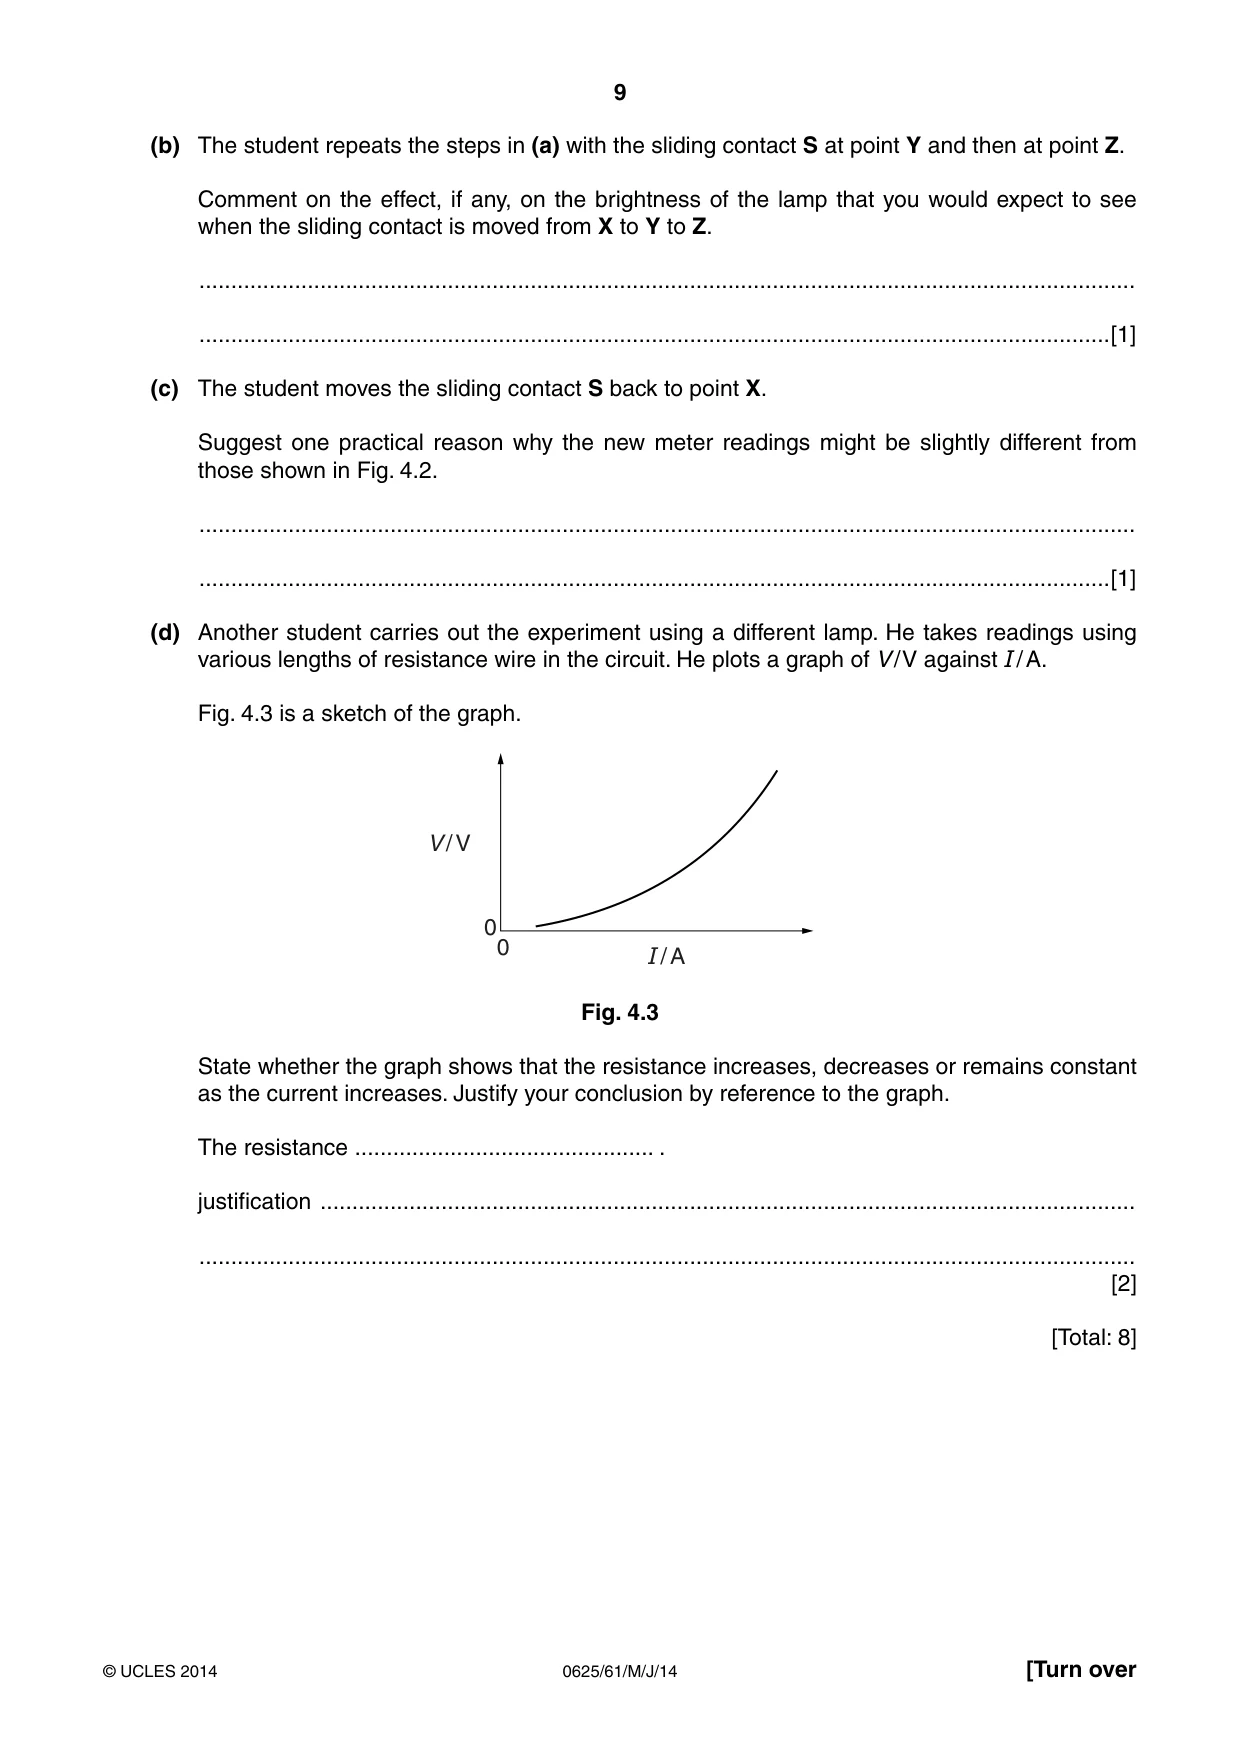
4 The IGCSE class is investigating the resistance of a lamp filament. The circuit is shown in Fig. 4.1. power supply A X Y Z S resistance wire V Fig. 4.1 (a) A student connects the sliding contact S to point X in the circuit. She measures the potential difference V across the lamp and the current I in the circuit. The meters are shown in Fig. 4.2. 4 5 6 0.4 0.6 3 7 2 8 0.2 0.8 1 9 0 V 10 0 A 1.0 Fig. 4.2 (i) Write down the readings shown on the meters in Fig. 4.2. V = .................................................... I = .................................................... [2] V (ii) Calculate the resistance R of the lamp filament using the equation R = I. R = ............................................... [2] (b) The student repeats the steps in (a) with the sliding contact S at point Y and then at point Z. Comment on the effect, if any, on the brightness of the lamp that you would expect to see when the sliding contact is moved from X to Y to Z. ................................................................................................................................................... ...............................................................................................................................................[1] (c) The student moves the sliding contact S back to point X. Suggest one practical reason why the new meter readings might be slightly different from those shown in Fig. 4.2. ................................................................................................................................................... ...............................................................................................................................................[1] (d) Another student carries out the experiment using a different lamp. He takes readings using various lengths of resistance wire in the circuit. He plots a graph of V / V against I / A. Fig. 4.3 is a sketch of the graph. V / V 0 0 I / A Fig. 4.3 State whether the graph shows that the resistance increases, decreases or remains constant as the current increases. Justify your conclusion by reference to the graph. The resistance ............................................... . justification ................................................................................................................................ ................................................................................................................................................... [2] [Total: 8]
Mark scheme: 4 (a) (i) 1.9 (V) [1] 0.26 (A) [1] (ii) R = 7.3 (7.3077) (Ω) accept any sig. figs. > 2, ecf allowed [1] all units V, A, Ω correct, symbols or words [1] (b) brightness increases (from X to Z) [1] (c) one from: • exact placement of S • width of S • battery running down / voltage changed • wire/lamp getting hot • resistance of lamp / wire changed [max 1] (d) increases (note: if this mark is not scored, the next mark cannot be scored) [1] V increases more quickly than I (accept greater rate) or V increases proportionately more than I or doubling V causes I to increase by less than double allow gradient is increasing [1] [Total: 8] IGCSE – May/June 2014 0625 61
Q5 · The IGCSE class is investigating reflection using a plane mirror
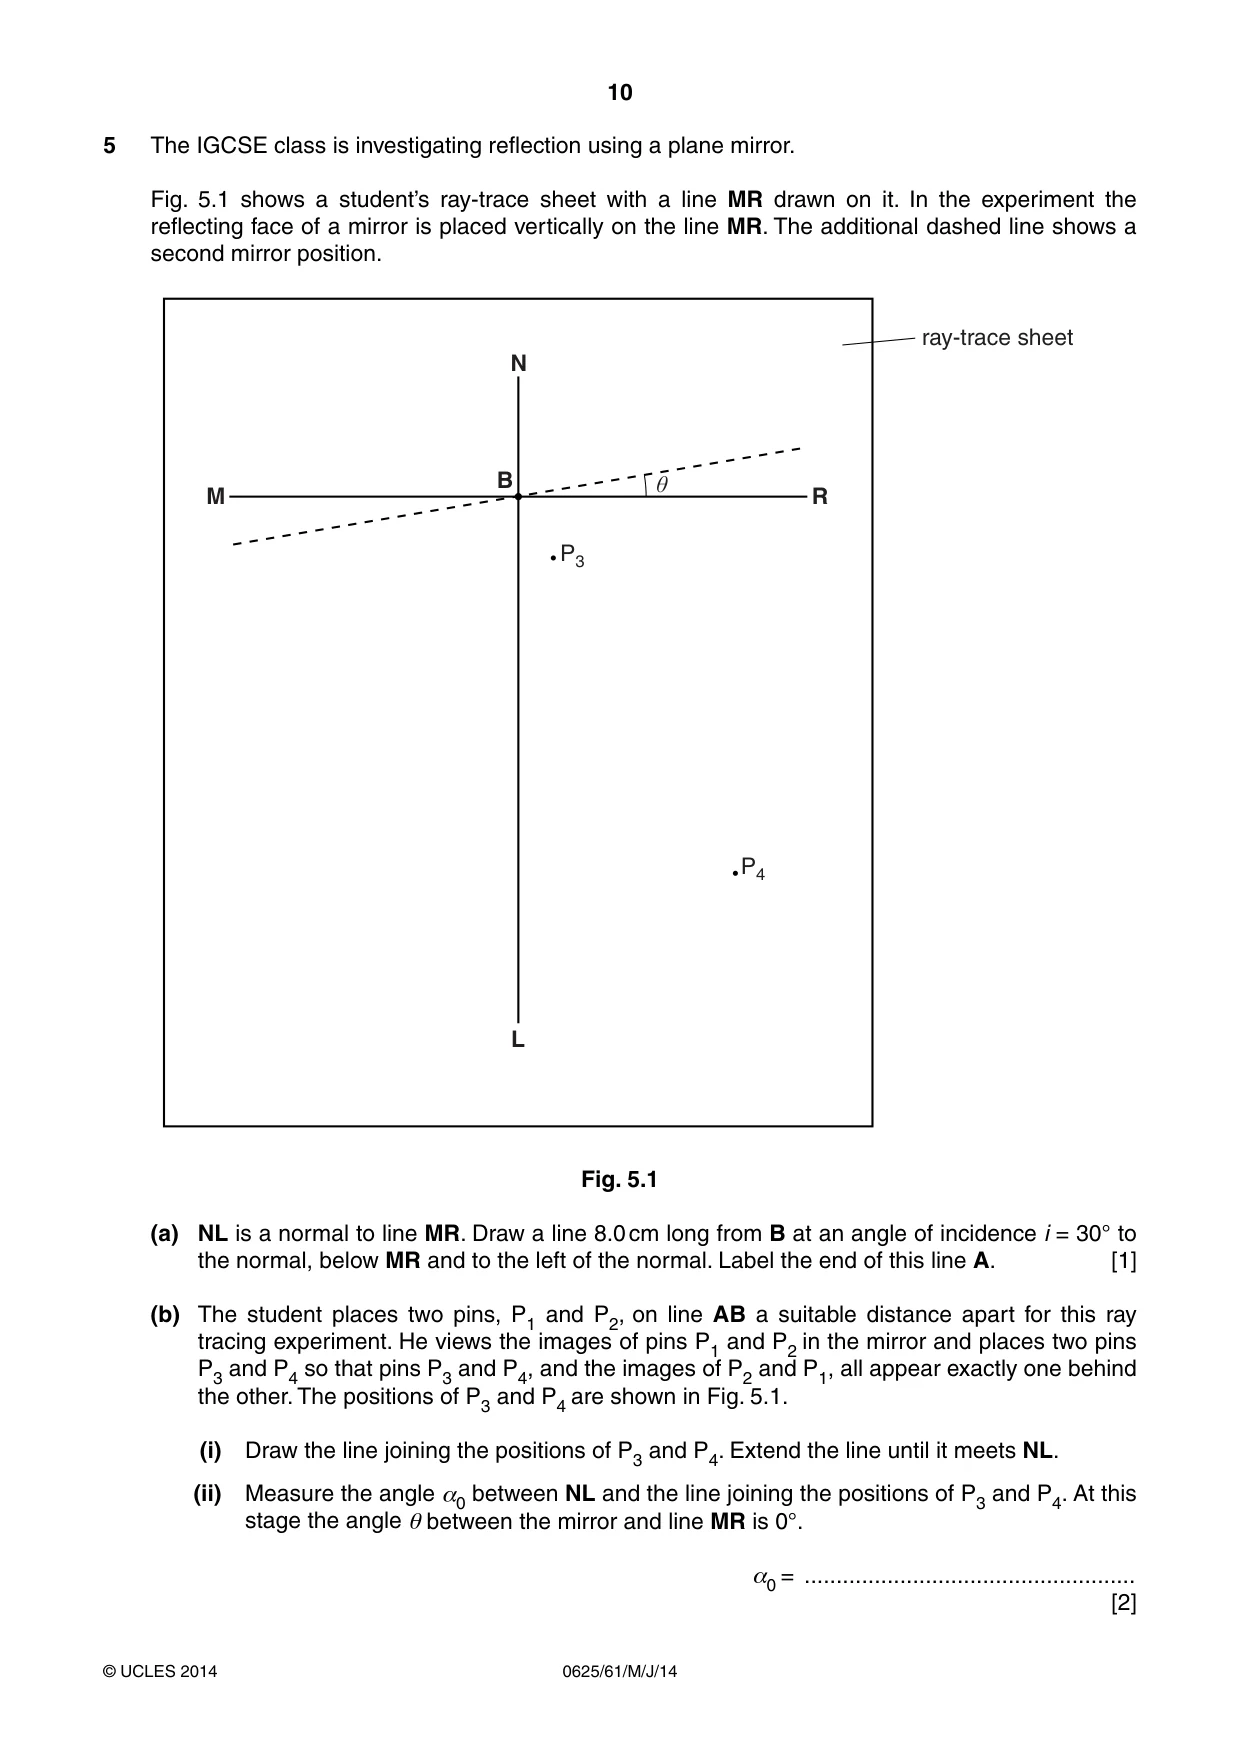
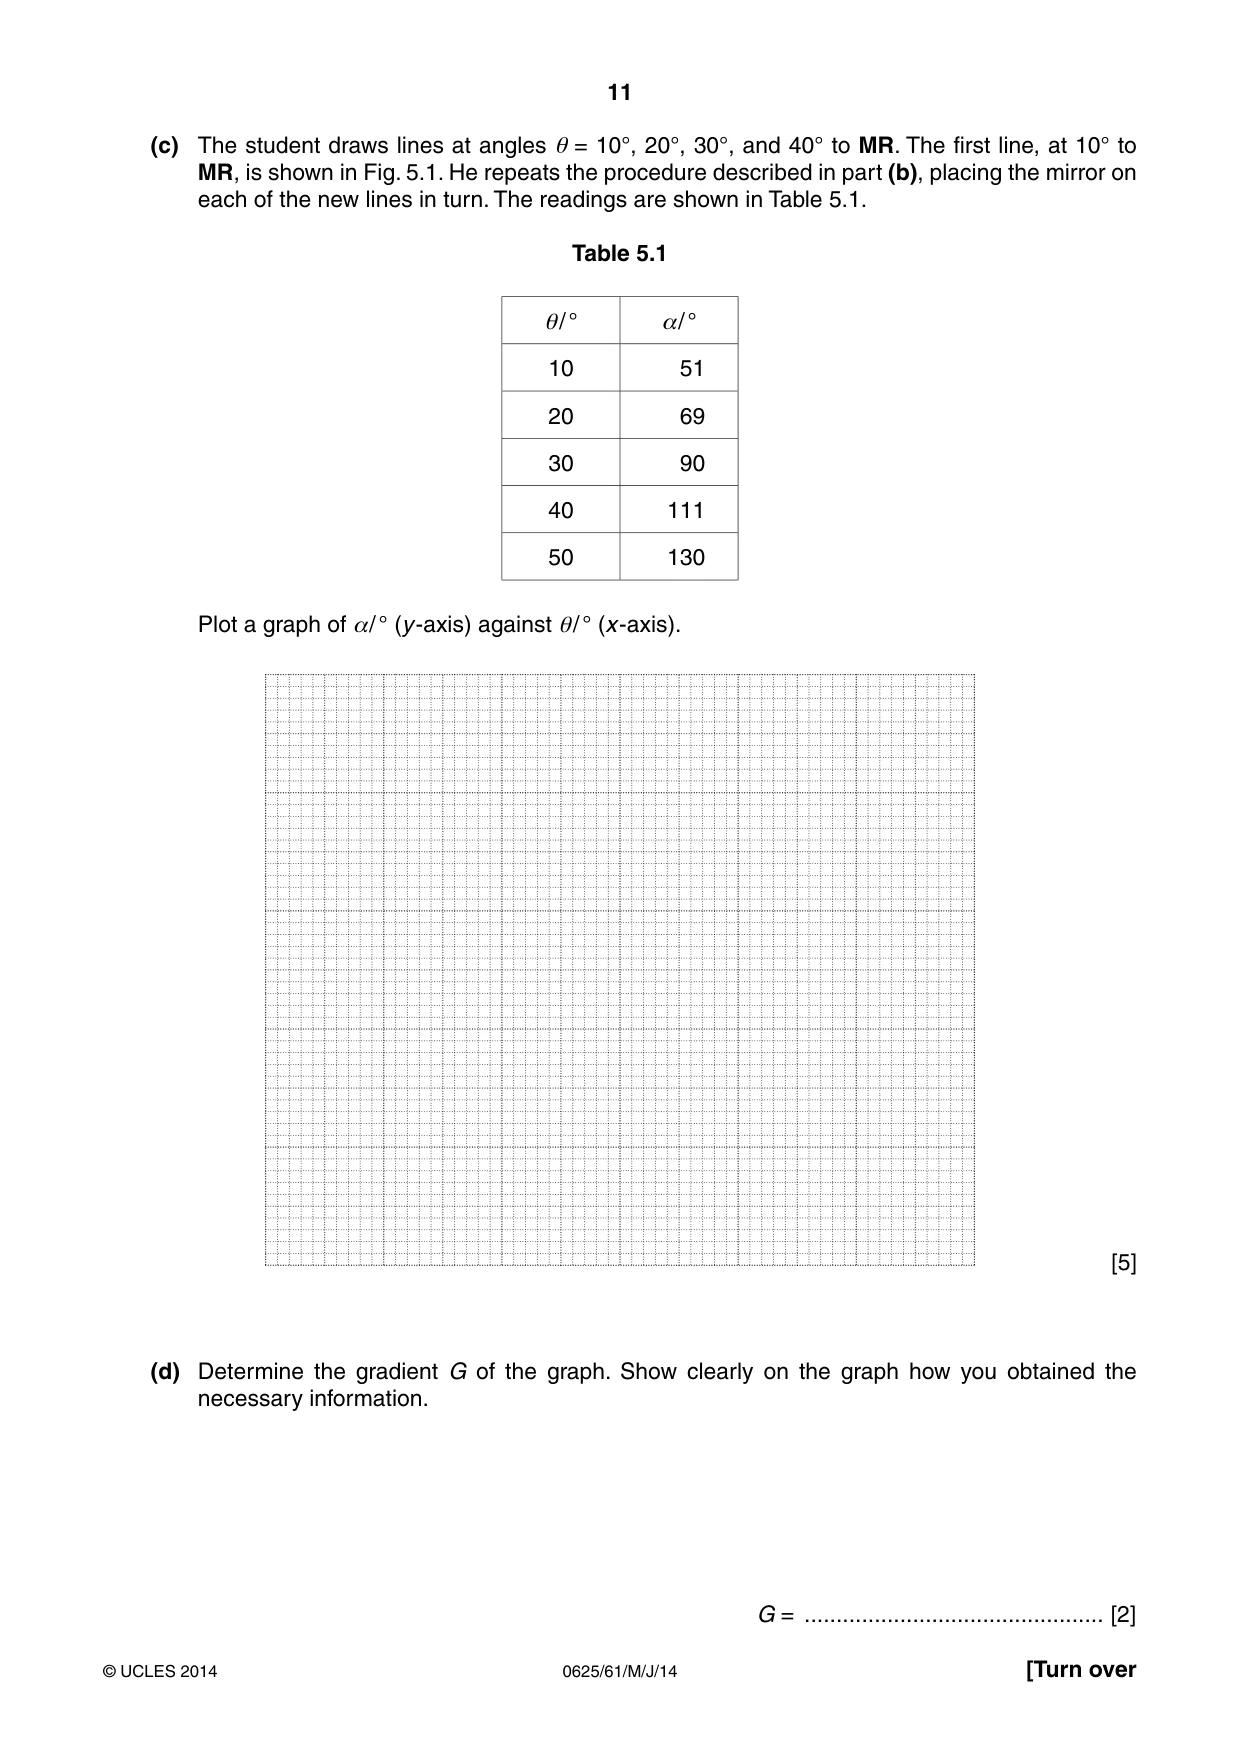
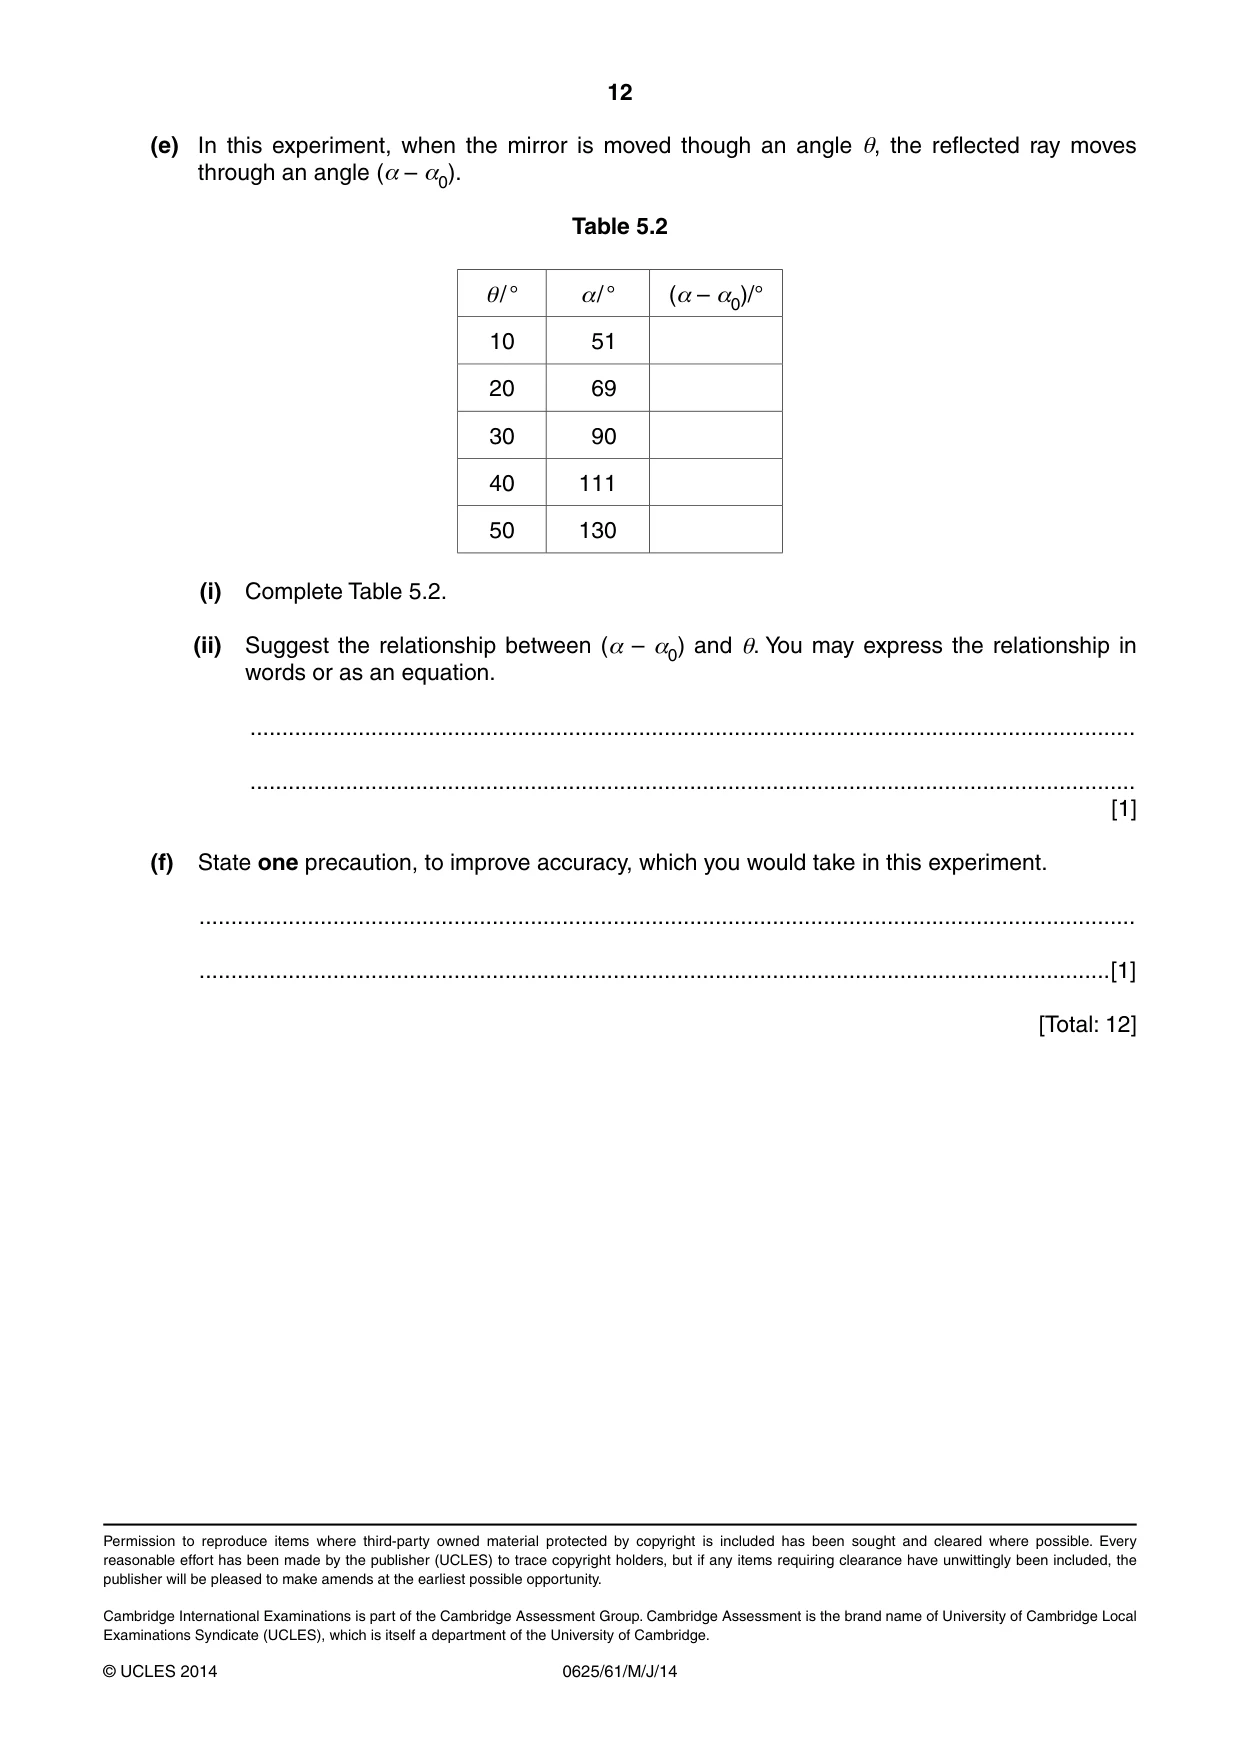
5 The IGCSE class is investigating reflection using a plane mirror. Fig. 5.1 shows a student’s ray-trace sheet with a line MR drawn on it. In the experiment the reflecting face of a mirror is placed vertically on the line MR. The additional dashed line shows a second mirror position. ray-trace sheet N B ș M R P3 P4 L Fig. 5.1 (a) NL is a normal to line MR. Draw a line 8.0 cm long from B at an angle of incidence i = 30° to the normal, below MR and to the left of the normal. Label the end of this line A. [1] (b) The student places two pins, P1 and P2, on line AB a suitable distance apart for this ray tracing experiment. He views the images of pins P1 and P2 in the mirror and places two pins P3 and P4 so that pins P3 and P4, and the images of P2 and P1, all appear exactly one behind the other. The positions of P3 and P4 are shown in Fig. 5.1. (i) Draw the line joining the positions of P3 and P4. Extend the line until it meets NL. (ii) Measure the angle α0 between NL and the line joining the positions of P3 and P4. At this stage the angle θ between the mirror and line MR is 0°. α0 = .................................................... [2] (c) The student draws lines at angles θ = 10°, 20°, 30°, and 40° to MR. The first line, at 10° to MR, is shown in Fig. 5.1. He repeats the procedure described in part (b), placing the mirror on each of the new lines in turn. The readings are shown in Table 5.1. Table 5.1 θ/ ° α/ ° 10 51 20 69 30 90 40 111 50 130 Plot a graph of α/ ° (y-axis) against θ/ ° (x-axis). [5] (d) Determine the gradient G of the graph. Show clearly on the graph how you obtained the necessary information. G = ............................................... [2] (e) In this experiment, when the mirror is moved though an angle θ, the reflected ray moves through an angle (α – α0). Table 5.2 θ/ ° α/ ° (α – α0)/° 10 51 20 69 30 90 40 111 50 130 (i) Complete Table 5.2. (ii) Suggest the relationship between (α – α0) and θ. You may express the relationship in words or as an equation. ........................................................................................................................................... ........................................................................................................................................... [1] (f) State one precaution, to improve accuracy, which you would take in this experiment. ................................................................................................................................................... ...............................................................................................................................................[1] [Total: 12]
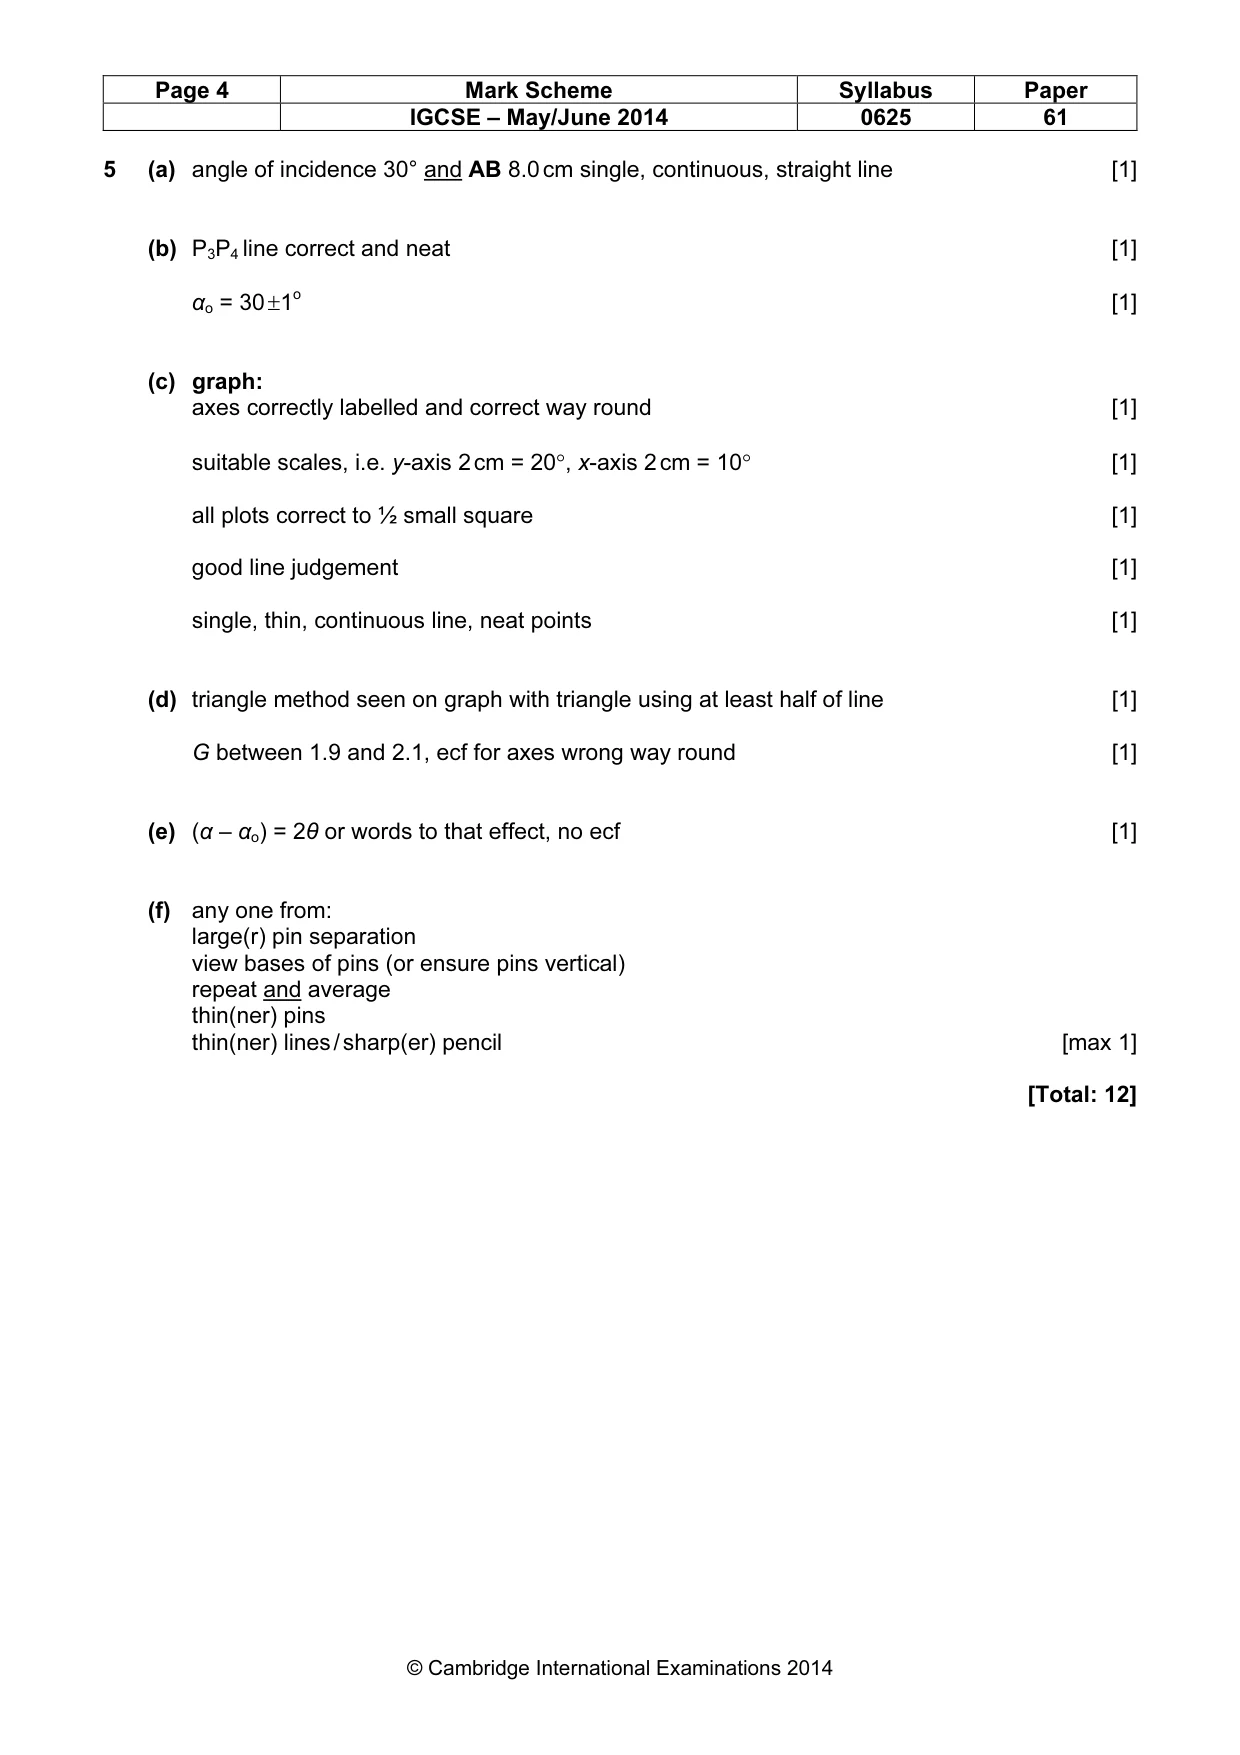
Mark scheme: 5 (a) angle of incidence 30° and AB 8.0 cm single, continuous, straight line [1] (b) P3P4 line correct and neat [1] αo = 30 ±1o [1] (c) graph: axes correctly labelled and correct way round [1] suitable scales, i.e. y-axis 2 cm = 20°, x-axis 2 cm = 10° [1] all plots correct to ½ small square [1] good line judgement [1] single, thin, continuous line, neat points [1] (d) triangle method seen on graph with triangle using at least half of line [1] G between 1.9 and 2.1, ecf for axes wrong way round [1] (e) (α – αo) = 2θ or words to that effect, no ecf [1] (f) any one from: large(r) pin separation view bases of pins (or ensure pins vertical) repeat and average thin(ner) pins thin(ner) lines / sharp(er) pencil [max 1] [Total: 12]
What was in this paper
The subtopics covered by these 5 questions, and how many questions each got. Open one in a new tab to see every Cambridge question on it.
What you needed in this session
Cambridge’s own grade thresholds for 2014 May/June, Paper 6 · Variant 1. A higher threshold means an easier paper — the bar moves with how the cohort did.