Cambridge IGCSE Physics 0625 — 2013 Oct/Nov Paper 6 · Variant 3
0625/63/O/N/13 · 5 questions · 40 marks · ≈45 min
The question paper and its mark scheme, free to read here and free to download. This is Cambridge’s own paper, exactly as it was sat.
Question paper16 pages

Mark scheme4 pages
Answers below. Sit the paper first if you are practising.
Questions as text
Q1 · An IGCSE student is measuring the capacity of a drinks cup by three methods
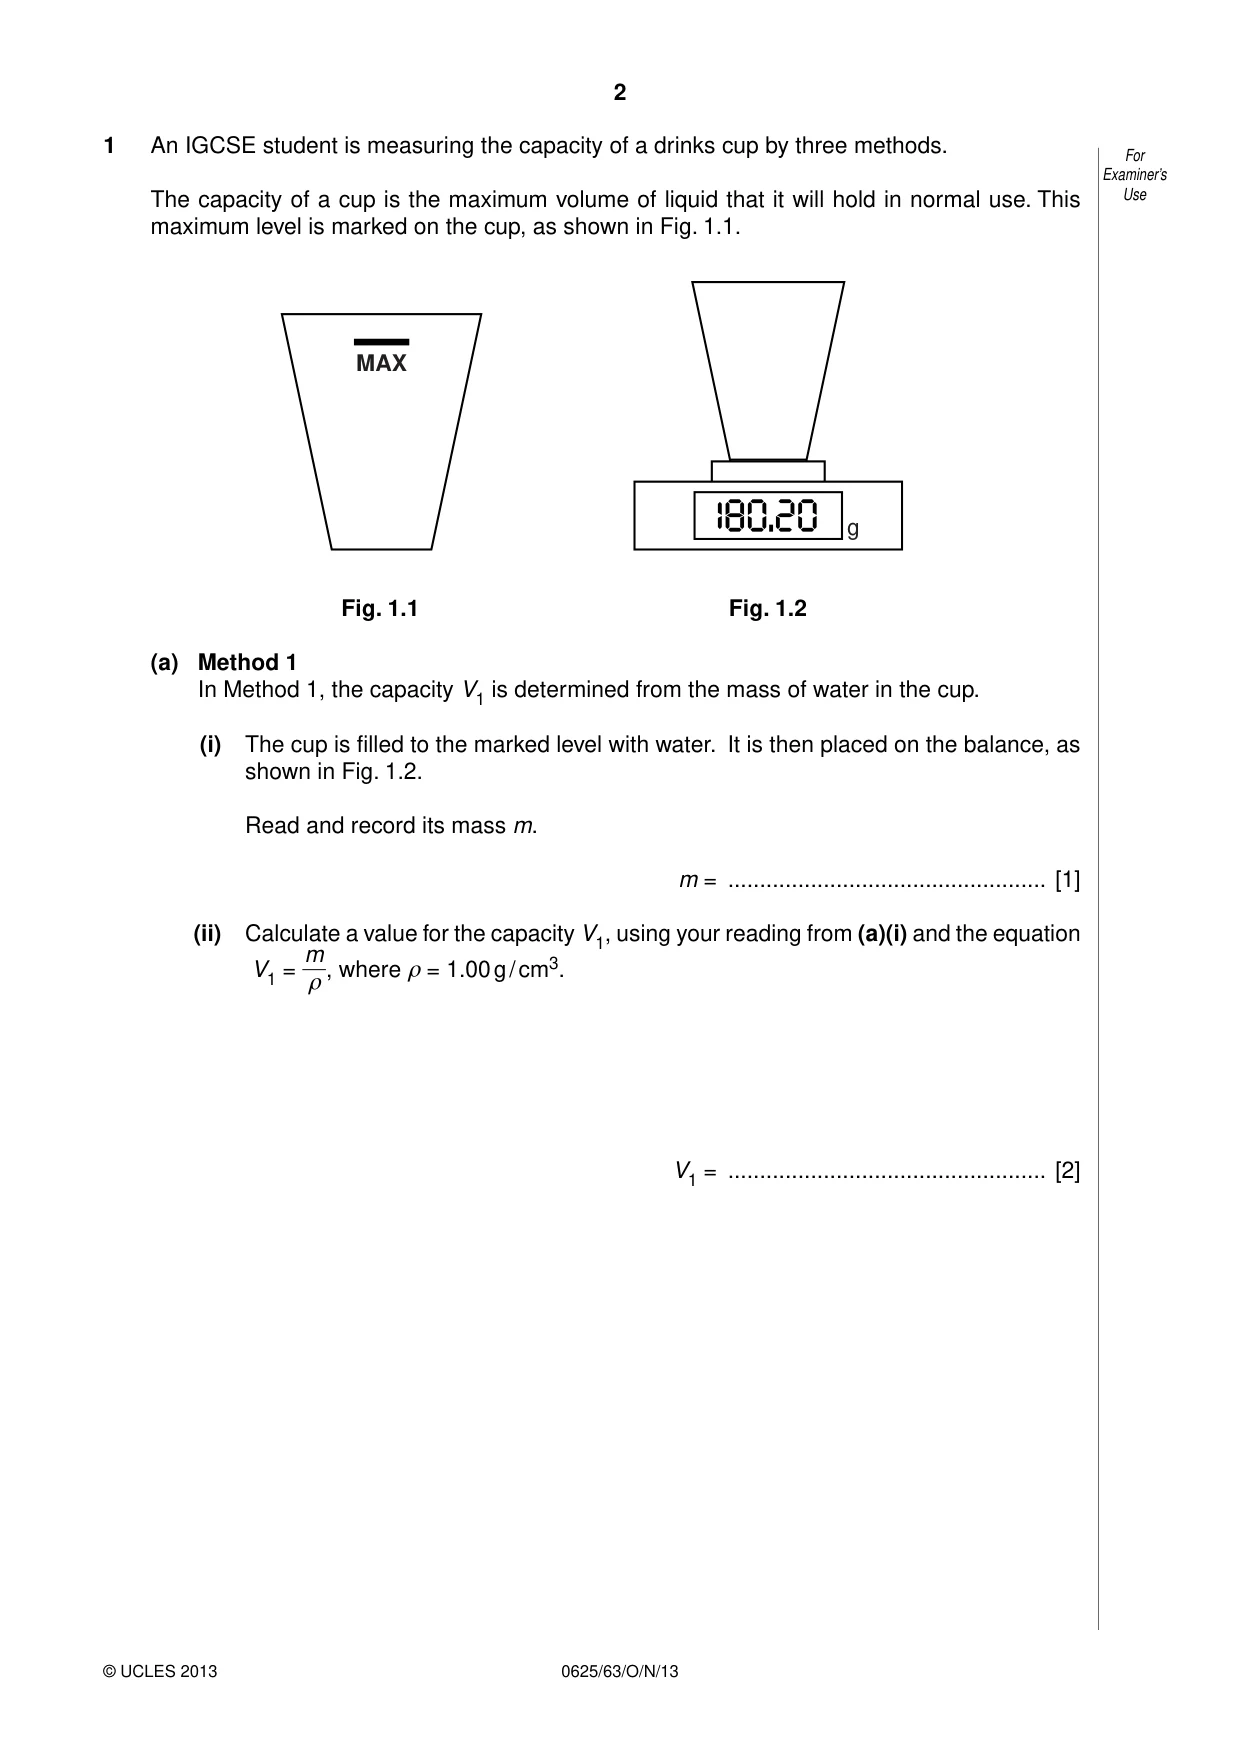
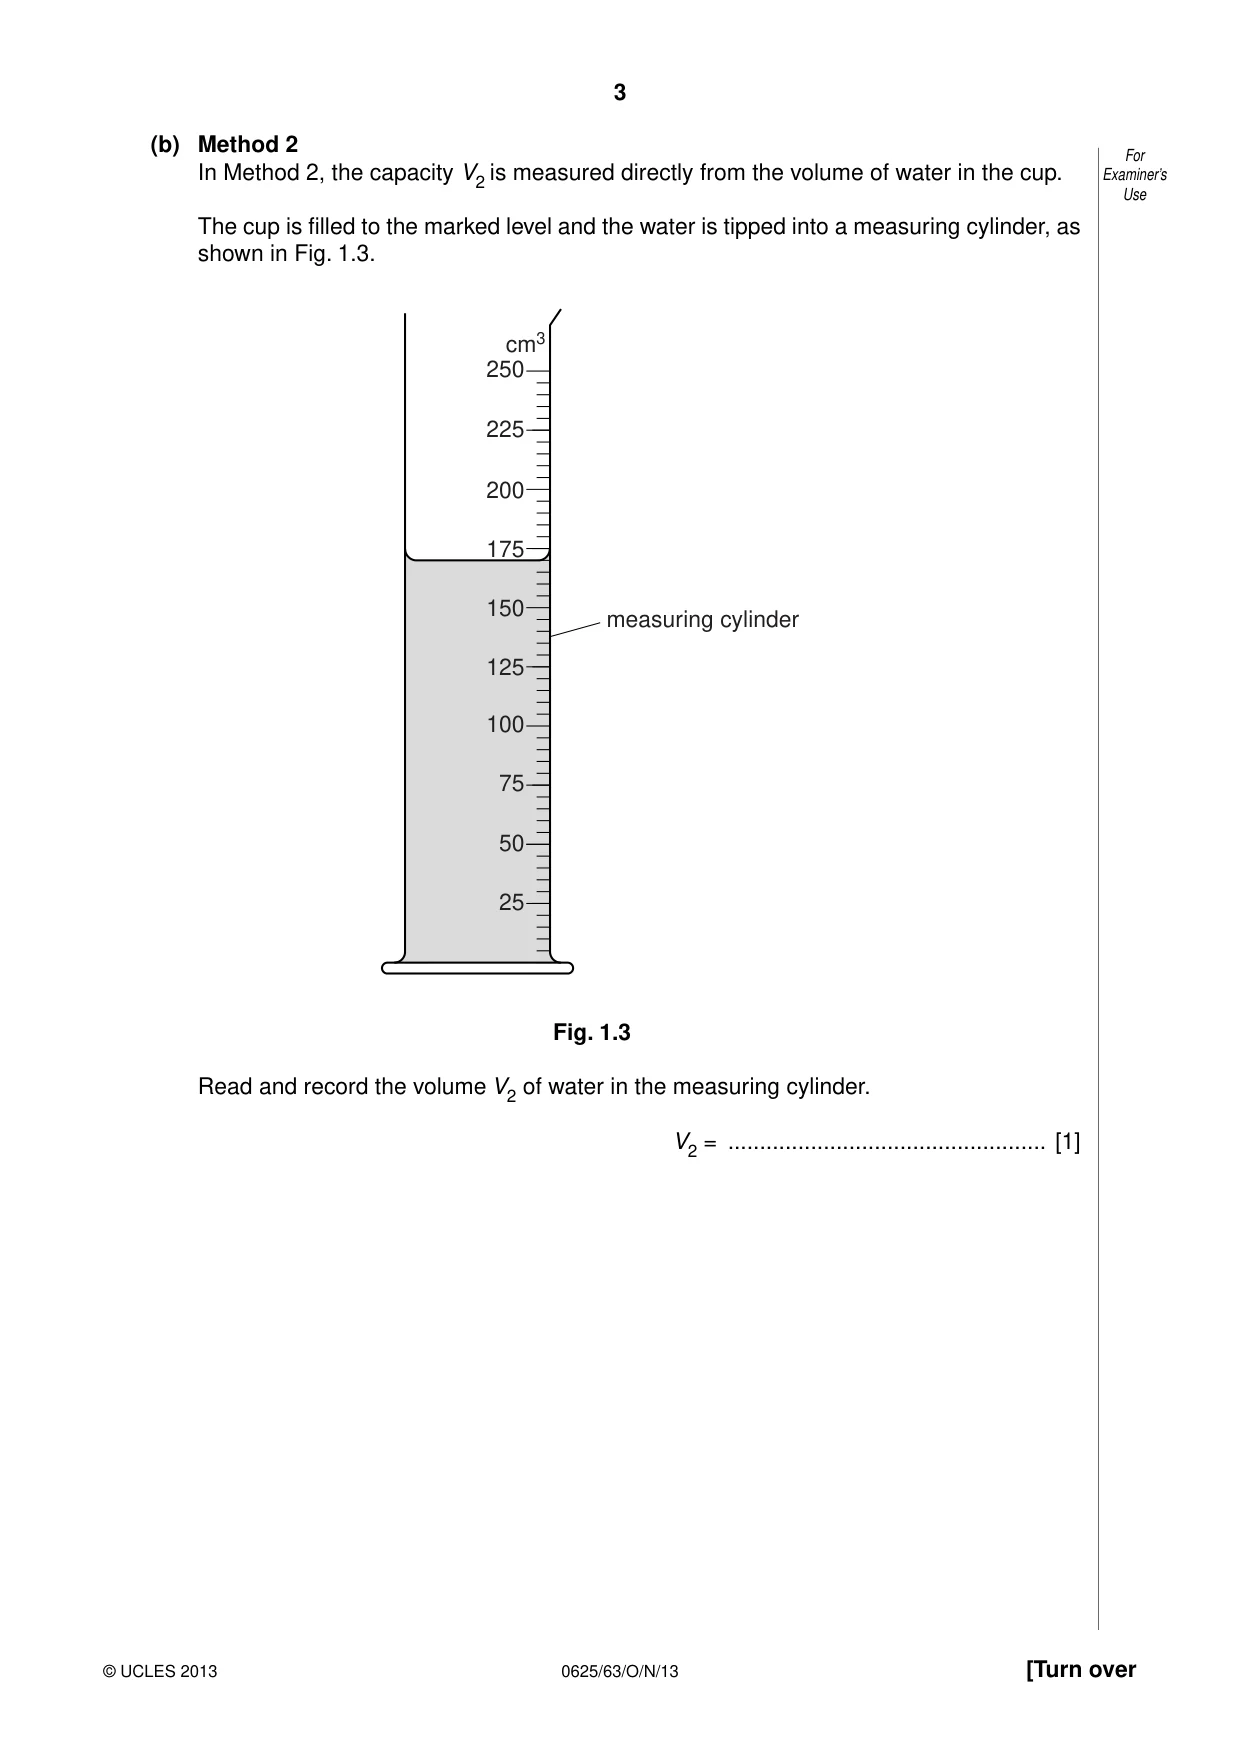
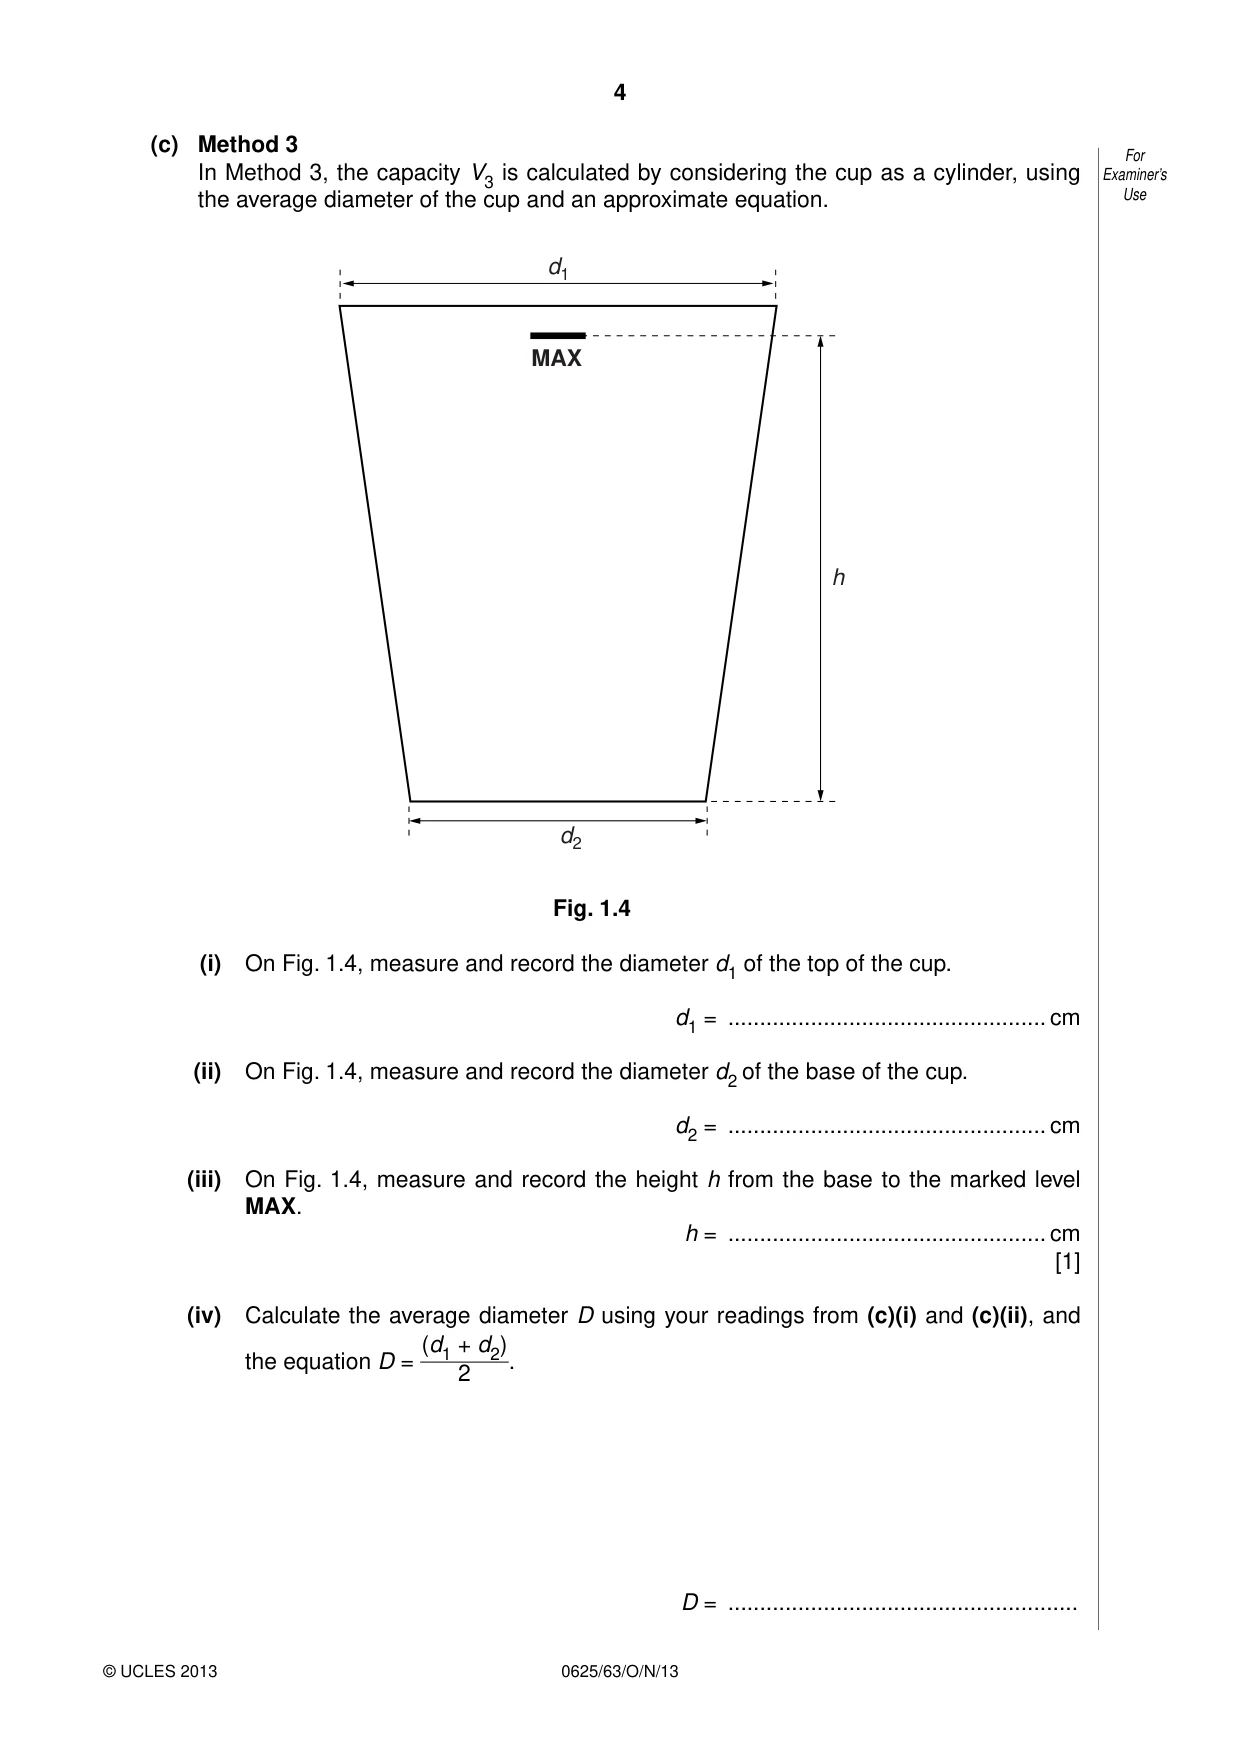
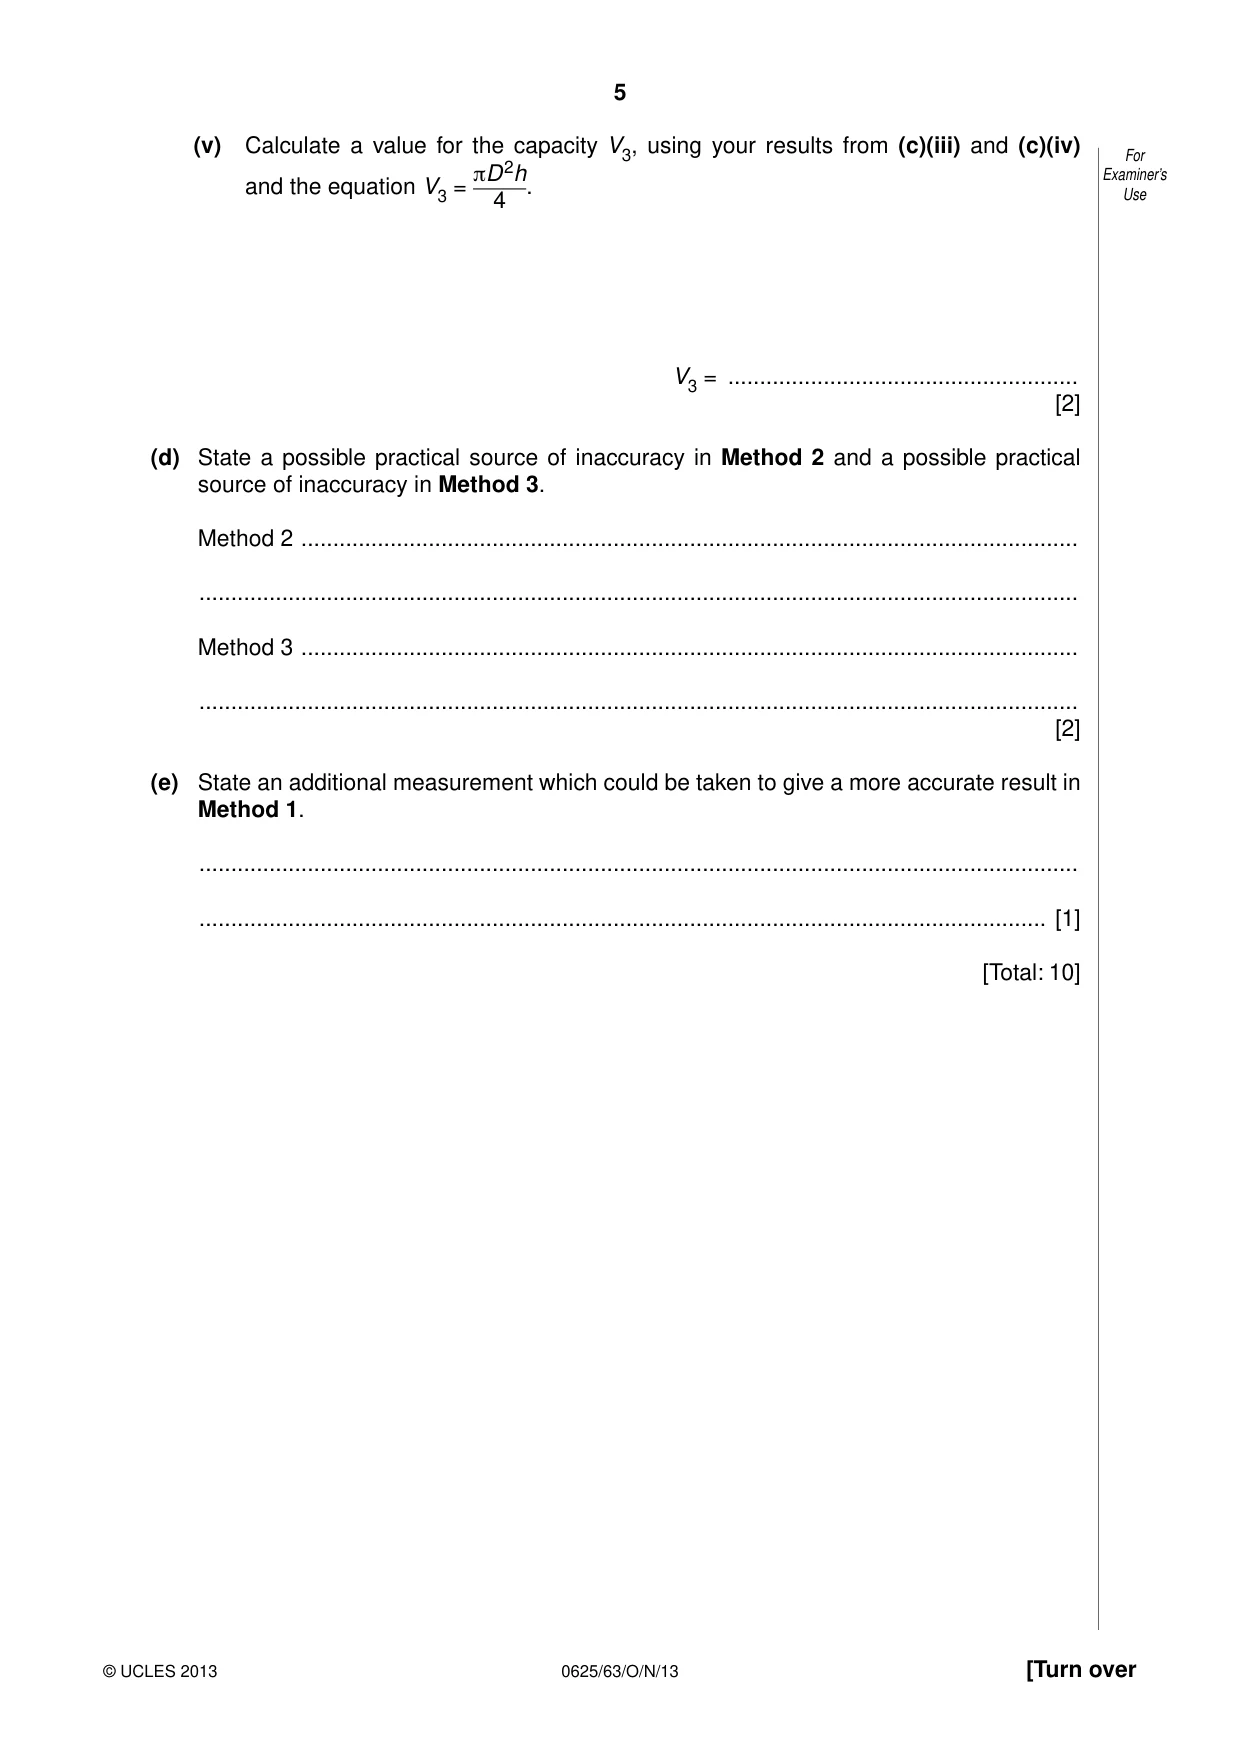
1 An IGCSE student is measuring the capacity of a drinks cup by three methods. For Examiner’s The capacity of a cup is the maximum volume of liquid that it will hold in normal use. This Use maximum level is marked on the cup, as shown in Fig. 1.1. MAX g Fig. 1.1 Fig. 1.2 (a) Method 1 In Method 1, the capacity V1 is determined from the mass of water in the cup. (i) The cup is filled to the marked level with water. It is then placed on the balance, as shown in Fig. 1.2. Read and record its mass m. m = .................................................. [1] (ii) Calculate a value for the capacity V1, using your reading from (a)(i) and the equation m V1 = , where ρ = 1.00 g / cm3. ρ V1 = .................................................. [2] (b) Method 2 For Examiner’s In Method 2, the capacity V2 is measured directly from the volume of water in the cup. Use The cup is filled to the marked level and the water is tipped into a measuring cylinder, as shown in Fig. 1.3. cm3 250 225 200 175 150 measuring cylinder 125 100 75 50 25 Fig. 1.3 Read and record the volume V2 of water in the measuring cylinder. V2 = .................................................. [1] (c) Method 3 For Examiner’s In Method 3, the capacity V3 is calculated by considering the cup as a cylinder, using the average diameter of the cup and an approximate equation. Use d1 MAX h d2 Fig. 1.4 (i) On Fig. 1.4, measure and record the diameter d1 of the top of the cup. d1 = .................................................. cm (ii) On Fig. 1.4, measure and record the diameter d2 of the base of the cup. d2 = .................................................. cm (iii) On Fig. 1.4, measure and record the height h from the base to the marked level MAX. h = .................................................. cm [1] (iv) Calculate the average diameter D using your readings from (c)(i) and (c)(ii), and (d1 + d2) the equation D = . 2 D = ....................................................... (v) Calculate a value for the capacity V3, using your results from (c)(iii) and (c)(iv) For πD2h Examiner’s and the equation V3 = . Use 4 V3 = ....................................................... [2] (d) State a possible practical source of inaccuracy in Method 2 and a possible practical source of inaccuracy in Method 3. Method 2 .......................................................................................................................... .......................................................................................................................................... Method 3 .......................................................................................................................... .......................................................................................................................................... [2] (e) State an additional measurement which could be taken to give a more accurate result in Method 1. .......................................................................................................................................... ..................................................................................................................................... [1] [Total: 10]
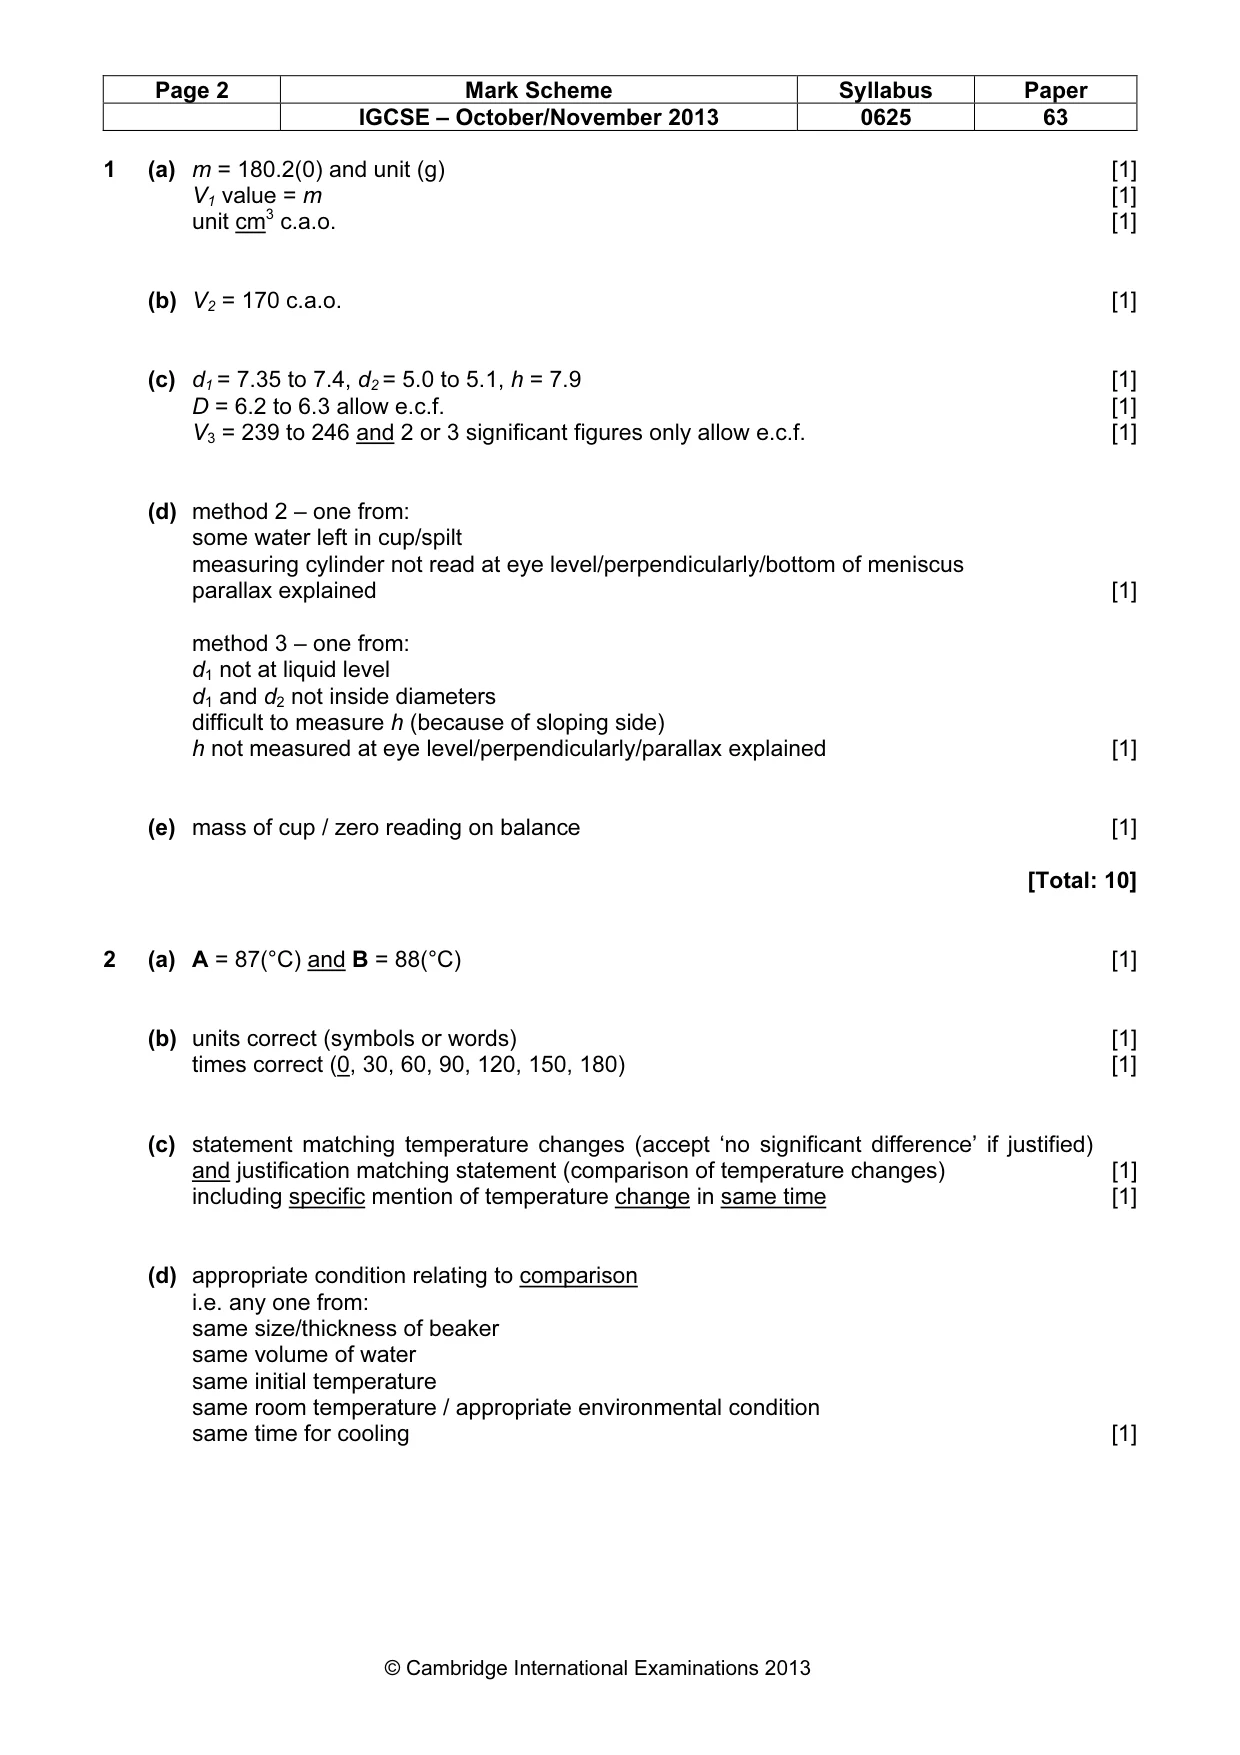
Mark scheme: 1 (a) m = 180.2(0) and unit (g) [1] V1 value = m [1] unit cm3 c.a.o. [1] (b) V2 = 170 c.a.o. [1] (c) d1 = 7.35 to 7.4, d2 = 5.0 to 5.1, h = 7.9 [1] D = 6.2 to 6.3 allow e.c.f. [1] V3 = 239 to 246 and 2 or 3 significant figures only allow e.c.f. [1] (d) method 2 – one from: some water left in cup/spilt measuring cylinder not read at eye level/perpendicularly/bottom of meniscus parallax explained [1] method 3 – one from: d1 not at liquid level d1 and d2 not inside diameters difficult to measure h (because of sloping side) h not measured at eye level/perpendicularly/parallax explained [1] (e) mass of cup / zero reading on balance [1] [Total: 10]
More questions on Physical quantities and measurement techniques
Q2 · An IGCSE student is investigating methods of preventing loss of thermal energy
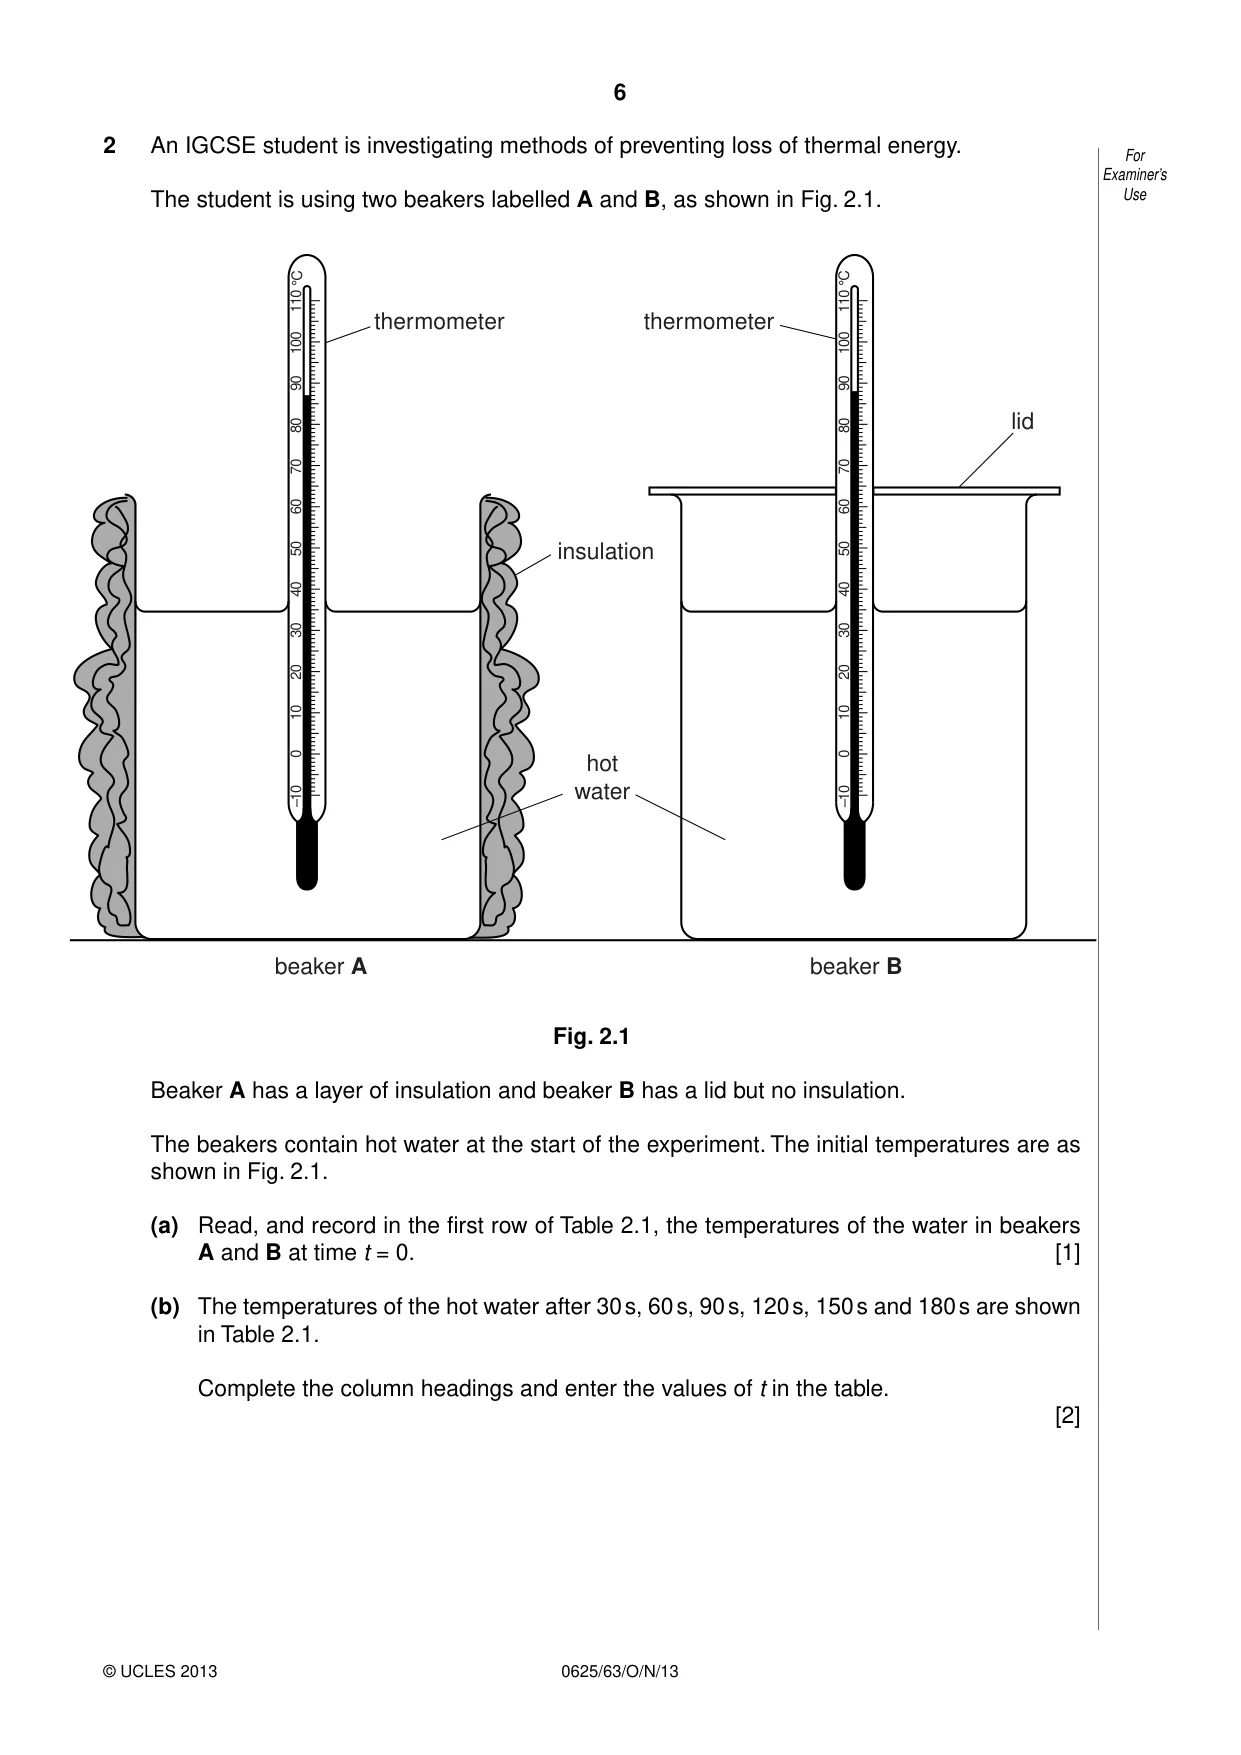
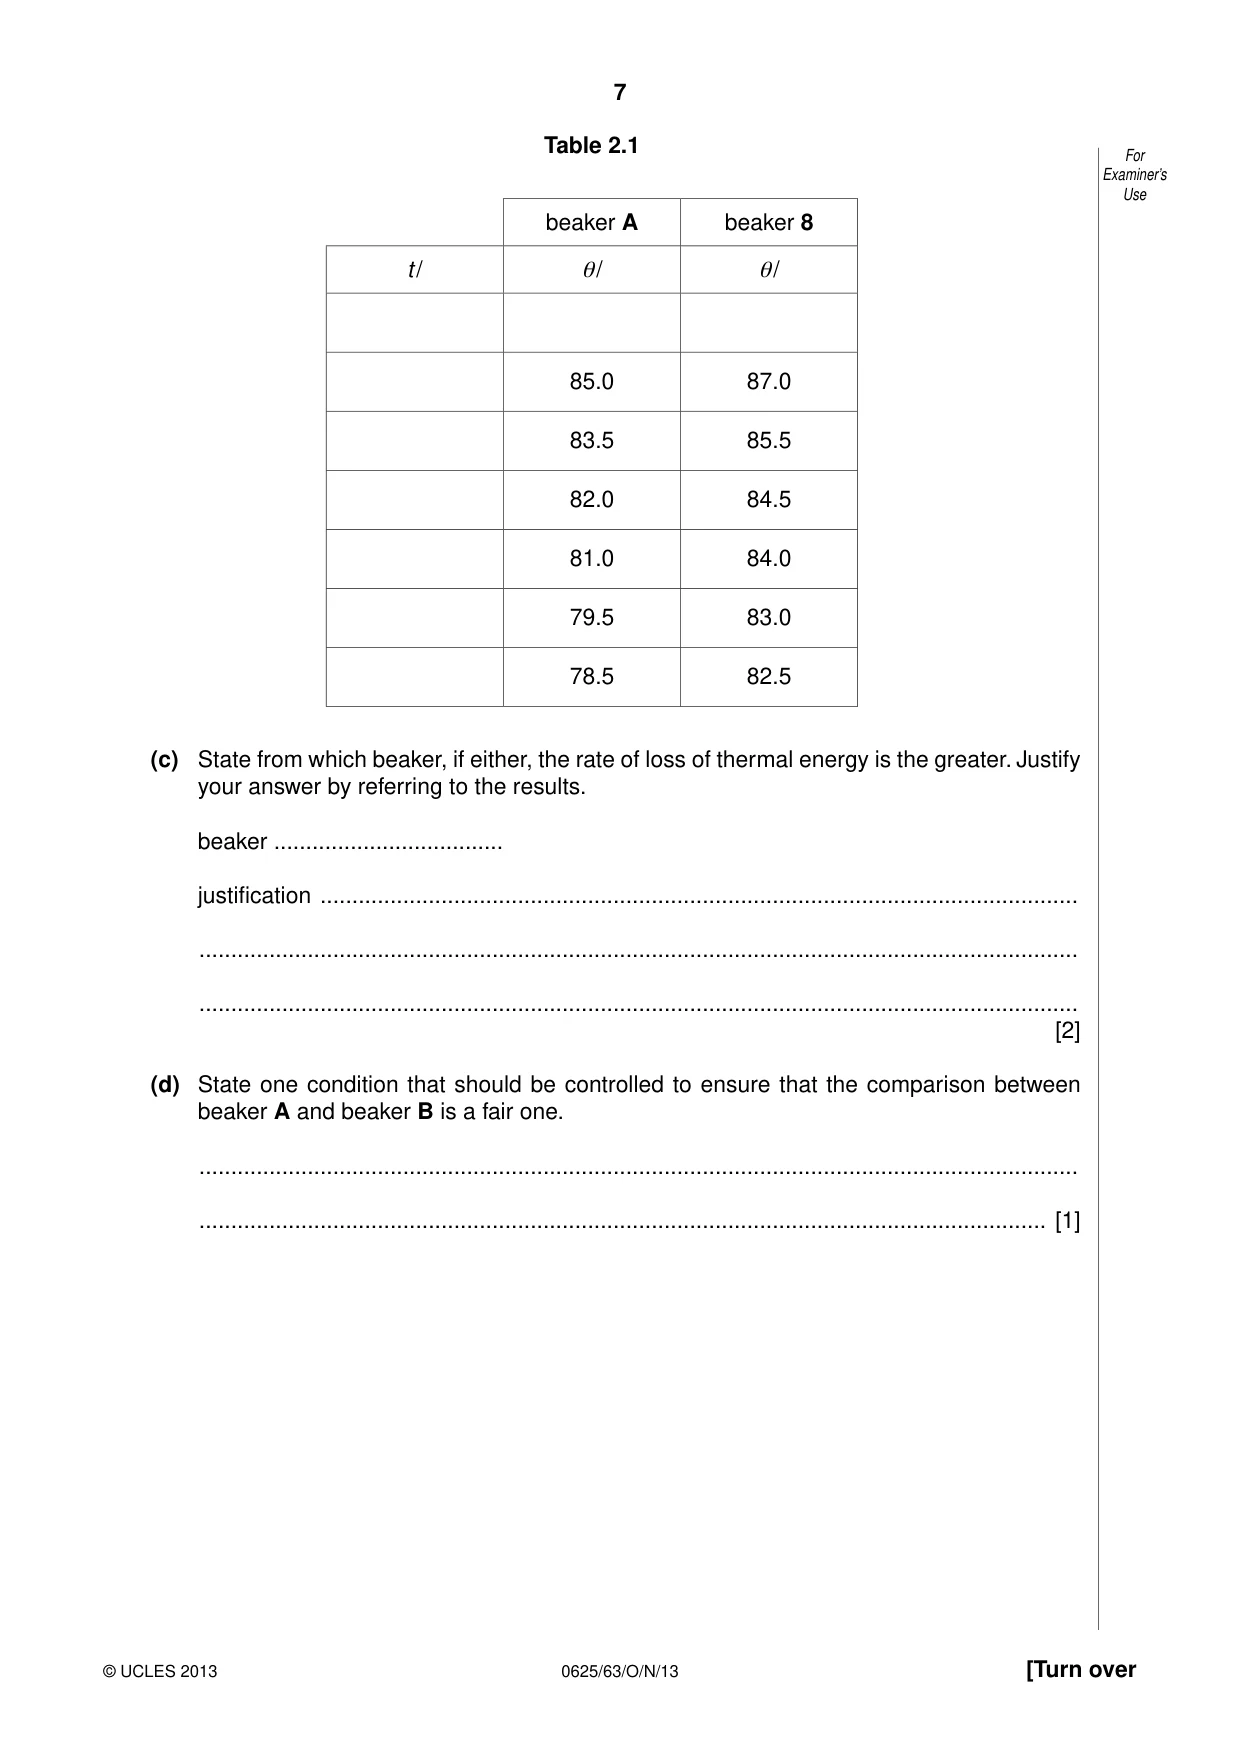
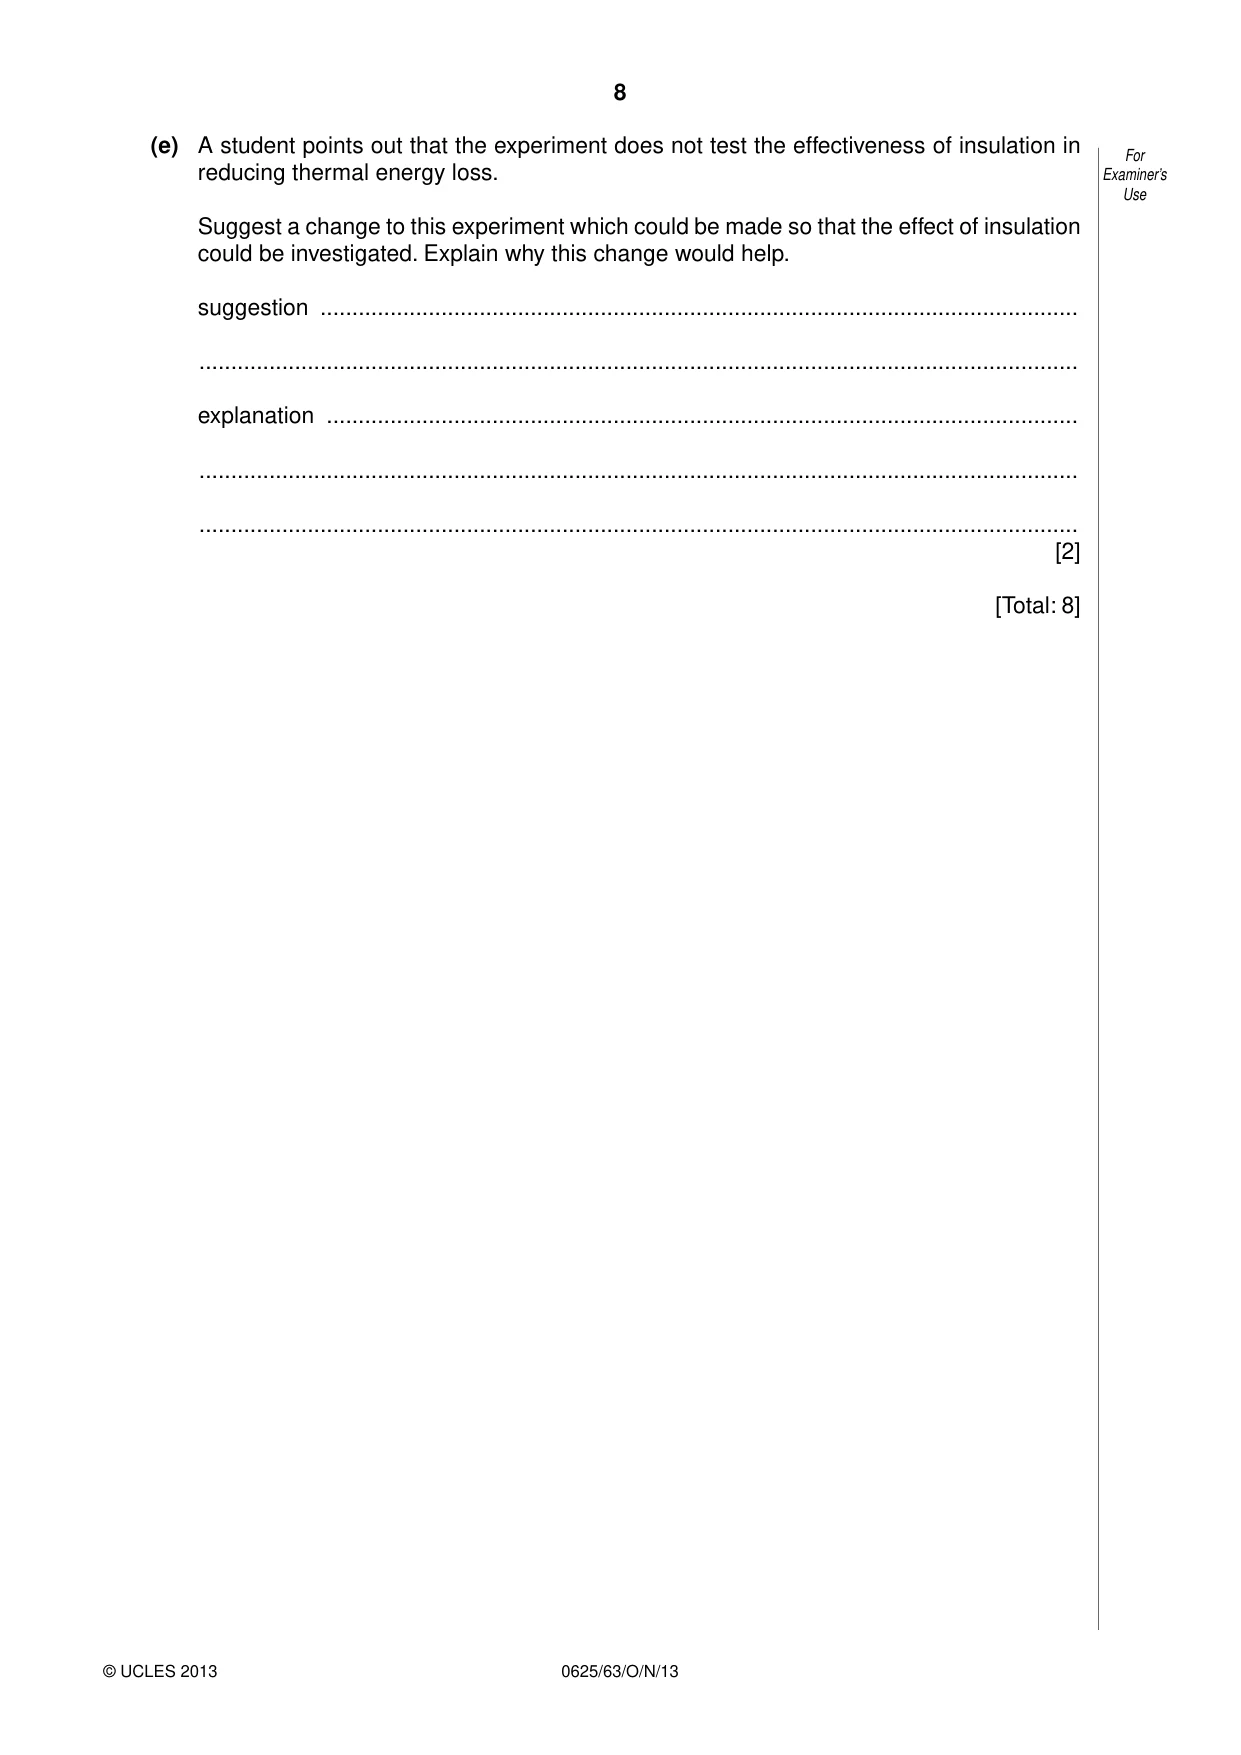
2 An IGCSE student is investigating methods of preventing loss of thermal energy. For Examiner’s The student is using two beakers labelled A and B, as shown in Fig. 2.1. Use °C °C 110 110 thermometer thermometer 100 100 90 90 80 80 lid 70 70 60 60 50 insulation 50 40 40 30 30 20 20 10 10 0 hot 0 –10 water –10 beaker A beaker B Fig. 2.1 Beaker A has a layer of insulation and beaker B has a lid but no insulation. The beakers contain hot water at the start of the experiment. The initial temperatures are as shown in Fig. 2.1. (a) Read, and record in the first row of Table 2.1, the temperatures of the water in beakers A and B at time t = 0. [1] (b) The temperatures of the hot water after 30 s, 60 s, 90 s, 120 s, 150 s and 180 s are shown in Table 2.1. Complete the column headings and enter the values of t in the table. [2] Table 2.1 For Examiner’s Use beaker A beaker 8 t / θ/ θ/ 85.0 87.0 83.5 85.5 82.0 84.5 81.0 84.0 79.5 83.0 78.5 82.5 (c) State from which beaker, if either, the rate of loss of thermal energy is the greater. Justify your answer by referring to the results. beaker .................................... justification ....................................................................................................................... .......................................................................................................................................... .......................................................................................................................................... [2] (d) State one condition that should be controlled to ensure that the comparison between beaker A and beaker B is a fair one. .......................................................................................................................................... ..................................................................................................................................... [1] (e) A student points out that the experiment does not test the effectiveness of insulation in For reducing thermal energy loss. Examiner’s Use Suggest a change to this experiment which could be made so that the effect of insulation could be investigated. Explain why this change would help. suggestion ....................................................................................................................... .......................................................................................................................................... explanation ...................................................................................................................... .......................................................................................................................................... .......................................................................................................................................... [2] [Total: 8]
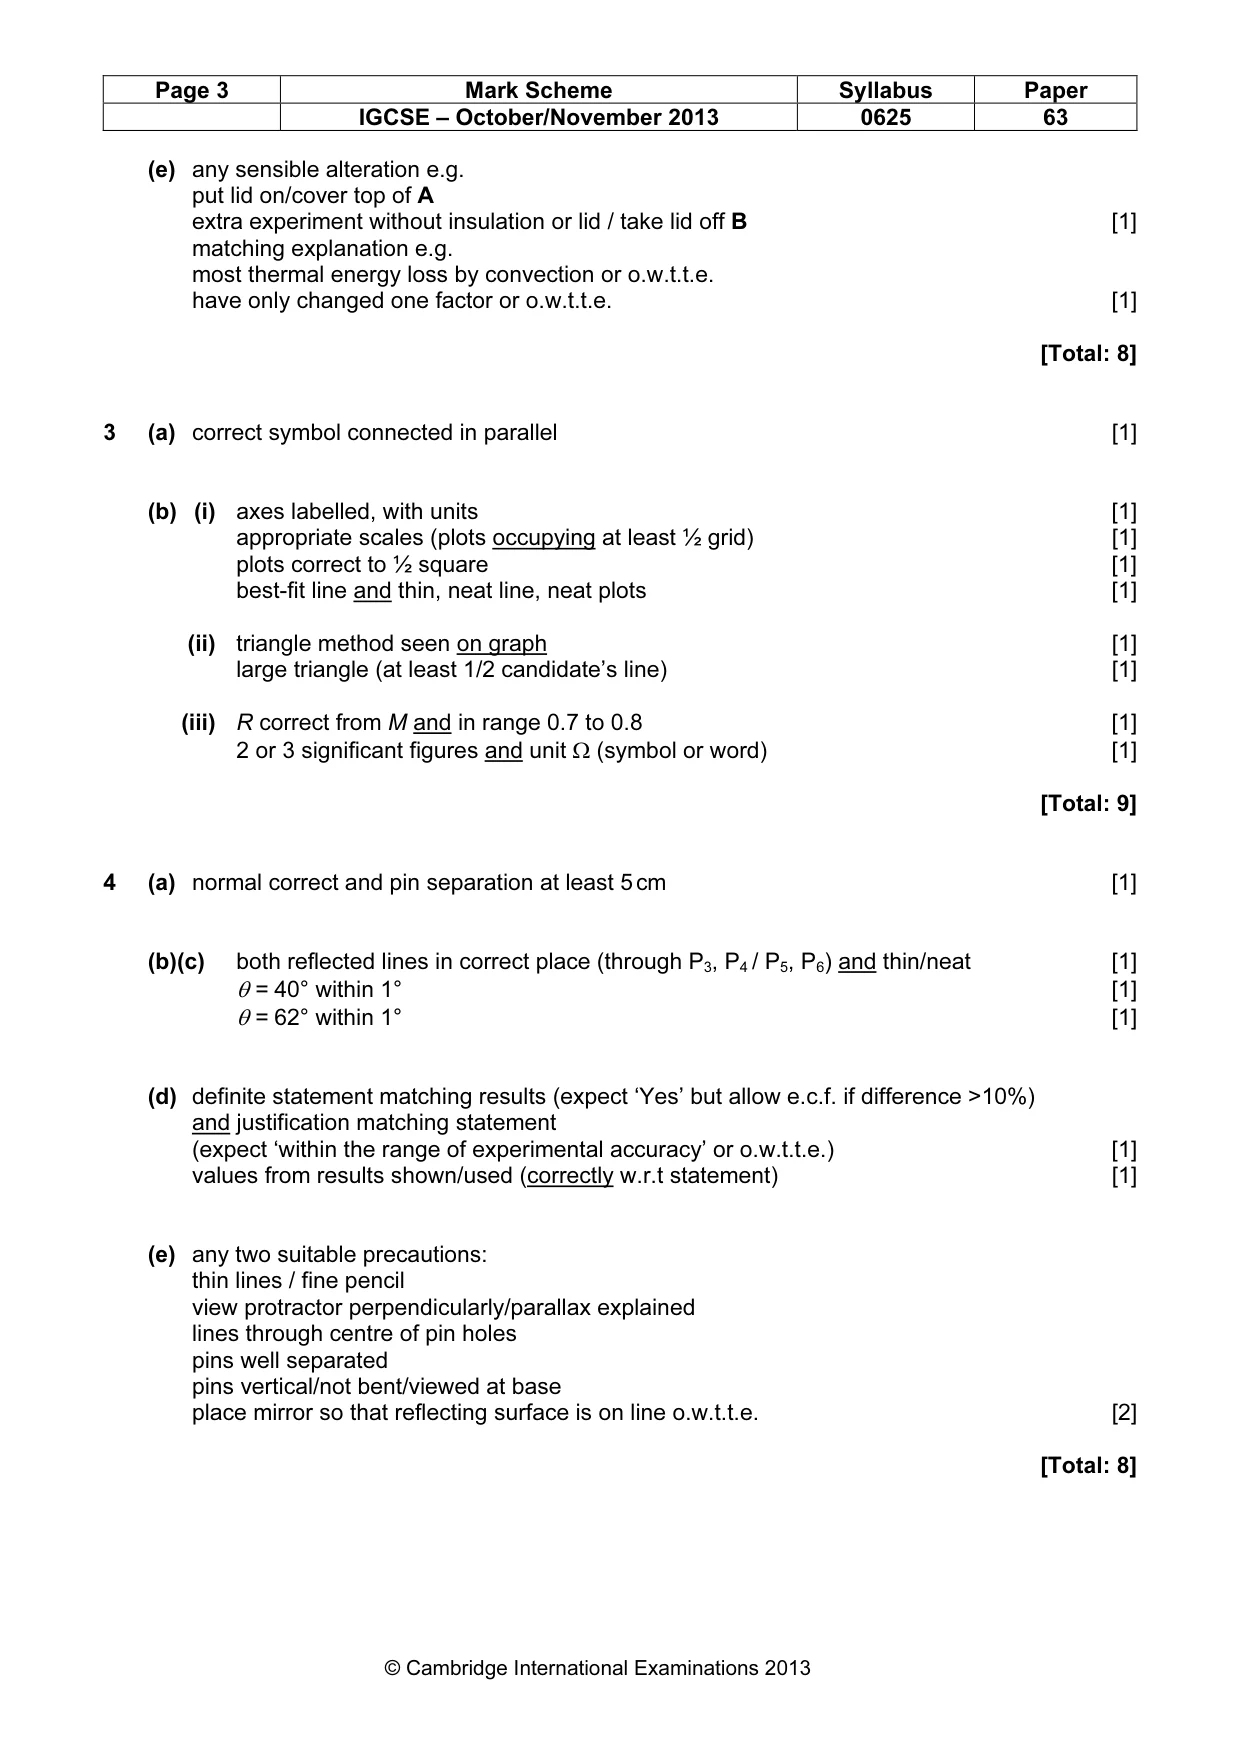
Mark scheme: 2 (a) A = 87(°C) and B = 88(°C) [1] (b) units correct (symbols or words) [1] times correct (0, 30, 60, 90, 120, 150, 180) [1] (c) statement matching temperature changes (accept ‘no significant difference’ if justified) and justification matching statement (comparison of temperature changes) [1] including specific mention of temperature change in same time [1] (d) appropriate condition relating to comparison i.e. any one from: same size/thickness of beaker same volume of water same initial temperature same room temperature / appropriate environmental condition same time for cooling [1] IGCSE – October/November 2013 0625 63 (e) any sensible alteration e.g. put lid on/cover top of A extra experiment without insulation or lid / take lid off B [1] matching explanation e.g. most thermal energy loss by convection or o.w.t.t.e. have only changed one factor or o.w.t.t.e. [1] [Total: 8]
Q3 · IGCSE students are investigating the current and potential difference in an electrical…
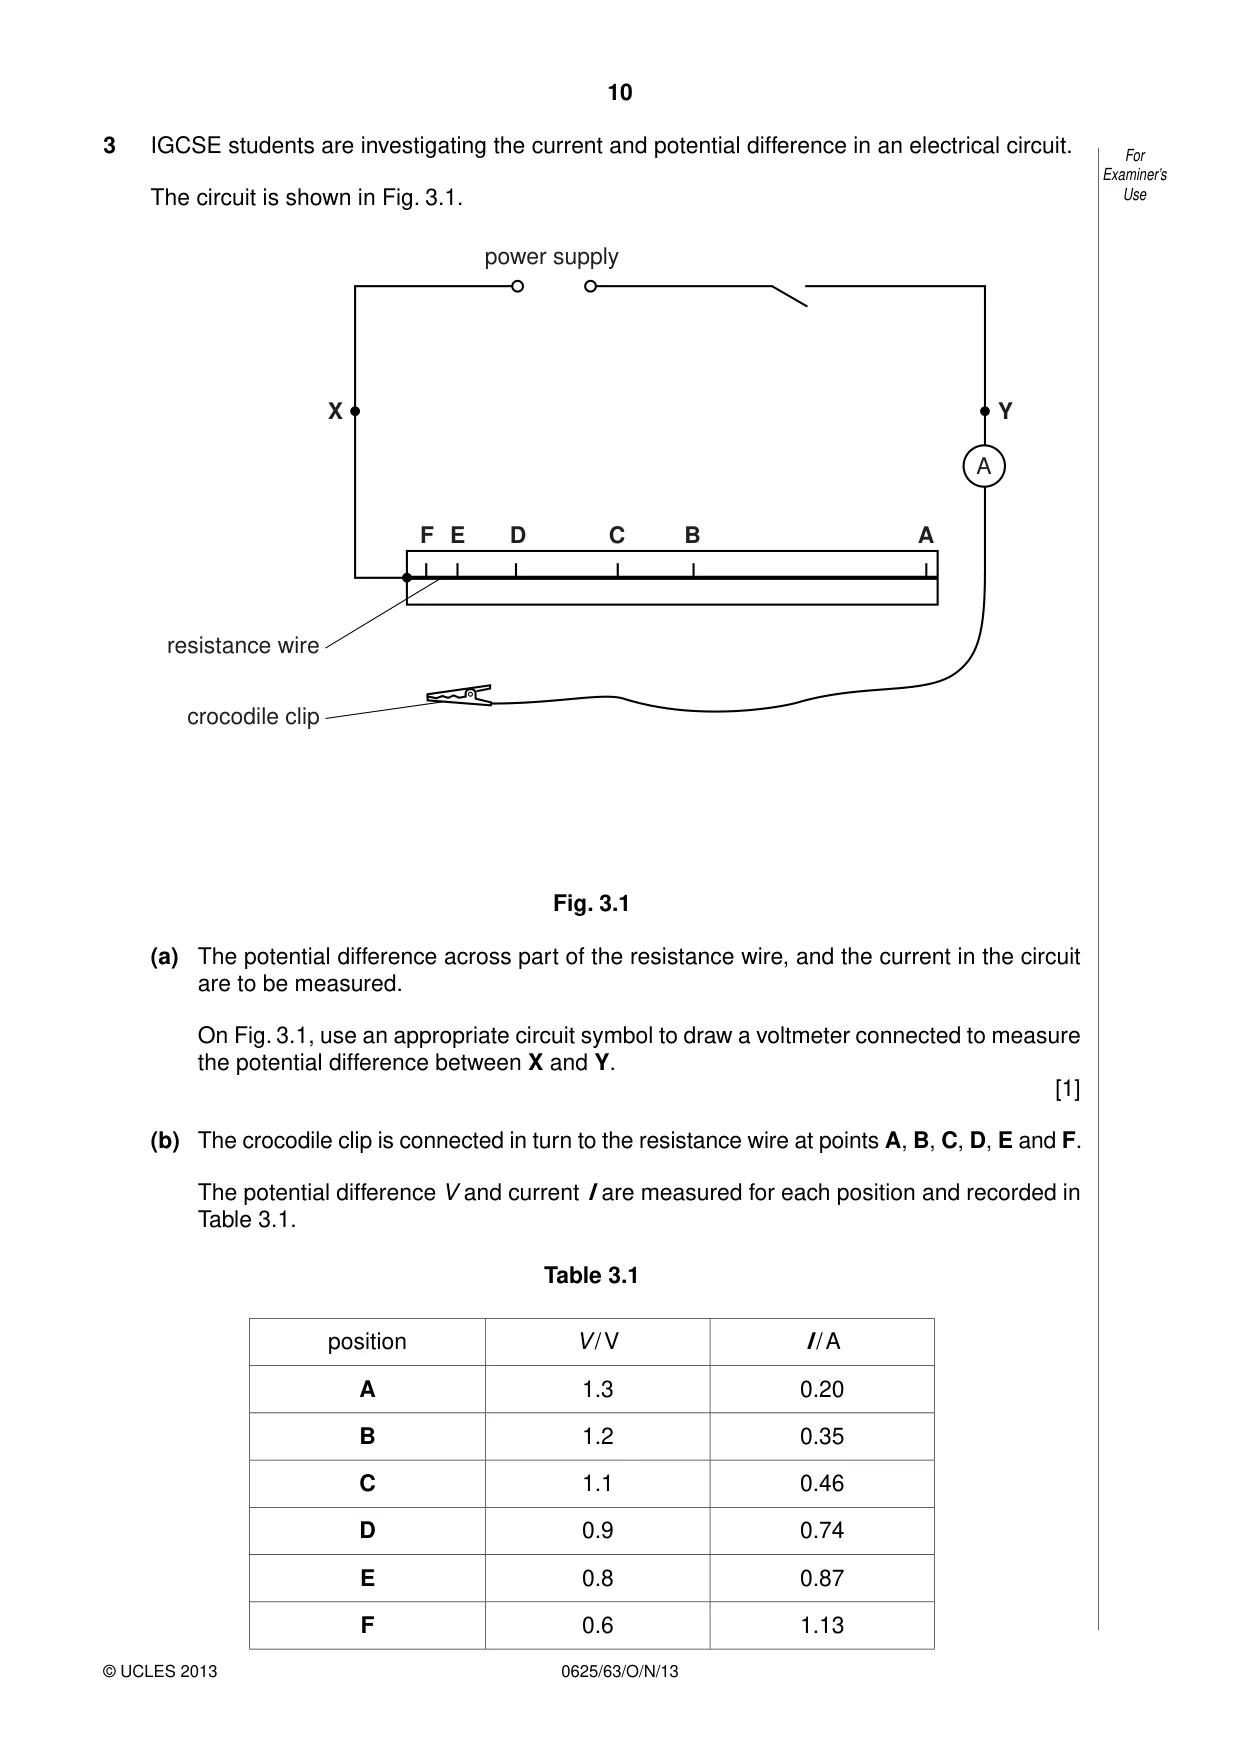
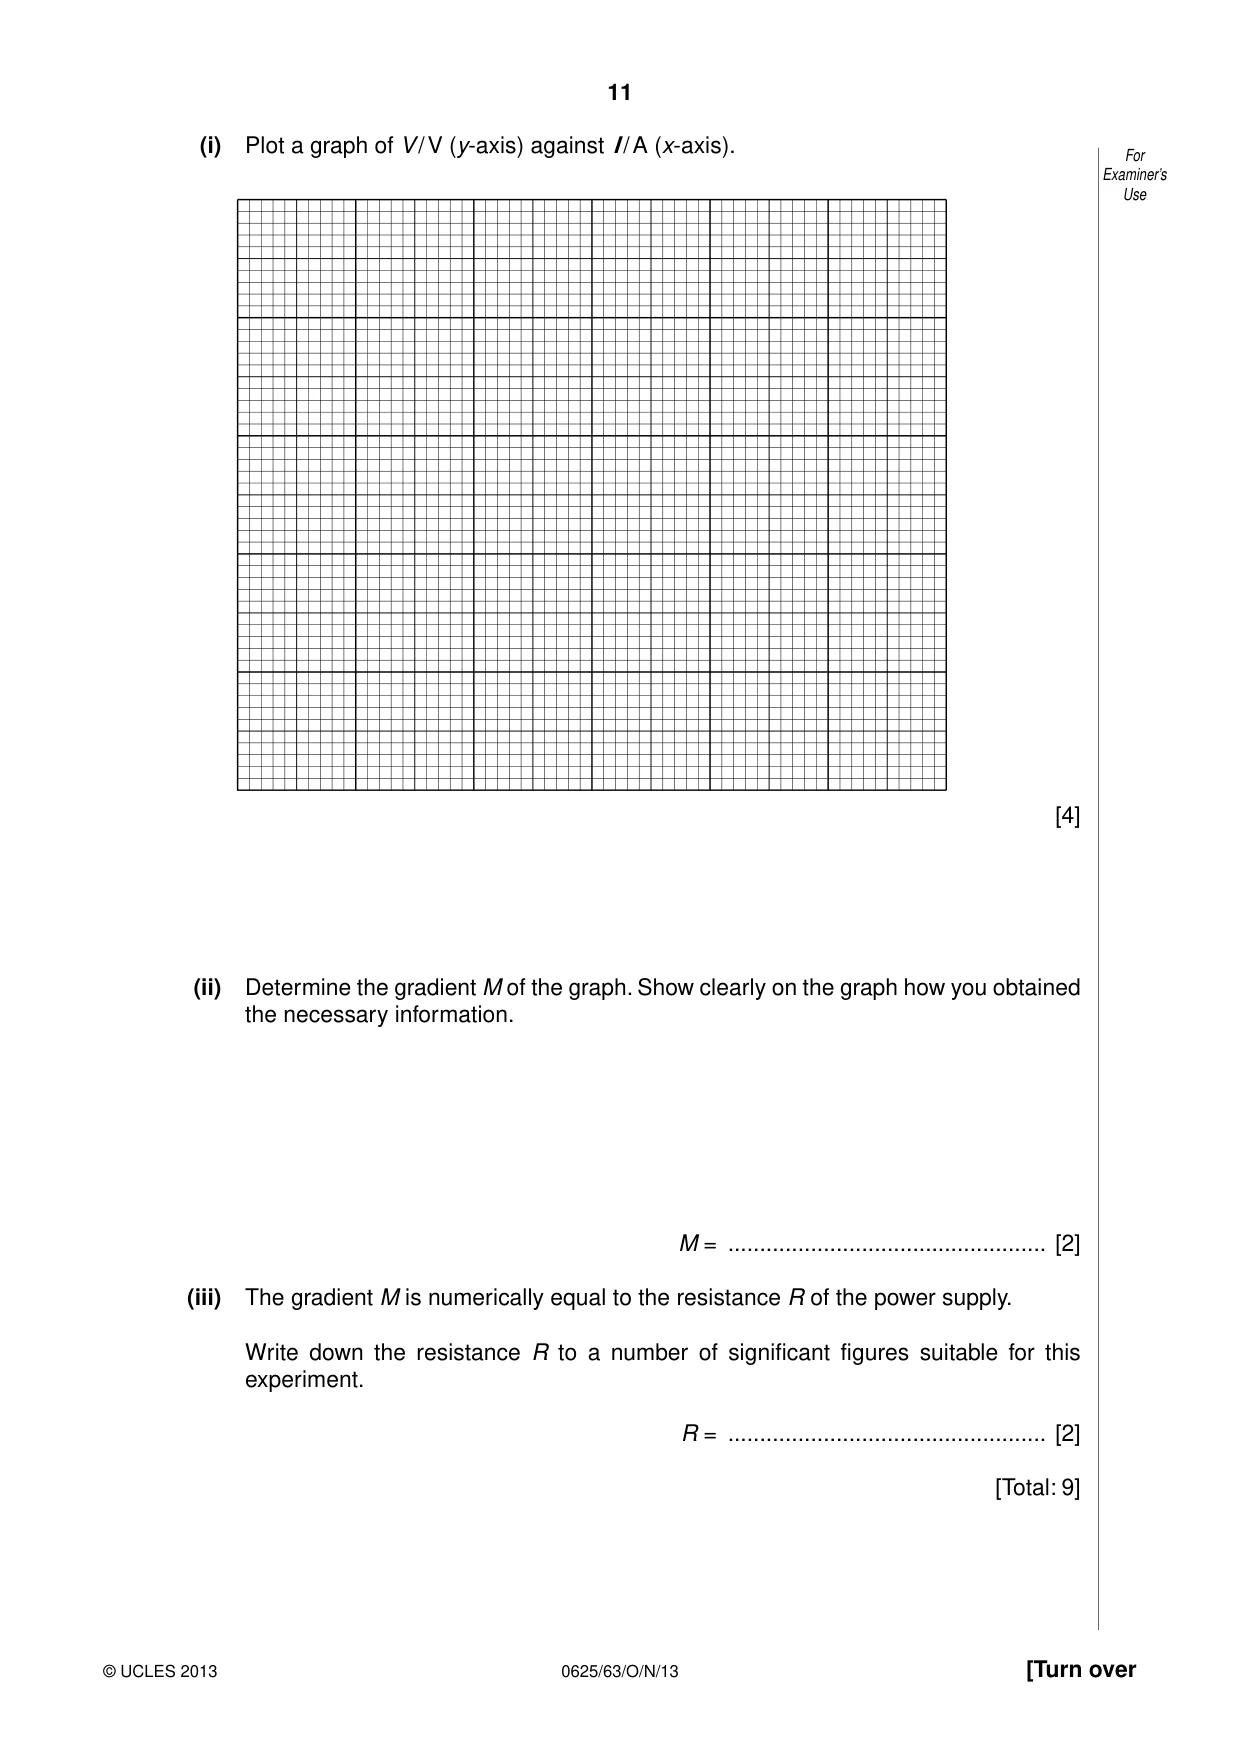
3 IGCSE students are investigating the current and potential difference in an electrical circuit. For Examiner’s The circuit is shown in Fig. 3.1. Use power supply X Y A F E D C B A resistance wire crocodile clip Fig. 3.1 (a) The potential difference across part of the resistance wire, and the current in the circuit are to be measured. On Fig. 3.1, use an appropriate circuit symbol to draw a voltmeter connected to measure the potential difference between X and Y. [1] (b) The crocodile clip is connected in turn to the resistance wire at points A, B, C, D, E and F. The potential difference V and current I are measured for each position and recorded in Table 3.1. Table 3.1 position V / V I / A A 1.3 0.20 B 1.2 0.35 C 1.1 0.46 D 0.9 0.74 E 0.8 0.87 F 0.6 1.13 (i) Plot a graph of V / V (y-axis) against I / A (x-axis). For Examiner’s Use [4] (ii) Determine the gradient M of the graph. Show clearly on the graph how you obtained the necessary information. M = .................................................. [2] (iii) The gradient M is numerically equal to the resistance R of the power supply. Write down the resistance R to a number of significant figures suitable for this experiment. R = .................................................. [2] [Total: 9]
Mark scheme: 3 (a) correct symbol connected in parallel [1] (b) (i) axes labelled, with units [1] appropriate scales (plots occupying at least ½ grid) [1] plots correct to ½ square [1] best-fit line and thin, neat line, neat plots [1] (ii) triangle method seen on graph [1] large triangle (at least 1/2 candidate’s line) [1] (iii) R correct from M and in range 0.7 to 0.8 [1] 2 or 3 significant figures and unit Ω (symbol or word) [1] [Total: 9]
Q4 · An IGCSE class is investigating the reflection of light by a plane mirror
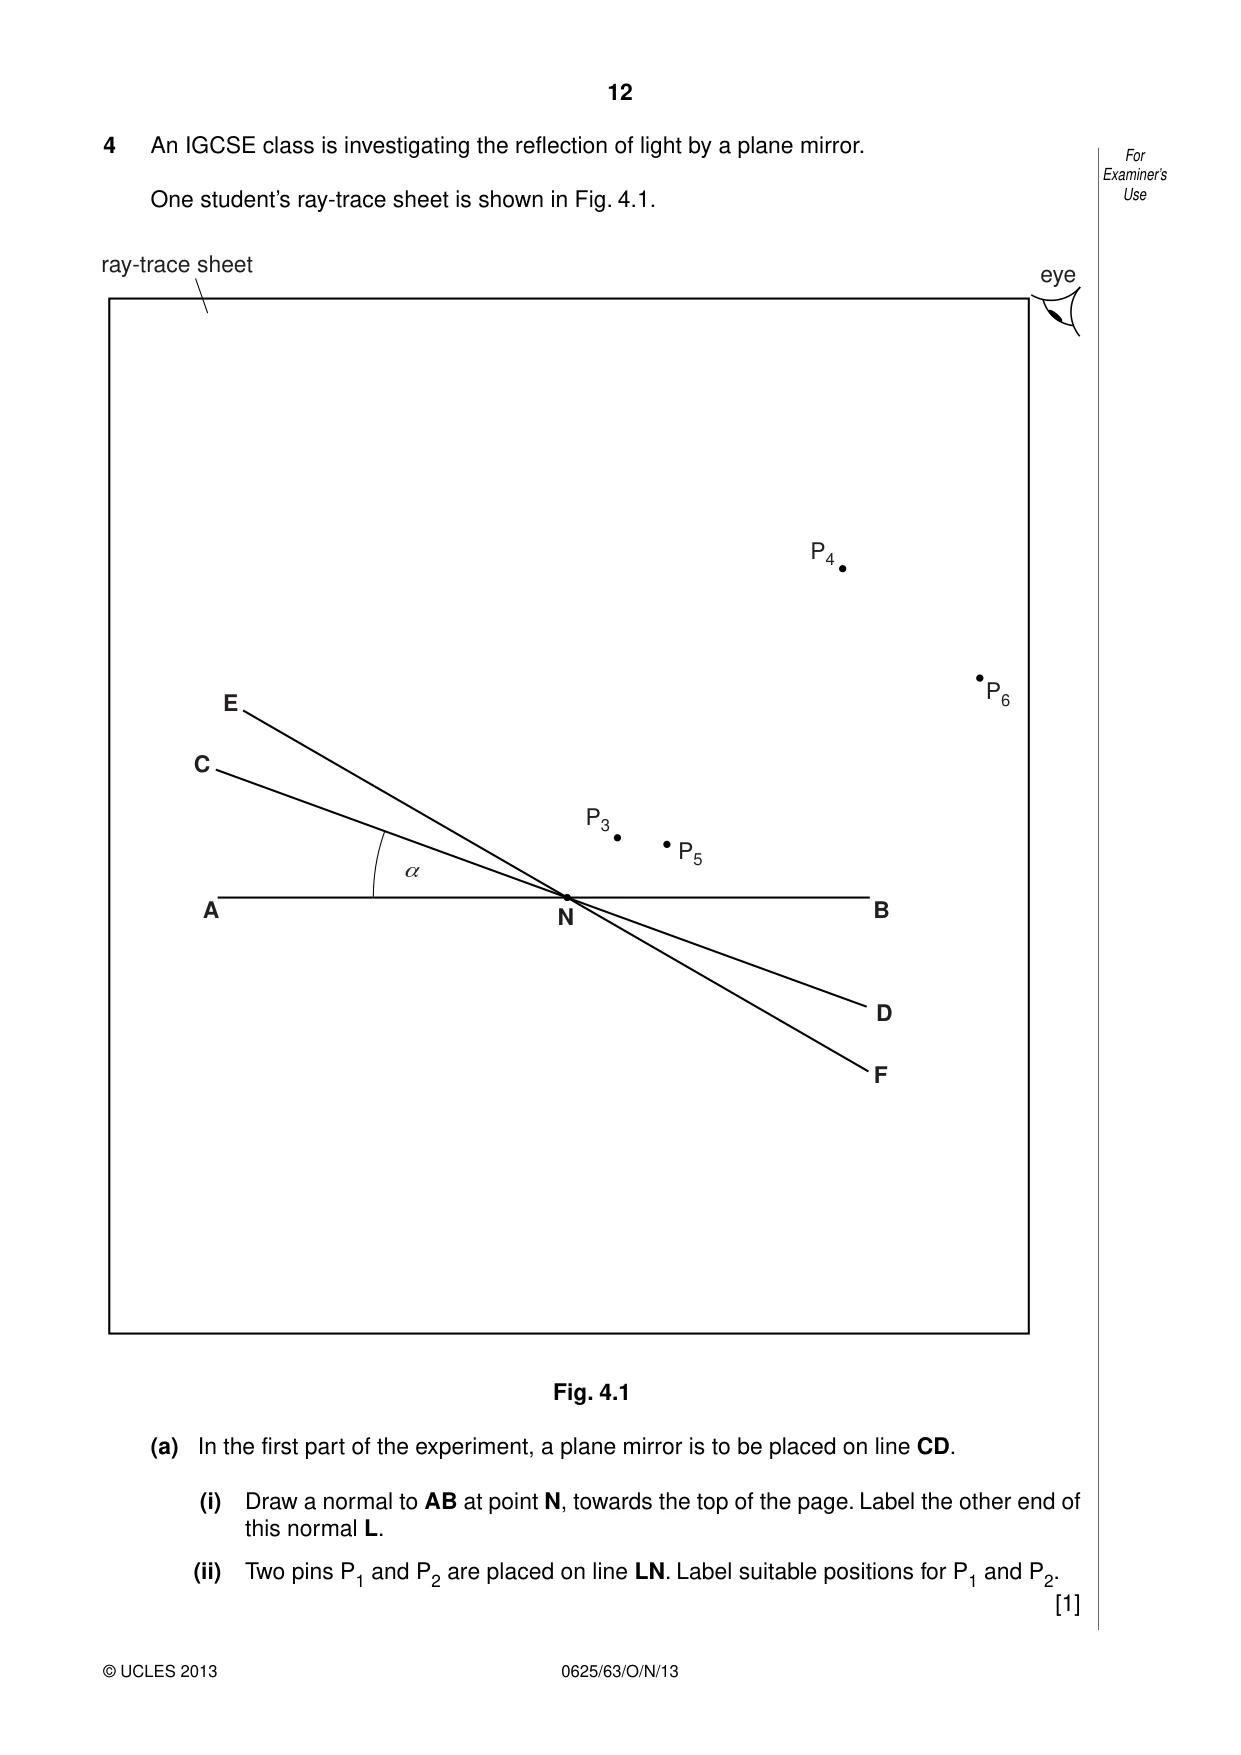
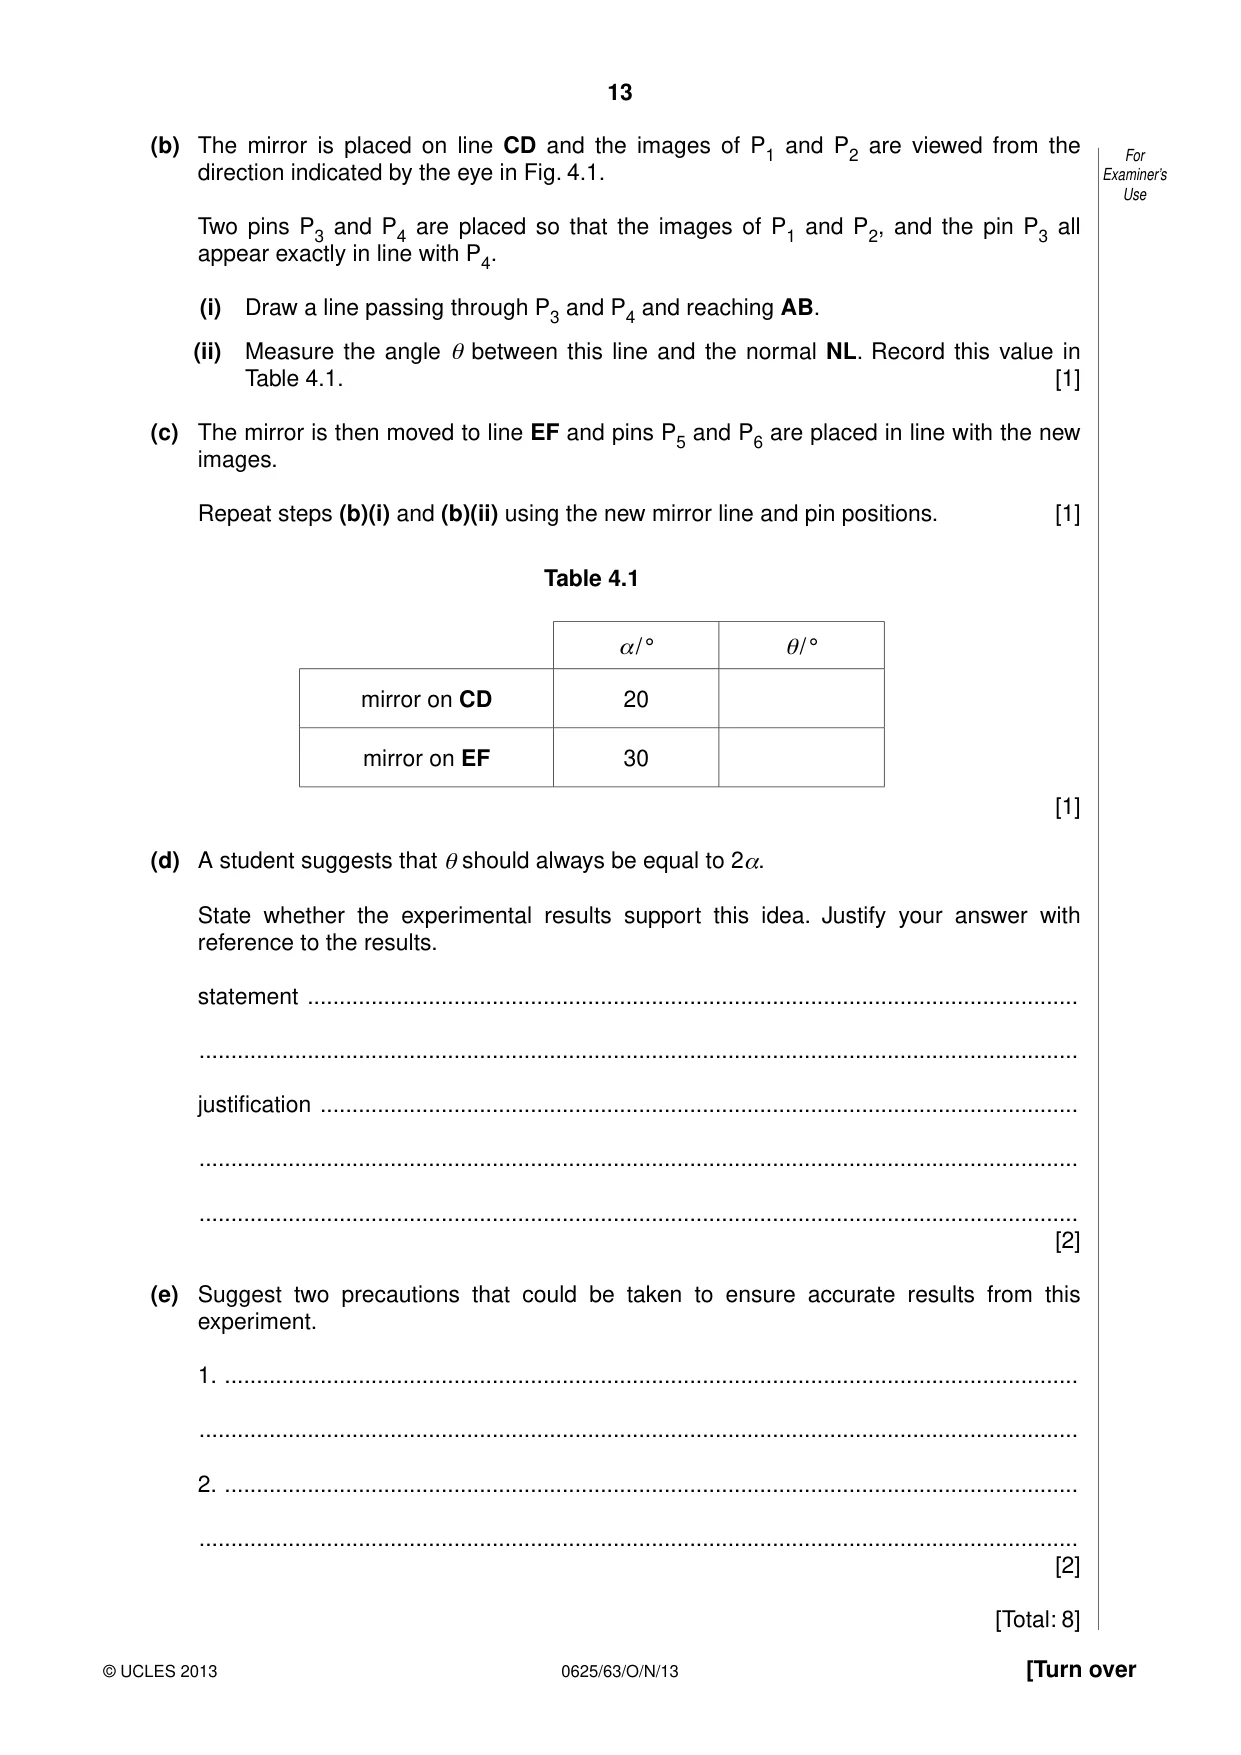
4 An IGCSE class is investigating the reflection of light by a plane mirror. For Examiner’s One student’s ray-trace sheet is shown in Fig. 4.1. Use ray-trace sheet eye P4 P6 E C P3 P5 _ A B N D F Fig. 4.1 (a) In the first part of the experiment, a plane mirror is to be placed on line CD. (i) Draw a normal to AB at point N, towards the top of the page. Label the other end of this normal L. (ii) Two pins P1 and P2 are placed on line LN. Label suitable positions for P1 and P2. [1] (b) The mirror is placed on line CD and the images of P1 and P2 are viewed from the For direction indicated by the eye in Fig. 4.1. Examiner’s Use Two pins P3 and P4 are placed so that the images of P1 and P2, and the pin P3 all appear exactly in line with P4. (i) Draw a line passing through P3 and P4 and reaching AB. (ii) Measure the angle θ between this line and the normal NL. Record this value in Table 4.1. [1] (c) The mirror is then moved to line EF and pins P5 and P6 are placed in line with the new images. Repeat steps (b)(i) and (b)(ii) using the new mirror line and pin positions. [1] Table 4.1 α/ ° θ/ ° mirror on CD 20 mirror on EF 30 [1] (d) A student suggests that θ should always be equal to 2α. State whether the experimental results support this idea. Justify your answer with reference to the results. statement ......................................................................................................................... .......................................................................................................................................... justification ....................................................................................................................... .......................................................................................................................................... .......................................................................................................................................... [2] (e) Suggest two precautions that could be taken to ensure accurate results from this experiment. 1. ...................................................................................................................................... .......................................................................................................................................... 2. ...................................................................................................................................... .......................................................................................................................................... [2] [Total: 8]
Mark scheme: 4 (a) normal correct and pin separation at least 5 cm [1] (b)(c) both reflected lines in correct place (through P3, P4 / P5, P6) and thin/neat [1] θ = 40° within 1° [1] θ = 62° within 1° [1] (d) definite statement matching results (expect ‘Yes’ but allow e.c.f. if difference >10%) and justification matching statement (expect ‘within the range of experimental accuracy’ or o.w.t.t.e.) [1] values from results shown/used (correctly w.r.t statement) [1] (e) any two suitable precautions: thin lines / fine pencil view protractor perpendicularly/parallax explained lines through centre of pin holes pins well separated pins vertical/not bent/viewed at base place mirror so that reflecting surface is on line o.w.t.t.e. [2] [Total: 8] IGCSE – October/November 2013 0625 63
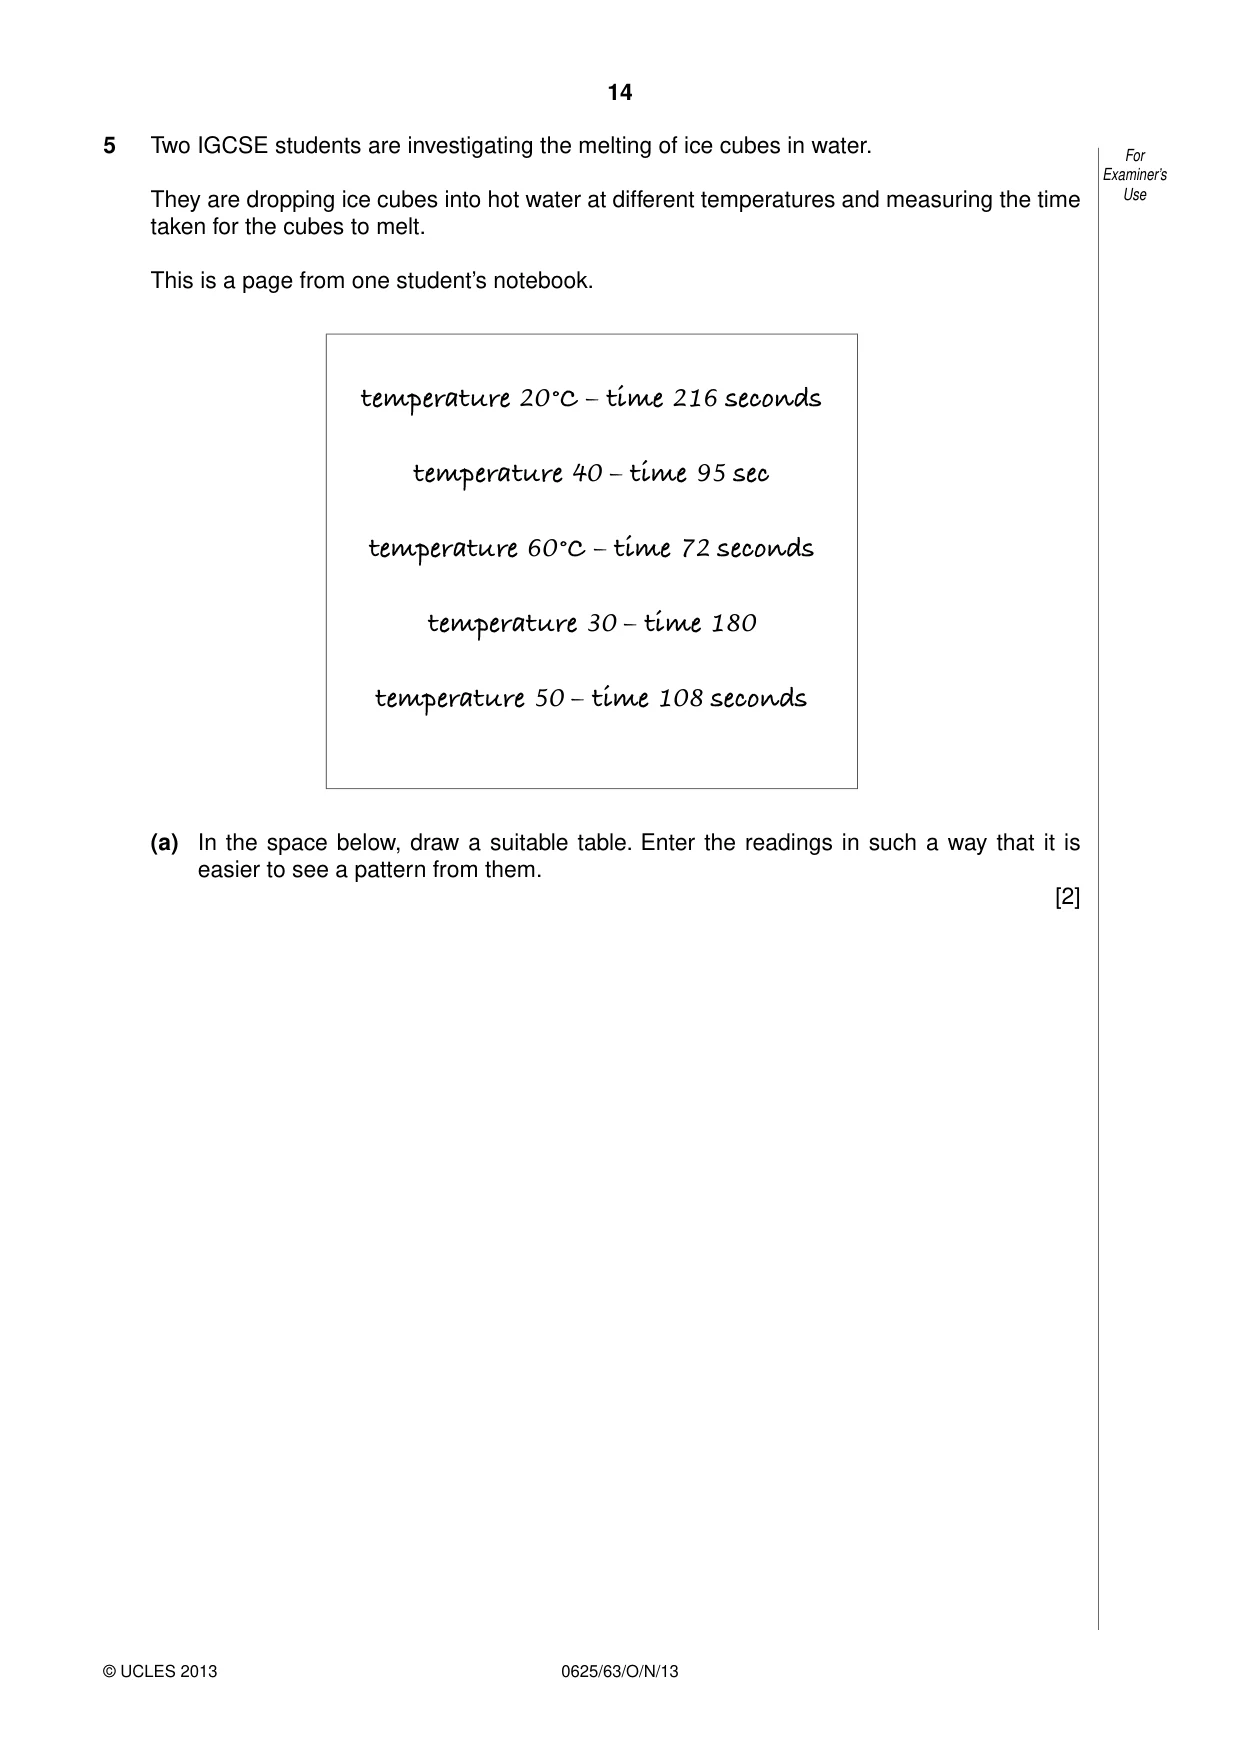
Q5 · Two IGCSE students are investigating the melting of ice cubes in water
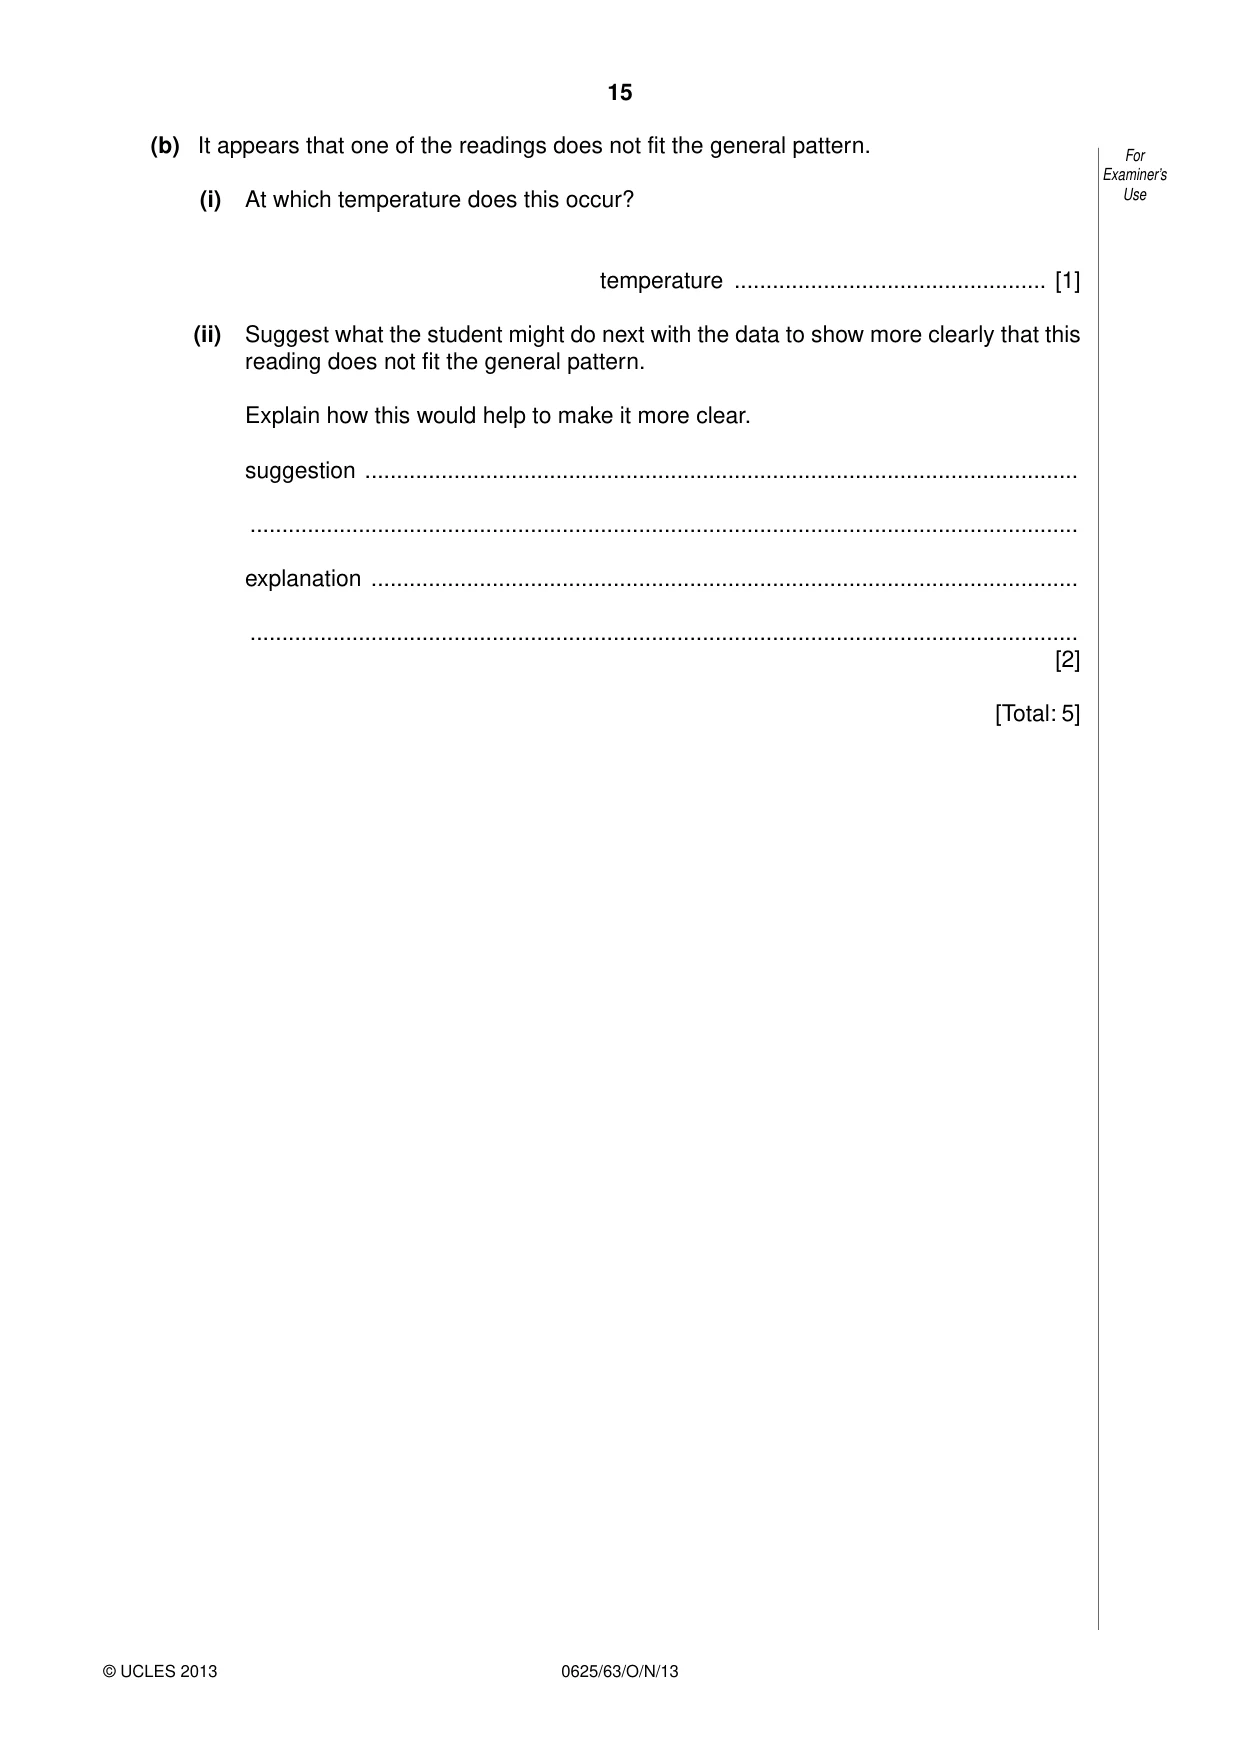
5 Two IGCSE students are investigating the melting of ice cubes in water. For Examiner’s They are dropping ice cubes into hot water at different temperatures and measuring the time Use taken for the cubes to melt. This is a page from one student’s notebook. temperature 20 °C – time 216 seconds temperature 40 – time 95 sec temperature 60 °C – time 72 seconds temperature 30 – time 180 temperature 50 – time 108 seconds (a) In the space below, draw a suitable table. Enter the readings in such a way that it is easier to see a pattern from them. [2] (b) It appears that one of the readings does not fit the general pattern. For Examiner’s (i) At which temperature does this occur? Use temperature ................................................. [1] (ii) Suggest what the student might do next with the data to show more clearly that this reading does not fit the general pattern. Explain how this would help to make it more clear. suggestion ................................................................................................................ .................................................................................................................................. explanation ............................................................................................................... .................................................................................................................................. [2] [Total: 5]
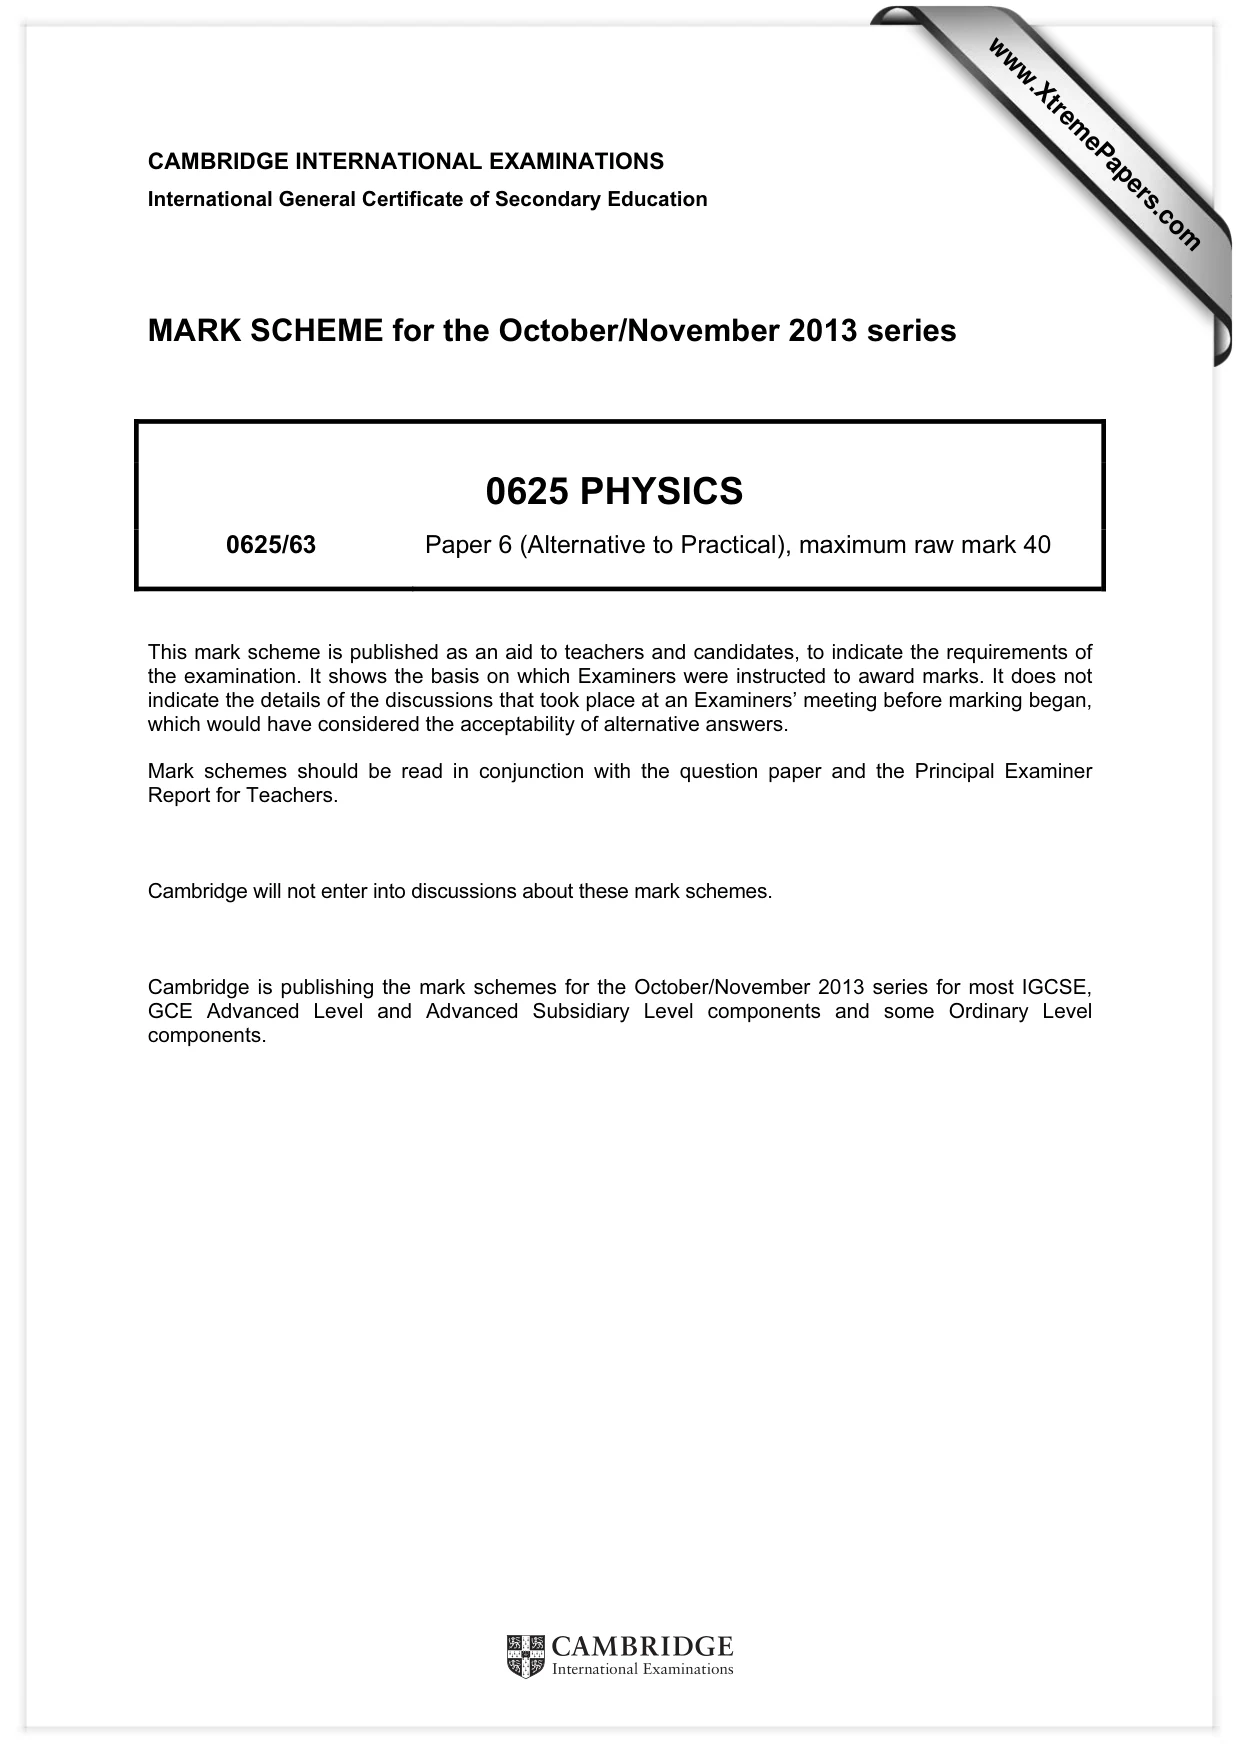
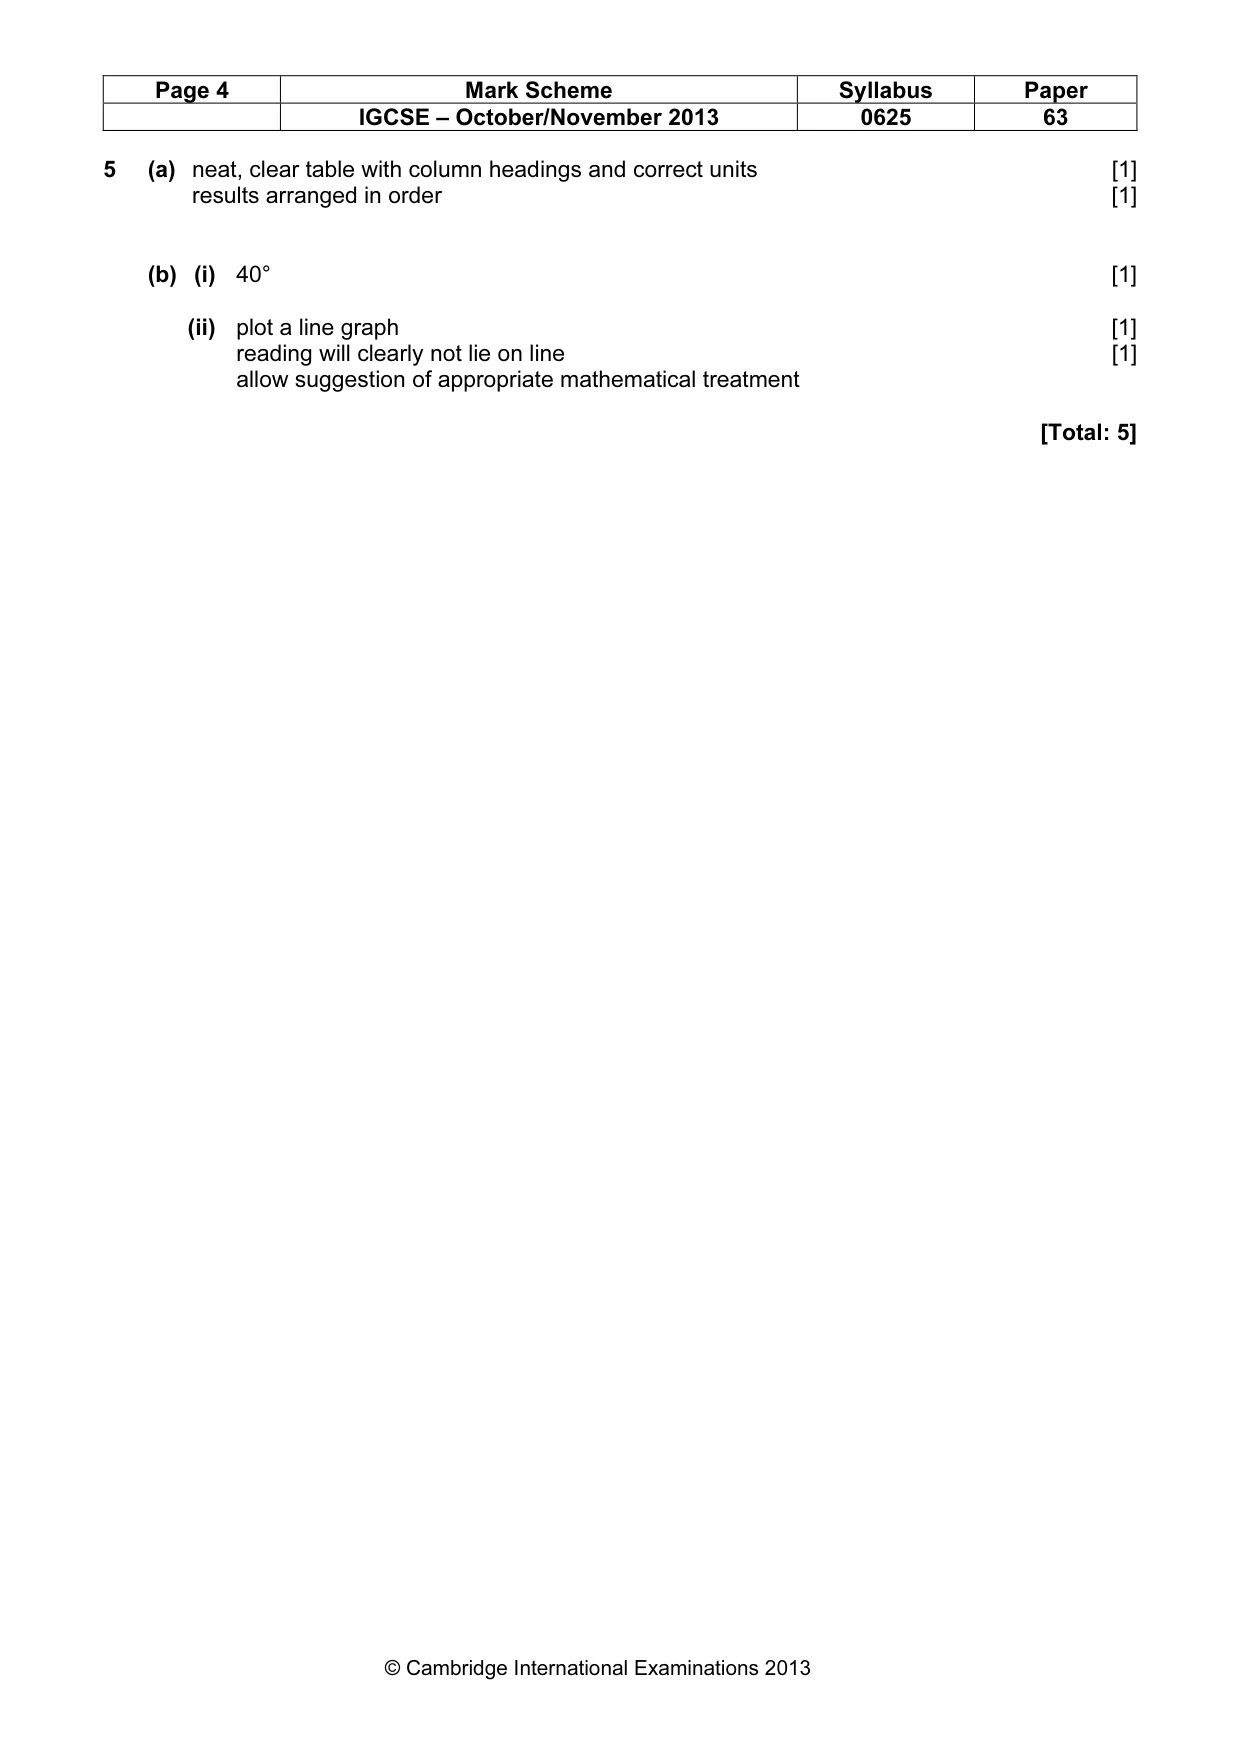
Mark scheme: 5 (a) neat, clear table with column headings and correct units [1] results arranged in order [1] (b) (i) 40° [1] (ii) plot a line graph [1] reading will clearly not lie on line [1] allow suggestion of appropriate mathematical treatment [Total: 5]
What was in this paper
The subtopics covered by these 5 questions, and how many questions each got. Open one in a new tab to see every Cambridge question on it.