Cambridge IGCSE Physics 0625 — 2013 Oct/Nov Paper 6 · Variant 1
0625/61/O/N/13 · 5 questions · 40 marks · ≈45 min
The question paper and its mark scheme, free to read here and free to download. This is Cambridge’s own paper, exactly as it was sat.
Question paper16 pages

Mark scheme4 pages
Answers below. Sit the paper first if you are practising.
Questions as text
Q1 · The IGCSE class is carrying out a moments experiment by balancing a metre rule on a small…
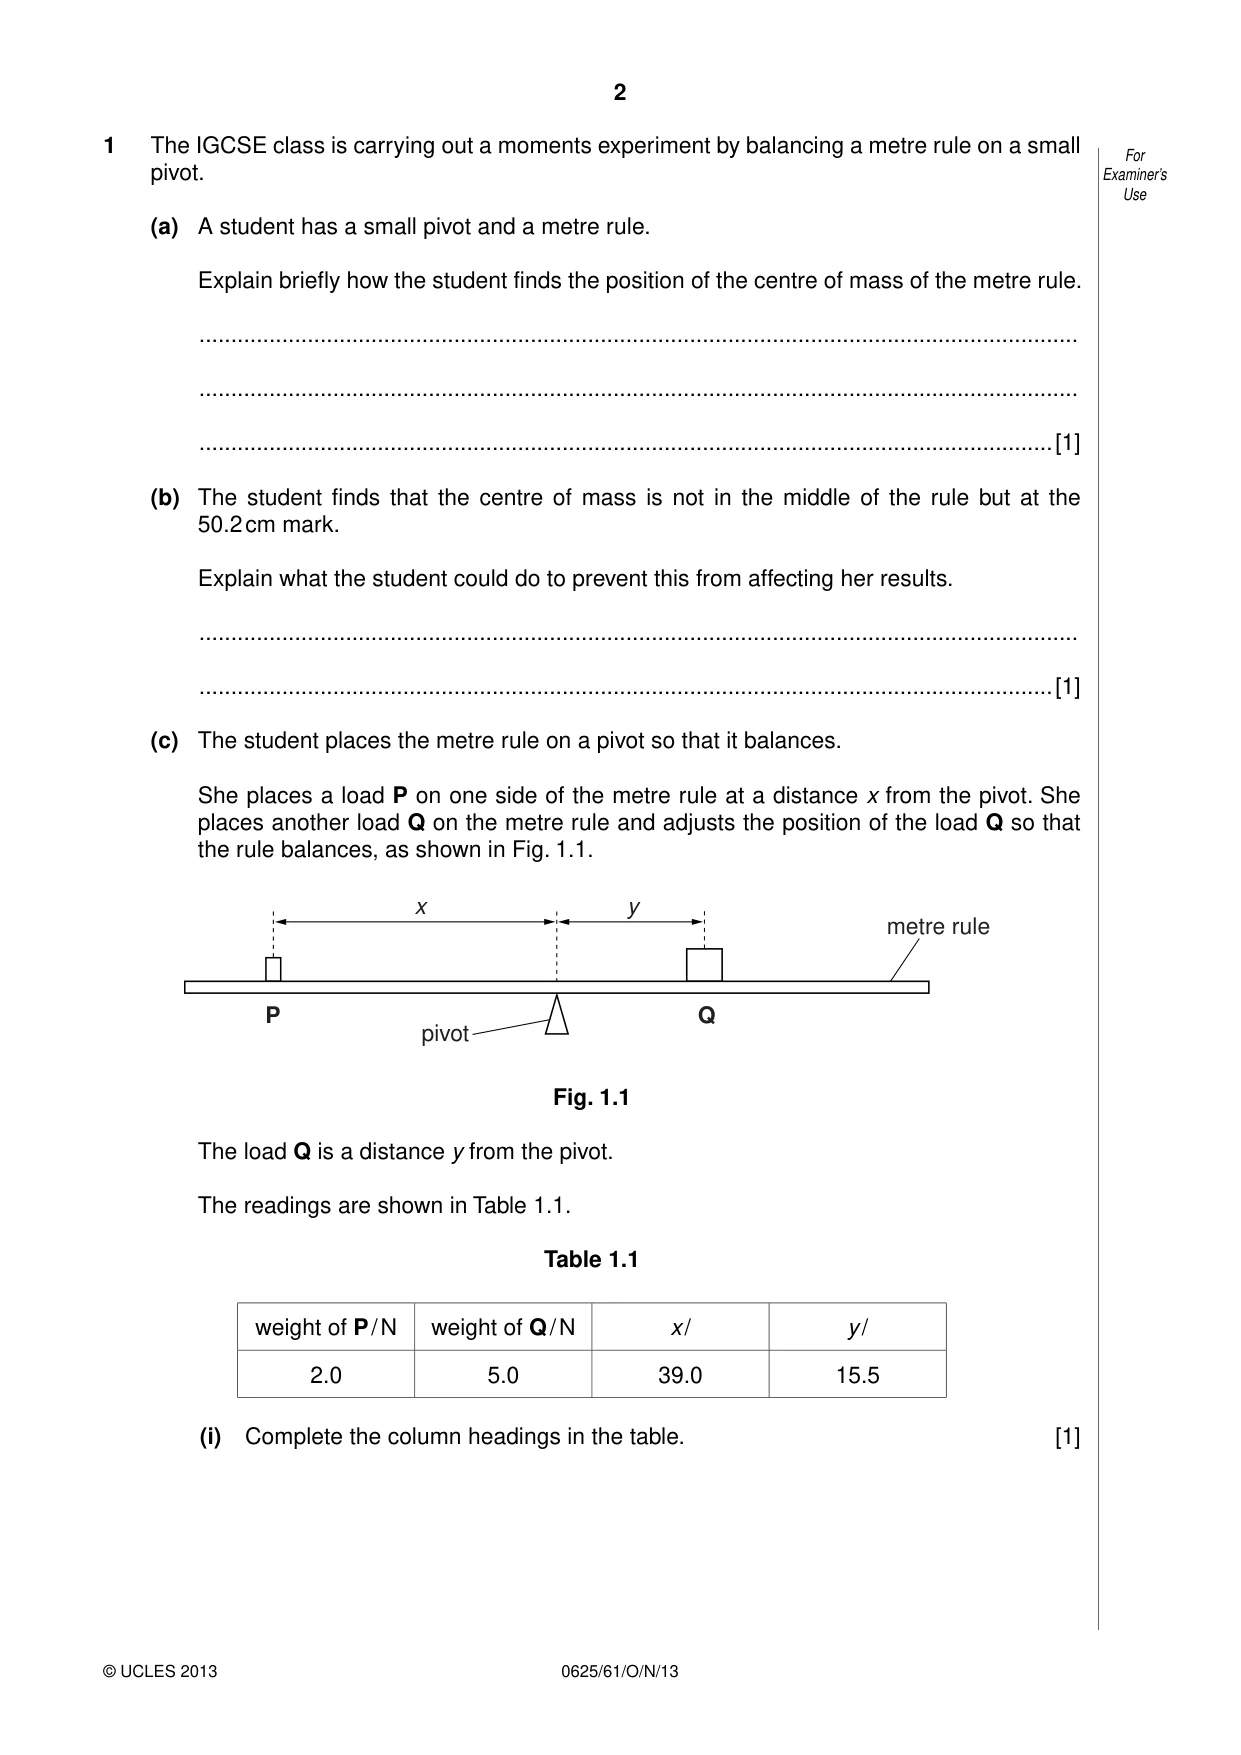
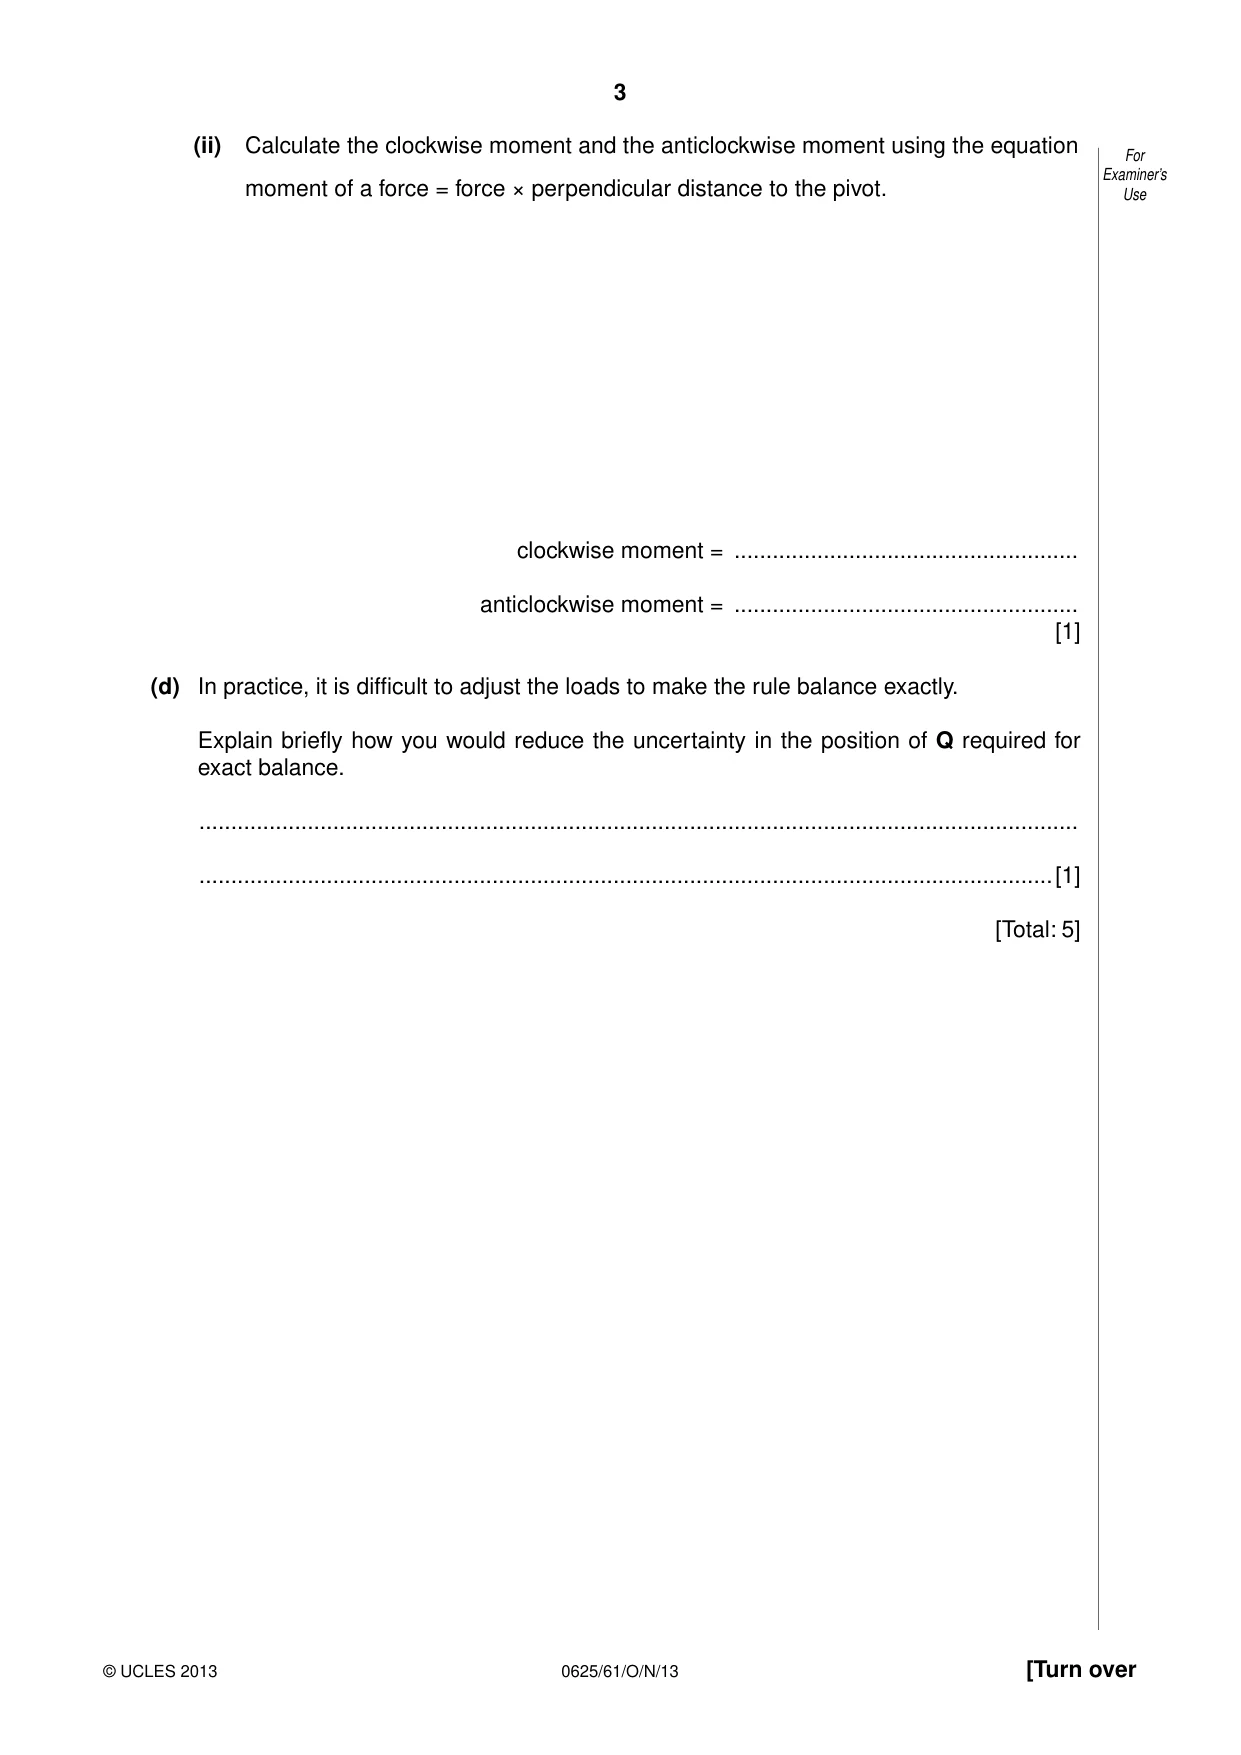
1 The IGCSE class is carrying out a moments experiment by balancing a metre rule on a small For pivot. Examiner’s Use (a) A student has a small pivot and a metre rule. Explain briefly how the student finds the position of the centre of mass of the metre rule. .......................................................................................................................................... .......................................................................................................................................... ......................................................................................................................................[1] (b) The student finds that the centre of mass is not in the middle of the rule but at the 50.2 cm mark. Explain what the student could do to prevent this from affecting her results. .......................................................................................................................................... ......................................................................................................................................[1] (c) The student places the metre rule on a pivot so that it balances. She places a load P on one side of the metre rule at a distance x from the pivot. She places another load Q on the metre rule and adjusts the position of the load Q so that the rule balances, as shown in Fig. 1.1. x y metre rule P Q pivot Fig. 1.1 The load Q is a distance y from the pivot. The readings are shown in Table 1.1. Table 1.1 weight of P / N weight of Q / N x / y / 2.0 5.0 39.0 15.5 (i) Complete the column headings in the table. [1] (ii) Calculate the clockwise moment and the anticlockwise moment using the equation For Examiner’s moment of a force = force × perpendicular distance to the pivot. Use clockwise moment = ...................................................... anticlockwise moment = ...................................................... [1] (d) In practice, it is difficult to adjust the loads to make the rule balance exactly. Explain briefly how you would reduce the uncertainty in the position of Q required for exact balance. .......................................................................................................................................... ......................................................................................................................................[1] [Total: 5]
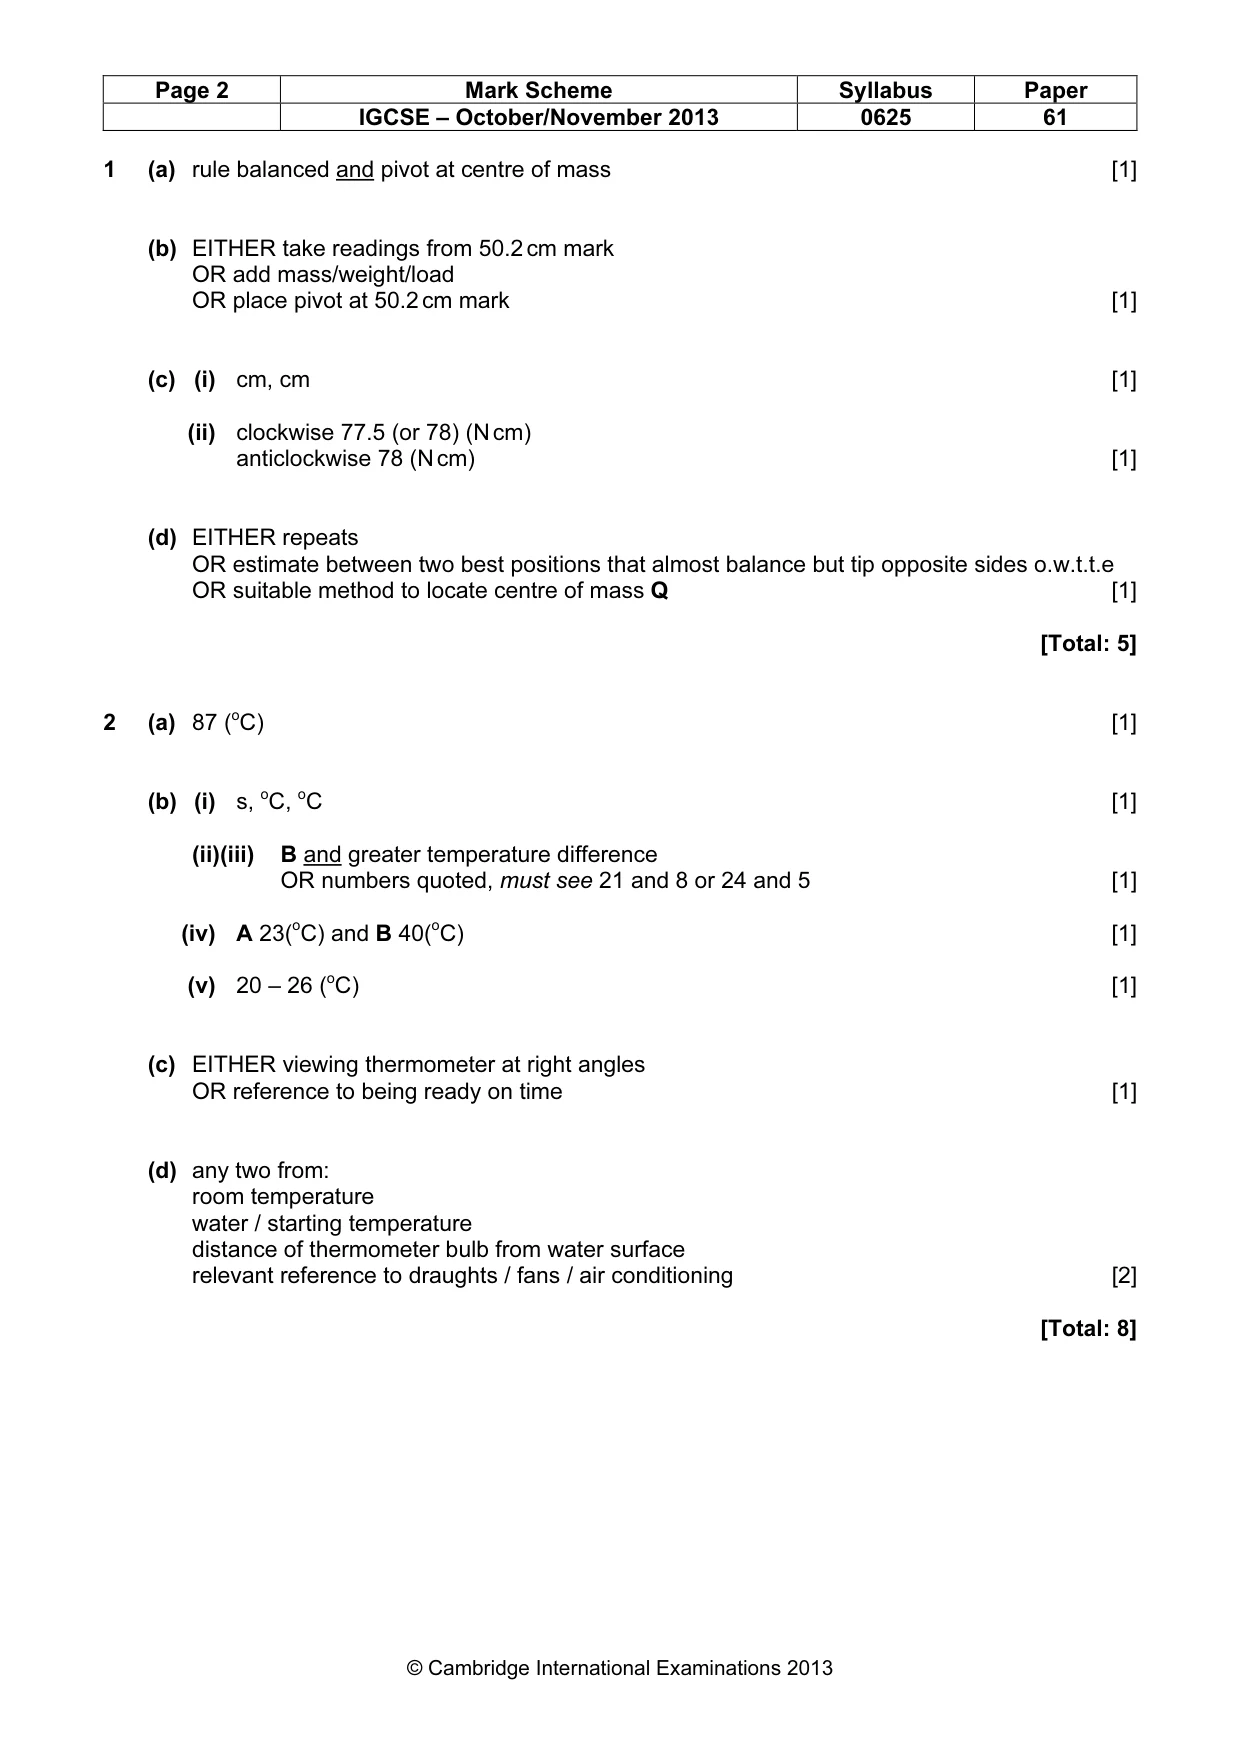
Mark scheme: 1 (a) rule balanced and pivot at centre of mass [1] (b) EITHER take readings from 50.2 cm mark OR add mass/weight/load OR place pivot at 50.2 cm mark [1] (c) (i) cm, cm [1] (ii) clockwise 77.5 (or 78) (N cm) anticlockwise 78 (N cm) [1] (d) EITHER repeats OR estimate between two best positions that almost balance but tip opposite sides o.w.t.t.e OR suitable method to locate centre of mass Q [1] [Total: 5] o
Q2 · An IGCSE student is investigating the cooling of a thermometer bulb
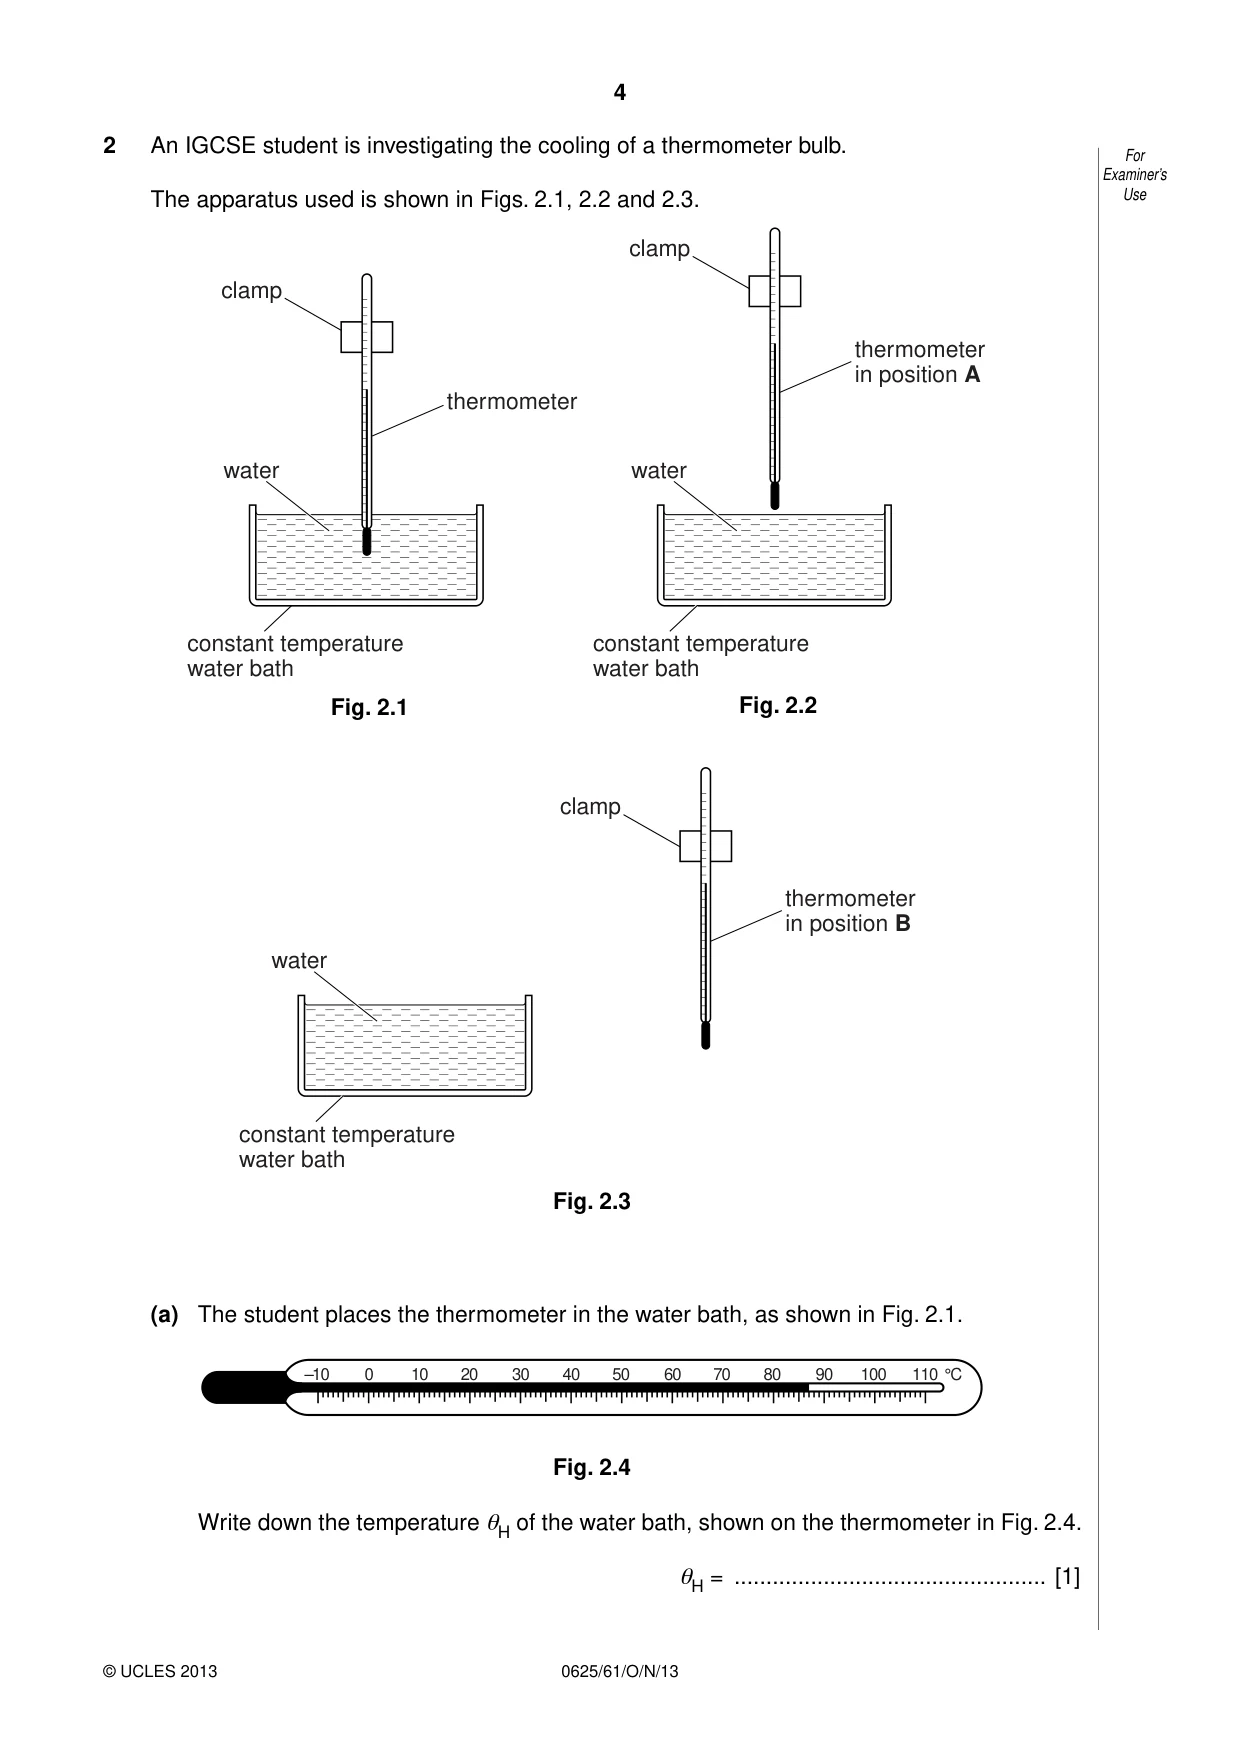
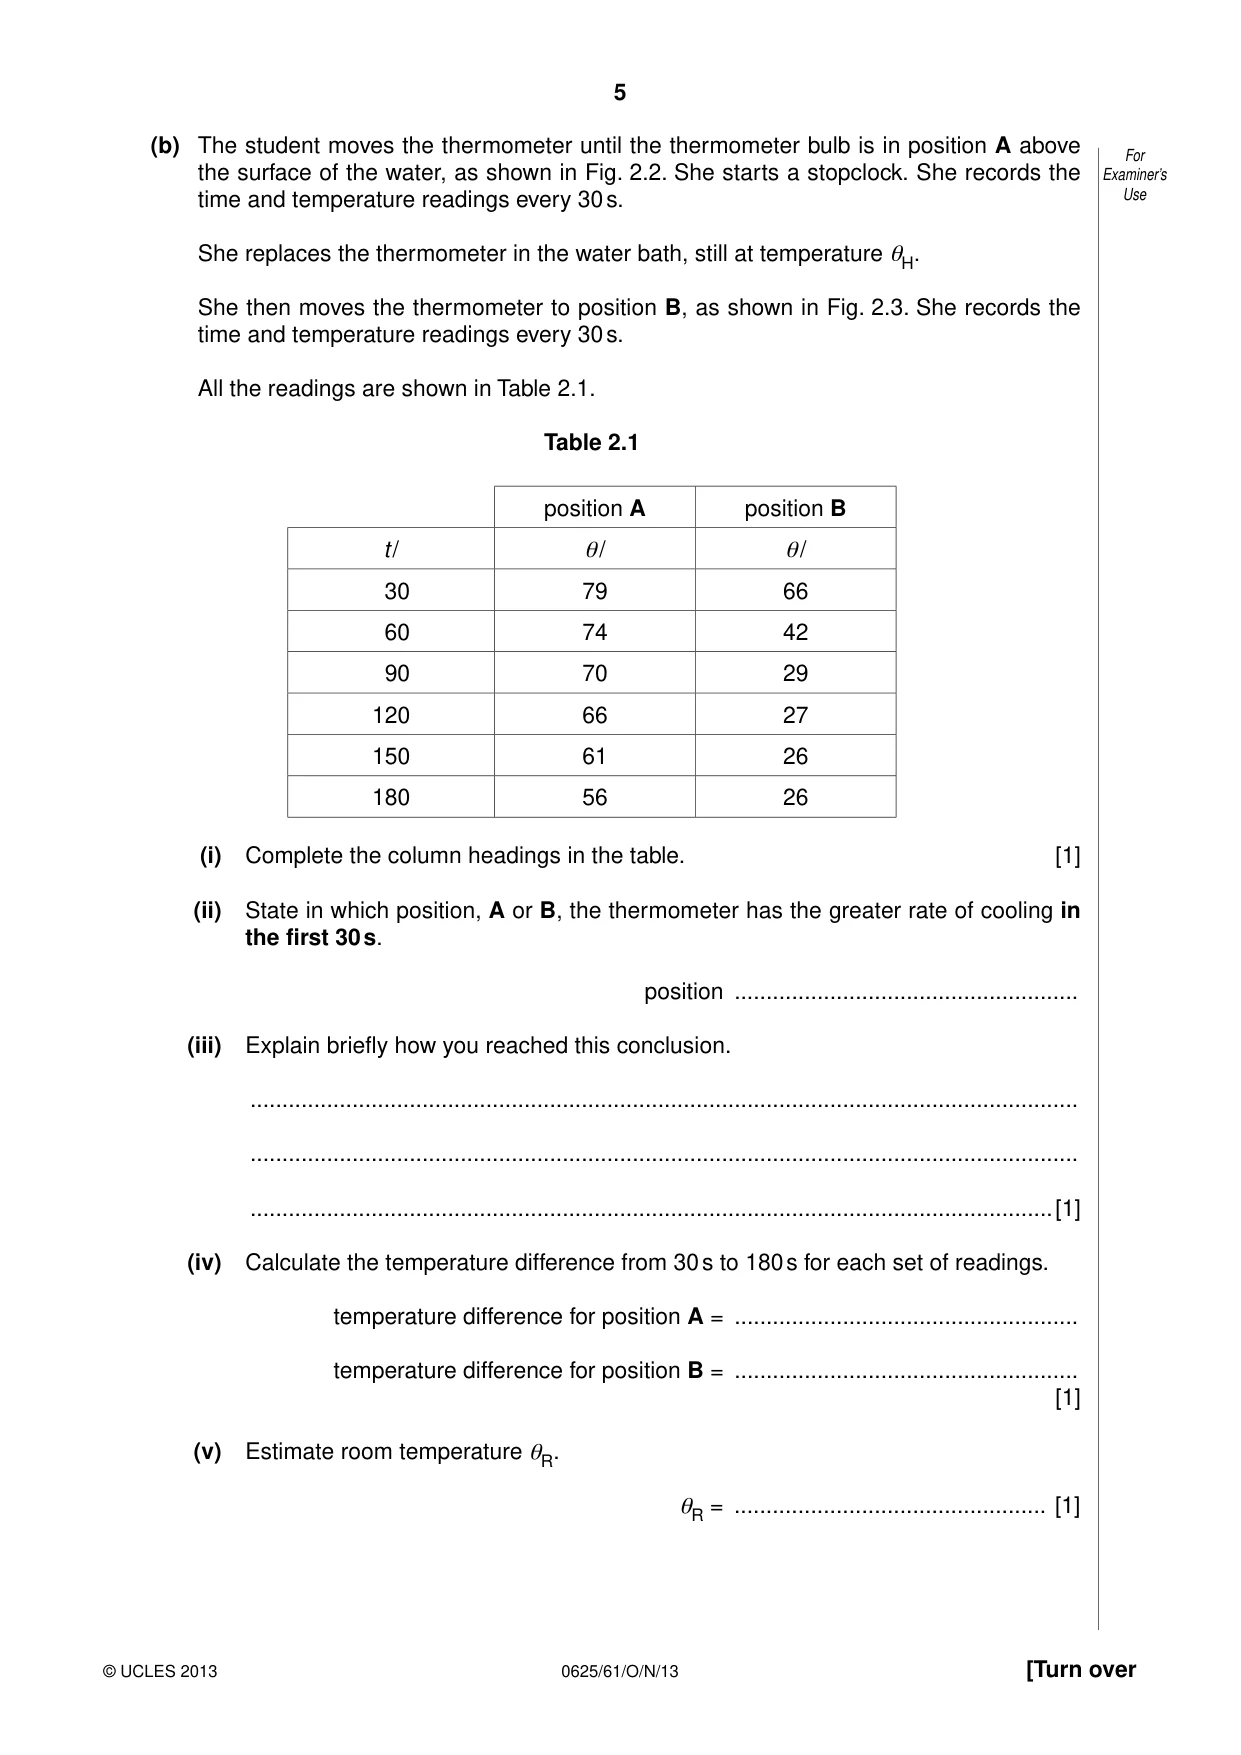
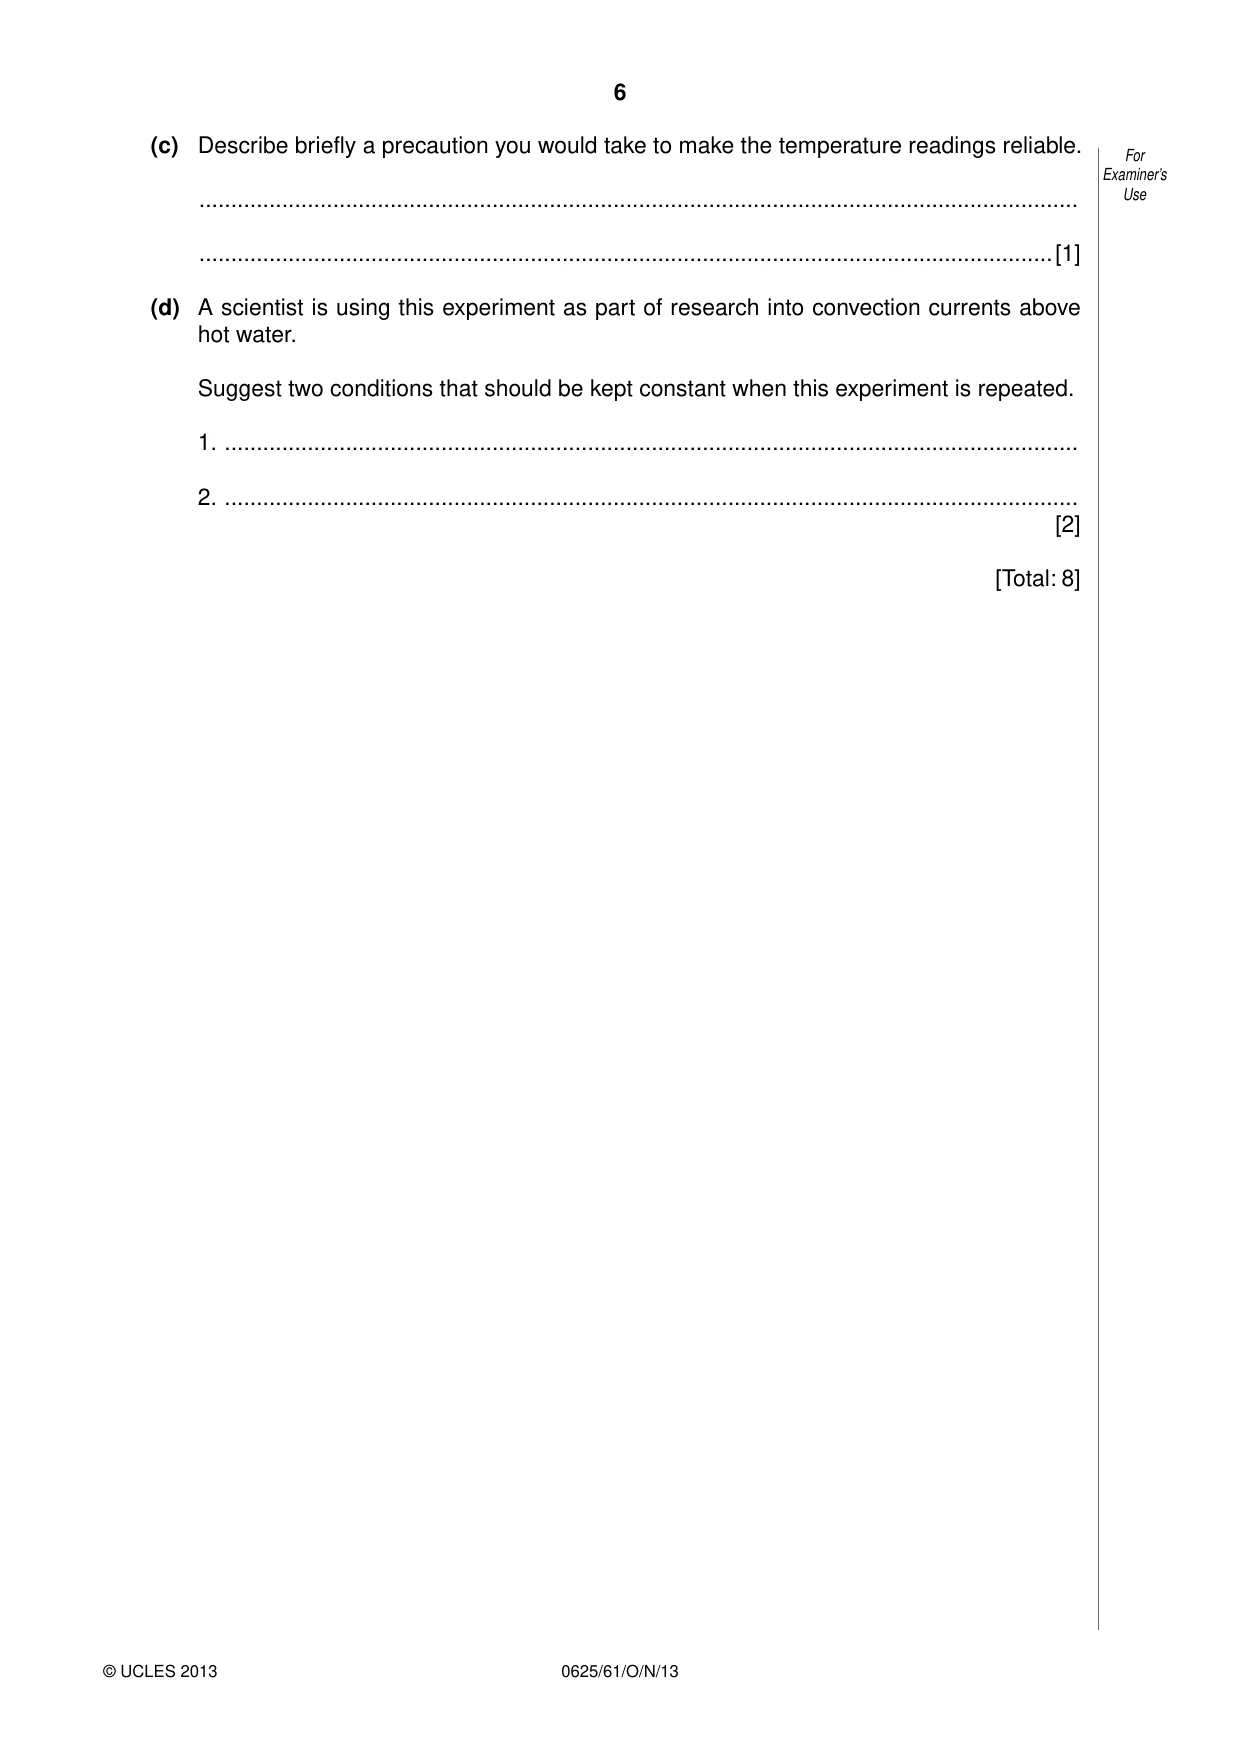
2 An IGCSE student is investigating the cooling of a thermometer bulb. For Examiner’s The apparatus used is shown in Figs. 2.1, 2.2 and 2.3. Use clamp clamp thermometer in position A thermometer water water constant temperature constant temperature water bath water bath Fig. 2.1 Fig. 2.2 clamp thermometer in position B water constant temperature water bath Fig. 2.3 (a) The student places the thermometer in the water bath, as shown in Fig. 2.1. –10 0 10 20 30 40 50 60 70 80 90 100 110 °C Fig. 2.4 Write down the temperature θH of the water bath, shown on the thermometer in Fig. 2.4. θH = ................................................. [1] (b) The student moves the thermometer until the thermometer bulb is in position A above For the surface of the water, as shown in Fig. 2.2. She starts a stopclock. She records the Examiner’s time and temperature readings every 30 s. Use She replaces the thermometer in the water bath, still at temperature θH. She then moves the thermometer to position B, as shown in Fig. 2.3. She records the time and temperature readings every 30 s. All the readings are shown in Table 2.1. Table 2.1 position A position B t / θ/ θ/ 30 79 66 60 74 42 90 70 29 120 66 27 150 61 26 180 56 26 (i) Complete the column headings in the table. [1] (ii) State in which position, A or B, the thermometer has the greater rate of cooling in the first 30 s. position ...................................................... (iii) Explain briefly how you reached this conclusion. .................................................................................................................................. .................................................................................................................................. ..............................................................................................................................[1] (iv) Calculate the temperature difference from 30 s to 180 s for each set of readings. temperature difference for position A = ...................................................... temperature difference for position B = ...................................................... [1] (v) Estimate room temperature θR. θR = ................................................. [1] (c) Describe briefly a precaution you would take to make the temperature readings reliable. For Examiner’s .......................................................................................................................................... Use ......................................................................................................................................[1] (d) A scientist is using this experiment as part of research into convection currents above hot water. Suggest two conditions that should be kept constant when this experiment is repeated. 1. ...................................................................................................................................... 2. ...................................................................................................................................... [2] [Total: 8] Question 3 begins on page 8.
Mark scheme: 2 (a) 87 (oC) [1] (b) (i) s, oC, oC [1] (ii)(iii) B and greater temperature difference OR numbers quoted, must see 21 and 8 or 24 and 5 [1] (iv) A 23(oC) and B 40(oC) [1] (v) 20 – 26 (oC) [1] (c) EITHER viewing thermometer at right angles OR reference to being ready on time [1] (d) any two from: room temperature water / starting temperature distance of thermometer bulb from water surface relevant reference to draughts / fans / air conditioning [2] [Total: 8] IGCSE – October/November 2013 0625 61
Q3 · The IGCSE class is investigating the power of lamps in a circuit
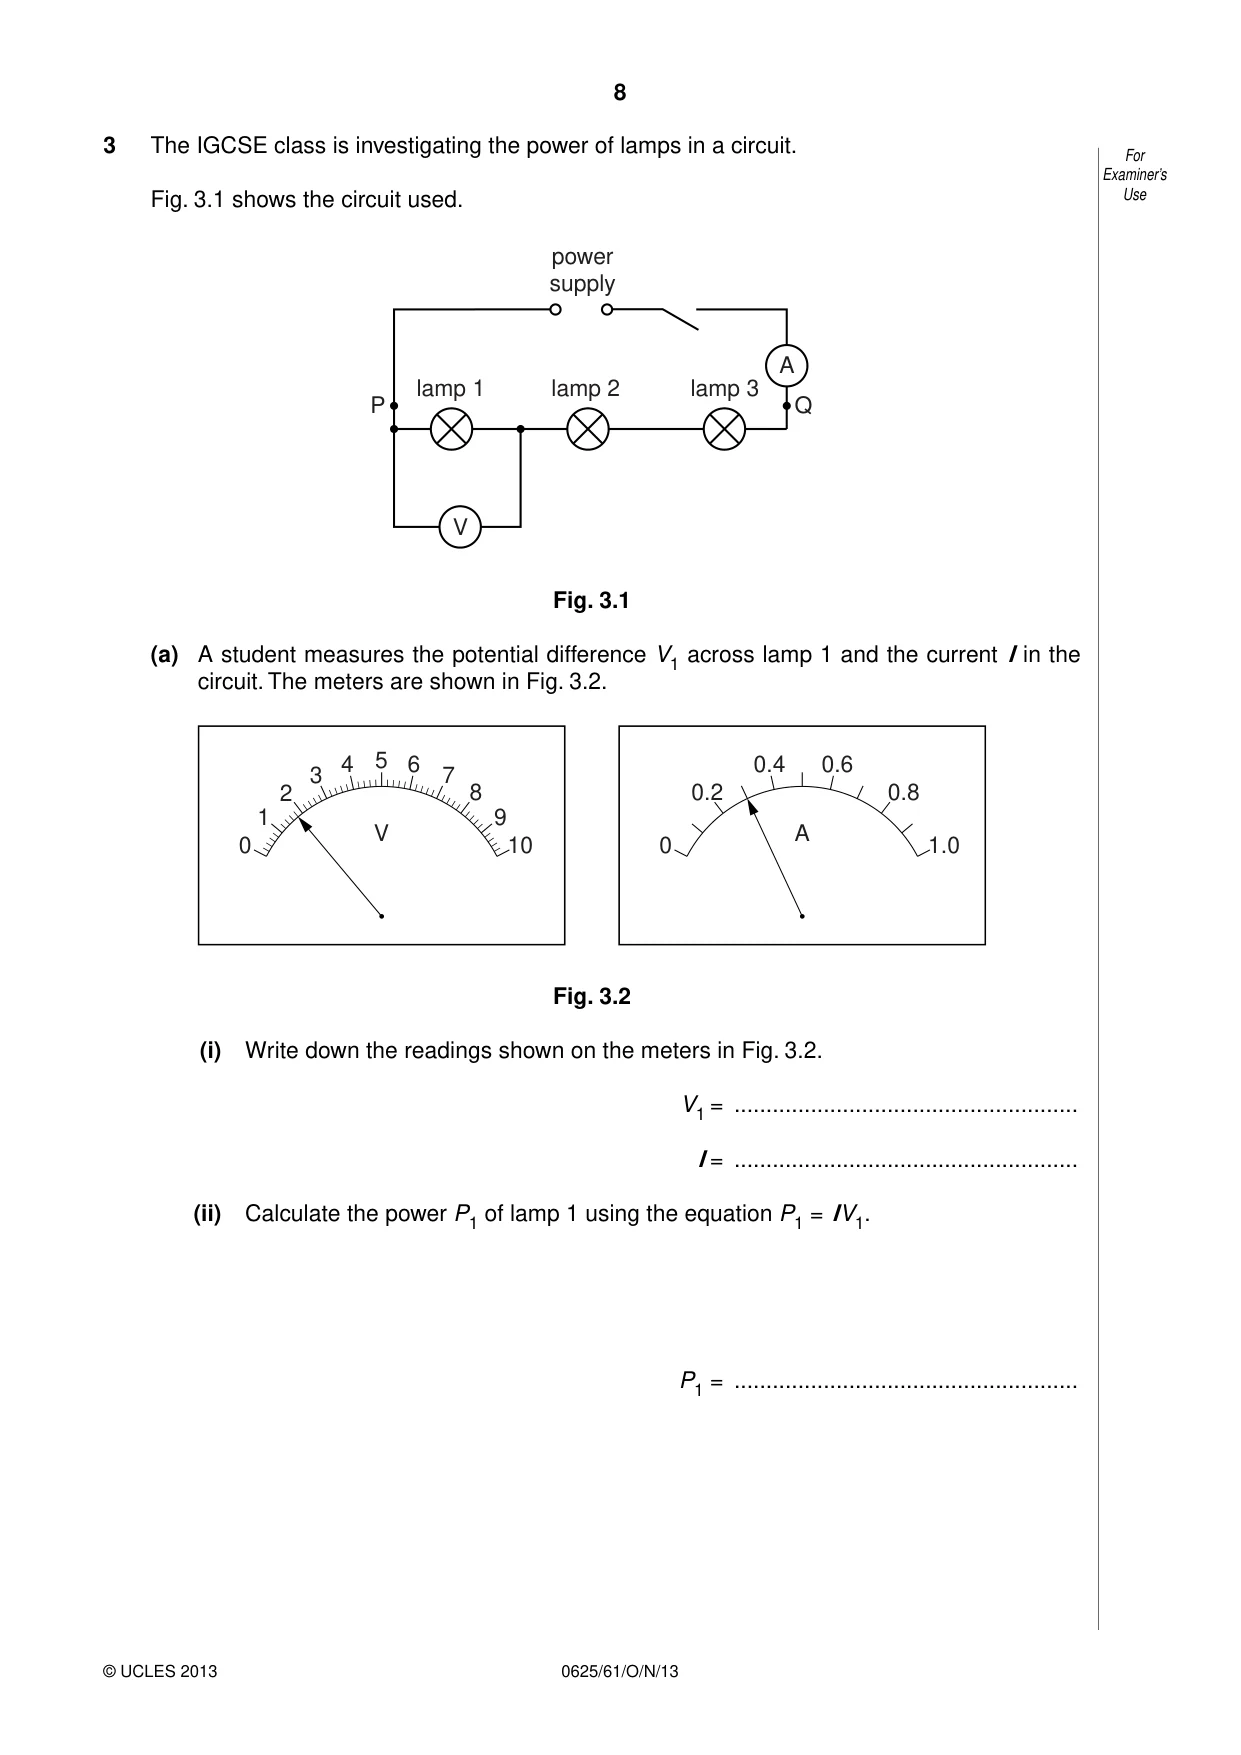
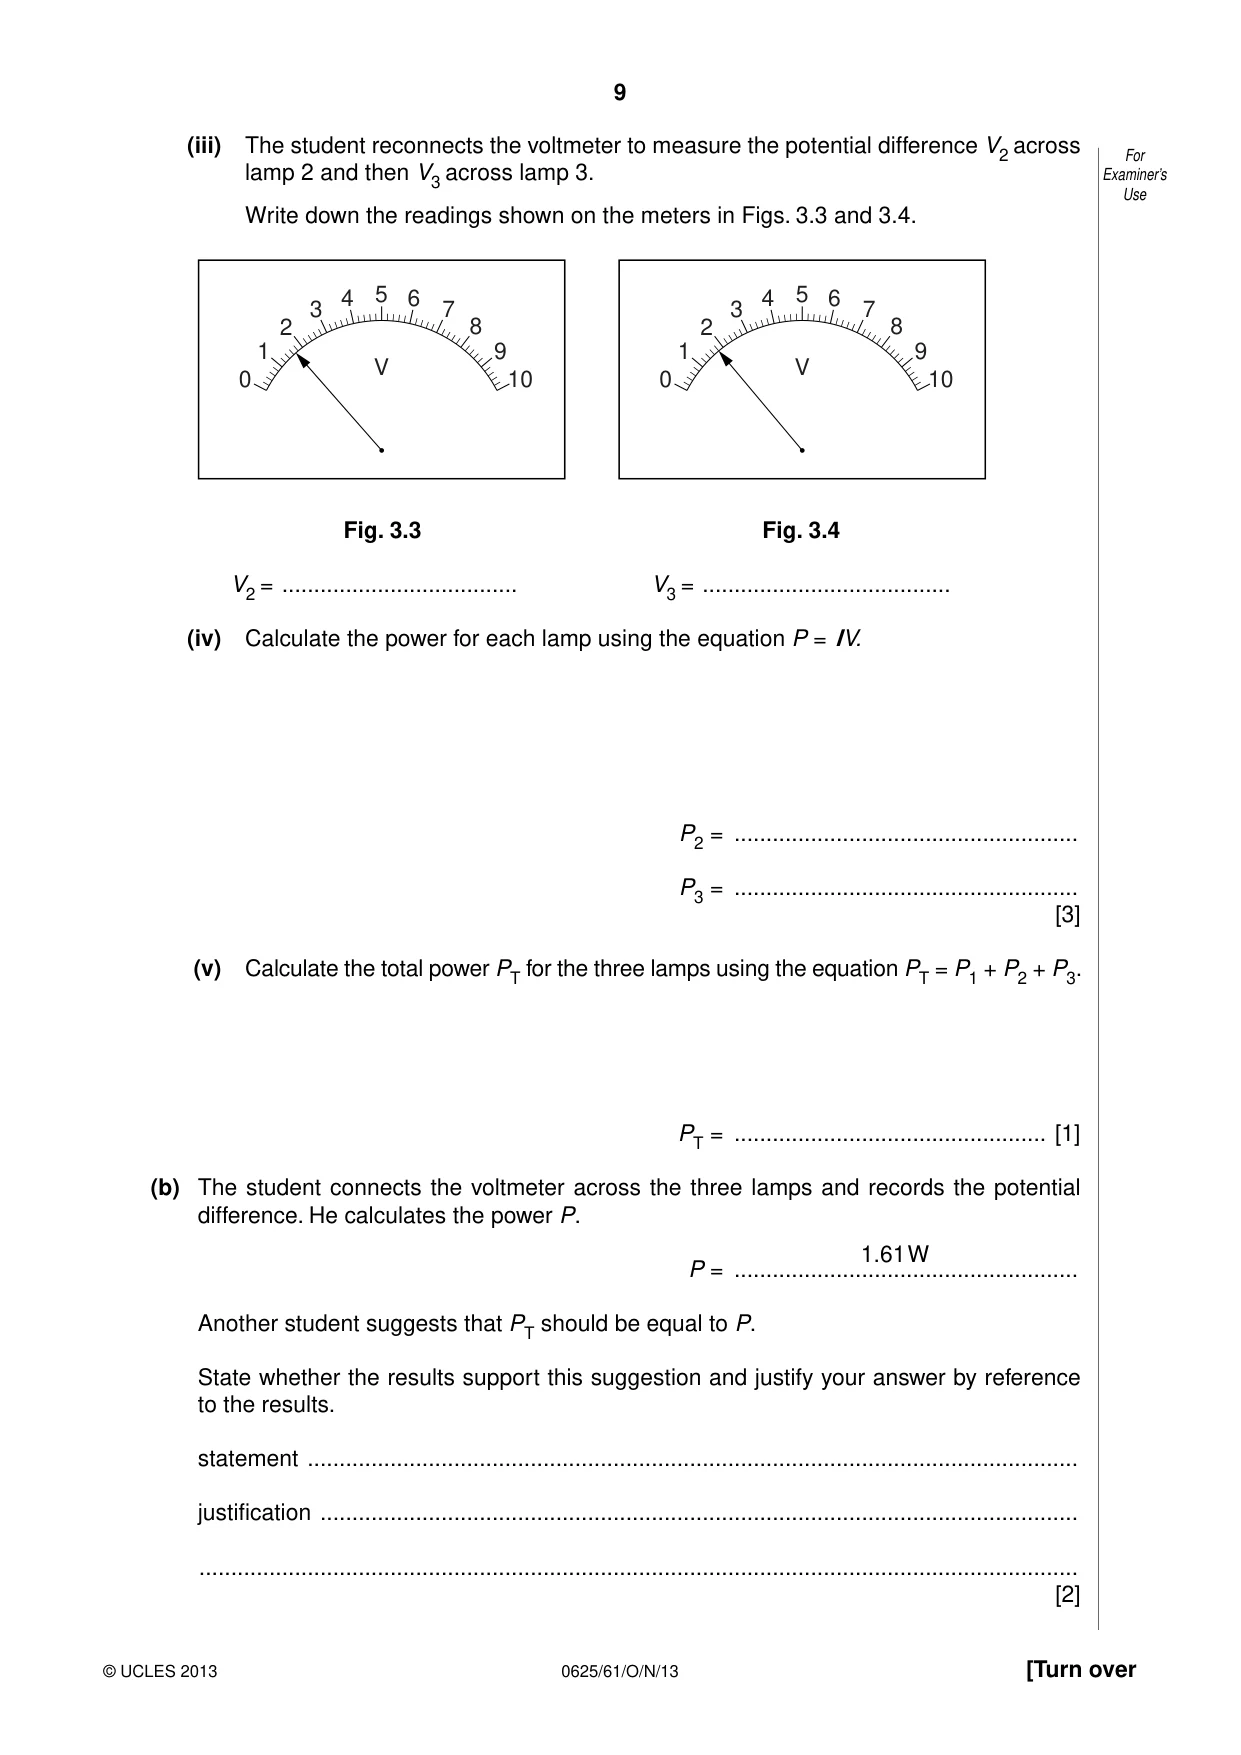
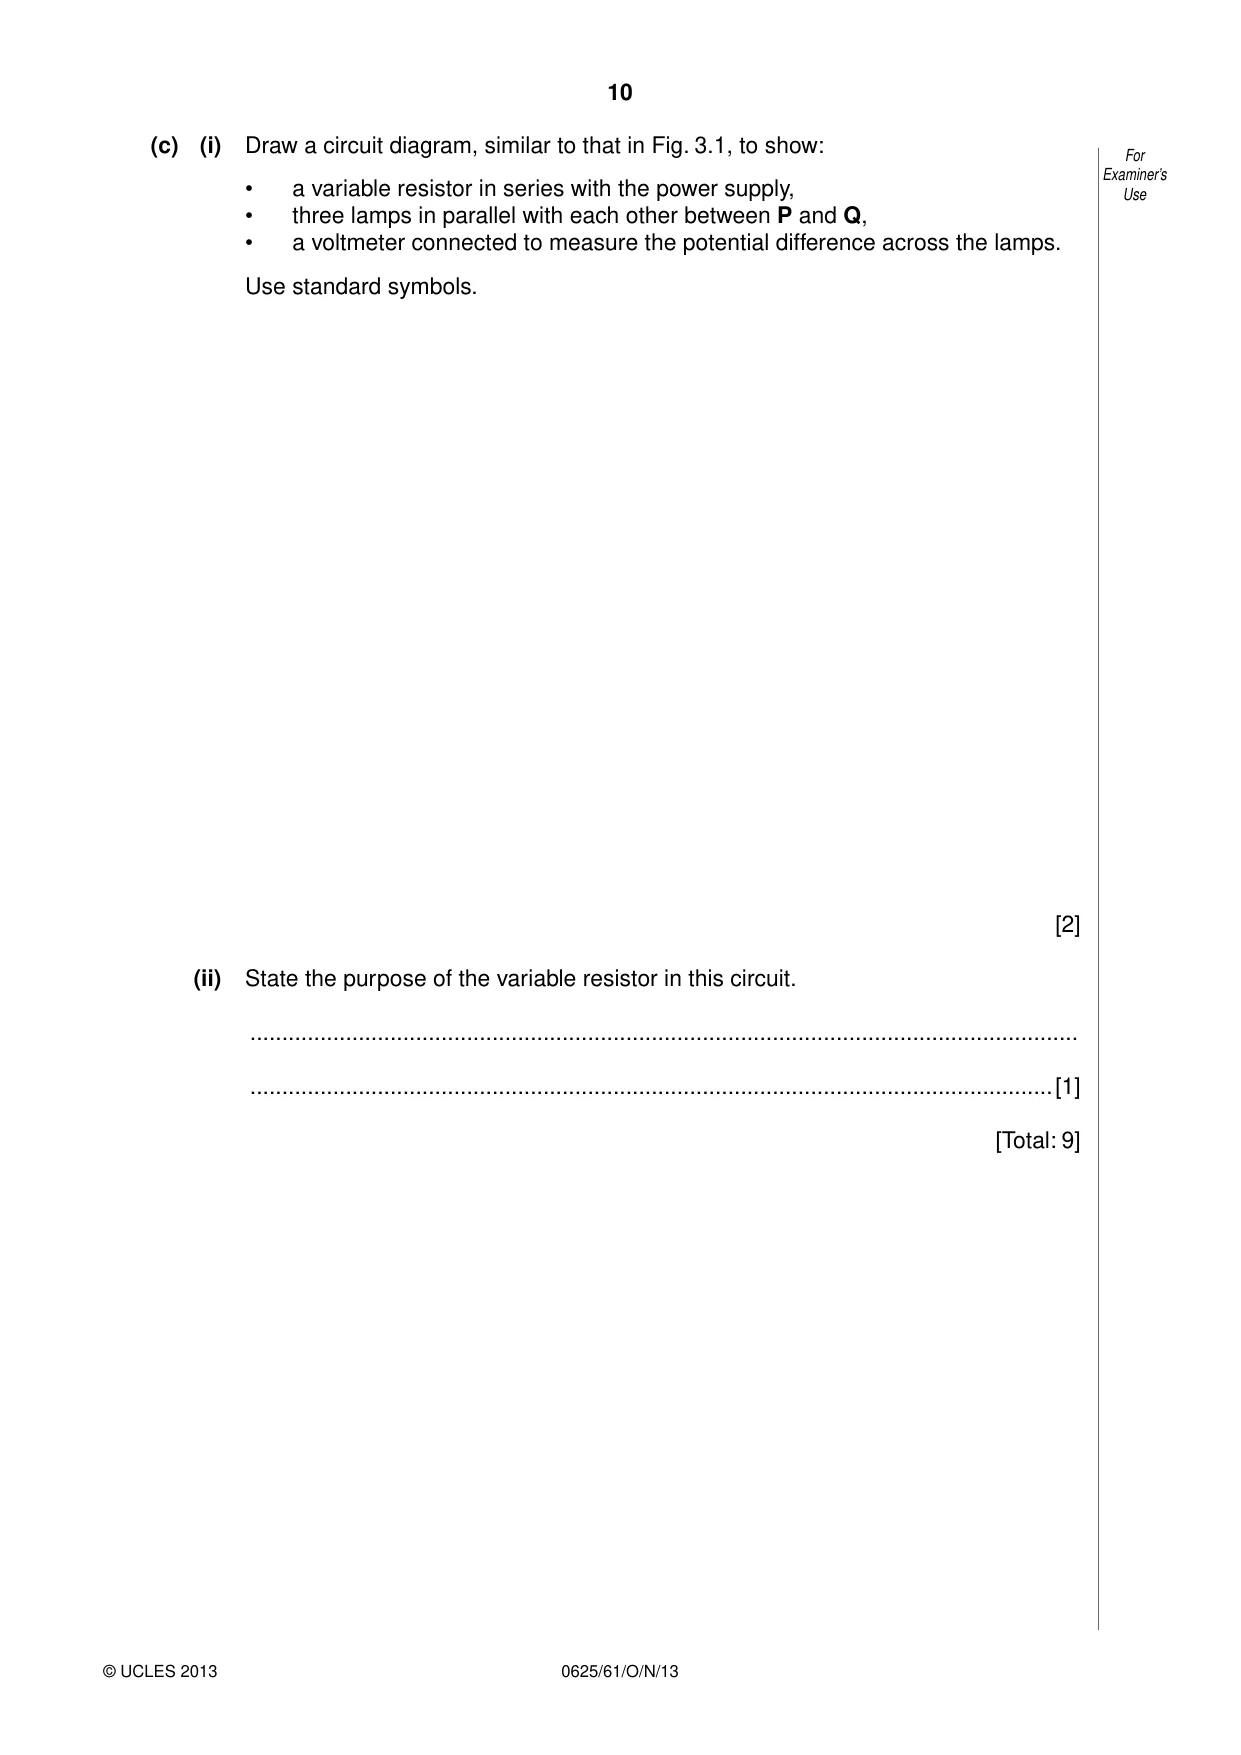
3 The IGCSE class is investigating the power of lamps in a circuit. For Examiner’s Fig. 3.1 shows the circuit used. Use power supply A lamp 1 lamp 2 lamp 3 P Q V Fig. 3.1 (a) A student measures the potential difference V1 across lamp 1 and the current I in the circuit. The meters are shown in Fig. 3.2. 4 5 6 0.4 0.6 3 7 2 8 0.2 0.8 1 9 V A 0 10 0 1.0 Fig. 3.2 (i) Write down the readings shown on the meters in Fig. 3.2. V1 = ...................................................... I = ...................................................... (ii) Calculate the power P1 of lamp 1 using the equation P1 = IV1. P1 = ...................................................... (iii) The student reconnects the voltmeter to measure the potential difference V2 across For Examiner’s lamp 2 and then V3 across lamp 3. Use Write down the readings shown on the meters in Figs. 3.3 and 3.4. 4 5 6 4 5 6 3 7 3 7 2 8 2 8 1 9 1 9 V V 0 10 0 10 Fig. 3.3 Fig. 3.4 V2 = ..................................... V3 = ....................................... (iv) Calculate the power for each lamp using the equation P = IV. P2 = ...................................................... P3 = ...................................................... [3] (v) Calculate the total power PT for the three lamps using the equation PT = P1 + P2 + P3. PT = ................................................. [1] (b) The student connects the voltmeter across the three lamps and records the potential difference. He calculates the power P. 1.61 W P = ...................................................... Another student suggests that PT should be equal to P. State whether the results support this suggestion and justify your answer by reference to the results. statement ......................................................................................................................... justification ....................................................................................................................... .......................................................................................................................................... [2] (c) (i) Draw a circuit diagram, similar to that in Fig. 3.1, to show: For Examiner’s • a variable resistor in series with the power supply, Use • three lamps in parallel with each other between P and Q, • a voltmeter connected to measure the potential difference across the lamps. Use standard symbols. [2] (ii) State the purpose of the variable resistor in this circuit. .................................................................................................................................. ..............................................................................................................................[1] [Total: 9] Question 4 begins on page 12.
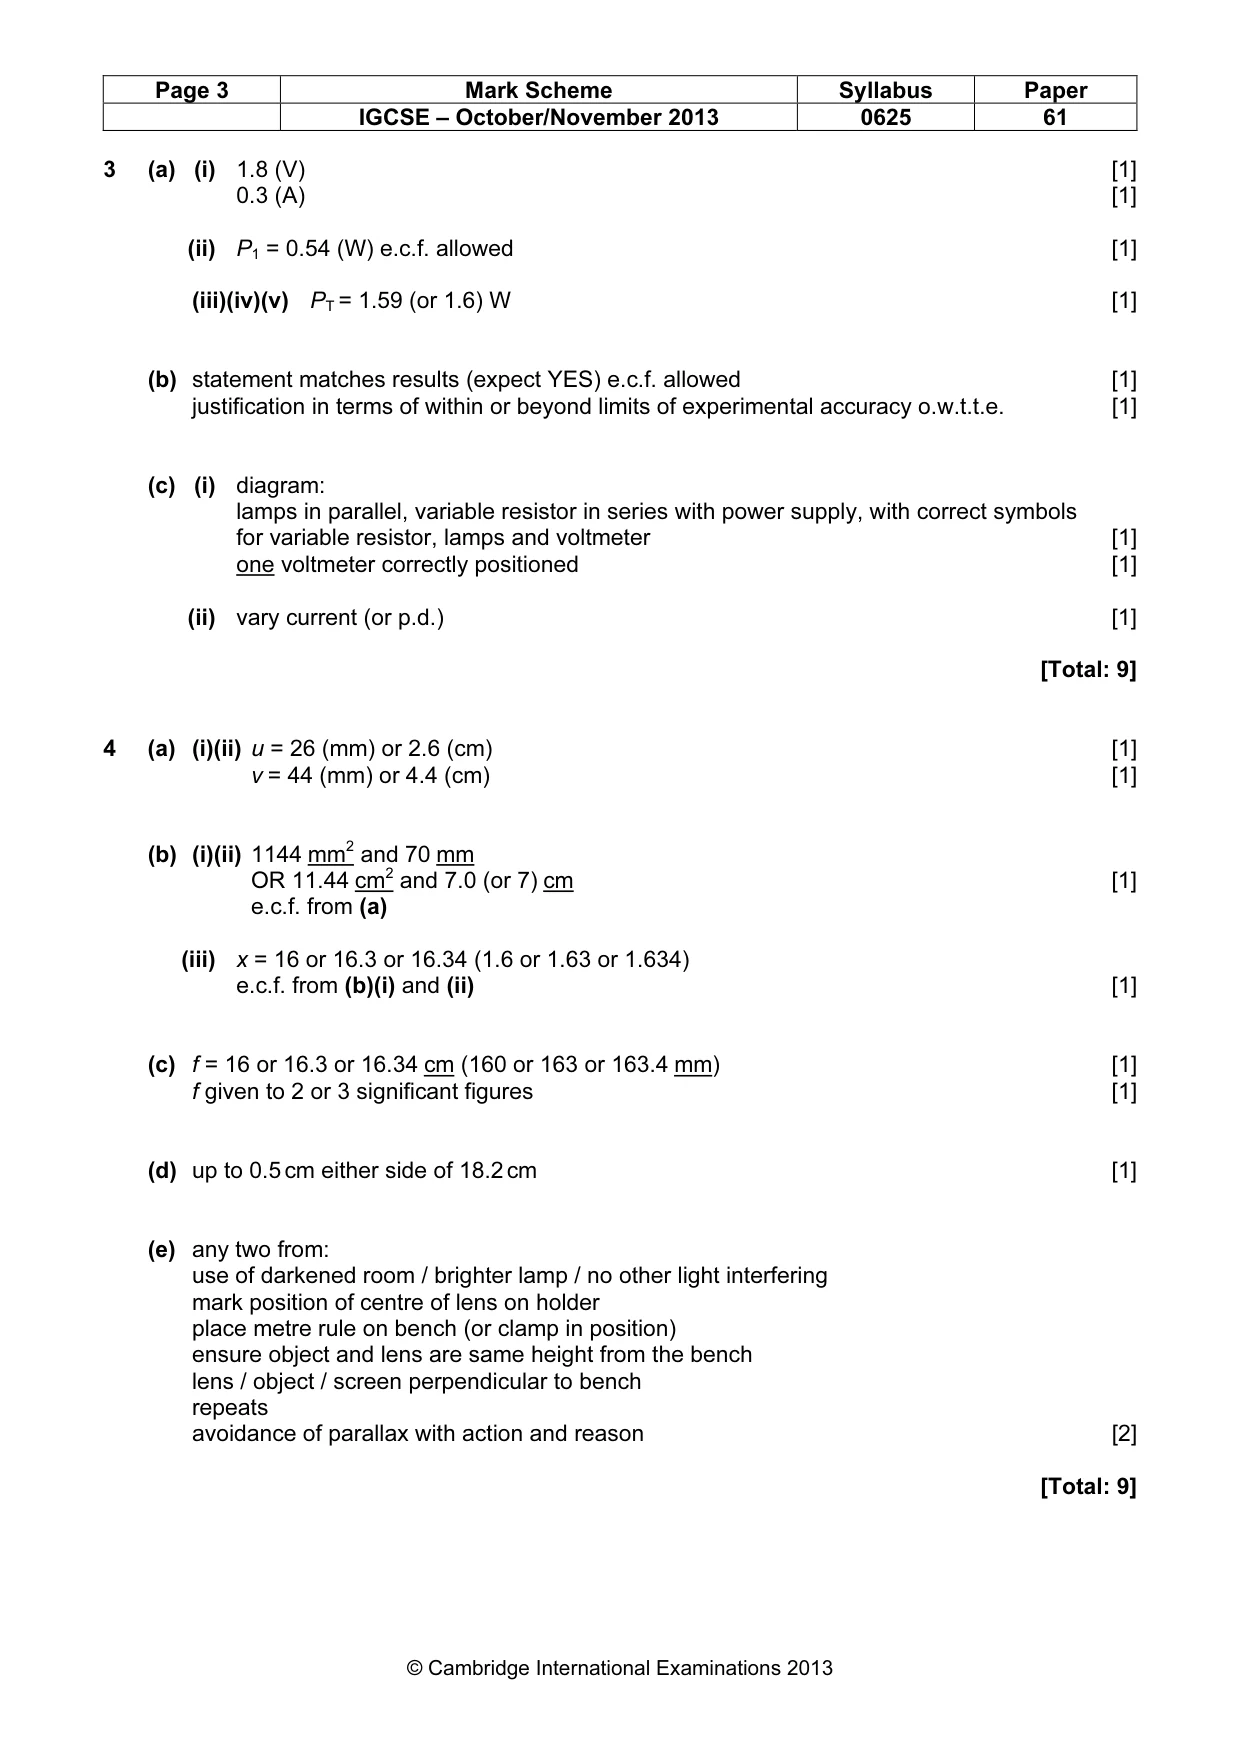
Mark scheme: 3 (a) (i) 1.8 (V) [1] 0.3 (A) [1] (ii) P1 = 0.54 (W) e.c.f. allowed [1] (iii)(iv)(v) PT = 1.59 (or 1.6) W [1] (b) statement matches results (expect YES) e.c.f. allowed [1] justification in terms of within or beyond limits of experimental accuracy o.w.t.t.e. [1] (c) (i) diagram: lamps in parallel, variable resistor in series with power supply, with correct symbols for variable resistor, lamps and voltmeter [1] one voltmeter correctly positioned [1] (ii) vary current (or p.d.) [1] [Total: 9]
Q4 · The IGCSE class is determining the focal length of a converging lens
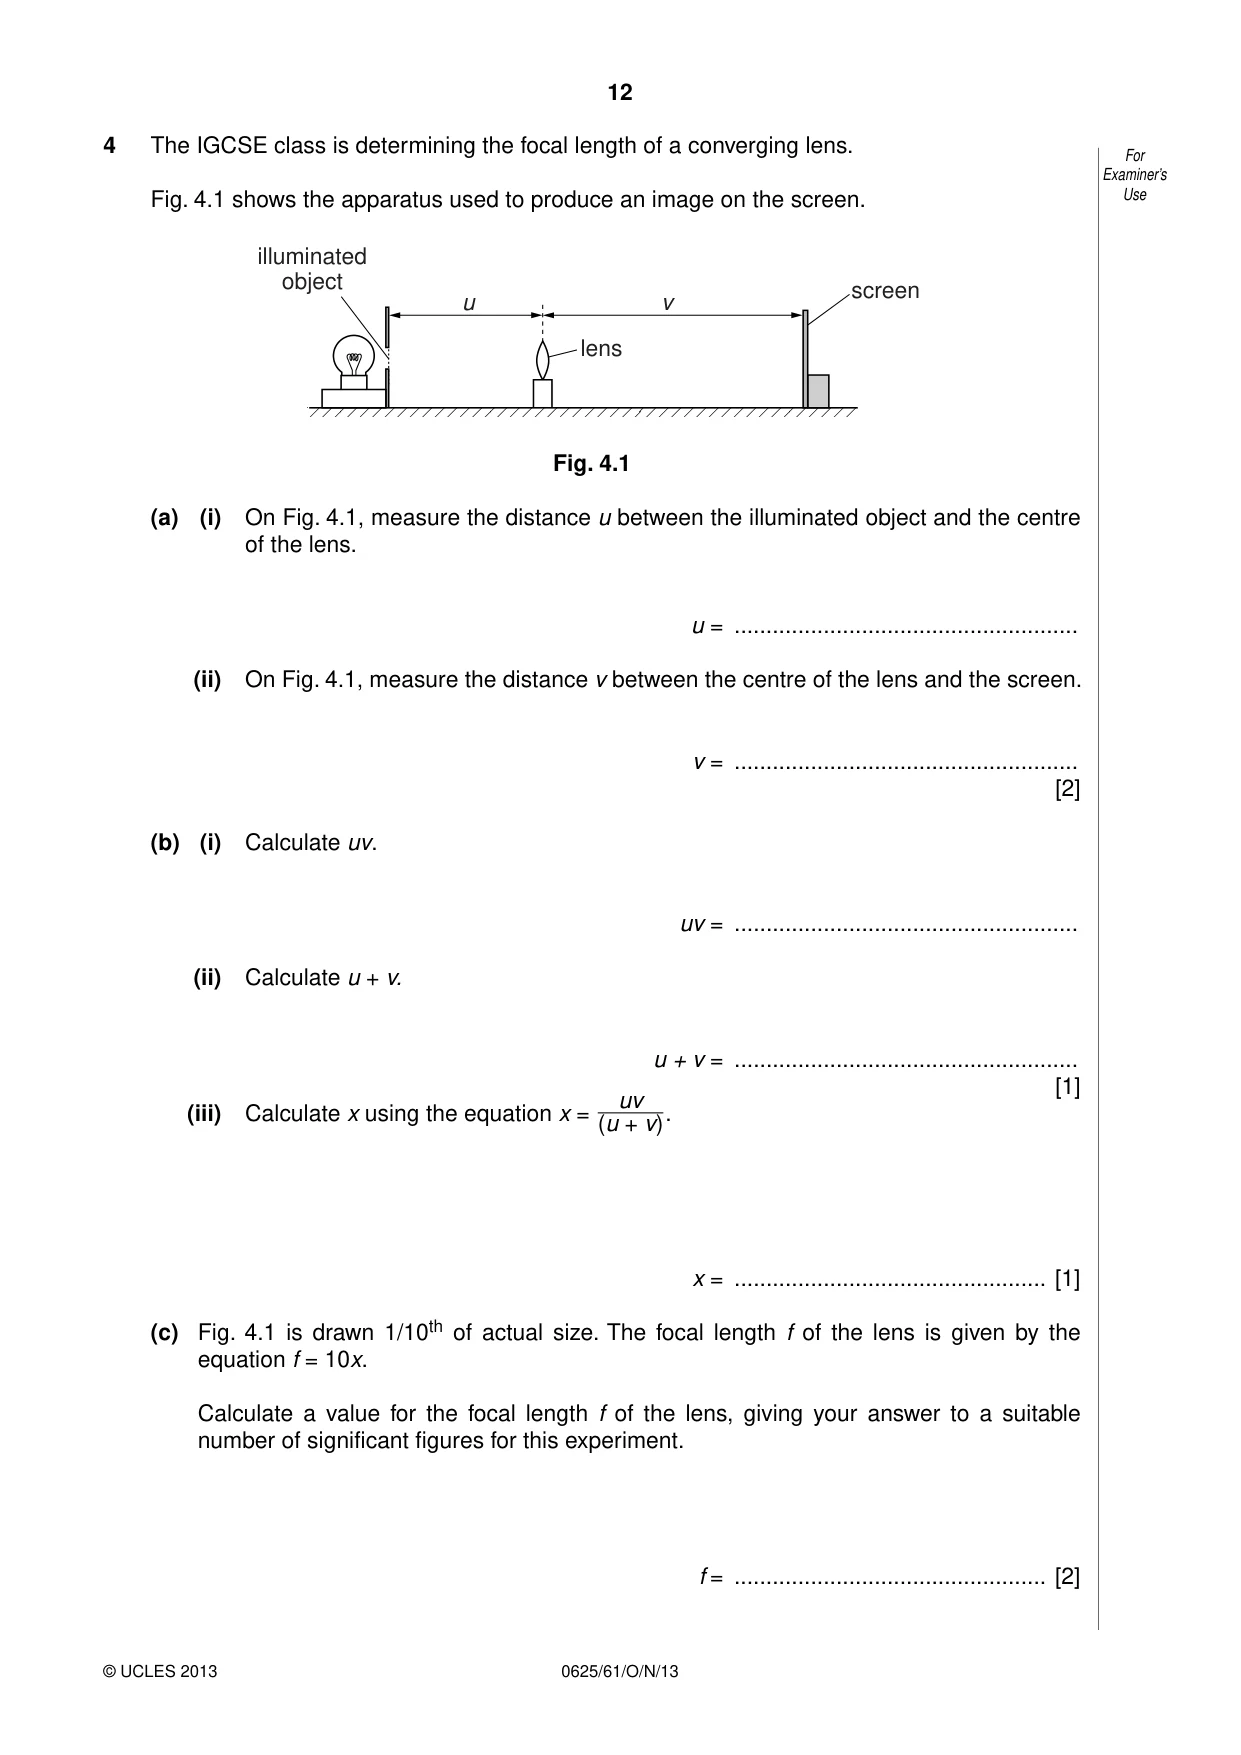
4 The IGCSE class is determining the focal length of a converging lens. For Examiner’s Fig. 4.1 shows the apparatus used to produce an image on the screen. Use illuminated object screen u v lens Fig. 4.1 (a) (i) On Fig. 4.1, measure the distance u between the illuminated object and the centre of the lens. u = ...................................................... (ii) On Fig. 4.1, measure the distance v between the centre of the lens and the screen. v = ...................................................... [2] (b) (i) Calculate uv. uv = ...................................................... (ii) Calculate u + v. u + v = ...................................................... [1] uv (iii) Calculate x using the equation x = (u + v). x = ................................................. [1] (c) Fig. 4.1 is drawn 1/10th of actual size. The focal length f of the lens is given by the equation f = 10x. Calculate a value for the focal length f of the lens, giving your answer to a suitable number of significant figures for this experiment. f = ................................................. [2] (d) A student carrying out this experiment changes the position of the lens and then moves For the screen to produce a well-focused image. Examiner’s Use She records the distance v between the centre of the lens and the screen as v = 18.2 cm. She finds it difficult to decide the exact point at which the image is sharpest. Suggest a range of v values for which the image may appear well-focused. range of v values = ........................... to ........................... [1] (e) State two precautions that you could take in this experiment to obtain reliable results. 1. ...................................................................................................................................... .......................................................................................................................................... 2. ...................................................................................................................................... .......................................................................................................................................... [2] [Total: 9]
Mark scheme: 4 (a) (i)(ii) u = 26 (mm) or 2.6 (cm) [1] v = 44 (mm) or 4.4 (cm) [1] (b) (i)(ii) 1144 mm2 and 70 mm OR 11.44 cm2 and 7.0 (or 7) cm [1] e.c.f. from (a) (iii) x = 16 or 16.3 or 16.34 (1.6 or 1.63 or 1.634) e.c.f. from (b)(i) and (ii) [1] (c) f = 16 or 16.3 or 16.34 cm (160 or 163 or 163.4 mm) [1] f given to 2 or 3 significant figures [1] (d) up to 0.5 cm either side of 18.2 cm [1] (e) any two from: use of darkened room / brighter lamp / no other light interfering mark position of centre of lens on holder place metre rule on bench (or clamp in position) ensure object and lens are same height from the bench lens / object / screen perpendicular to bench repeats avoidance of parallax with action and reason [2] [Total: 9] IGCSE – October/November 2013 0625 61
More questions on Physical quantities and measurement techniques
Q5 · The IGCSE class is investigating the stretching of a spring
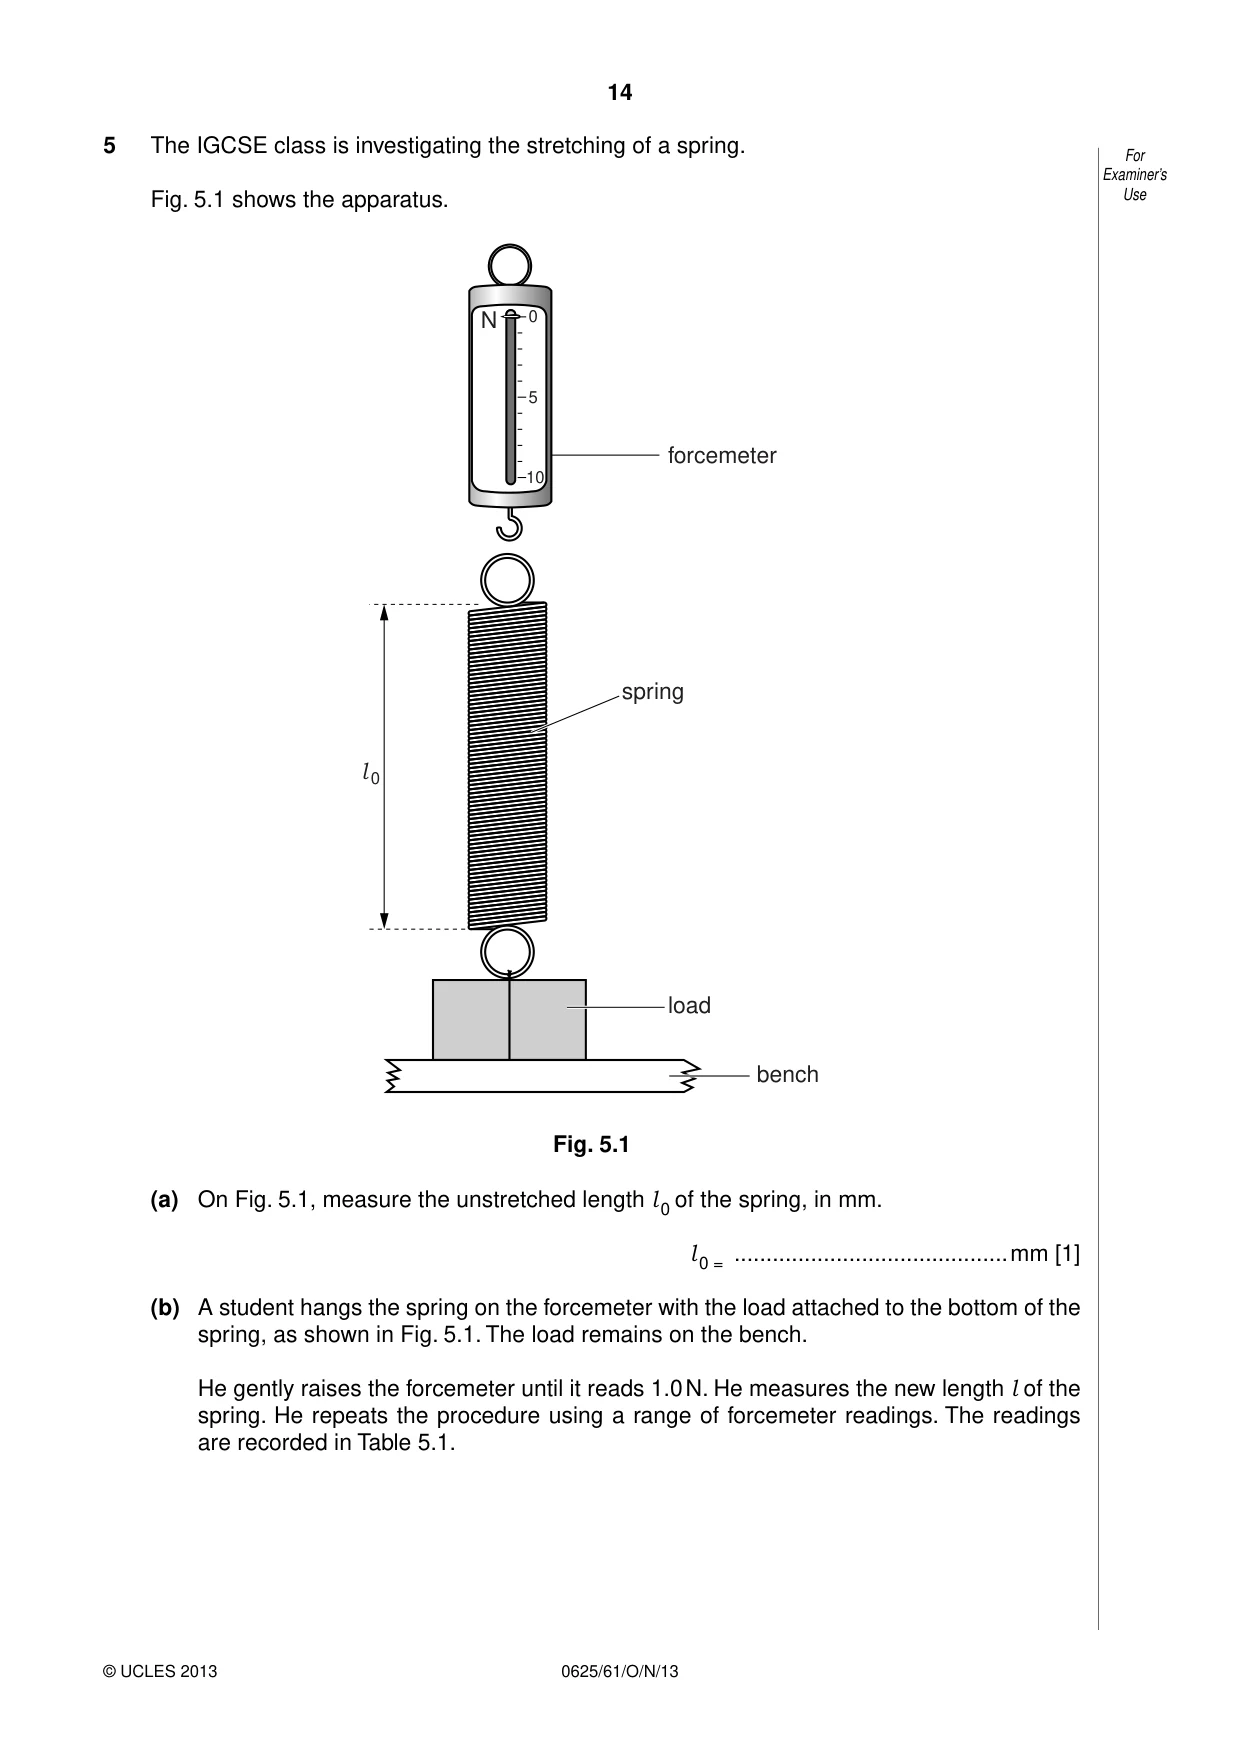
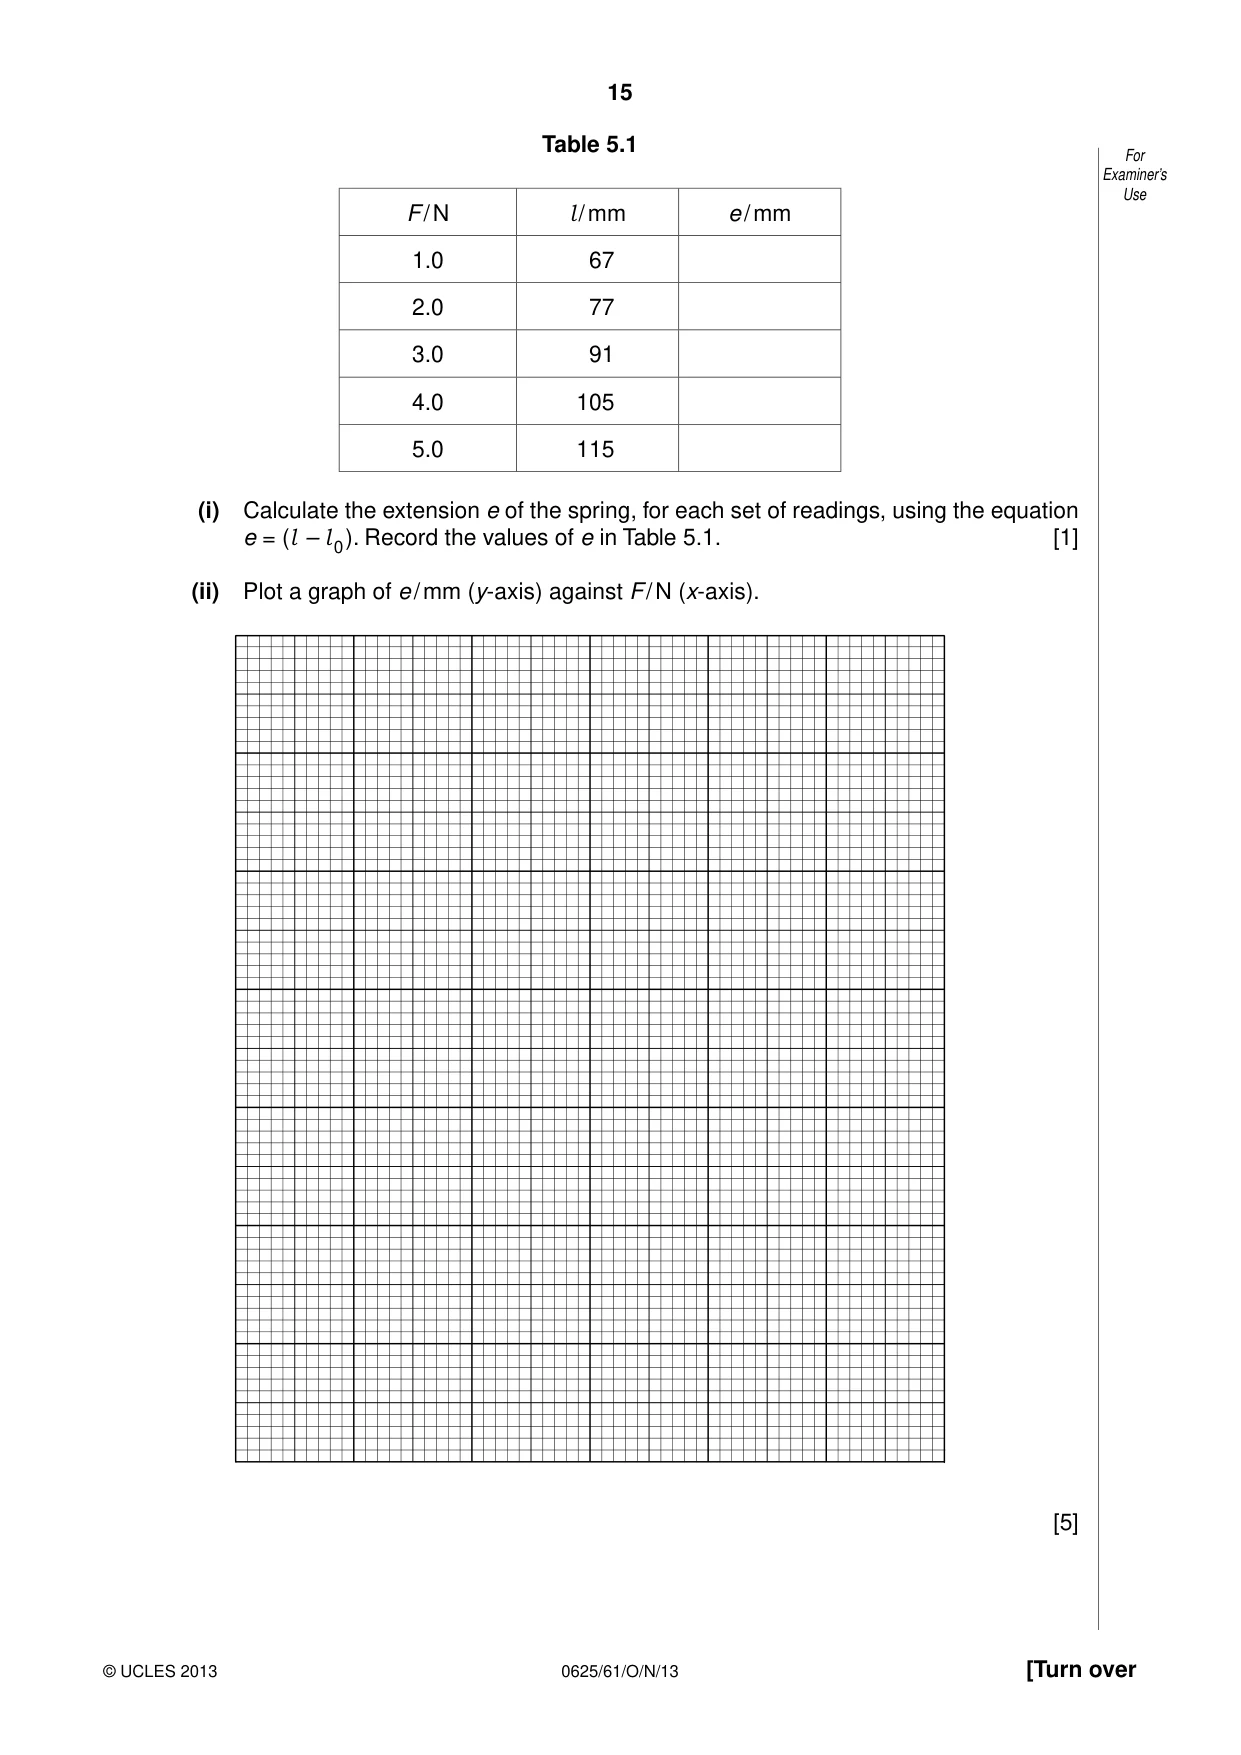
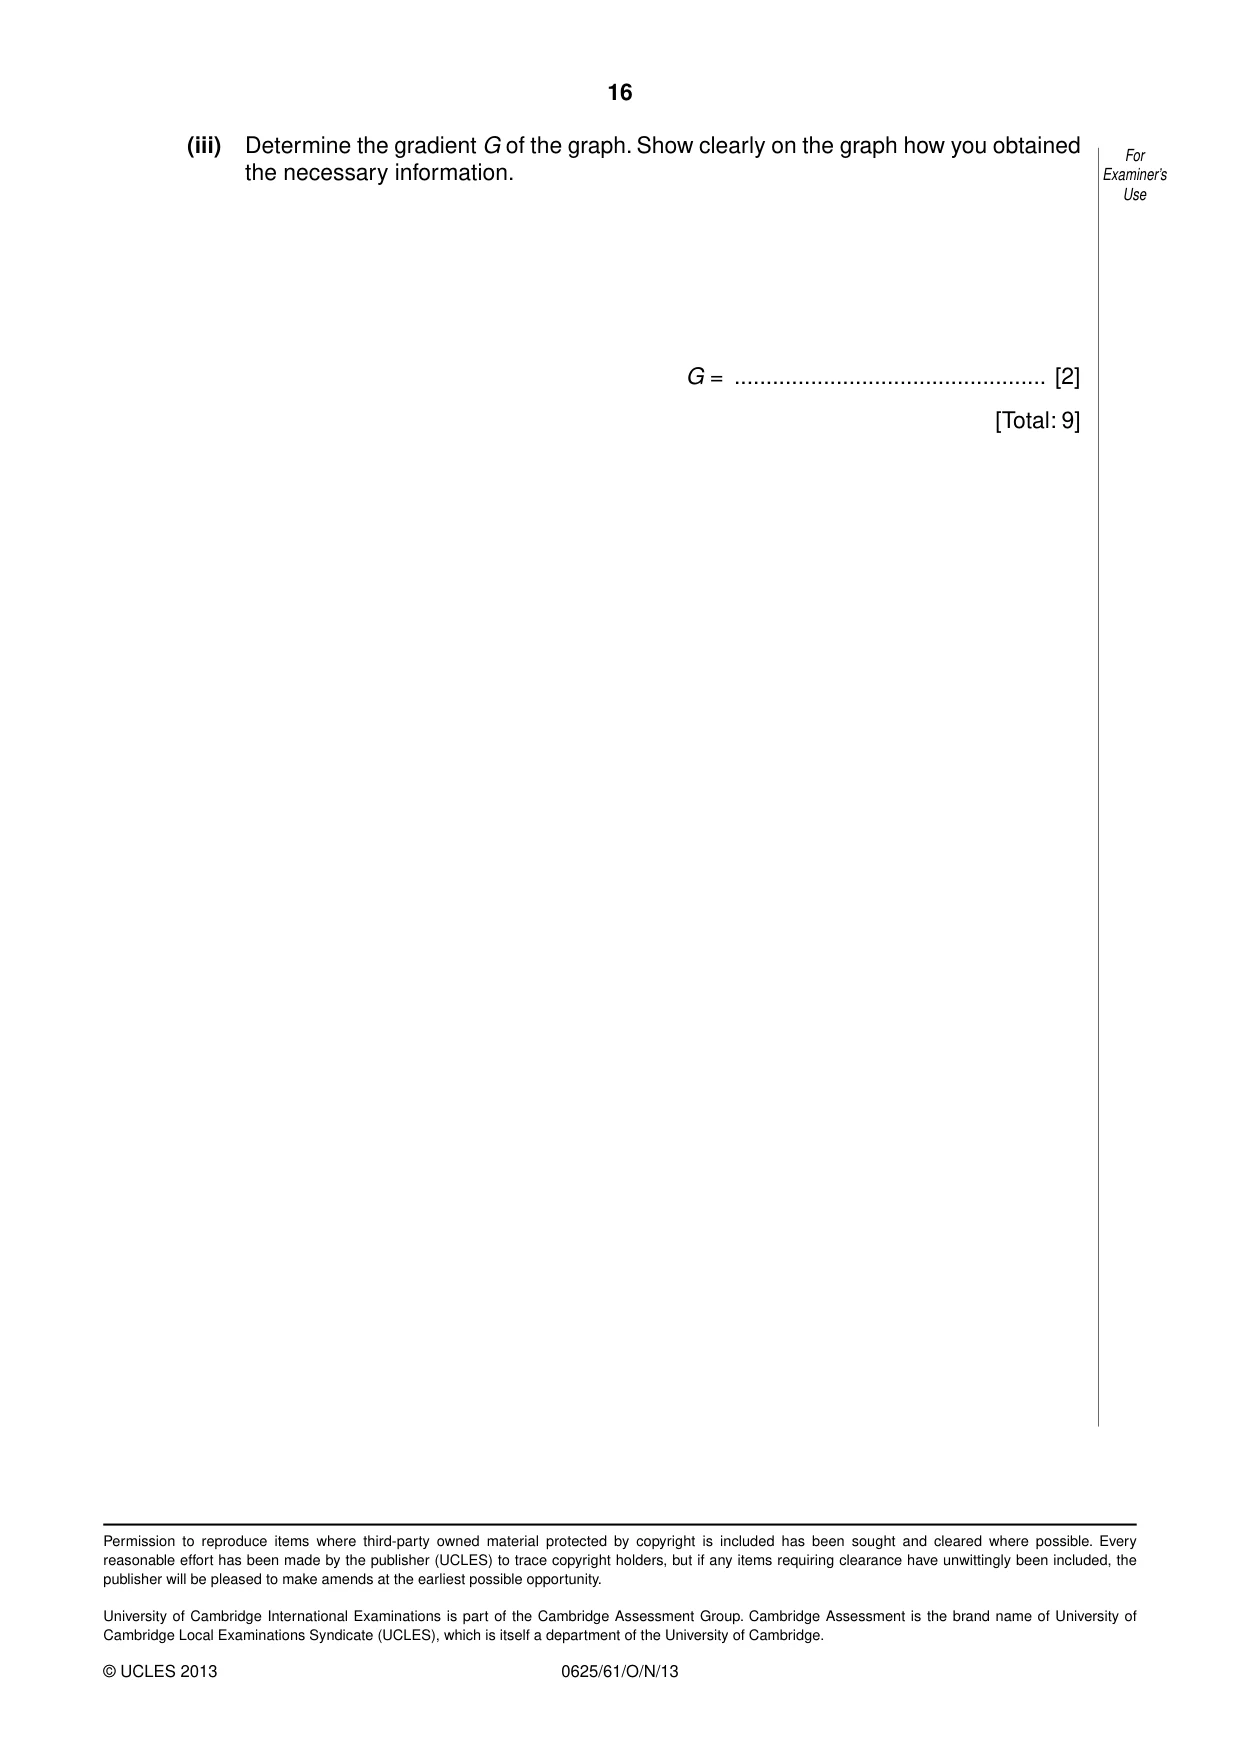
5 The IGCSE class is investigating the stretching of a spring. For Examiner’s Fig. 5.1 shows the apparatus. Use N 0 5 forcemeter 10 spring l 0 load bench Fig. 5.1 (a) On Fig. 5.1, measure the unstretched length l of the spring, in mm. 0 l ...........................................mm [1] 0 = (b) A student hangs the spring on the forcemeter with the load attached to the bottom of the spring, as shown in Fig. 5.1. The load remains on the bench. He gently raises the forcemeter until it reads 1.0 N. He measures the new length l of the spring. He repeats the procedure using a range of forcemeter readings. The readings are recorded in Table 5.1. Table 5.1 For Examiner’s Use F / N l / mm e / mm 1.0 67 2.0 77 3.0 91 4.0 105 5.0 115 (i) Calculate the extension e of the spring, for each set of readings, using the equation e = (l – l ). Record the values of e in Table 5.1. [1] 0 (ii) Plot a graph of e / mm (y-axis) against F / N (x-axis). [5] (iii) Determine the gradient G of the graph. Show clearly on the graph how you obtained For the necessary information. Examiner’s Use G = ................................................. [2] [Total: 9]
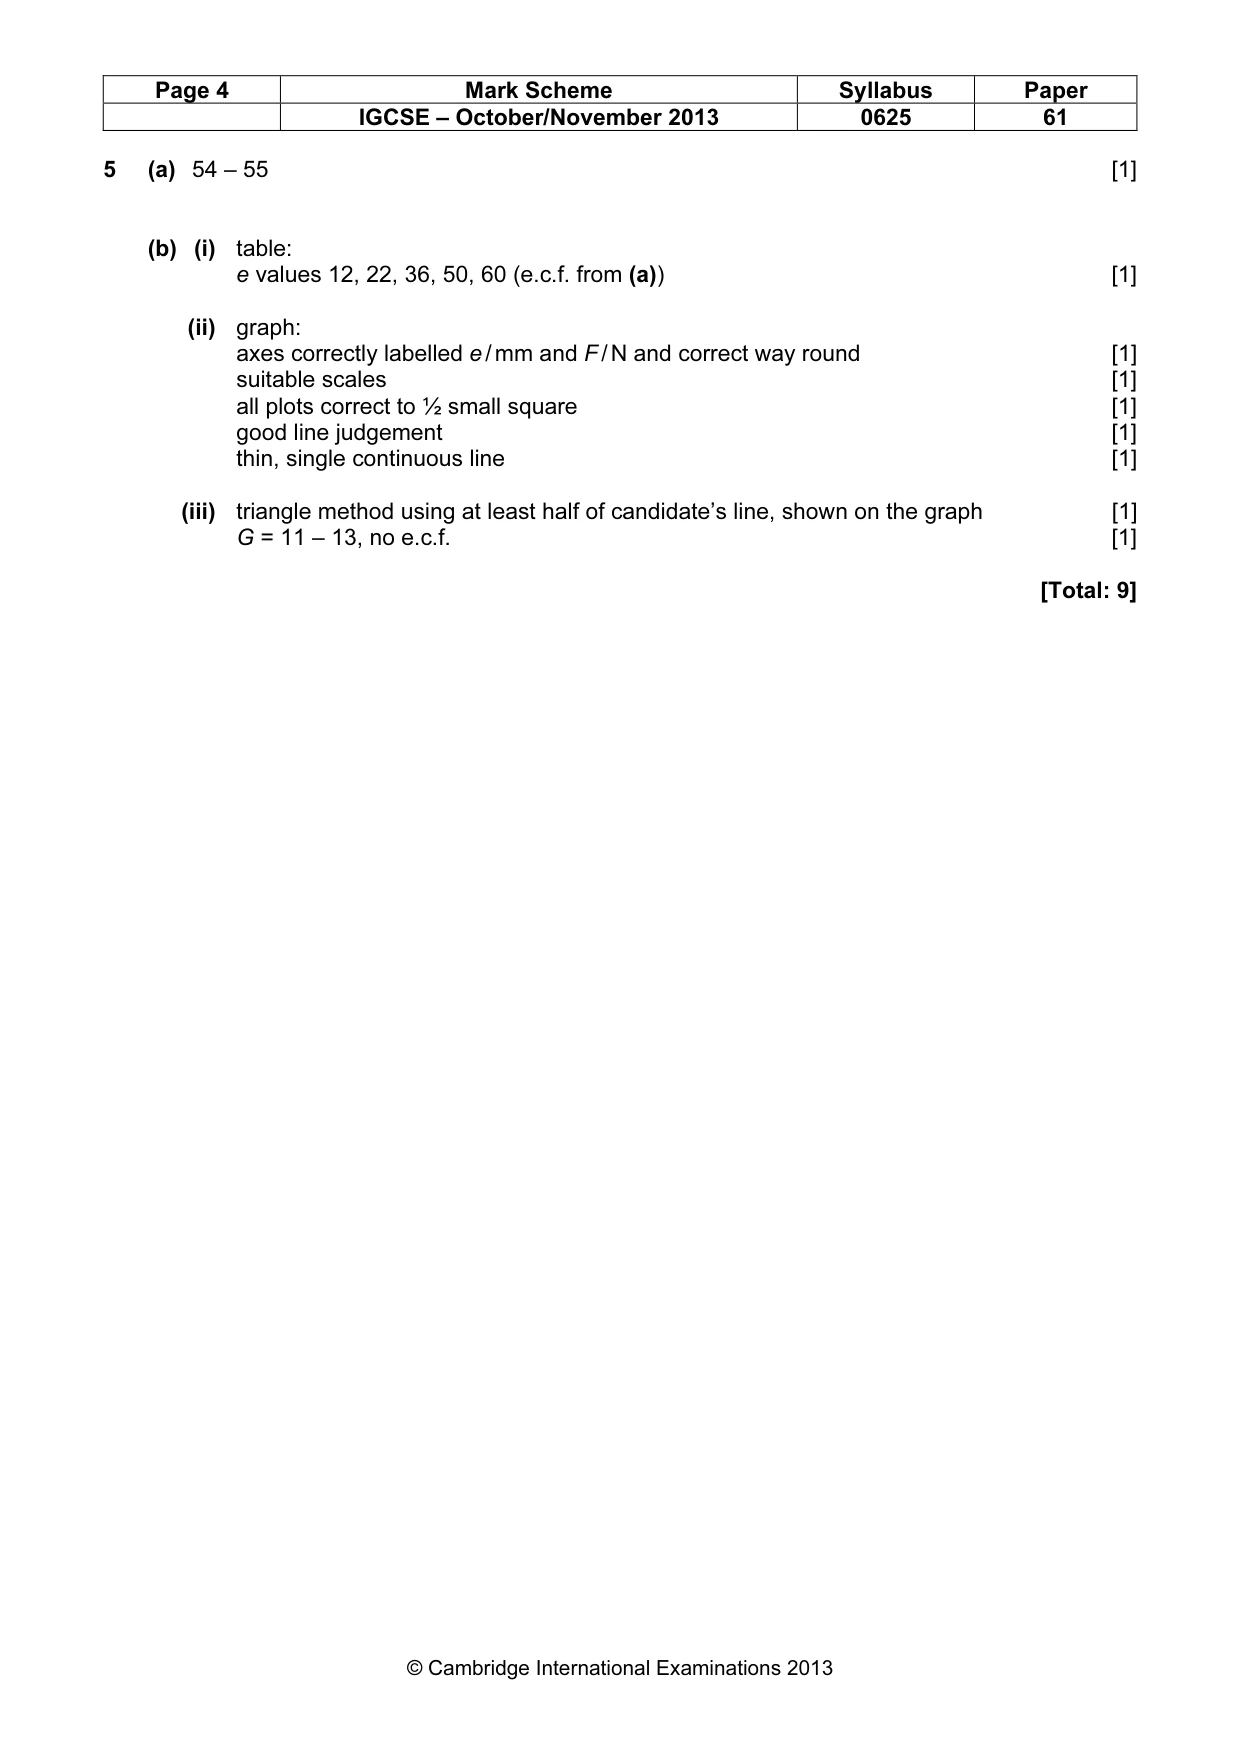
Mark scheme: 5 (a) 54 – 55 [1] (b) (i) table: e values 12, 22, 36, 50, 60 (e.c.f. from (a)) [1] (ii) graph: axes correctly labelled e / mm and F / N and correct way round [1] suitable scales [1] all plots correct to ½ small square [1] good line judgement [1] thin, single continuous line [1] (iii) triangle method using at least half of candidate’s line, shown on the graph [1] G = 11 – 13, no e.c.f. [1] [Total: 9]
What was in this paper
The subtopics covered by these 5 questions, and how many questions each got. Open one in a new tab to see every Cambridge question on it.