Cambridge IGCSE Physics 0625 — 2013 Oct/Nov Paper 6 · Variant 2
0625/62/O/N/13 · 5 questions · 40 marks · ≈45 min
The question paper and its mark scheme, free to read here and free to download. This is Cambridge’s own paper, exactly as it was sat.
Question paper16 pages



Mark scheme4 pages
Answers below. Sit the paper first if you are practising.
Questions as text
Q1 · The IGCSE class is investigating pendulums
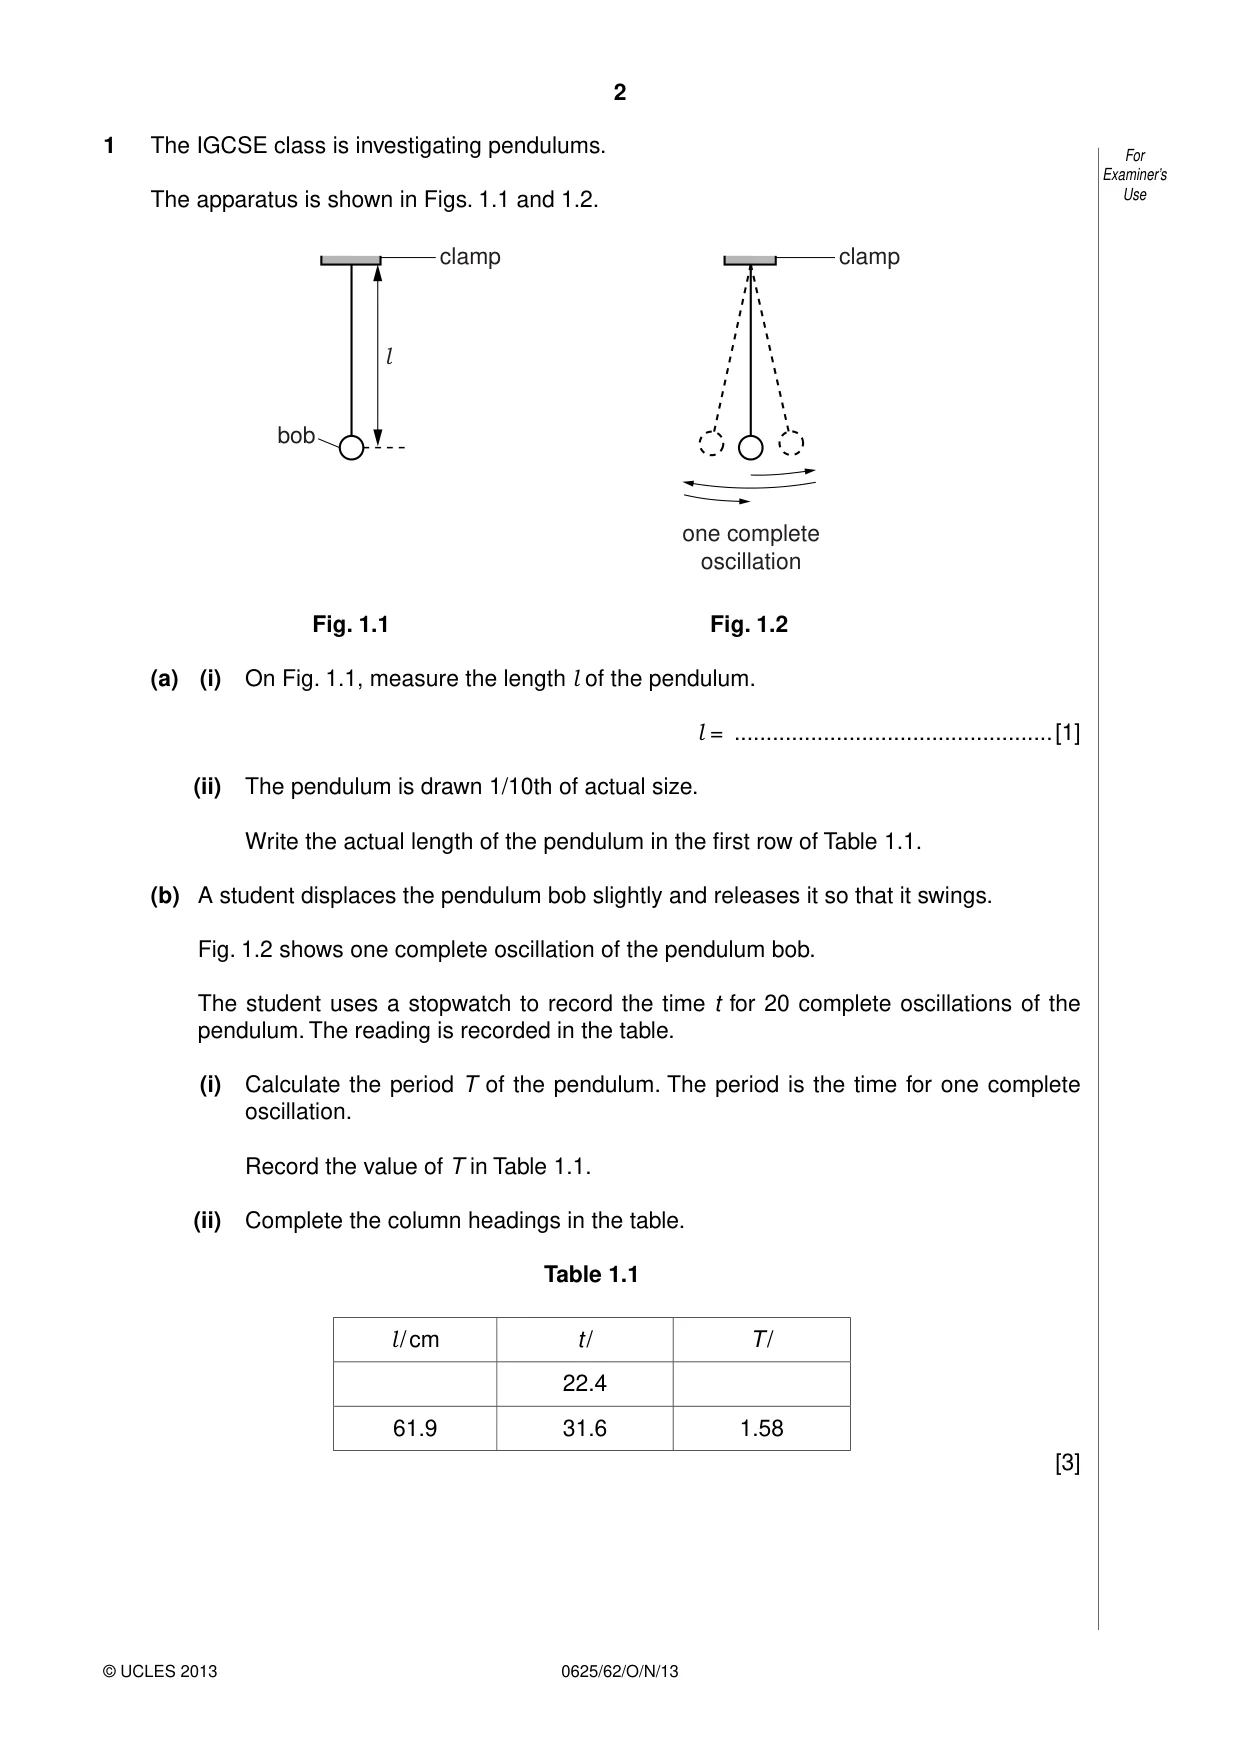
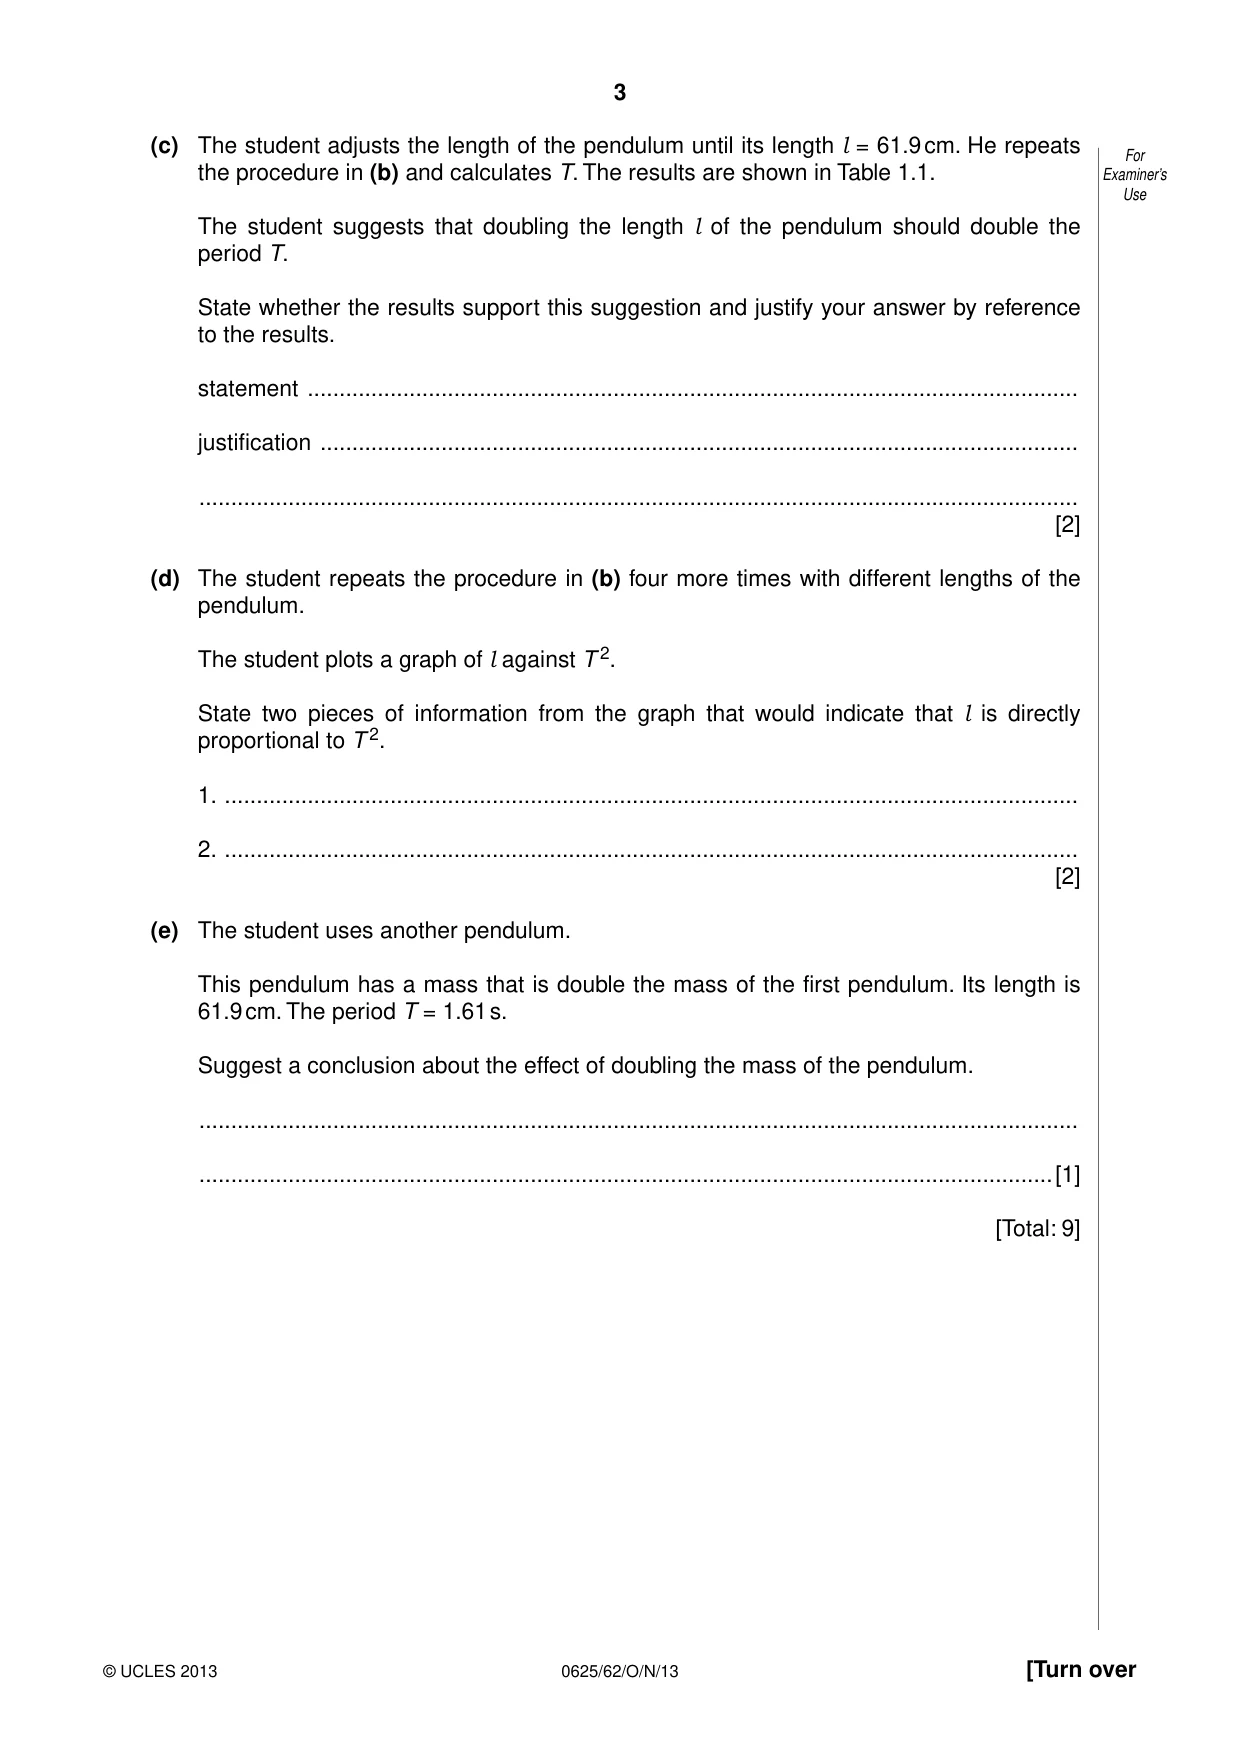
1 The IGCSE class is investigating pendulums. For Examiner’s The apparatus is shown in Figs. 1.1 and 1.2. Use clamp clamp l bob one complete oscillation Fig. 1.1 Fig. 1.2 (a) (i) On Fig. 1.1, measure the length l of the pendulum. l = ..................................................[1] (ii) The pendulum is drawn 1/10th of actual size. Write the actual length of the pendulum in the first row of Table 1.1. (b) A student displaces the pendulum bob slightly and releases it so that it swings. Fig. 1.2 shows one complete oscillation of the pendulum bob. The student uses a stopwatch to record the time t for 20 complete oscillations of the pendulum. The reading is recorded in the table. (i) Calculate the period T of the pendulum. The period is the time for one complete oscillation. Record the value of T in Table 1.1. (ii) Complete the column headings in the table. Table 1.1 l / cm t / T / 22.4 61.9 31.6 1.58 [3] (c) The student adjusts the length of the pendulum until its length l = 61.9 cm. He repeats For the procedure in (b) and calculates T. The results are shown in Table 1.1. Examiner’s Use The student suggests that doubling the length l of the pendulum should double the period T. State whether the results support this suggestion and justify your answer by reference to the results. statement ......................................................................................................................... justification ....................................................................................................................... .......................................................................................................................................... [2] (d) The student repeats the procedure in (b) four more times with different lengths of the pendulum. The student plots a graph of l against T 2. State two pieces of information from the graph that would indicate that l is directly proportional to T 2. 1. ...................................................................................................................................... 2. ...................................................................................................................................... [2] (e) The student uses another pendulum. This pendulum has a mass that is double the mass of the first pendulum. Its length is 61.9 cm. The period T = 1.61 s. Suggest a conclusion about the effect of doubling the mass of the pendulum. .......................................................................................................................................... ......................................................................................................................................[1] [Total: 9]
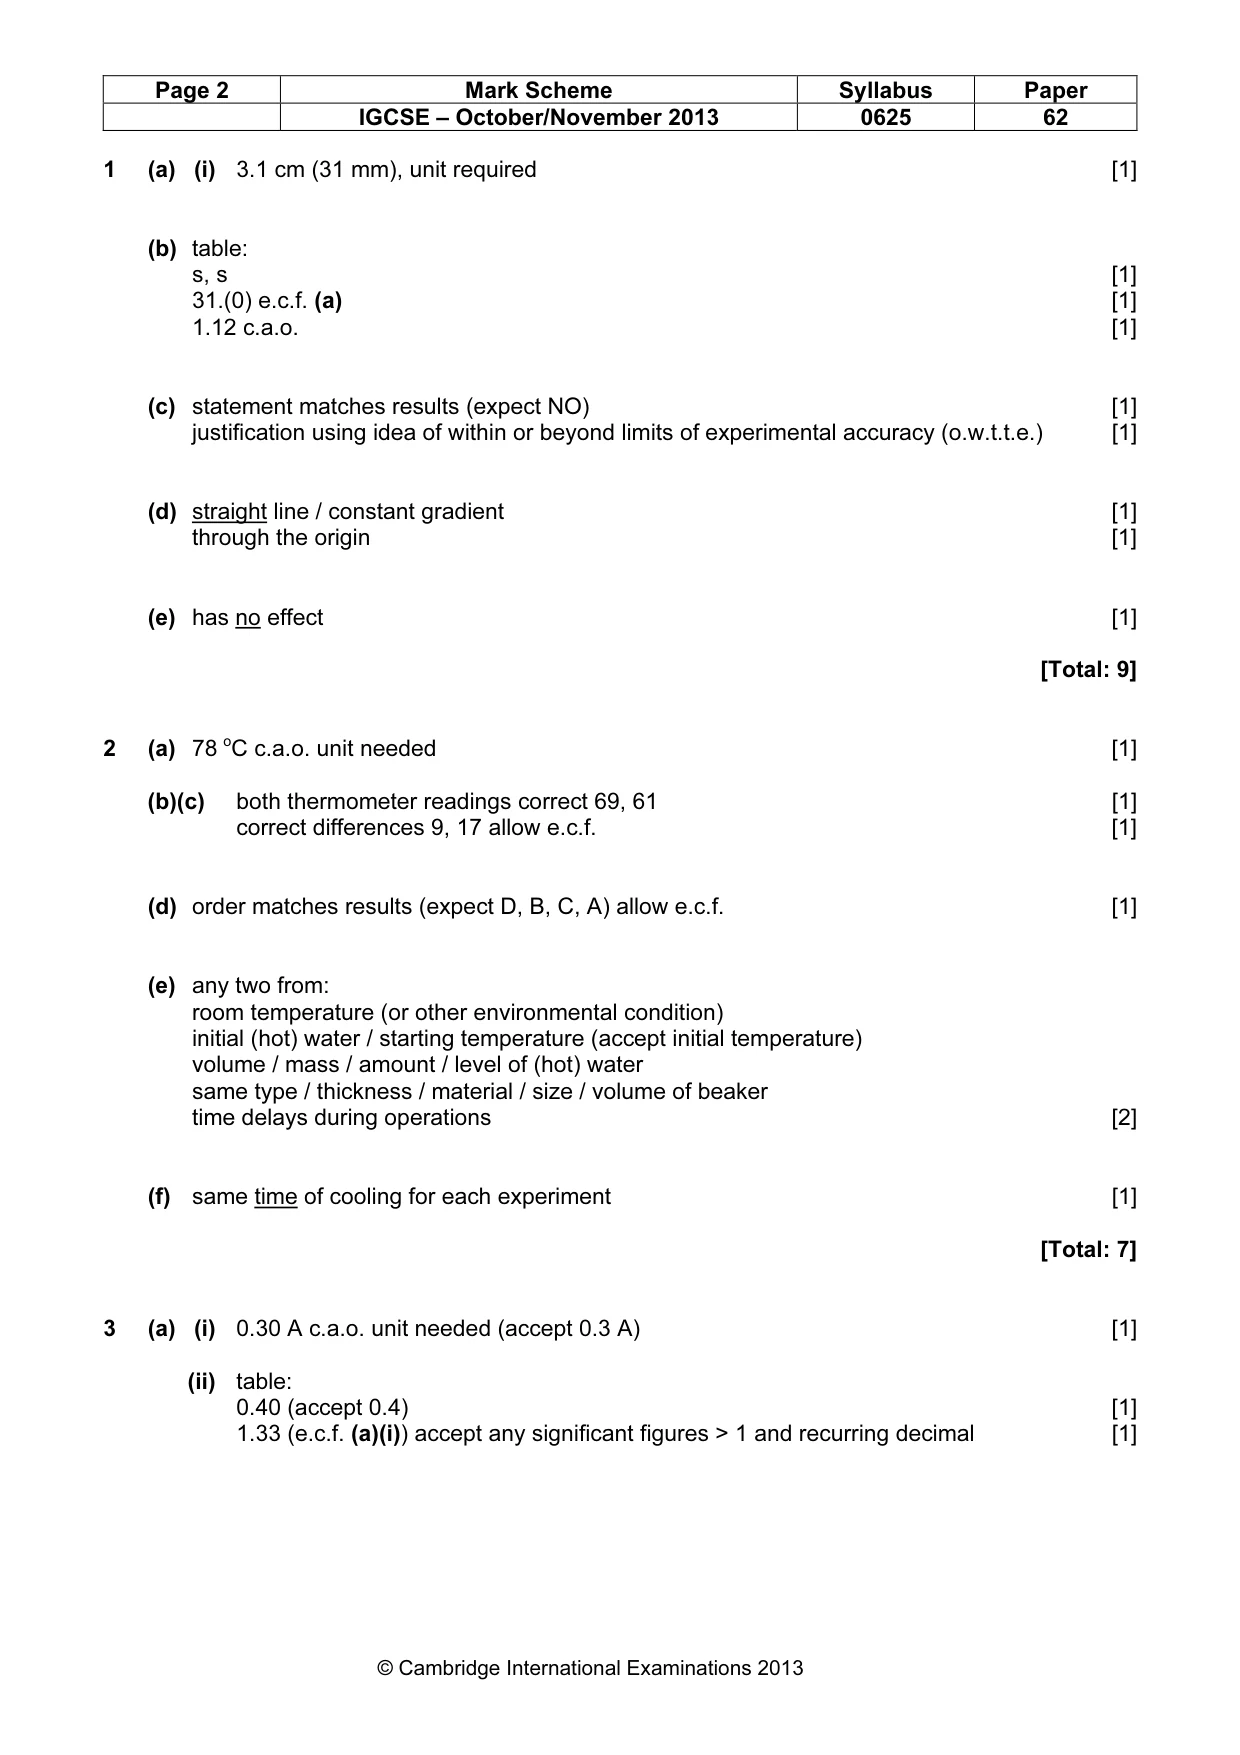
Mark scheme: 1 (a) (i) 3.1 cm (31 mm), unit required [1] (b) table: s, s [1] 31.(0) e.c.f. (a) [1] 1.12 c.a.o. [1] (c) statement matches results (expect NO) [1] justification using idea of within or beyond limits of experimental accuracy (o.w.t.t.e.) [1] (d) straight line / constant gradient [1] through the origin [1] (e) has no effect [1] [Total: 9] o
Q2 · The IGCSE class is investigating the cooling of water
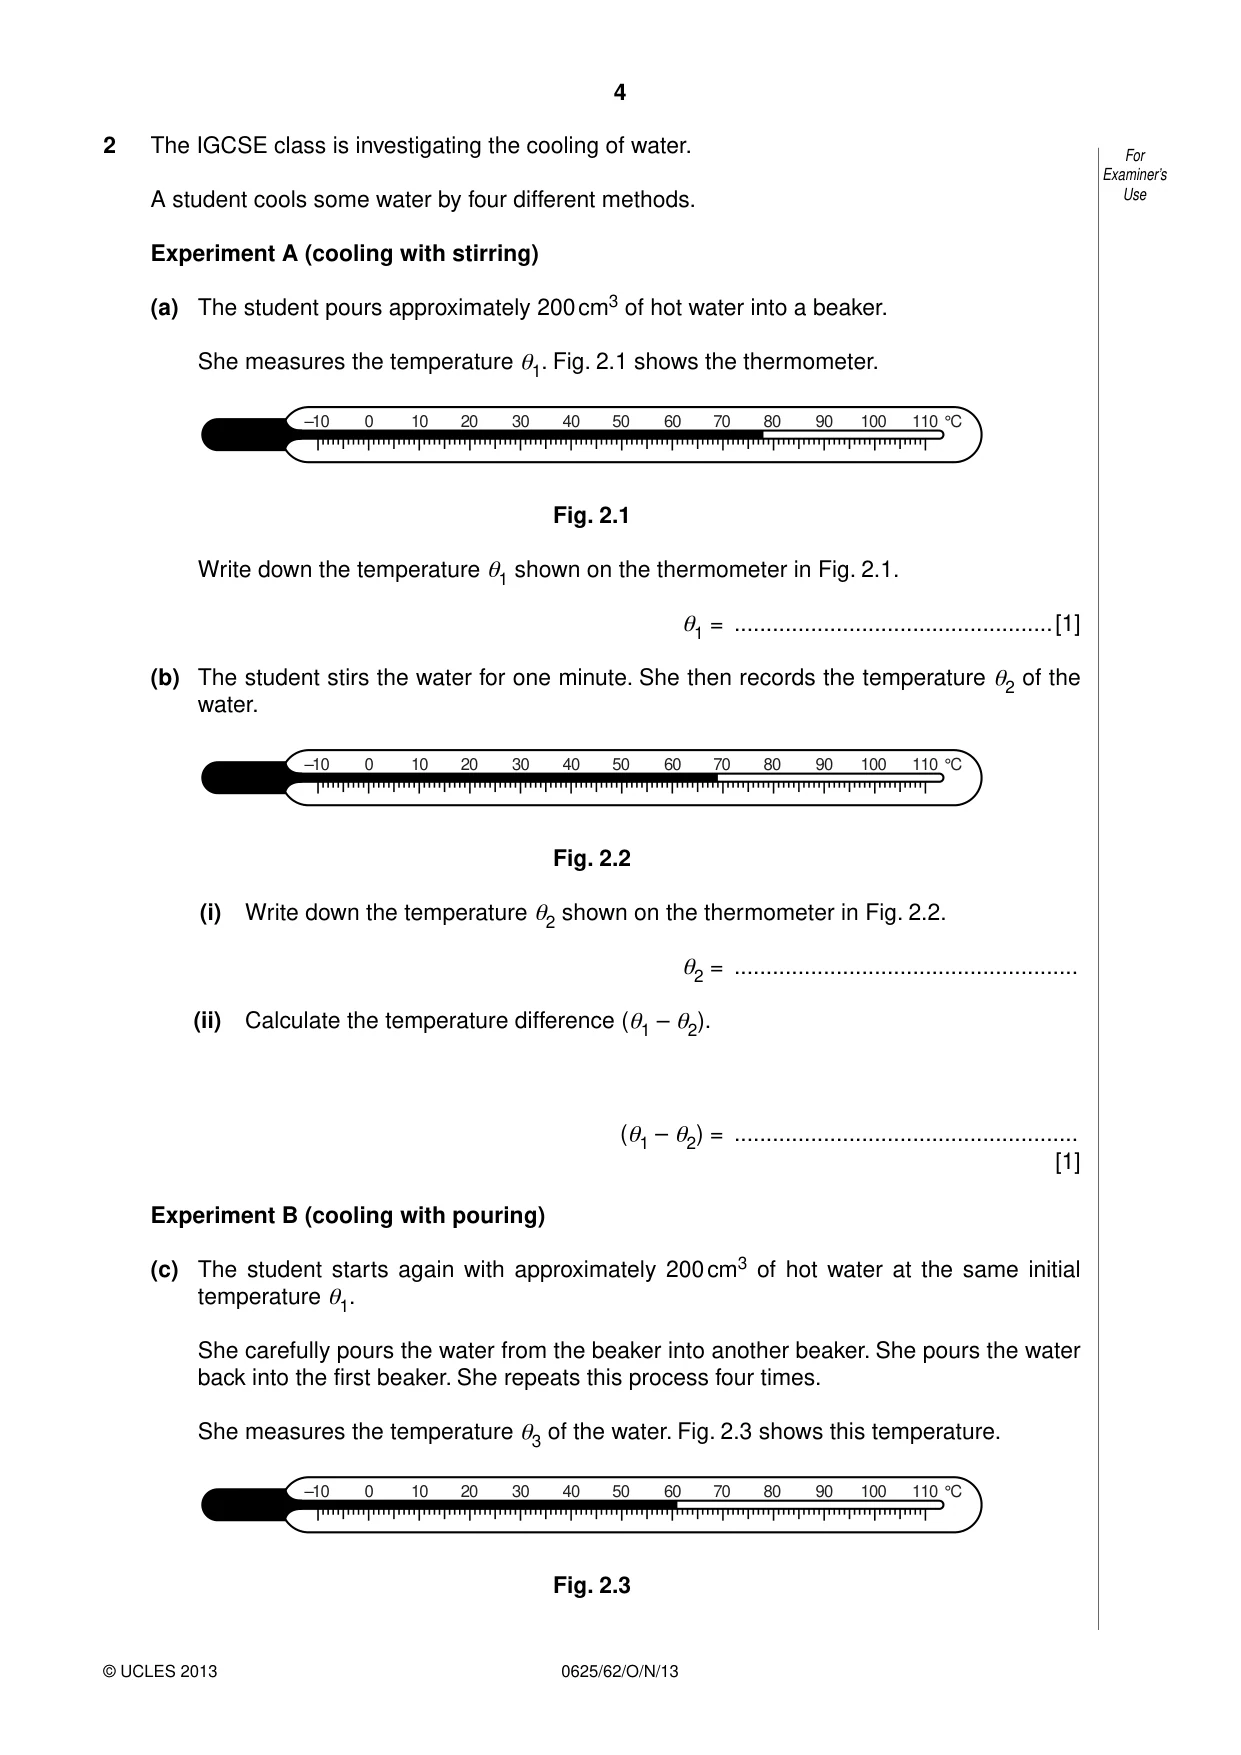
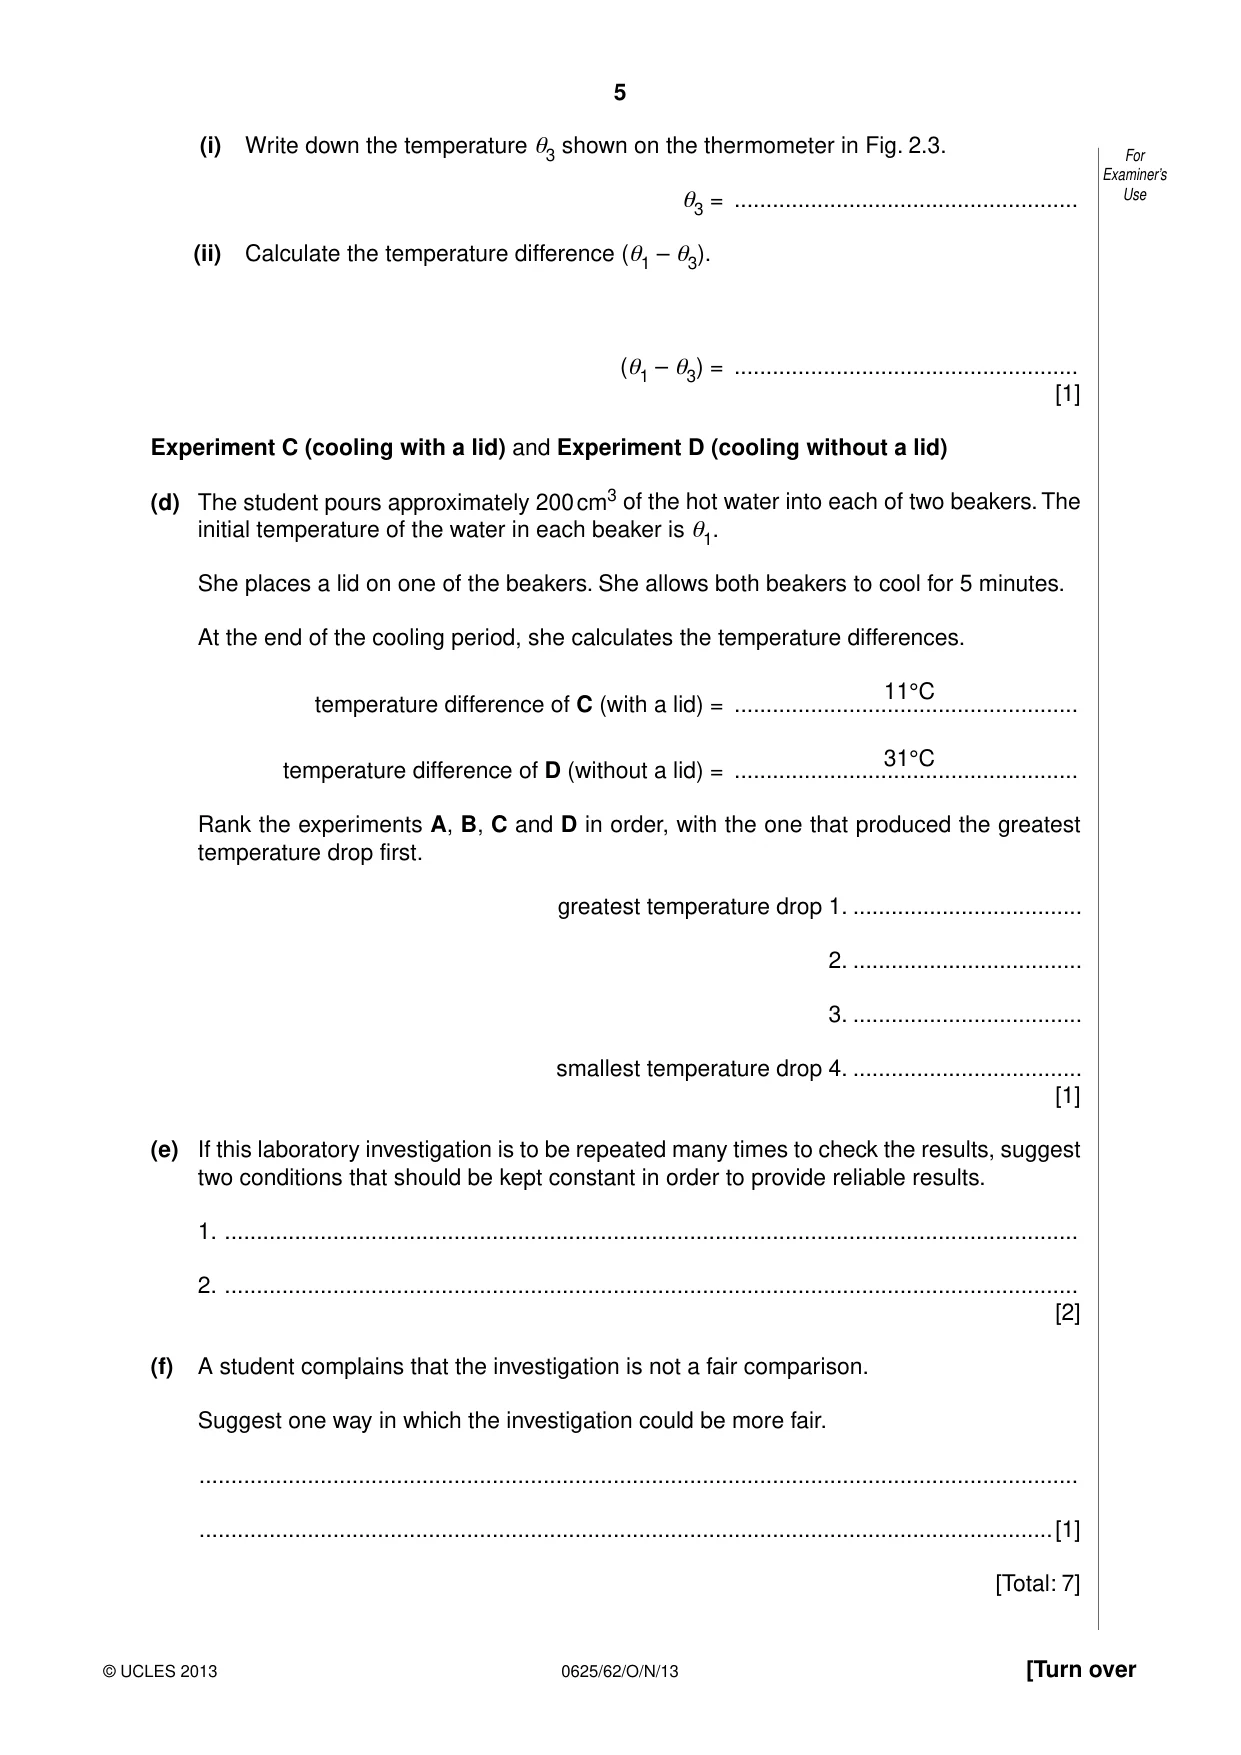
2 The IGCSE class is investigating the cooling of water. For Examiner’s A student cools some water by four different methods. Use Experiment A (cooling with stirring) (a) The student pours approximately 200 cm3 of hot water into a beaker. She measures the temperature θ1. Fig. 2.1 shows the thermometer. –10 0 10 20 30 40 50 60 70 80 90 100 110 °C Fig. 2.1 Write down the temperature θ1 shown on the thermometer in Fig. 2.1. θ1 = ..................................................[1] (b) The student stirs the water for one minute. She then records the temperature θ2 of the water. –10 0 10 20 30 40 50 60 70 80 90 100 110 °C Fig. 2.2 (i) Write down the temperature θ2 shown on the thermometer in Fig. 2.2. θ2 = ...................................................... (ii) Calculate the temperature difference (θ1 – θ2). (θ1 – θ2) = ...................................................... [1] Experiment B (cooling with pouring) (c) The student starts again with approximately 200 cm3 of hot water at the same initial temperature θ1. She carefully pours the water from the beaker into another beaker. She pours the water back into the first beaker. She repeats this process four times. She measures the temperature θ3 of the water. Fig. 2.3 shows this temperature. –10 0 10 20 30 40 50 60 70 80 90 100 110 °C Fig. 2.3 (i) Write down the temperature θ3 shown on the thermometer in Fig. 2.3. For Examiner’s θ3 = ...................................................... Use (ii) Calculate the temperature difference (θ1 – θ3). (θ1 – θ3) = ...................................................... [1] Experiment C (cooling with a lid) and Experiment D (cooling without a lid) (d) The student pours approximately 200 cm3 of the hot water into each of two beakers. The initial temperature of the water in each beaker is θ1. She places a lid on one of the beakers. She allows both beakers to cool for 5 minutes. At the end of the cooling period, she calculates the temperature differences. 11°C temperature difference of C (with a lid) = ...................................................... 31°C temperature difference of D (without a lid) = ...................................................... Rank the experiments A, B, C and D in order, with the one that produced the greatest temperature drop first. greatest temperature drop 1. .................................... 2. .................................... 3. .................................... smallest temperature drop 4. .................................... [1] (e) If this laboratory investigation is to be repeated many times to check the results, suggest two conditions that should be kept constant in order to provide reliable results. 1. ...................................................................................................................................... 2. ...................................................................................................................................... [2] (f) A student complains that the investigation is not a fair comparison. Suggest one way in which the investigation could be more fair. .......................................................................................................................................... ......................................................................................................................................[1] [Total: 7]
Mark scheme: 2 (a) 78 oC c.a.o. unit needed [1] (b)(c) both thermometer readings correct 69, 61 [1] correct differences 9, 17 allow e.c.f. [1] (d) order matches results (expect D, B, C, A) allow e.c.f. [1] (e) any two from: room temperature (or other environmental condition) initial (hot) water / starting temperature (accept initial temperature) volume / mass / amount / level of (hot) water same type / thickness / material / size / volume of beaker time delays during operations [2] (f) same time of cooling for each experiment [1] [Total: 7]
Q3 · The IGCSE class is investigating the resistance of a wire
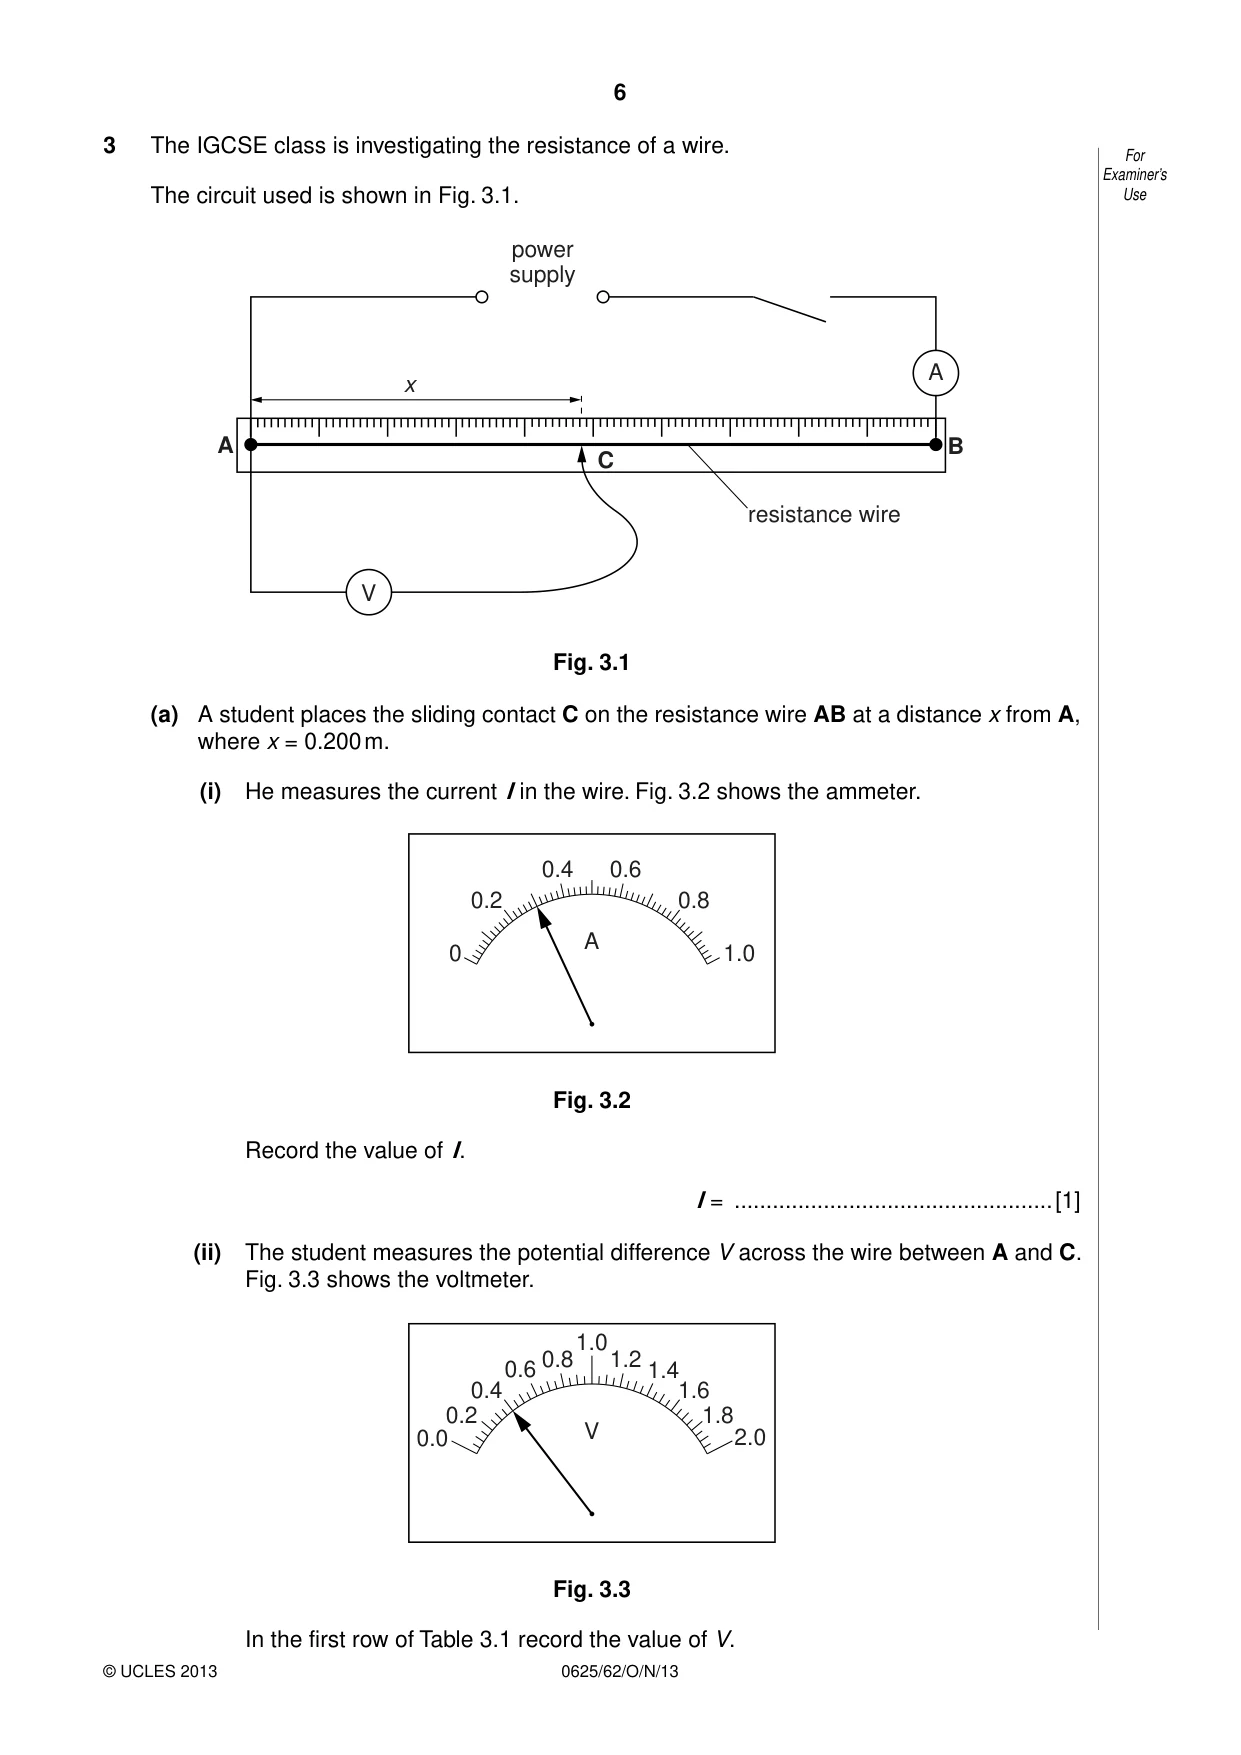
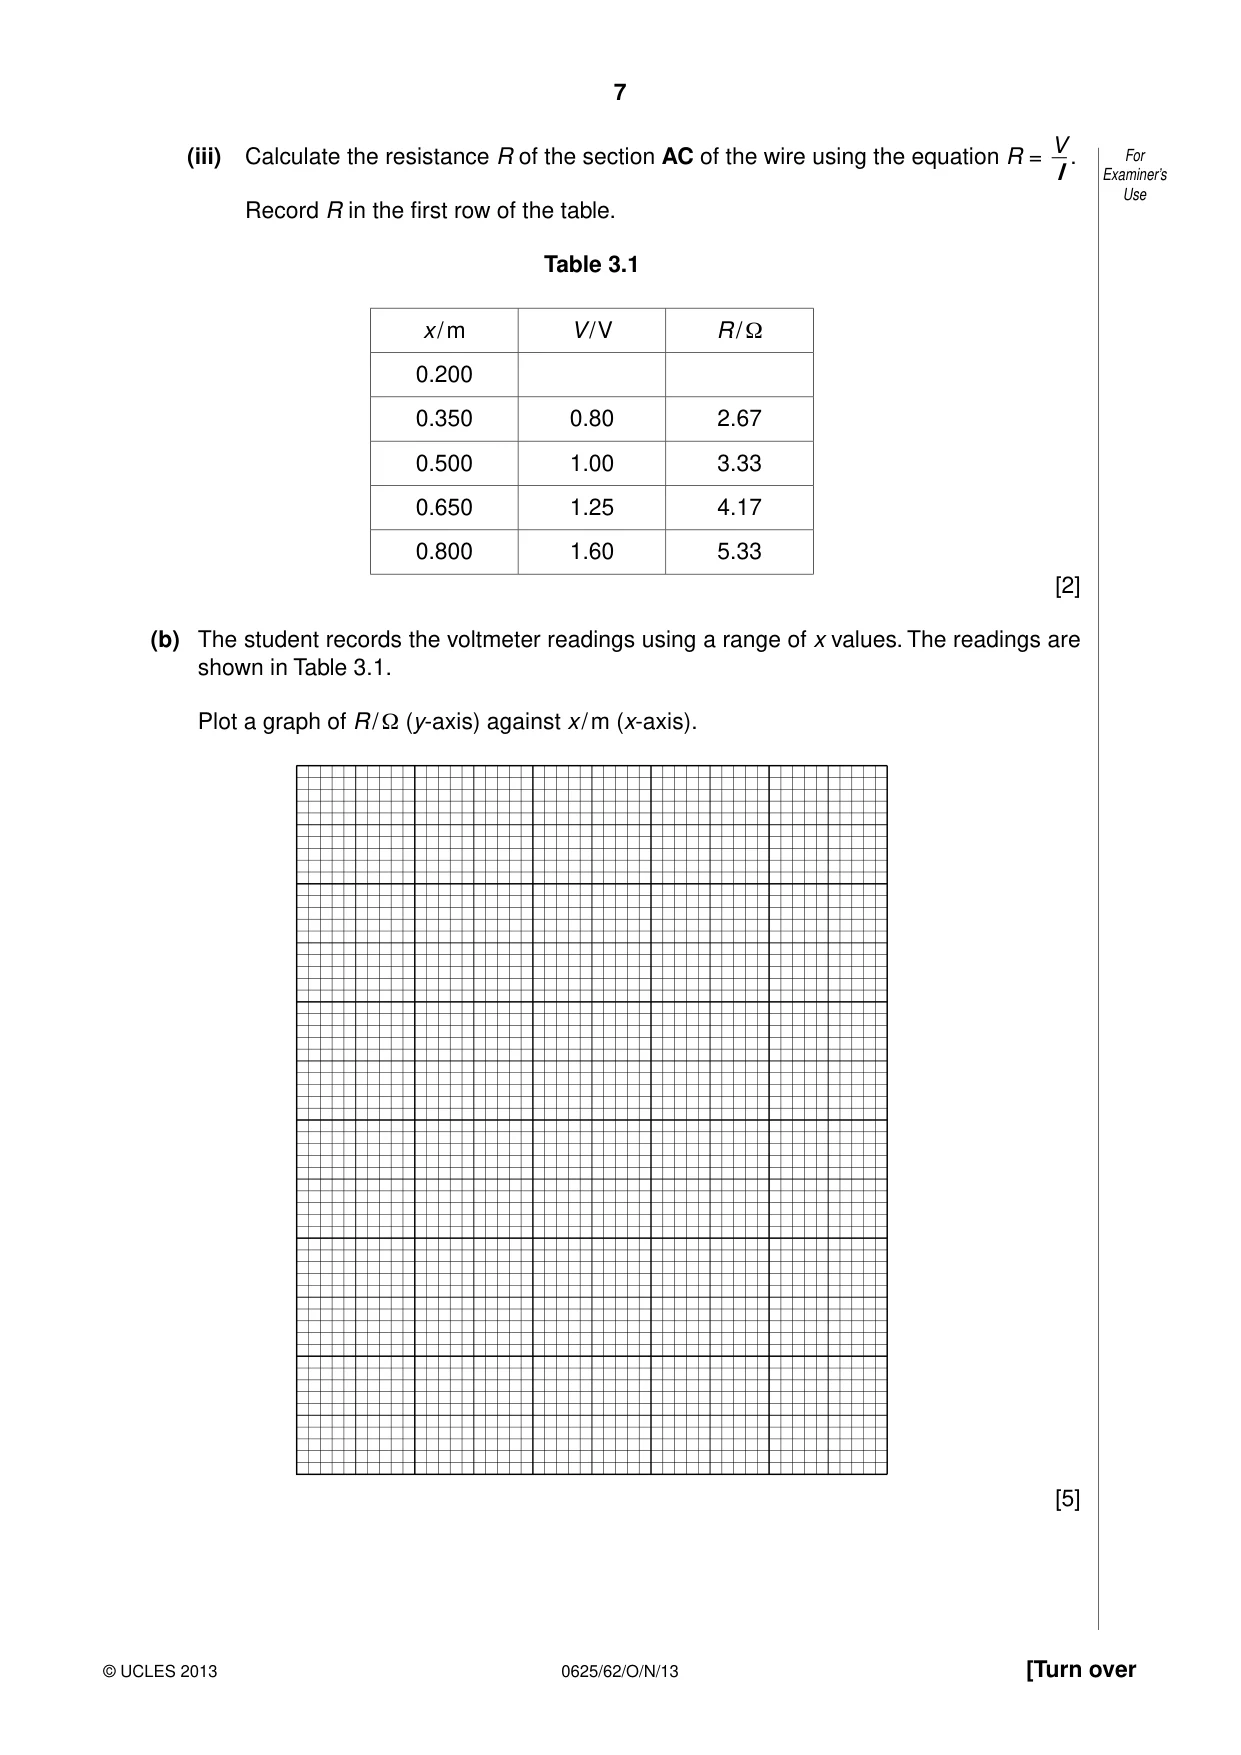
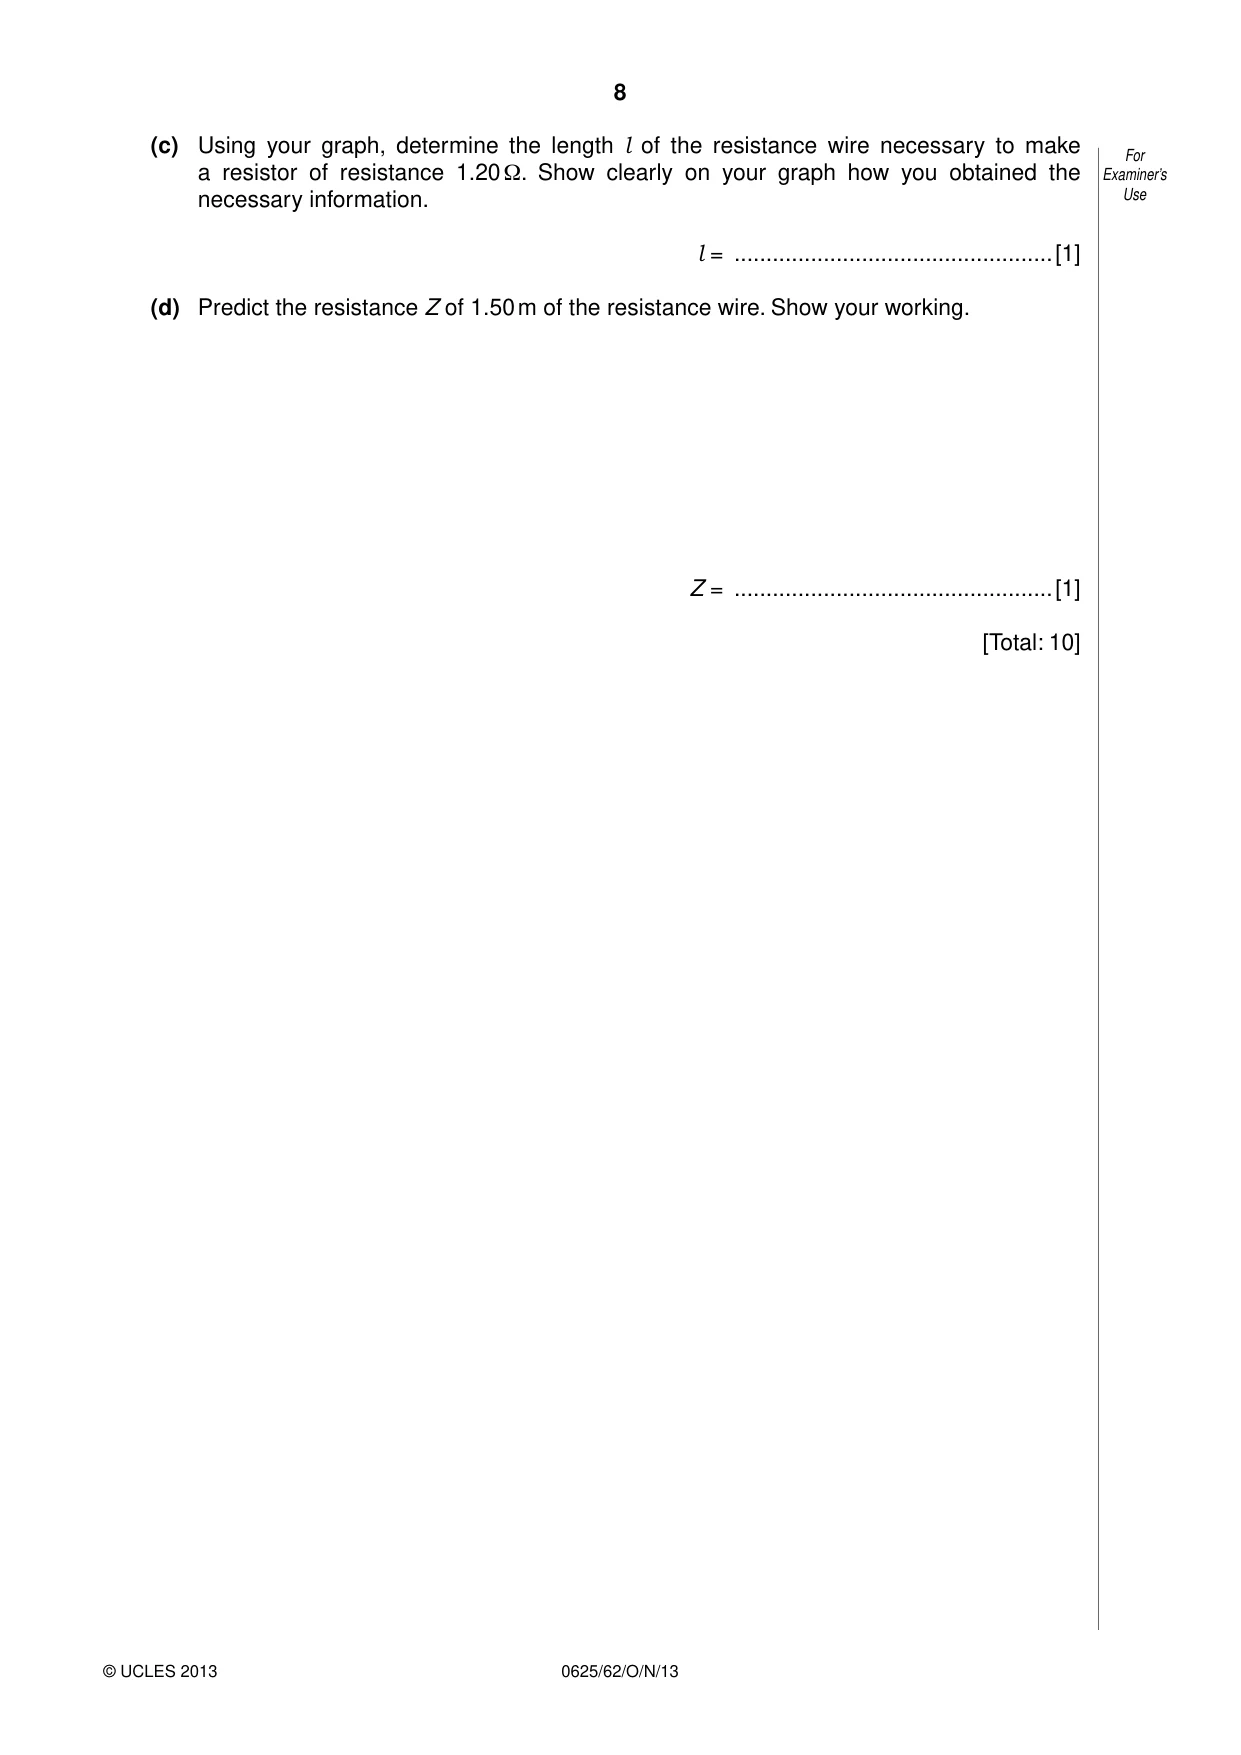
3 The IGCSE class is investigating the resistance of a wire. For Examiner’s The circuit used is shown in Fig. 3.1. Use power supply A x A B C resistance wire V Fig. 3.1 (a) A student places the sliding contact C on the resistance wire AB at a distance x from A, where x = 0.200 m. (i) He measures the current I in the wire. Fig. 3.2 shows the ammeter. 0.4 0.6 0.2 0.8 A 0 1.0 Fig. 3.2 Record the value of I. I = ..................................................[1] (ii) The student measures the potential difference V across the wire between A and C. Fig. 3.3 shows the voltmeter. 0.81.0 1.2 0.6 1.4 0.4 1.6 0.2 1.8 V 2.0 0.0 Fig. 3.3 In the first row of Table 3.1 record the value of V. V (iii) Calculate the resistance R of the section AC of the wire using the equation R = . For I Examiner’s Use Record R in the first row of the table. Table 3.1 x / m V / V R / Ω 0.200 0.350 0.80 2.67 0.500 1.00 3.33 0.650 1.25 4.17 0.800 1.60 5.33 [2] (b) The student records the voltmeter readings using a range of x values. The readings are shown in Table 3.1. Plot a graph of R / Ω (y-axis) against x / m (x-axis). [5] (c) Using your graph, determine the length l of the resistance wire necessary to make For a resistor of resistance 1.20 Ω. Show clearly on your graph how you obtained the Examiner’s necessary information. Use l = ..................................................[1] (d) Predict the resistance Z of 1.50 m of the resistance wire. Show your working. Z = ..................................................[1] [Total: 10]
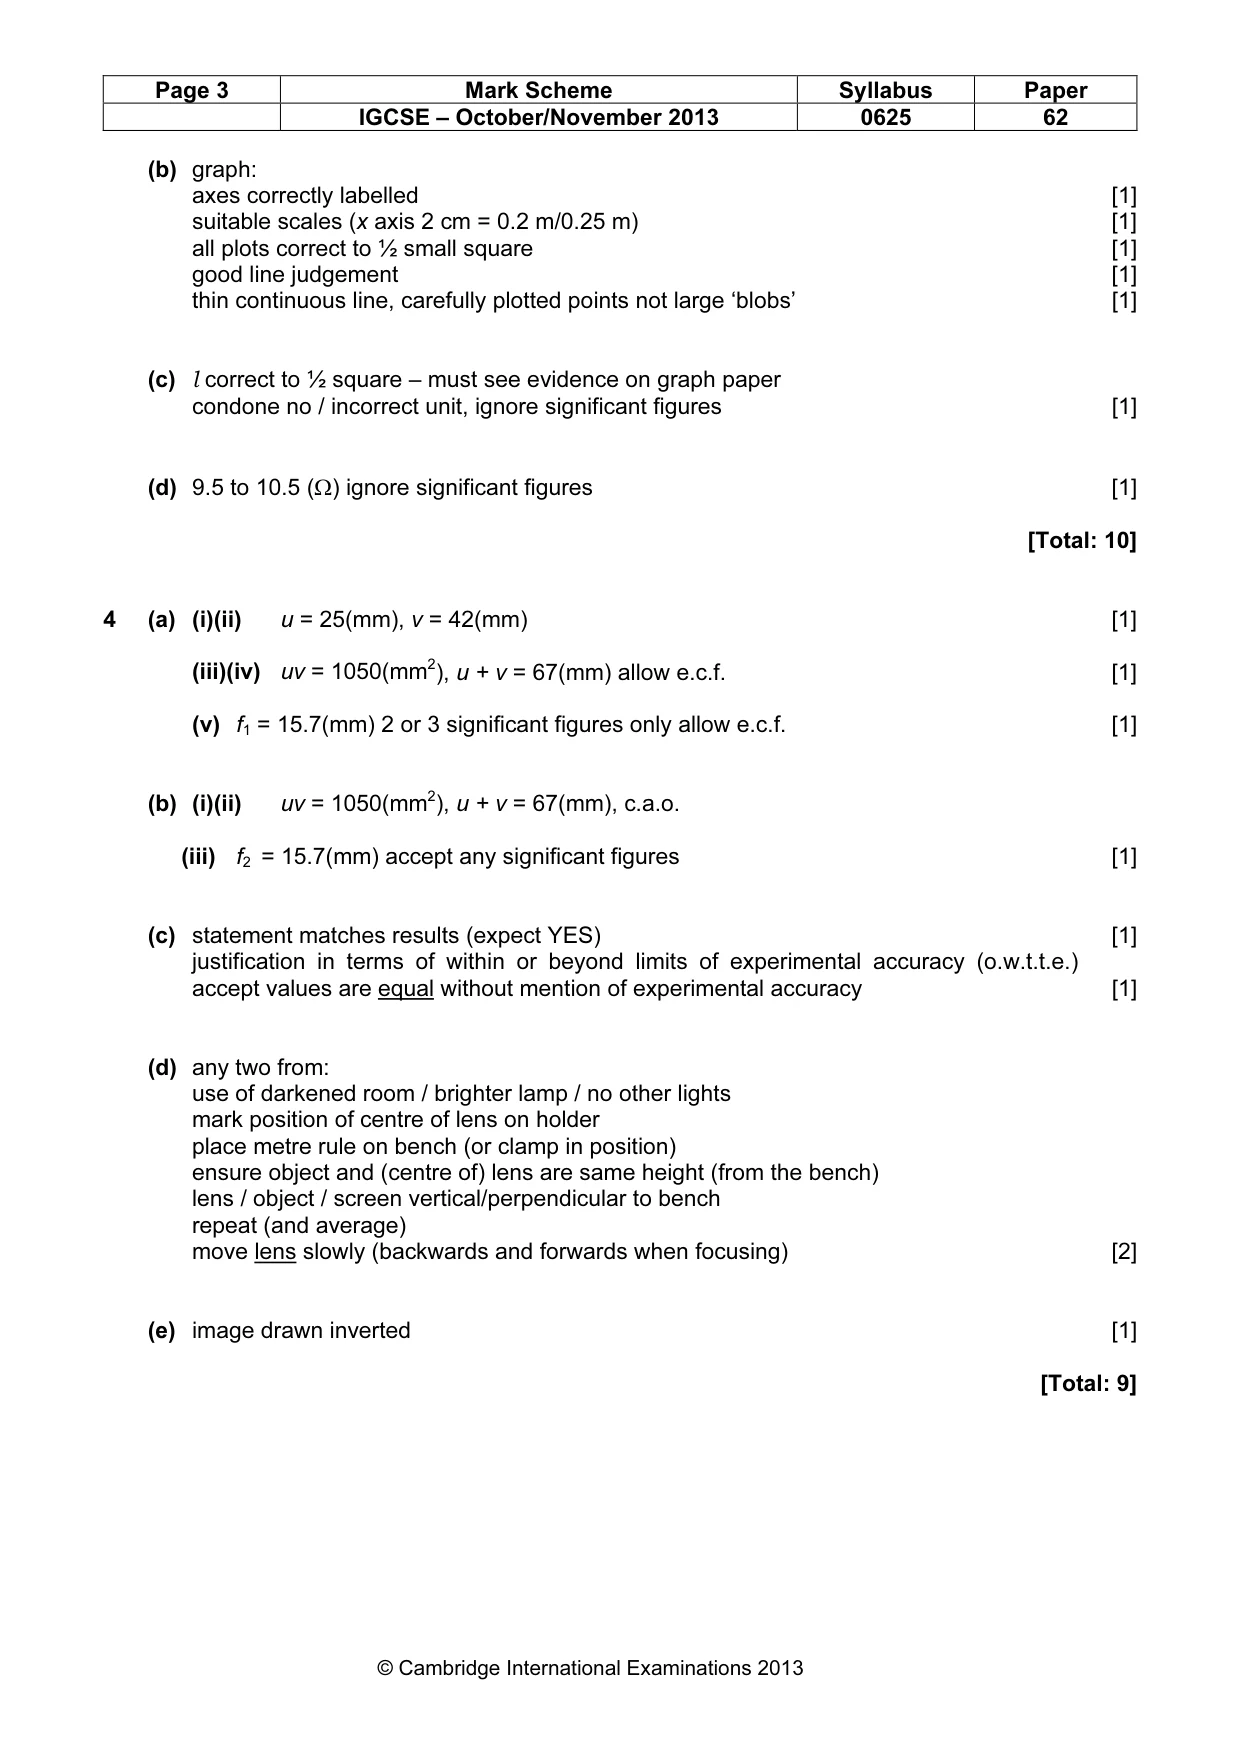
Mark scheme: 3 (a) (i) 0.30 A c.a.o. unit needed (accept 0.3 A) [1] (ii) table: 0.40 (accept 0.4) [1] 1.33 (e.c.f. (a)(i)) accept any significant figures > 1 and recurring decimal [1] IGCSE – October/November 2013 0625 62 (b) graph: axes correctly labelled [1] suitable scales (x axis 2 cm = 0.2 m/0.25 m) [1] all plots correct to ½ small square [1] good line judgement [1] thin continuous line, carefully plotted points not large ‘blobs’ [1] (c) l correct to ½ square – must see evidence on graph paper condone no / incorrect unit, ignore significant figures [1] (d) 9.5 to 10.5 (Ω) ignore significant figures [1] [Total: 10]
Q4 · The IGCSE class is determining the focal length of a converging lens
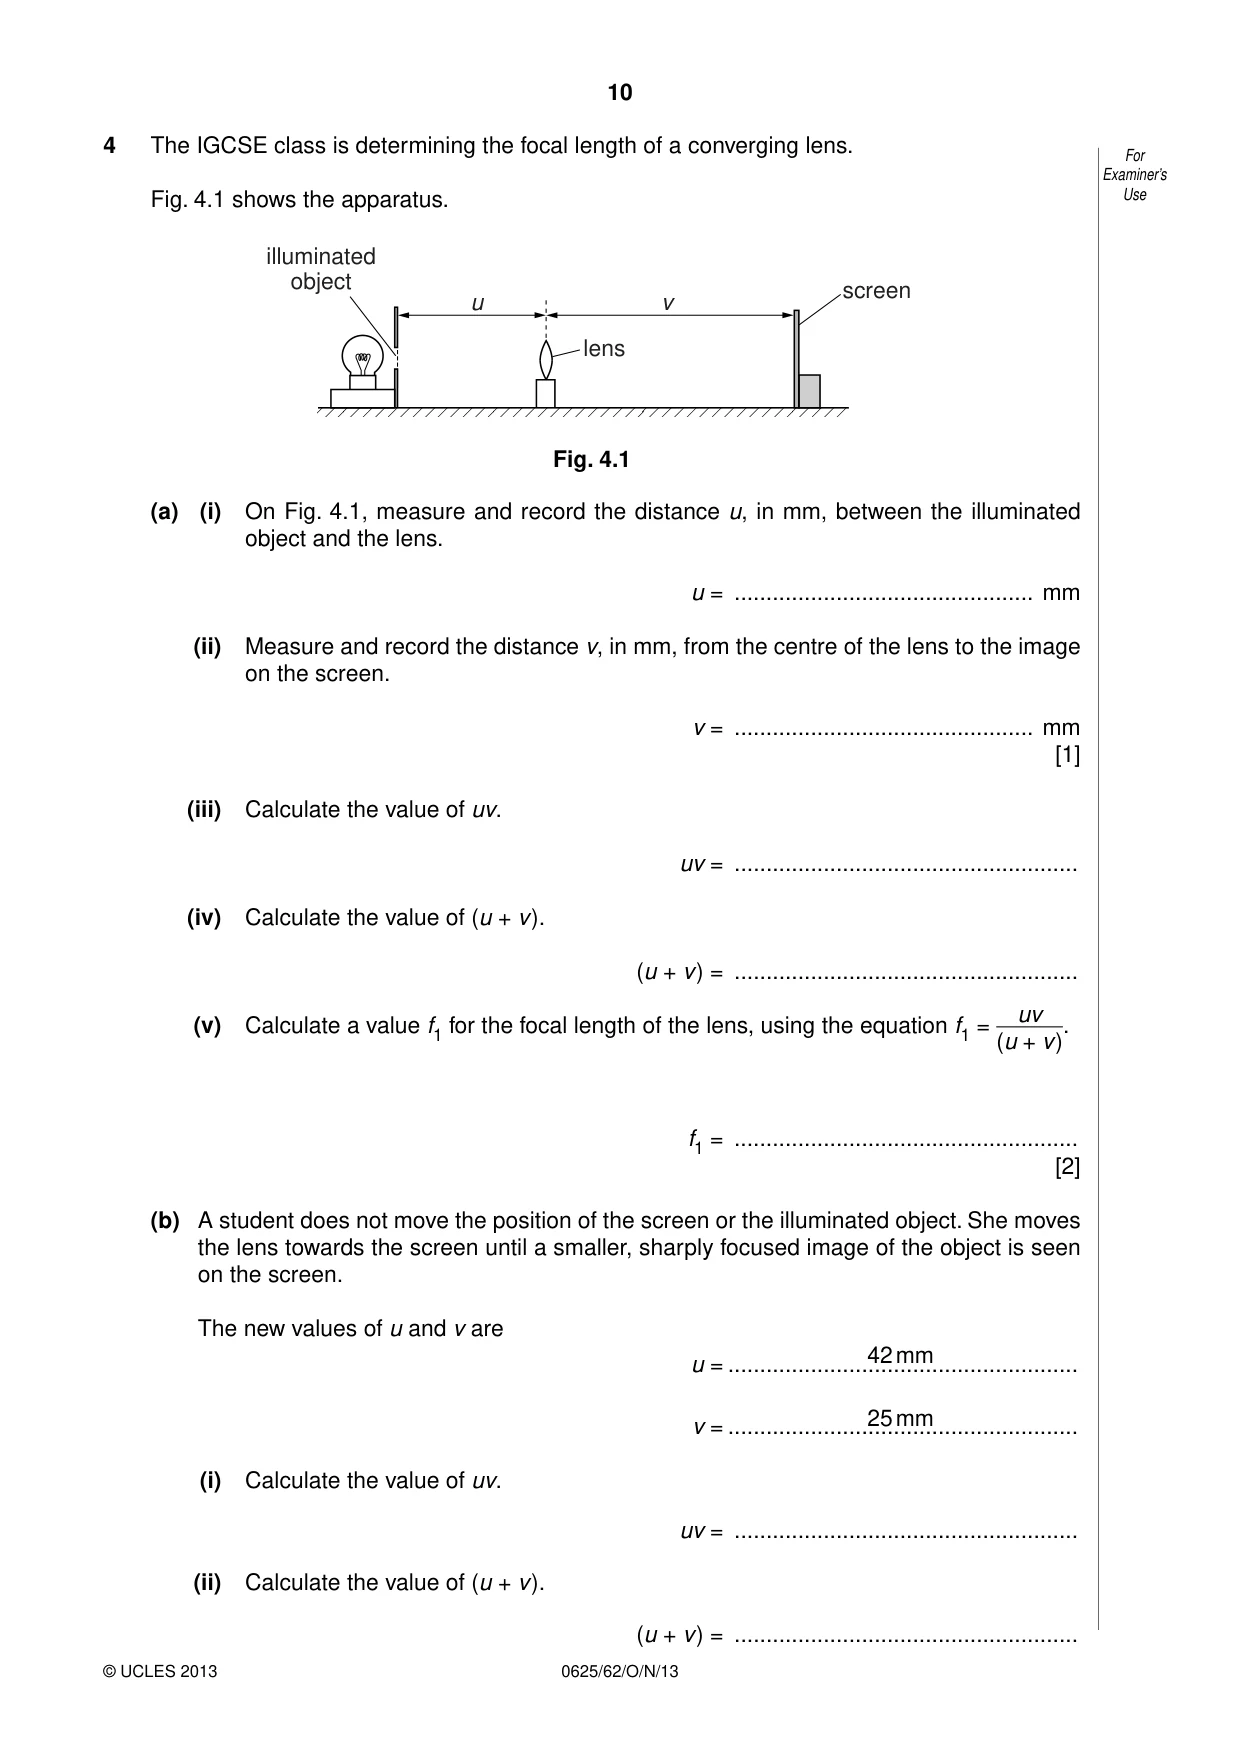
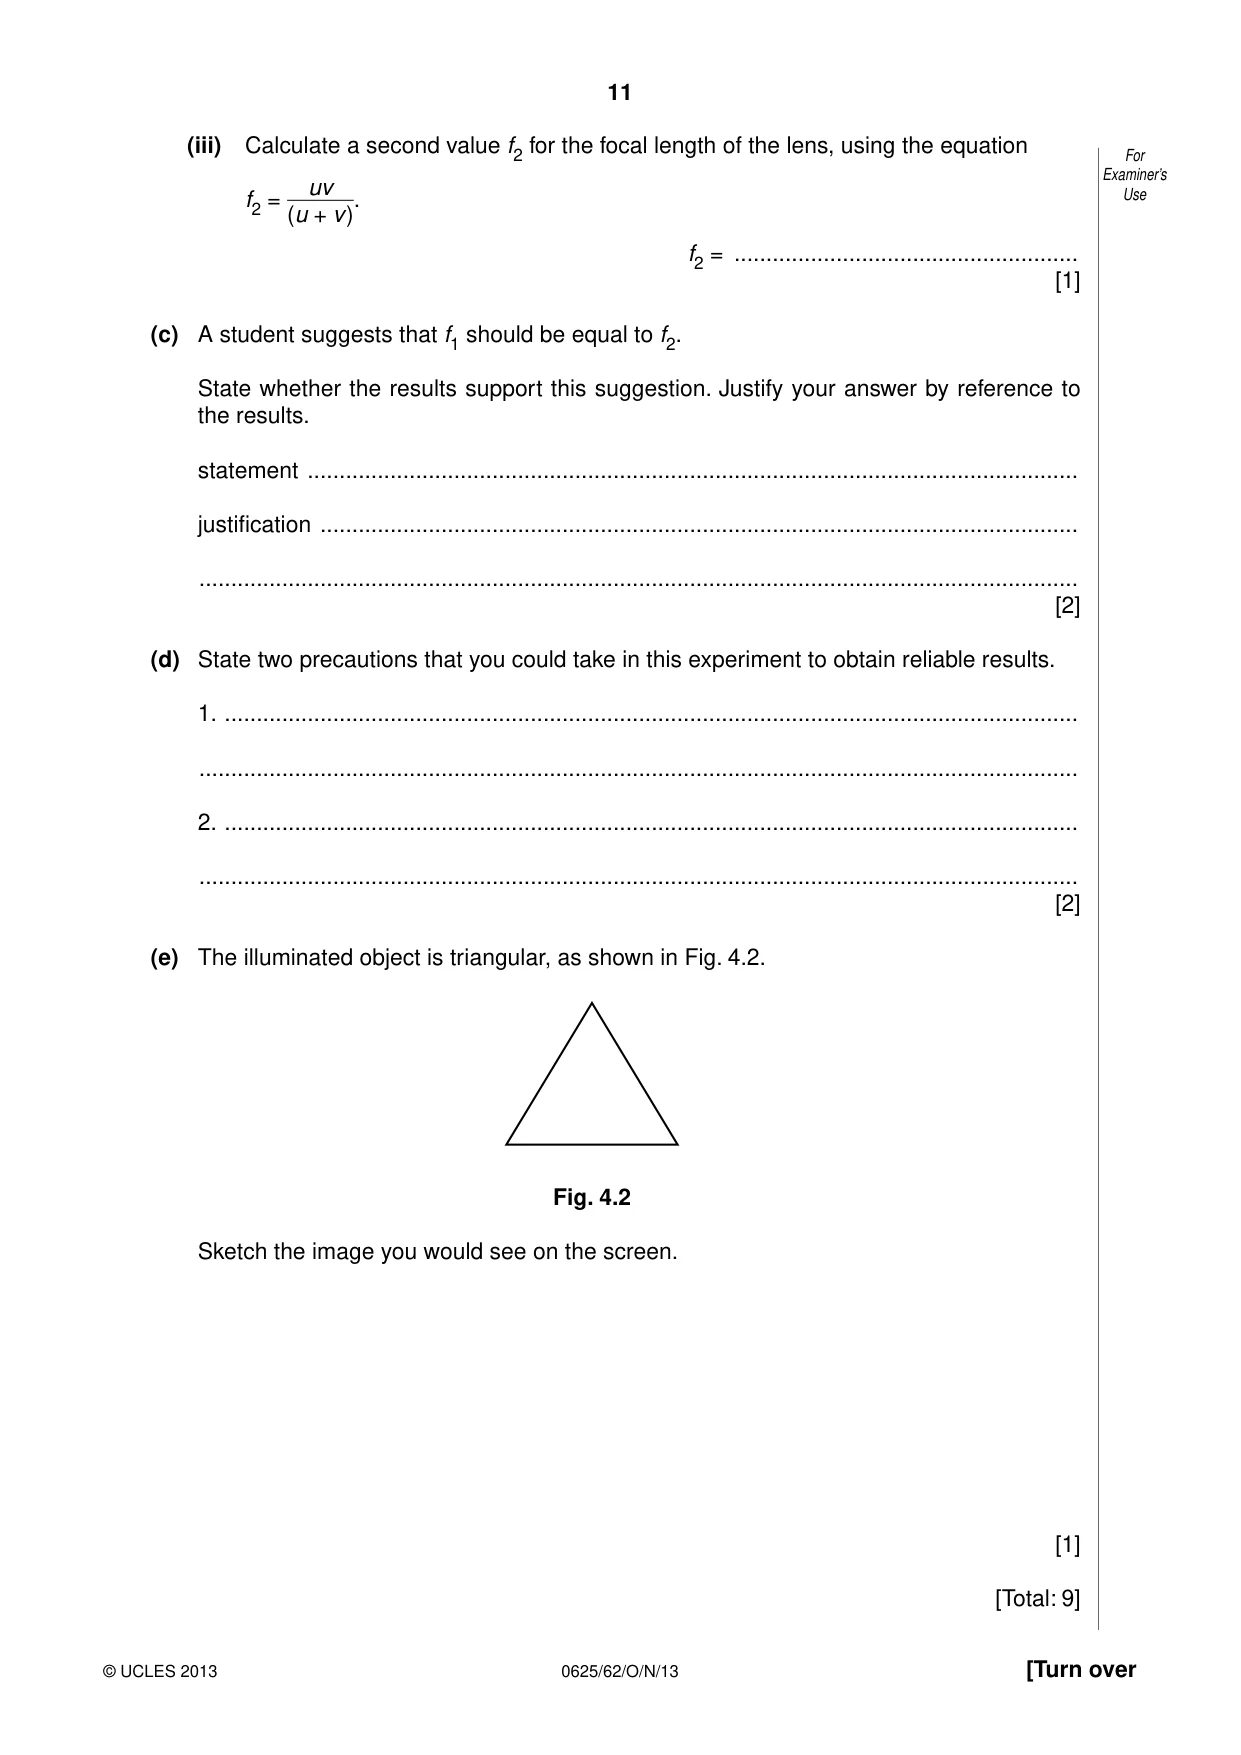
4 The IGCSE class is determining the focal length of a converging lens. For Examiner’s Fig. 4.1 shows the apparatus. Use illuminated object screen u v lens Fig. 4.1 (a) (i) On Fig. 4.1, measure and record the distance u, in mm, between the illuminated object and the lens. u = ............................................... mm (ii) Measure and record the distance v, in mm, from the centre of the lens to the image on the screen. v = ............................................... mm [1] (iii) Calculate the value of uv. uv = ...................................................... (iv) Calculate the value of (u + v ). (u + v ) = ...................................................... uv (v) Calculate a value f1 for the focal length of the lens, using the equation f1 = (u + v ). f1 = ...................................................... [2] (b) A student does not move the position of the screen or the illuminated object. She moves the lens towards the screen until a smaller, sharply focused image of the object is seen on the screen. The new values of u and v are 42 mm u = ....................................................... 25 mm v = ....................................................... (i) Calculate the value of uv. uv = ...................................................... (ii) Calculate the value of (u + v ). (u + v ) = ...................................................... (iii) Calculate a second value f2 for the focal length of the lens, using the equation For Examiner’s uv Use f2 = (u + v ). f2 = ...................................................... [1] (c) A student suggests that f1 should be equal to f2. State whether the results support this suggestion. Justify your answer by reference to the results. statement ......................................................................................................................... justification ....................................................................................................................... .......................................................................................................................................... [2] (d) State two precautions that you could take in this experiment to obtain reliable results. 1. ...................................................................................................................................... .......................................................................................................................................... 2. ...................................................................................................................................... .......................................................................................................................................... [2] (e) The illuminated object is triangular, as shown in Fig. 4.2. Fig. 4.2 Sketch the image you would see on the screen. [1] [Total: 9]
Mark scheme: 4 (a) (i)(ii) u = 25(mm), v = 42(mm) [1] (iii)(iv) uv = 1050(mm2), u + v = 67(mm) allow e.c.f. [1] (v) f1 = 15.7(mm) 2 or 3 significant figures only allow e.c.f. [1] (b) (i)(ii) uv = 1050(mm2), u + v = 67(mm), c.a.o. (iii) f2 = 15.7(mm) accept any significant figures [1] (c) statement matches results (expect YES) [1] justification in terms of within or beyond limits of experimental accuracy (o.w.t.t.e.) accept values are equal without mention of experimental accuracy [1] (d) any two from: use of darkened room / brighter lamp / no other lights mark position of centre of lens on holder place metre rule on bench (or clamp in position) ensure object and (centre of) lens are same height (from the bench) lens / object / screen vertical/perpendicular to bench repeat (and average) move lens slowly (backwards and forwards when focusing) [2] (e) image drawn inverted [1] [Total: 9] IGCSE – October/November 2013 0625 62
More questions on Physical quantities and measurement techniques
Q5 · The IGCSE class is investigating pressure
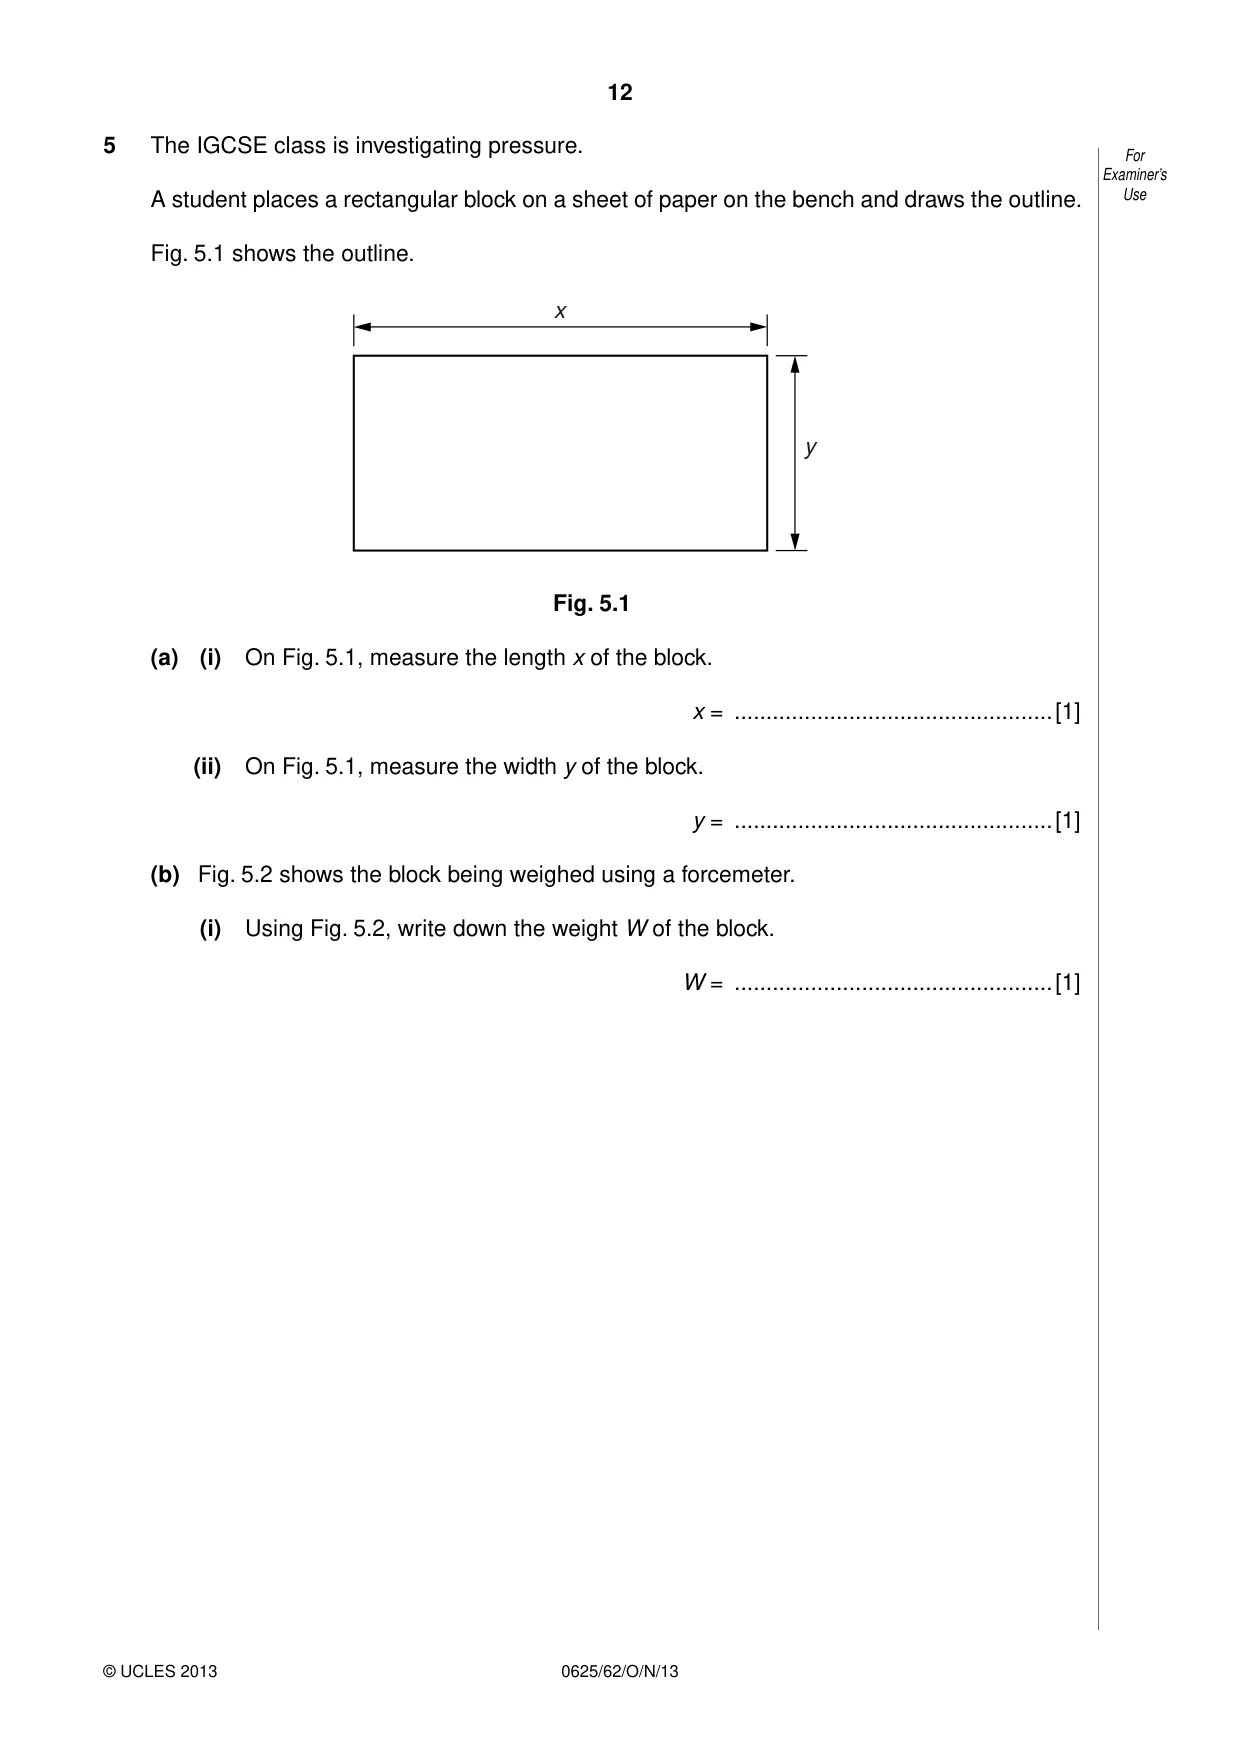
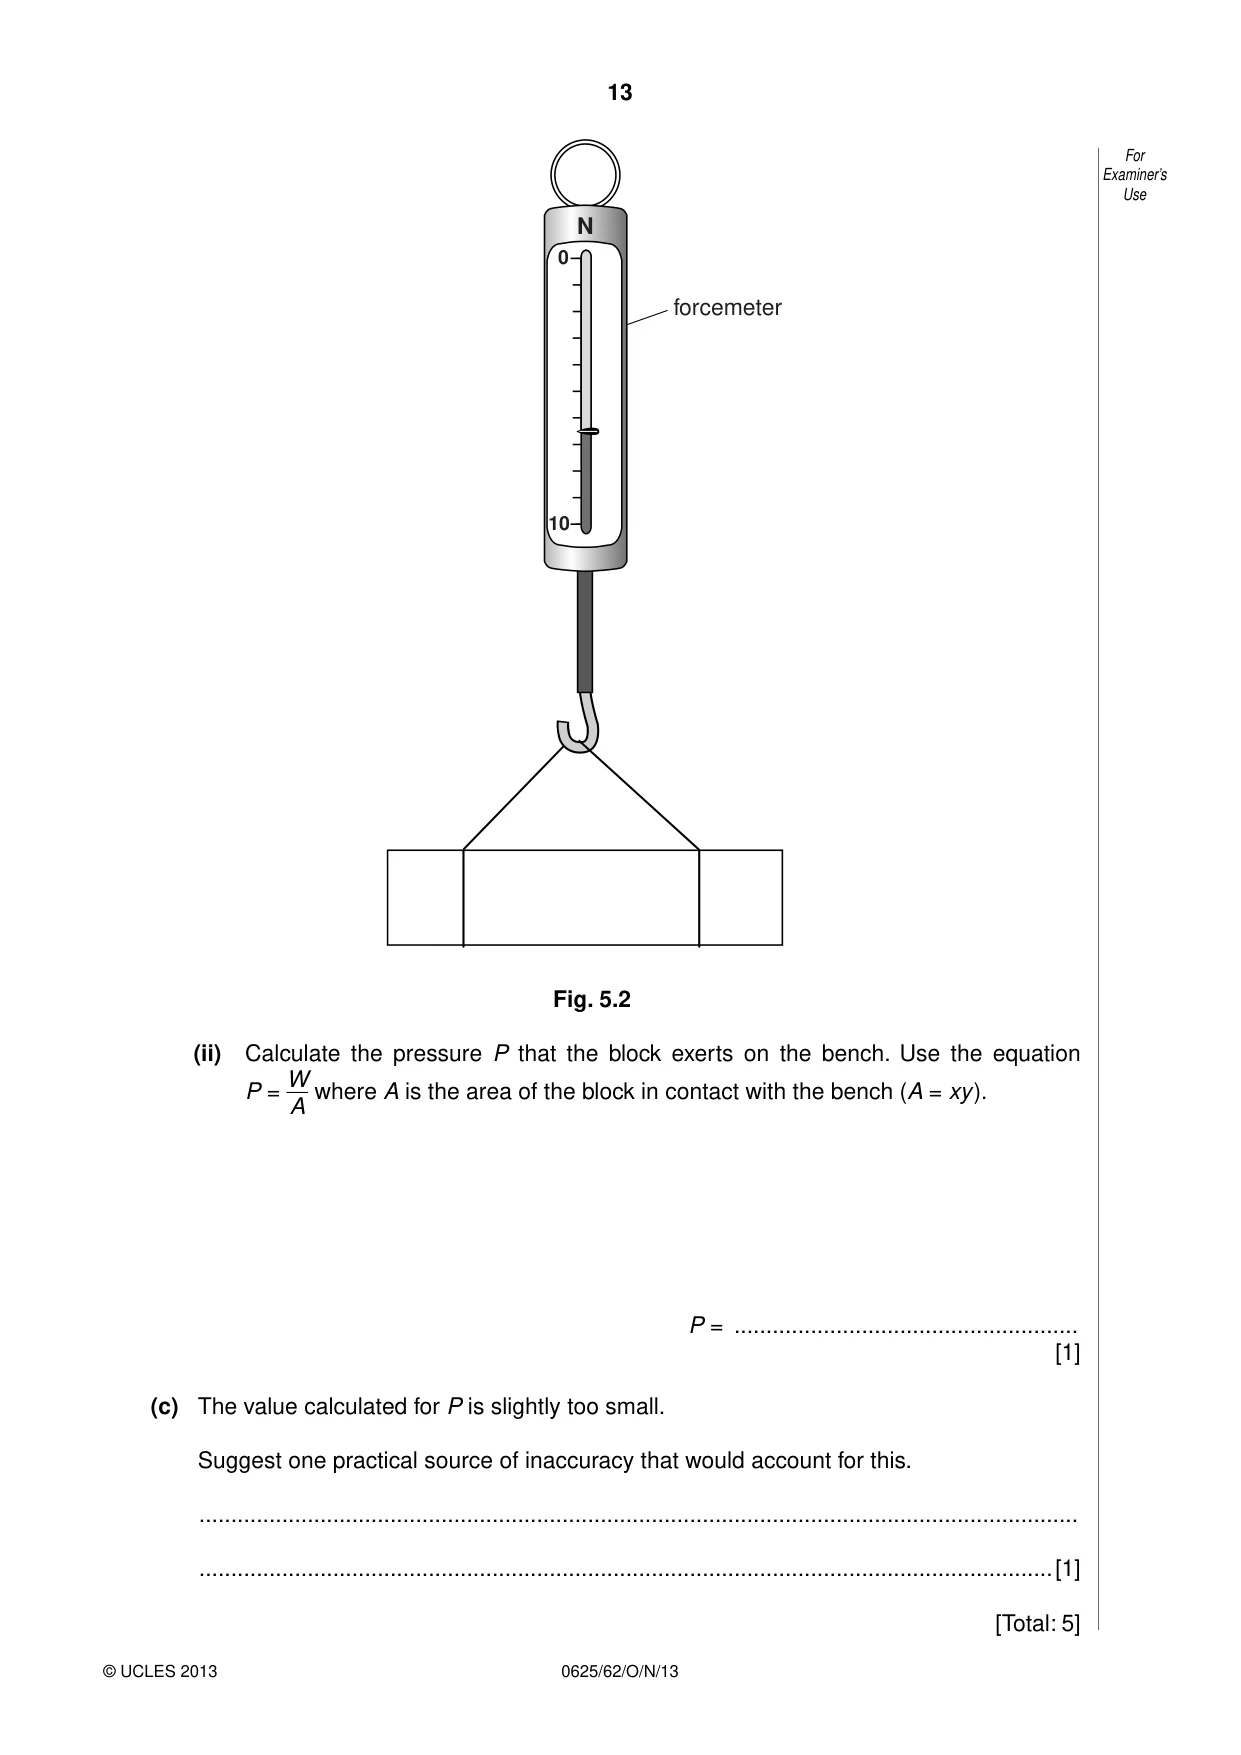
5 The IGCSE class is investigating pressure. For Examiner’s A student places a rectangular block on a sheet of paper on the bench and draws the outline. Use Fig. 5.1 shows the outline. x y Fig. 5.1 (a) (i) On Fig. 5.1, measure the length x of the block. x = ..................................................[1] (ii) On Fig. 5.1, measure the width y of the block. y = ..................................................[1] (b) Fig. 5.2 shows the block being weighed using a forcemeter. (i) Using Fig. 5.2, write down the weight W of the block. W = ..................................................[1] For Examiner’s Use N 0 forcemeter 10 Fig. 5.2 (ii) Calculate the pressure P that the block exerts on the bench. Use the equation W P = where A is the area of the block in contact with the bench (A = xy ). A P = ...................................................... [1] (c) The value calculated for P is slightly too small. Suggest one practical source of inaccuracy that would account for this. .......................................................................................................................................... ......................................................................................................................................[1] [Total: 5]
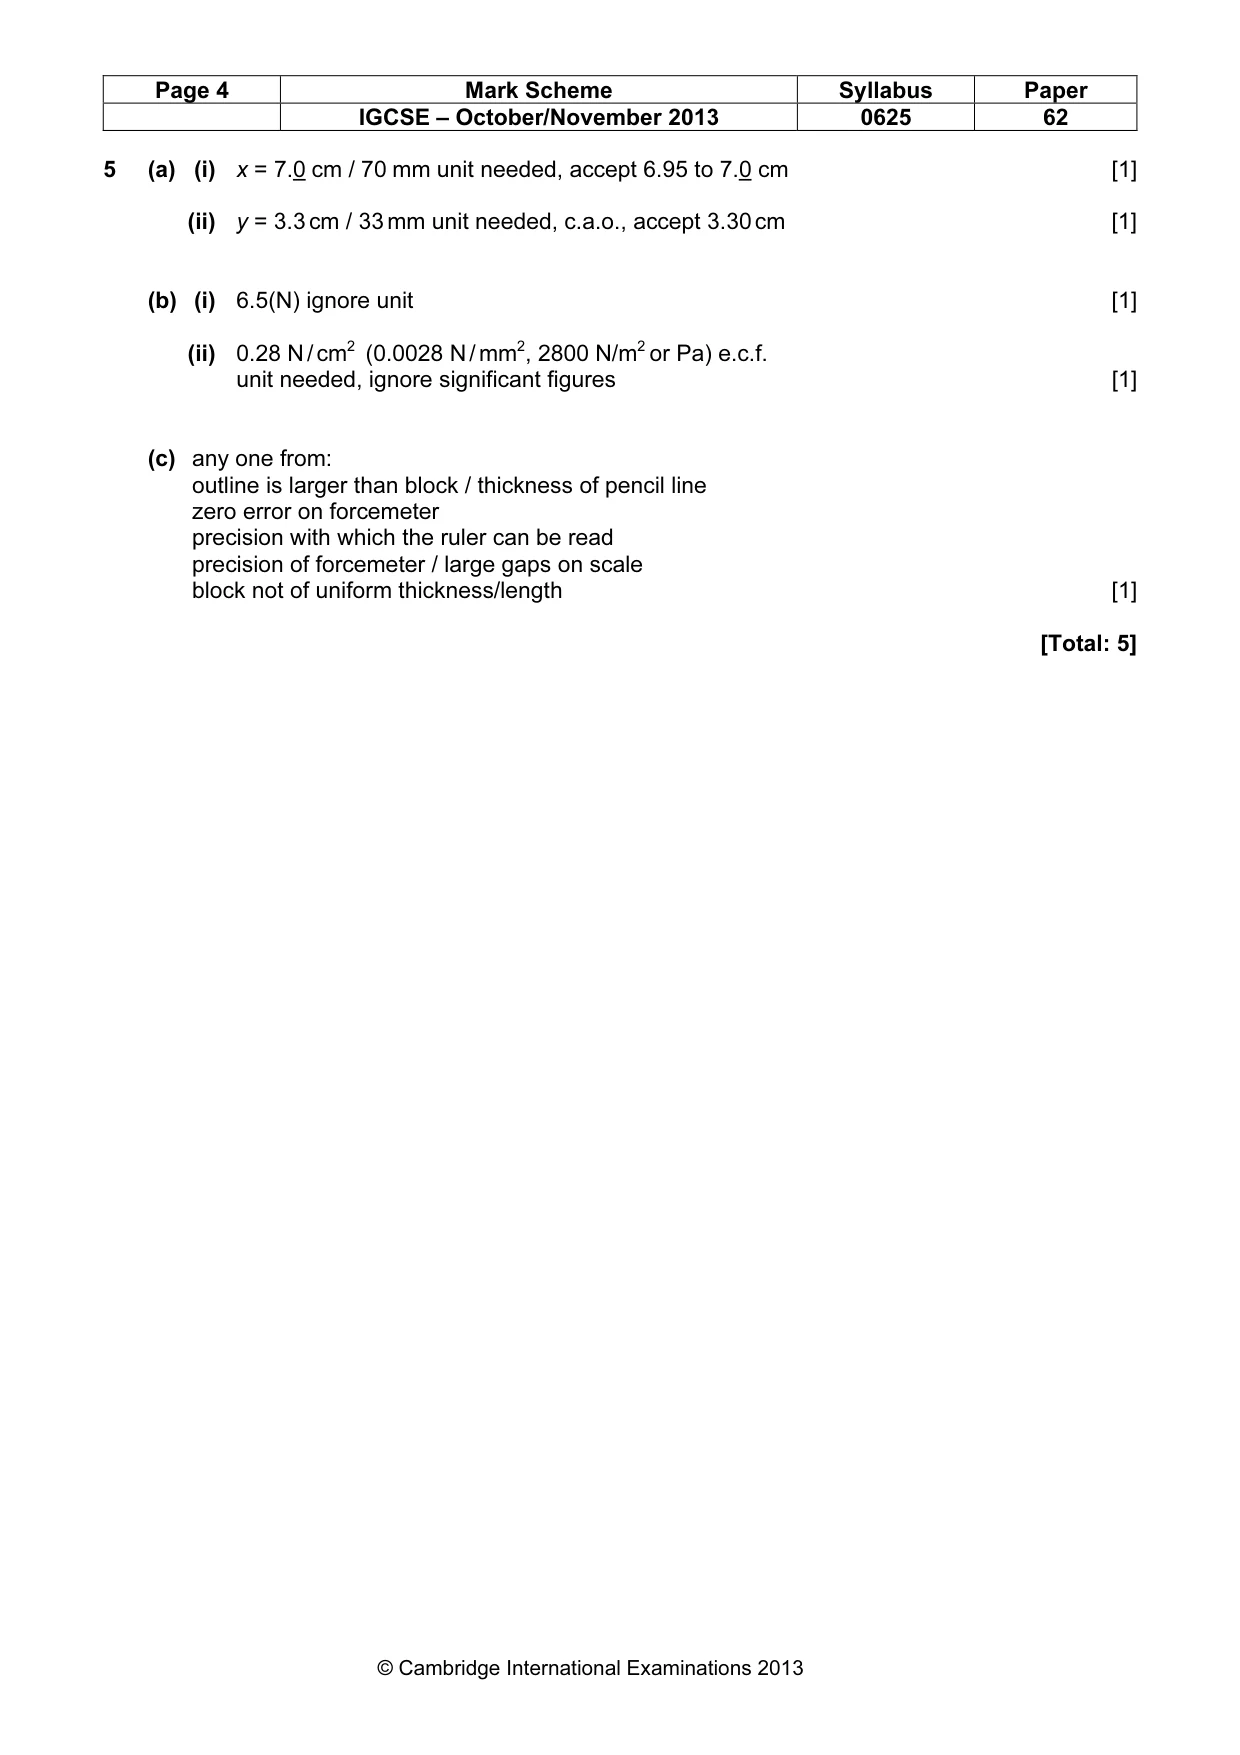
Mark scheme: 5 (a) (i) x = 7.0 cm / 70 mm unit needed, accept 6.95 to 7.0 cm [1] (ii) y = 3.3 cm / 33 mm unit needed, c.a.o., accept 3.30 cm [1] (b) (i) 6.5(N) ignore unit [1] (ii) 0.28 N / cm2 (0.0028 N / mm2, 2800 N/m2 or Pa) e.c.f. unit needed, ignore significant figures [1] (c) any one from: outline is larger than block / thickness of pencil line zero error on forcemeter precision with which the ruler can be read precision of forcemeter / large gaps on scale block not of uniform thickness/length [1] [Total: 5]
More questions on Physical quantities and measurement techniques
What was in this paper
The subtopics covered by these 5 questions, and how many questions each got. Open one in a new tab to see every Cambridge question on it.