Cambridge IGCSE Physics 0625 — 2011 Oct/Nov Paper 6 · Variant 3
0625/63/O/N/11 · 5 questions · 40 marks · ≈45 min
The question paper and its mark scheme, free to read here and free to download. This is Cambridge’s own paper, exactly as it was sat.
Question paper12 pages
Mark scheme4 pages
Answers below. Sit the paper first if you are practising.
Questions as text
Q1 · An IGCSE student is investigating the passage of light through a transparent block using…
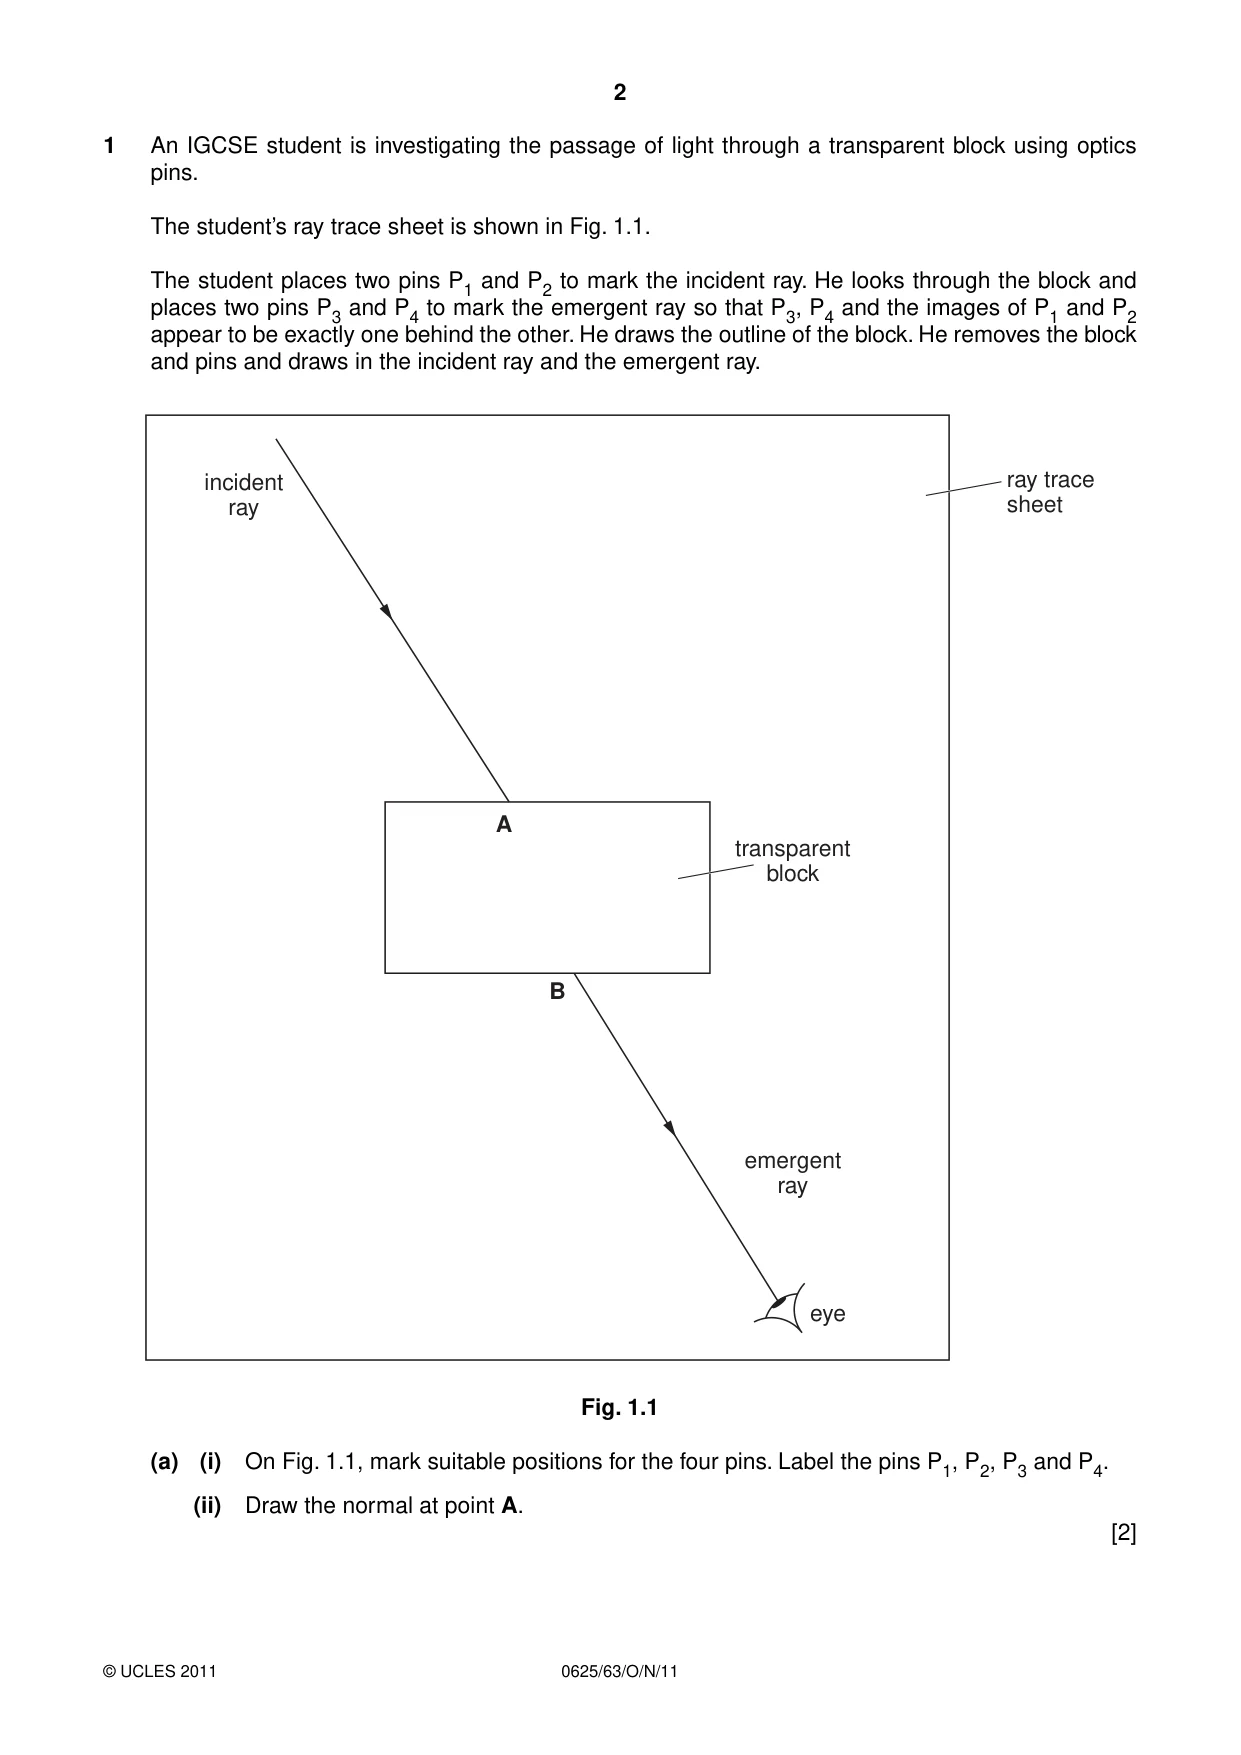
1 An IGCSE student is investigating the passage of light through a transparent block using optics pins. The student’s ray trace sheet is shown in Fig. 1.1. The student places two pins P1 and P2 to mark the incident ray. He looks through the block and places two pins P3 and P4 to mark the emergent ray so that P3, P4 and the images of P1 and P2 appear to be exactly one behind the other. He draws the outline of the block. He removes the block and pins and draws in the incident ray and the emergent ray. incident ray trace ray sheet A transparent block B emergent ray eye Fig. 1.1 (a) (i) On Fig. 1.1, mark suitable positions for the four pins. Label the pins P1, P2, P3 and P4. (ii) Draw the normal at point A. [2] (b) (i) Draw in the line AB. Measure and record the angle of refraction r between the line AB and the normal. r = ............................................................... (ii) Measure and record the angle of incidence i between the incident ray and the normal. i = ............................................................... [2] (c) The student does not have a set square or any other means to check that the pins are vertical. Suggest how he can ensure that his P3 and P4 positions are as accurate as possible. ................................................................................................................................................... ...............................................................................................................................................[1] [Total: 5]
Mark scheme: 1 (a) (i) pins P3 and P4 at least 5 cm apart [1] (ii) normal correct position and at 90° [1] (b) (i) AB drawn neatly and r = 20° ± 2° [1] (ii) i = 32° ± 2°and unit shown at least once and no contradiction [1] (c) view bases of pins / keep line of sight low / view close to table [1] [Total: 5]
Q2 · An IGCSE student is investigating the energy changes that occur when hot water and cold…
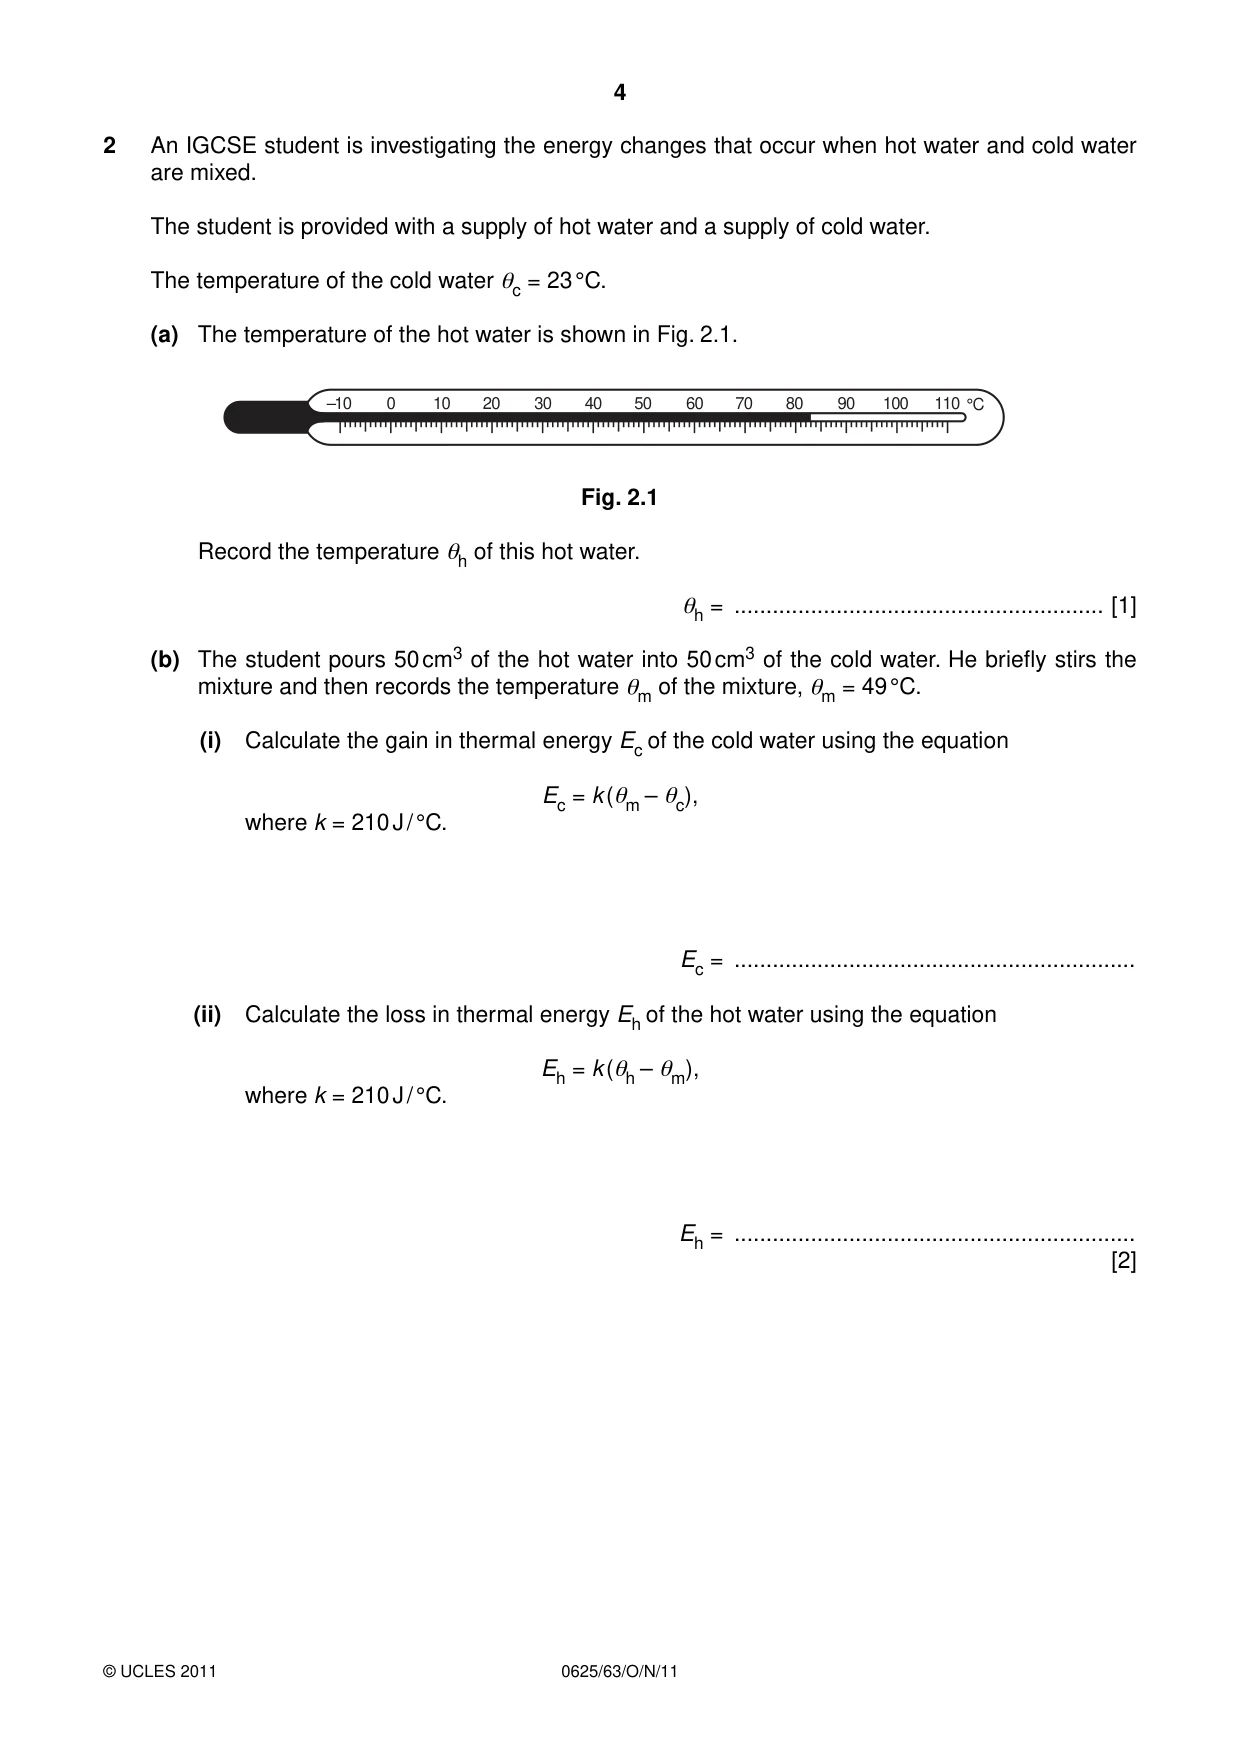
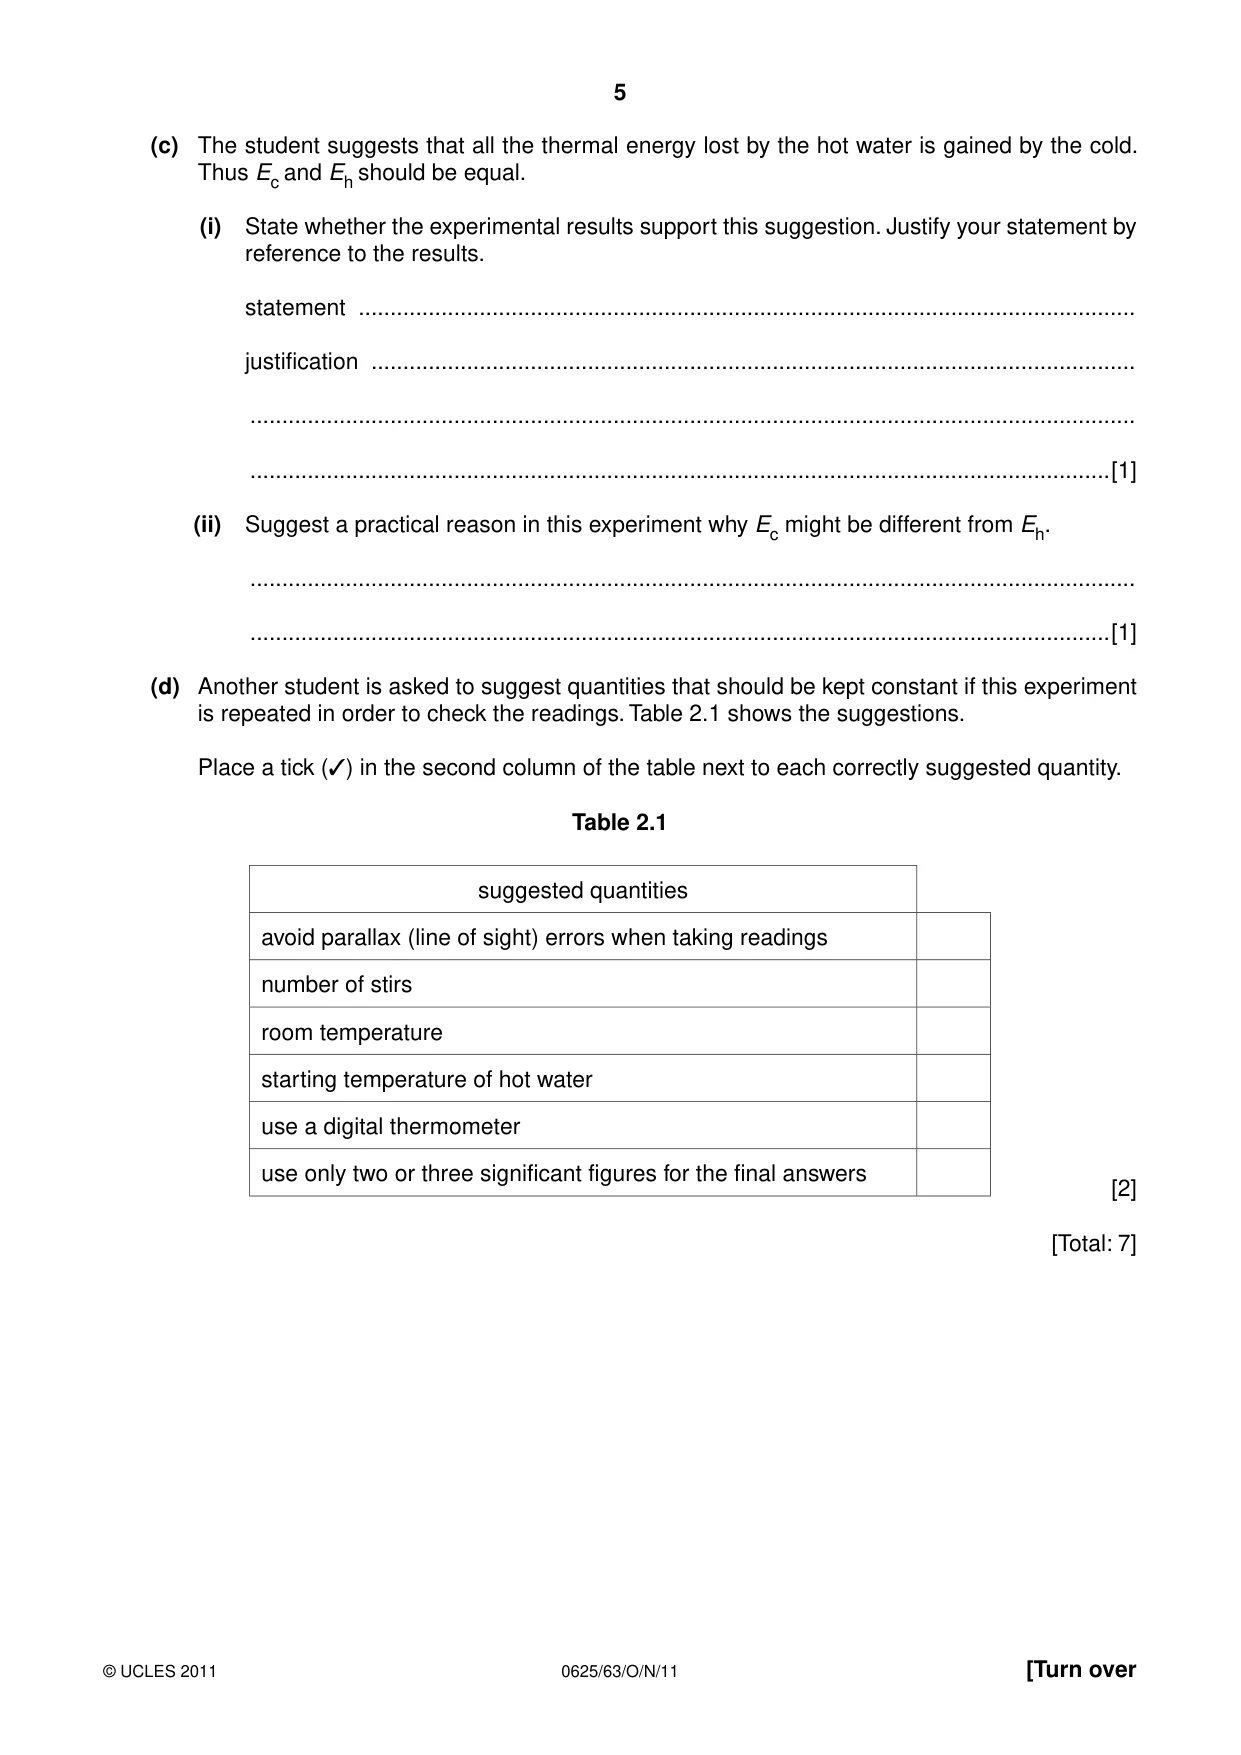
2 An IGCSE student is investigating the energy changes that occur when hot water and cold water are mixed. The student is provided with a supply of hot water and a supply of cold water. The temperature of the cold water θc = 23 °C. (a) The temperature of the hot water is shown in Fig. 2.1. –10 0 10 20 30 40 50 60 70 80 90 100 110 °C Fig. 2.1 Record the temperature θh of this hot water. θh = .......................................................... [1] (b) The student pours 50 cm3 of the hot water into 50 cm3 of the cold water. He briefly stirs the mixture and then records the temperature θm of the mixture, θm = 49 °C. (i) Calculate the gain in thermal energy Ec of the cold water using the equation Ec = k (θm – θc), where k = 210 J / °C. Ec = ............................................................... (ii) Calculate the loss in thermal energy Eh of the hot water using the equation Eh = k (θh – θm), where k = 210 J / °C. Eh = ............................................................... [2] (c) The student suggests that all the thermal energy lost by the hot water is gained by the cold. Thus Ec and Eh should be equal. (i) State whether the experimental results support this suggestion. Justify your statement by reference to the results. statement .......................................................................................................................... justification ........................................................................................................................ ........................................................................................................................................... .......................................................................................................................................[1] (ii) Suggest a practical reason in this experiment why Ec might be different from Eh. ........................................................................................................................................... .......................................................................................................................................[1] (d) Another student is asked to suggest quantities that should be kept constant if this experiment is repeated in order to check the readings. Table 2.1 shows the suggestions. Place a tick (✓) in the second column of the table next to each correctly suggested quantity. Table 2.1 suggested quantities avoid parallax (line of sight) errors when taking readings number of stirs room temperature starting temperature of hot water use a digital thermometer use only two or three significant figures for the final answers [2] [Total: 7]
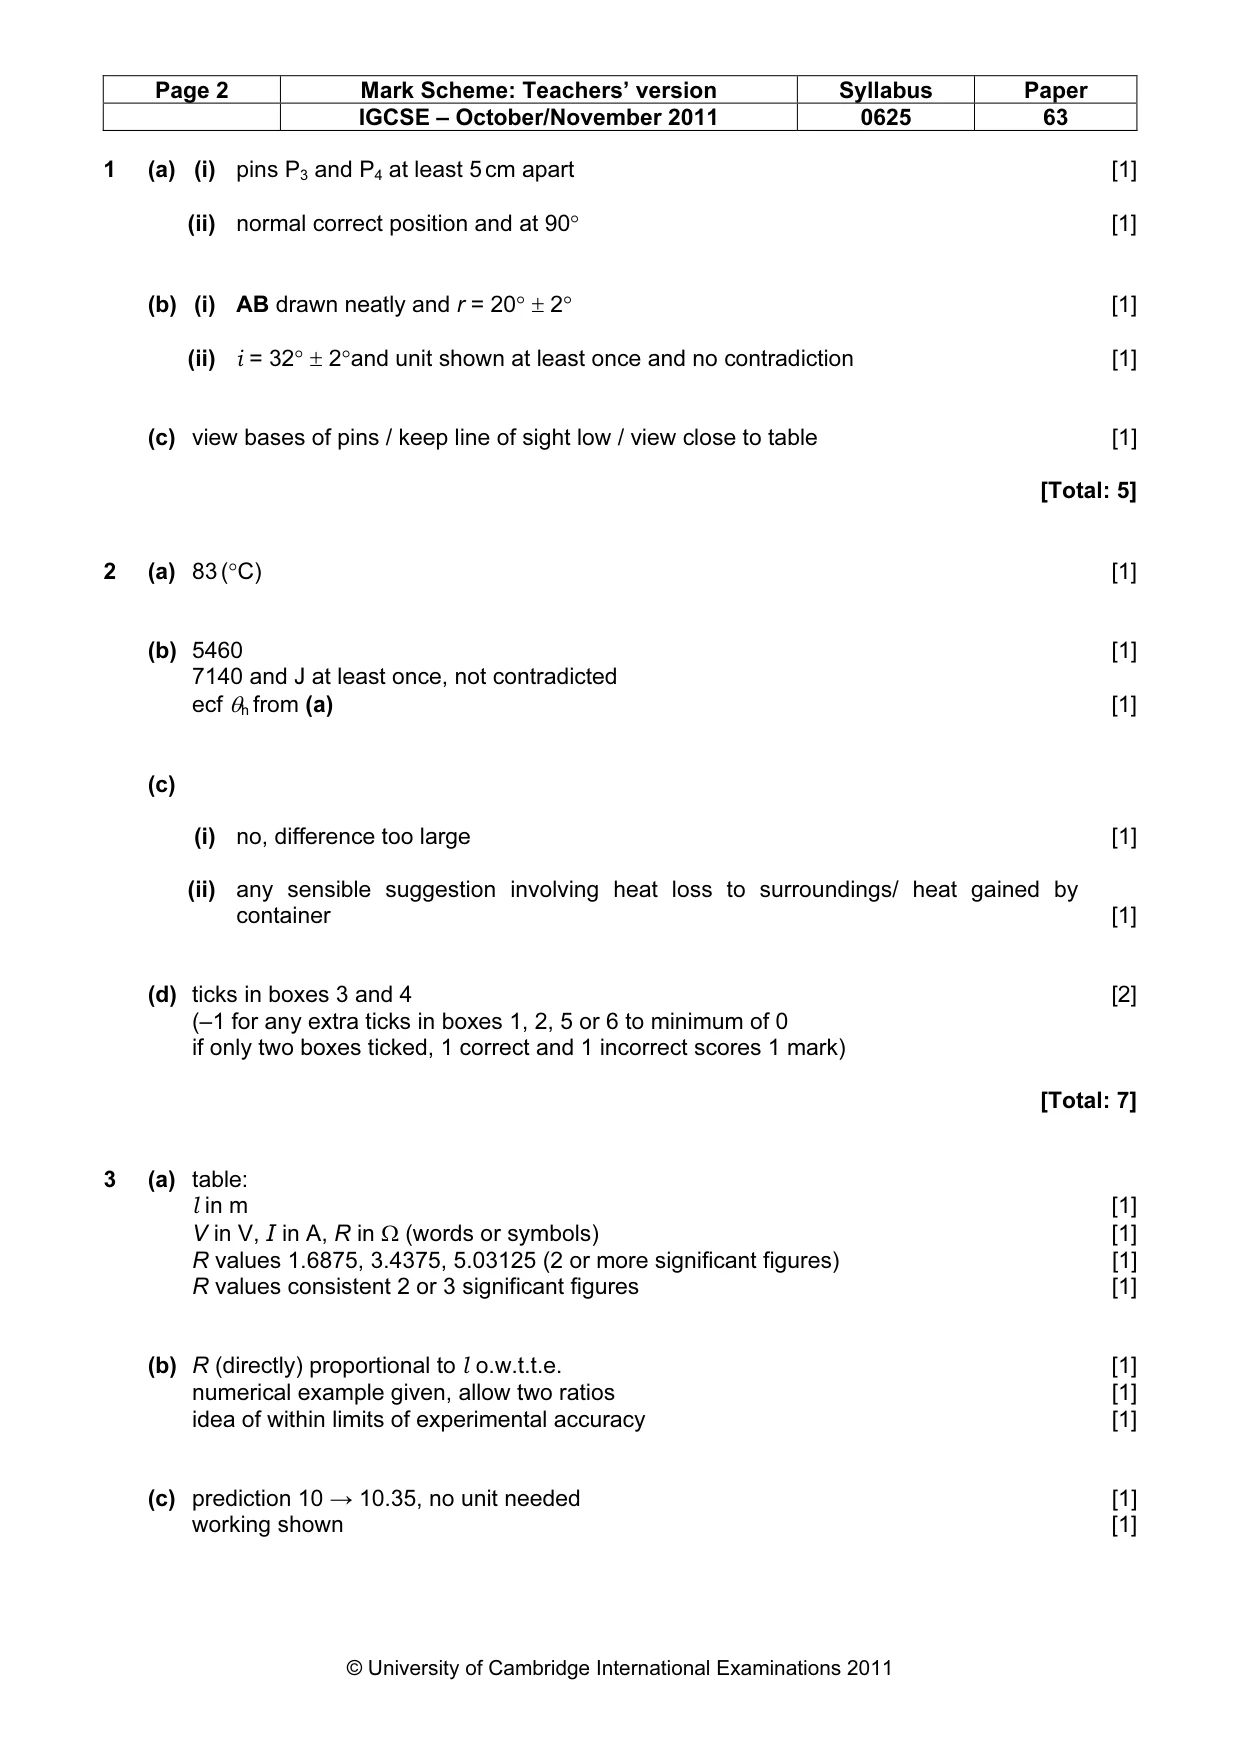
Mark scheme: 2 (a) 83 (°C) [1] (b) 5460 [1] 7140 and J at least once, not contradicted ecf θh from (a) [1] (c) (i) no, difference too large [1] (ii) any sensible suggestion involving heat loss to surroundings/ heat gained by container [1] (d) ticks in boxes 3 and 4 [2] (–1 for any extra ticks in boxes 1, 2, 5 or 6 to minimum of 0 if only two boxes ticked, 1 correct and 1 incorrect scores 1 mark) [Total: 7]
Q3 · The IGCSE class is investigating the resistance of a wire
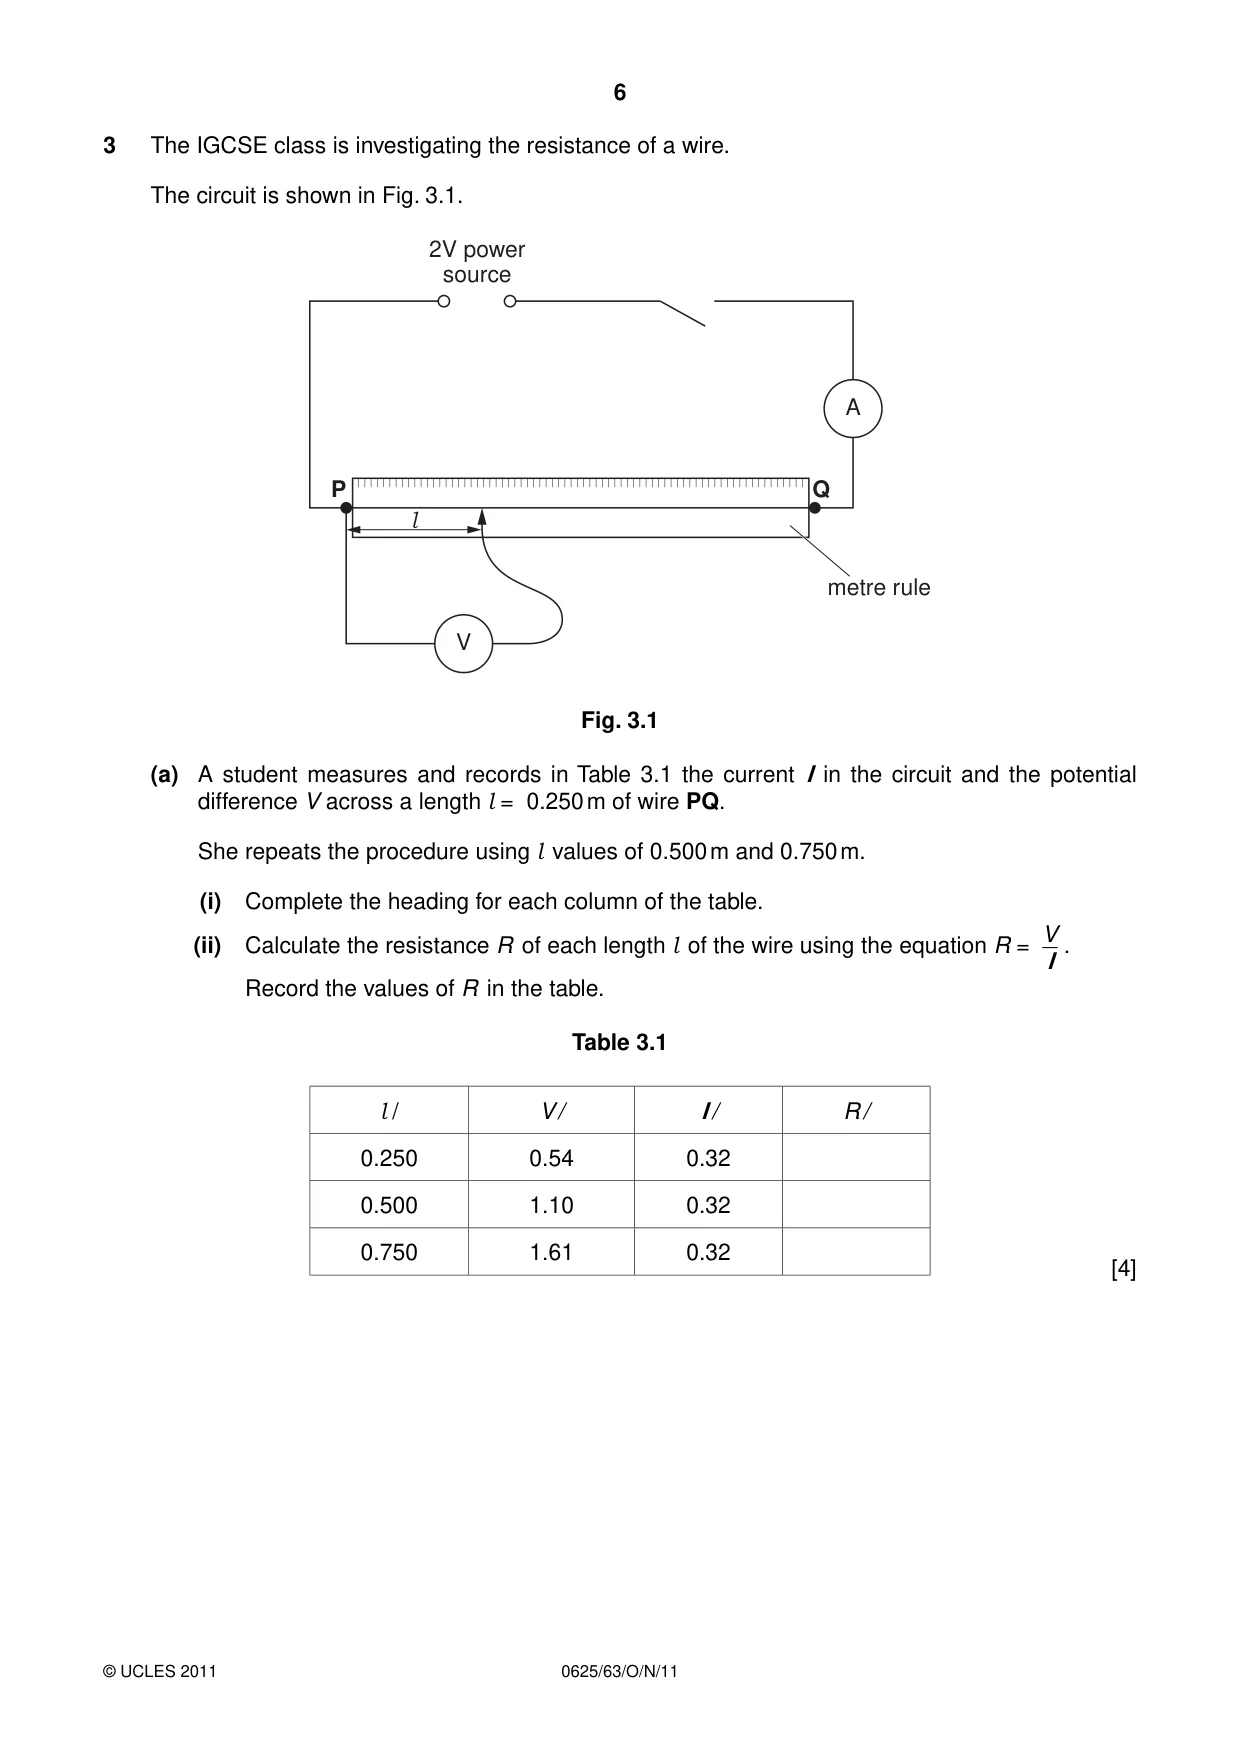
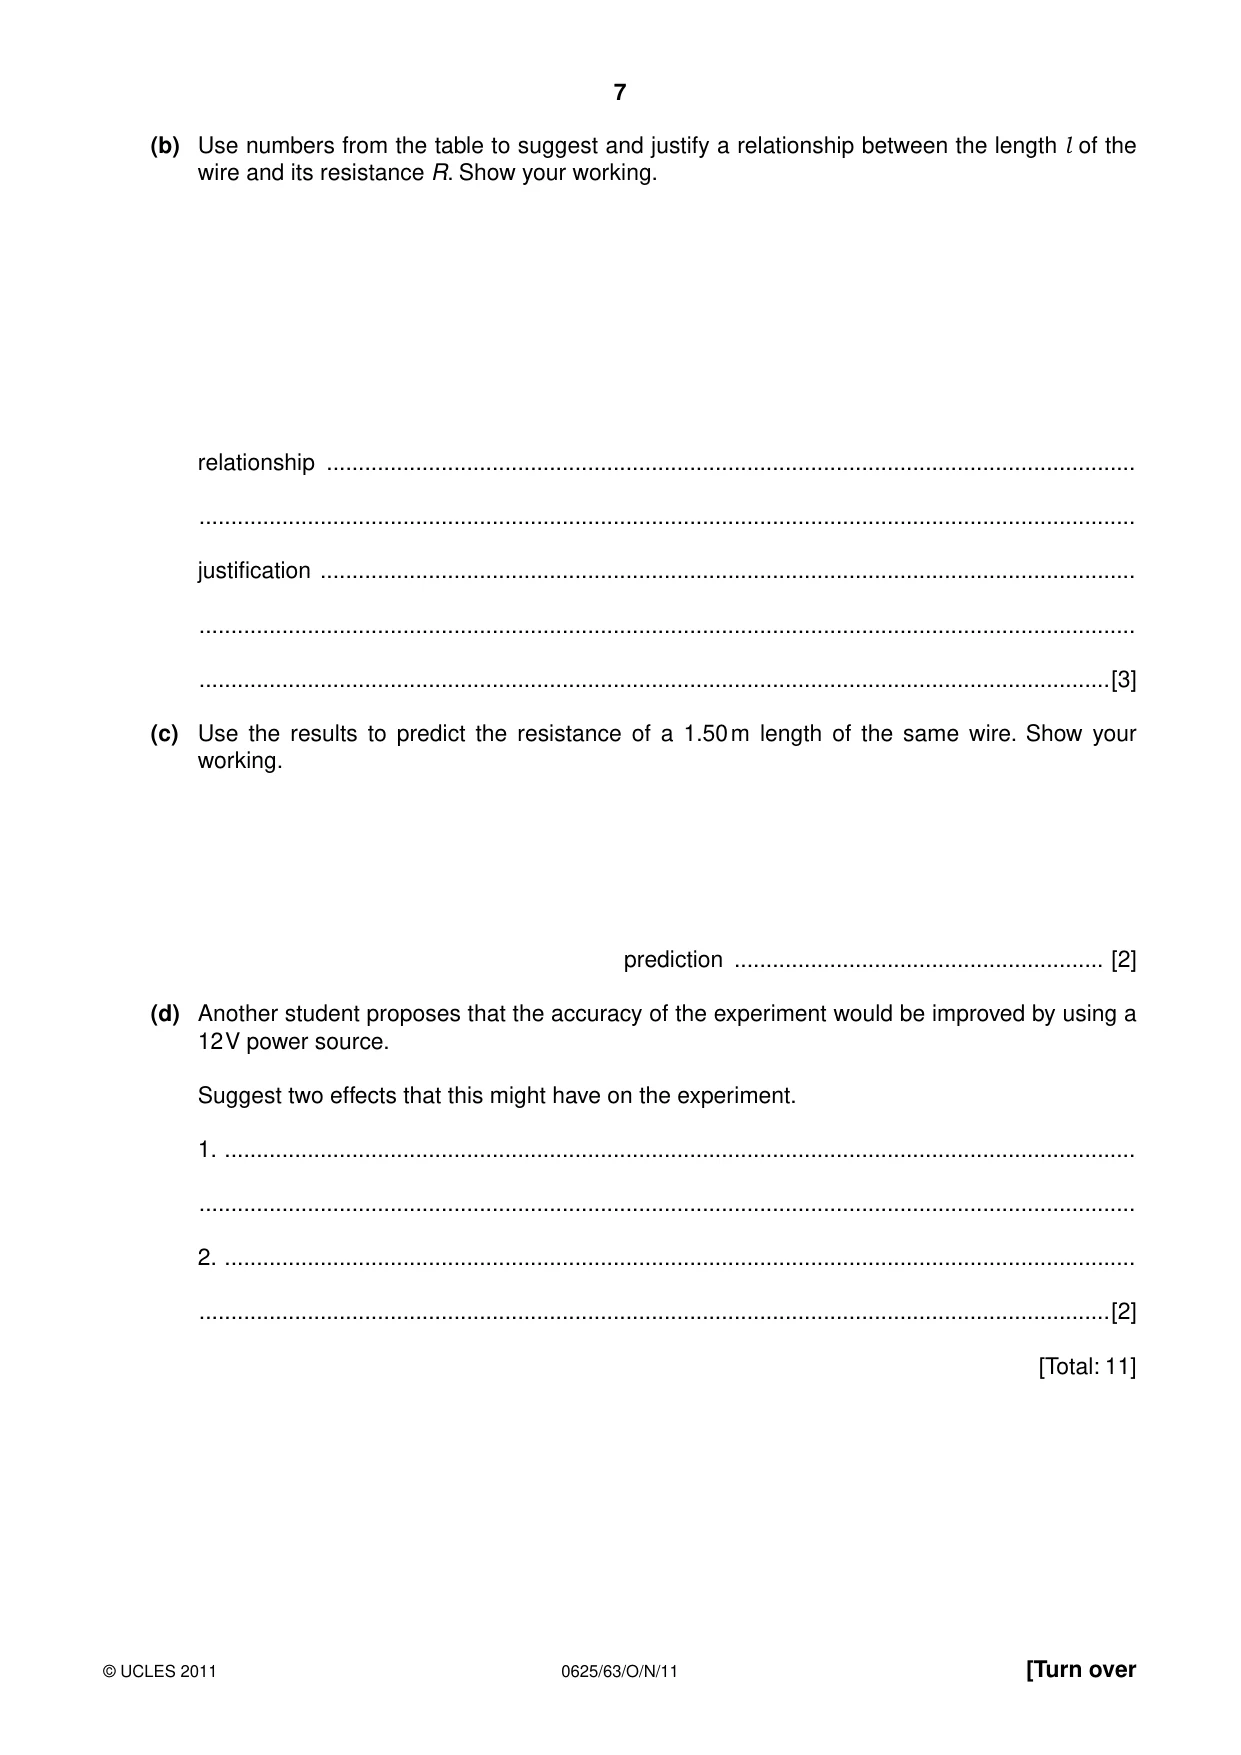
3 The IGCSE class is investigating the resistance of a wire. The circuit is shown in Fig. 3.1. 2V power source A P Q l metre rule V Fig. 3.1 (a) A student measures and records in Table 3.1 the current I in the circuit and the potential difference V across a length l = 0.250 m of wire PQ. She repeats the procedure using l values of 0.500 m and 0.750 m. (i) Complete the heading for each column of the table. V (ii) Calculate the resistance R of each length l of the wire using the equation R = . I Record the values of R in the table. Table 3.1 l / V / I / R / 0.250 0.54 0.32 0.500 1.10 0.32 0.750 1.61 0.32 [4] (b) Use numbers from the table to suggest and justify a relationship between the length l of the wire and its resistance R. Show your working. relationship ............................................................................................................................... ................................................................................................................................................... justification ................................................................................................................................ ................................................................................................................................................... ...............................................................................................................................................[3] (c) Use the results to predict the resistance of a 1.50 m length of the same wire. Show your working. prediction .......................................................... [2] (d) Another student proposes that the accuracy of the experiment would be improved by using a 12 V power source. Suggest two effects that this might have on the experiment. 1. ............................................................................................................................................... ................................................................................................................................................... 2. ............................................................................................................................................... ...............................................................................................................................................[2] [Total: 11]
Mark scheme: 3 (a) table: l in m [1] V in V, I in A, R in Ω (words or symbols) [1] R values 1.6875, 3.4375, 5.03125 (2 or more significant figures) [1] R values consistent 2 or 3 significant figures [1] (b) R (directly) proportional to l o.w.t.t.e. [1] numerical example given, allow two ratios [1] idea of within limits of experimental accuracy [1] (c) prediction 10 → 10.35, no unit needed [1] working shown [1] IGCSE – October/November 2011 0625 63 (d) two from: wire gets hot / burns out meter damaged wire gets floppy / expands higher meter readings / readings off scale power source cuts out / fuses resistance of wire increases [2] [Total: 11]
Q4 · The IGCSE class is investigating the formation of images by a lens
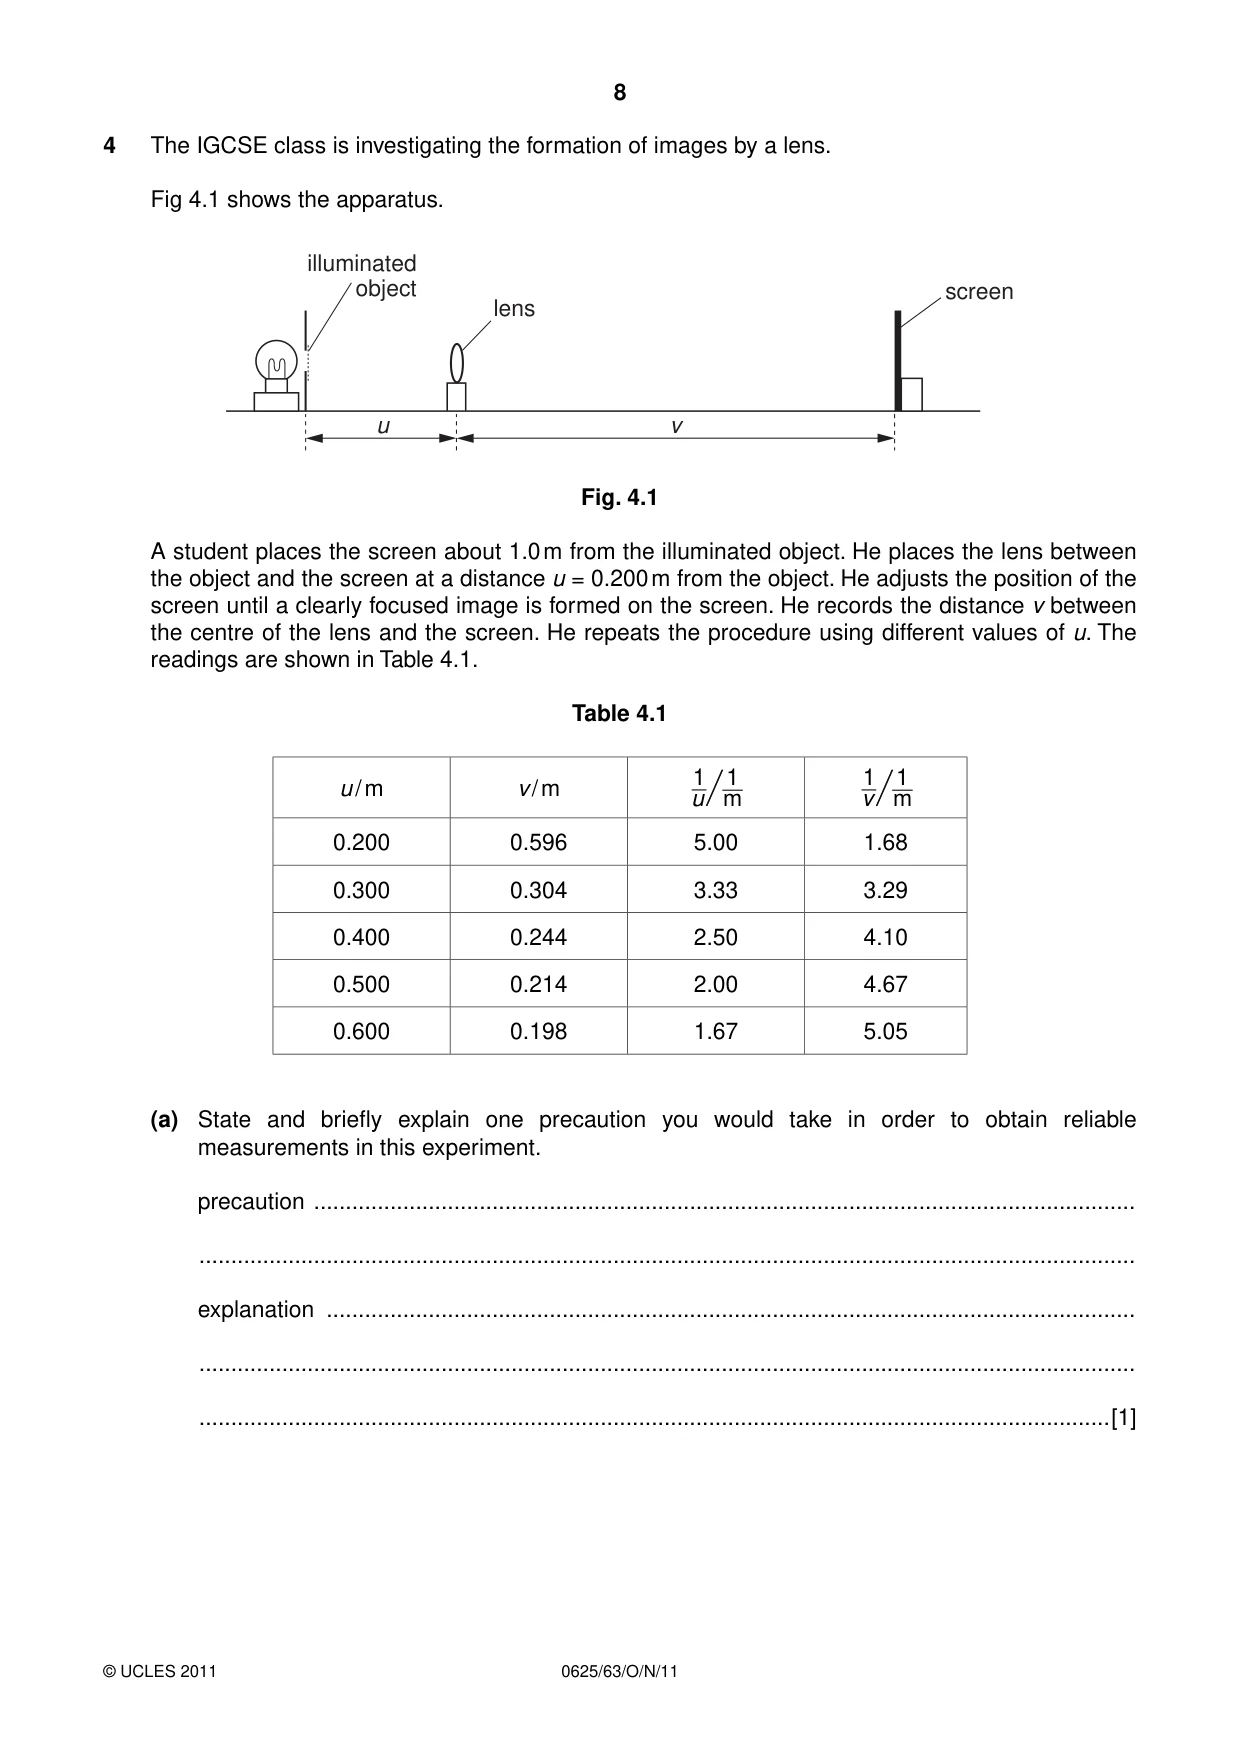
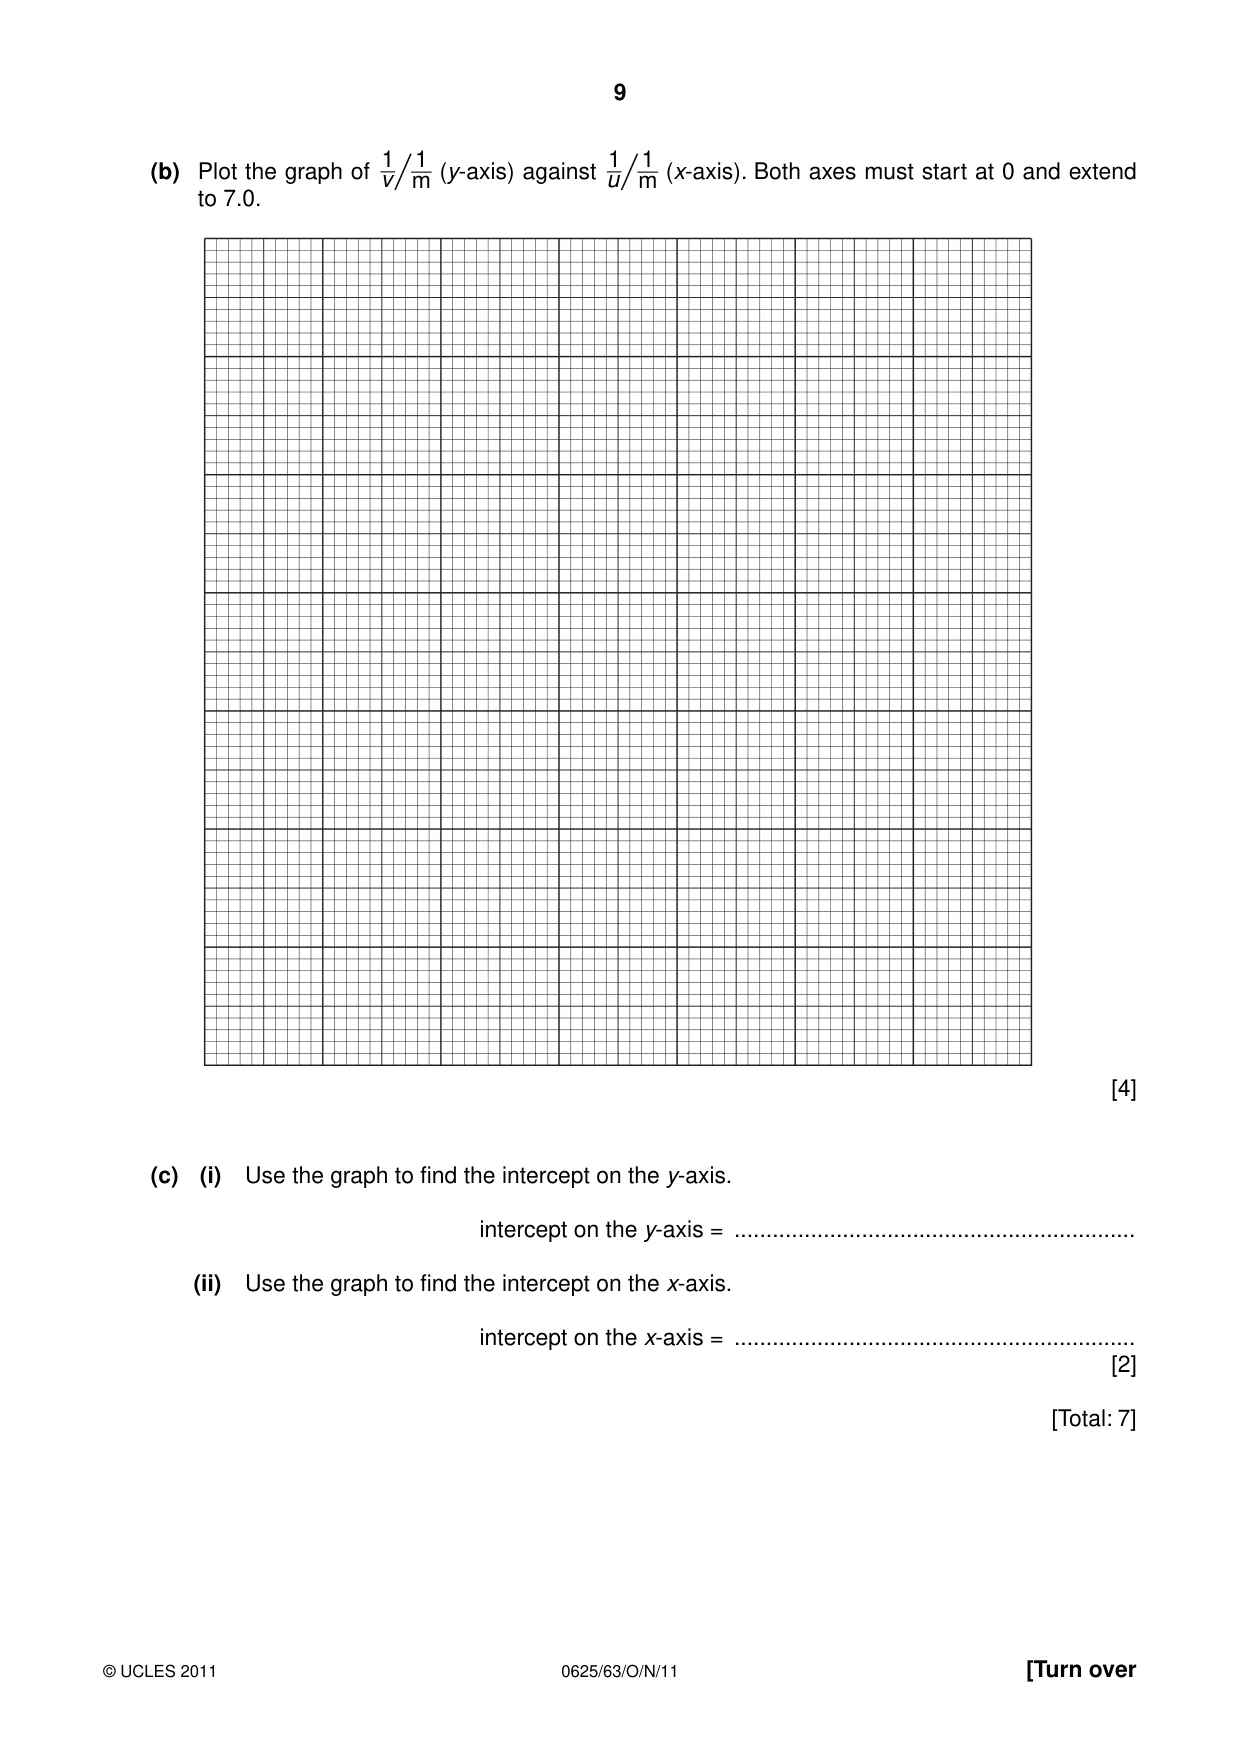
4 The IGCSE class is investigating the formation of images by a lens. Fig 4.1 shows the apparatus. illuminated object screen lens u v Fig. 4.1 A student places the screen about 1.0 m from the illuminated object. He places the lens between the object and the screen at a distance u = 0.200 m from the object. He adjusts the position of the screen until a clearly focused image is formed on the screen. He records the distance v between the centre of the lens and the screen. He repeats the procedure using different values of u. The readings are shown in Table 4.1. Table 4.1 1 1 1 1 u / m v / m u/ m v/ m 0.200 0.596 5.00 1.68 0.300 0.304 3.33 3.29 0.400 0.244 2.50 4.10 0.500 0.214 2.00 4.67 0.600 0.198 1.67 5.05 (a) State and briefly explain one precaution you would take in order to obtain reliable measurements in this experiment. precaution ................................................................................................................................. ................................................................................................................................................... explanation ............................................................................................................................... ................................................................................................................................................... ...............................................................................................................................................[1] 1 1 1 1 (b) Plot the graph of (y-axis) against (x-axis). Both axes must start at 0 and extend m m v/ u/ to 7.0. [4] (c) (i) Use the graph to find the intercept on the y-axis. intercept on the y-axis = ............................................................... (ii) Use the graph to find the intercept on the x-axis. intercept on the x-axis = ............................................................... [2] [Total: 7]
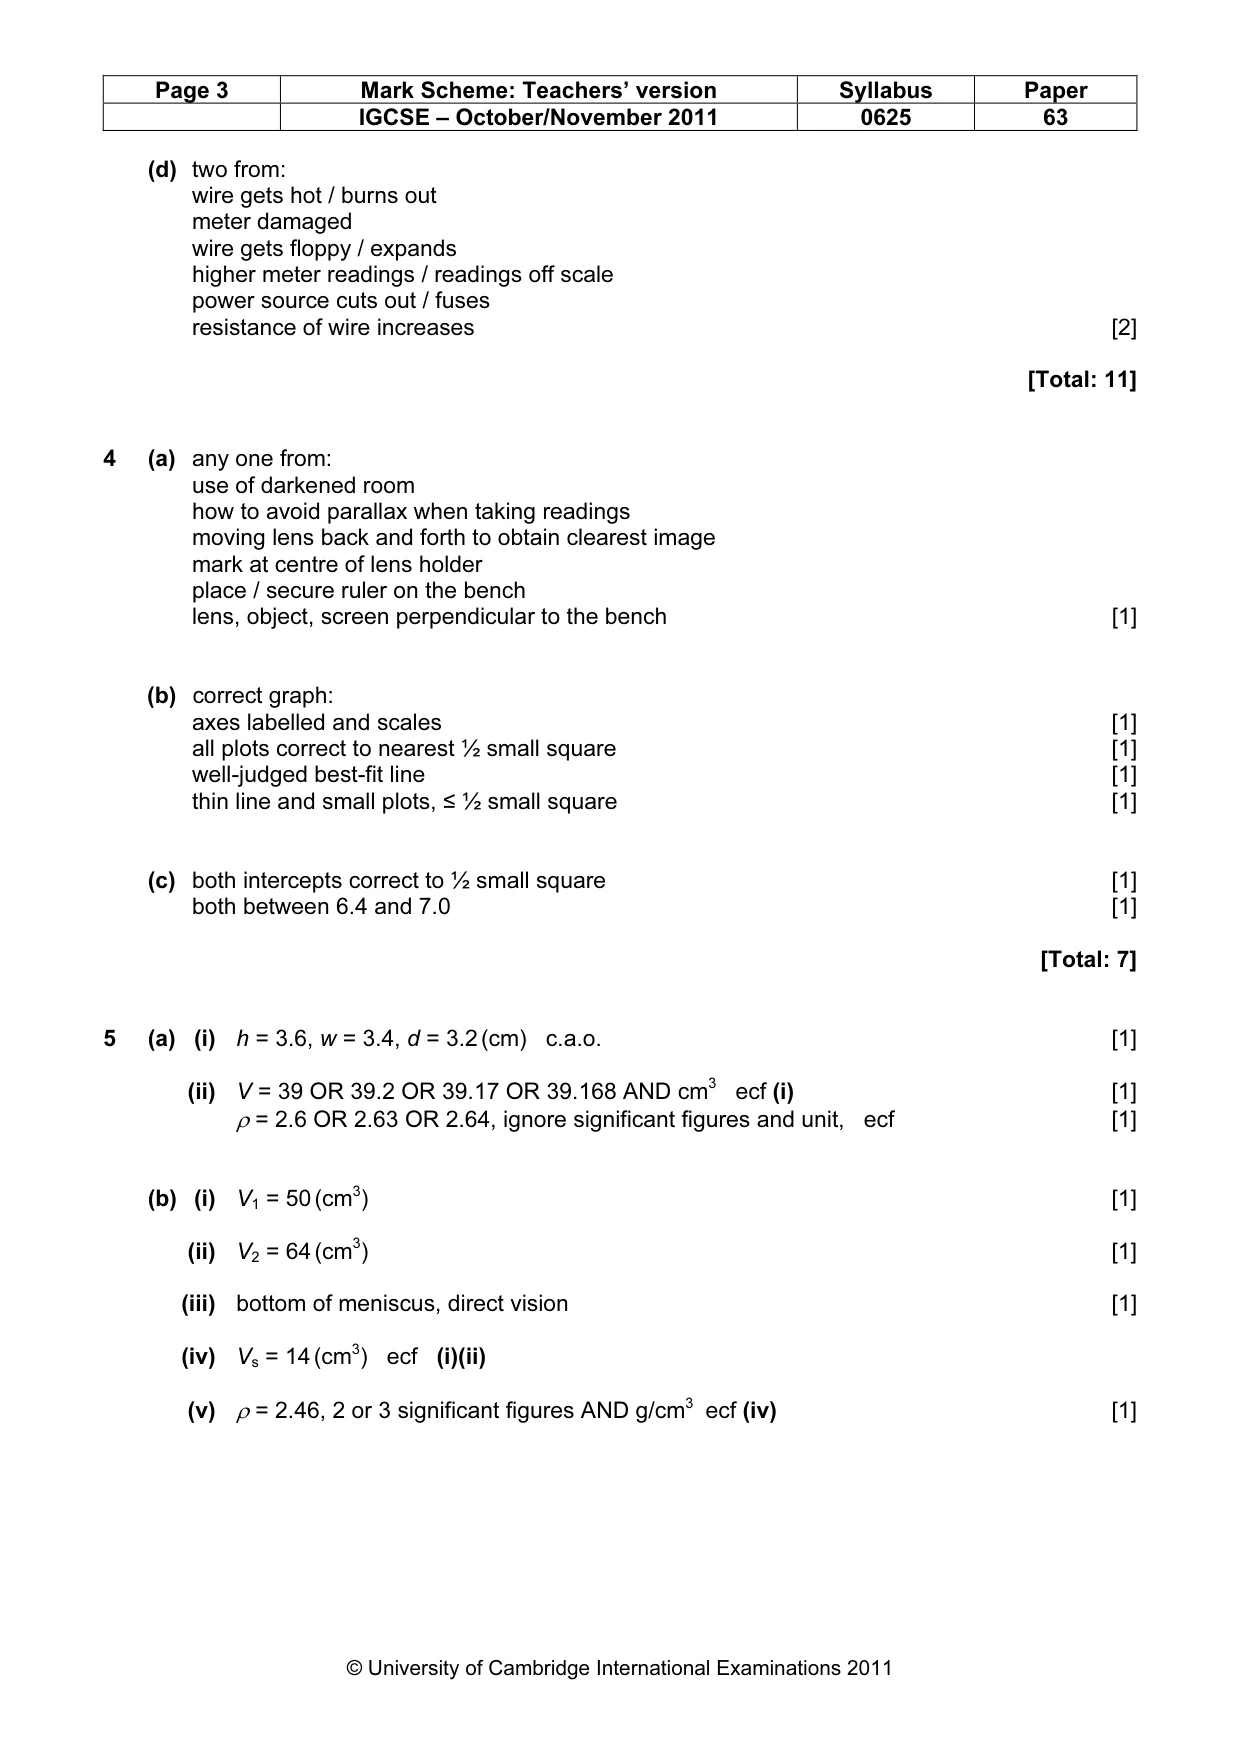
Mark scheme: 4 (a) any one from: use of darkened room how to avoid parallax when taking readings moving lens back and forth to obtain clearest image mark at centre of lens holder place / secure ruler on the bench lens, object, screen perpendicular to the bench [1] (b) correct graph: axes labelled and scales [1] all plots correct to nearest ½ small square [1] well-judged best-fit line [1] thin line and small plots, ≤ ½ small square [1] (c) both intercepts correct to ½ small square [1] both between 6.4 and 7.0 [1] [Total: 7]
More questions on Physical quantities and measurement techniques
Q5 · The IGSCE class is determining the density of modelling clay by two methods
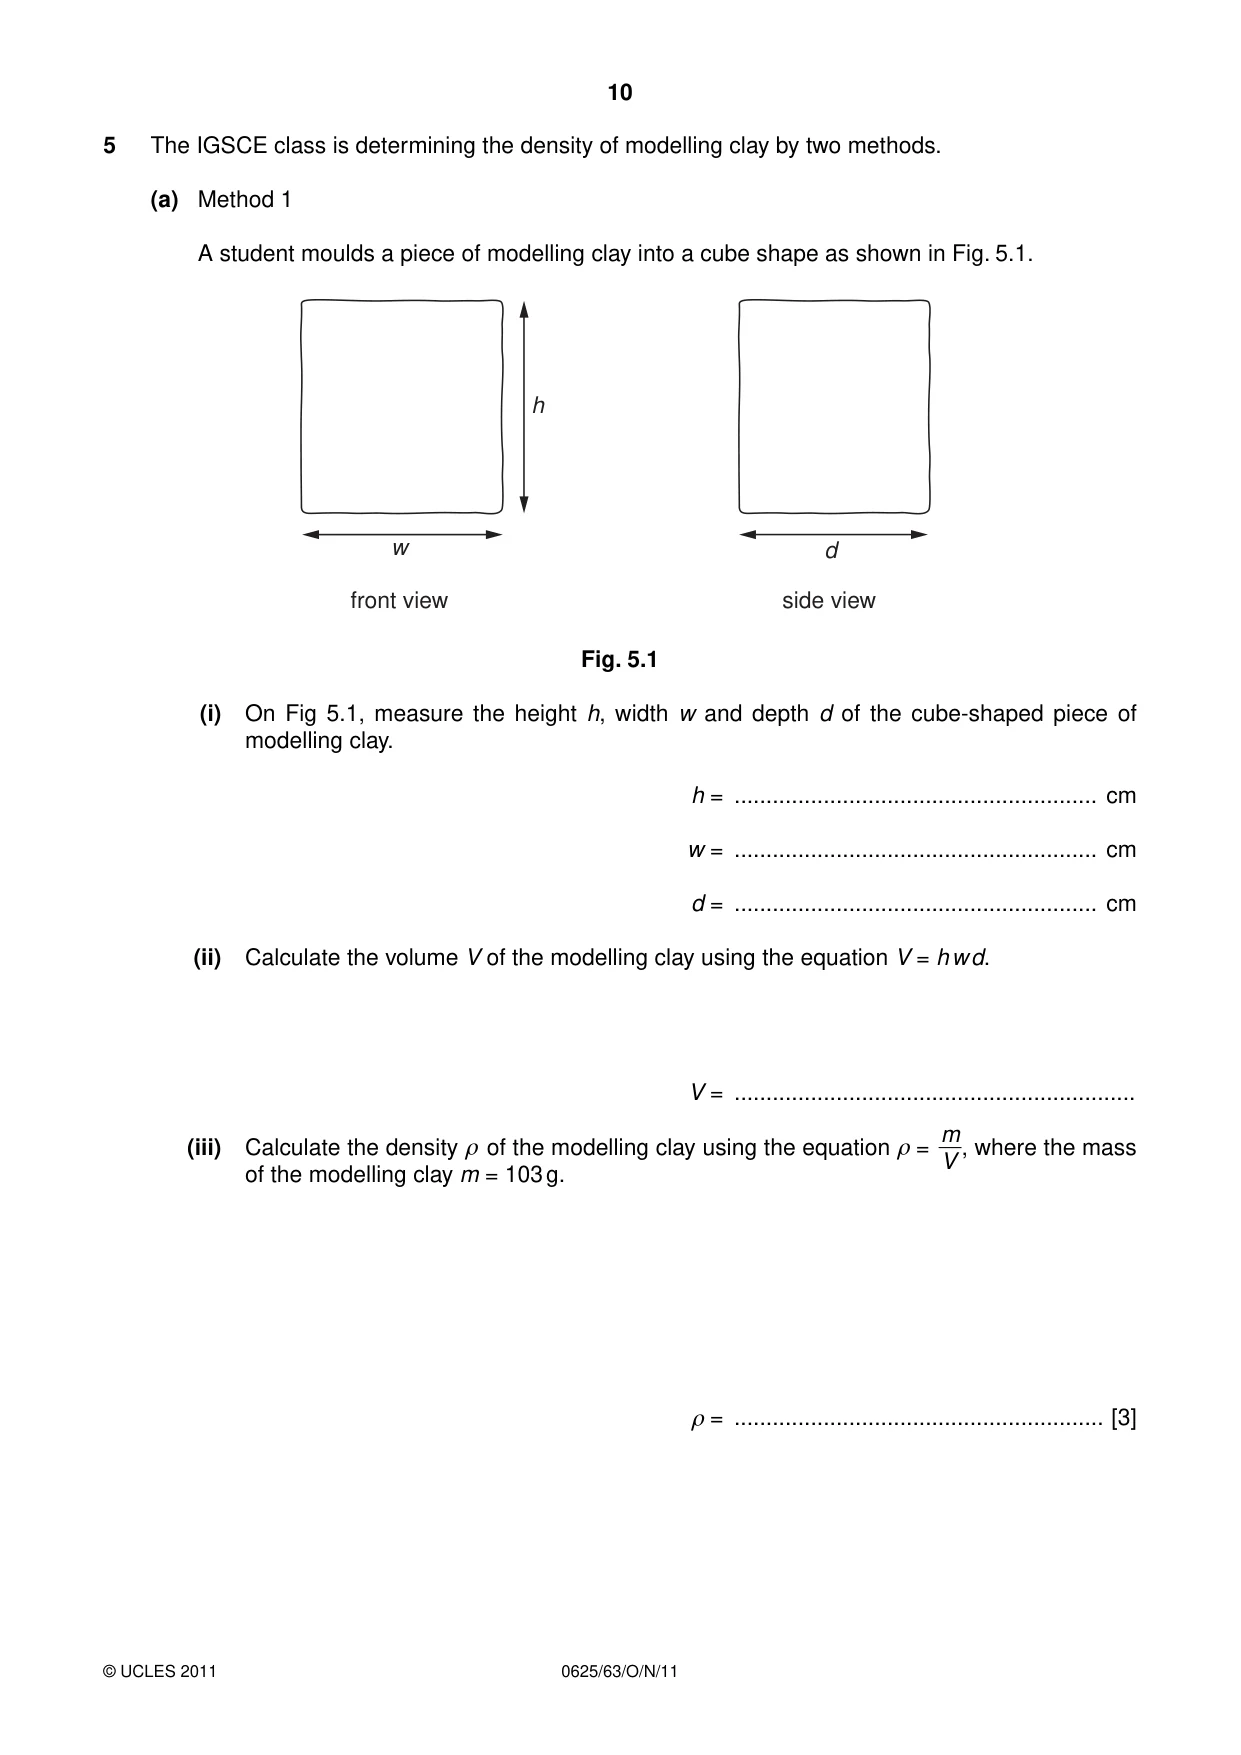
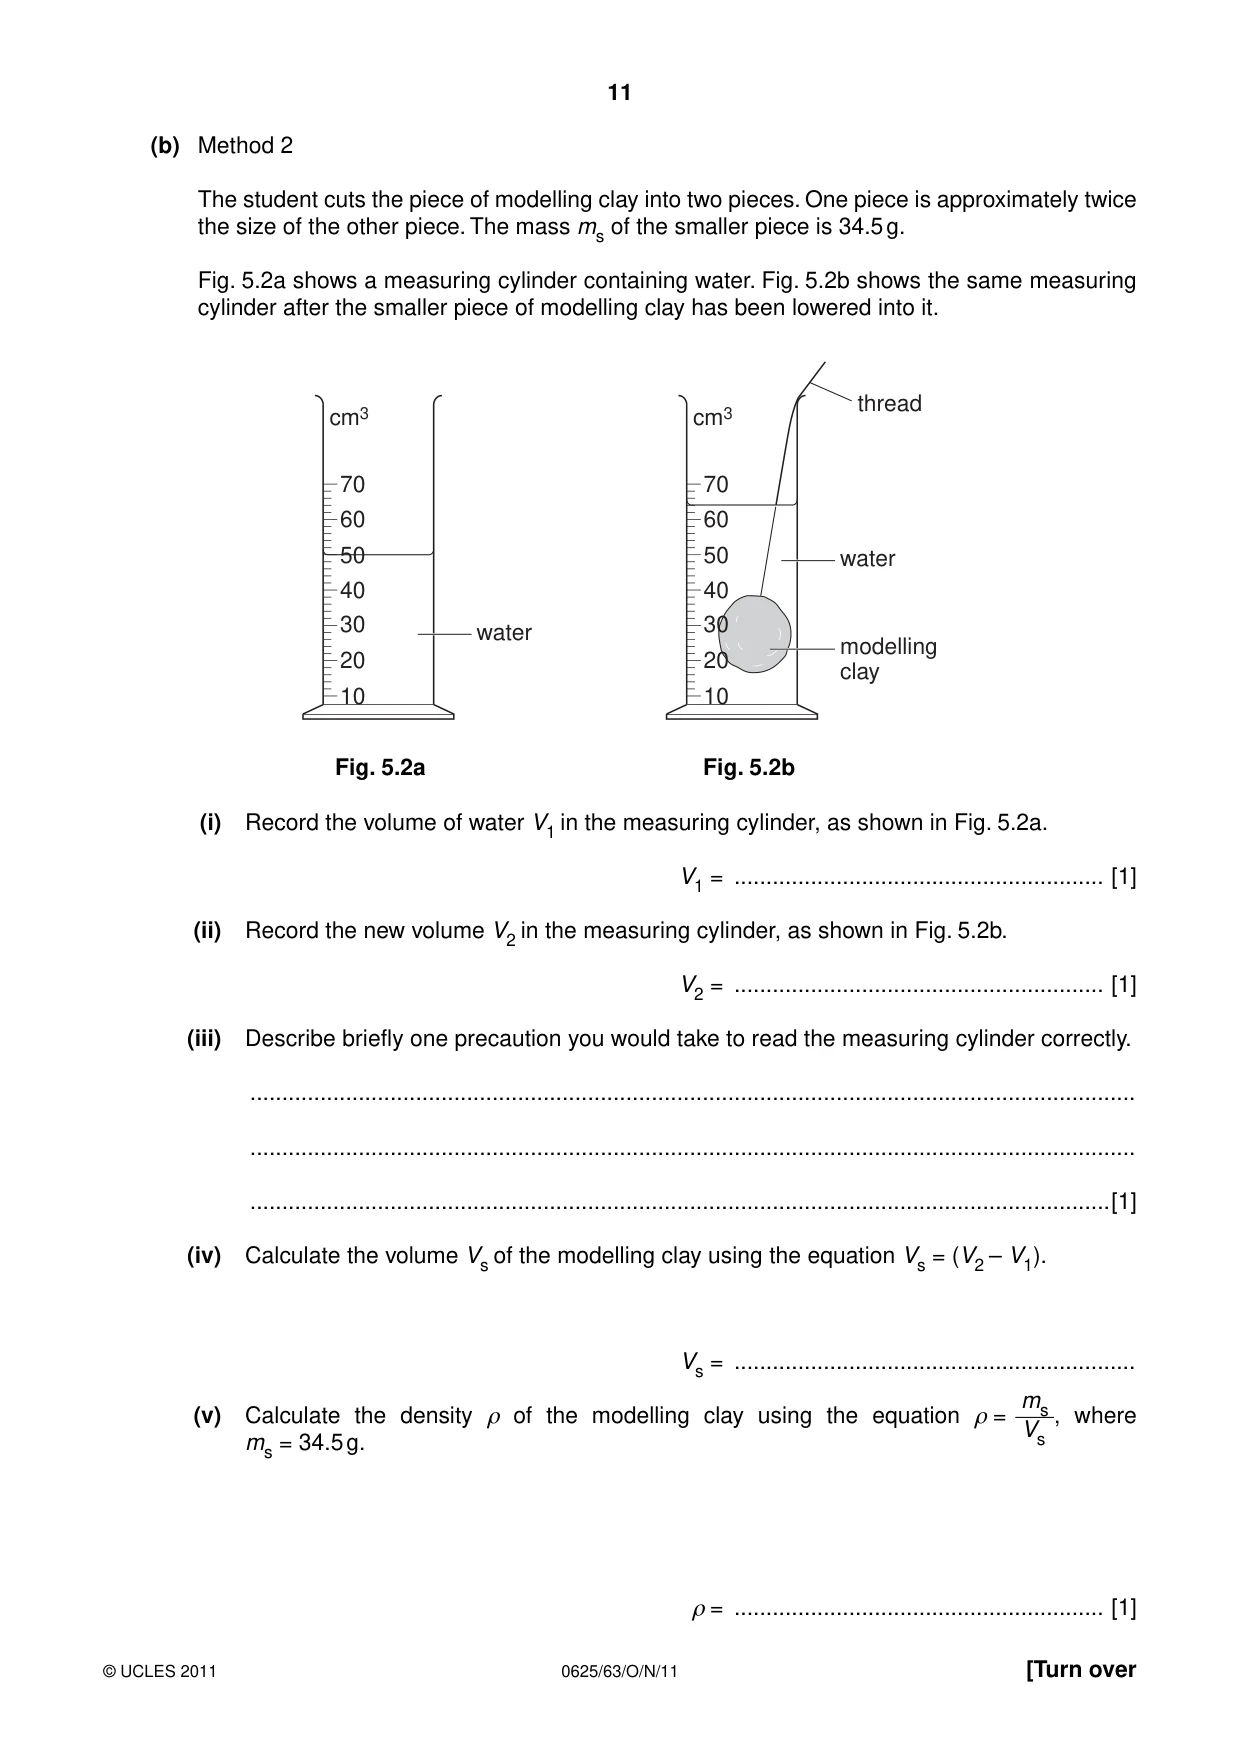
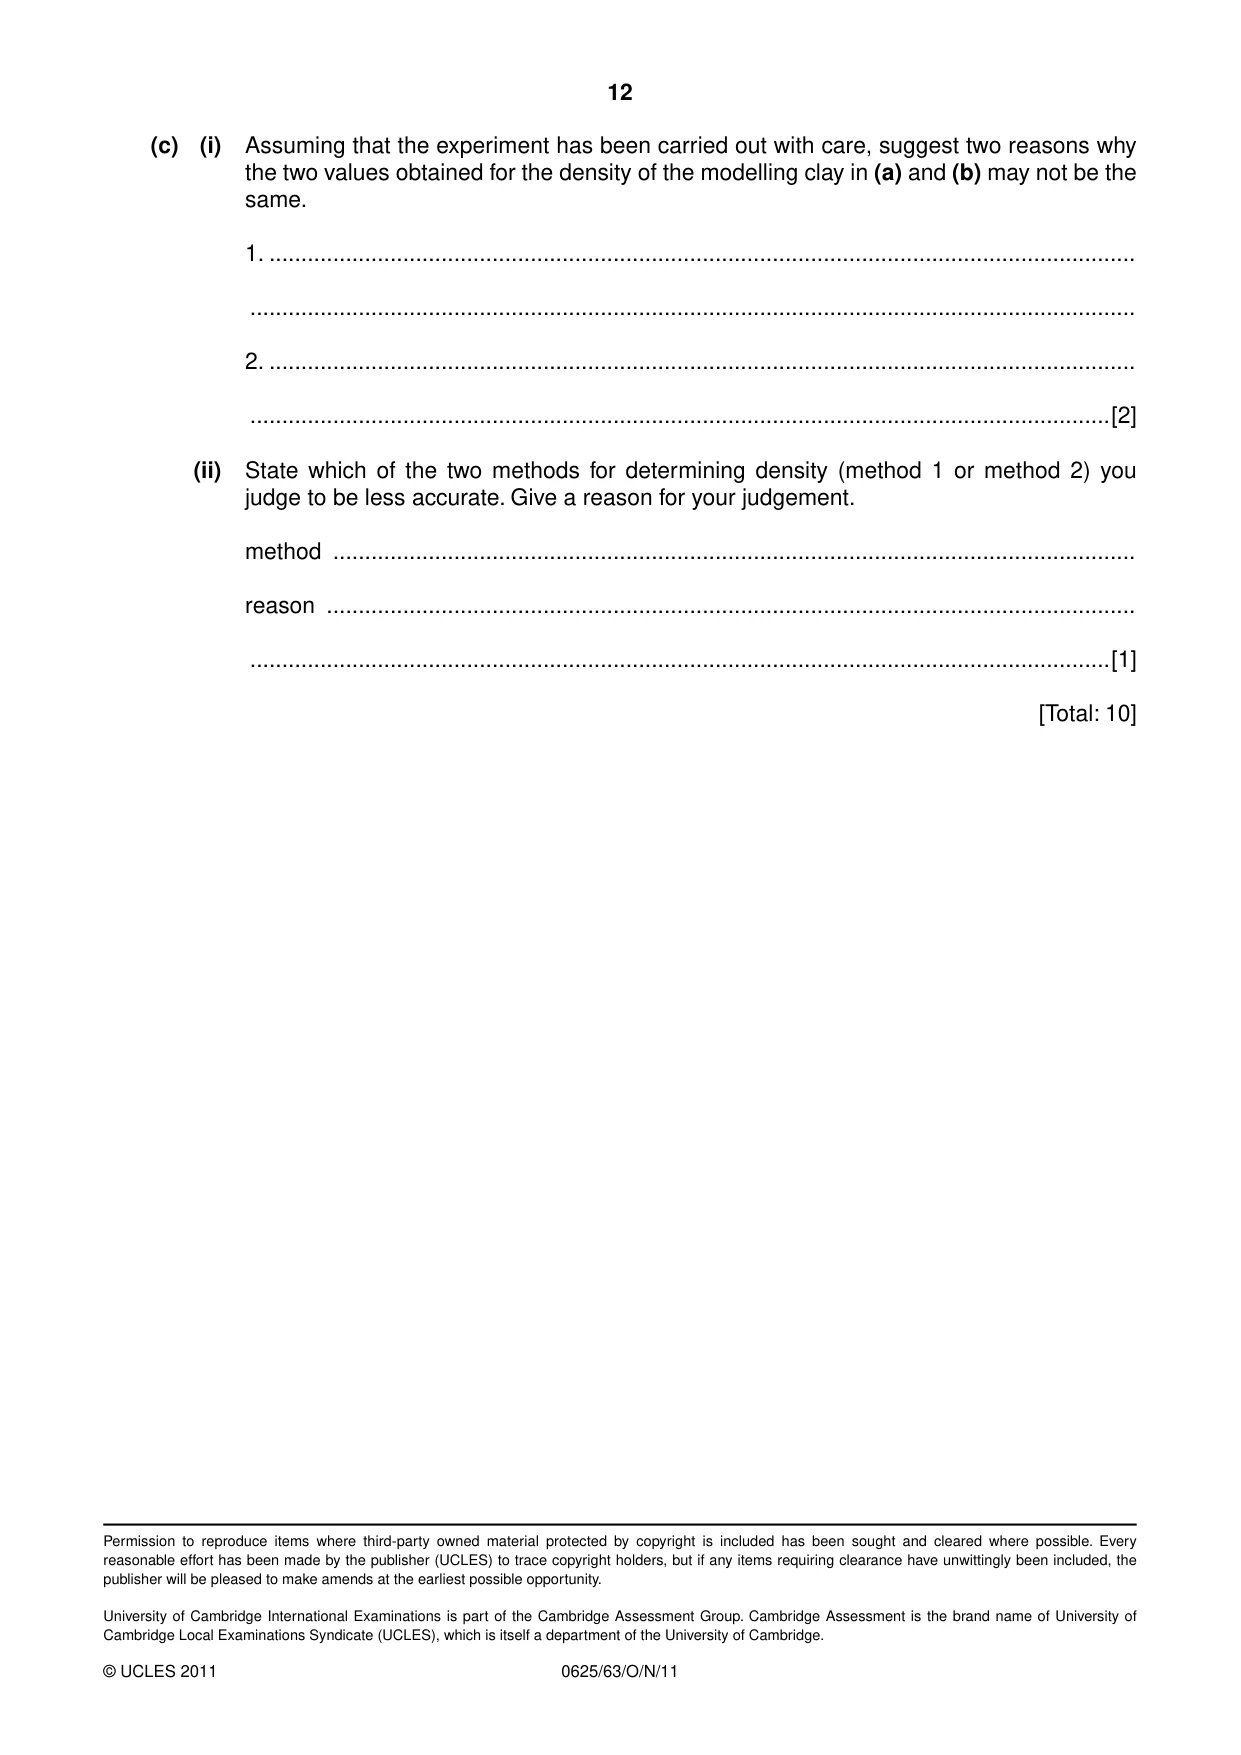
5 The IGSCE class is determining the density of modelling clay by two methods. (a) Method 1 A student moulds a piece of modelling clay into a cube shape as shown in Fig. 5.1. h w d front view side view Fig. 5.1 (i) On Fig 5.1, measure the height h, width w and depth d of the cube-shaped piece of modelling clay. h = ......................................................... cm w = ......................................................... cm d = ......................................................... cm (ii) Calculate the volume V of the modelling clay using the equation V = h w d. V = ............................................................... m (iii) Calculate the density ρ of the modelling clay using the equation ρ = , where the mass V of the modelling clay m = 103 g. ρ = .......................................................... [3] (b) Method 2 The student cuts the piece of modelling clay into two pieces. One piece is approximately twice the size of the other piece. The mass ms of the smaller piece is 34.5 g. Fig. 5.2a shows a measuring cylinder containing water. Fig. 5.2b shows the same measuring cylinder after the smaller piece of modelling clay has been lowered into it. thread cm3 cm3 70 70 60 60 50 50 water 40 40 30 30 water modelling 20 20 clay 10 10 Fig. 5.2a Fig. 5.2b (i) Record the volume of water V1 in the measuring cylinder, as shown in Fig. 5.2a. V1 = .......................................................... [1] (ii) Record the new volume V2 in the measuring cylinder, as shown in Fig. 5.2b. V2 = .......................................................... [1] (iii) Describe briefly one precaution you would take to read the measuring cylinder correctly. ........................................................................................................................................... ........................................................................................................................................... .......................................................................................................................................[1] (iv) Calculate the volume Vs of the modelling clay using the equation Vs = (V2 – V1). Vs = ............................................................... ms (v) Calculate the density ρ of the modelling clay using the equation ρ = , where Vs ms = 34.5 g. ρ = .......................................................... [1] (c) (i) Assuming that the experiment has been carried out with care, suggest two reasons why the two values obtained for the density of the modelling clay in (a) and (b) may not be the same. 1. ........................................................................................................................................ ........................................................................................................................................... 2. ........................................................................................................................................ .......................................................................................................................................[2] (ii) State which of the two methods for determining density (method 1 or method 2) you judge to be less accurate. Give a reason for your judgement. method .............................................................................................................................. reason ............................................................................................................................... .......................................................................................................................................[1] [Total: 10]
Mark scheme: 5 (a) (i) h = 3.6, w = 3.4, d = 3.2 (cm) c.a.o. [1] (ii) V = 39 OR 39.2 OR 39.17 OR 39.168 AND cm3 ecf (i) [1] ρ = 2.6 OR 2.63 OR 2.64, ignore significant figures and unit, ecf [1] (b) (i) V1 = 50 (cm3) [1] (ii) V2 = 64 (cm3) [1] (iii) bottom of meniscus, direct vision [1] (iv) Vs = 14 (cm3) ecf (i)(ii) (v) ρ = 2.46, 2 or 3 significant figures AND g/cm3 ecf (iv) [1] IGCSE – October/November 2011 0625 63 (c) (i) two from: difficulty of making perfect cuboid shape o.w.t.t.e. measuring cylinder readings only to nearest cm3 o.w.t.t.e. smaller mass so greater inaccuracy volume of thread not taken into account air bubbles in clay / uneven density distribution / clay may absorb water / some clay may stick to the knife [2] (ii) either method but with sensible matching reason [1] [Total: 10]
What was in this paper
The subtopics covered by these 5 questions, and how many questions each got. Open one in a new tab to see every Cambridge question on it.
What you needed in this session
Cambridge’s own grade thresholds for 2011 Oct/Nov, Paper 6 · Variant 3. A higher threshold means an easier paper — the bar moves with how the cohort did.