Cambridge IGCSE Physics 0625 — 2011 Oct/Nov Paper 6 · Variant 1
0625/61/O/N/11 · 5 questions · 40 marks · ≈45 min
The question paper and its mark scheme, free to read here and free to download. This is Cambridge’s own paper, exactly as it was sat.
Question paper12 pages
Mark scheme4 pages
Answers below. Sit the paper first if you are practising.
Questions as text
Q1 · An IGCSE student is determining the weight of a metre rule
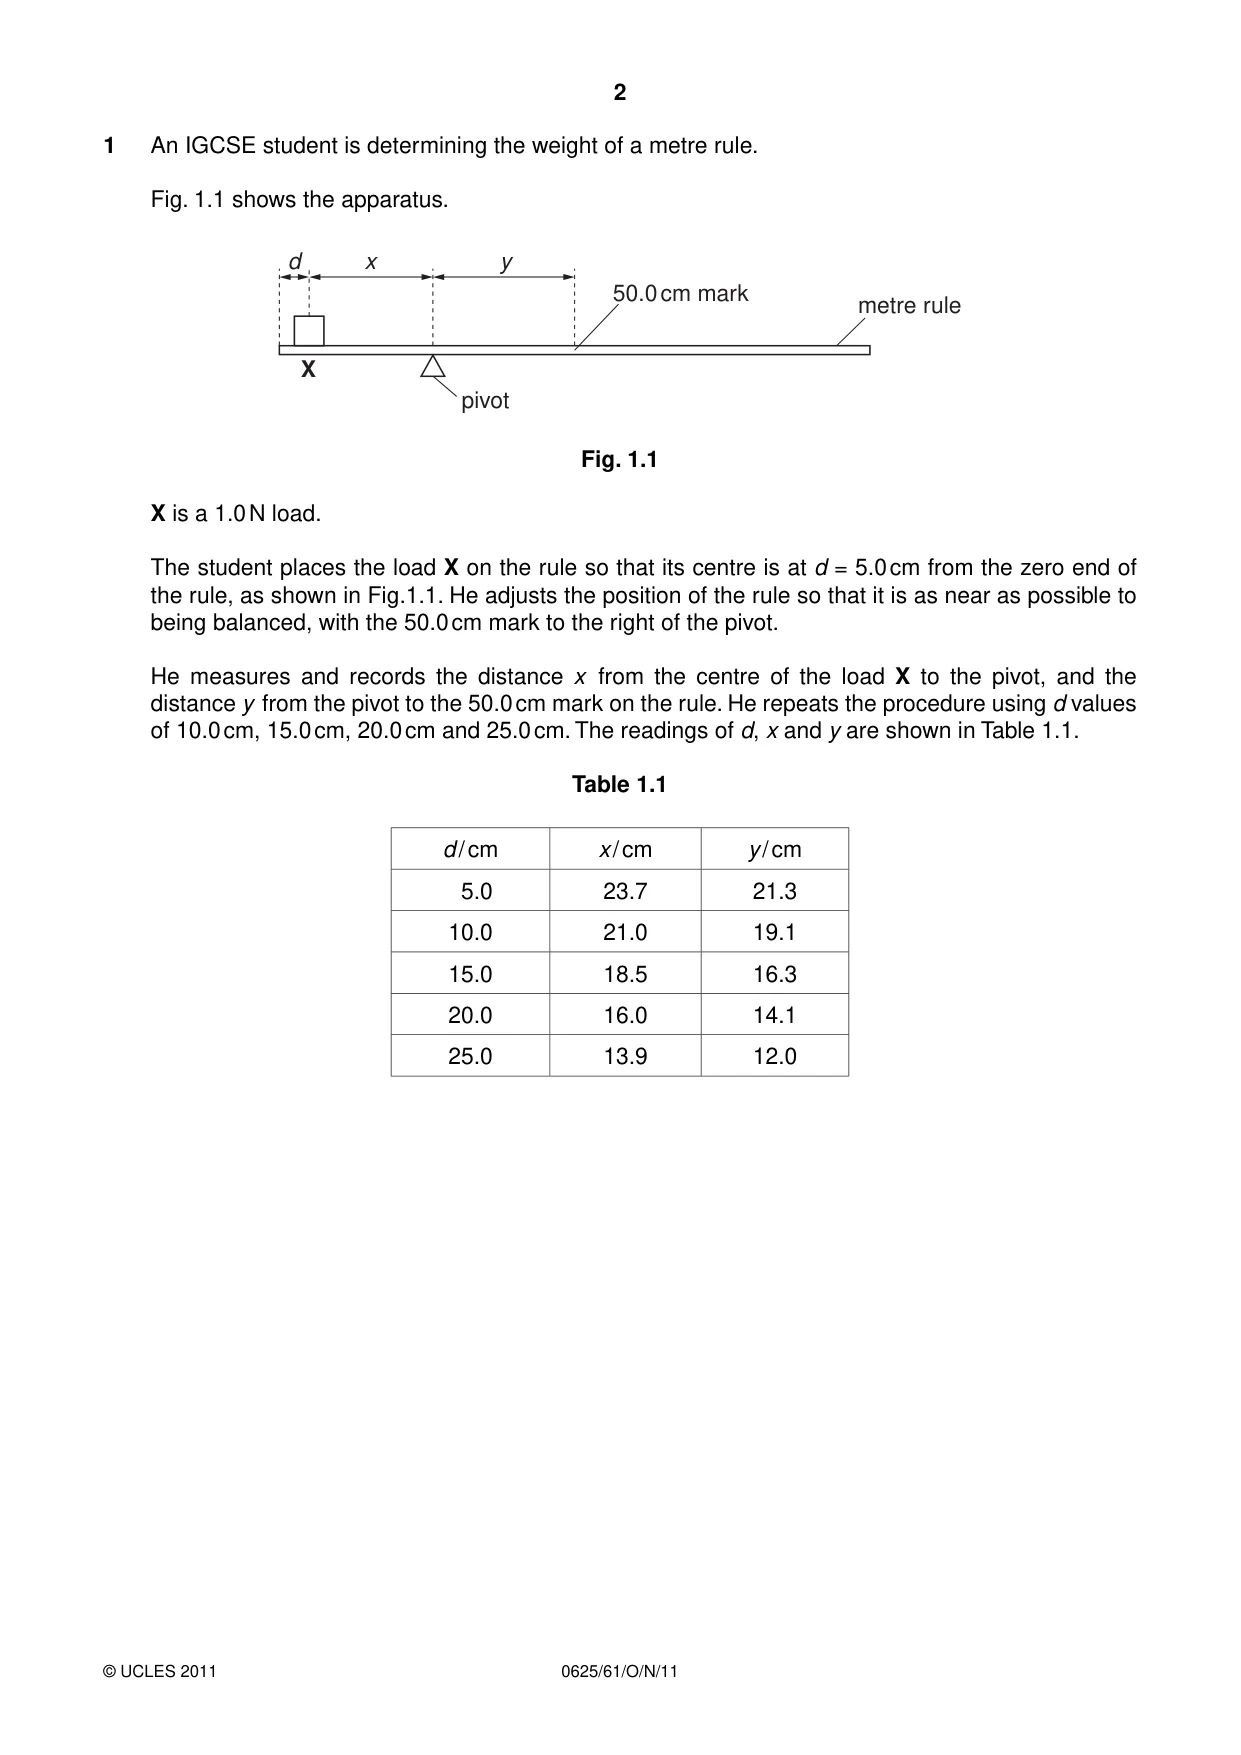
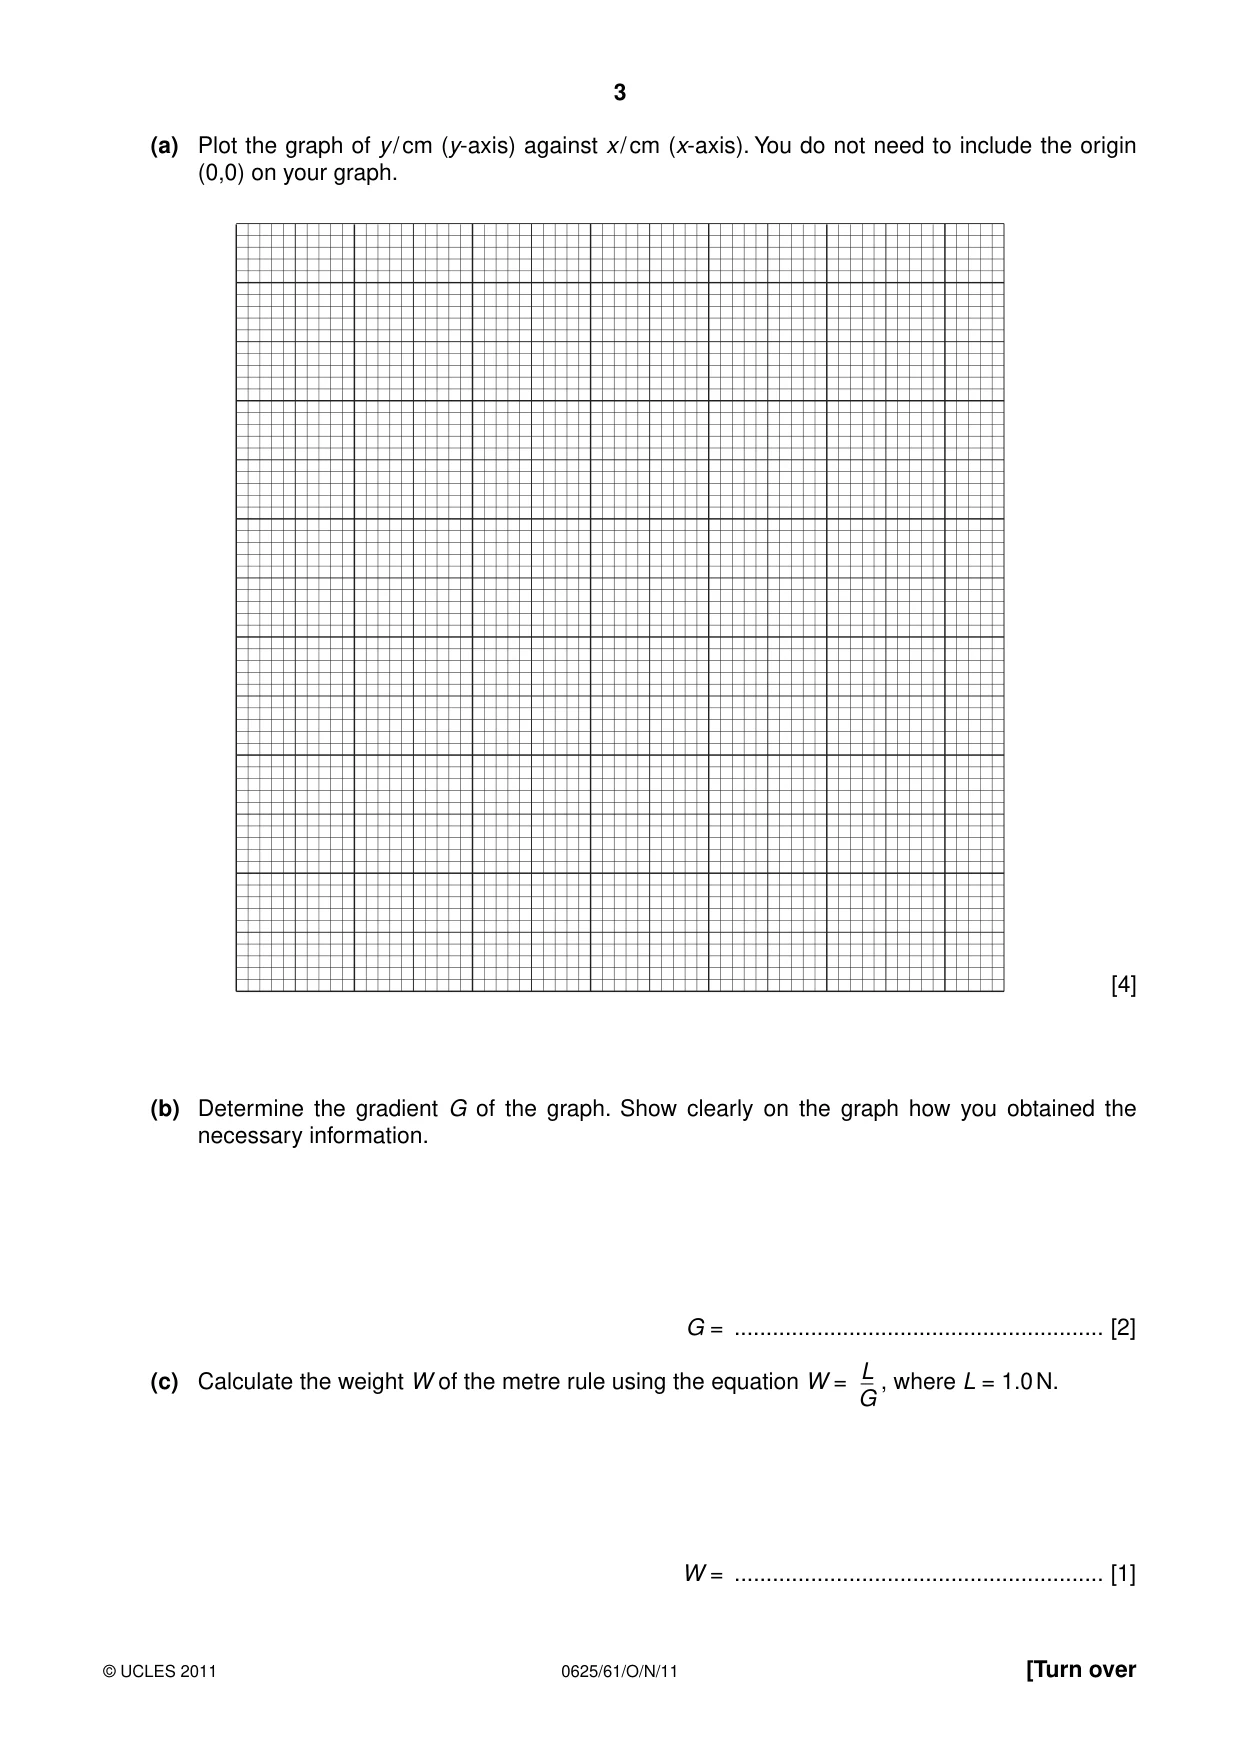
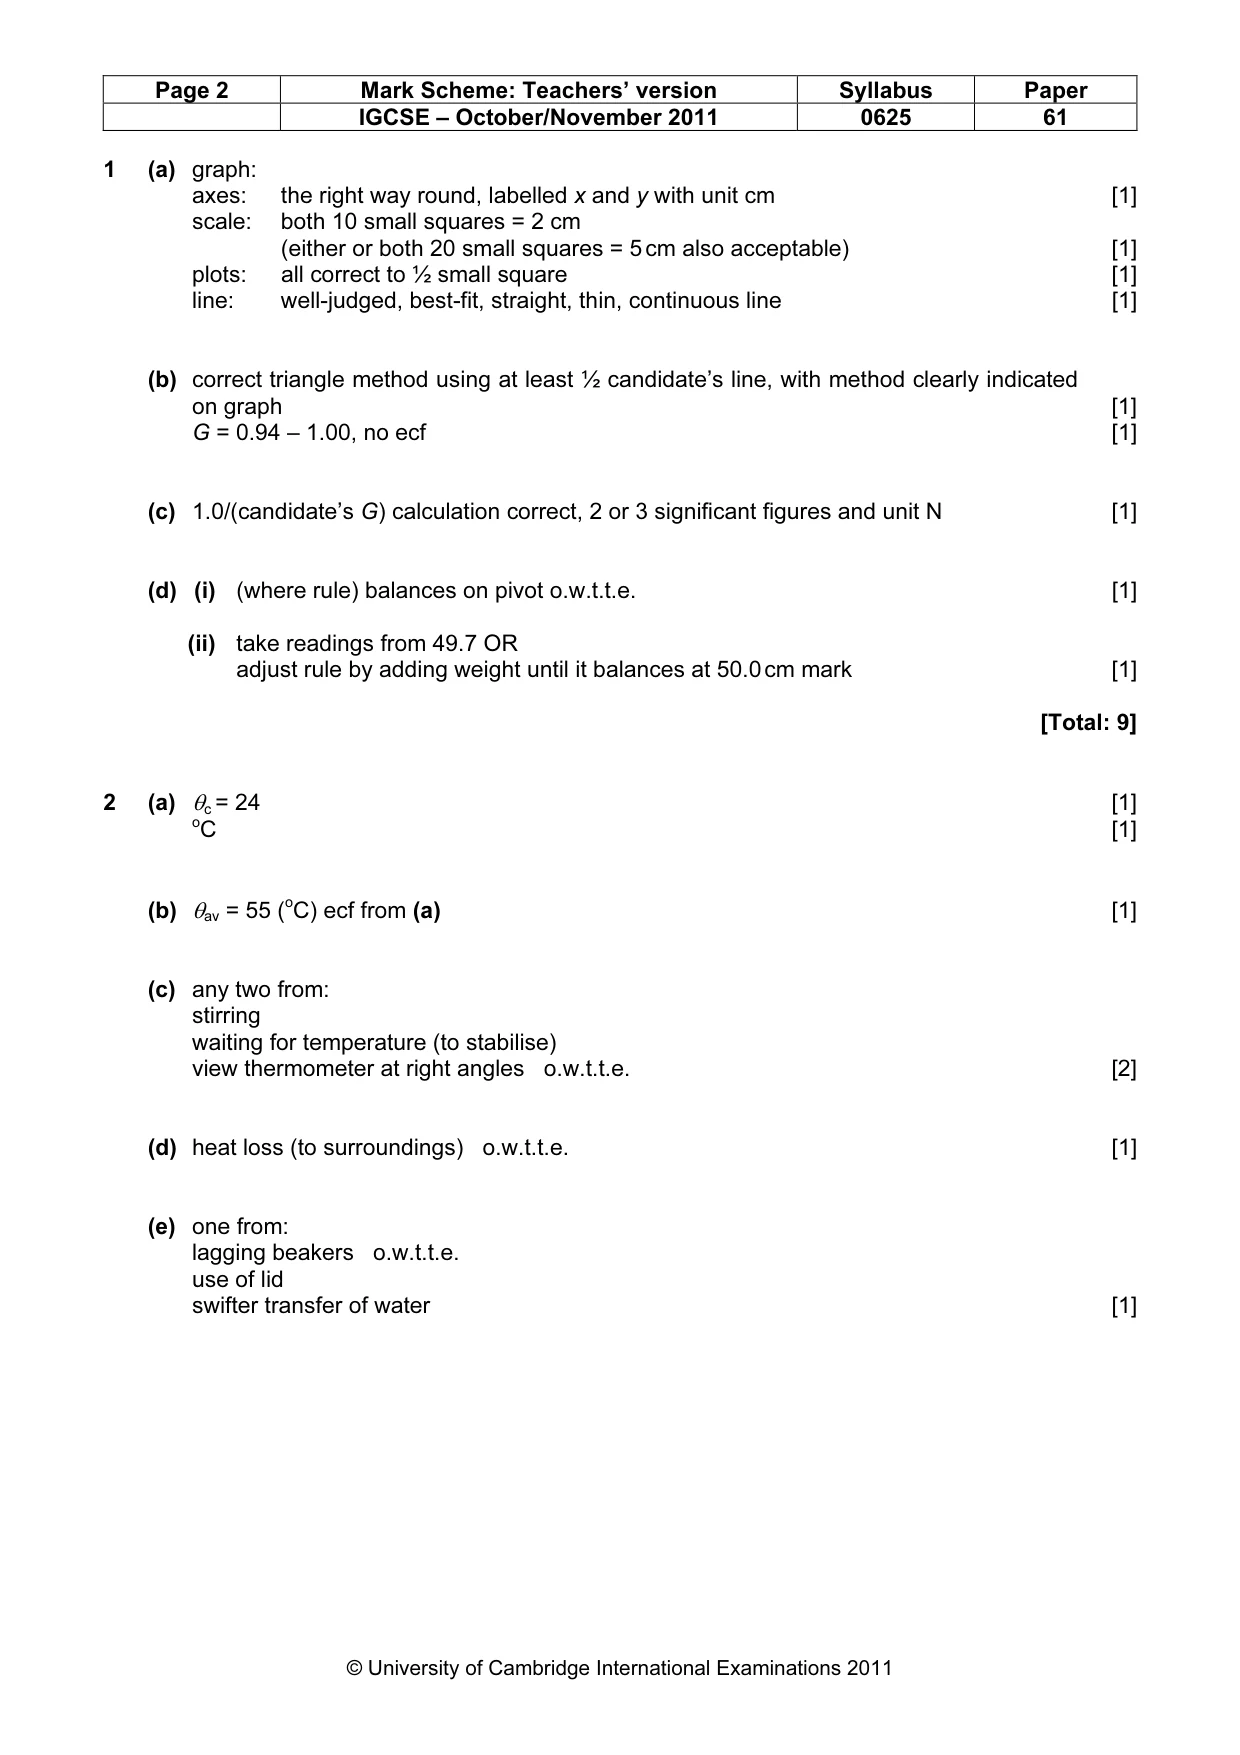
1 An IGCSE student is determining the weight of a metre rule. Fig. 1.1 shows the apparatus. d x y 50.0 cm mark metre rule X pivot Fig. 1.1 X is a 1.0 N load. The student places the load X on the rule so that its centre is at d = 5.0 cm from the zero end of the rule, as shown in Fig.1.1. He adjusts the position of the rule so that it is as near as possible to being balanced, with the 50.0 cm mark to the right of the pivot. He measures and records the distance x from the centre of the load X to the pivot, and the distance y from the pivot to the 50.0 cm mark on the rule. He repeats the procedure using d values of 10.0 cm, 15.0 cm, 20.0 cm and 25.0 cm. The readings of d, x and y are shown in Table 1.1. Table 1.1 d / cm x / cm y / cm 5.0 23.7 21.3 10.0 21.0 19.1 15.0 18.5 16.3 20.0 16.0 14.1 25.0 13.9 12.0 (a) Plot the graph of y / cm (y-axis) against x / cm (x-axis). You do not need to include the origin (0,0) on your graph. [4] (b) Determine the gradient G of the graph. Show clearly on the graph how you obtained the necessary information. G = .......................................................... [2] L(c) Calculate the weight W of the metre rule using the equation W = , where L = 1.0 N. G W = .......................................................... [1] (d) The calculation of W is based on the assumption that the centre of mass of the rule is at the 50.0 cm mark. (i) Describe briefly how you would determine the position of the centre of mass of the rule. ........................................................................................................................................... ........................................................................................................................................... (ii) Describe how you would modify the experiment if the centre of mass was at the 49.7 cm mark. ........................................................................................................................................... .......................................................................................................................................[2] [Total: 9]
Mark scheme: 1 (a) graph: axes: the right way round, labelled x and y with unit cm [1] scale: both 10 small squares = 2 cm (either or both 20 small squares = 5 cm also acceptable) [1] plots: all correct to ½ small square [1] line: well-judged, best-fit, straight, thin, continuous line [1] (b) correct triangle method using at least ½ candidate’s line, with method clearly indicated on graph [1] G = 0.94 – 1.00, no ecf [1] (c) 1.0/(candidate’s G) calculation correct, 2 or 3 significant figures and unit N [1] (d) (i) (where rule) balances on pivot o.w.t.t.e. [1] (ii) take readings from 49.7 OR adjust rule by adding weight until it balances at 50.0 cm mark [1] [Total: 9]
Q2 · The IGCSE class is investigating temperature changes when cold water and hot water are…
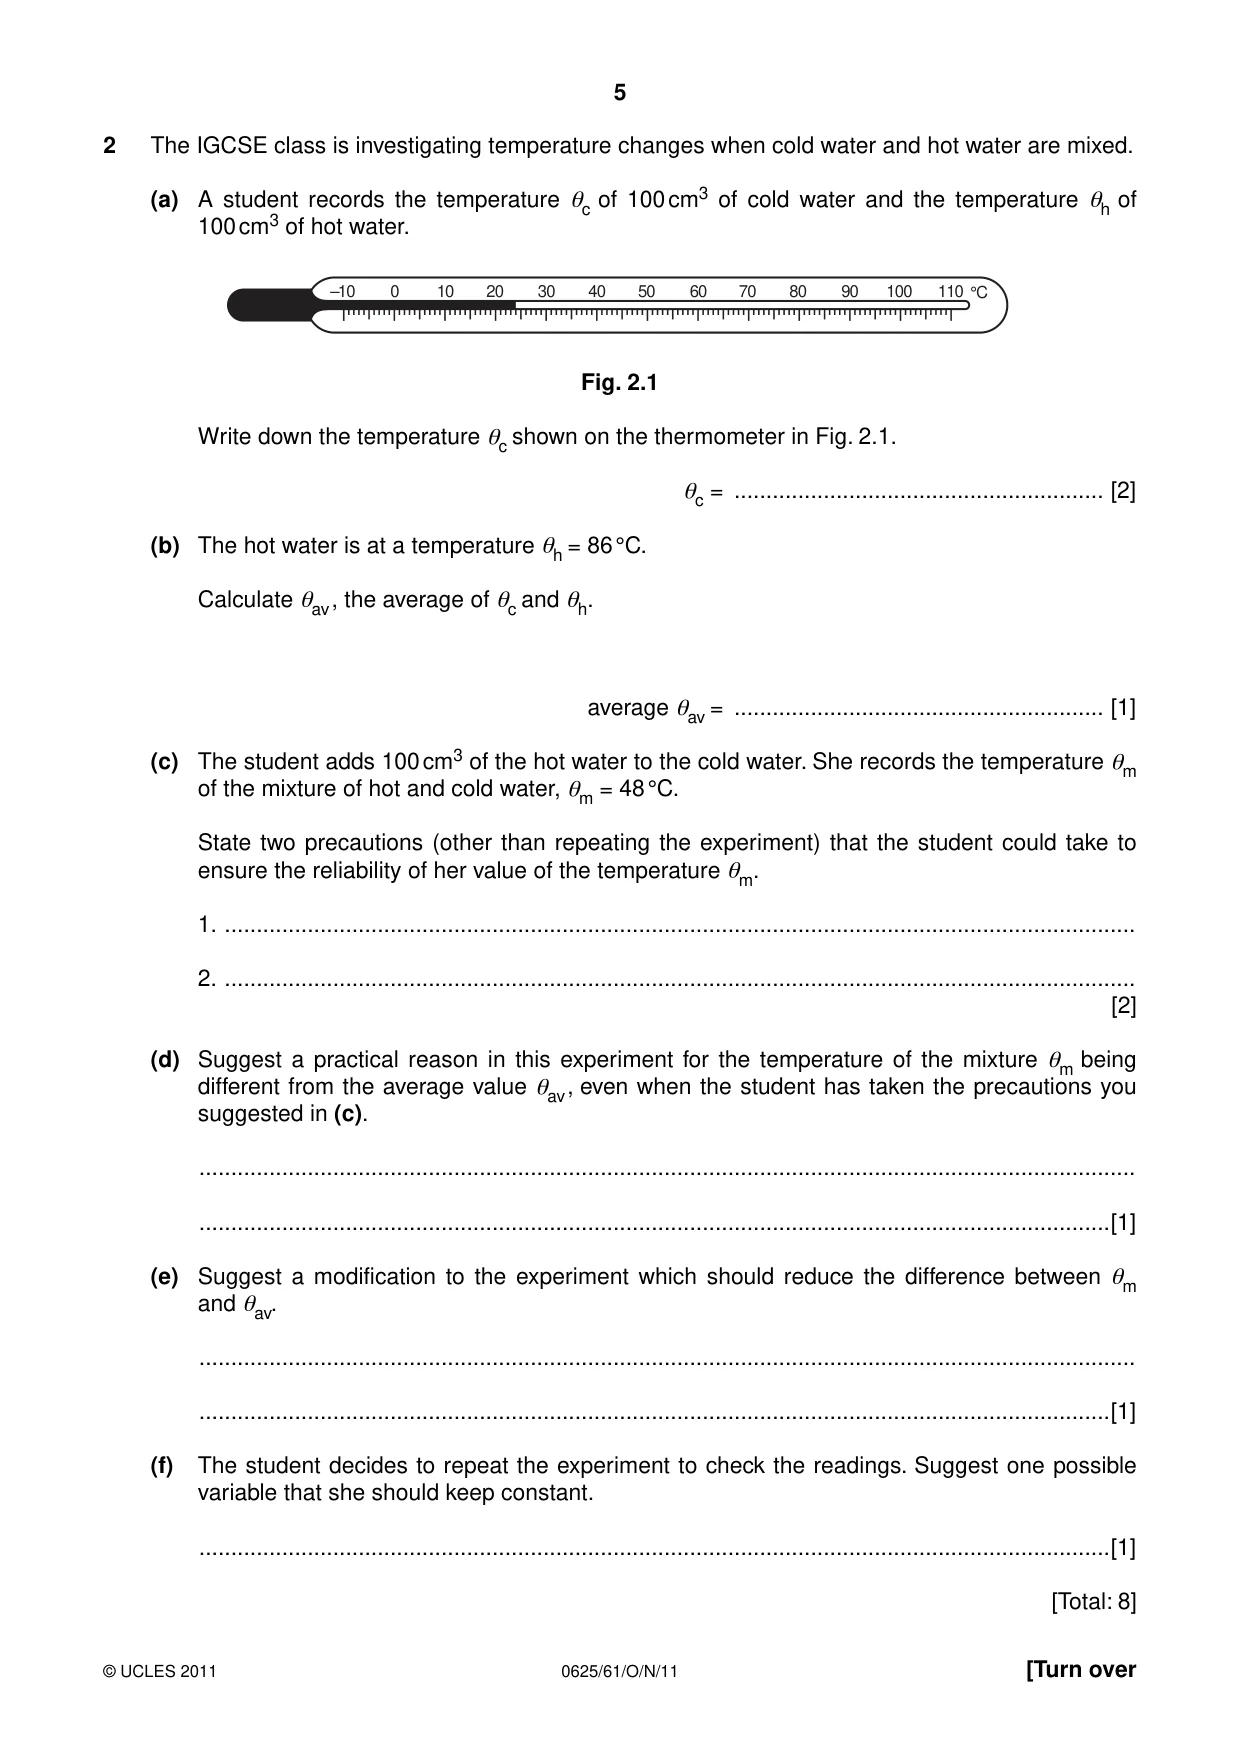
2 The IGCSE class is investigating temperature changes when cold water and hot water are mixed. (a) A student records the temperature θc of 100 cm3 of cold water and the temperature θh of 100 cm3 of hot water. –10 0 10 20 30 40 50 60 70 80 90 100 110 °C Fig. 2.1 Write down the temperature θc shown on the thermometer in Fig. 2.1. θc = .......................................................... [2] (b) The hot water is at a temperature θh = 86 °C. Calculate θav , the average of θc and θh. average θav = .......................................................... [1] (c) The student adds 100 cm3 of the hot water to the cold water. She records the temperature θm of the mixture of hot and cold water, θm = 48 °C. State two precautions (other than repeating the experiment) that the student could take to ensure the reliability of her value of the temperature θm. 1. ............................................................................................................................................... 2. ............................................................................................................................................... [2] (d) Suggest a practical reason in this experiment for the temperature of the mixture θm being different from the average value θav , even when the student has taken the precautions you suggested in (c). ................................................................................................................................................... ...............................................................................................................................................[1] (e) Suggest a modification to the experiment which should reduce the difference between θm and θav. ................................................................................................................................................... ...............................................................................................................................................[1] (f) The student decides to repeat the experiment to check the readings. Suggest one possible variable that she should keep constant. ...............................................................................................................................................[1] [Total: 8]
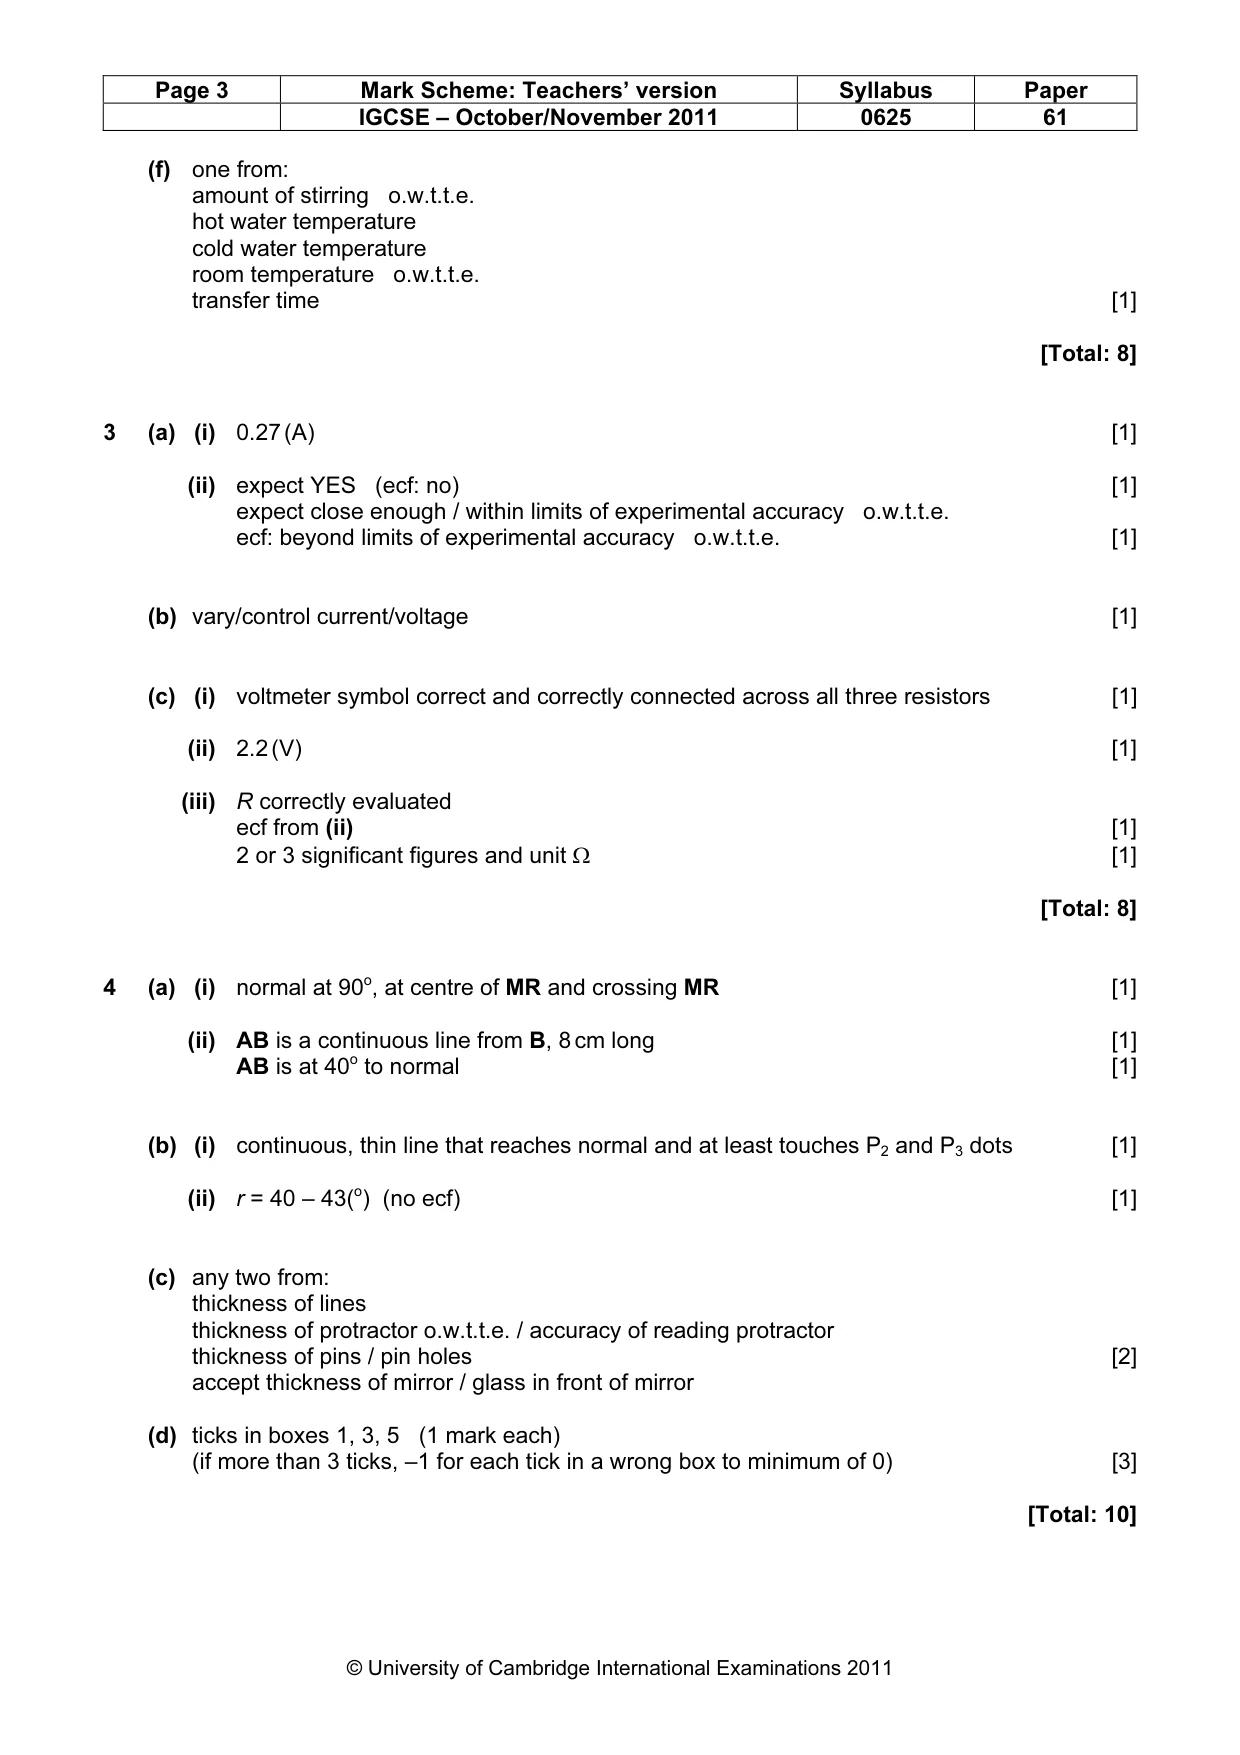
Mark scheme: 2 (a) θc = 24 [1] oC [1] (b) θav = 55 (oC) ecf from (a) [1] (c) any two from: stirring waiting for temperature (to stabilise) view thermometer at right angles o.w.t.t.e. [2] (d) heat loss (to surroundings) o.w.t.t.e. [1] (e) one from: lagging beakers o.w.t.t.e. use of lid swifter transfer of water [1] IGCSE – October/November 2011 0625 61 (f) one from: amount of stirring o.w.t.t.e. hot water temperature cold water temperature room temperature o.w.t.t.e. transfer time [1] [Total: 8]
Q3 · The IGCSE class is investigating the current in resistors in a circuit
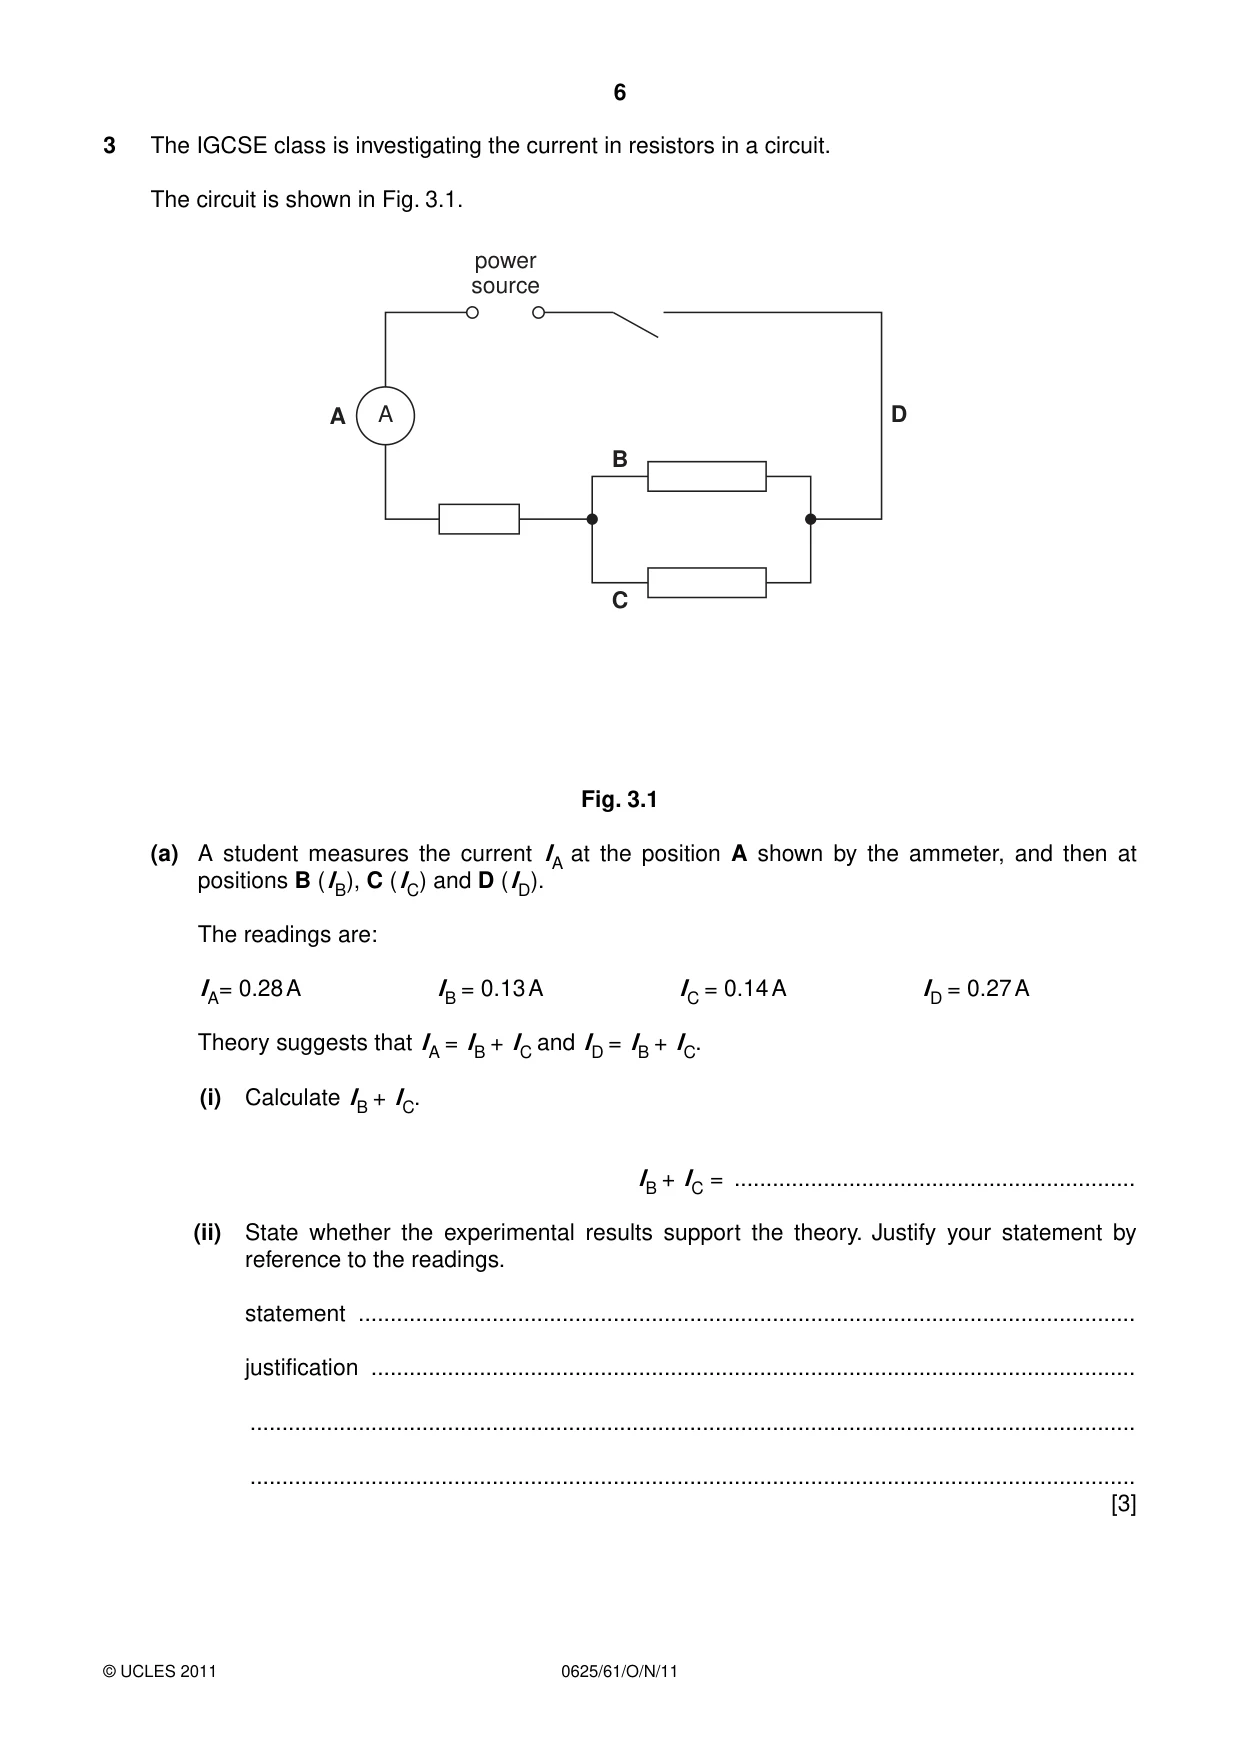
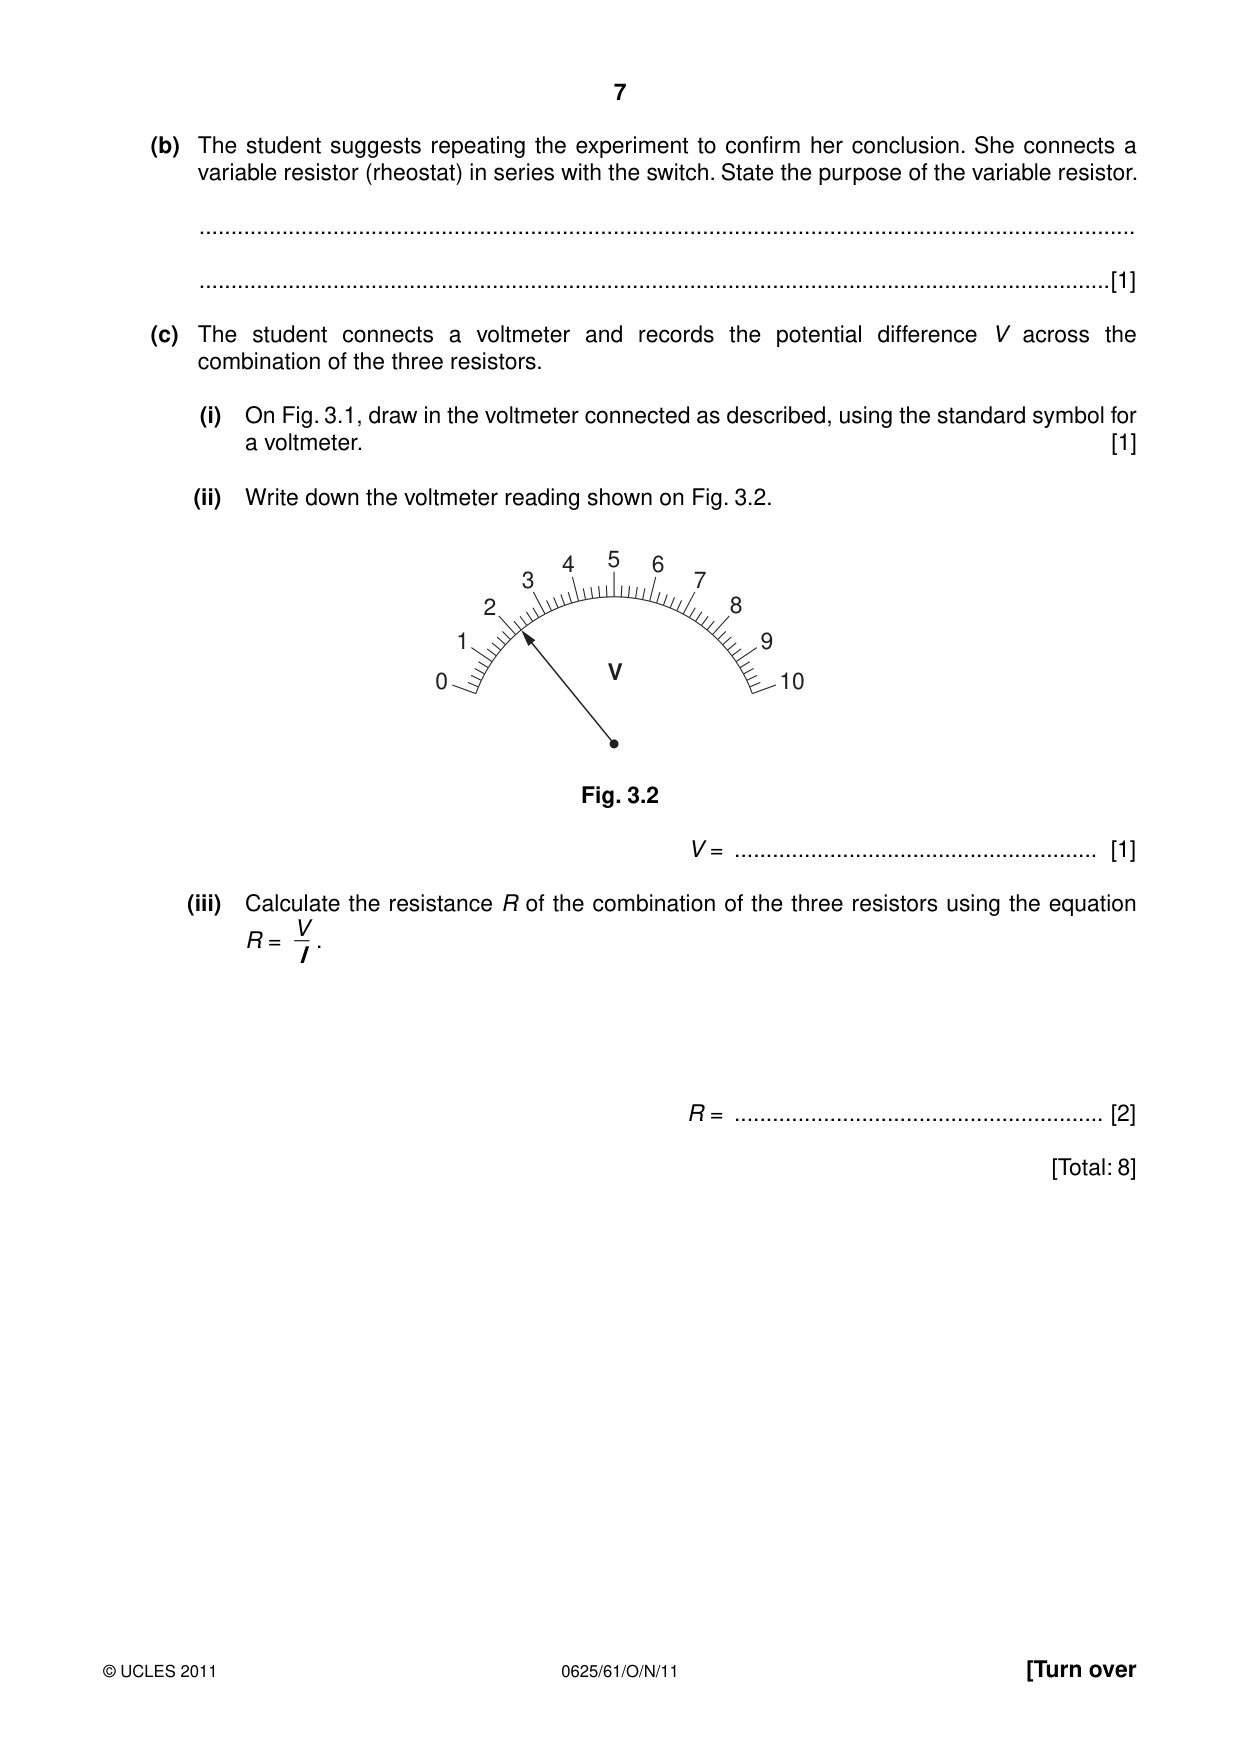
3 The IGCSE class is investigating the current in resistors in a circuit. The circuit is shown in Fig. 3.1. power source A A D B C Fig. 3.1 (a) A student measures the current IA at the position A shown by the ammeter, and then at positions B (IB), C (IC) and D (ID). The readings are: IA= 0.28 A IB = 0.13 A IC = 0.14 A ID = 0.27 A Theory suggests that IA = IB + IC and ID = IB + IC. (i) Calculate IB + IC. IB + IC = ............................................................... (ii) State whether the experimental results support the theory. Justify your statement by reference to the readings. statement .......................................................................................................................... justification ........................................................................................................................ ........................................................................................................................................... ........................................................................................................................................... [3] (b) The student suggests repeating the experiment to confirm her conclusion. She connects a variable resistor (rheostat) in series with the switch. State the purpose of the variable resistor. ................................................................................................................................................... ...............................................................................................................................................[1] (c) The student connects a voltmeter and records the potential difference V across the combination of the three resistors. (i) On Fig. 3.1, draw in the voltmeter connected as described, using the standard symbol for a voltmeter. [1] (ii) Write down the voltmeter reading shown on Fig. 3.2. 4 5 6 3 7 2 8 1 9 V 0 10 Fig. 3.2 V = ......................................................... [1] (iii) Calculate the resistance R of the combination of the three resistors using the equation V R = . I R = .......................................................... [2] [Total: 8]
Mark scheme: 3 (a) (i) 0.27 (A) [1] (ii) expect YES (ecf: no) [1] expect close enough / within limits of experimental accuracy o.w.t.t.e. ecf: beyond limits of experimental accuracy o.w.t.t.e. [1] (b) vary/control current/voltage [1] (c) (i) voltmeter symbol correct and correctly connected across all three resistors [1] (ii) 2.2 (V) [1] (iii) R correctly evaluated ecf from (ii) [1] 2 or 3 significant figures and unit Ω [1] [Total: 8] o
Q4 · An IGCSE student is investigating reflection of light in a plane mirror
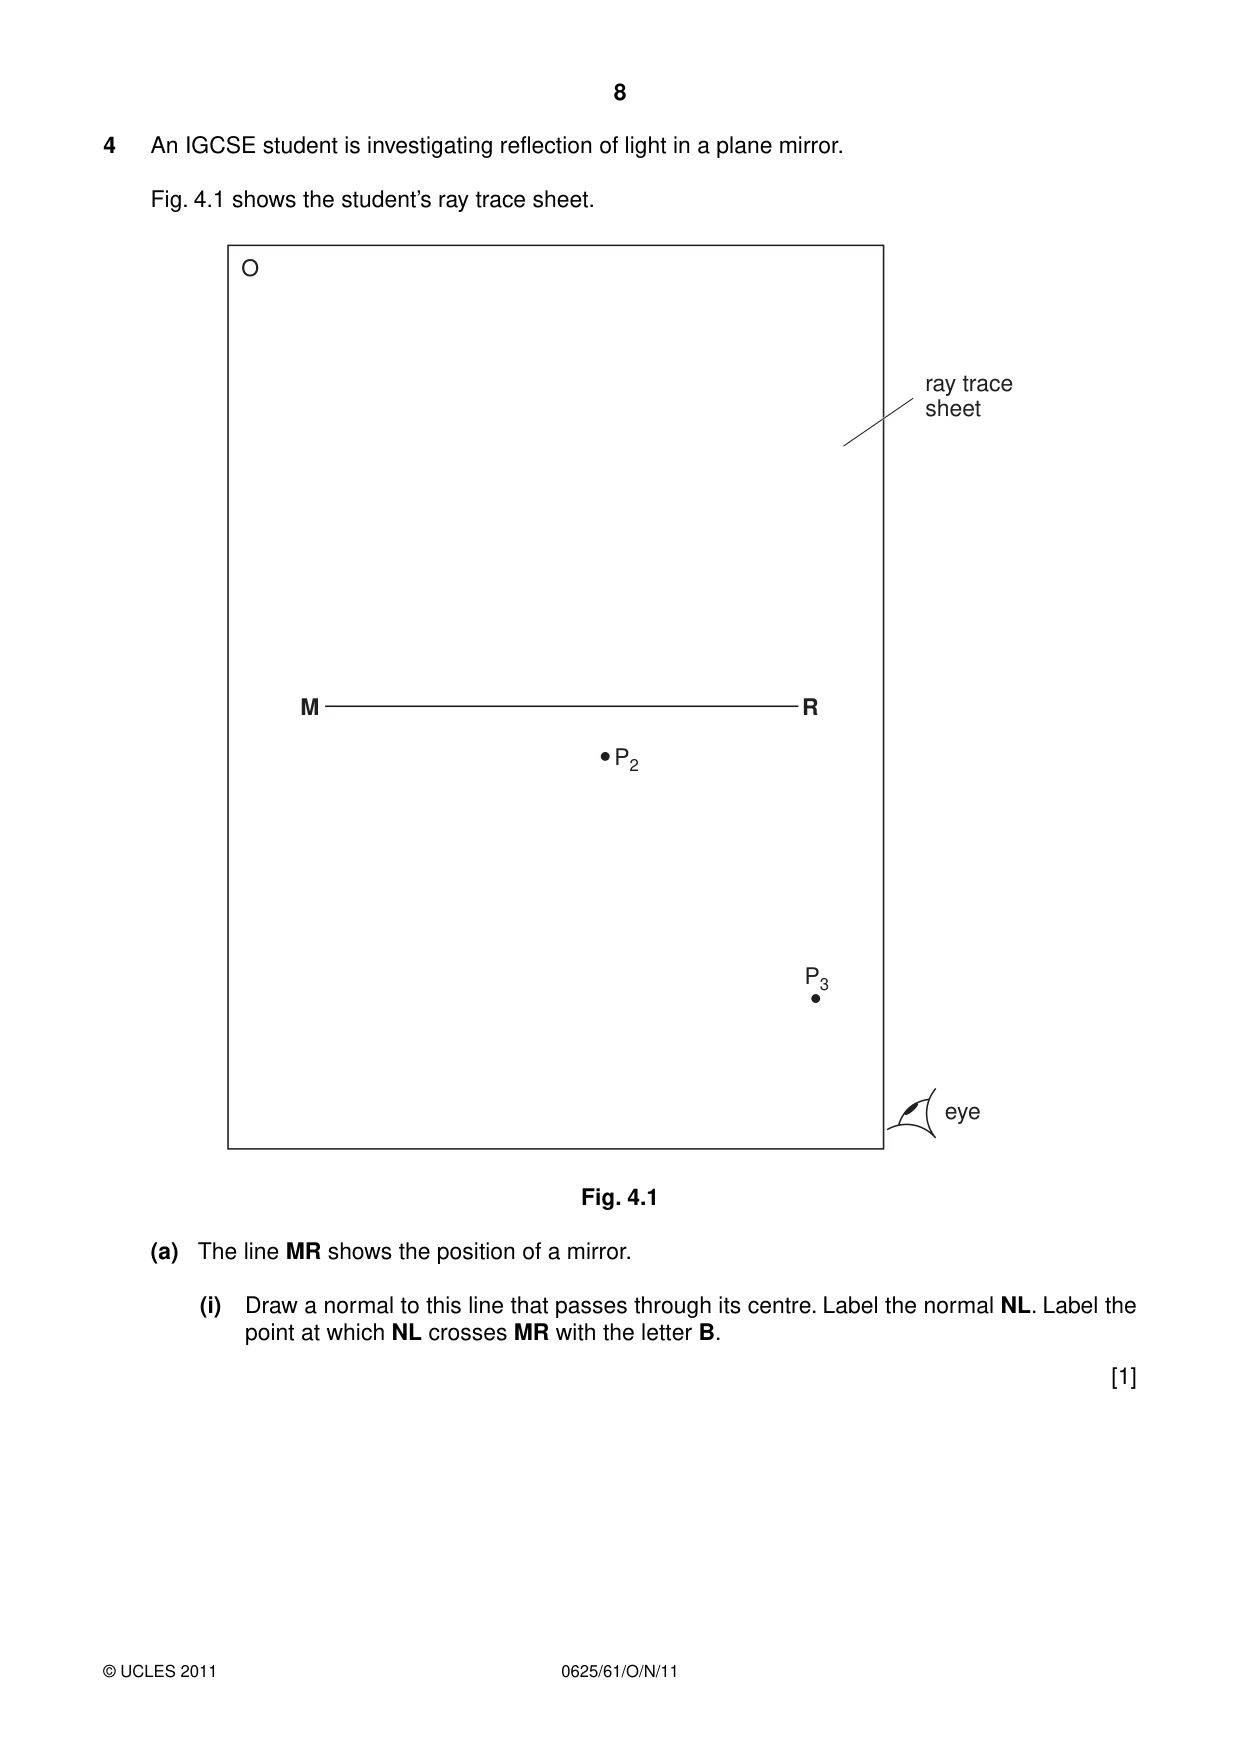
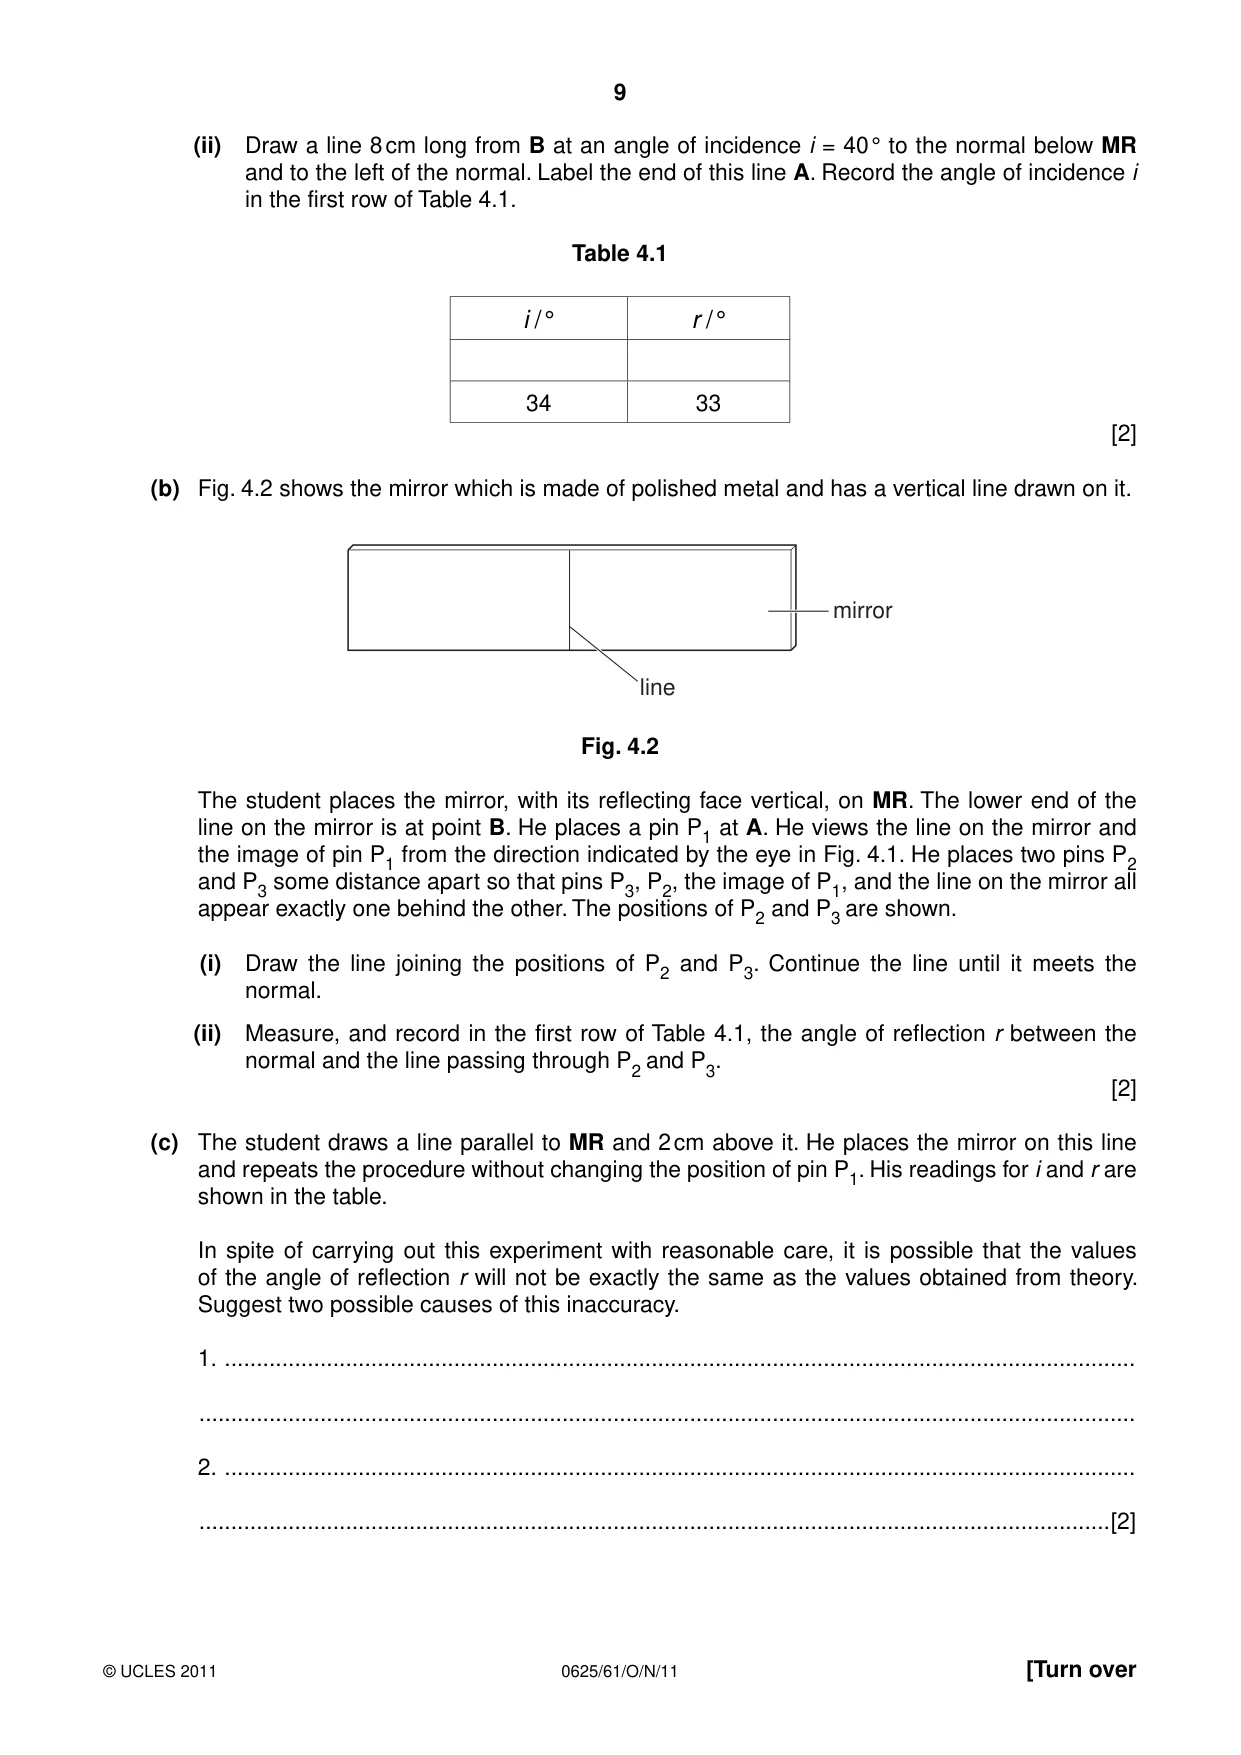
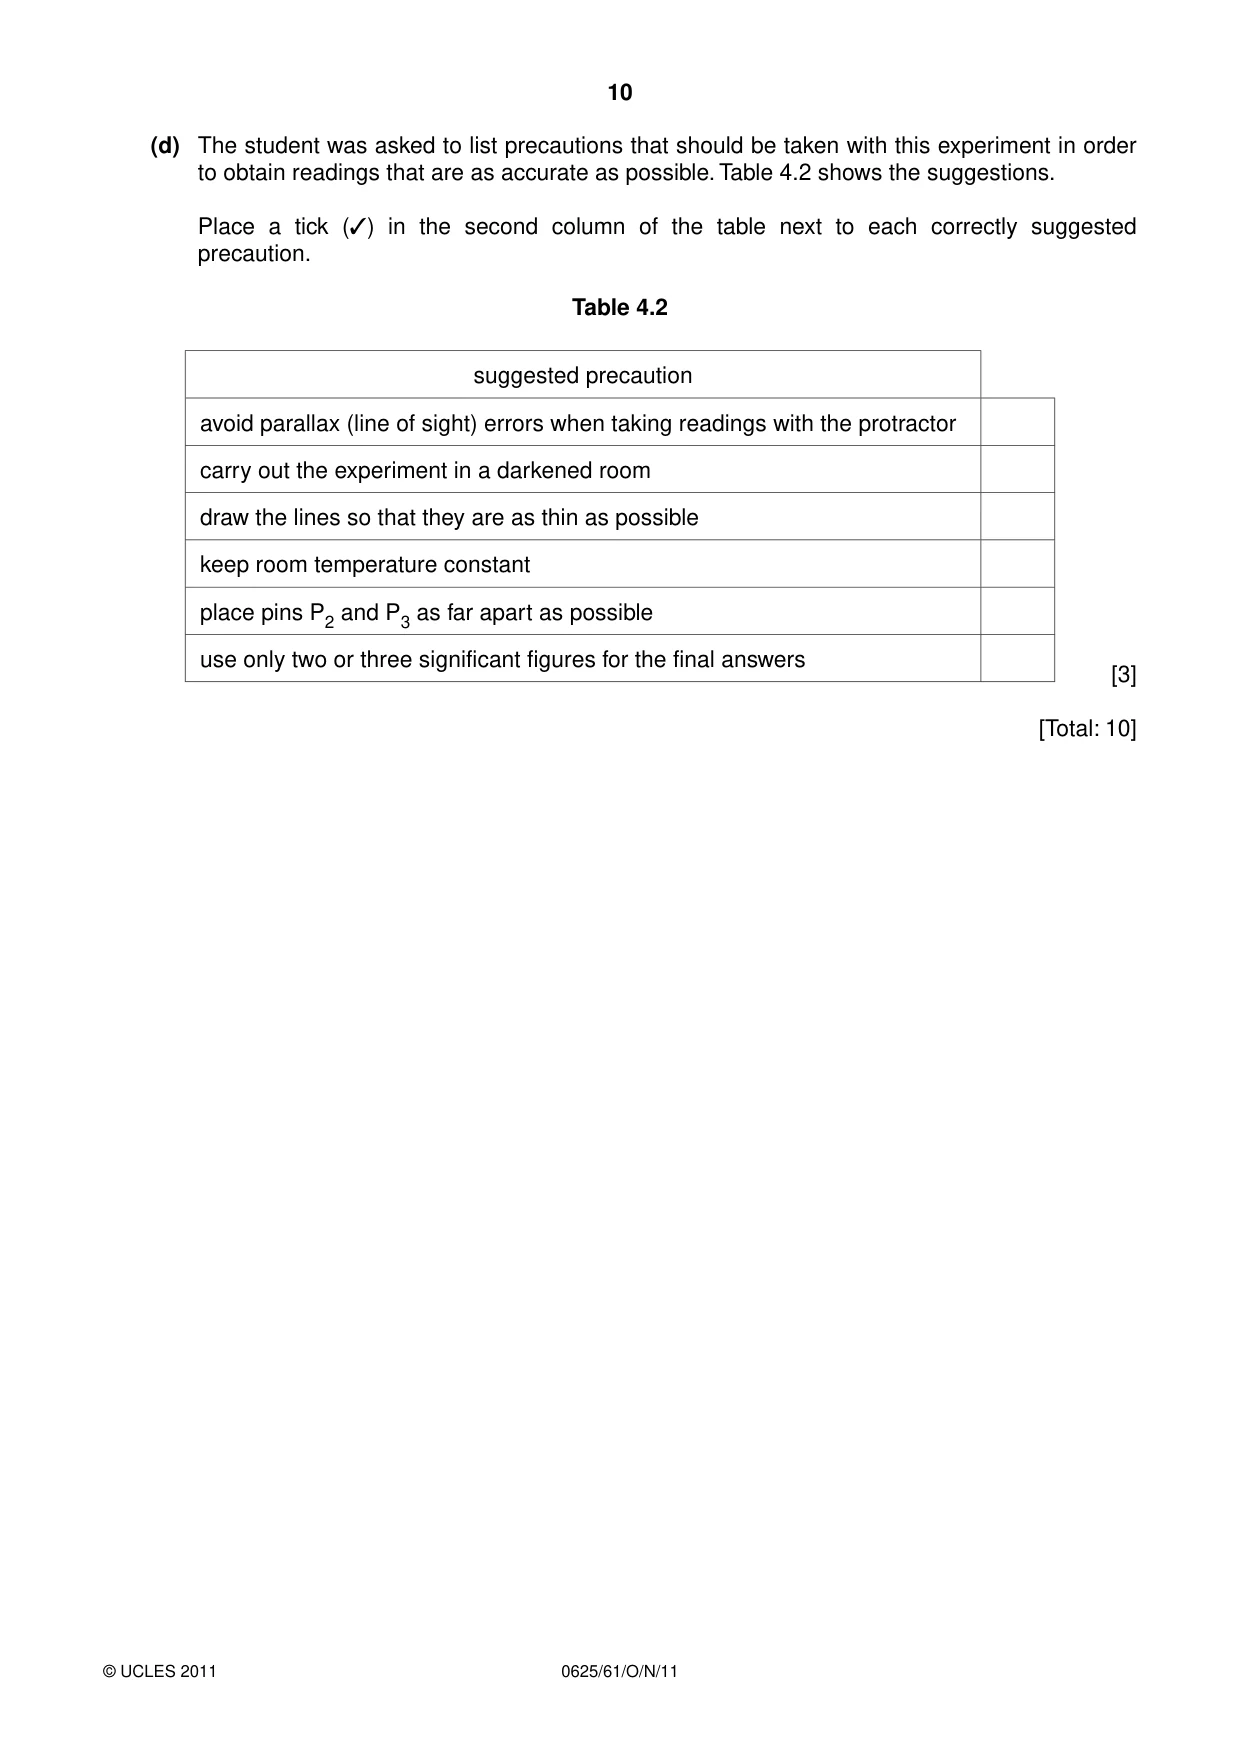
4 An IGCSE student is investigating reflection of light in a plane mirror. Fig. 4.1 shows the student’s ray trace sheet. O ray trace sheet M R P2 P3 eye Fig. 4.1 (a) The line MR shows the position of a mirror. (i) Draw a normal to this line that passes through its centre. Label the normal NL. Label the point at which NL crosses MR with the letter B. [1] (ii) Draw a line 8 cm long from B at an angle of incidence i = 40 ° to the normal below MR and to the left of the normal. Label the end of this line A. Record the angle of incidence i in the first row of Table 4.1. Table 4.1 i / ° r / ° 34 33 [2] (b) Fig. 4.2 shows the mirror which is made of polished metal and has a vertical line drawn on it. mirror line Fig. 4.2 The student places the mirror, with its reflecting face vertical, on MR. The lower end of the line on the mirror is at point B. He places a pin P1 at A. He views the line on the mirror and the image of pin P1 from the direction indicated by the eye in Fig. 4.1. He places two pins P2 and P3 some distance apart so that pins P3, P2, the image of P1, and the line on the mirror all appear exactly one behind the other. The positions of P2 and P3 are shown. (i) Draw the line joining the positions of P2 and P3. Continue the line until it meets the normal. (ii) Measure, and record in the first row of Table 4.1, the angle of reflection r between the normal and the line passing through P2 and P3. [2] (c) The student draws a line parallel to MR and 2 cm above it. He places the mirror on this line and repeats the procedure without changing the position of pin P1. His readings for i and r are shown in the table. In spite of carrying out this experiment with reasonable care, it is possible that the values of the angle of reflection r will not be exactly the same as the values obtained from theory. Suggest two possible causes of this inaccuracy. 1. ............................................................................................................................................... ................................................................................................................................................... 2. ............................................................................................................................................... ...............................................................................................................................................[2] (d) The student was asked to list precautions that should be taken with this experiment in order to obtain readings that are as accurate as possible. Table 4.2 shows the suggestions. Place a tick (✓) in the second column of the table next to each correctly suggested precaution. Table 4.2 suggested precaution avoid parallax (line of sight) errors when taking readings with the protractor carry out the experiment in a darkened room draw the lines so that they are as thin as possible keep room temperature constant place pins P2 and P3 as far apart as possible use only two or three significant figures for the final answers [3] [Total: 10]
Mark scheme: 4 (a) (i) normal at 90o, at centre of MR and crossing MR [1] (ii) AB is a continuous line from B, 8 cm long [1] AB is at 40o to normal [1] (b) (i) continuous, thin line that reaches normal and at least touches P2 and P3 dots [1] (ii) r = 40 – 43(o) (no ecf) [1] (c) any two from: thickness of lines thickness of protractor o.w.t.t.e. / accuracy of reading protractor thickness of pins / pin holes [2] accept thickness of mirror / glass in front of mirror (d) ticks in boxes 1, 3, 5 (1 mark each) (if more than 3 ticks, –1 for each tick in a wrong box to minimum of 0) [3] [Total: 10] IGCSE – October/November 2011 0625 61
Q5 · The IGCSE class is carrying out an experiment to determine the speed of sound in air
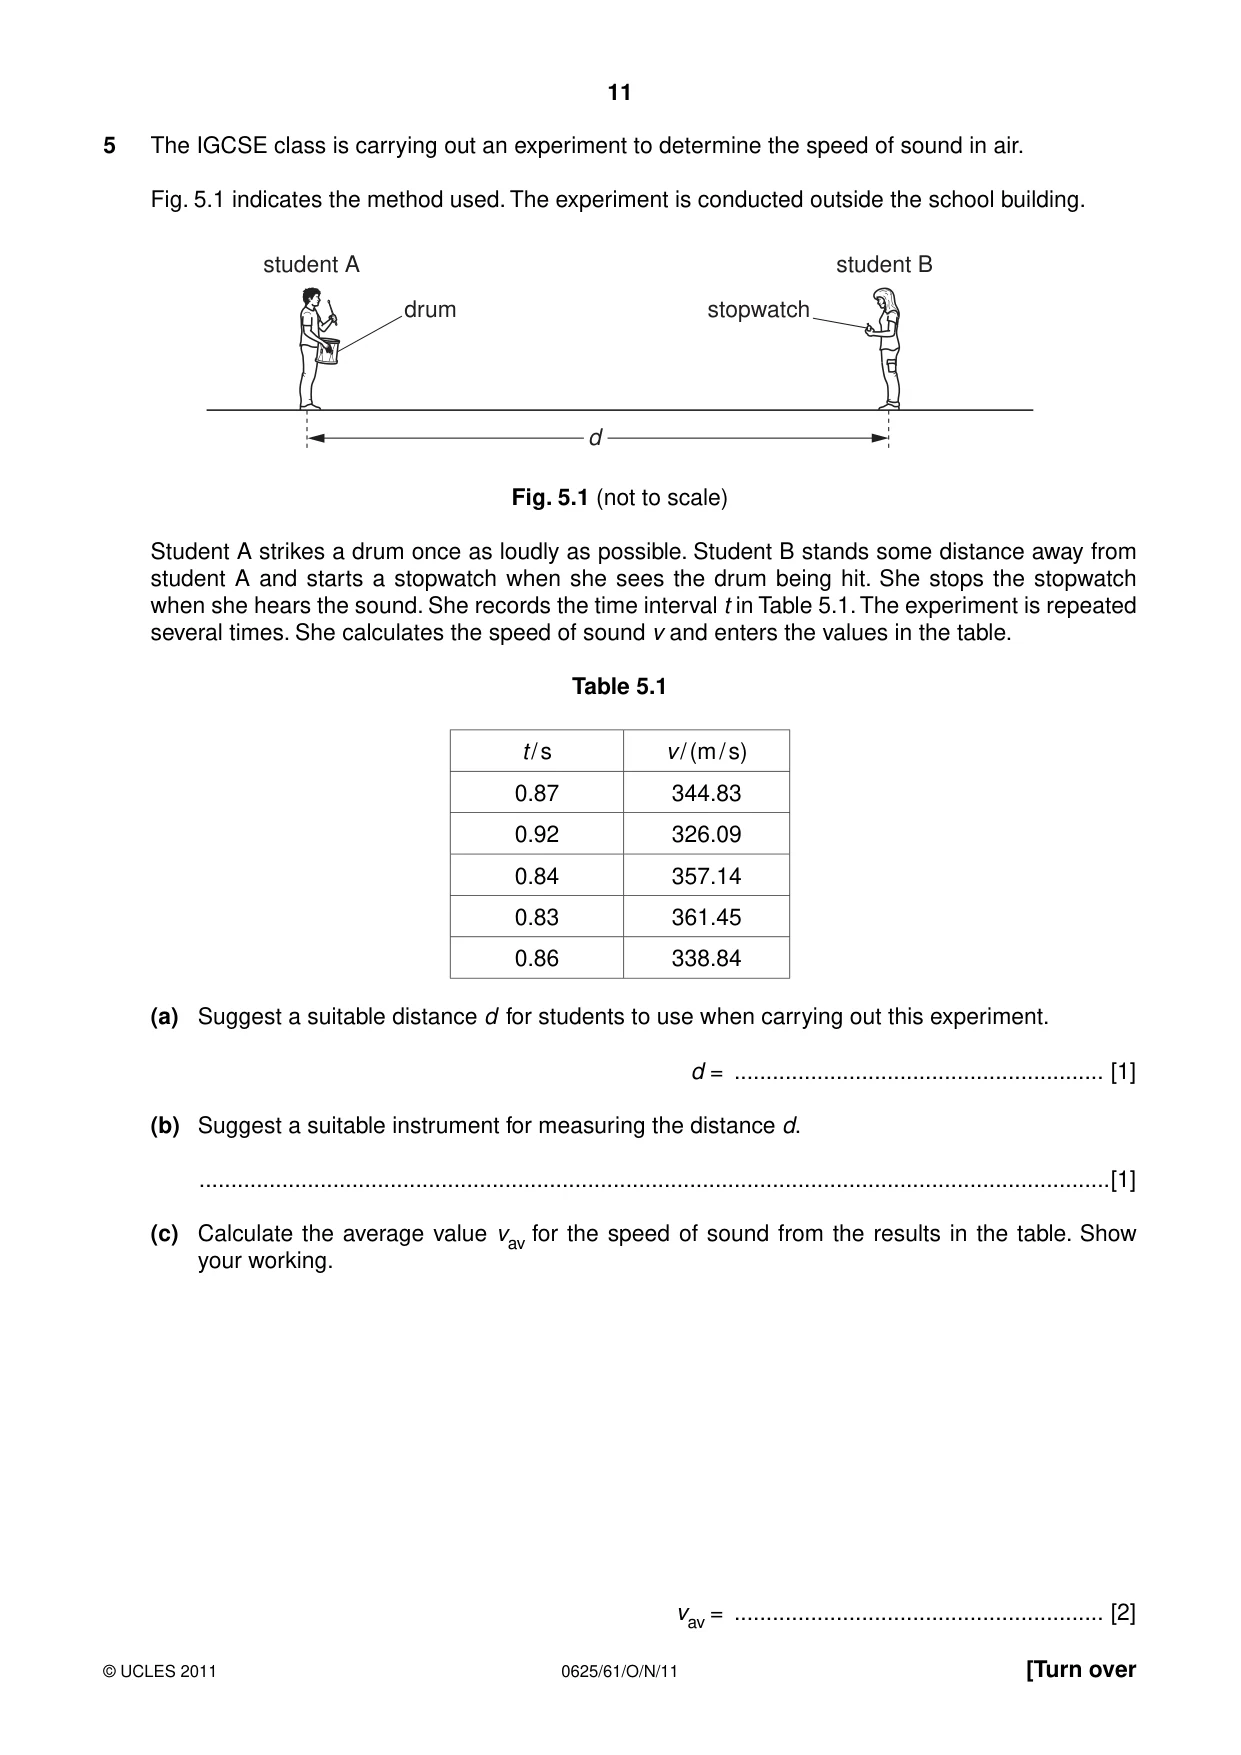
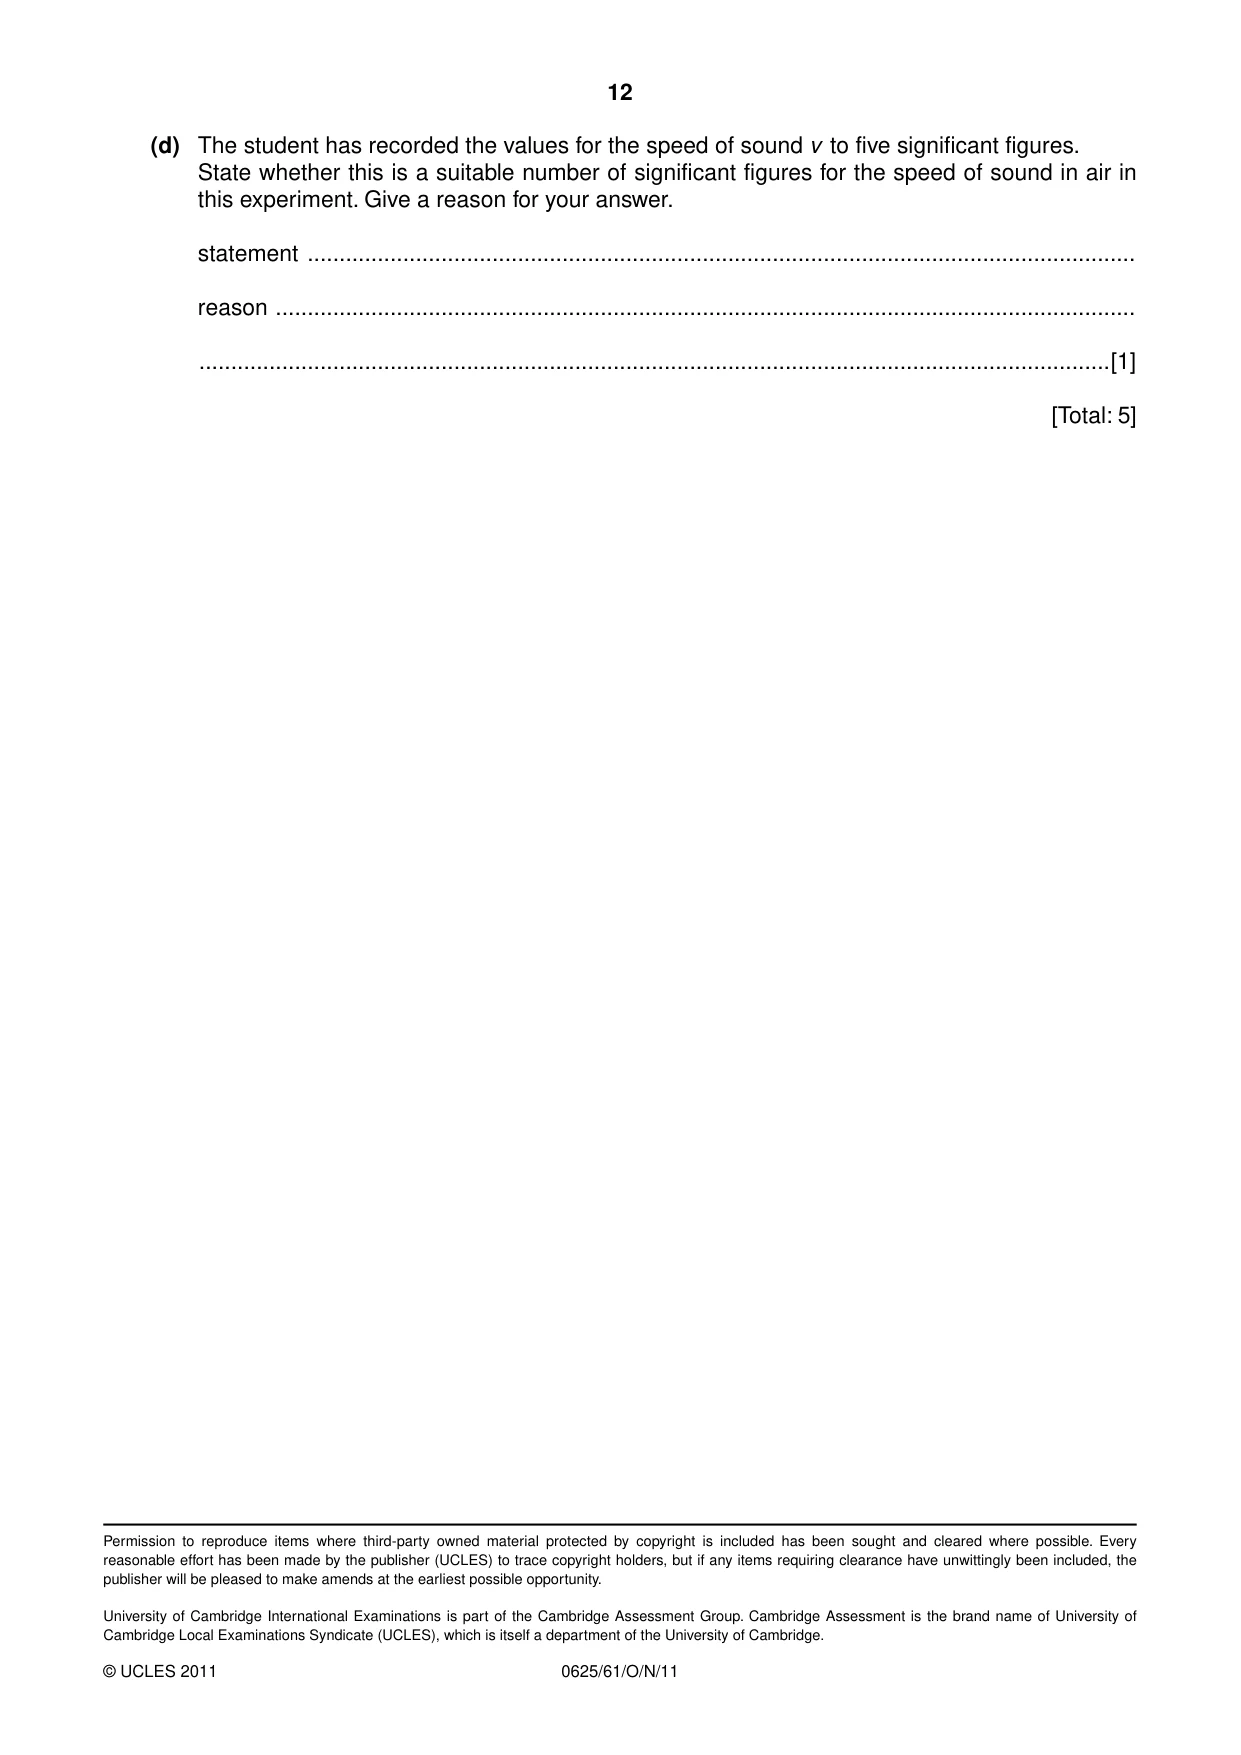
5 The IGCSE class is carrying out an experiment to determine the speed of sound in air. Fig. 5.1 indicates the method used. The experiment is conducted outside the school building. student A student B drum stopwatch d Fig. 5.1 (not to scale) Student A strikes a drum once as loudly as possible. Student B stands some distance away from student A and starts a stopwatch when she sees the drum being hit. She stops the stopwatch when she hears the sound. She records the time interval t in Table 5.1. The experiment is repeated several times. She calculates the speed of sound v and enters the values in the table. Table 5.1 t / s v / (m / s) 0.87 344.83 0.92 326.09 0.84 357.14 0.83 361.45 0.86 338.84 (a) Suggest a suitable distance d for students to use when carrying out this experiment. d = .......................................................... [1] (b) Suggest a suitable instrument for measuring the distance d. ...............................................................................................................................................[1] (c) Calculate the average value vav for the speed of sound from the results in the table. Show your working. vav = .......................................................... [2] (d) The student has recorded the values for the speed of sound v to five significant figures. State whether this is a suitable number of significant figures for the speed of sound in air in this experiment. Give a reason for your answer. statement .................................................................................................................................. reason ....................................................................................................................................... ...............................................................................................................................................[1] [Total: 5]
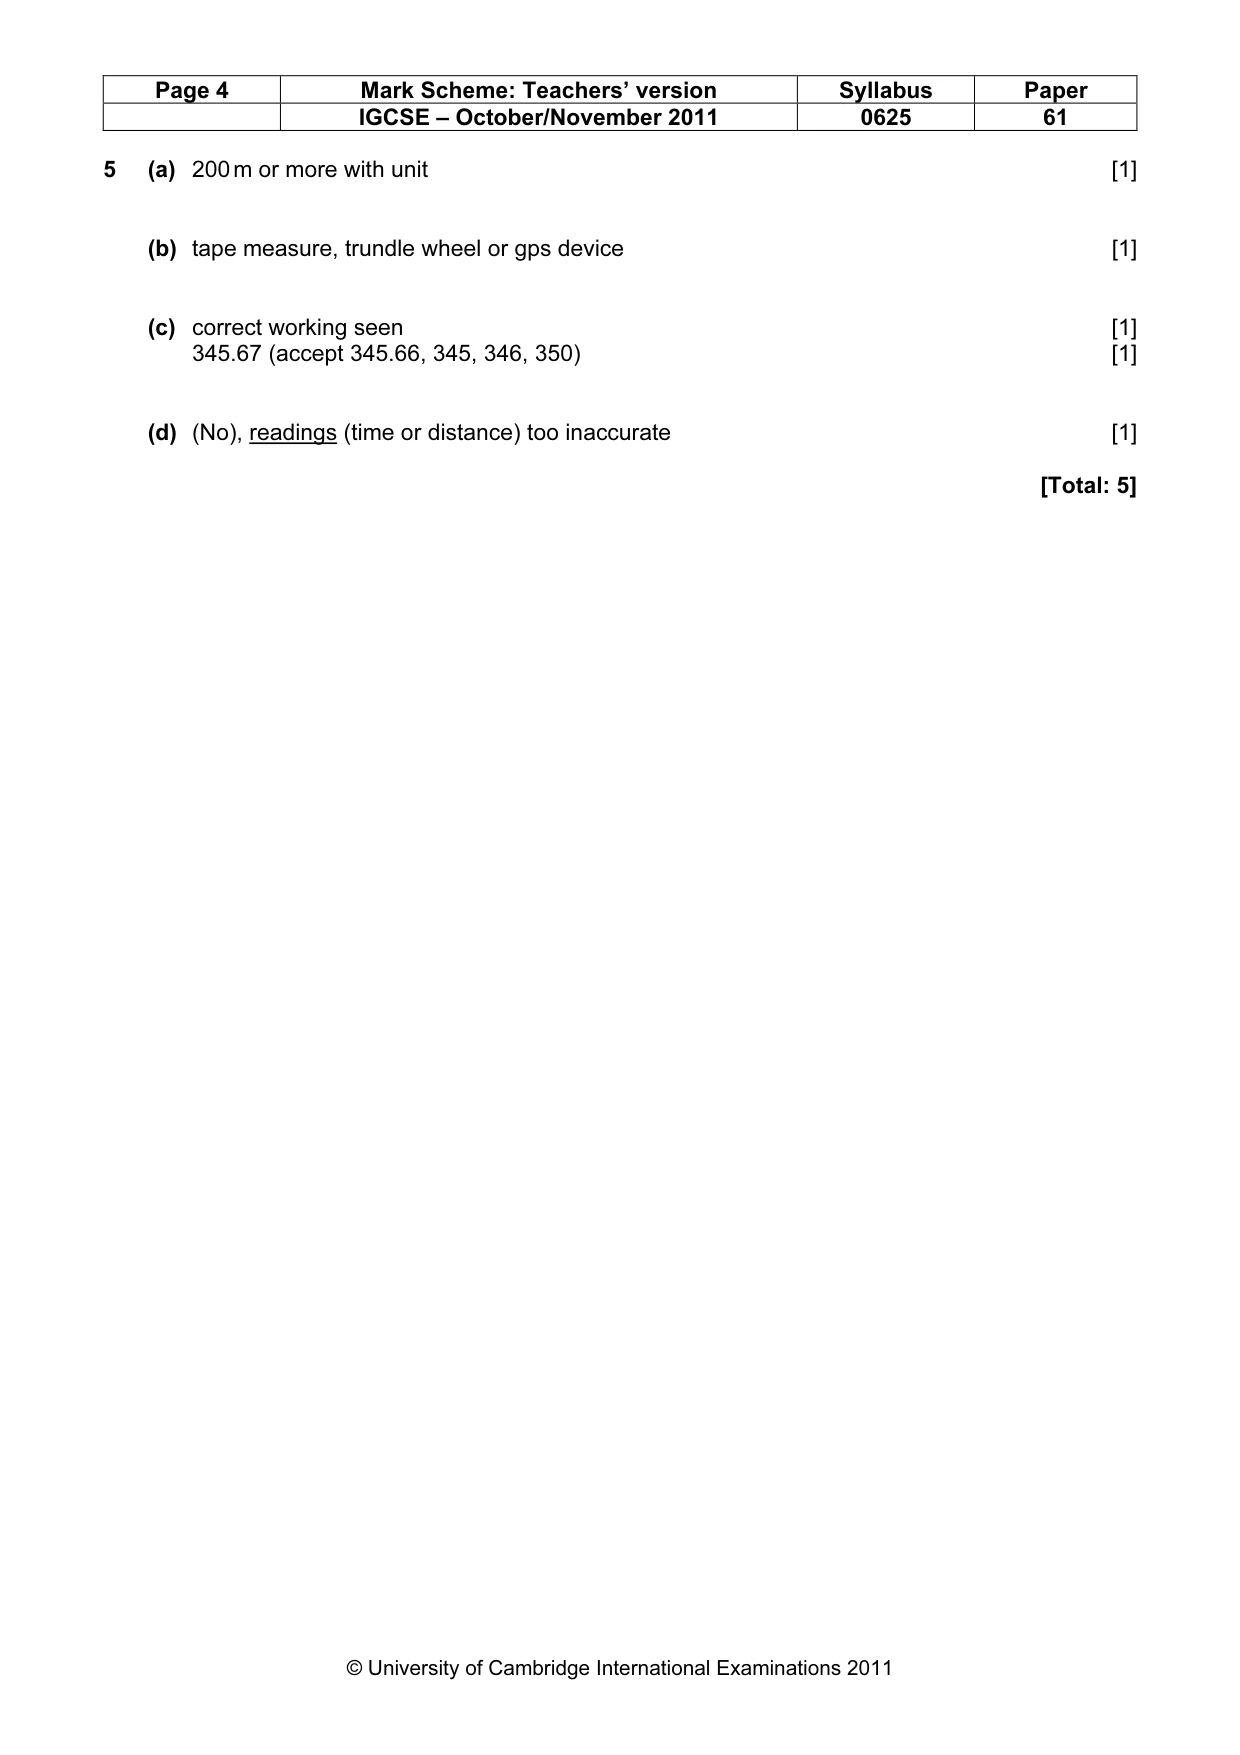
Mark scheme: 5 (a) 200 m or more with unit [1] (b) tape measure, trundle wheel or gps device [1] (c) correct working seen [1] 345.67 (accept 345.66, 345, 346, 350) [1] (d) (No), readings (time or distance) too inaccurate [1] [Total: 5]
More questions on Physical quantities and measurement techniques
What was in this paper
The subtopics covered by these 5 questions, and how many questions each got. Open one in a new tab to see every Cambridge question on it.
What you needed in this session
Cambridge’s own grade thresholds for 2011 Oct/Nov, Paper 6 · Variant 1. A higher threshold means an easier paper — the bar moves with how the cohort did.