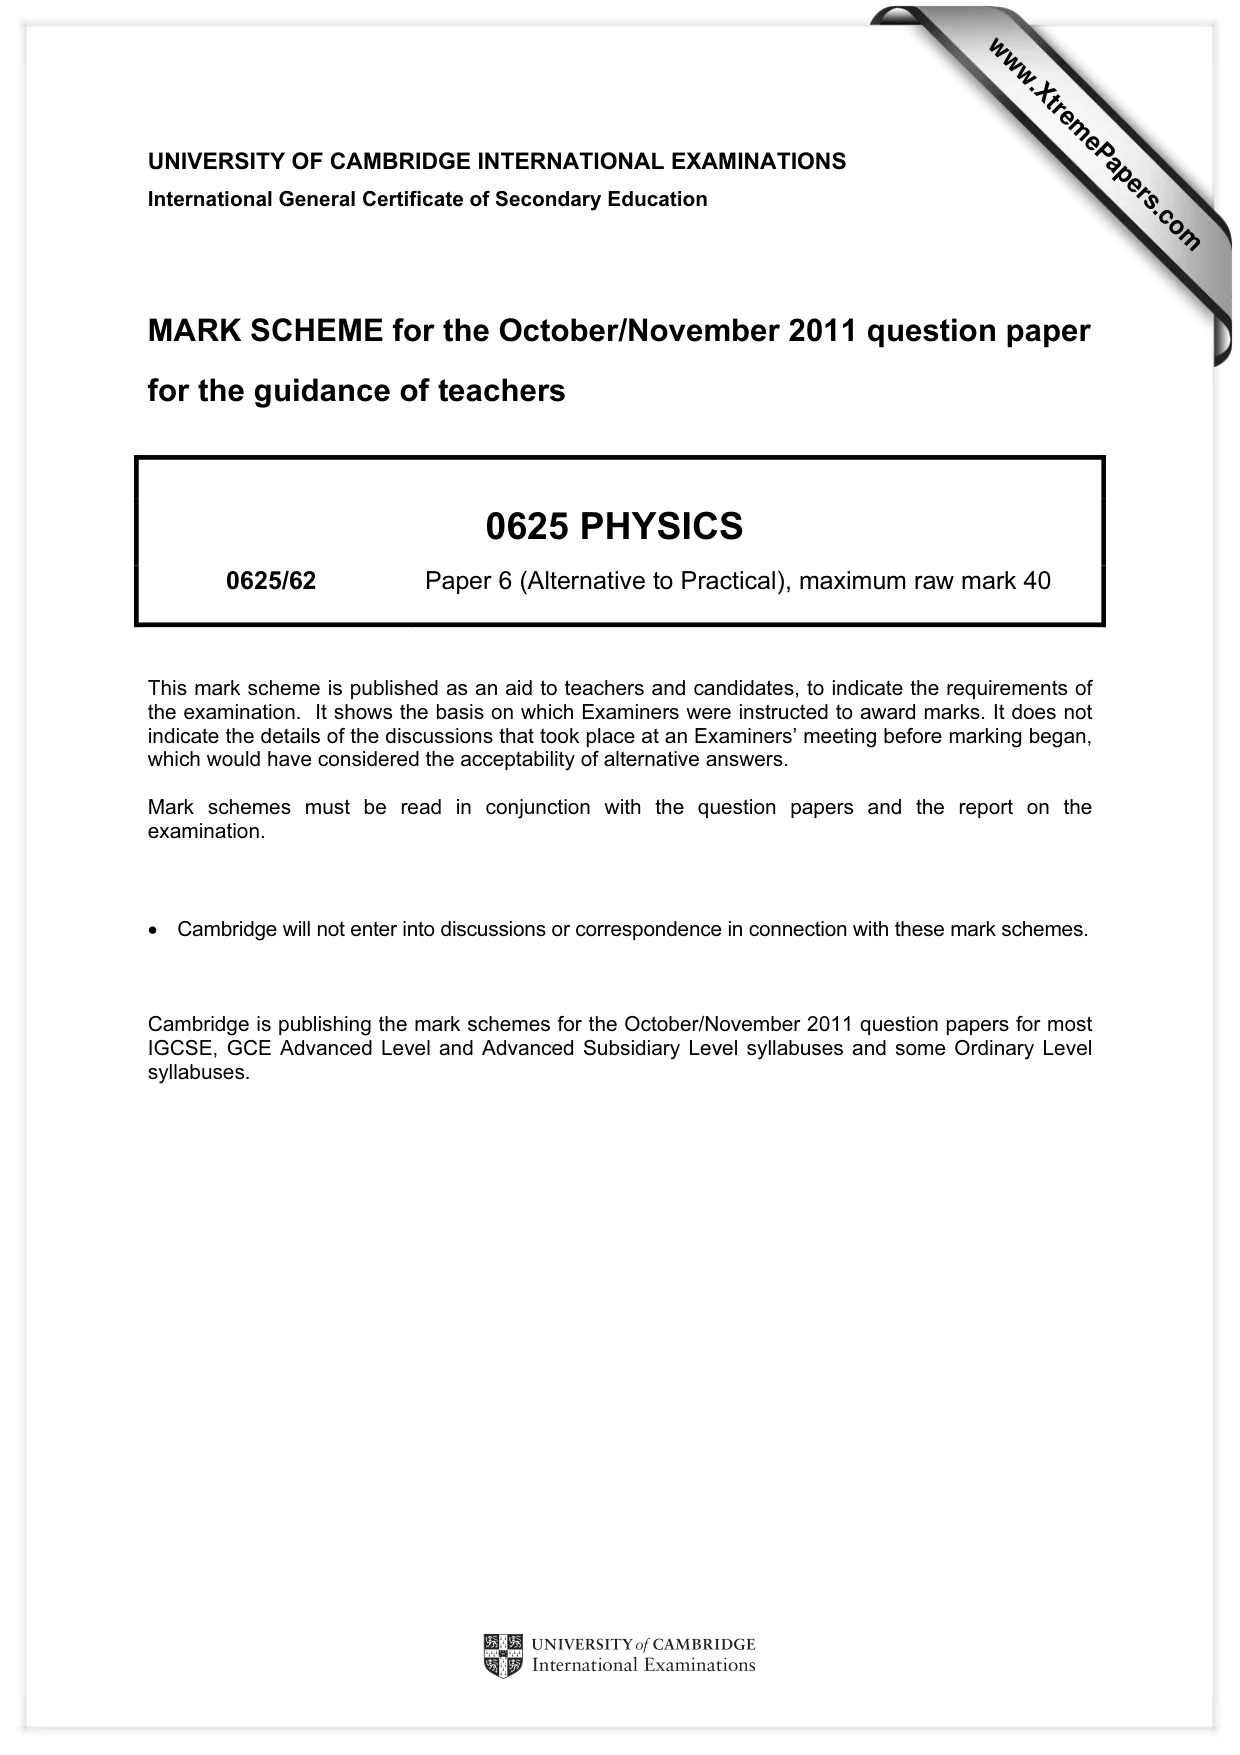
Cambridge IGCSE Physics 0625 — 2011 Oct/Nov Paper 6 · Variant 2
0625/62/O/N/11 · 5 questions · 40 marks · ≈45 min
The question paper and its mark scheme, free to read here and free to download. This is Cambridge’s own paper, exactly as it was sat.
Question paper12 pages
Mark scheme4 pages
Answers below. Sit the paper first if you are practising.
Questions as text
Q1 · The IGCSE class is investigating the law of moments
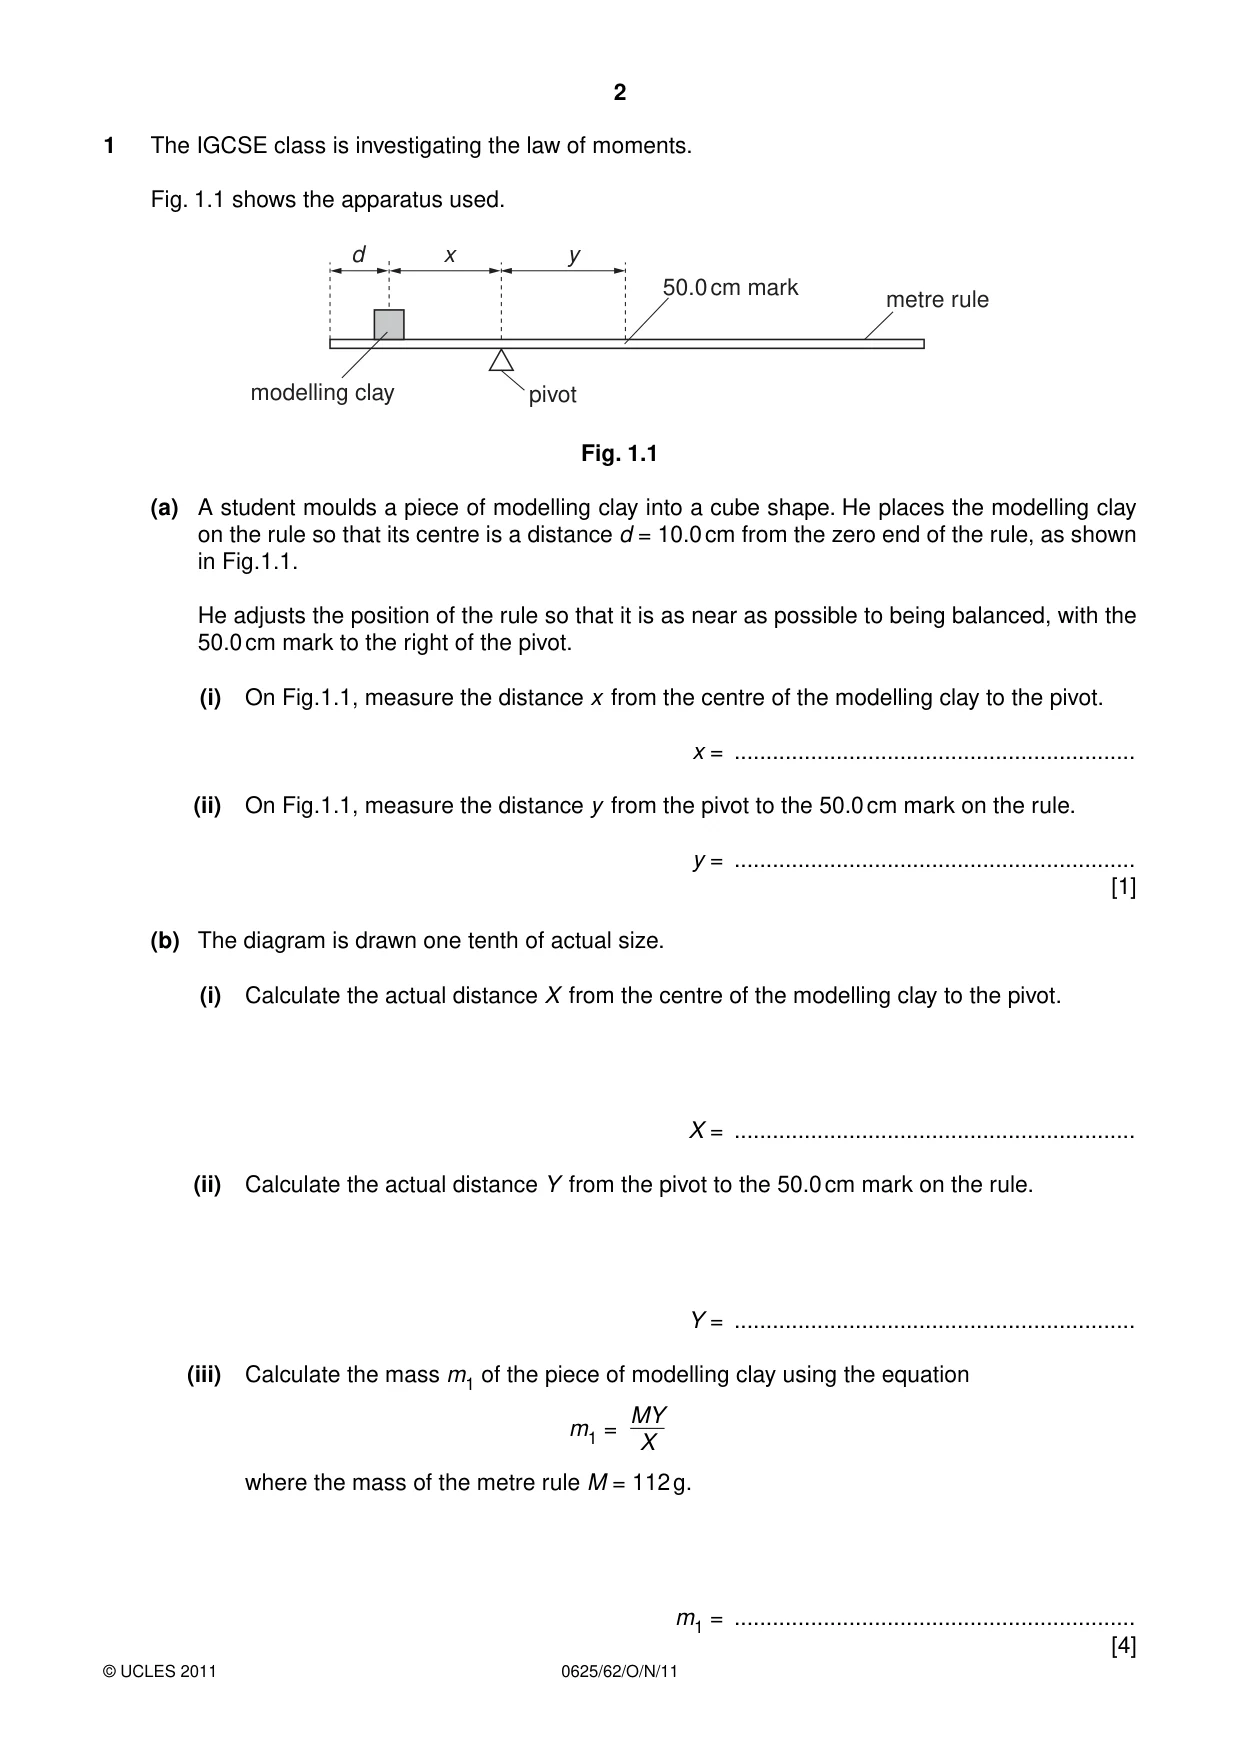
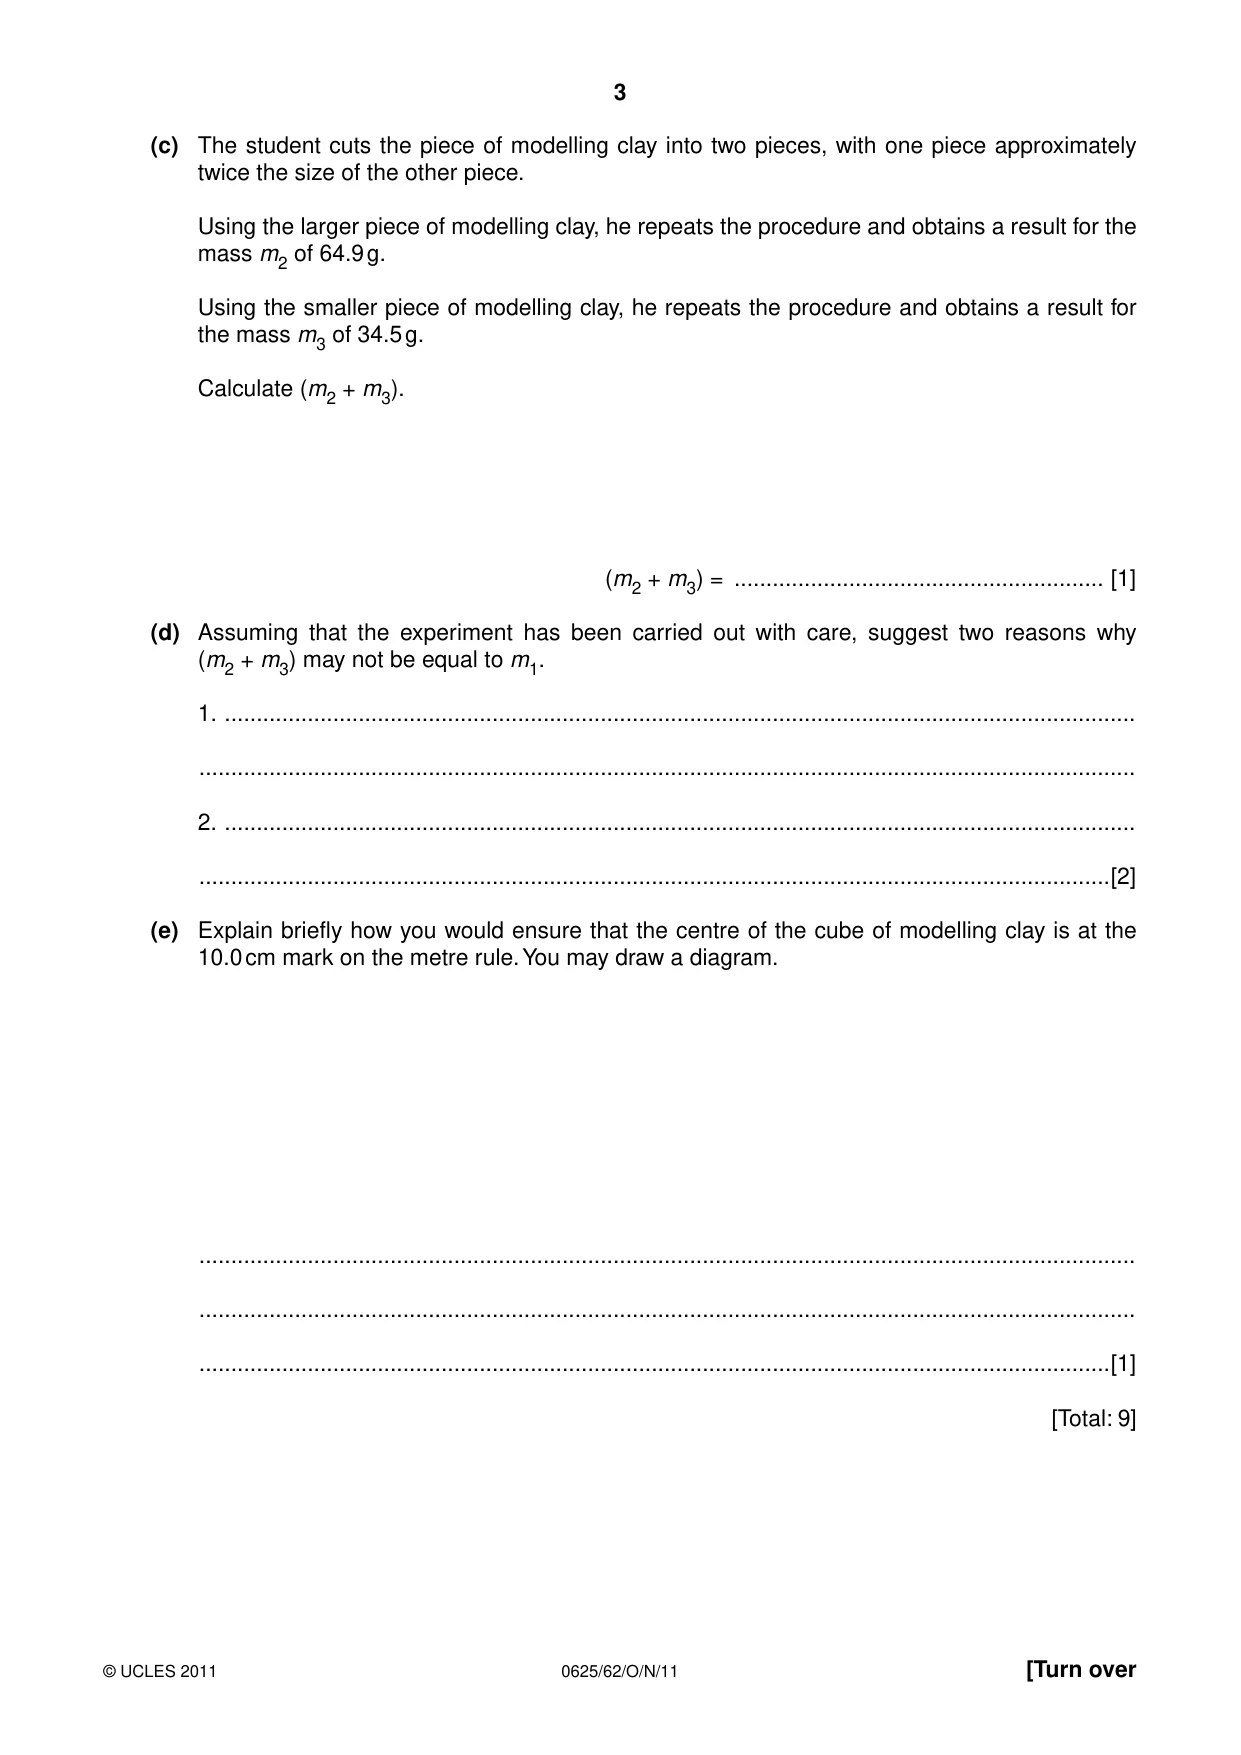
1 The IGCSE class is investigating the law of moments. Fig. 1.1 shows the apparatus used. d x y 50.0 cm mark metre rule modelling clay pivot Fig. 1.1 (a) A student moulds a piece of modelling clay into a cube shape. He places the modelling clay on the rule so that its centre is a distance d = 10.0 cm from the zero end of the rule, as shown in Fig.1.1. He adjusts the position of the rule so that it is as near as possible to being balanced, with the 50.0 cm mark to the right of the pivot. (i) On Fig.1.1, measure the distance x from the centre of the modelling clay to the pivot. x = ............................................................... (ii) On Fig.1.1, measure the distance y from the pivot to the 50.0 cm mark on the rule. y = ............................................................... [1] (b) The diagram is drawn one tenth of actual size. (i) Calculate the actual distance X from the centre of the modelling clay to the pivot. X = ............................................................... (ii) Calculate the actual distance Y from the pivot to the 50.0 cm mark on the rule. Y = ............................................................... (iii) Calculate the mass m1 of the piece of modelling clay using the equation MY m1 = X where the mass of the metre rule M = 112 g. m1 = ............................................................... [4] (c) The student cuts the piece of modelling clay into two pieces, with one piece approximately twice the size of the other piece. Using the larger piece of modelling clay, he repeats the procedure and obtains a result for the mass m2 of 64.9 g. Using the smaller piece of modelling clay, he repeats the procedure and obtains a result for the mass m3 of 34.5 g. Calculate (m2 + m3). (m2 + m3) = .......................................................... [1] (d) Assuming that the experiment has been carried out with care, suggest two reasons why (m2 + m3) may not be equal to m1. 1. ............................................................................................................................................... ................................................................................................................................................... 2. ............................................................................................................................................... ...............................................................................................................................................[2] (e) Explain briefly how you would ensure that the centre of the cube of modelling clay is at the 10.0 cm mark on the metre rule. You may draw a diagram. ................................................................................................................................................... ................................................................................................................................................... ...............................................................................................................................................[1] [Total: 9]
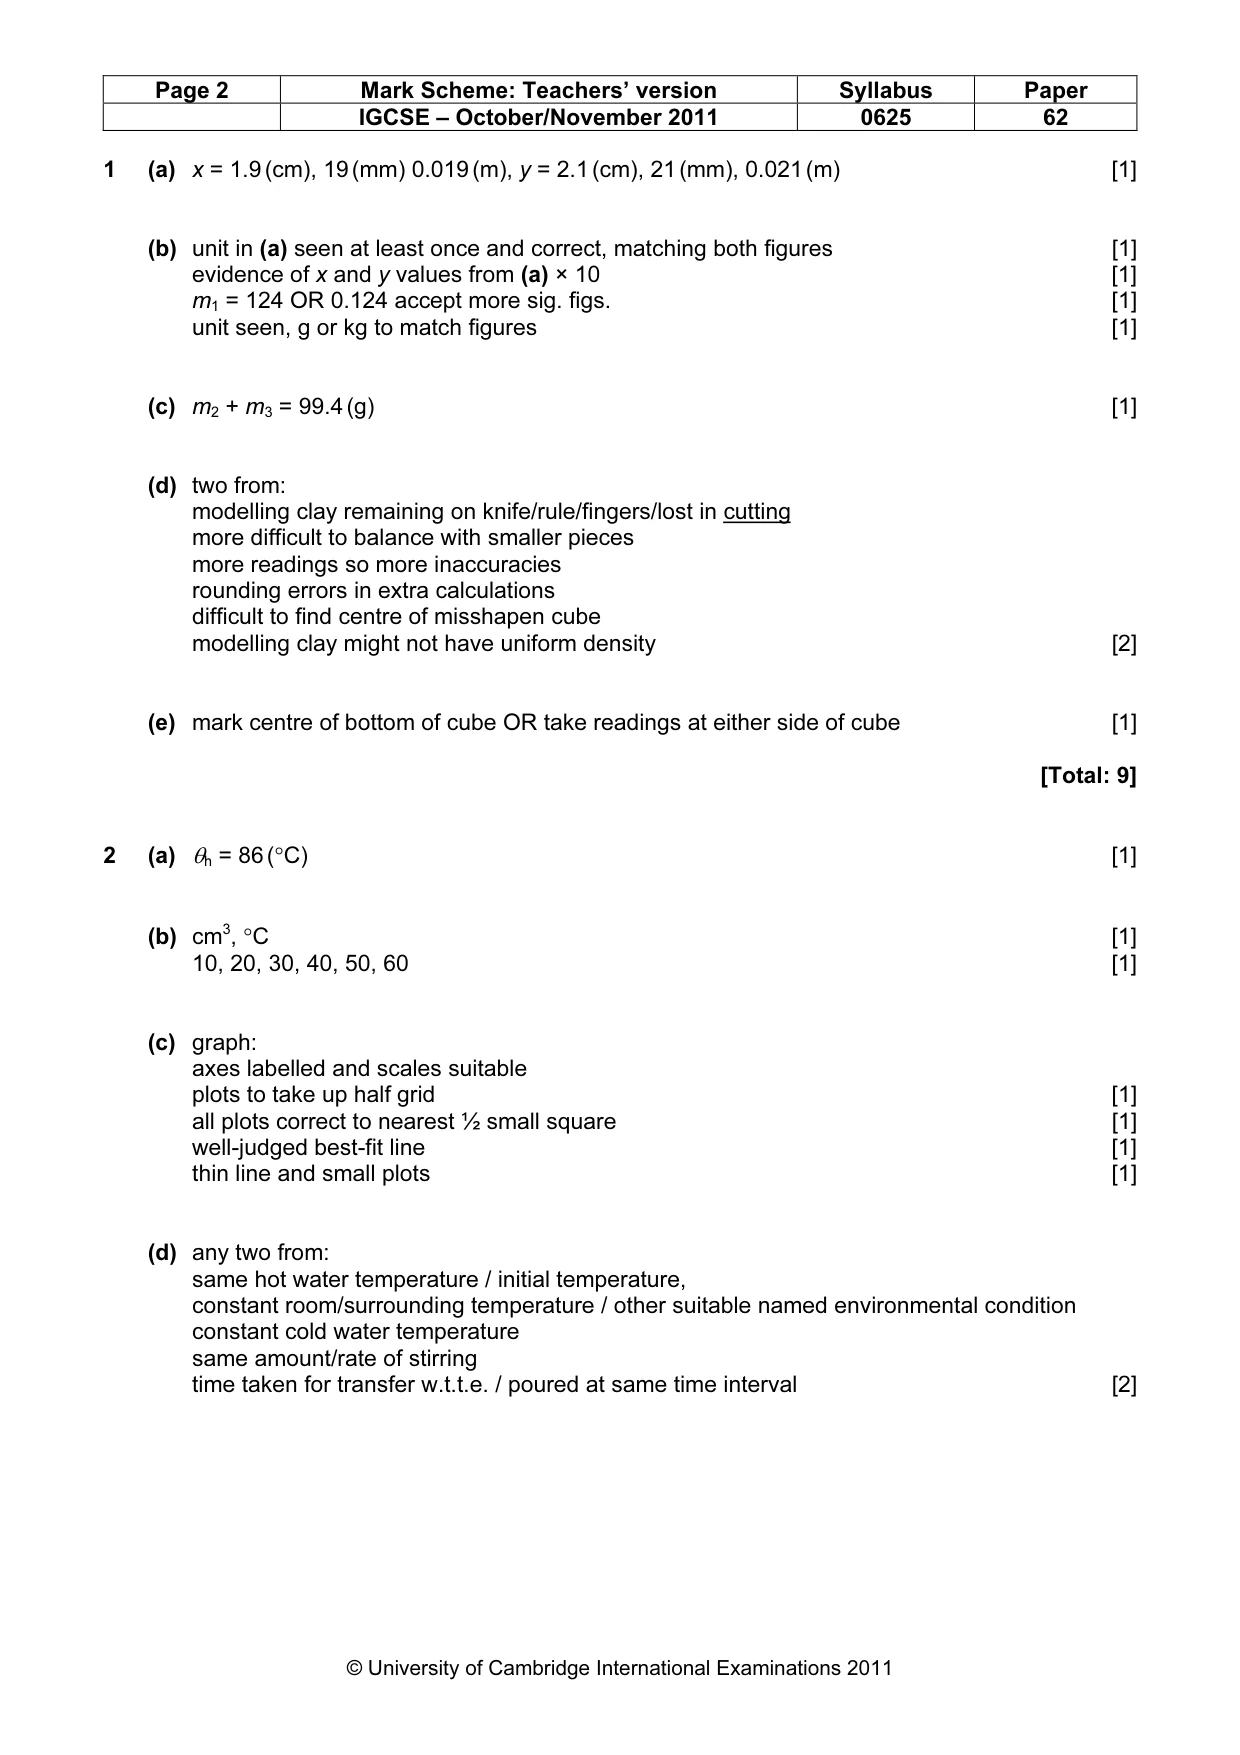
Mark scheme: 1 (a) x = 1.9 (cm), 19 (mm) 0.019 (m), y = 2.1 (cm), 21 (mm), 0.021 (m) [1] (b) unit in (a) seen at least once and correct, matching both figures [1] evidence of x and y values from (a) × 10 [1] m1 = 124 OR 0.124 accept more sig. figs. [1] unit seen, g or kg to match figures [1] (c) m2 + m3 = 99.4 (g) [1] (d) two from: modelling clay remaining on knife/rule/fingers/lost in cutting more difficult to balance with smaller pieces more readings so more inaccuracies rounding errors in extra calculations difficult to find centre of misshapen cube modelling clay might not have uniform density [2] (e) mark centre of bottom of cube OR take readings at either side of cube [1] [Total: 9]
Q2 · An IGCSE student is investigating temperature changes when hot water and cold water are…
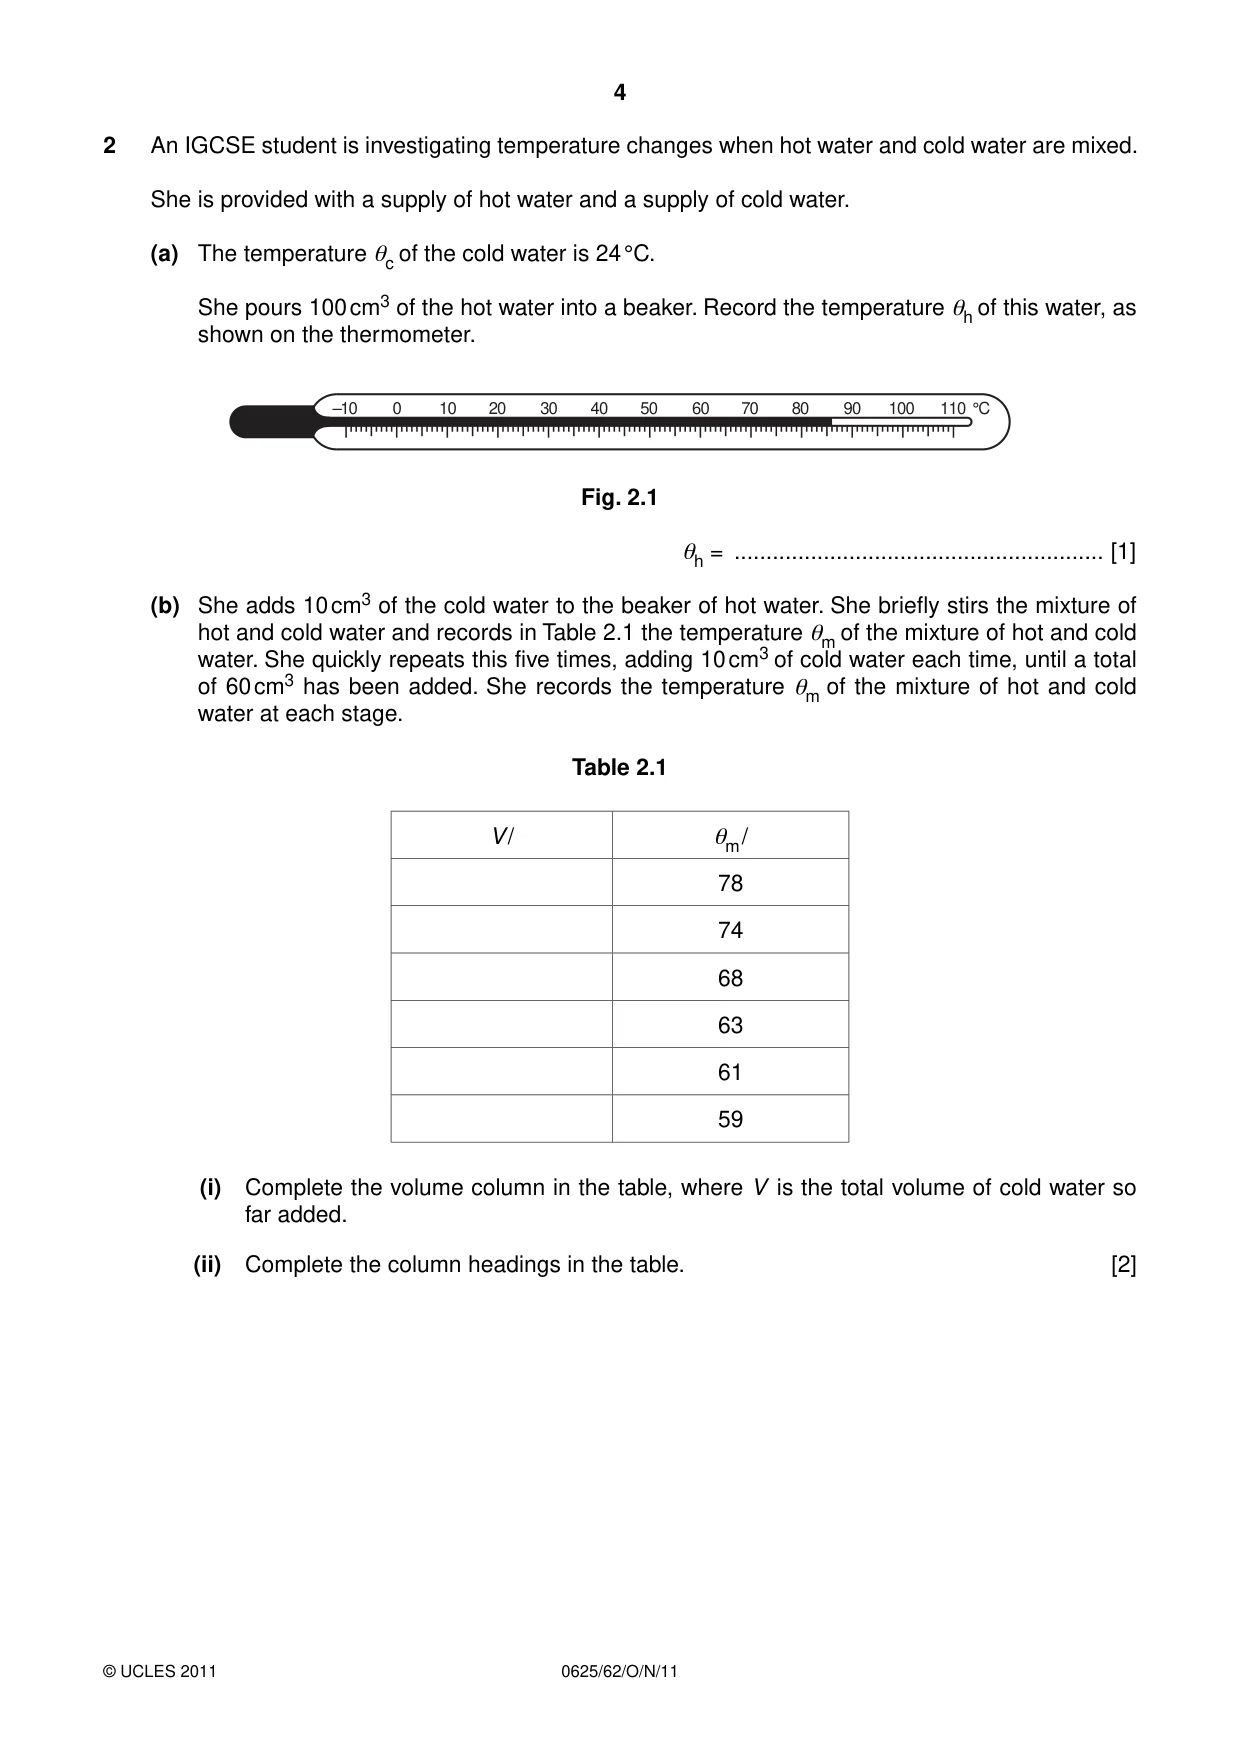
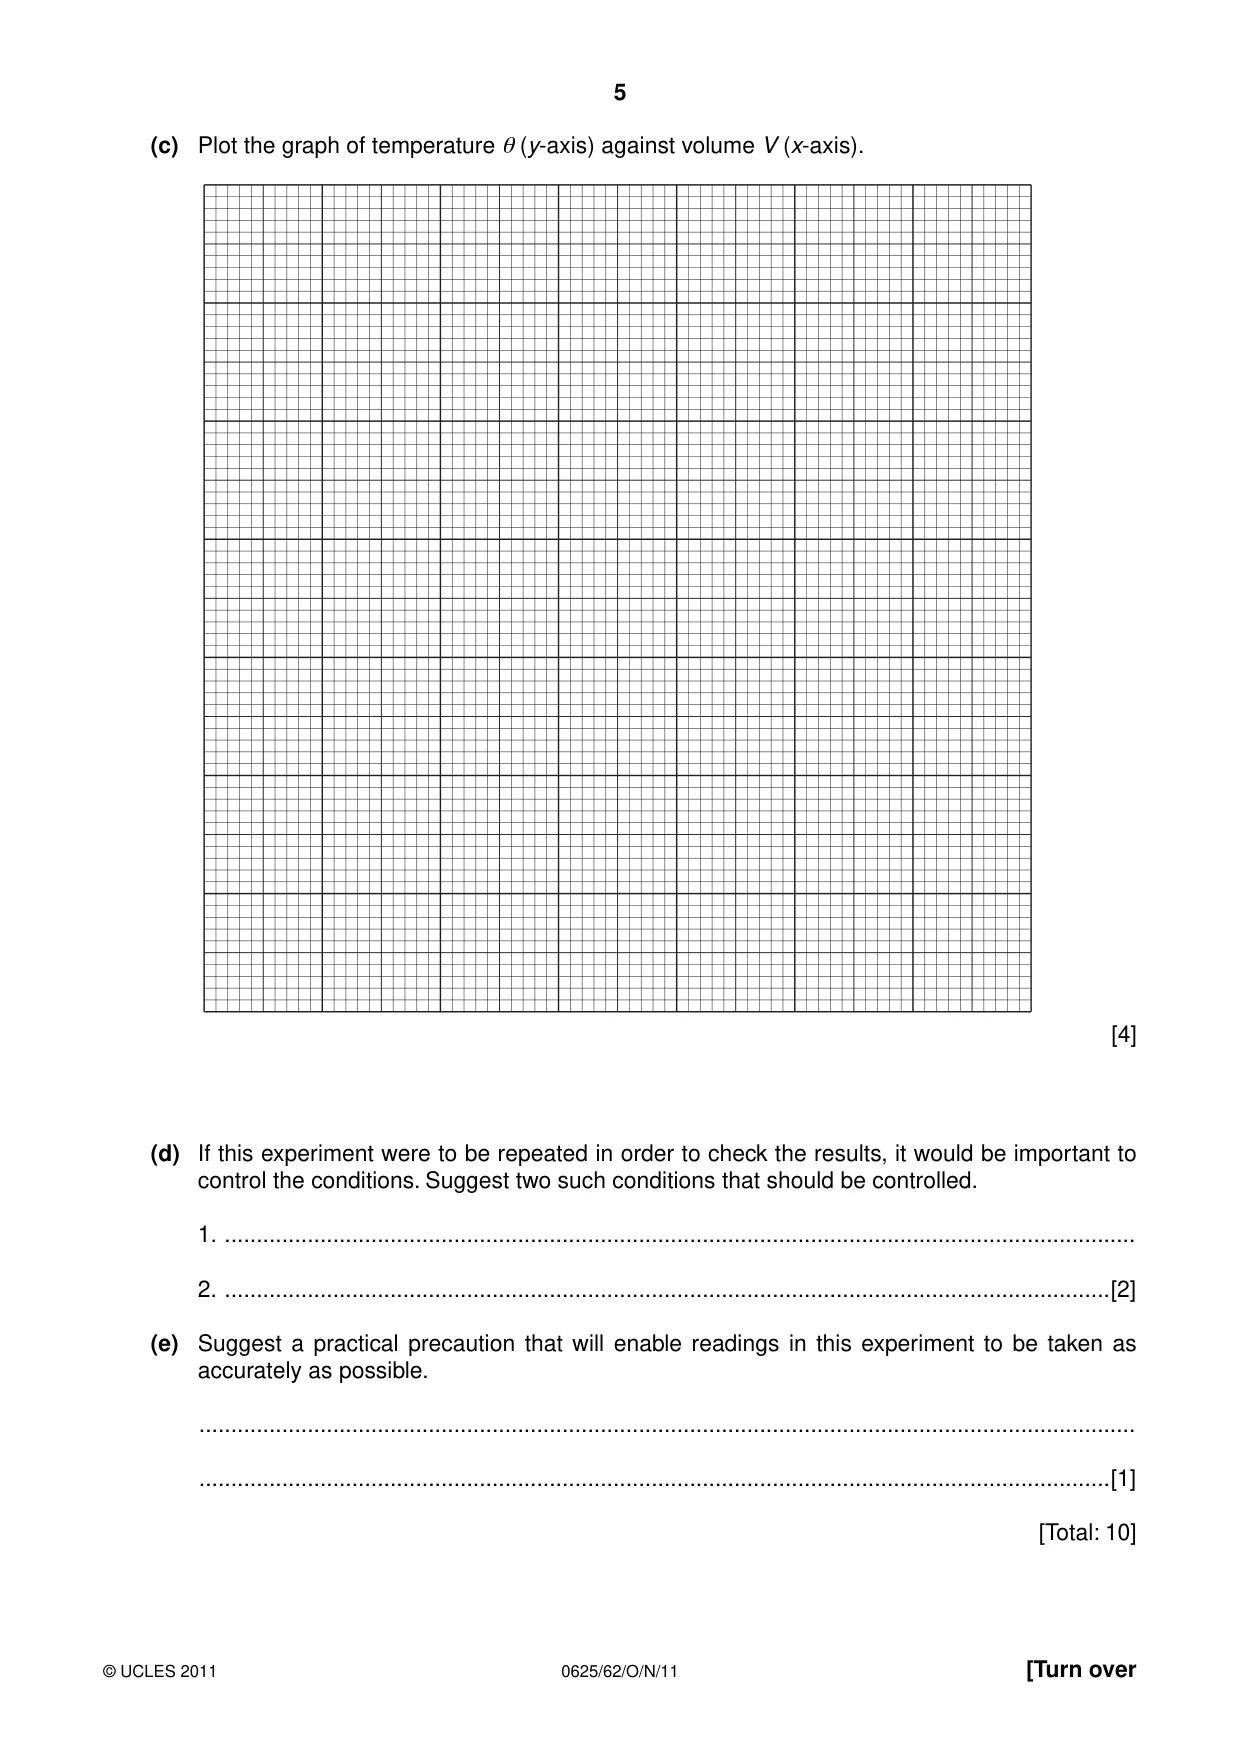
2 An IGCSE student is investigating temperature changes when hot water and cold water are mixed. She is provided with a supply of hot water and a supply of cold water. (a) The temperature θc of the cold water is 24 °C. She pours 100 cm3 of the hot water into a beaker. Record the temperature θh of this water, as shown on the thermometer. –10 0 10 20 30 40 50 60 70 80 90 100 110 °C Fig. 2.1 θh = .......................................................... [1] (b) She adds 10 cm3 of the cold water to the beaker of hot water. She briefly stirs the mixture of hot and cold water and records in Table 2.1 the temperature θm of the mixture of hot and cold water. She quickly repeats this five times, adding 10 cm3 of cold water each time, until a total of 60 cm3 has been added. She records the temperature θm of the mixture of hot and cold water at each stage. Table 2.1 V / θm / 78 74 68 63 61 59 (i) Complete the volume column in the table, where V is the total volume of cold water so far added. (ii) Complete the column headings in the table. [2] (c) Plot the graph of temperature θ (y-axis) against volume V (x-axis). [4] (d) If this experiment were to be repeated in order to check the results, it would be important to control the conditions. Suggest two such conditions that should be controlled. 1. ............................................................................................................................................... 2. ...........................................................................................................................................[2] (e) Suggest a practical precaution that will enable readings in this experiment to be taken as accurately as possible. ................................................................................................................................................... ...............................................................................................................................................[1] [Total: 10]
Mark scheme: 2 (a) θh = 86 (°C) [1] (b) cm3, °C [1] 10, 20, 30, 40, 50, 60 [1] (c) graph: axes labelled and scales suitable plots to take up half grid [1] all plots correct to nearest ½ small square [1] well-judged best-fit line [1] thin line and small plots [1] (d) any two from: same hot water temperature / initial temperature, constant room/surrounding temperature / other suitable named environmental condition constant cold water temperature same amount/rate of stirring time taken for transfer w.t.t.e. / poured at same time interval [2] IGCSE – October/November 2011 0625 62 (e) any one from: avoidance of parallax explained (thermometer or measuring cylinder) wait for temperature to stabilise other suitable suggestion related to measurement [1] [Total: 10]
Q3 · The IGCSE class is investigating the potential difference across resistors in a circuit
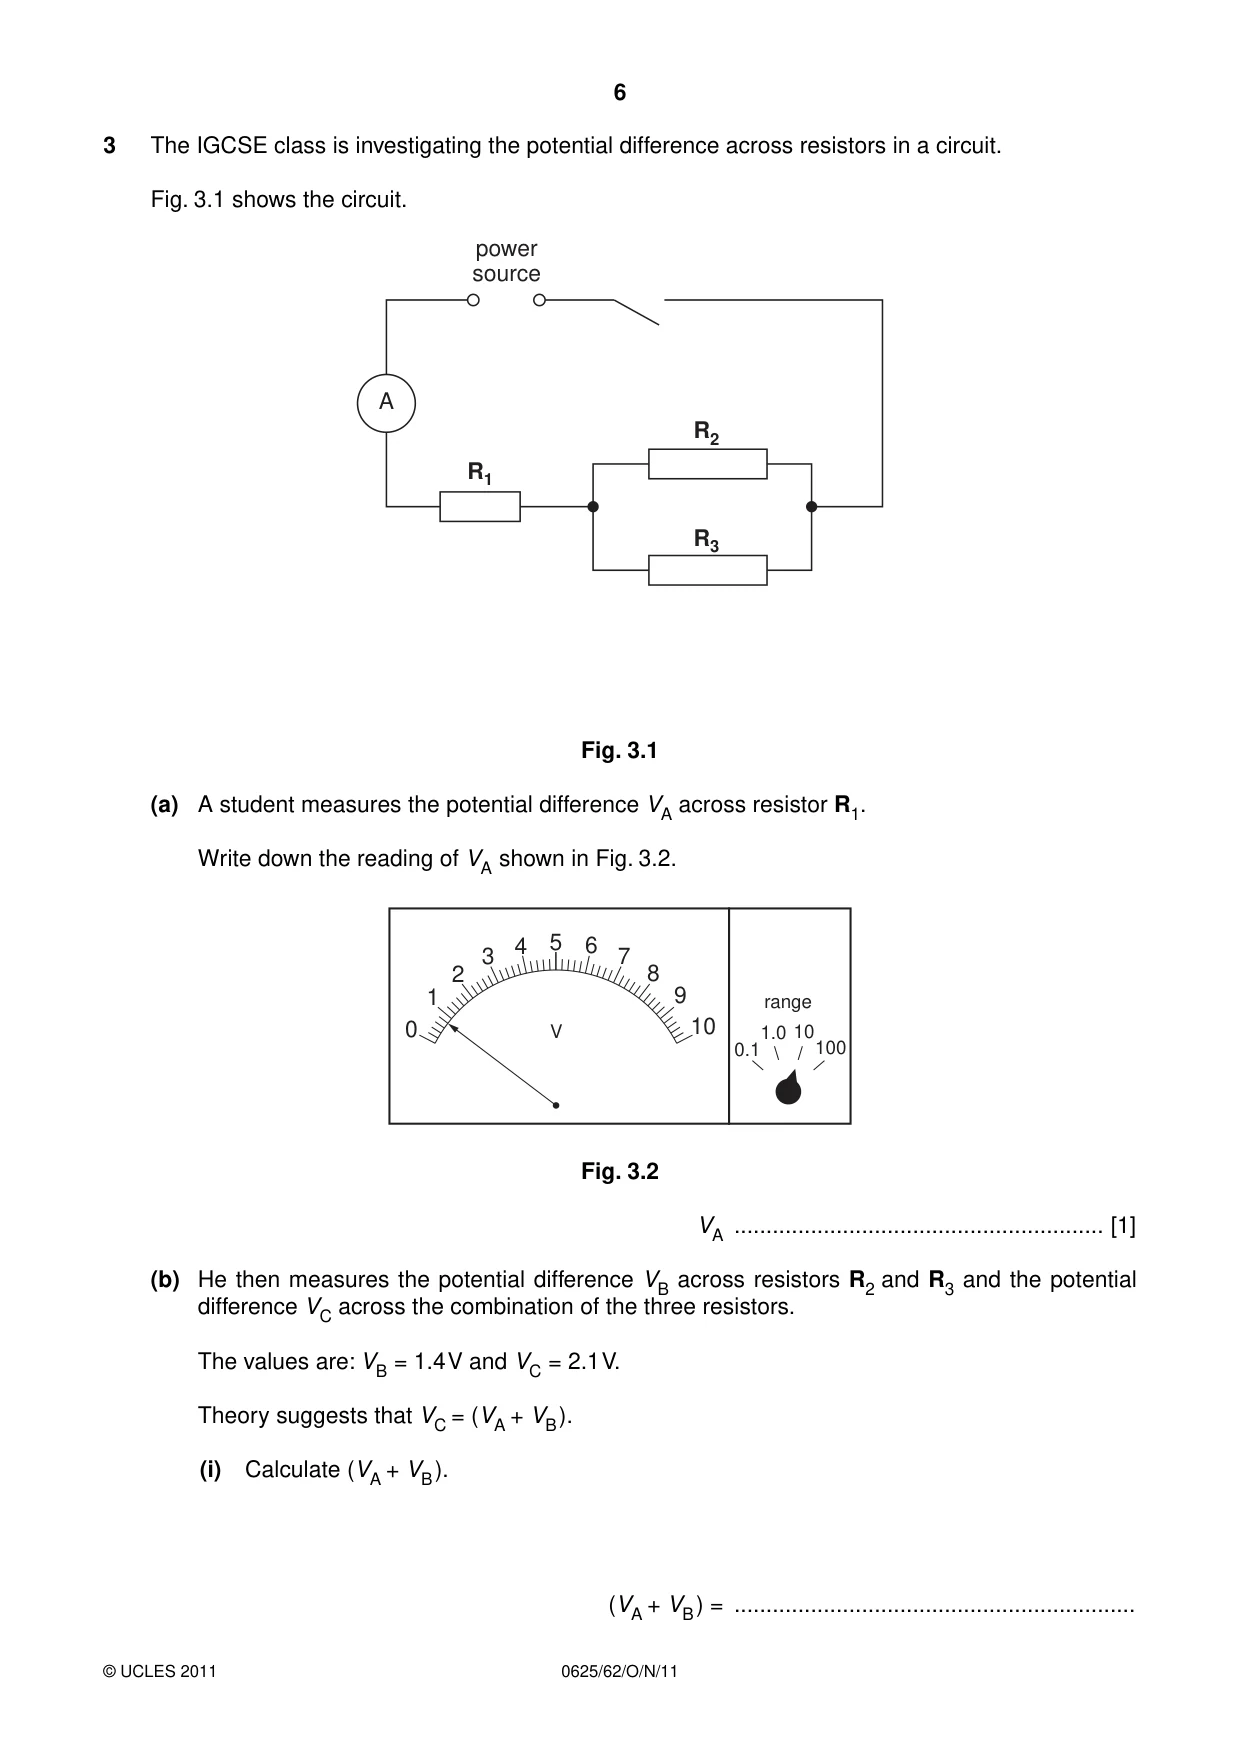
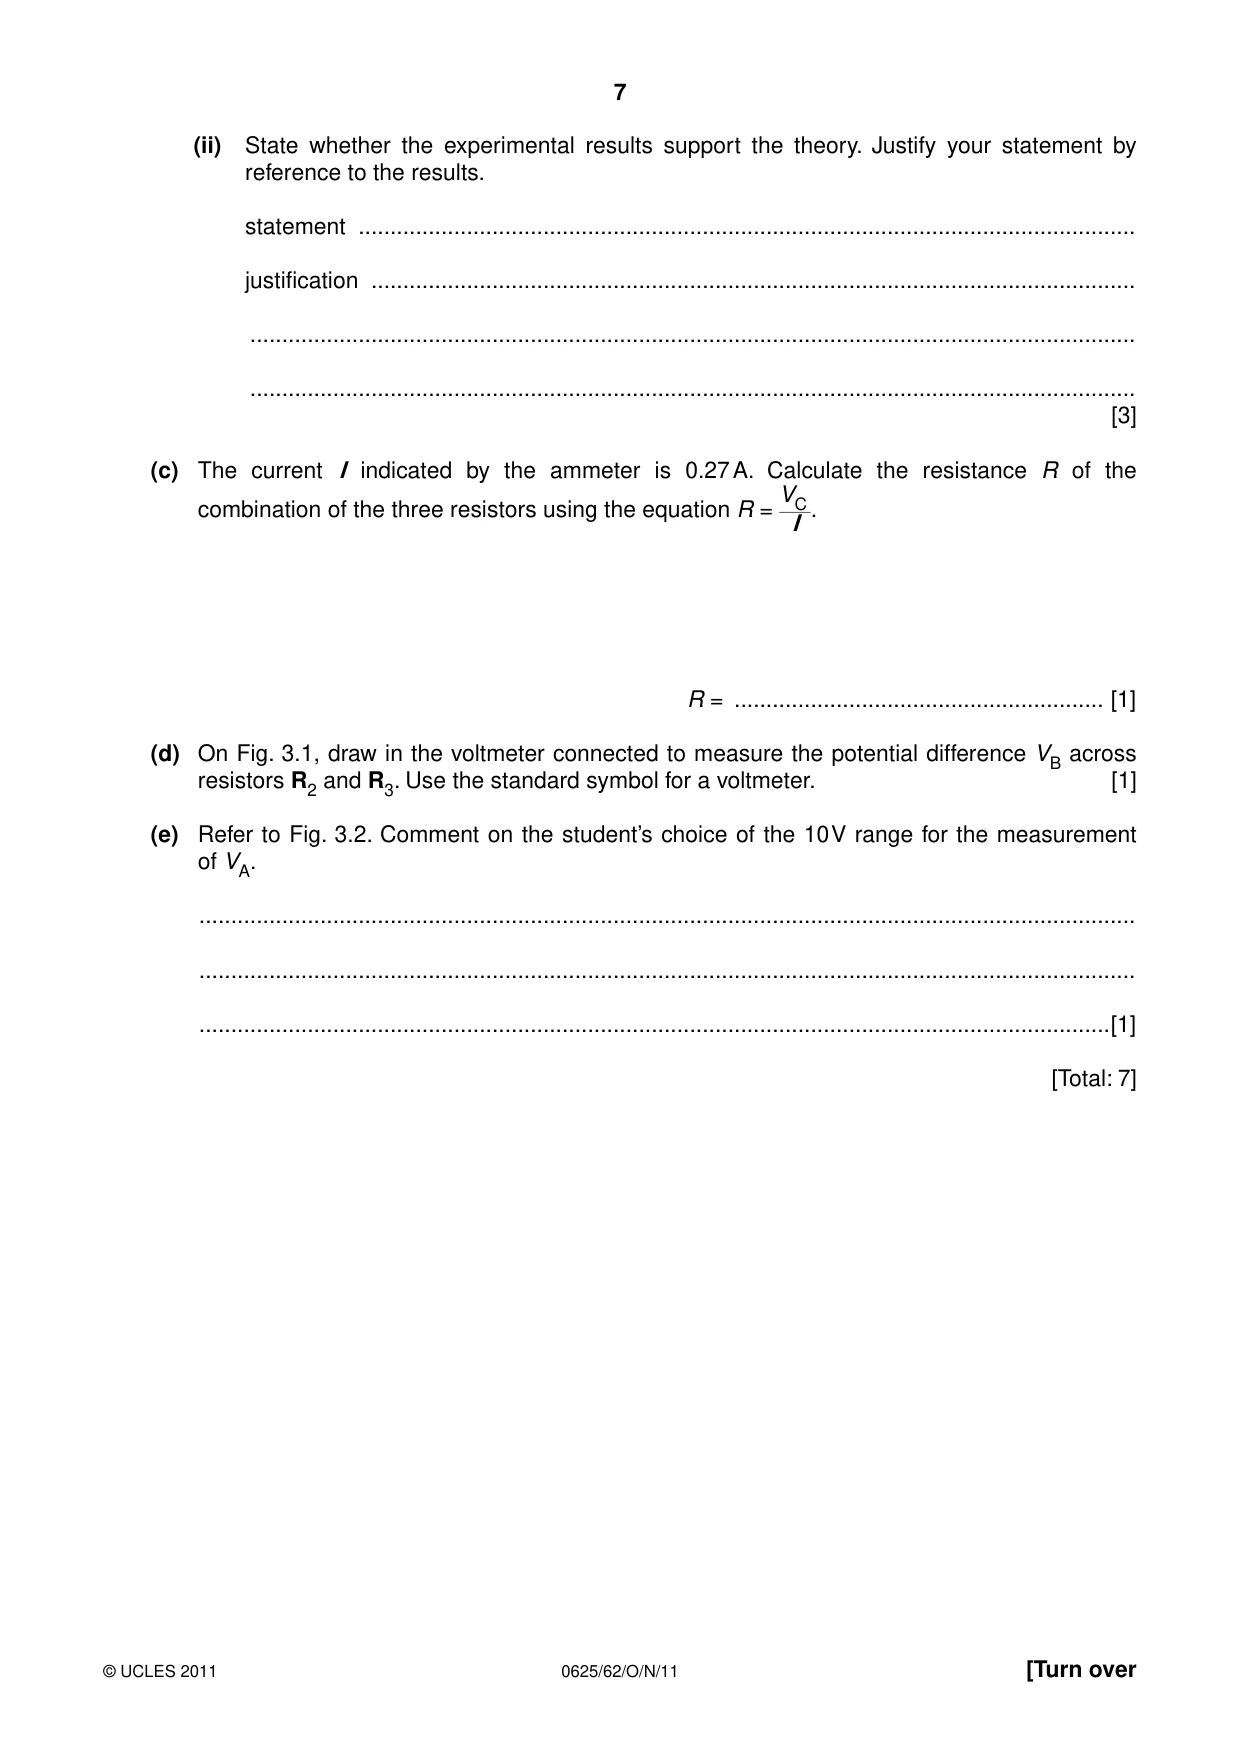
3 The IGCSE class is investigating the potential difference across resistors in a circuit. Fig. 3.1 shows the circuit. power source A R2 R1 R3 Fig. 3.1 (a) A student measures the potential difference VA across resistor R1. Write down the reading of VA shown in Fig. 3.2. 4 5 6 3 7 2 8 1 9 range 0 V 10 1.0 10 0.1 100 Fig. 3.2 VA .......................................................... [1] (b) He then measures the potential difference VB across resistors R2 and R3 and the potential difference VC across the combination of the three resistors. The values are: VB = 1.4 V and VC = 2.1 V. Theory suggests that VC = (VA + VB ). (i) Calculate (VA + VB ). (VA + VB ) = ............................................................... (ii) State whether the experimental results support the theory. Justify your statement by reference to the results. statement .......................................................................................................................... justification ........................................................................................................................ ........................................................................................................................................... ........................................................................................................................................... [3] (c) The current I indicated by the ammeter is 0.27 A. Calculate the resistance R of the VC combination of the three resistors using the equation R = . I R = .......................................................... [1] (d) On Fig. 3.1, draw in the voltmeter connected to measure the potential difference VB across resistors R2 and R3. Use the standard symbol for a voltmeter. [1] (e) Refer to Fig. 3.2. Comment on the student’s choice of the 10 V range for the measurement of VA. ................................................................................................................................................... ................................................................................................................................................... ...............................................................................................................................................[1] [Total: 7]
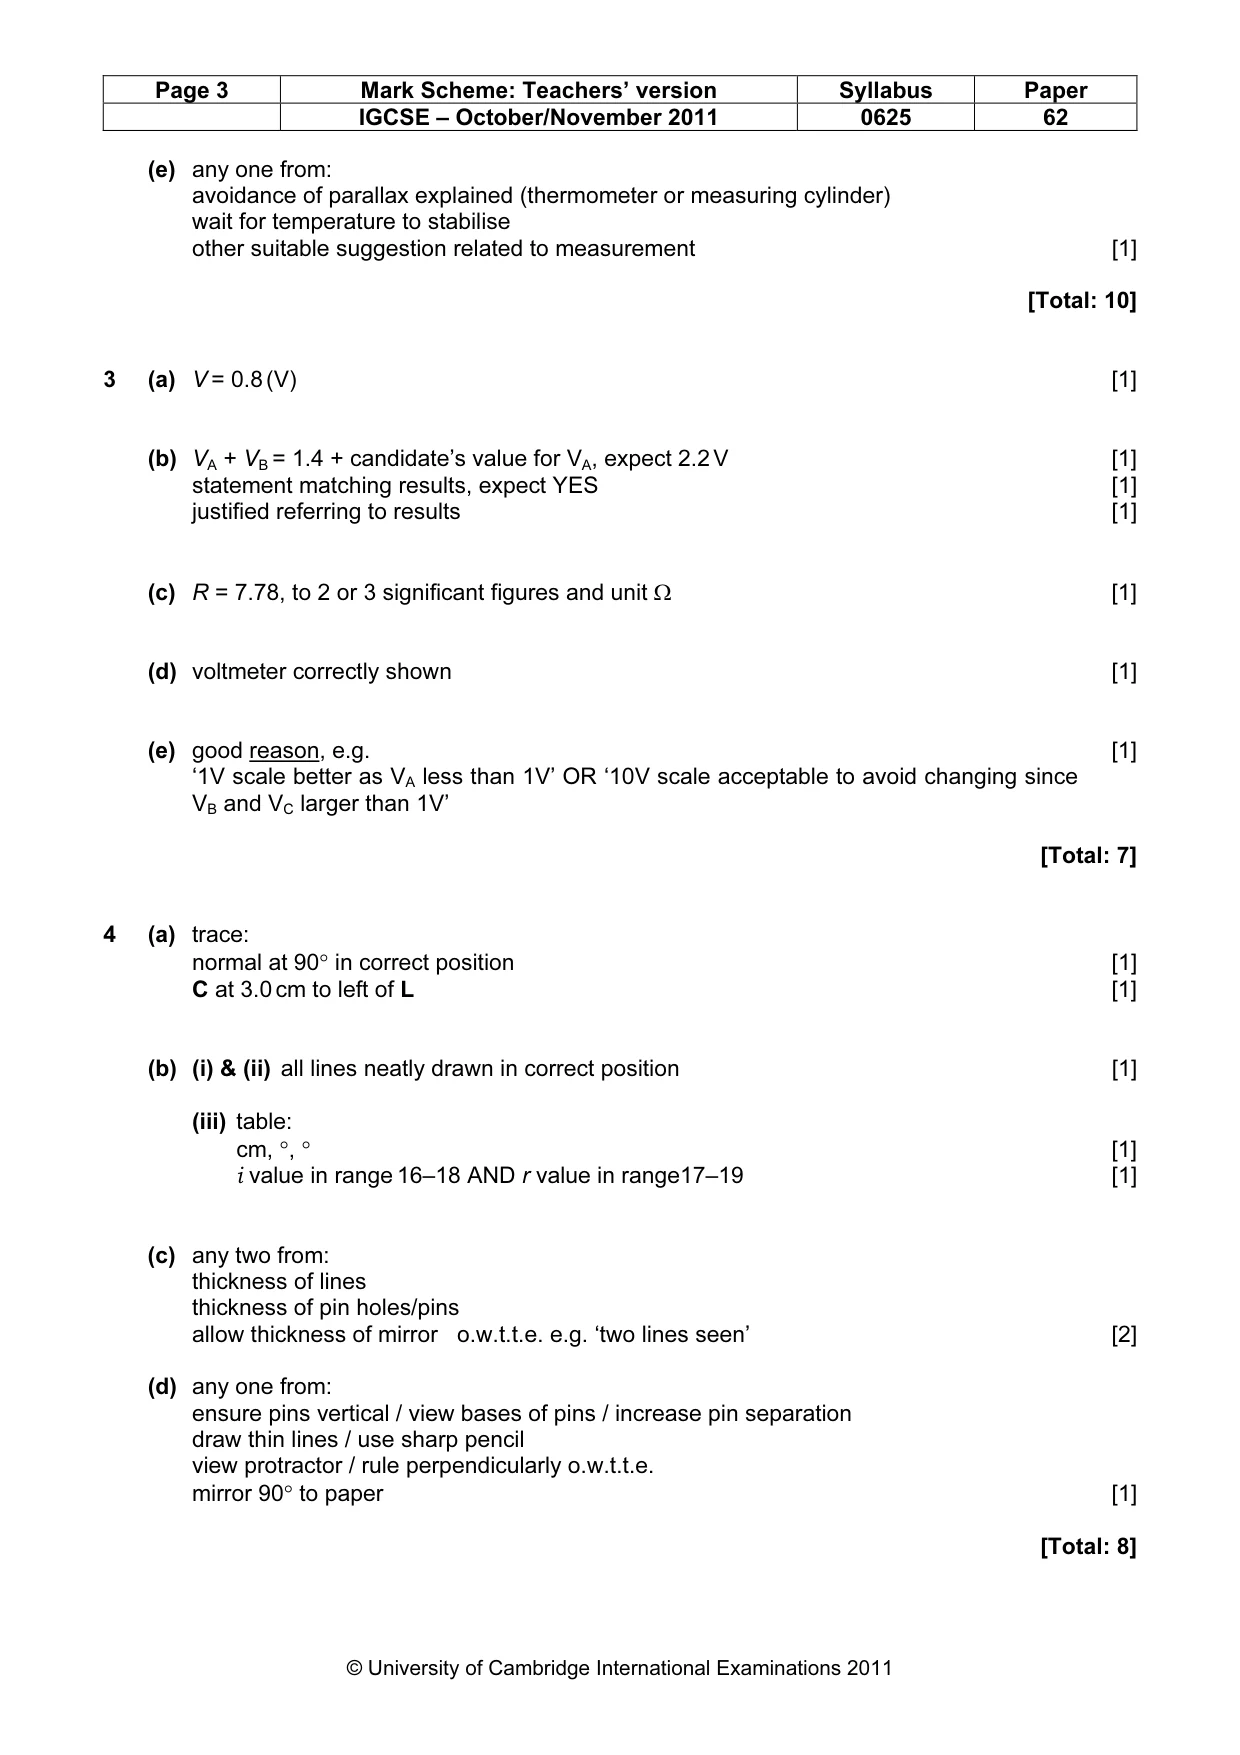
Mark scheme: 3 (a) V = 0.8 (V) [1] (b) VA + VB = 1.4 + candidate’s value for VA, expect 2.2 V [1] statement matching results, expect YES [1] justified referring to results [1] (c) R = 7.78, to 2 or 3 significant figures and unit Ω [1] (d) voltmeter correctly shown [1] (e) good reason, e.g. [1] ‘1V scale better as VA less than 1V’ OR ‘10V scale acceptable to avoid changing since VB and VC larger than 1V’ [Total: 7]
Q4 · An IGCSE student is investigating the reflection of light by a plane mirror
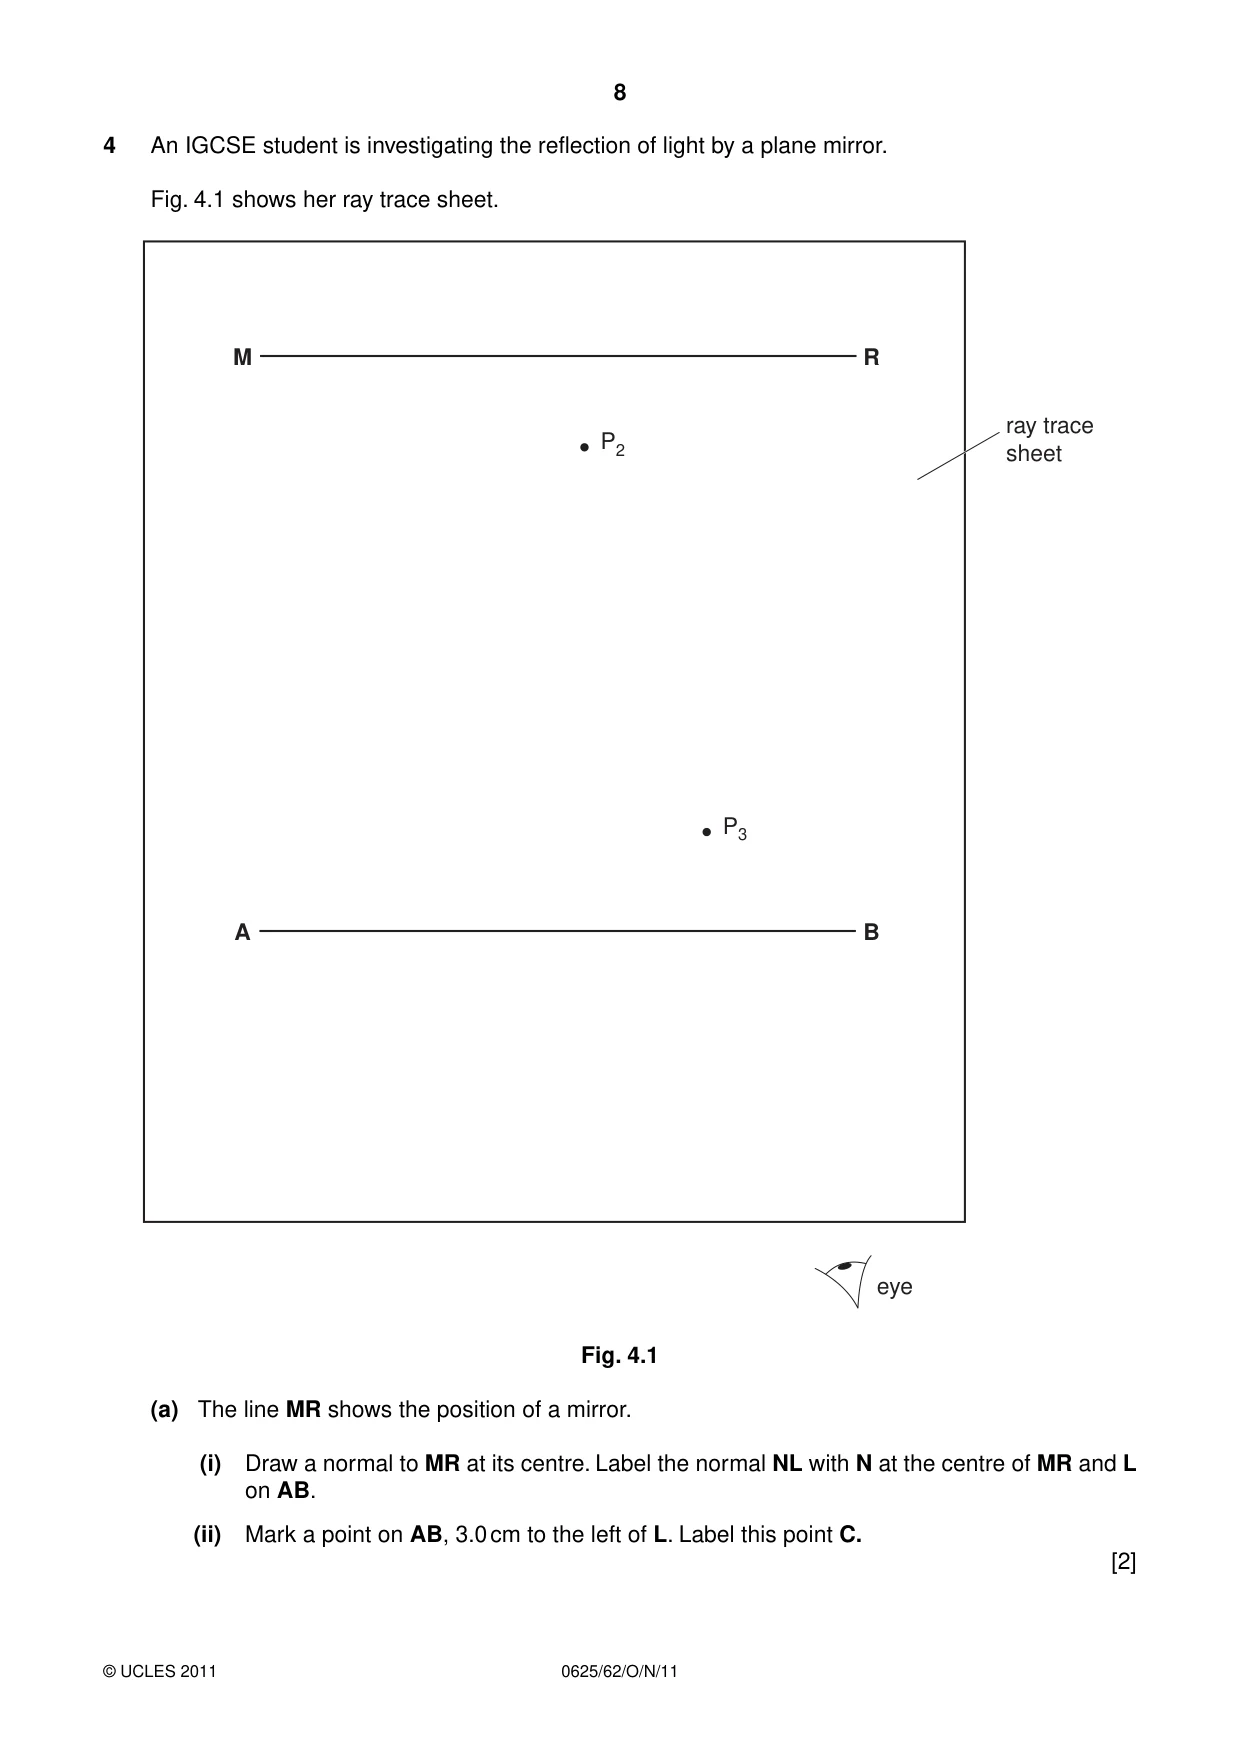
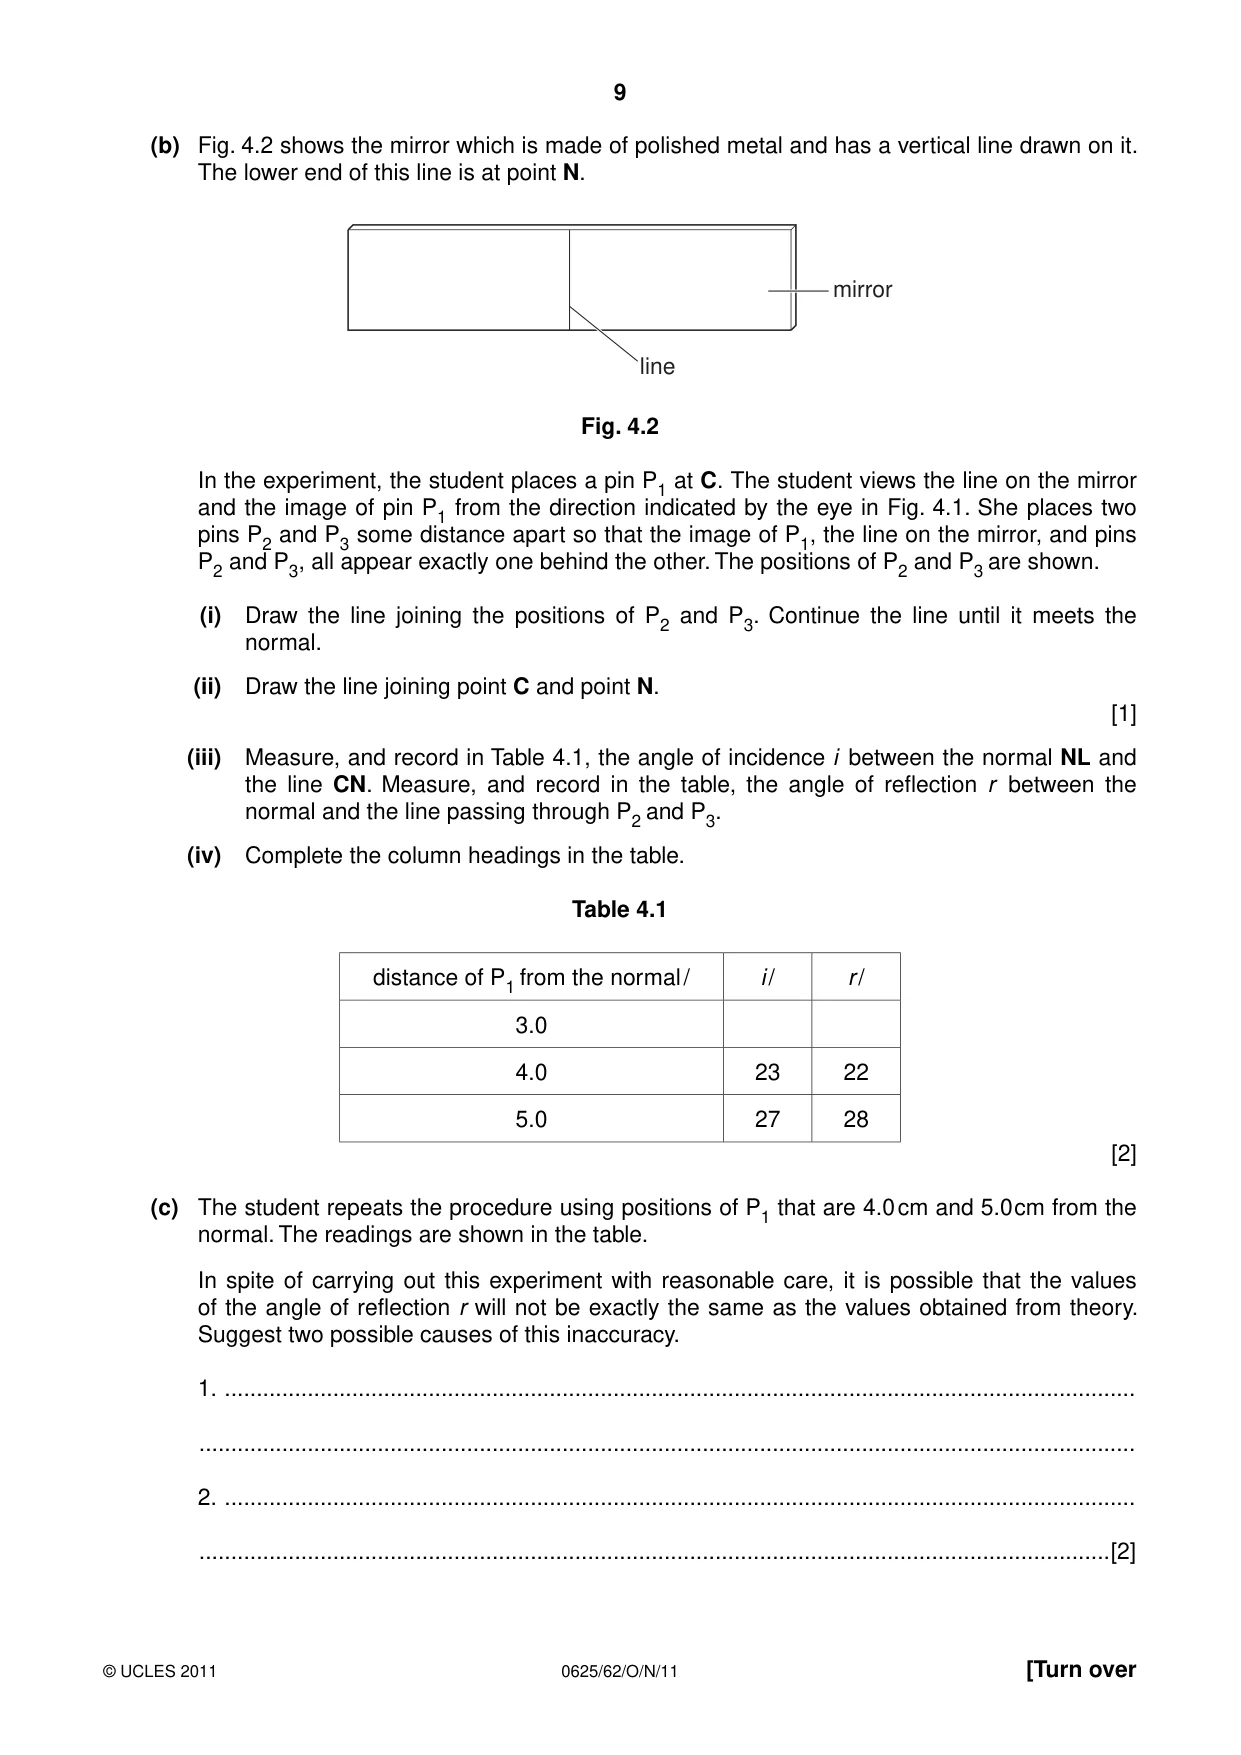
4 An IGCSE student is investigating the reflection of light by a plane mirror. Fig. 4.1 shows her ray trace sheet. M R ray trace P2 sheet P3 A B eye Fig. 4.1 (a) The line MR shows the position of a mirror. (i) Draw a normal to MR at its centre. Label the normal NL with N at the centre of MR and L on AB. (ii) Mark a point on AB, 3.0 cm to the left of L. Label this point C. [2] (b) Fig. 4.2 shows the mirror which is made of polished metal and has a vertical line drawn on it. The lower end of this line is at point N. mirror line Fig. 4.2 In the experiment, the student places a pin P1 at C. The student views the line on the mirror and the image of pin P1 from the direction indicated by the eye in Fig. 4.1. She places two pins P2 and P3 some distance apart so that the image of P1, the line on the mirror, and pins P2 and P3, all appear exactly one behind the other. The positions of P2 and P3 are shown. (i) Draw the line joining the positions of P2 and P3. Continue the line until it meets the normal. (ii) Draw the line joining point C and point N. [1] (iii) Measure, and record in Table 4.1, the angle of incidence i between the normal NL and the line CN. Measure, and record in the table, the angle of reflection r between the normal and the line passing through P2 and P3. (iv) Complete the column headings in the table. Table 4.1 distance of P1 from the normal / i / r / 3.0 4.0 23 22 5.0 27 28 [2] (c) The student repeats the procedure using positions of P1 that are 4.0 cm and 5.0 cm from the normal. The readings are shown in the table. In spite of carrying out this experiment with reasonable care, it is possible that the values of the angle of reflection r will not be exactly the same as the values obtained from theory. Suggest two possible causes of this inaccuracy. 1. ............................................................................................................................................... ................................................................................................................................................... 2. ............................................................................................................................................... ...............................................................................................................................................[2] (d) Suggest one precaution that you would take in this experiment to ensure that the results are as accurate as possible. ................................................................................................................................................... ...............................................................................................................................................[1] [Total: 8]
Mark scheme: 4 (a) trace: normal at 90° in correct position [1] C at 3.0 cm to left of L [1] (b) (i) & (ii) all lines neatly drawn in correct position [1] (iii) table: cm, °, ° [1] i value in range 16–18 AND r value in range17–19 [1] (c) any two from: thickness of lines thickness of pin holes/pins allow thickness of mirror o.w.t.t.e. e.g. ‘two lines seen’ [2] (d) any one from: ensure pins vertical / view bases of pins / increase pin separation draw thin lines / use sharp pencil view protractor / rule perpendicularly o.w.t.t.e. mirror 90° to paper [1] [Total: 8] IGCSE – October/November 2011 0625 62
Q5 · The IGCSE class is investigating springs
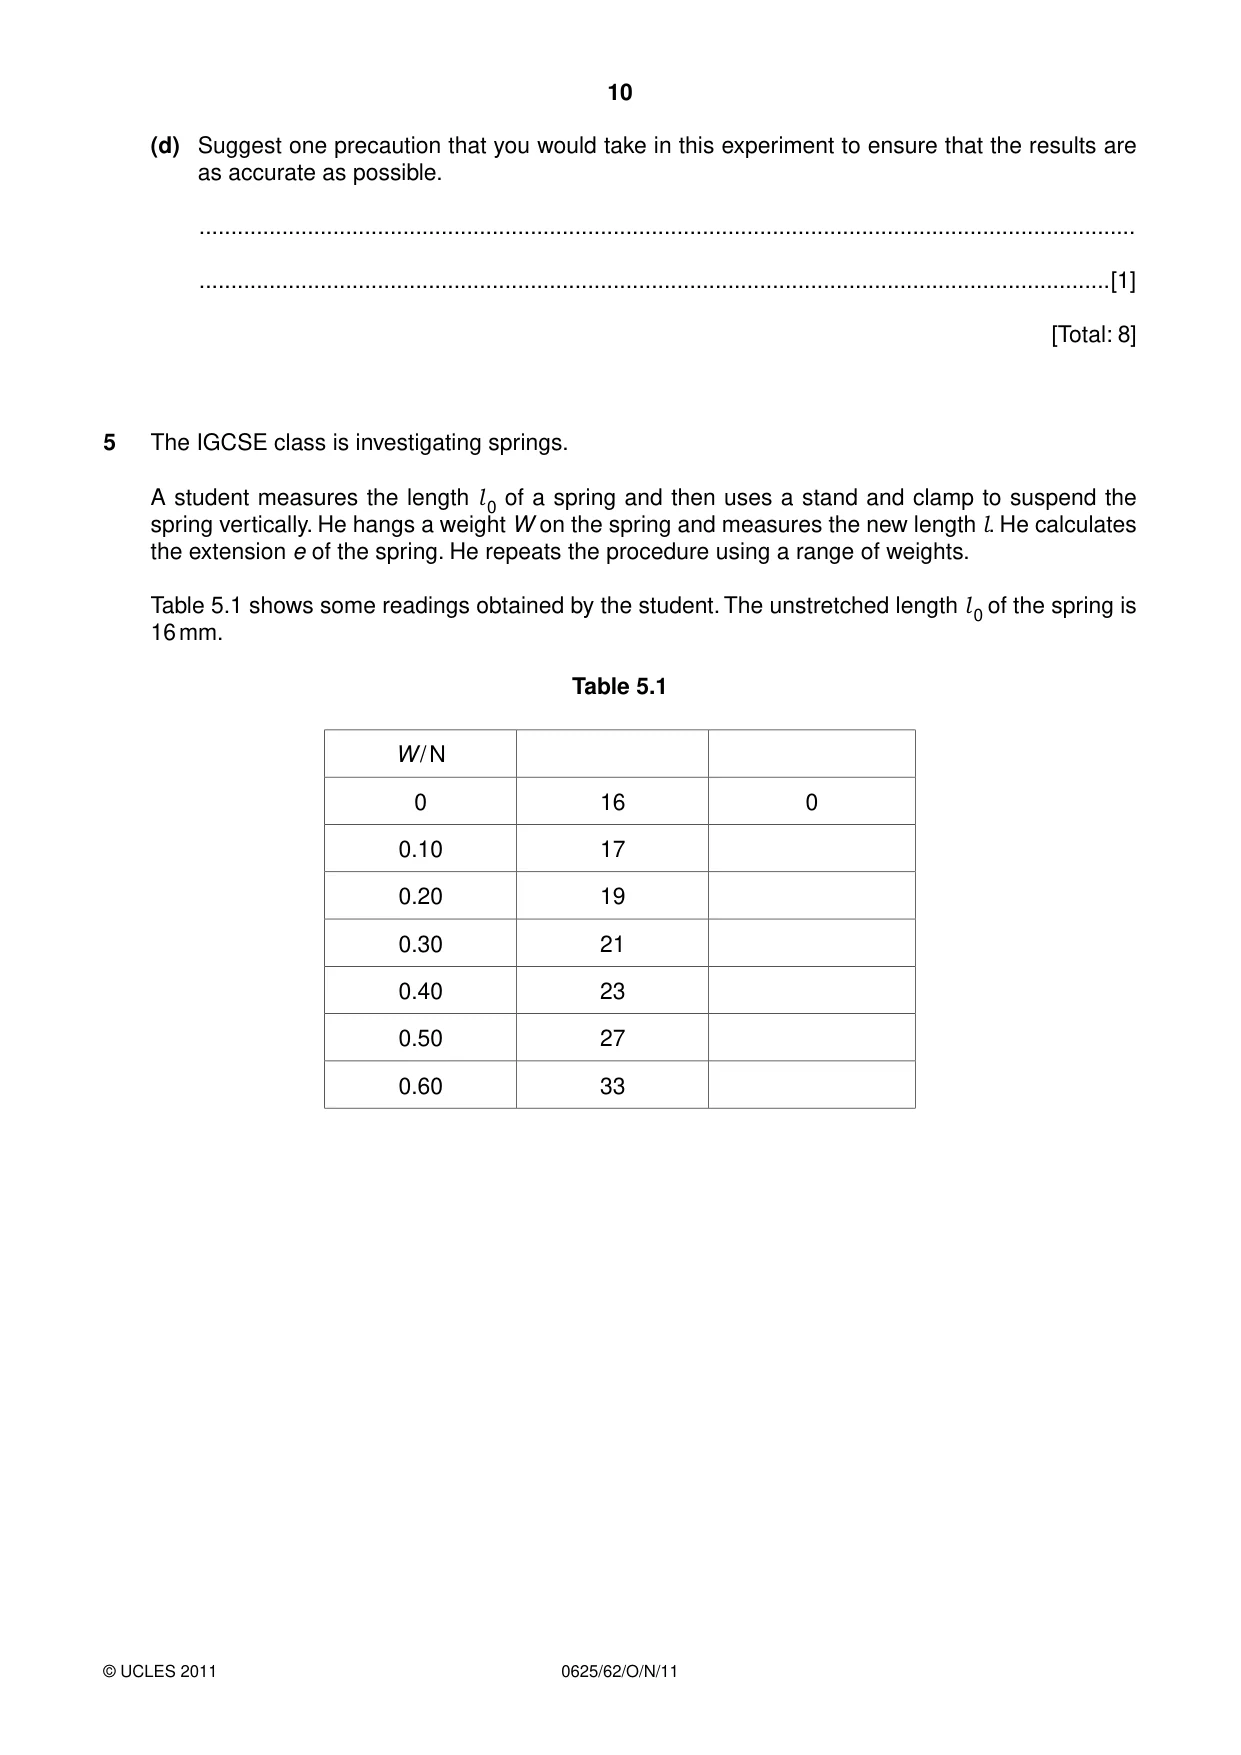
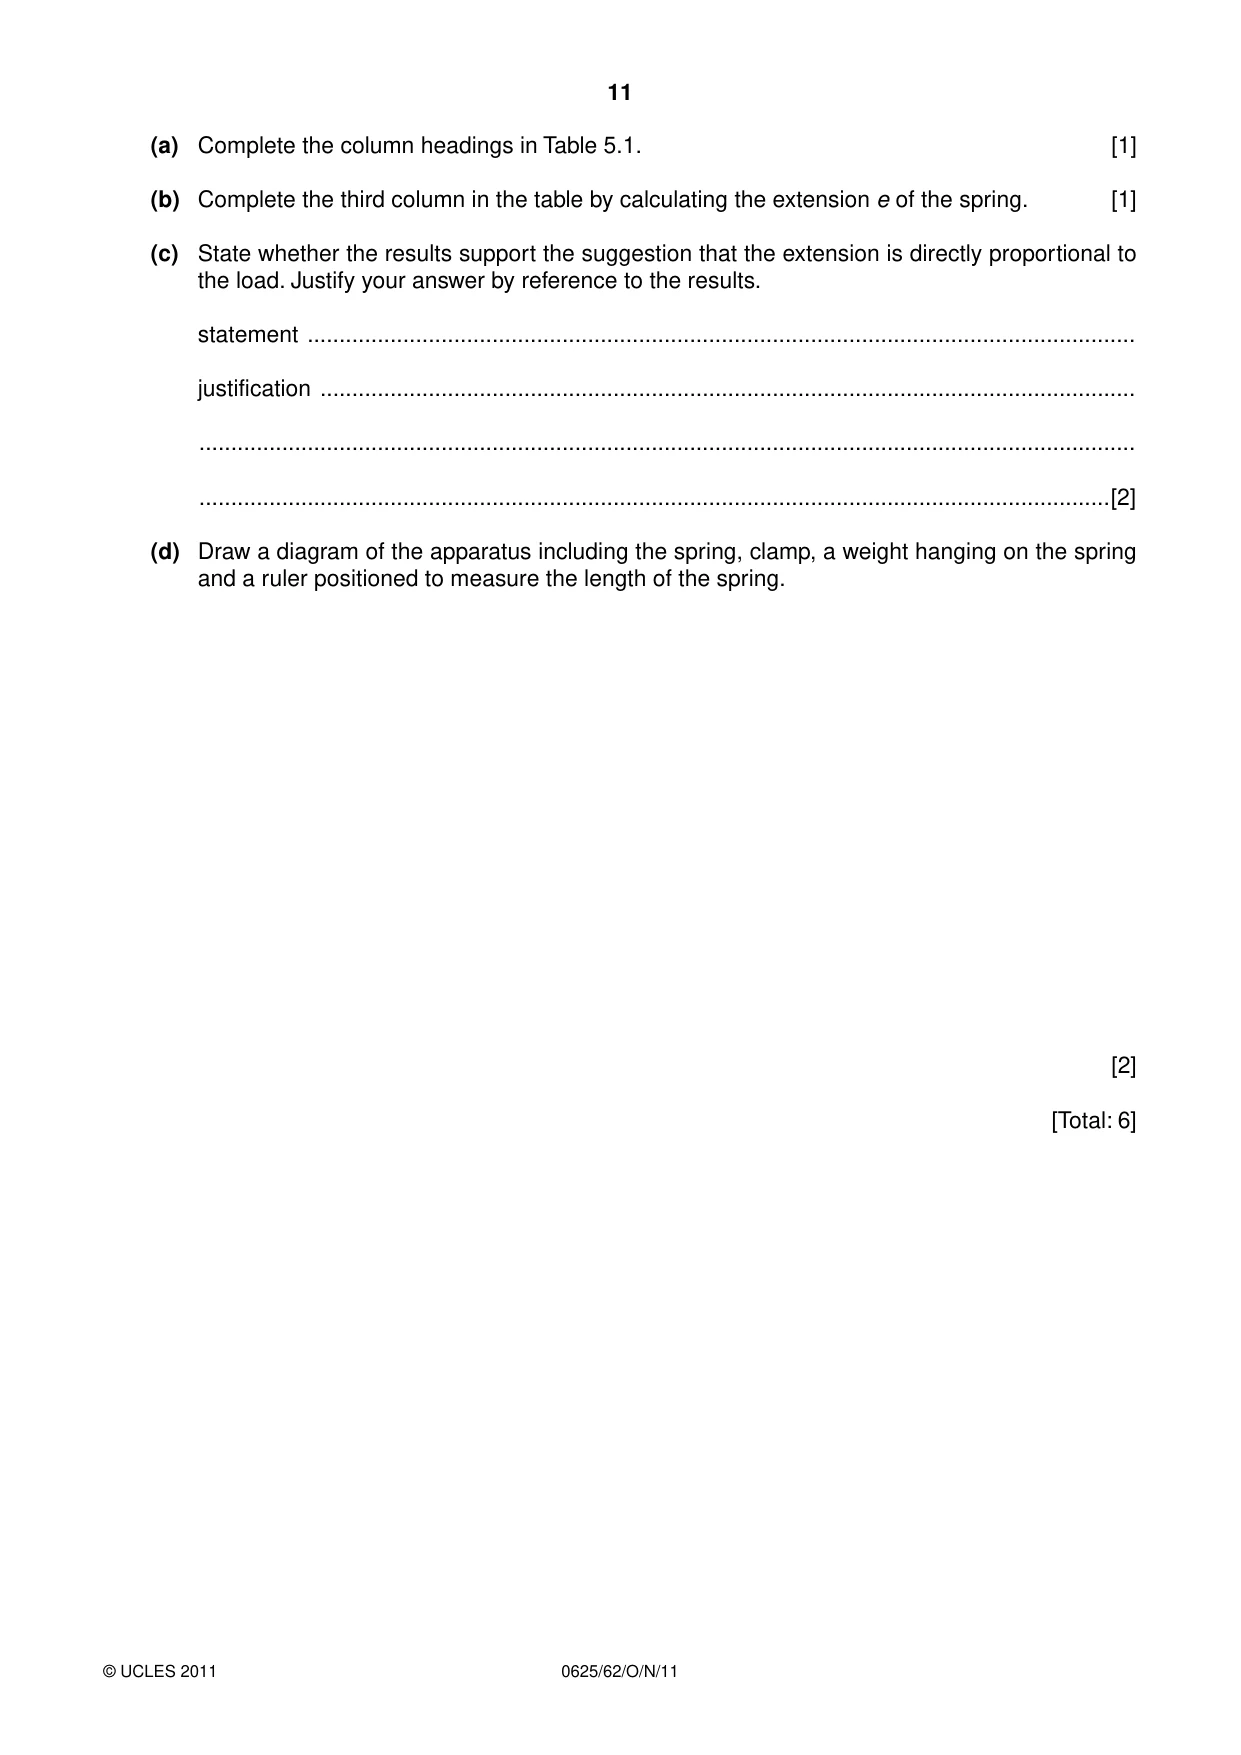
5 The IGCSE class is investigating springs. A student measures the length l of a spring and then uses a stand and clamp to suspend the 0 spring vertically. He hangs a weight W on the spring and measures the new length l. He calculates the extension e of the spring. He repeats the procedure using a range of weights. Table 5.1 shows some readings obtained by the student. The unstretched length l of the spring is 0 16 mm. Table 5.1 W / N 0 16 0 0.10 17 0.20 19 0.30 21 0.40 23 0.50 27 0.60 33 (a) Complete the column headings in Table 5.1. [1] (b) Complete the third column in the table by calculating the extension e of the spring. [1] (c) State whether the results support the suggestion that the extension is directly proportional to the load. Justify your answer by reference to the results. statement .................................................................................................................................. justification ................................................................................................................................ ................................................................................................................................................... ...............................................................................................................................................[2] (d) Draw a diagram of the apparatus including the spring, clamp, a weight hanging on the spring and a ruler positioned to measure the length of the spring. [2] [Total: 6]
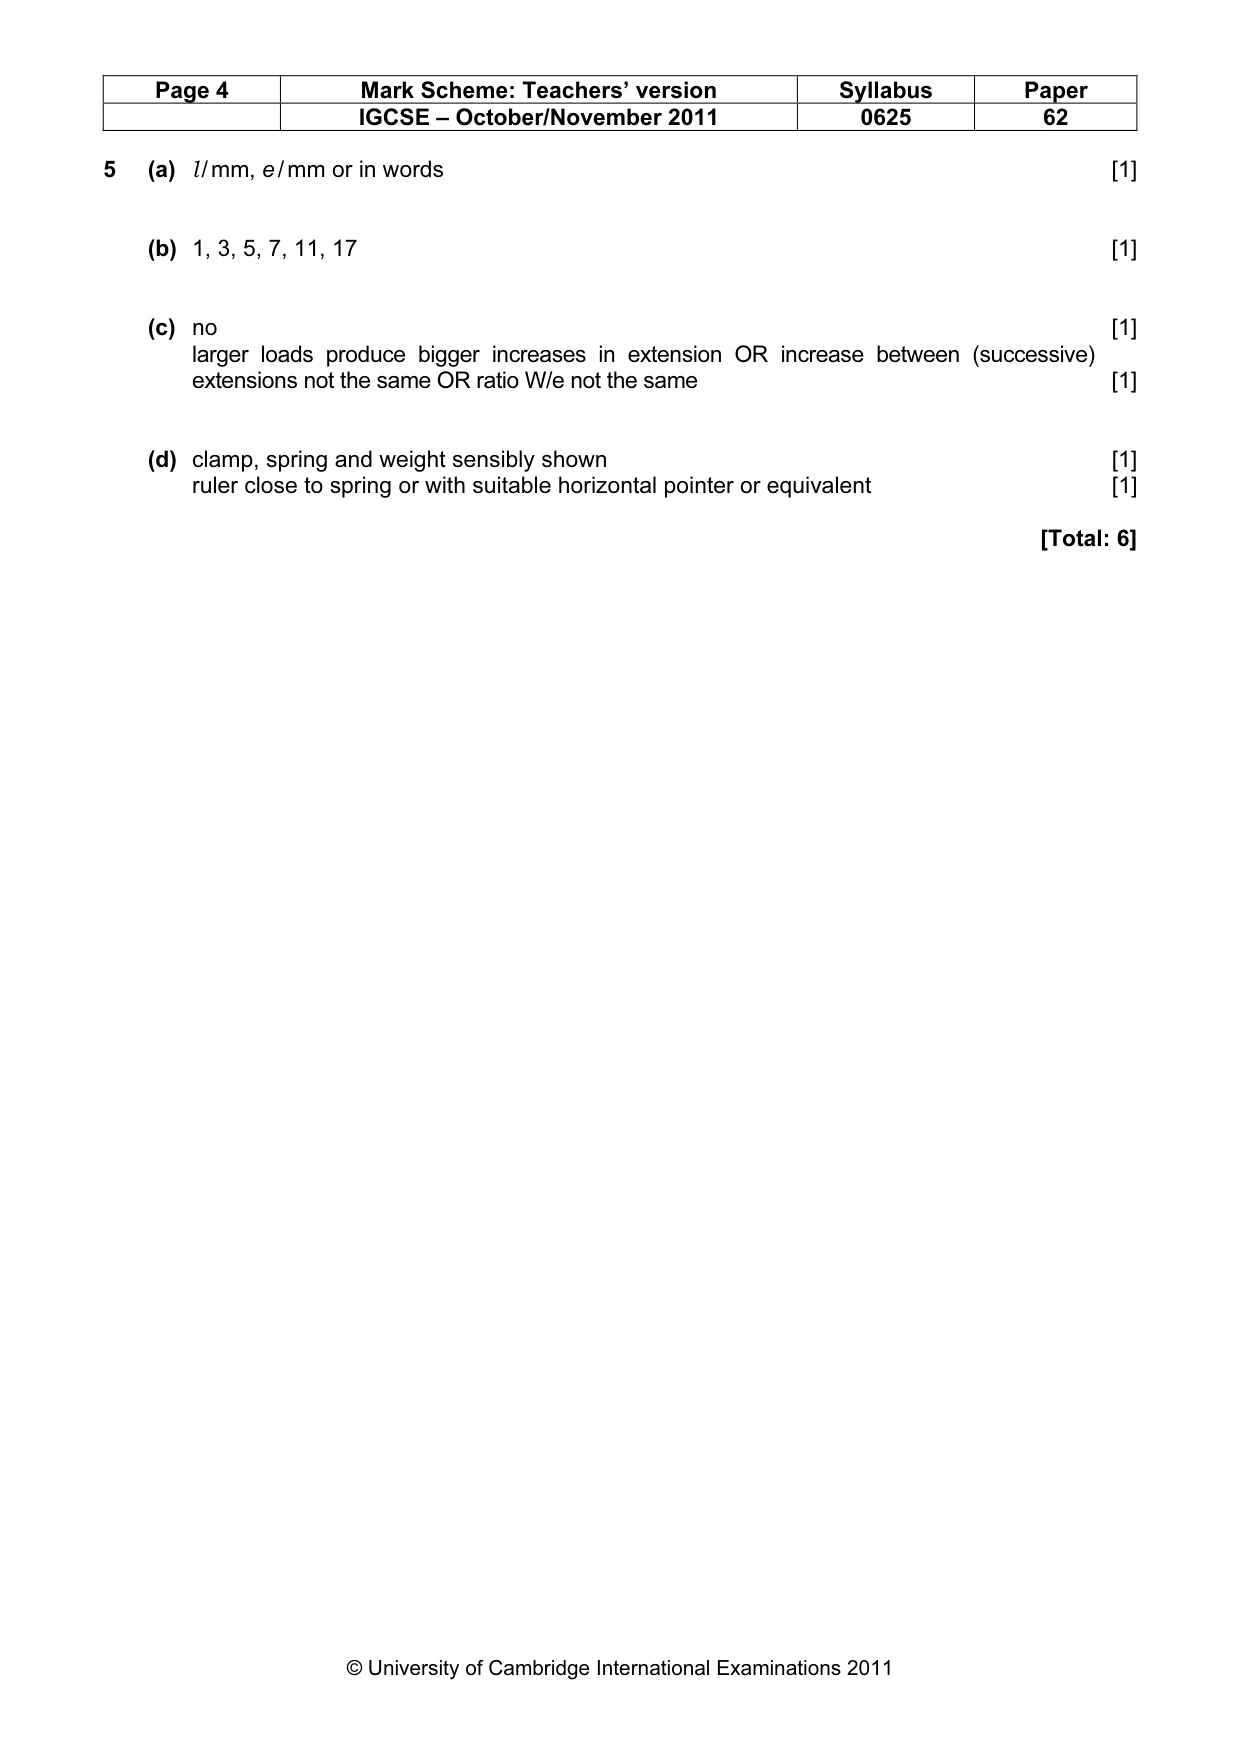
Mark scheme: 5 (a) l / mm, e / mm or in words [1] (b) 1, 3, 5, 7, 11, 17 [1] (c) no [1] larger loads produce bigger increases in extension OR increase between (successive) extensions not the same OR ratio W/e not the same [1] (d) clamp, spring and weight sensibly shown [1] ruler close to spring or with suitable horizontal pointer or equivalent [1] [Total: 6]
More questions on Physical quantities and measurement techniques
What was in this paper
The subtopics covered by these 5 questions, and how many questions each got. Open one in a new tab to see every Cambridge question on it.
What you needed in this session
Cambridge’s own grade thresholds for 2011 Oct/Nov, Paper 6 · Variant 2. A higher threshold means an easier paper — the bar moves with how the cohort did.