Cambridge IGCSE Physics 0625 — 2010 Oct/Nov Paper 6 · Variant 3
0625/63/O/N/10 · 5 questions · 40 marks · ≈45 min
The question paper and its mark scheme, free to read here and free to download. This is Cambridge’s own paper, exactly as it was sat.
Question paper12 pages
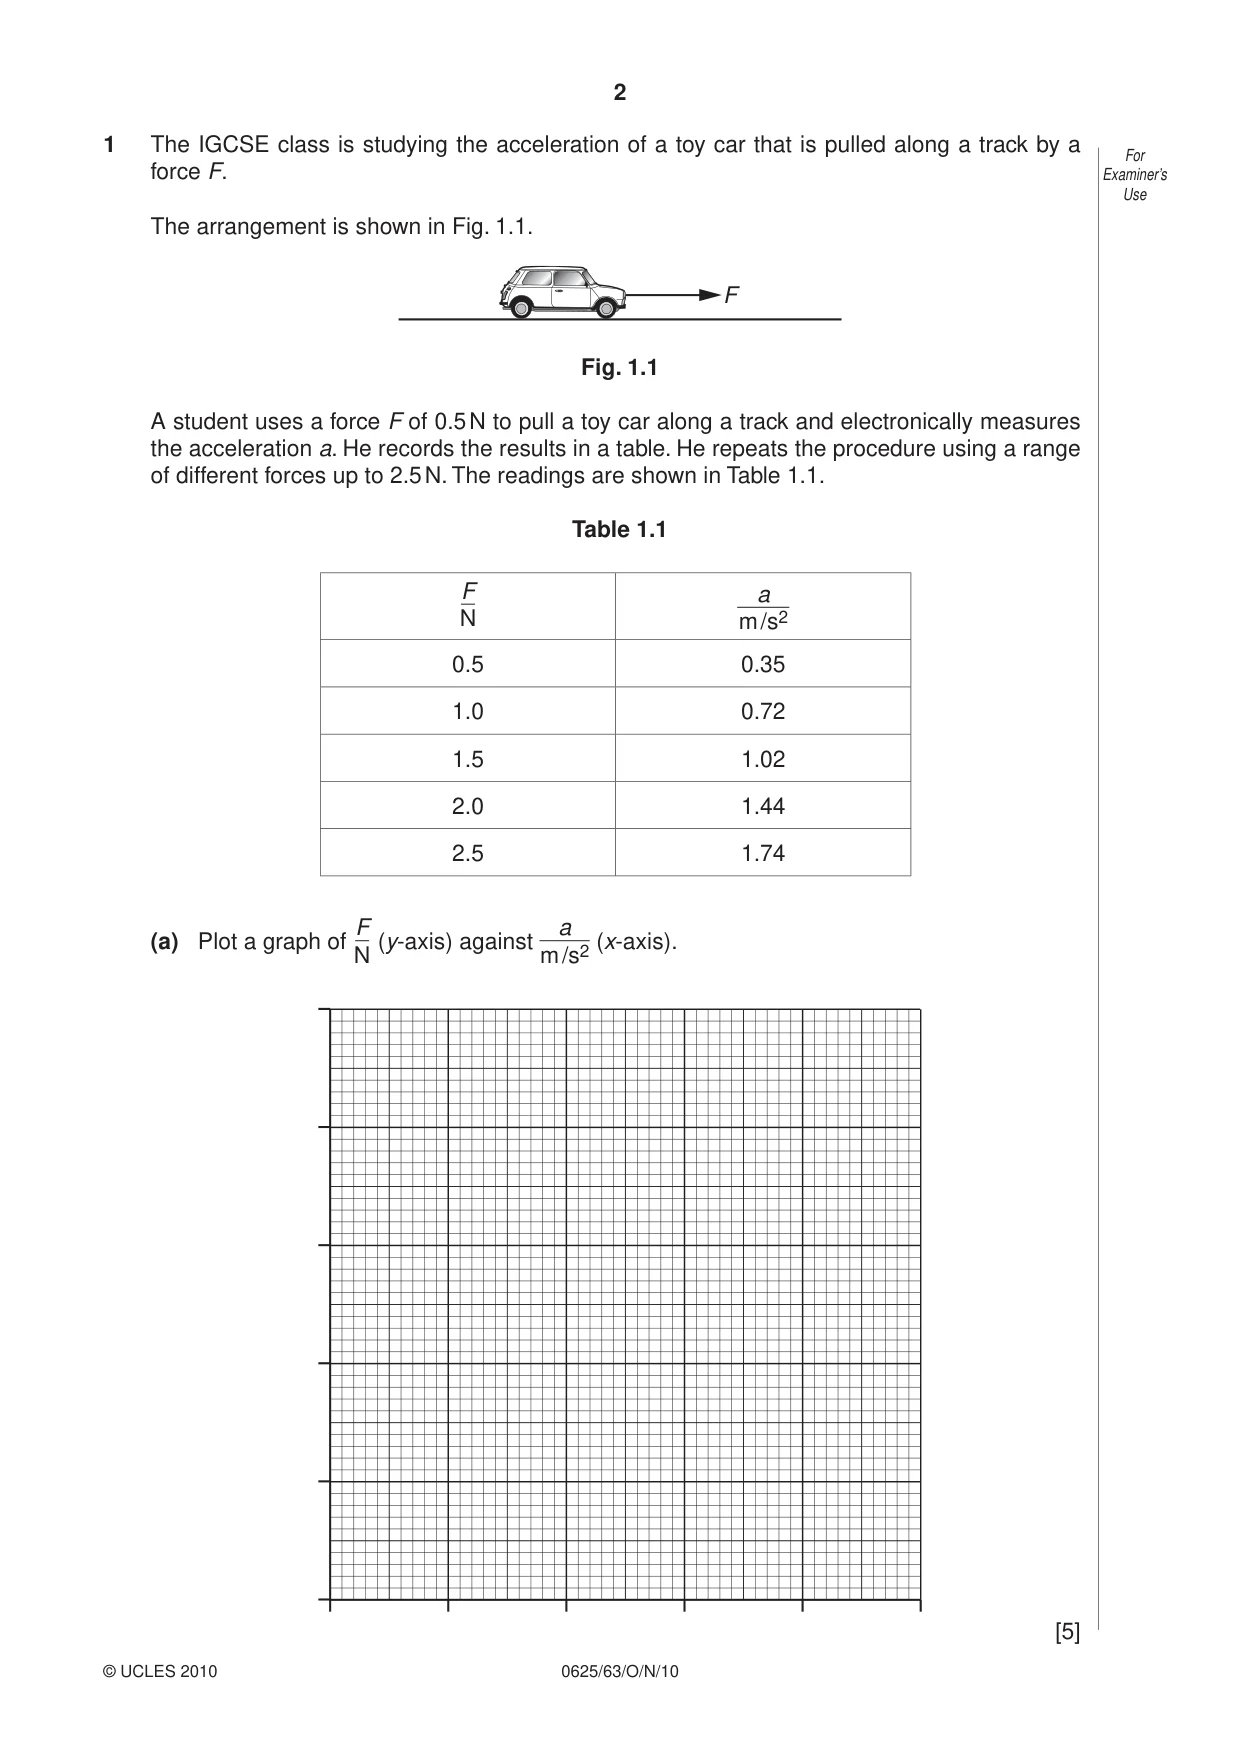
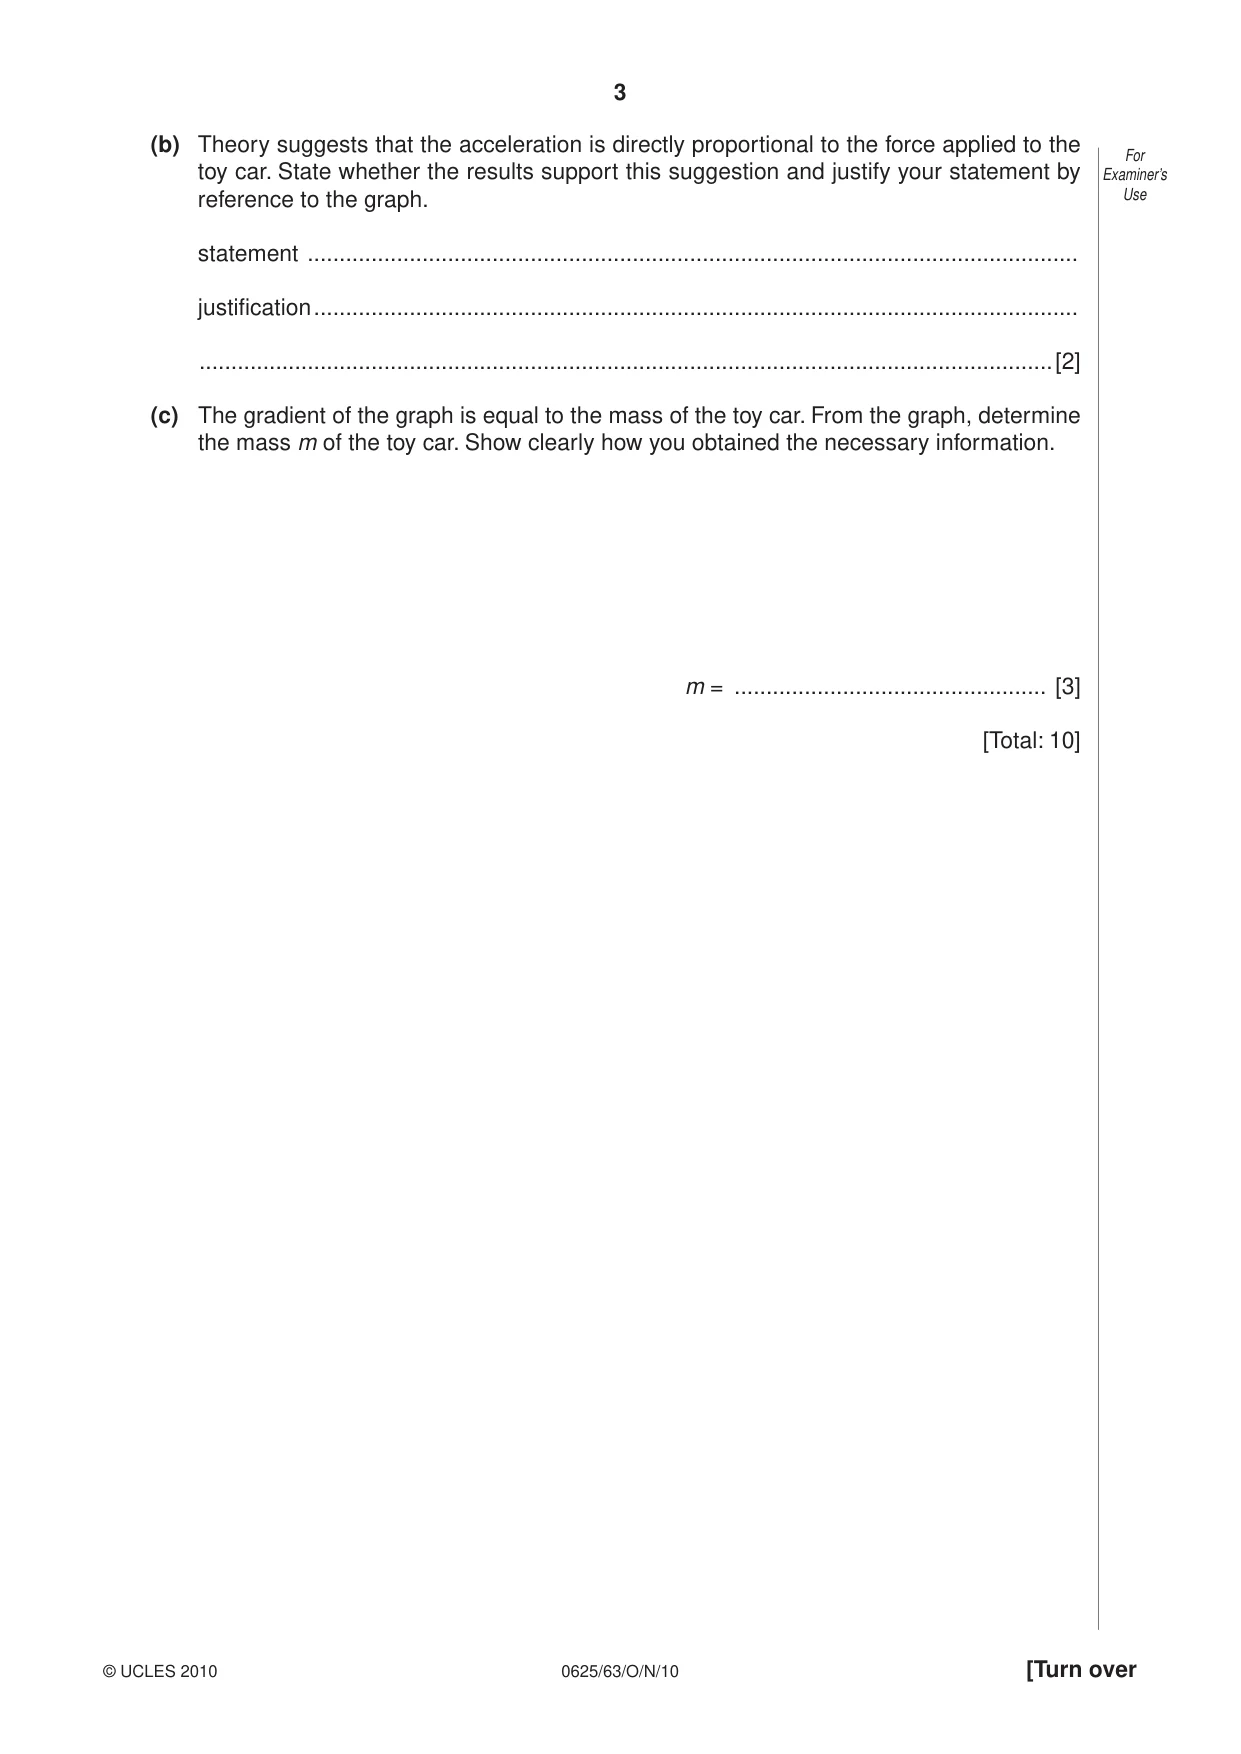
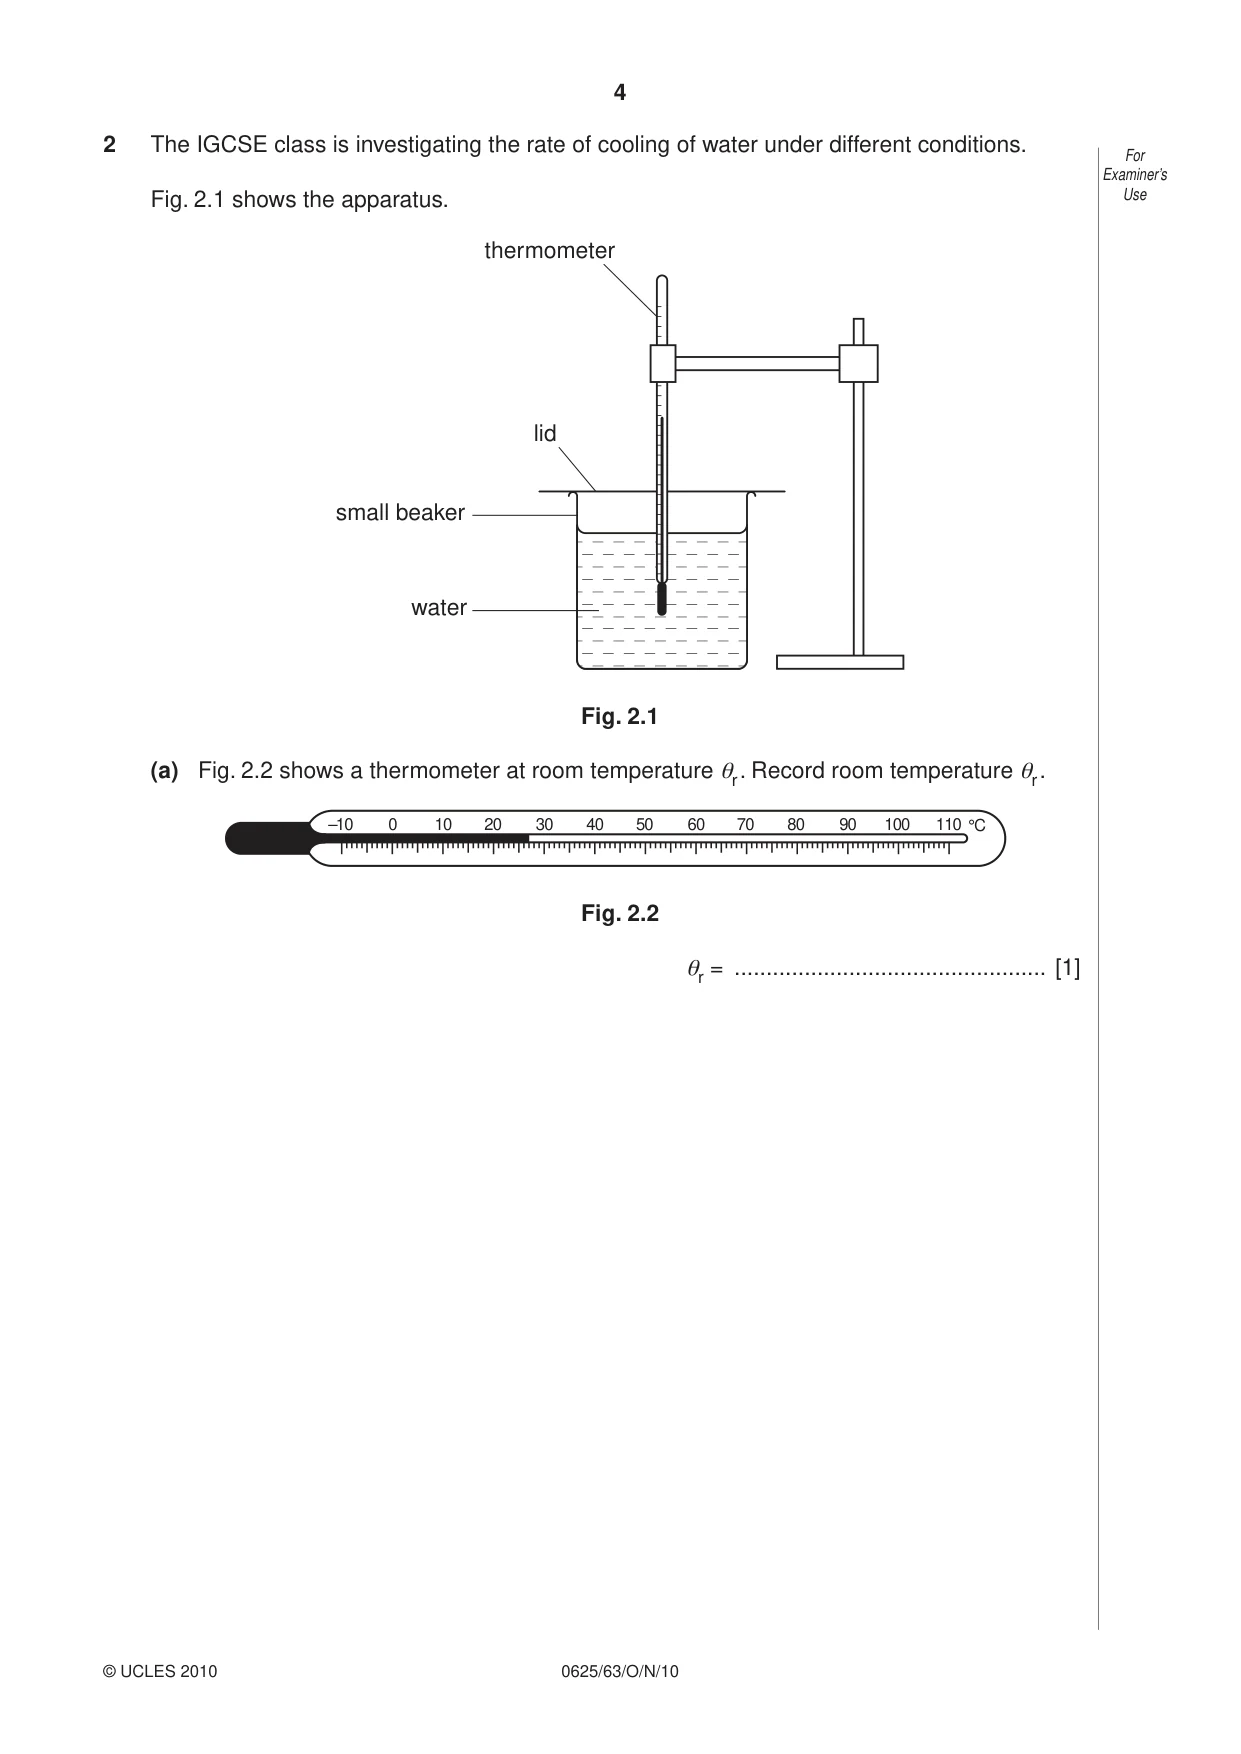

Mark scheme3 pages
Answers below. Sit the paper first if you are practising.
Questions as text
Q1 · The IGCSE class is studying the acceleration of a toy car that is pulled along a track by…
1 The IGCSE class is studying the acceleration of a toy car that is pulled along a track by a For force F. Examiner’s Use The arrangement is shown in Fig. 1.1. F Fig. 1.1 A student uses a force F of 0.5 N to pull a toy car along a track and electronically measures the acceleration a. He records the results in a table. He repeats the procedure using a range of different forces up to 2.5 N. The readings are shown in Table 1.1. Table 1.1 F a N m /s2 0.5 0.35 1.0 0.72 1.5 1.02 2.0 1.44 2.5 1.74 F a (a) Plot a graph of (y-axis) against (x-axis). N m /s2 [5] (b) Theory suggests that the acceleration is directly proportional to the force applied to the For toy car. State whether the results support this suggestion and justify your statement by Examiner’s reference to the graph. Use statement ......................................................................................................................... justification ........................................................................................................................ ......................................................................................................................................[2] (c) The gradient of the graph is equal to the mass of the toy car. From the graph, determine the mass m of the toy car. Show clearly how you obtained the necessary information. m = ................................................. [3] [Total: 10]
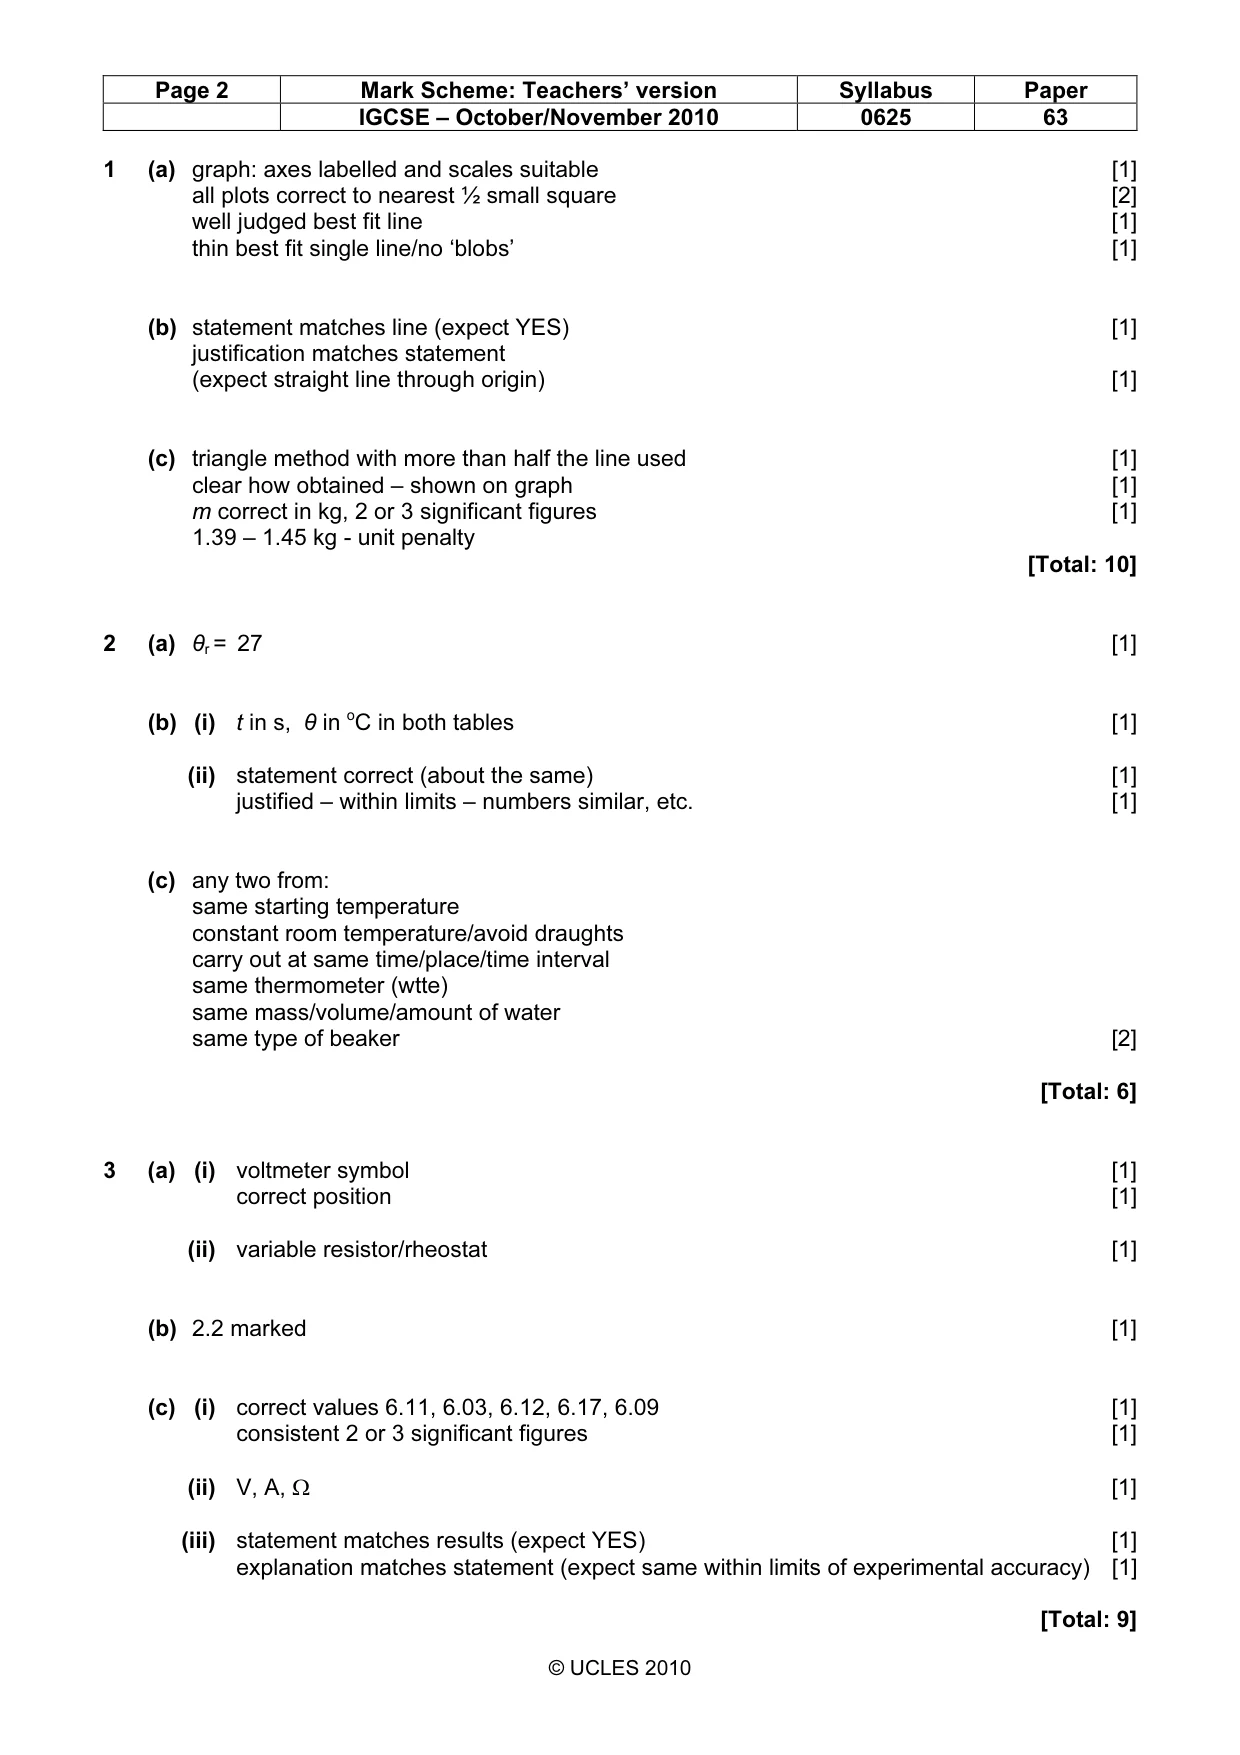
Mark scheme: 1 (a) graph: axes labelled and scales suitable [1] all plots correct to nearest ½ small square [2] well judged best fit line [1] thin best fit single line/no ‘blobs’ [1] (b) statement matches line (expect YES) [1] justification matches statement (expect straight line through origin) [1] (c) triangle method with more than half the line used [1] clear how obtained – shown on graph [1] m correct in kg, 2 or 3 significant figures [1] 1.39 – 1.45 kg - unit penalty [Total: 10]
Q2 · The IGCSE class is investigating the rate of cooling of water under different conditions
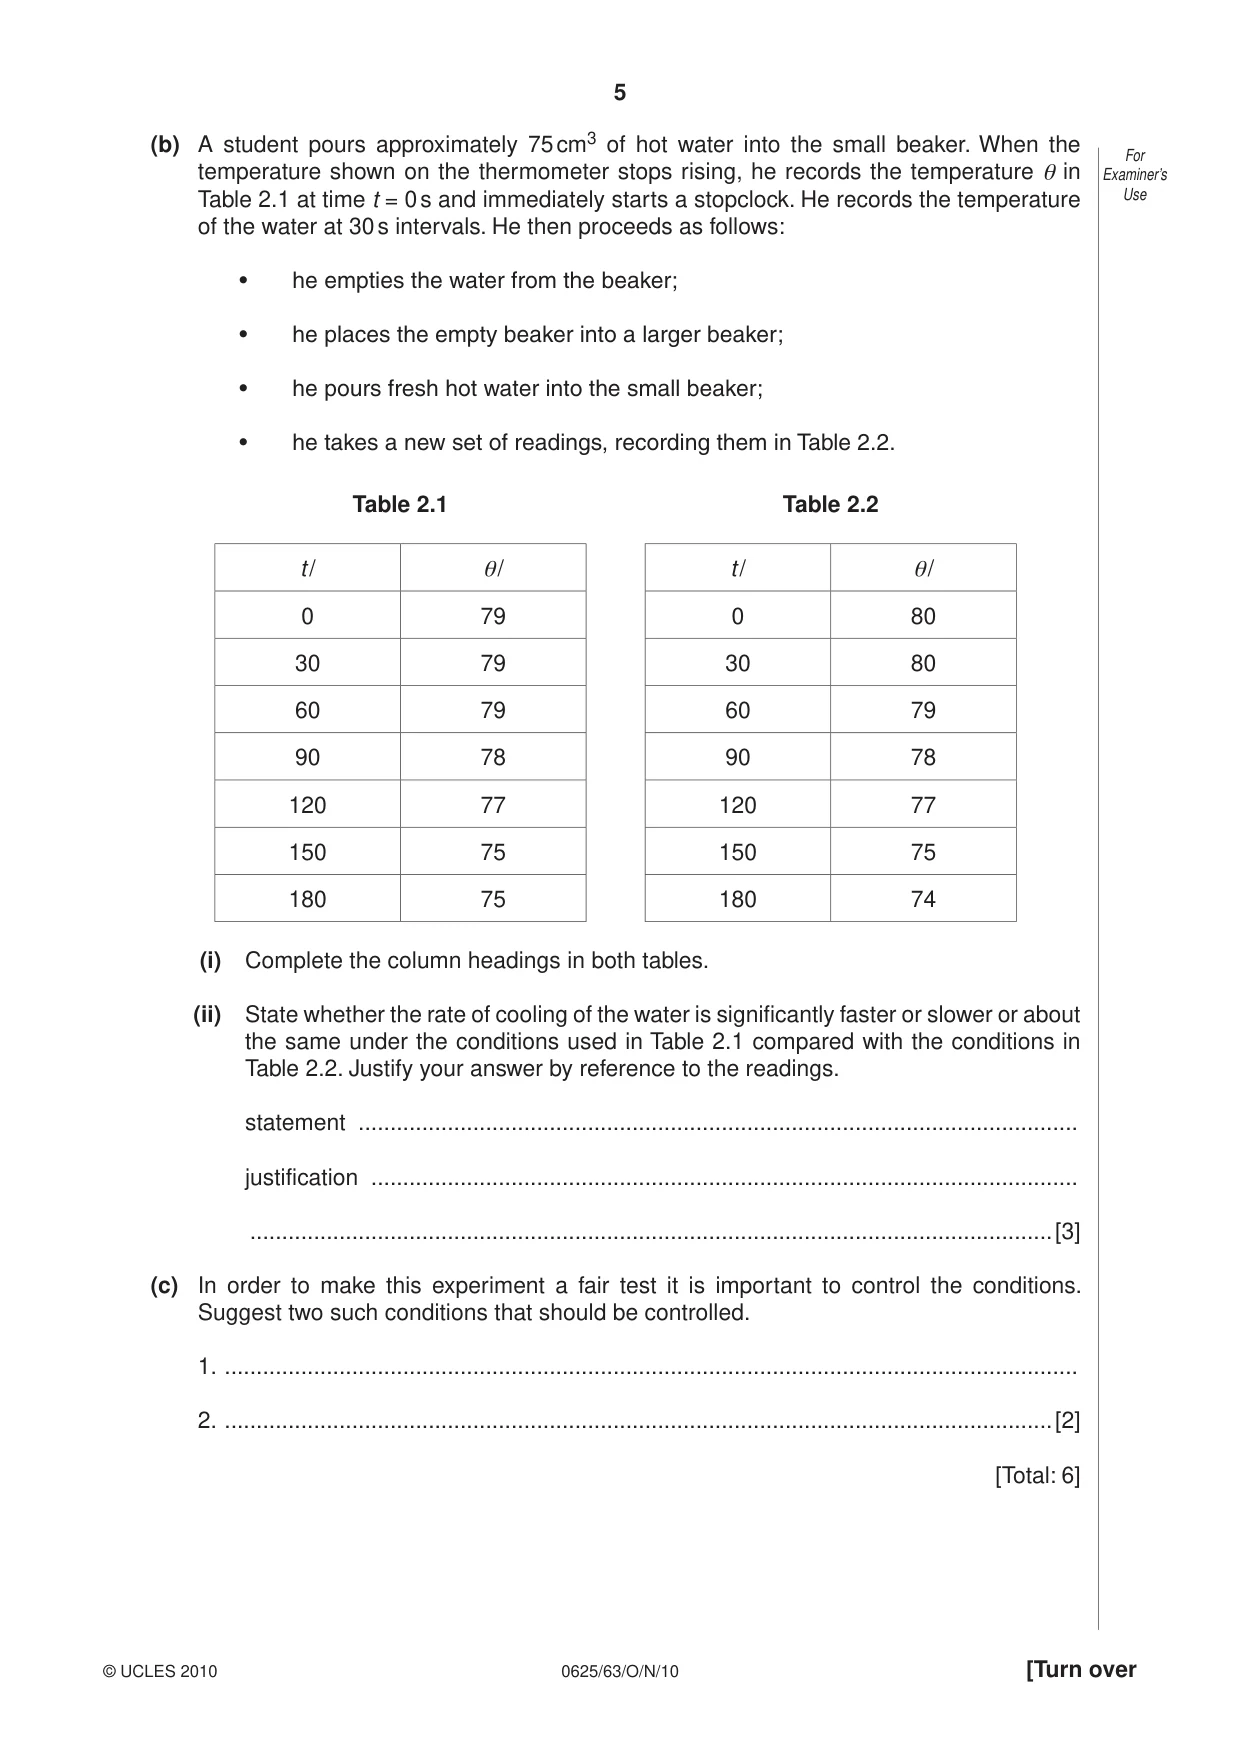
2 The IGCSE class is investigating the rate of cooling of water under different conditions. For Examiner’s Fig. 2.1 shows the apparatus. Use thermometer lid small beaker water Fig. 2.1 (a) Fig. 2.2 shows a thermometer at room temperature θr . Record room temperature θr . –10 0 10 20 30 40 50 60 70 80 90 100 110 °C Fig. 2.2 θr = ................................................. [1] (b) A student pours approximately 75 cm3 of hot water into the small beaker. When the For temperature shown on the thermometer stops rising, he records the temperature θ in Examiner’s Table 2.1 at time t = 0 s and immediately starts a stopclock. He records the temperature Use of the water at 30 s intervals. He then proceeds as follows: • he empties the water from the beaker; • he places the empty beaker into a larger beaker; • he pours fresh hot water into the small beaker; • he takes a new set of readings, recording them in Table 2.2. Table 2.1 Table 2.2 t / θ/ t / θ/ 0 79 0 80 30 79 30 80 60 79 60 79 90 78 90 78 120 77 120 77 150 75 150 75 180 75 180 74 (i) Complete the column headings in both tables. (ii) State whether the rate of cooling of the water is significantly faster or slower or about the same under the conditions used in Table 2.1 compared with the conditions in Table 2.2. Justify your answer by reference to the readings. statement ................................................................................................................. justification ............................................................................................................... ..............................................................................................................................[3] (c) In order to make this experiment a fair test it is important to control the conditions. Suggest two such conditions that should be controlled. 1. ...................................................................................................................................... 2. ..................................................................................................................................[2] [Total: 6]
Mark scheme: 2 (a) θr = 27 [1] (b) (i) t in s, θ in oC in both tables [1] (ii) statement correct (about the same) [1] justified – within limits – numbers similar, etc. [1] (c) any two from: same starting temperature constant room temperature/avoid draughts carry out at same time/place/time interval same thermometer (wtte) same mass/volume/amount of water same type of beaker [2] [Total: 6]
Q3 · The IGCSE class is investigating resistance in an electrical circuit
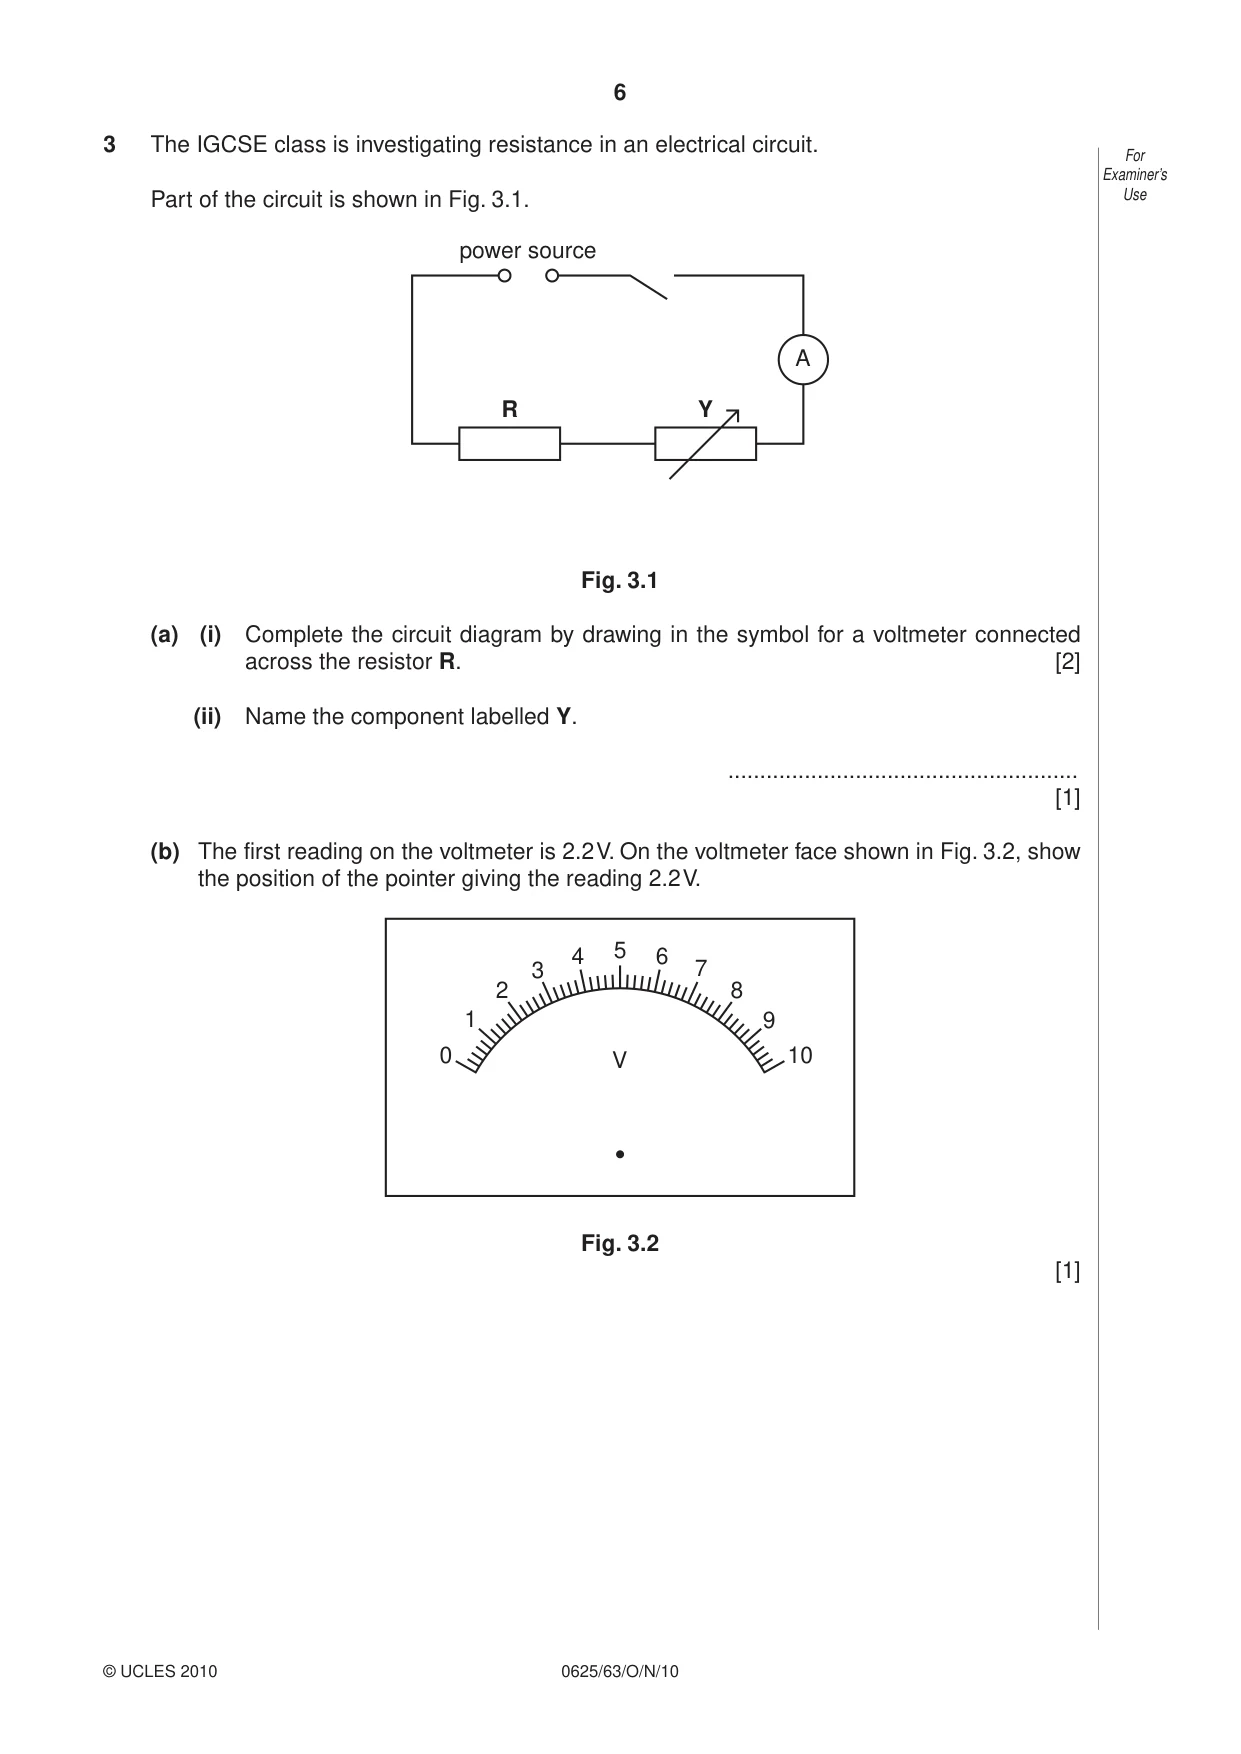
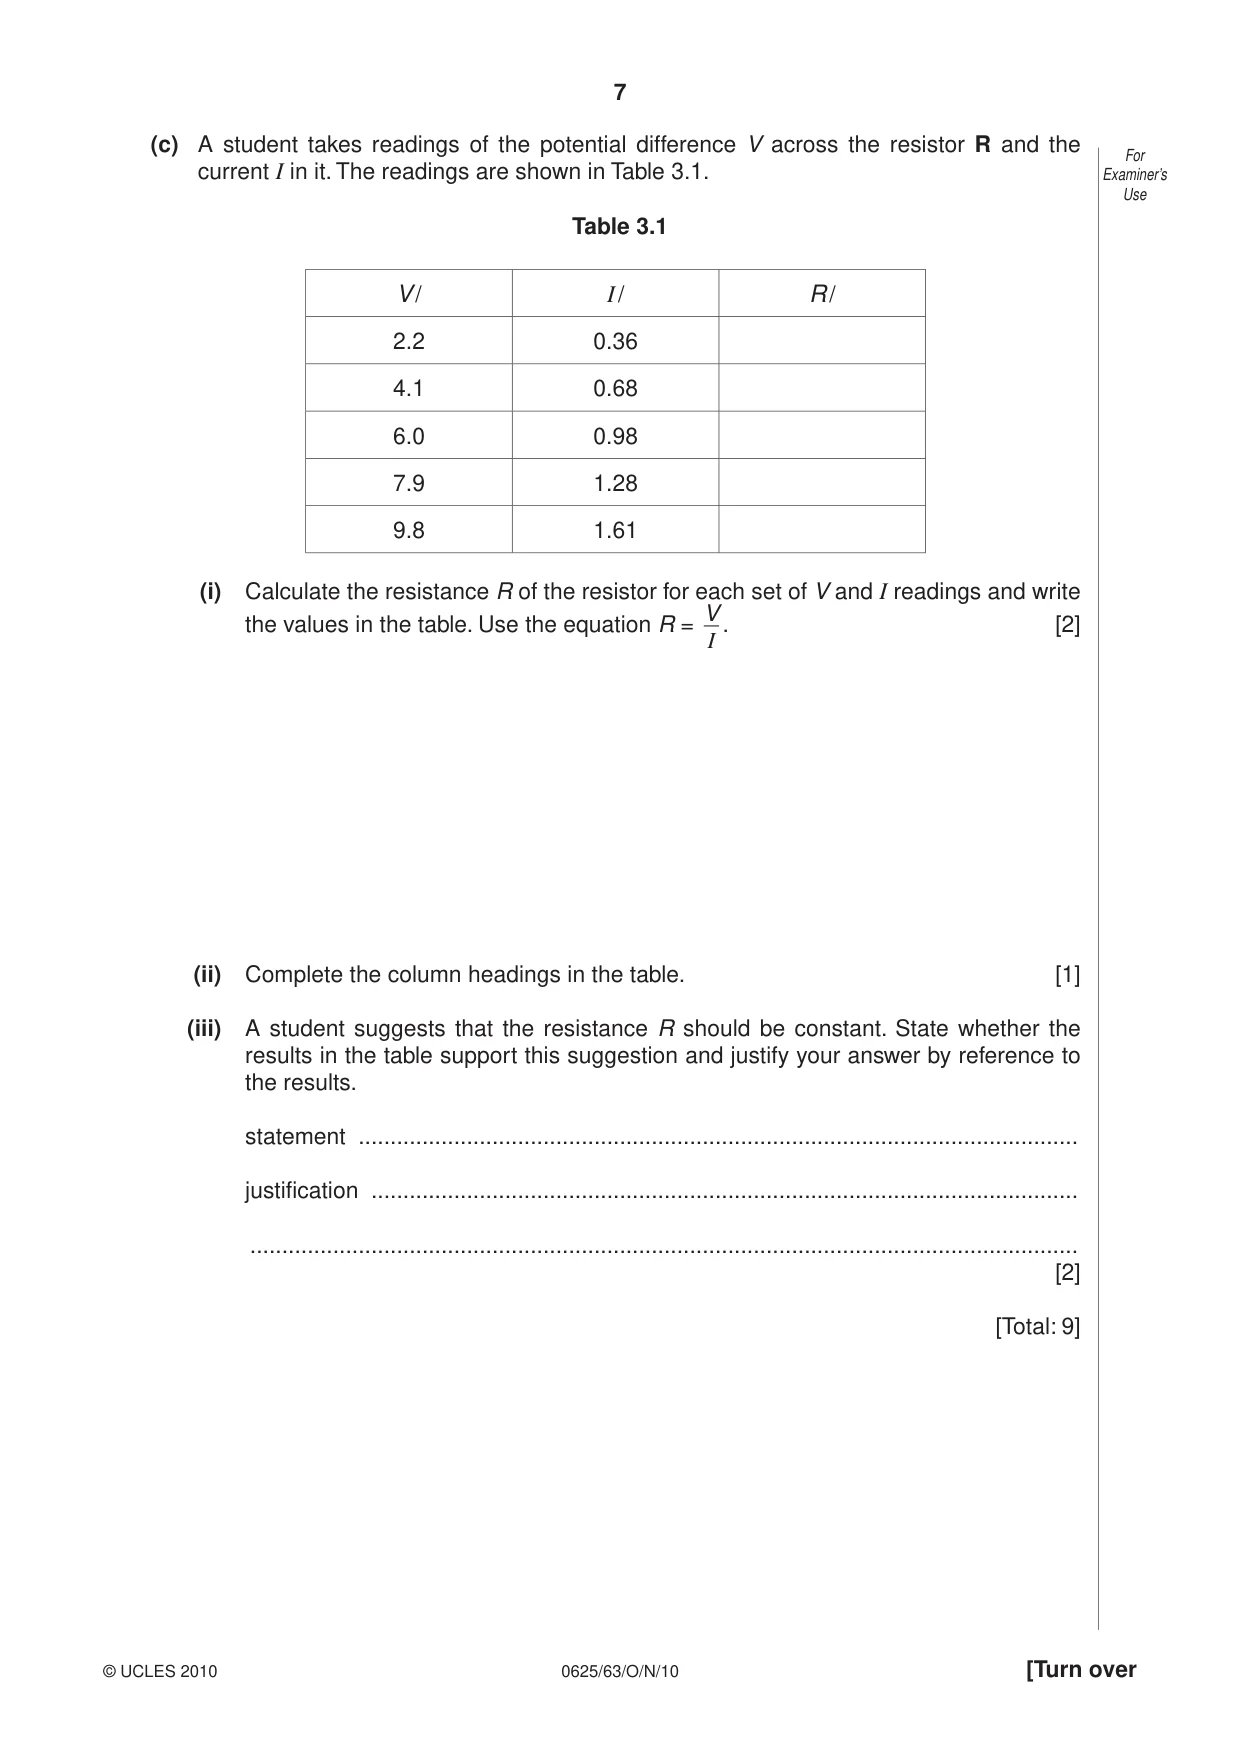
3 The IGCSE class is investigating resistance in an electrical circuit. For Examiner’s Part of the circuit is shown in Fig. 3.1. Use power source A R Y Fig. 3.1 (a) (i) Complete the circuit diagram by drawing in the symbol for a voltmeter connected across the resistor R. [2] (ii) Name the component labelled Y. ....................................................... [1] (b) The first reading on the voltmeter is 2.2 V. On the voltmeter face shown in Fig. 3.2, show the position of the pointer giving the reading 2.2 V. 4 5 6 3 7 2 8 1 9 0 V 10 Fig. 3.2 [1] (c) A student takes readings of the potential difference V across the resistor R and the For current I in it. The readings are shown in Table 3.1. Examiner’s Use Table 3.1 V / I / R / 2.2 0.36 4.1 0.68 6.0 0.98 7.9 1.28 9.8 1.61 (i) Calculate the resistance R of the resistor for each set of V and I readings and write V the values in the table. Use the equation R = . [2] I (ii) Complete the column headings in the table. [1] (iii) A student suggests that the resistance R should be constant. State whether the results in the table support this suggestion and justify your answer by reference to the results. statement ................................................................................................................. justification ............................................................................................................... .................................................................................................................................. [2] [Total: 9]
Mark scheme: 3 (a) (i) voltmeter symbol [1] correct position [1] (ii) variable resistor/rheostat [1] (b) 2.2 marked [1] (c) (i) correct values 6.11, 6.03, 6.12, 6.17, 6.09 [1] consistent 2 or 3 significant figures [1] (ii) V, A, Ω [1] (iii) statement matches results (expect YES) [1] explanation matches statement (expect same within limits of experimental accuracy) [1] [Total: 9] IGCSE – October/November 2010 0625 63
Q4 · The IGCSE class is investigating shadows formed on a screen
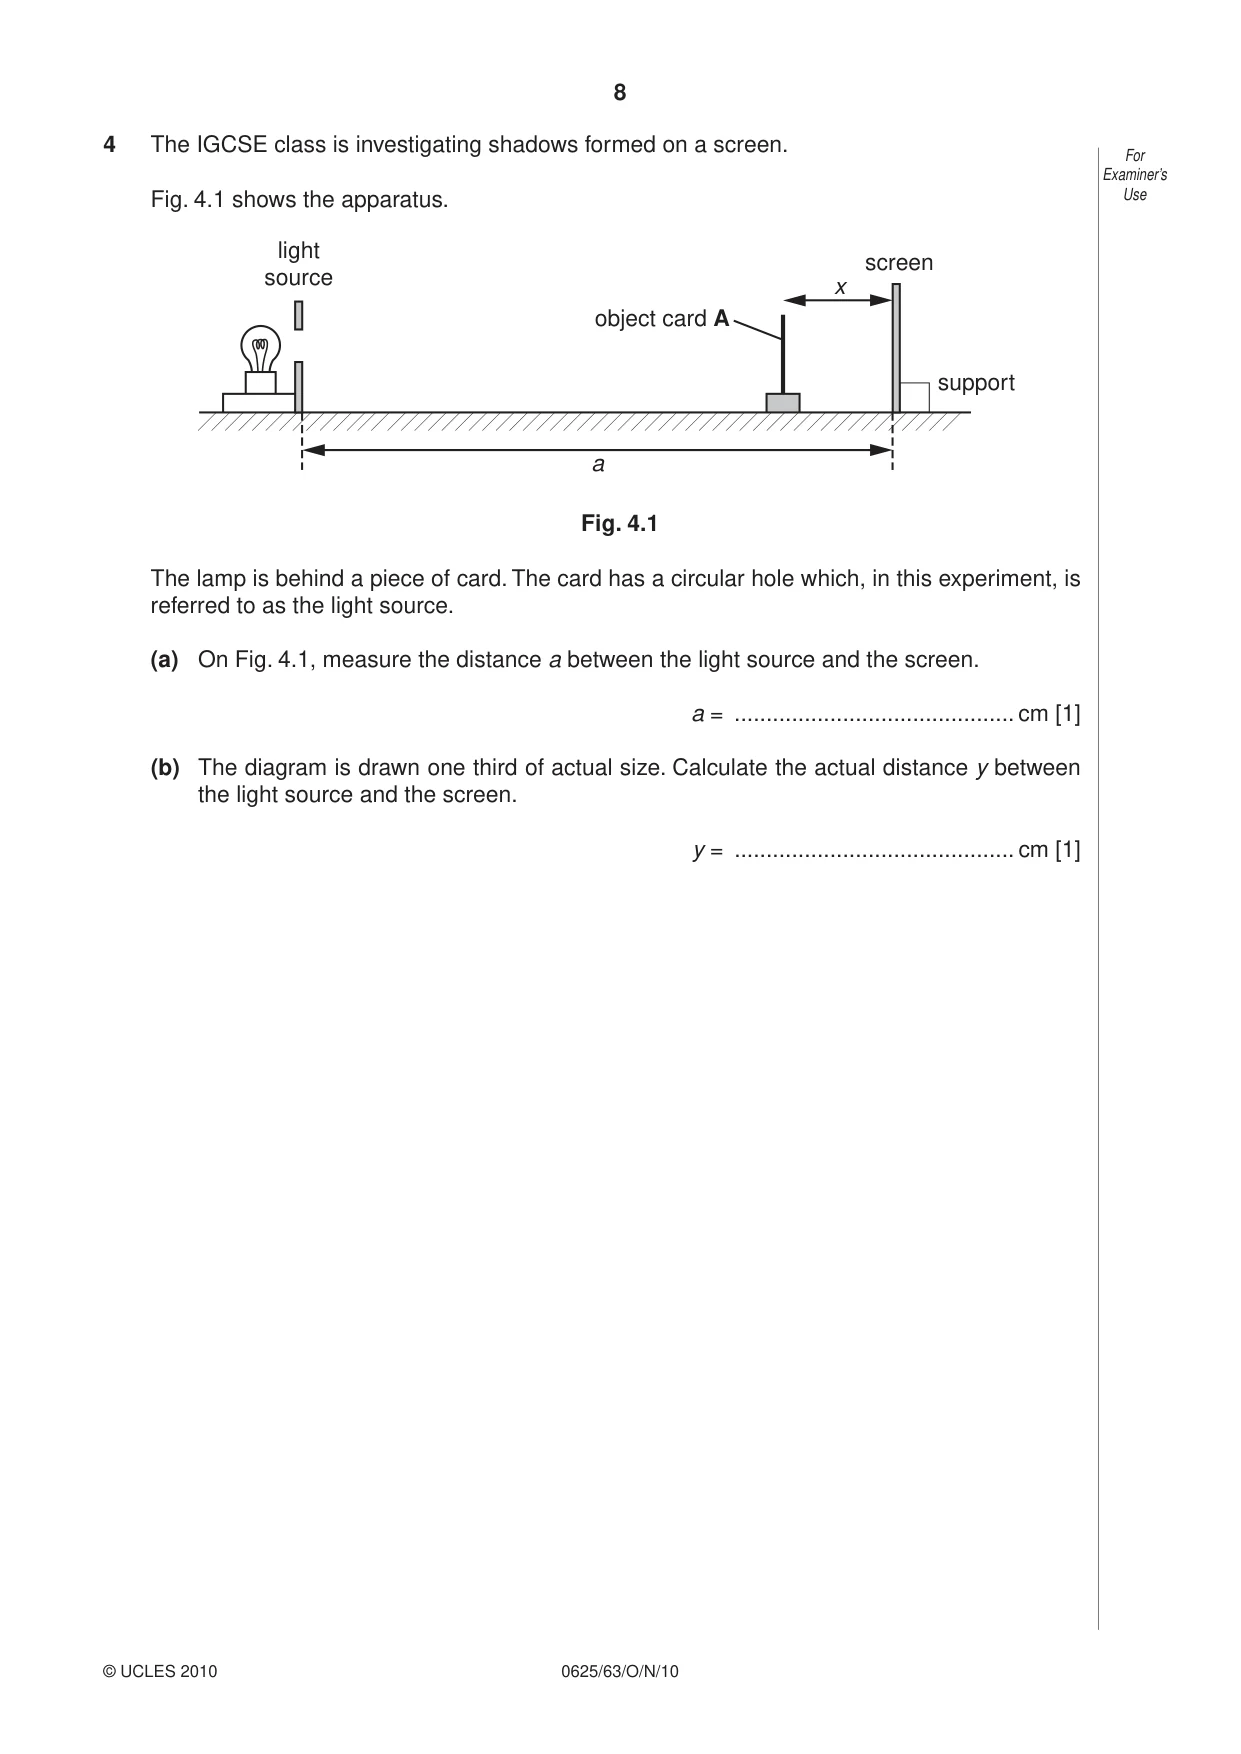
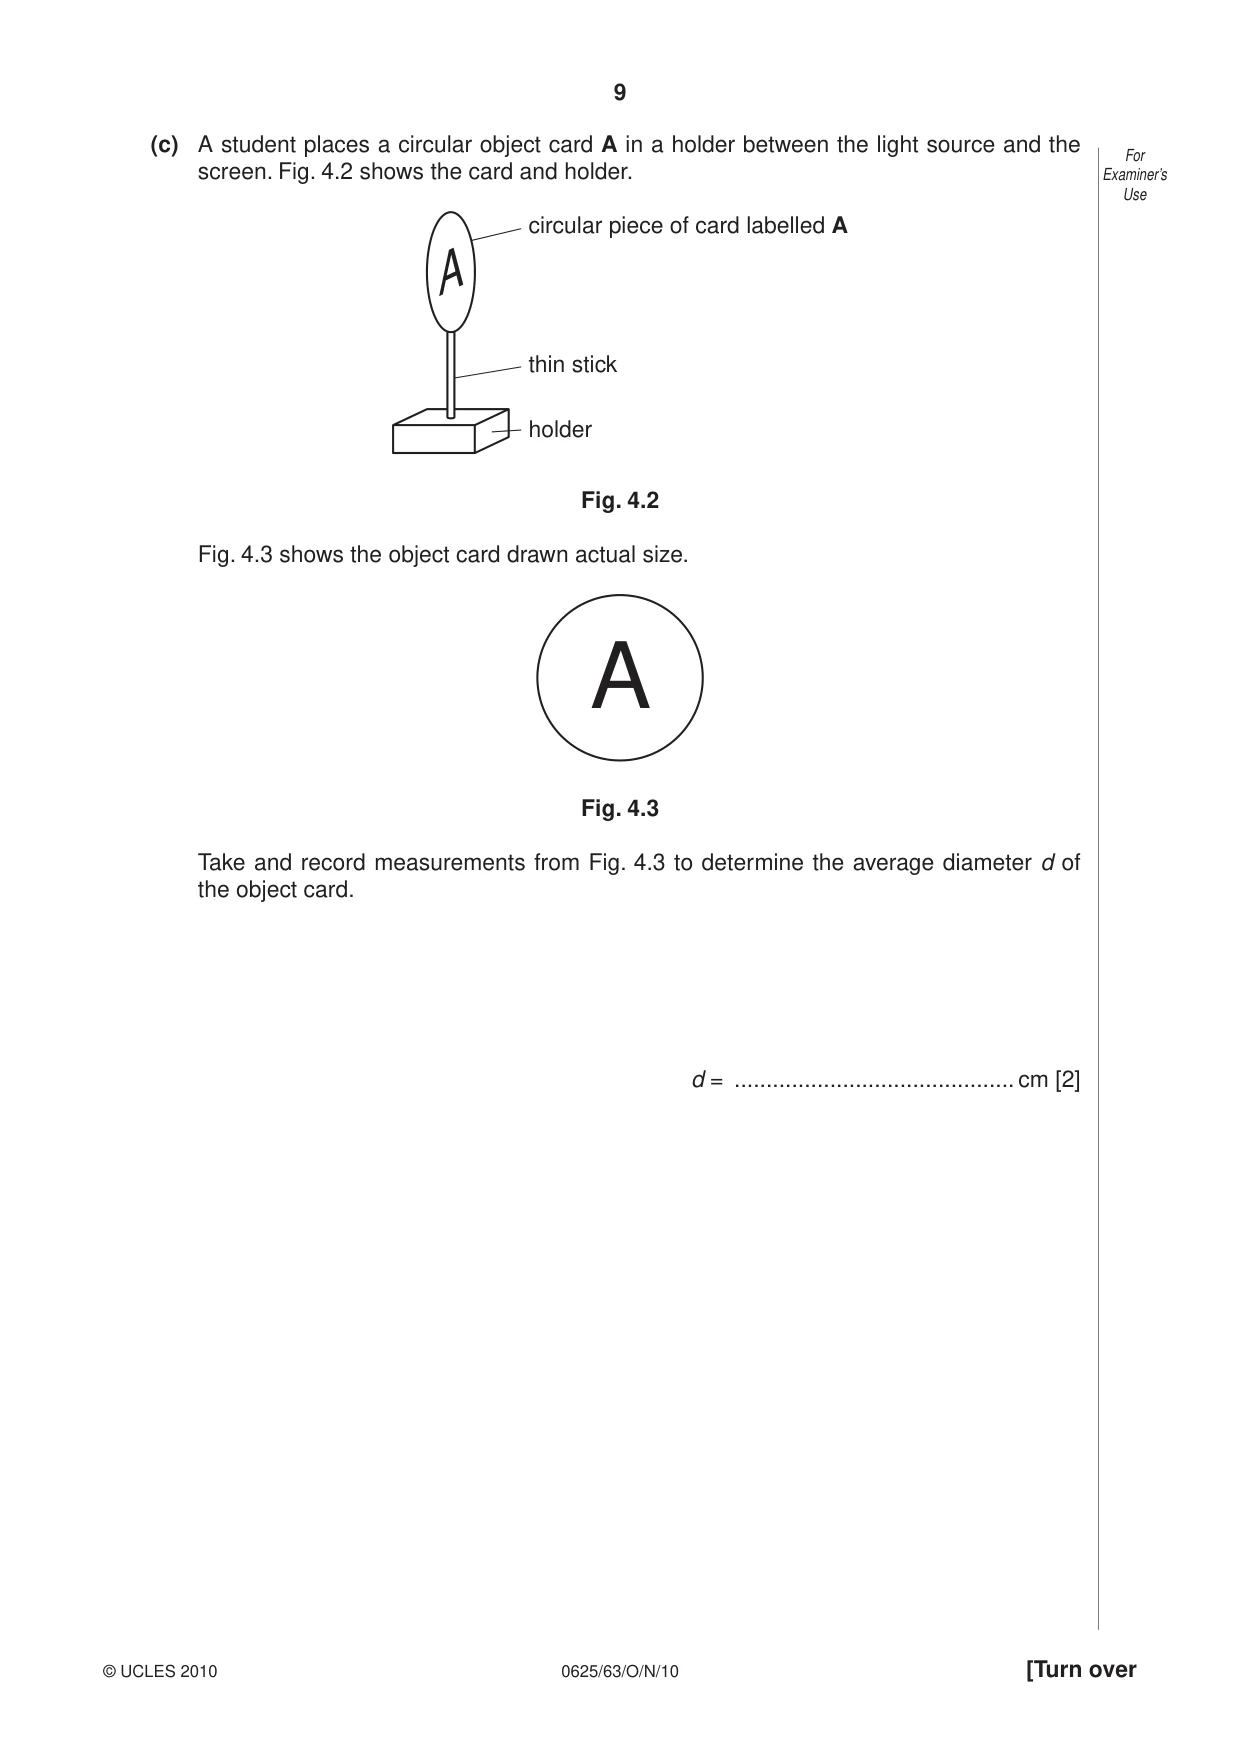
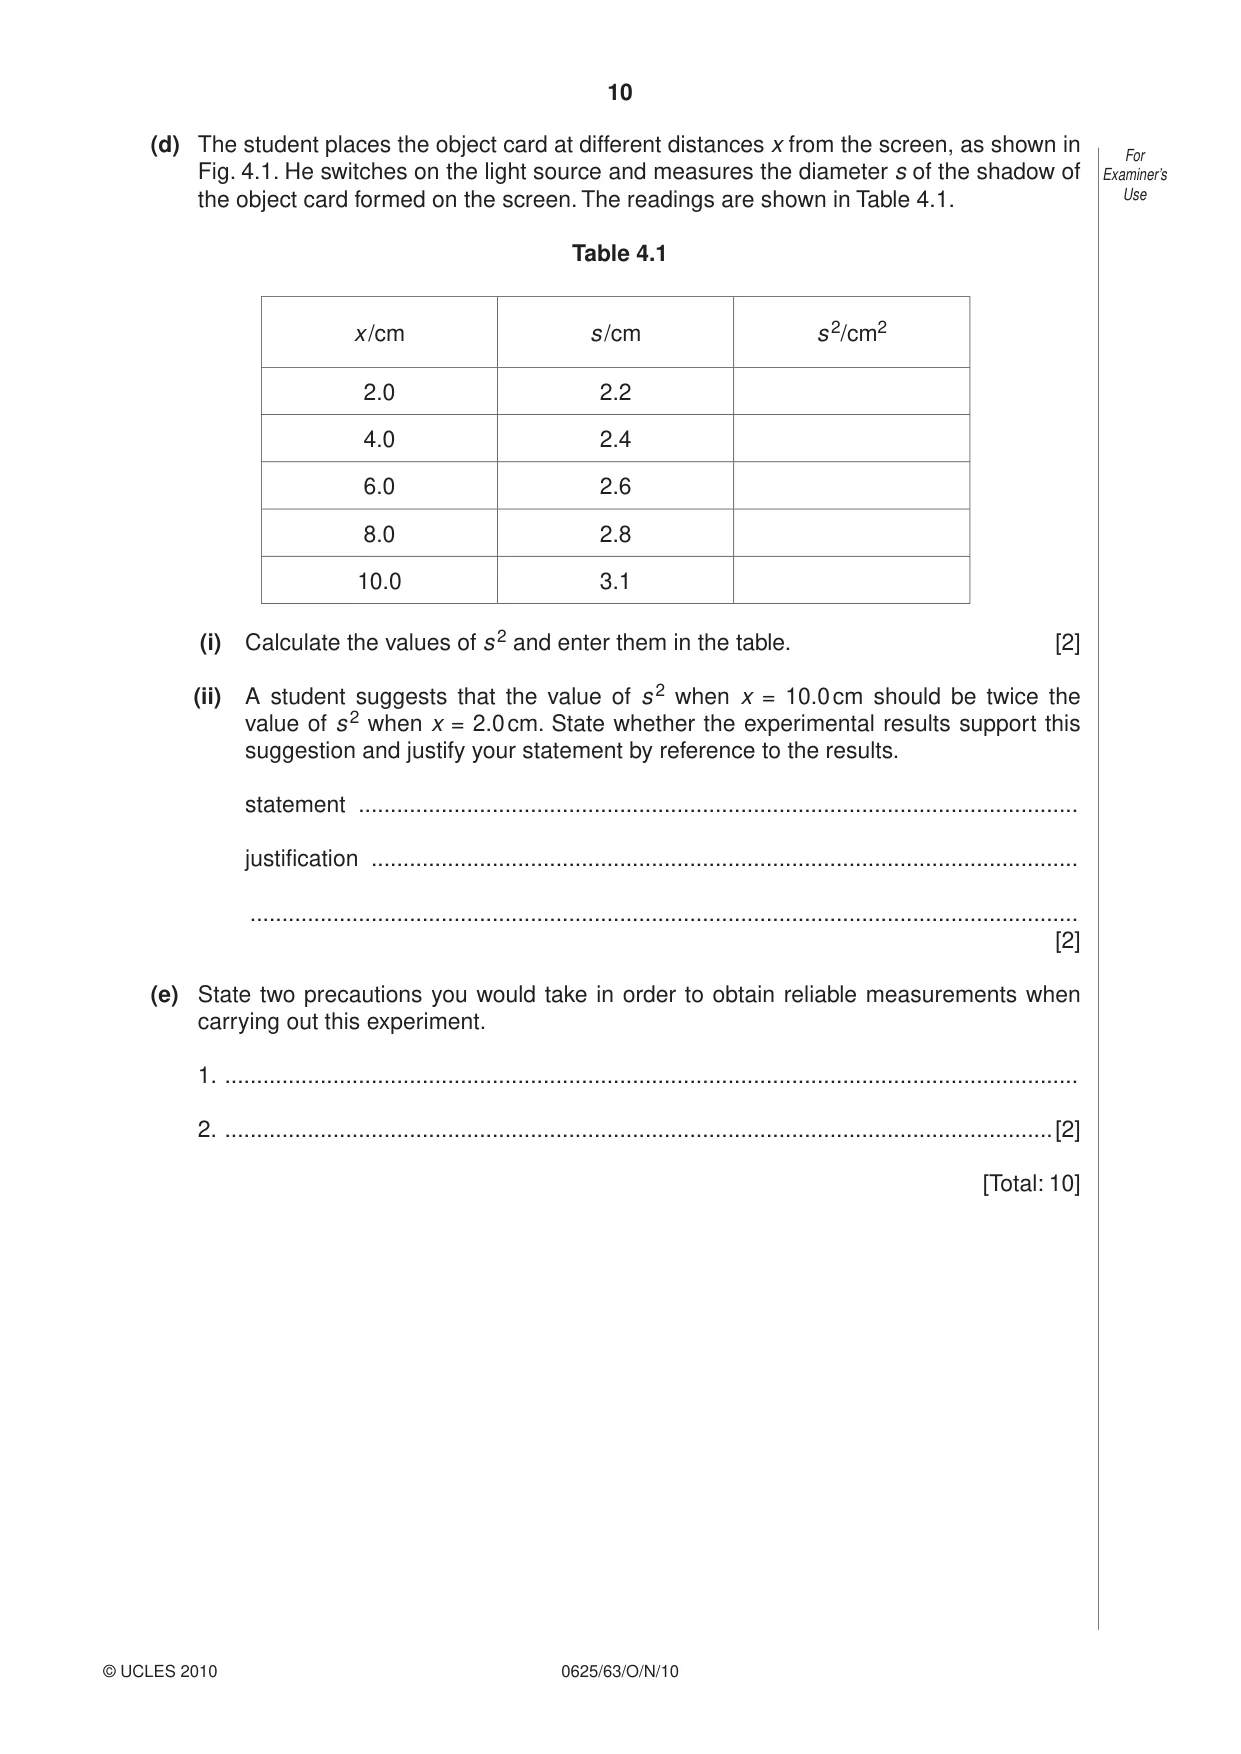
4 The IGCSE class is investigating shadows formed on a screen. For Examiner’s Fig. 4.1 shows the apparatus. Use light screen source x object card A support a Fig. 4.1 The lamp is behind a piece of card. The card has a circular hole which, in this experiment, is referred to as the light source. (a) On Fig. 4.1, measure the distance a between the light source and the screen. a = ............................................ cm [1] (b) The diagram is drawn one third of actual size. Calculate the actual distance y between the light source and the screen. y = ............................................ cm [1] (c) A student places a circular object card A in a holder between the light source and the For screen. Fig. 4.2 shows the card and holder. Examiner’s Use circular piece of card labelled A A thin stick holder Fig. 4.2 Fig. 4.3 shows the object card drawn actual size. A Fig. 4.3 Take and record measurements from Fig. 4.3 to determine the average diameter d of the object card. d = ............................................ cm [2] (d) The student places the object card at different distances x from the screen, as shown in For Fig. 4.1. He switches on the light source and measures the diameter s of the shadow of Examiner’s the object card formed on the screen. The readings are shown in Table 4.1. Use Table 4.1 x /cm s /cm s 2/cm2 2.0 2.2 4.0 2.4 6.0 2.6 8.0 2.8 10.0 3.1 (i) Calculate the values of s 2 and enter them in the table. [2] (ii) A student suggests that the value of s 2 when x = 10.0 cm should be twice the value of s 2 when x = 2.0 cm. State whether the experimental results support this suggestion and justify your statement by reference to the results. statement ................................................................................................................. justification ............................................................................................................... .................................................................................................................................. [2] (e) State two precautions you would take in order to obtain reliable measurements when carrying out this experiment. 1. ...................................................................................................................................... 2. ..................................................................................................................................[2] [Total: 10]
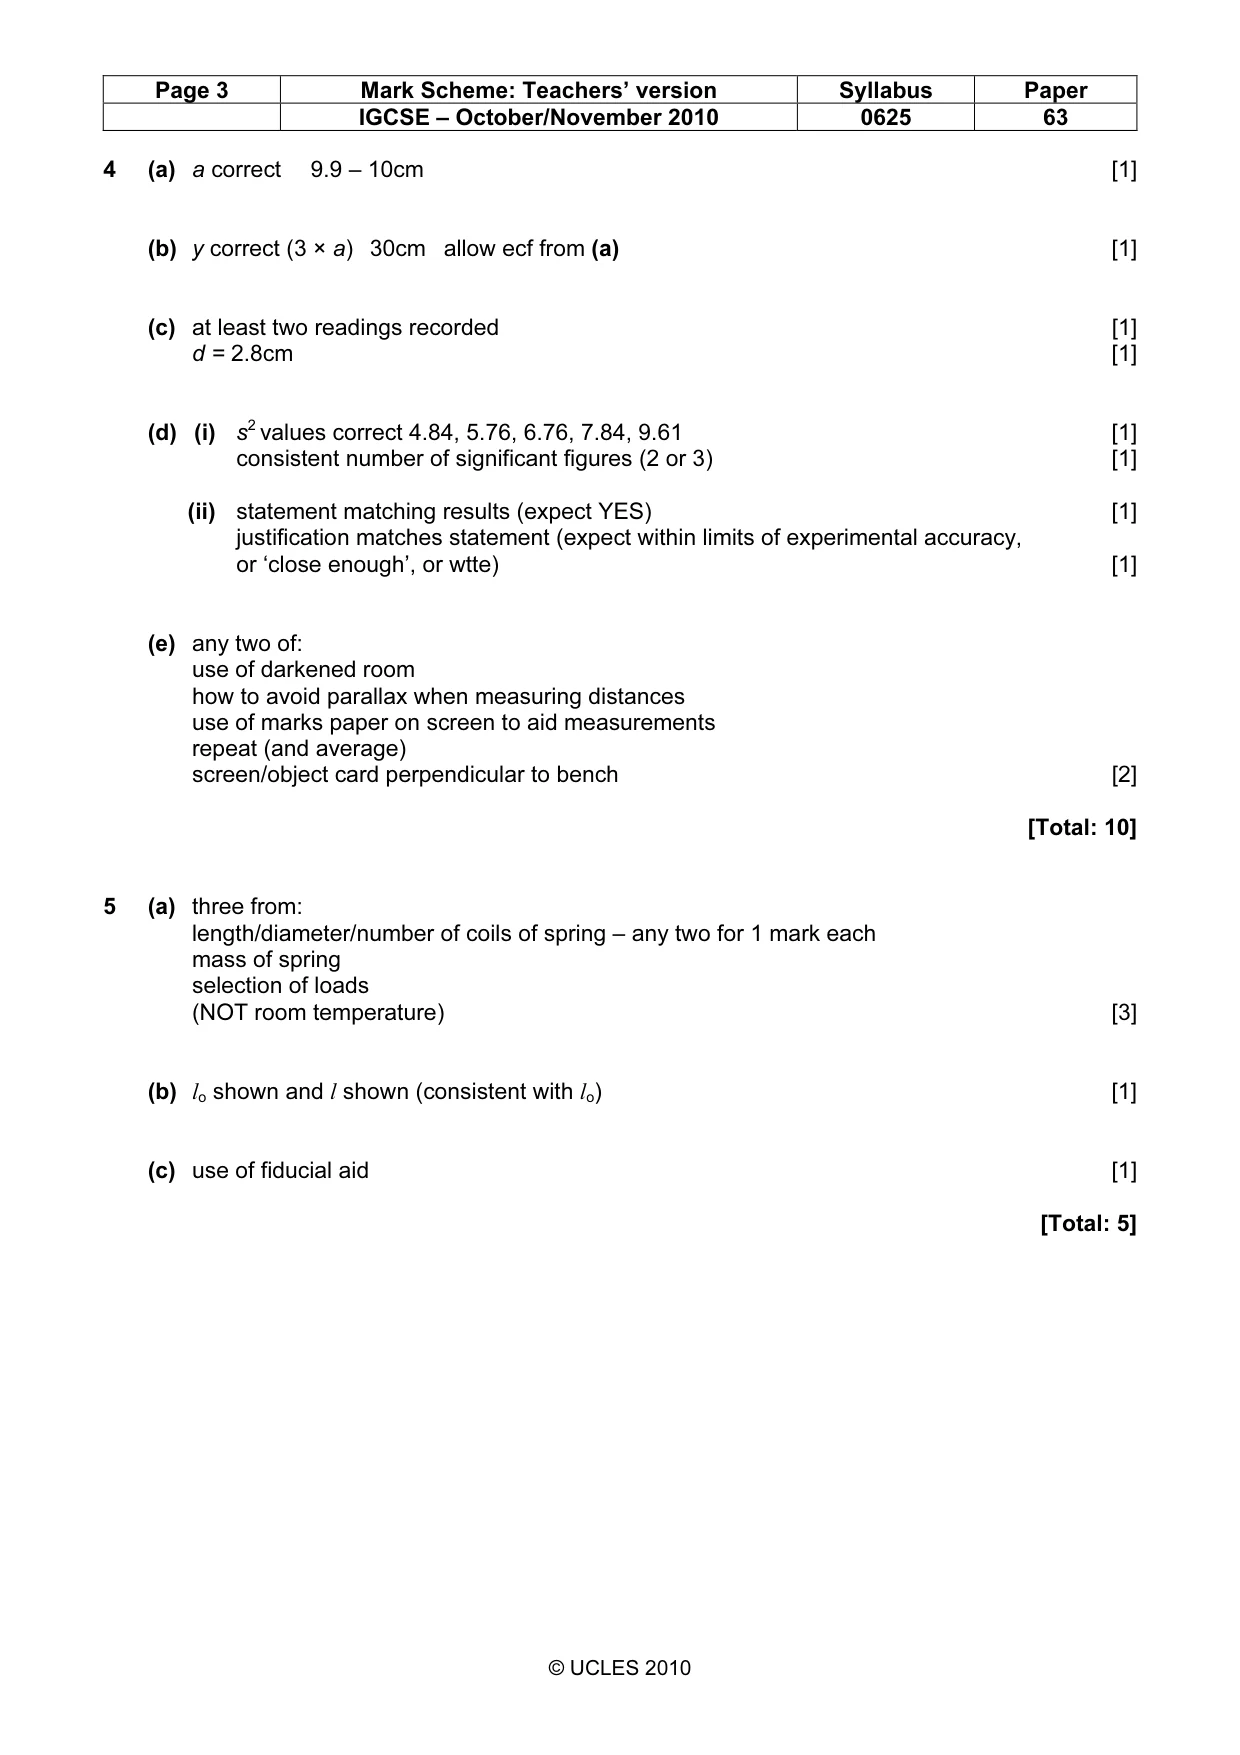
Mark scheme: 4 (a) a correct 9.9 – 10cm [1] (b) y correct (3 × a) 30cm allow ecf from (a) [1] (c) at least two readings recorded [1] d = 2.8cm [1] (d) (i) s2 values correct 4.84, 5.76, 6.76, 7.84, 9.61 [1] consistent number of significant figures (2 or 3) [1] (ii) statement matching results (expect YES) [1] justification matches statement (expect within limits of experimental accuracy, or ‘close enough’, or wtte) [1] (e) any two of: use of darkened room how to avoid parallax when measuring distances use of marks paper on screen to aid measurements repeat (and average) screen/object card perpendicular to bench [2] [Total: 10]
Q5 · The IGCSE class is investigating the stretching of springs
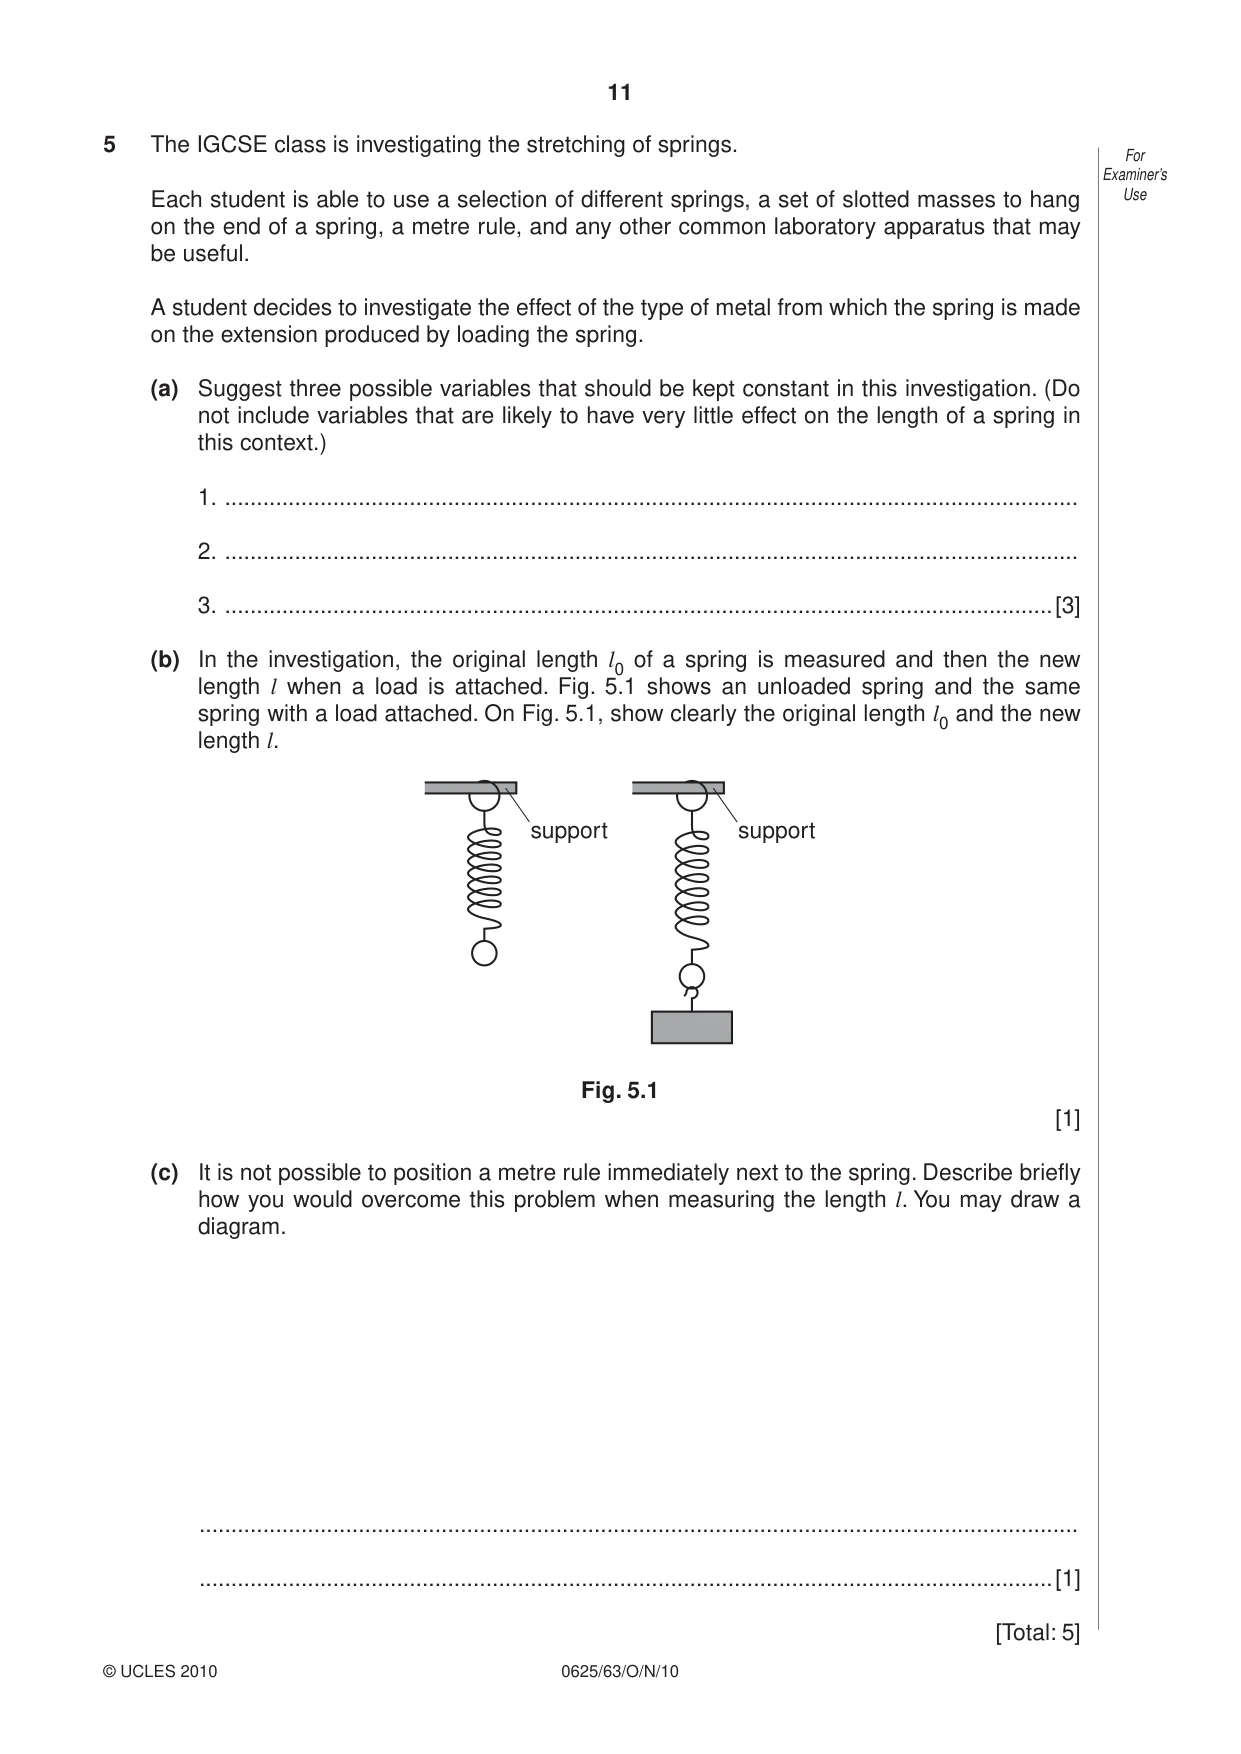
5 The IGCSE class is investigating the stretching of springs. For Examiner’s Each student is able to use a selection of different springs, a set of slotted masses to hang Use on the end of a spring, a metre rule, and any other common laboratory apparatus that may be useful. A student decides to investigate the effect of the type of metal from which the spring is made on the extension produced by loading the spring. (a) Suggest three possible variables that should be kept constant in this investigation. (Do not include variables that are likely to have very little effect on the length of a spring in this context.) 1. ...................................................................................................................................... 2. ...................................................................................................................................... 3. ..................................................................................................................................[3] (b) In the investigation, the original length l0 of a spring is measured and then the new length l when a load is attached. Fig. 5.1 shows an unloaded spring and the same spring with a load attached. On Fig. 5.1, show clearly the original length and the new l0 length l. support support Fig. 5.1 [1] (c) It is not possible to position a metre rule immediately next to the spring. Describe briefly how you would overcome this problem when measuring the length l. You may draw a diagram. .......................................................................................................................................... ......................................................................................................................................[1]
Mark scheme: 5 (a) three from: length/diameter/number of coils of spring – any two for 1 mark each mass of spring selection of loads (NOT room temperature) [3] (b) lo shown and l shown (consistent with lo) [1] (c) use of fiducial aid [1] [Total: 5]
More questions on Physical quantities and measurement techniques
What was in this paper
The subtopics covered by these 5 questions, and how many questions each got. Open one in a new tab to see every Cambridge question on it.
What you needed in this session
Cambridge’s own grade thresholds for 2010 Oct/Nov, Paper 6 · Variant 3. A higher threshold means an easier paper — the bar moves with how the cohort did.