Cambridge IGCSE Physics 0625 — 2010 Oct/Nov Paper 6 · Variant 1
0625/61/O/N/10 · 5 questions · 40 marks · ≈45 min
The question paper and its mark scheme, free to read here and free to download. This is Cambridge’s own paper, exactly as it was sat.
Question paper12 pages

Mark scheme3 pages
Answers below. Sit the paper first if you are practising.
Questions as text
Q1 · A student is determining the position of the centre of mass of an object using a…
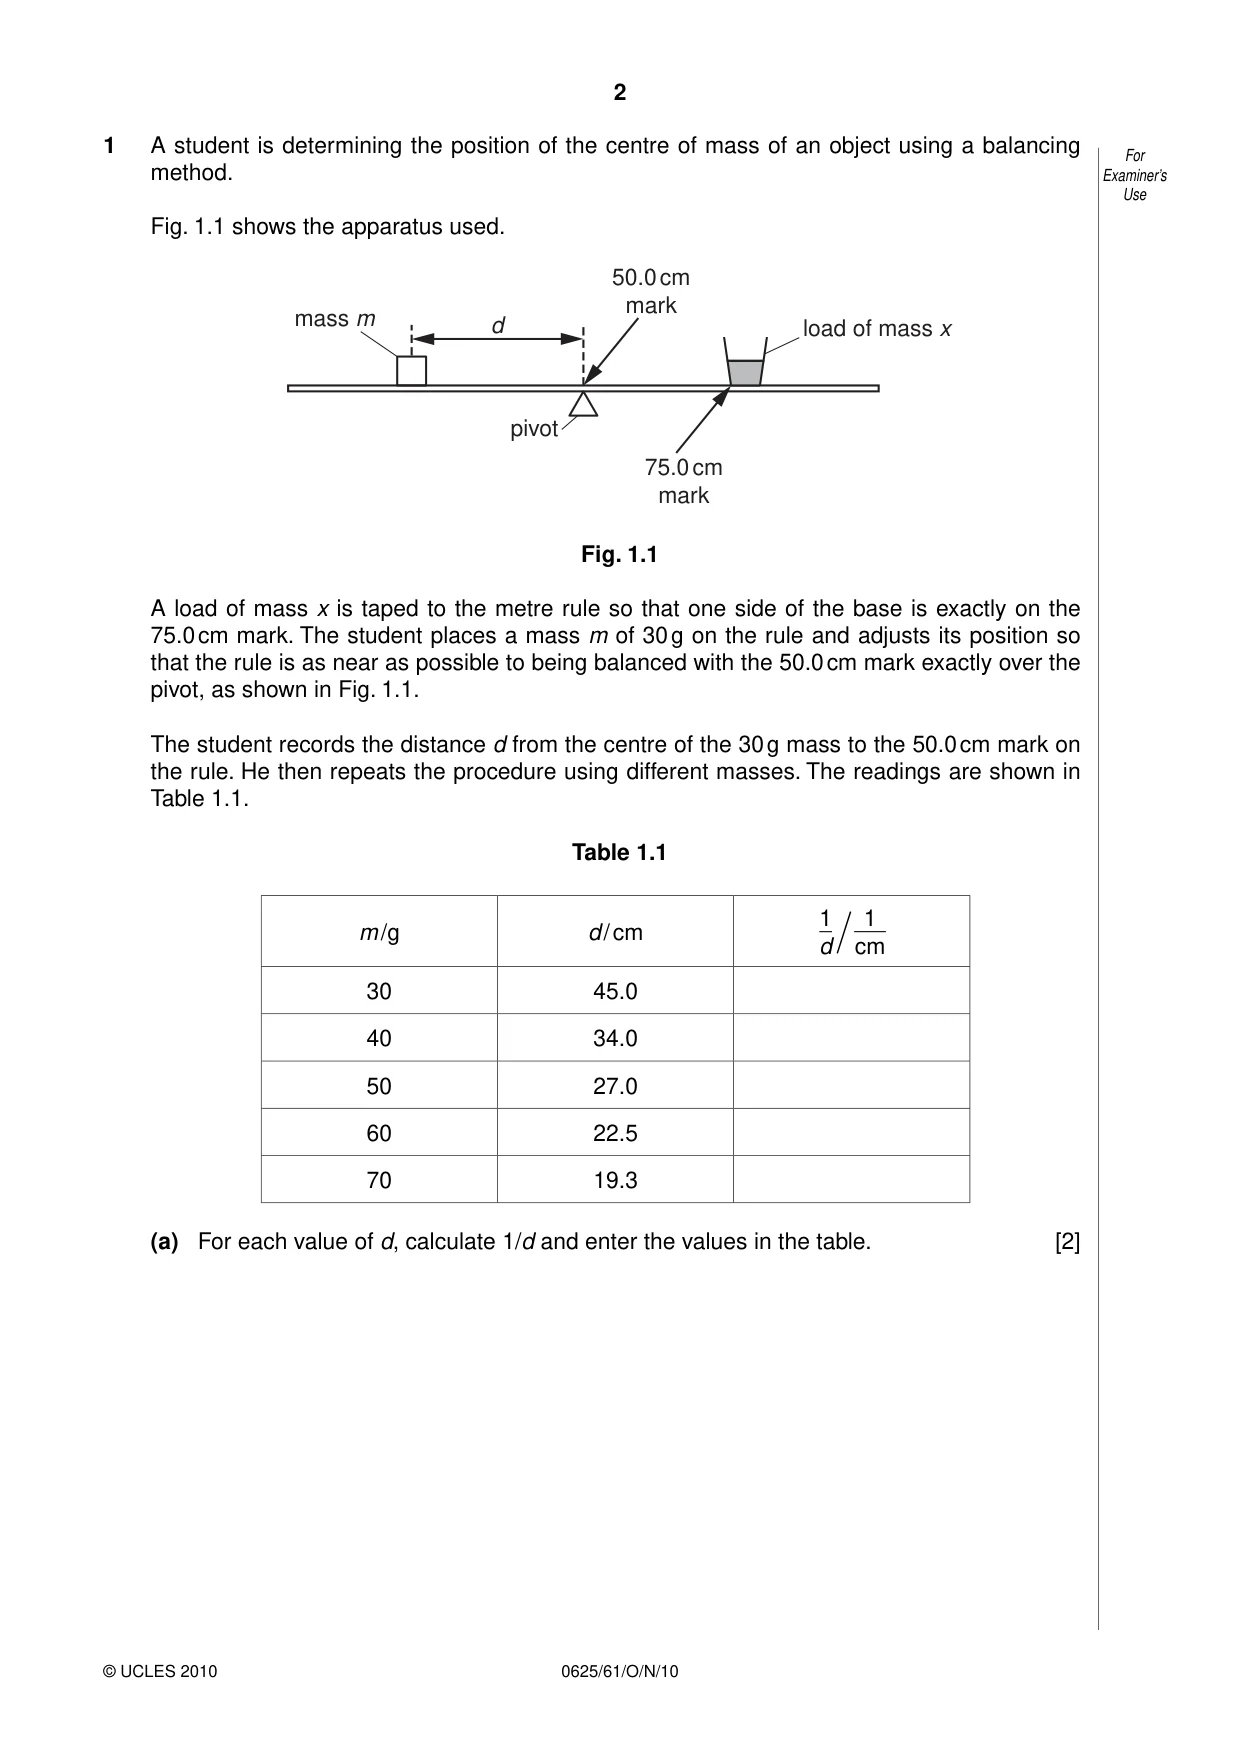
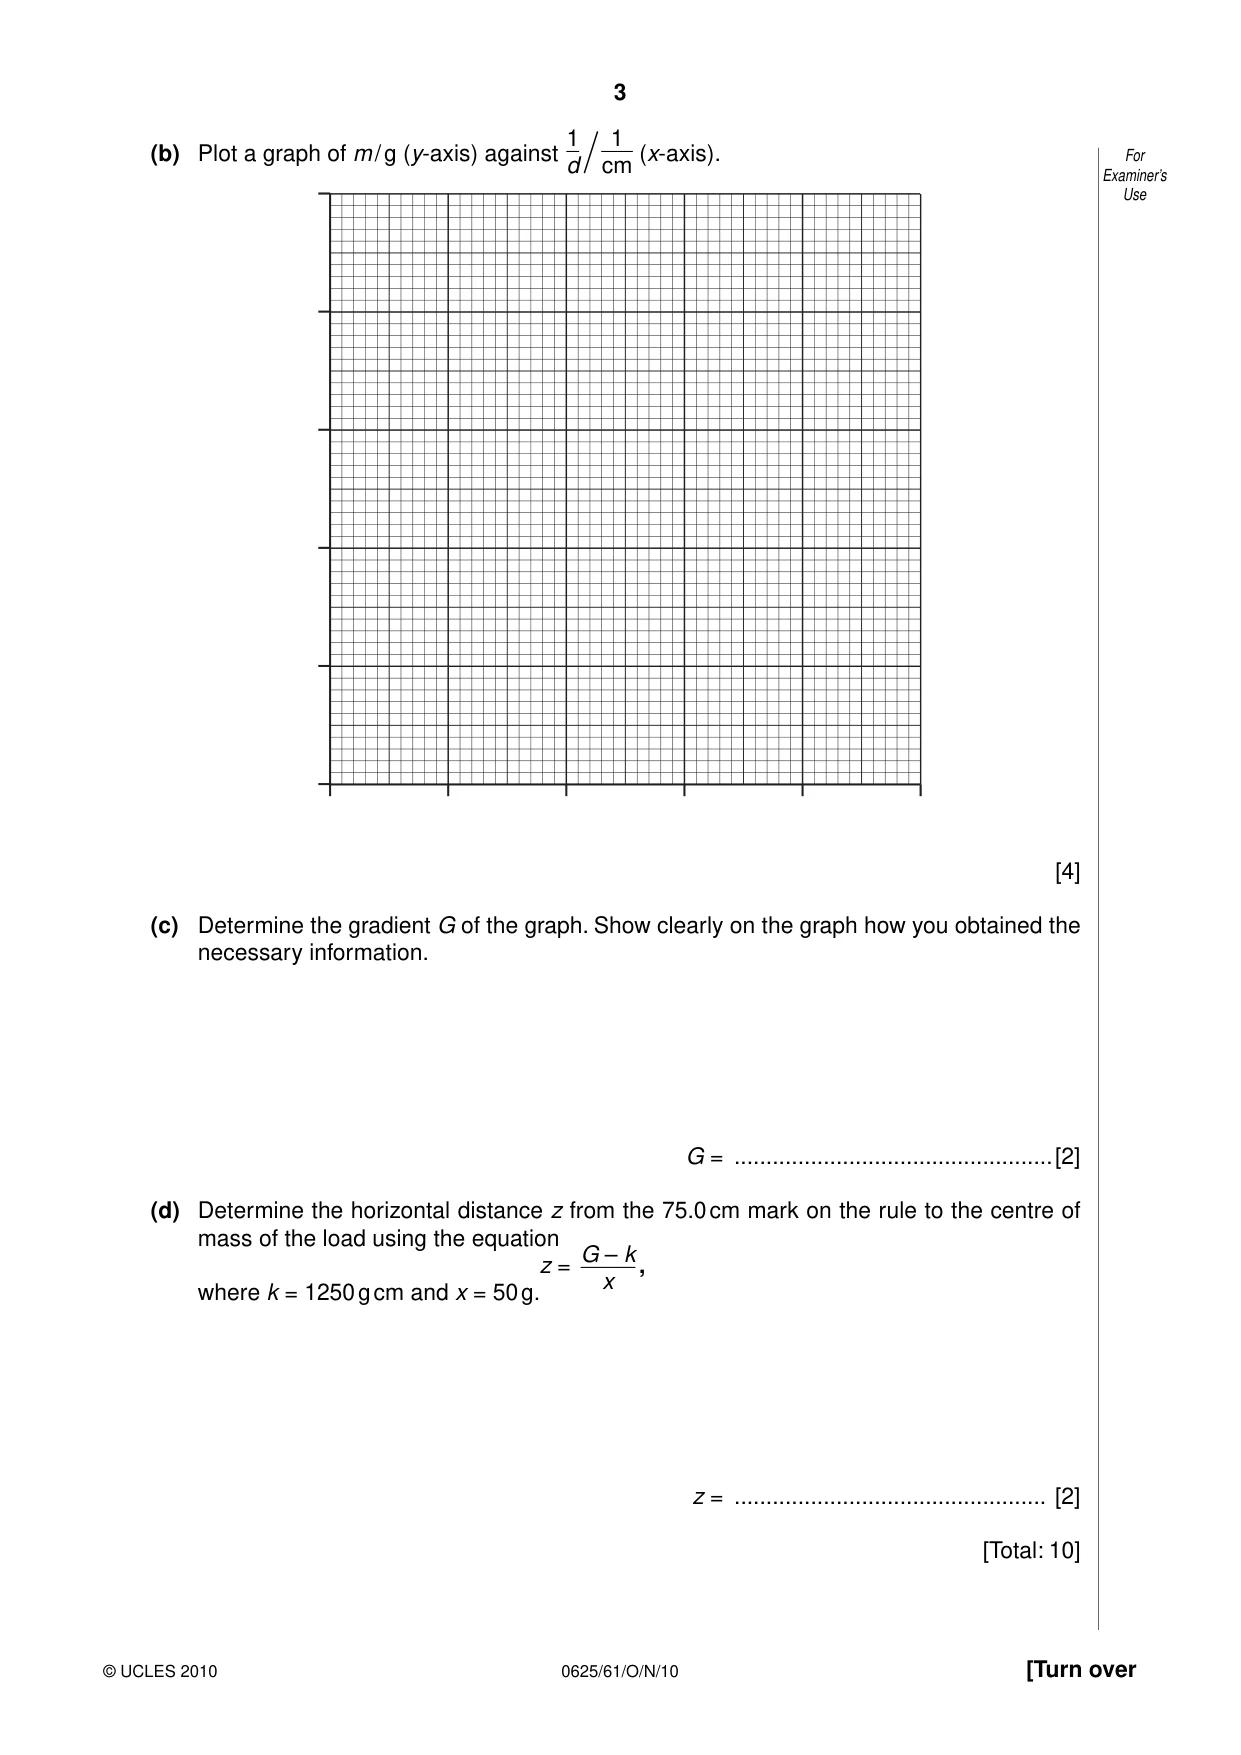
1 A student is determining the position of the centre of mass of an object using a balancing For method. Examiner’s Use Fig. 1.1 shows the apparatus used. 50.0 cm mark mass m d load of mass x pivot 75.0 cm mark Fig. 1.1 A load of mass x is taped to the metre rule so that one side of the base is exactly on the 75.0 cm mark. The student places a mass m of 30 g on the rule and adjusts its position so that the rule is as near as possible to being balanced with the 50.0 cm mark exactly over the pivot, as shown in Fig. 1.1. The student records the distance d from the centre of the 30 g mass to the 50.0 cm mark on the rule. He then repeats the procedure using different masses. The readings are shown in Table 1.1. Table 1.1 1 1 m /g d / cm d cm 30 45.0 40 34.0 50 27.0 60 22.5 70 19.3 (a) For each value of d, calculate 1/d and enter the values in the table. [2] 1 1 (b) Plot a graph of m / g (y-axis) against (x-axis). For d cm Examiner’s Use [4] (c) Determine the gradient G of the graph. Show clearly on the graph how you obtained the necessary information. G = ..................................................[2] (d) Determine the horizontal distance z from the 75.0 cm mark on the rule to the centre of mass of the load using the equation G – k z = , x where k = 1250 g cm and x = 50 g. z = ................................................. [2] [Total: 10]
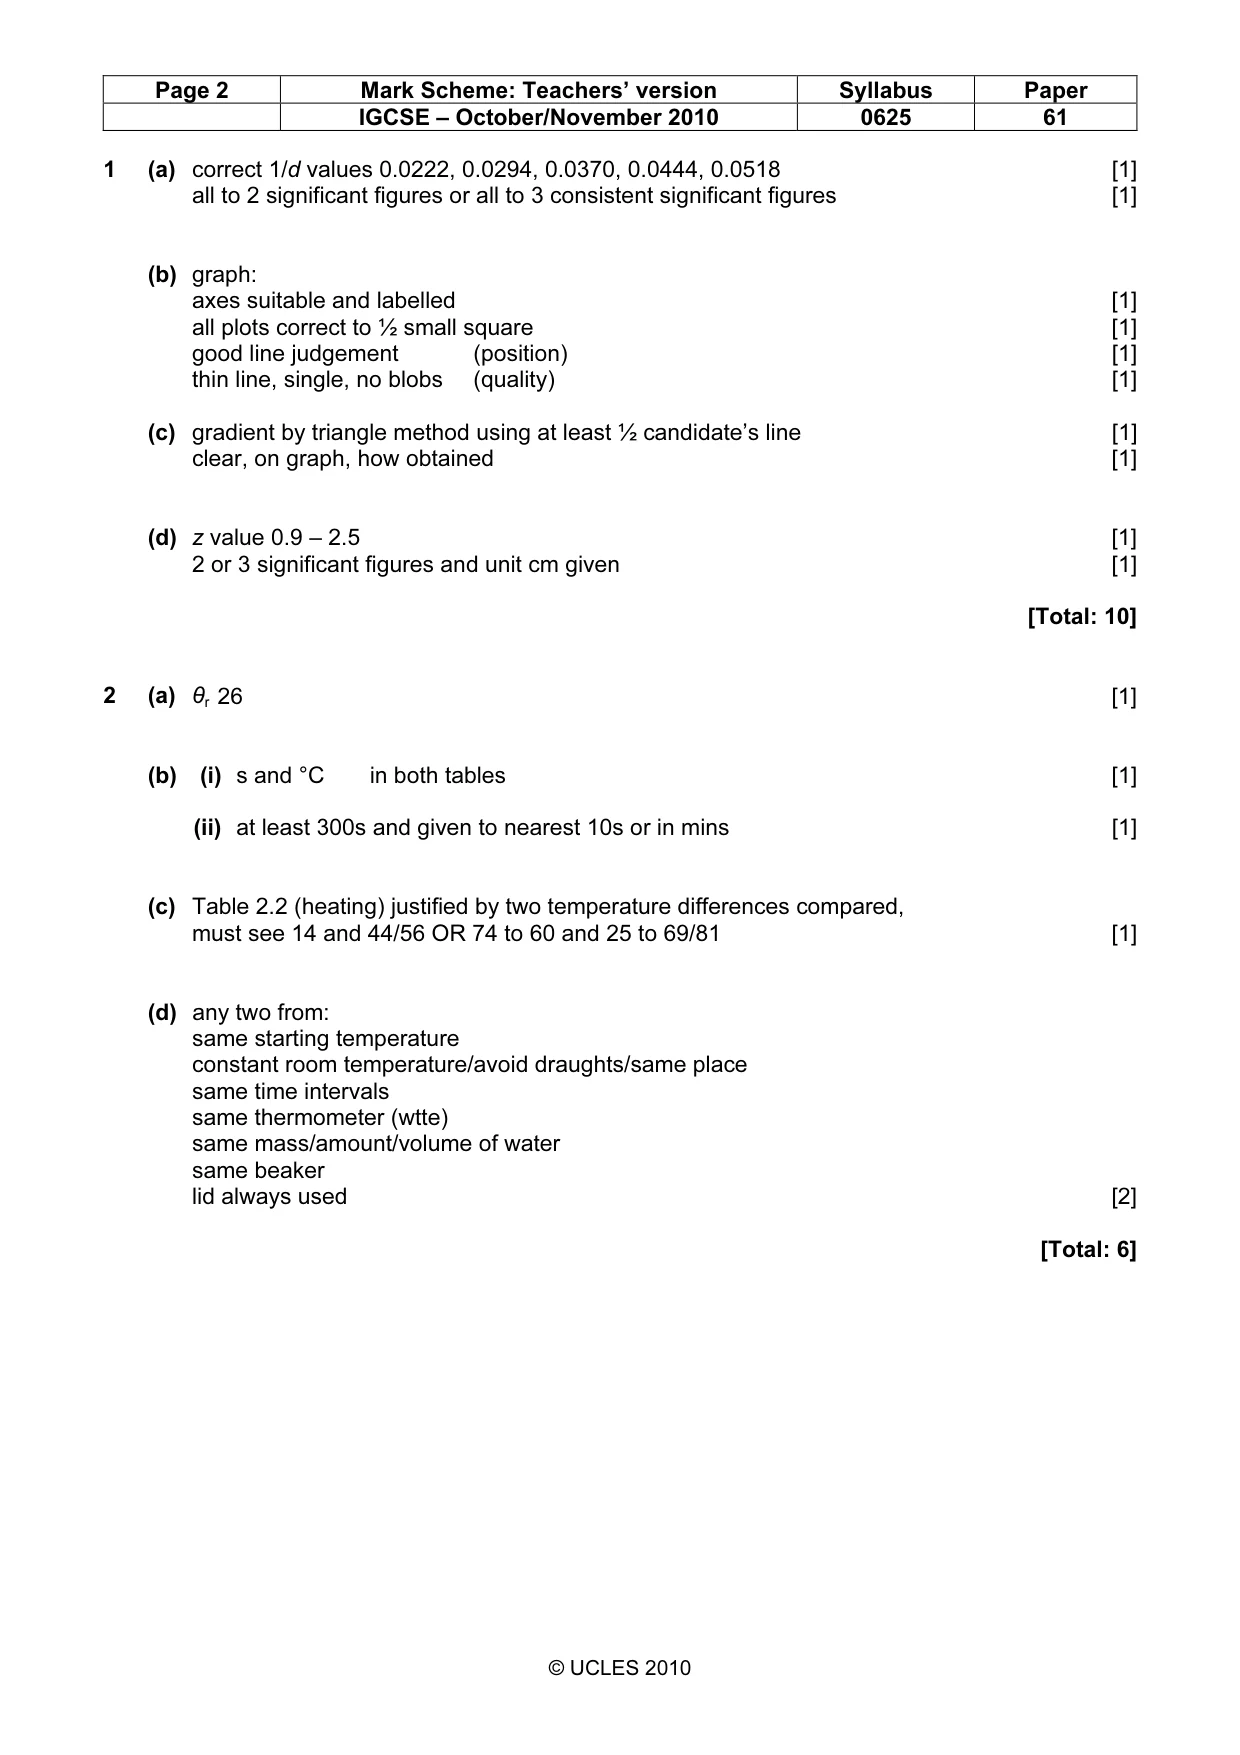
Mark scheme: 1 (a) correct 1/d values 0.0222, 0.0294, 0.0370, 0.0444, 0.0518 [1] all to 2 significant figures or all to 3 consistent significant figures [1] (b) graph: axes suitable and labelled [1] all plots correct to ½ small square [1] good line judgement (position) [1] thin line, single, no blobs (quality) [1] (c) gradient by triangle method using at least ½ candidate’s line [1] clear, on graph, how obtained [1] (d) z value 0.9 – 2.5 [1] 2 or 3 significant figures and unit cm given [1] [Total: 10]
More questions on Physical quantities and measurement techniques
Q2 · The IGCSE class is investigating the rate of heating and cooling of a thermometer bulb
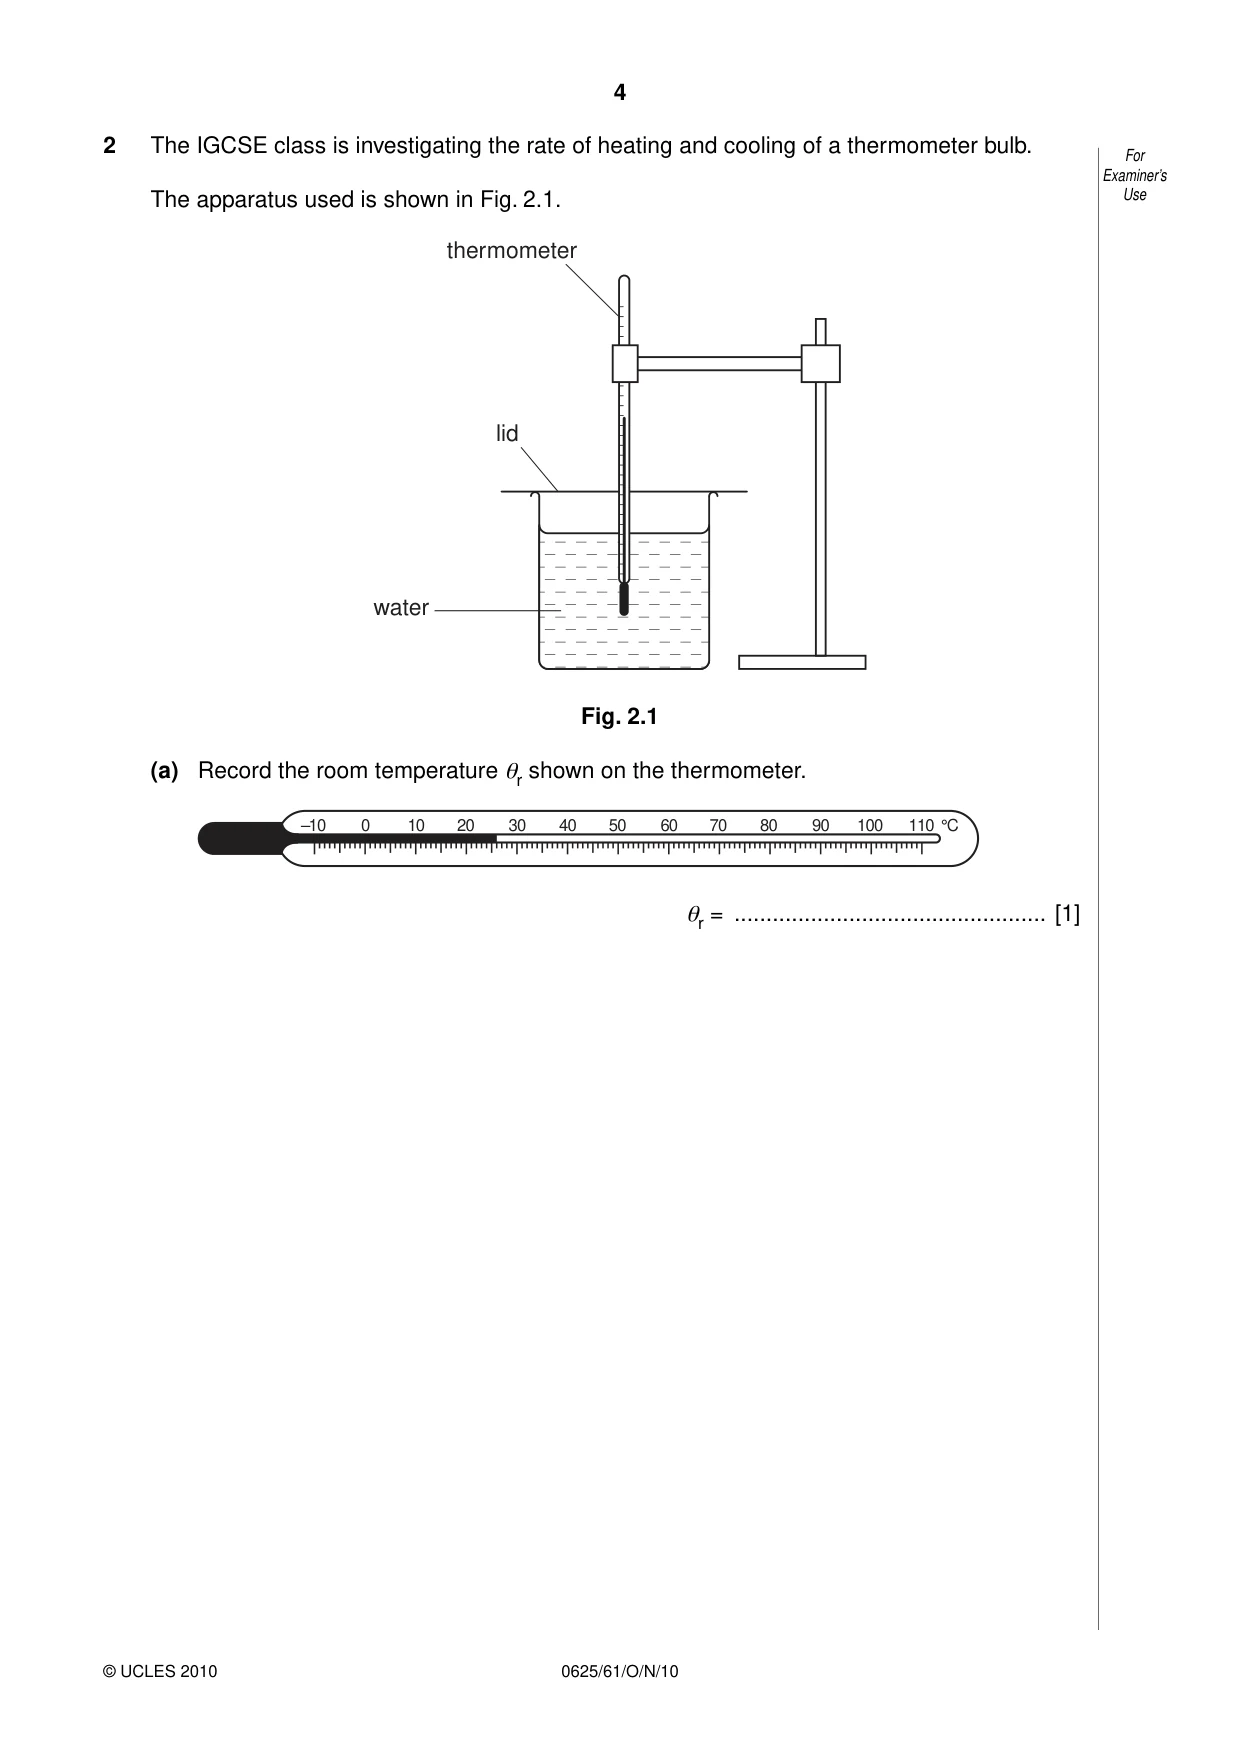
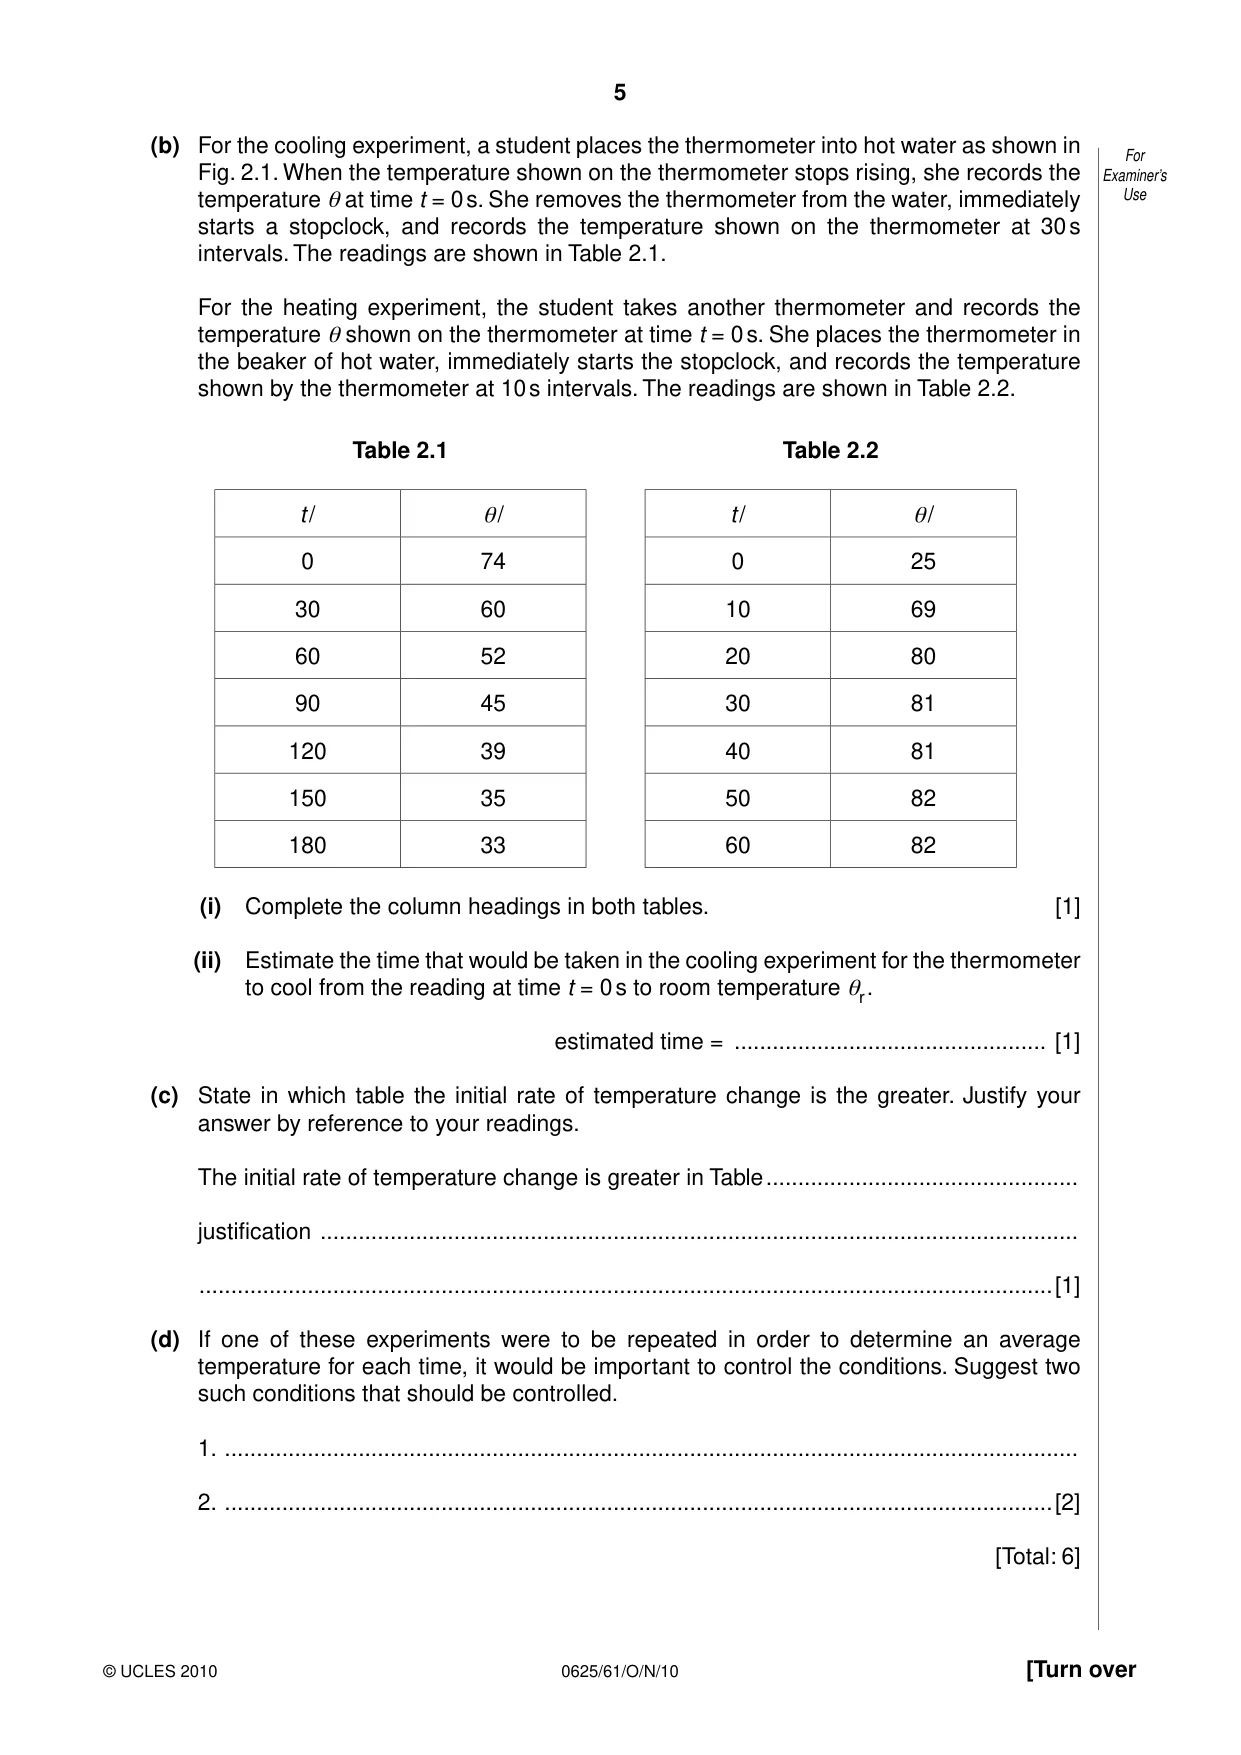
2 The IGCSE class is investigating the rate of heating and cooling of a thermometer bulb. For Examiner’s The apparatus used is shown in Fig. 2.1. Use thermometer lid water Fig. 2.1 (a) Record the room temperature θr shown on the thermometer. –10 0 10 20 30 40 50 60 70 80 90 100 110 °C θr = ................................................. [1] (b) For the cooling experiment, a student places the thermometer into hot water as shown in For Fig. 2.1. When the temperature shown on the thermometer stops rising, she records the Examiner’s temperature θ at time t = 0 s. She removes the thermometer from the water, immediately Use starts a stopclock, and records the temperature shown on the thermometer at 30 s intervals. The readings are shown in Table 2.1. For the heating experiment, the student takes another thermometer and records the temperature θ shown on the thermometer at time t = 0 s. She places the thermometer in the beaker of hot water, immediately starts the stopclock, and records the temperature shown by the thermometer at 10 s intervals. The readings are shown in Table 2.2. Table 2.1 Table 2.2 t / θ/ t / θ/ 0 74 0 25 30 60 10 69 60 52 20 80 90 45 30 81 120 39 40 81 150 35 50 82 180 33 60 82 (i) Complete the column headings in both tables. [1] (ii) Estimate the time that would be taken in the cooling experiment for the thermometer to cool from the reading at time t = 0 s to room temperature θr . estimated time = ................................................. [1] (c) State in which table the initial rate of temperature change is the greater. Justify your answer by reference to your readings. The initial rate of temperature change is greater in Table ................................................. justification ....................................................................................................................... ......................................................................................................................................[1] (d) If one of these experiments were to be repeated in order to determine an average temperature for each time, it would be important to control the conditions. Suggest two such conditions that should be controlled. 1. ...................................................................................................................................... 2. ..................................................................................................................................[2] [Total: 6]
Mark scheme: 2 (a) θr 26 [1] (b) (i) s and °C in both tables [1] (ii) at least 300s and given to nearest 10s or in mins [1] (c) Table 2.2 (heating) justified by two temperature differences compared, must see 14 and 44/56 OR 74 to 60 and 25 to 69/81 [1] (d) any two from: same starting temperature constant room temperature/avoid draughts/same place same time intervals same thermometer (wtte) same mass/amount/volume of water same beaker lid always used [2] [Total: 6] IGCSE – October/November 2010 0625 61
Q3 · The IGCSE class is investigating the current in a circuit when different resistors are…
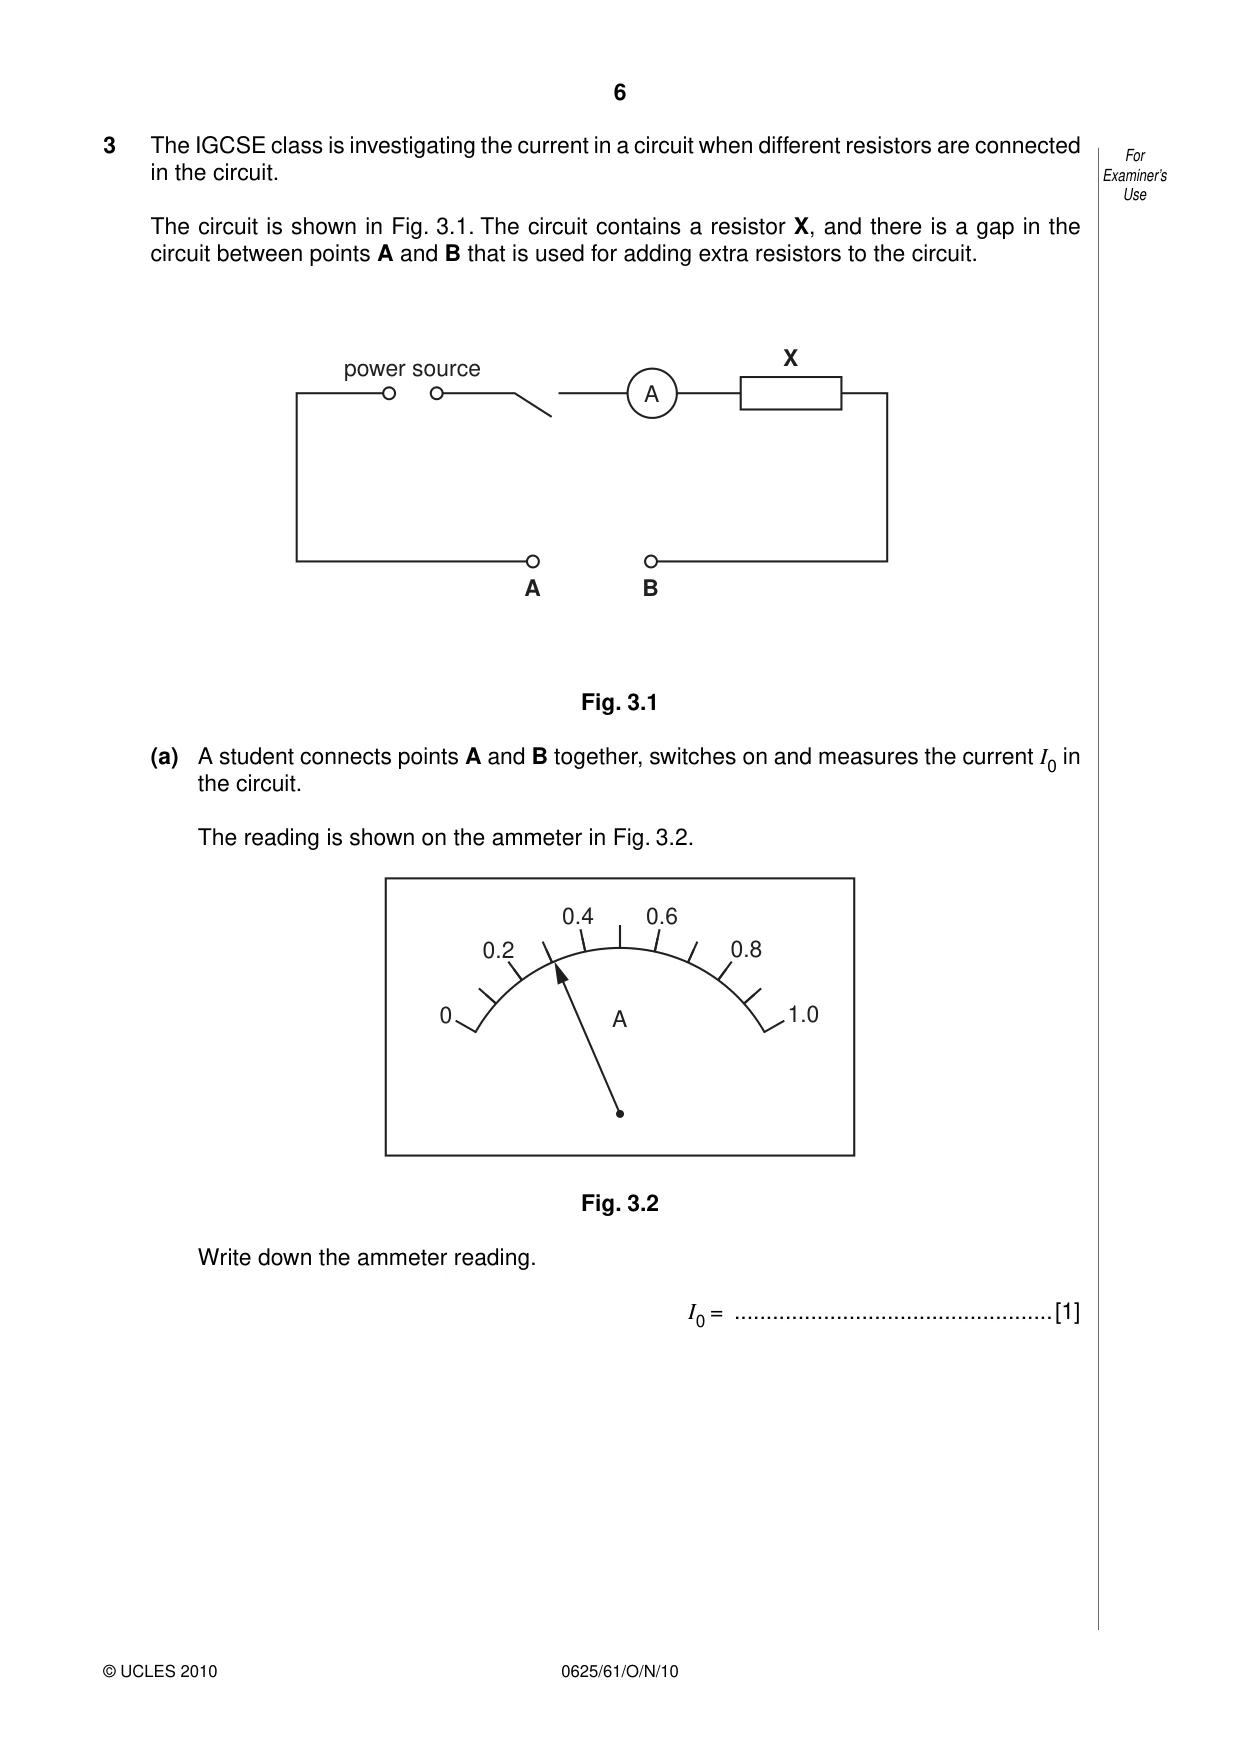
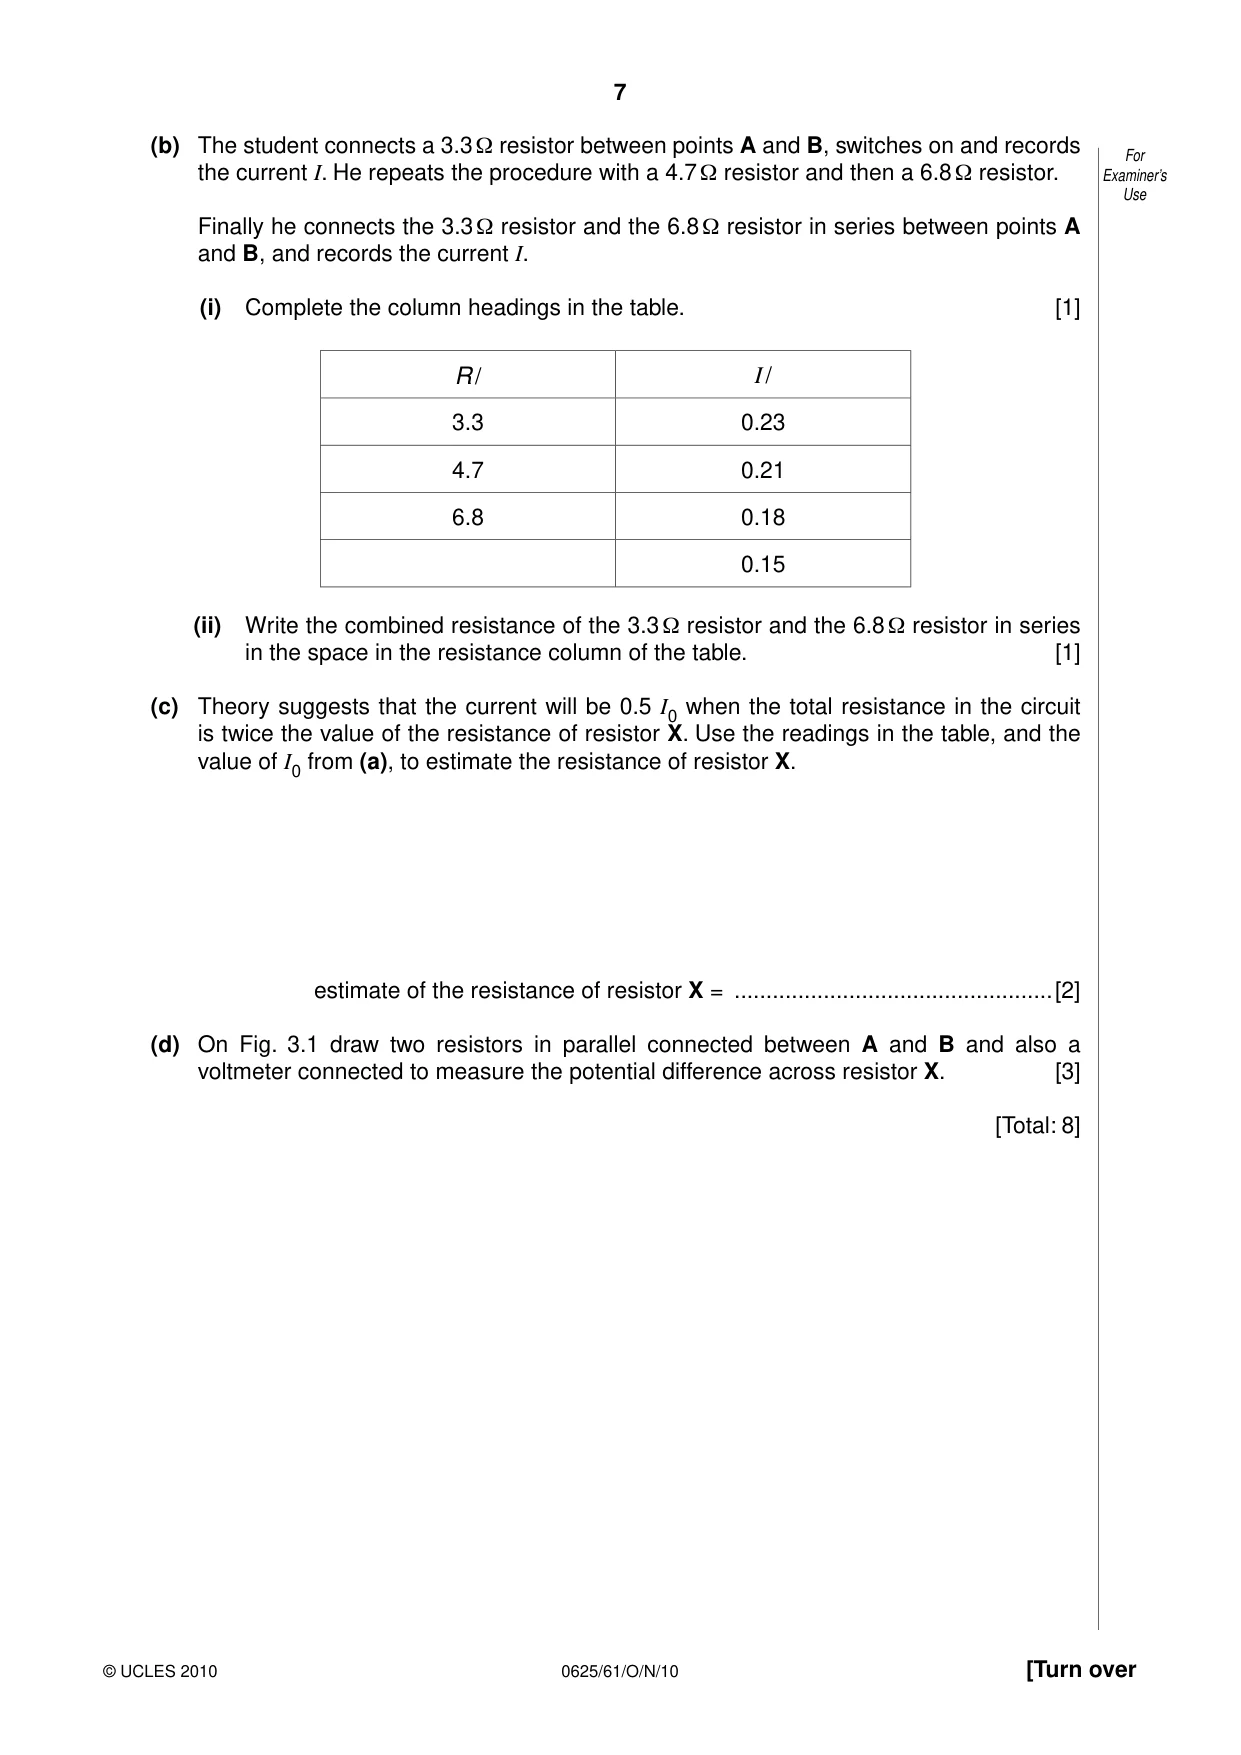
3 The IGCSE class is investigating the current in a circuit when different resistors are connected For in the circuit. Examiner’s Use The circuit is shown in Fig. 3.1. The circuit contains a resistor X, and there is a gap in the circuit between points A and B that is used for adding extra resistors to the circuit. X power source A A B Fig. 3.1 (a) A student connects points A and B together, switches on and measures the current I0 in the circuit. The reading is shown on the ammeter in Fig. 3.2. 0.4 0.6 0.2 0.8 0 A 1.0 Fig. 3.2 Write down the ammeter reading. I0 = ..................................................[1] (b) The student connects a 3.3 Ω resistor between points A and B, switches on and records For the current I. He repeats the procedure with a 4.7 Ω resistor and then a 6.8 Ω resistor. Examiner’s Use Finally he connects the 3.3 Ω resistor and the 6.8 Ω resistor in series between points A and B, and records the current I. (i) Complete the column headings in the table. [1] R / I / 3.3 0.23 4.7 0.21 6.8 0.18 0.15 (ii) Write the combined resistance of the 3.3 Ω resistor and the 6.8 Ω resistor in series in the space in the resistance column of the table. [1] (c) Theory suggests that the current will be 0.5 I0 when the total resistance in the circuit is twice the value of the resistance of resistor X. Use the readings in the table, and the value of I0 from (a), to estimate the resistance of resistor X. estimate of the resistance of resistor X = ..................................................[2] (d) On Fig. 3.1 draw two resistors in parallel connected between A and B and also a voltmeter connected to measure the potential difference across resistor X. [3] [Total: 8]
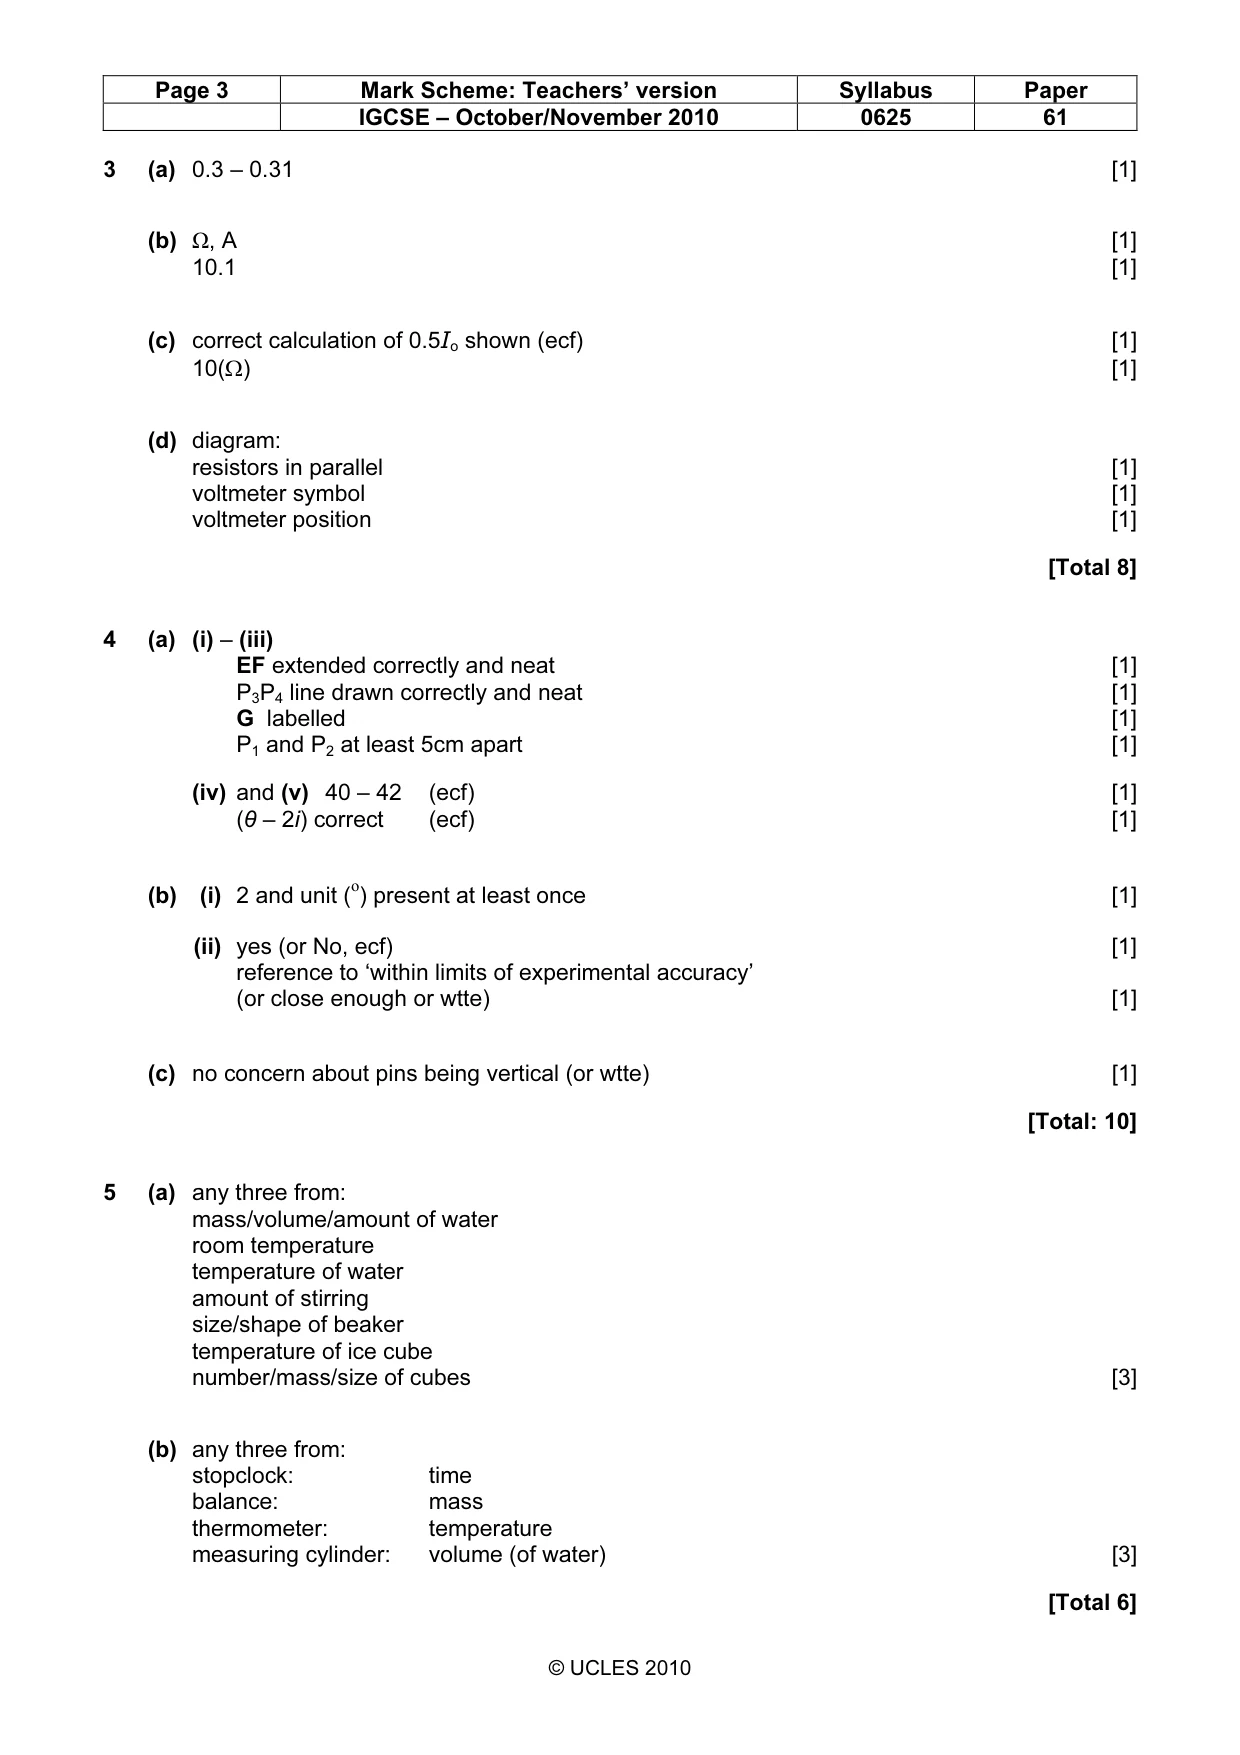
Mark scheme: 3 (a) 0.3 – 0.31 [1] (b) Ω, A [1] 10.1 [1] (c) correct calculation of 0.5Io shown (ecf) [1] 10(Ω) [1] (d) diagram: resistors in parallel [1] voltmeter symbol [1] voltmeter position [1] [Total 8]
Q4 · The IGCSE class is investigating the reflection of light by a mirror as seen through a…
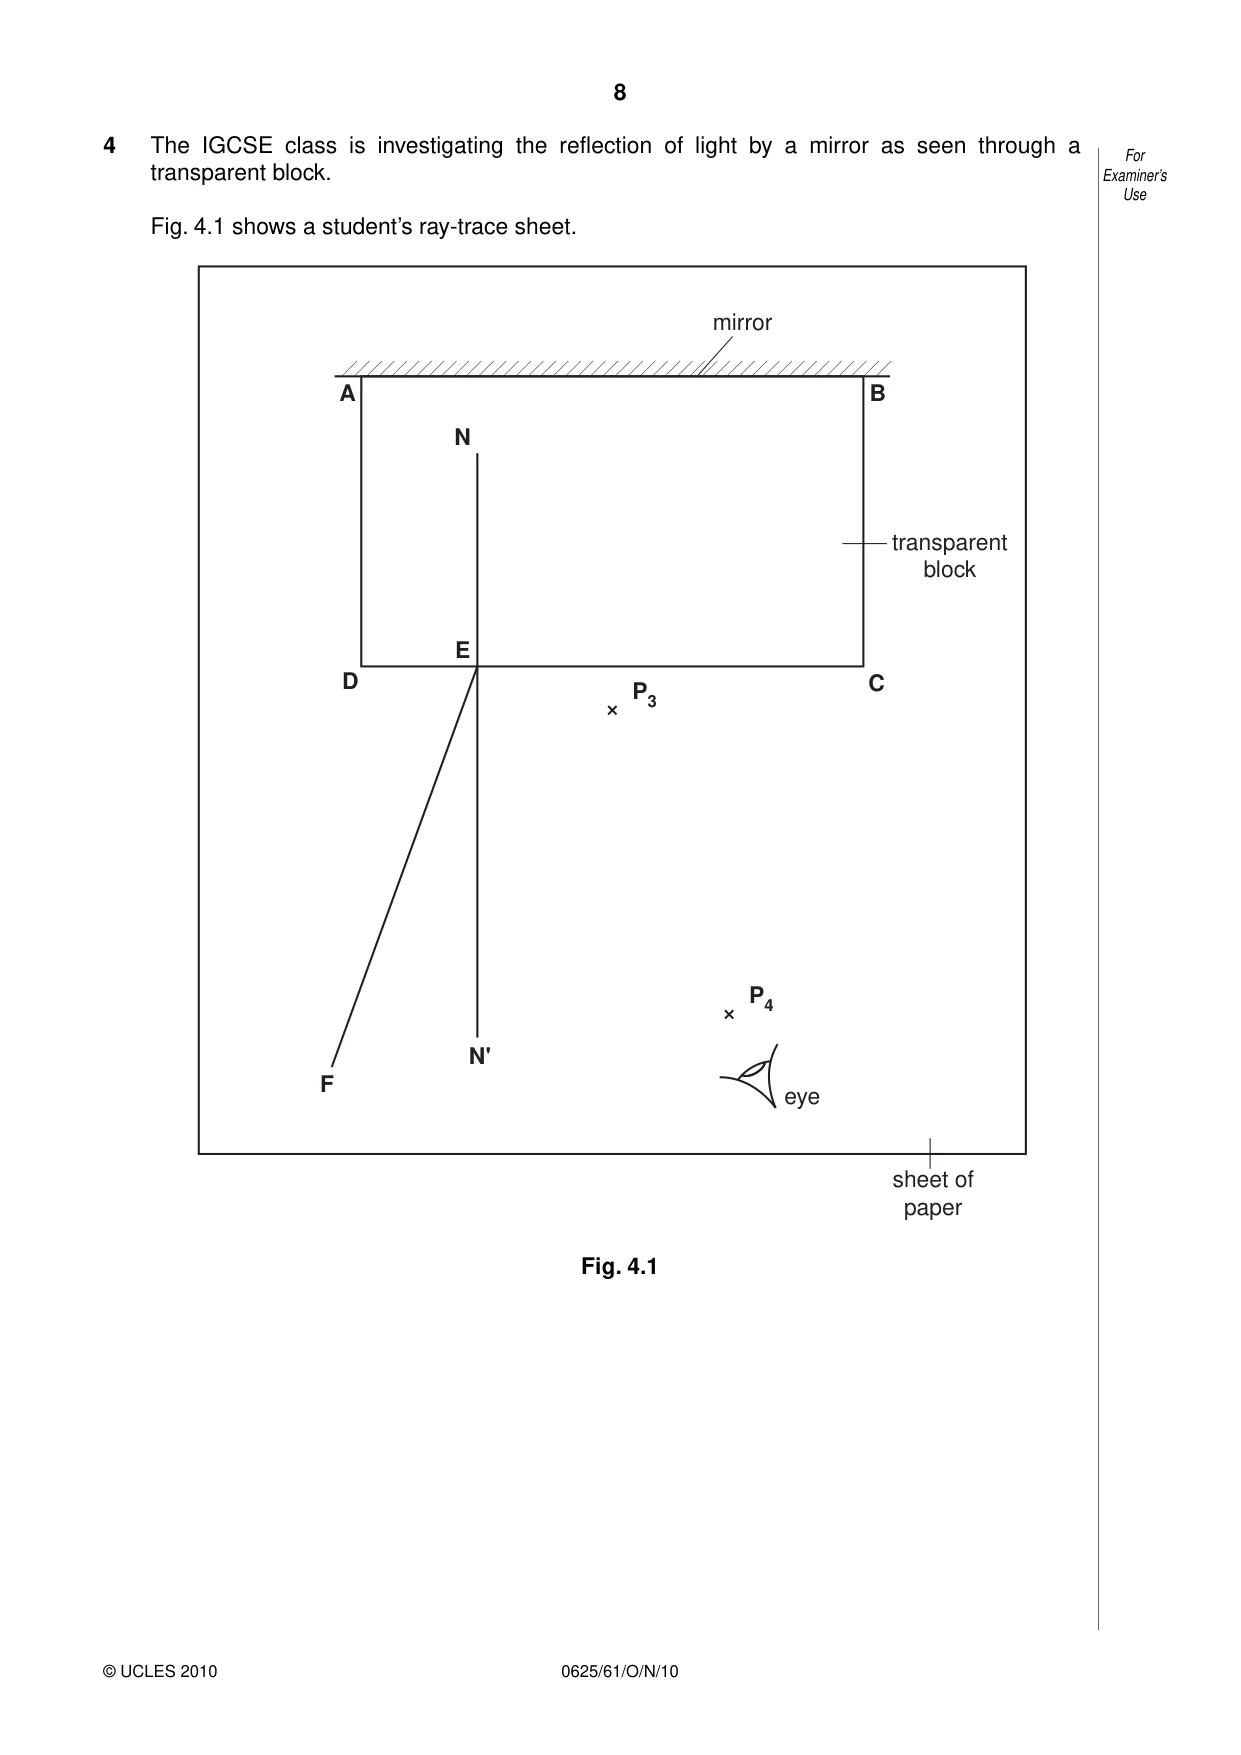
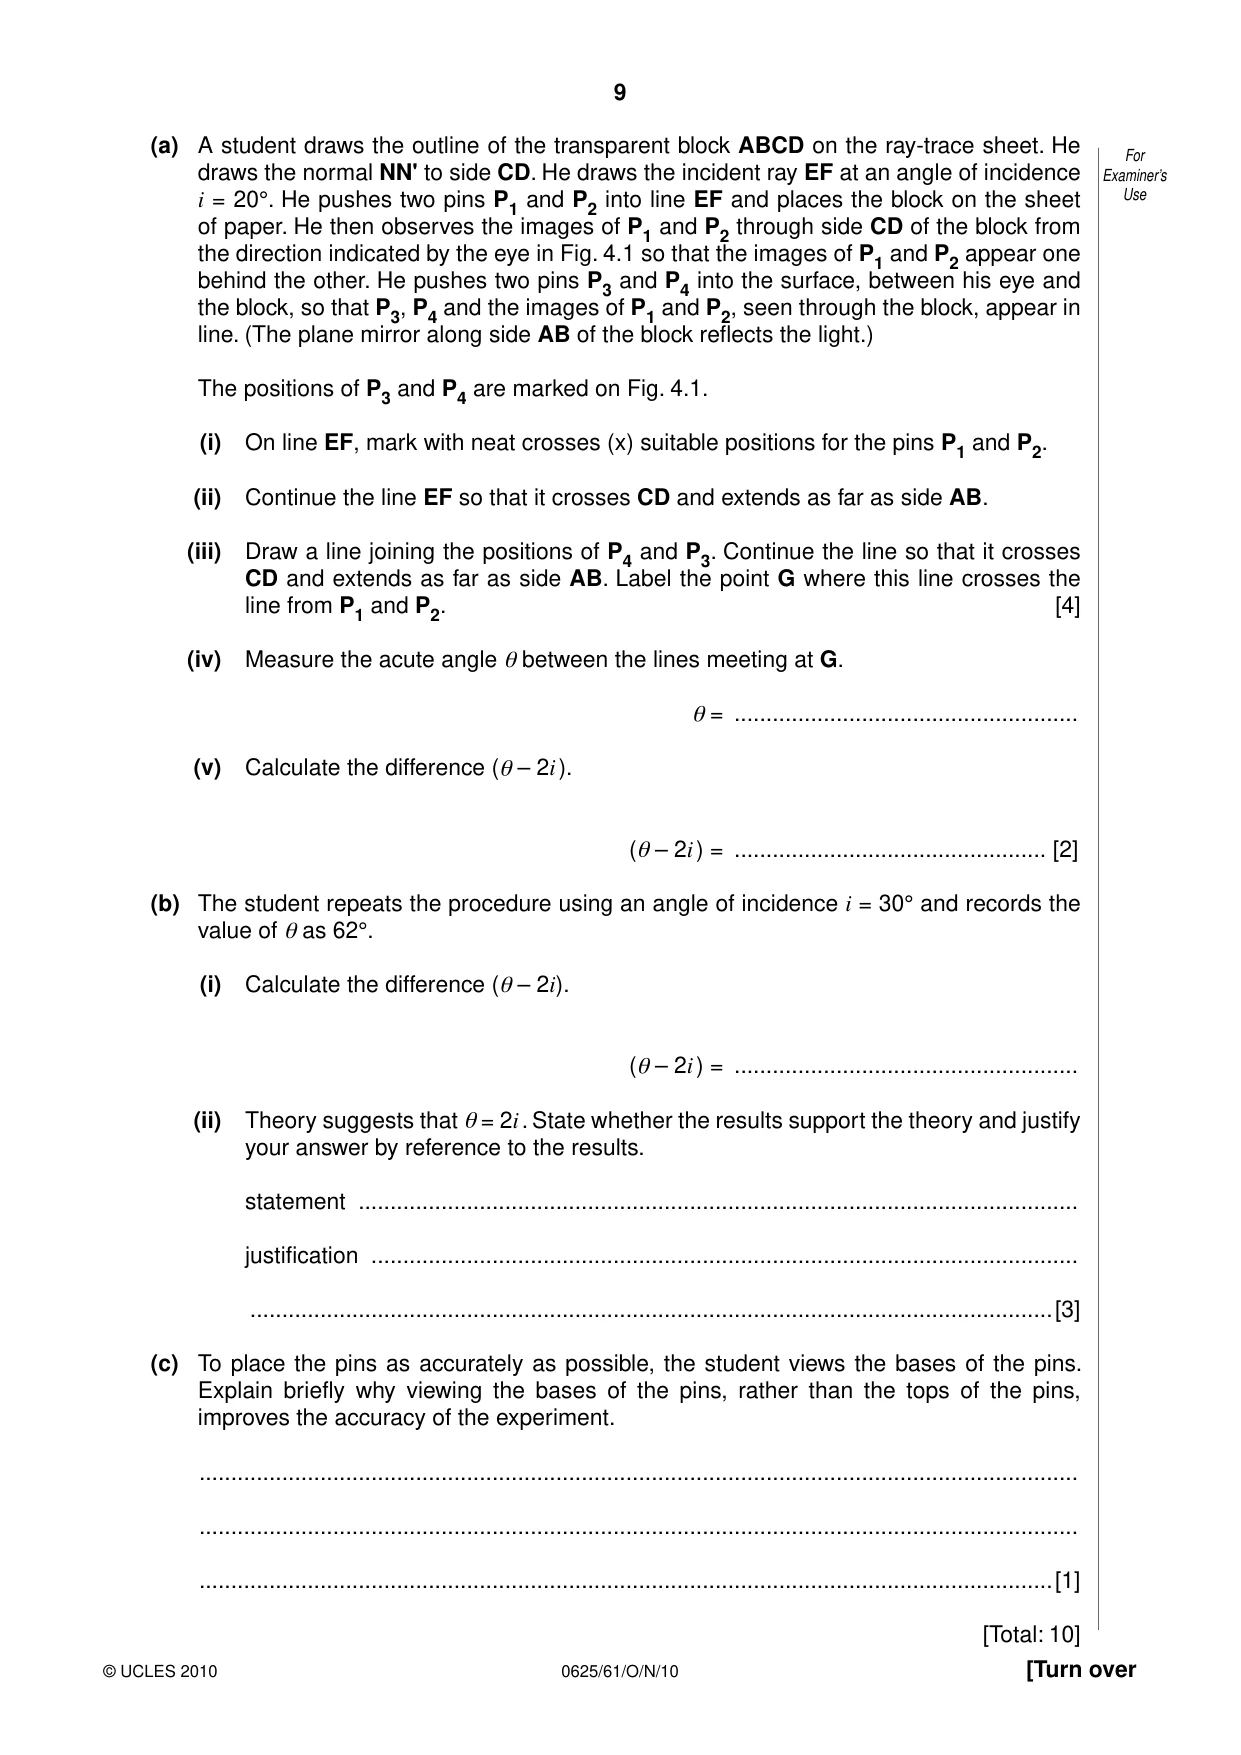
4 The IGCSE class is investigating the reflection of light by a mirror as seen through a For transparent block. Examiner’s Use Fig. 4.1 shows a student’s ray-trace sheet. mirror A B N transparent block E D C P3 P4 N' F eye sheet of paper Fig. 4.1 (a) A student draws the outline of the transparent block ABCD on the ray-trace sheet. He For draws the normal NN' to side CD. He draws the incident ray EF at an angle of incidence Examiner’s i = 20°. He pushes two pins P1 and P2 into line EF and places the block on the sheet Use of paper. He then observes the images of P1 and P2 through side CD of the block from the direction indicated by the eye in Fig. 4.1 so that the images of P1 and P2 appear one behind the other. He pushes two pins P3 and P4 into the surface, between his eye and the block, so that P3, P4 and the images of P1 and P2, seen through the block, appear in line. (The plane mirror along side AB of the block reflects the light.) The positions of P3 and P4 are marked on Fig. 4.1. (i) On line EF, mark with neat crosses (x) suitable positions for the pins P1 and P2. (ii) Continue the line EF so that it crosses CD and extends as far as side AB. (iii) Draw a line joining the positions of P4 and P3. Continue the line so that it crosses CD and extends as far as side AB. Label the point G where this line crosses the line from P1 and P2. [4] (iv) Measure the acute angle θ between the lines meeting at G. θ = ...................................................... (v) Calculate the difference (θ – 2i ). (θ – 2i ) = ................................................. [2] (b) The student repeats the procedure using an angle of incidence i = 30° and records the value of θ as 62°. (i) Calculate the difference (θ – 2i). (θ – 2i ) = ...................................................... (ii) Theory suggests that θ = 2i . State whether the results support the theory and justify your answer by reference to the results. statement ................................................................................................................. justification ............................................................................................................... ..............................................................................................................................[3] (c) To place the pins as accurately as possible, the student views the bases of the pins. Explain briefly why viewing the bases of the pins, rather than the tops of the pins, improves the accuracy of the experiment. .......................................................................................................................................... .......................................................................................................................................... ......................................................................................................................................[1] [Total: 10]
Mark scheme: 4 (a) (i) – (iii) EF extended correctly and neat [1] P3P4 line drawn correctly and neat [1] G labelled [1] P1 and P2 at least 5cm apart [1] (iv) and (v) 40 – 42 (ecf) [1] (θ – 2i) correct (ecf) [1] (b) (i) 2 and unit (o) present at least once [1] (ii) yes (or No, ecf) [1] reference to ‘within limits of experimental accuracy’ (or close enough or wtte) [1] (c) no concern about pins being vertical (or wtte) [1] [Total: 10]
Q5 · The IGCSE class is investigating the time taken for ice cubes to melt when placed in water
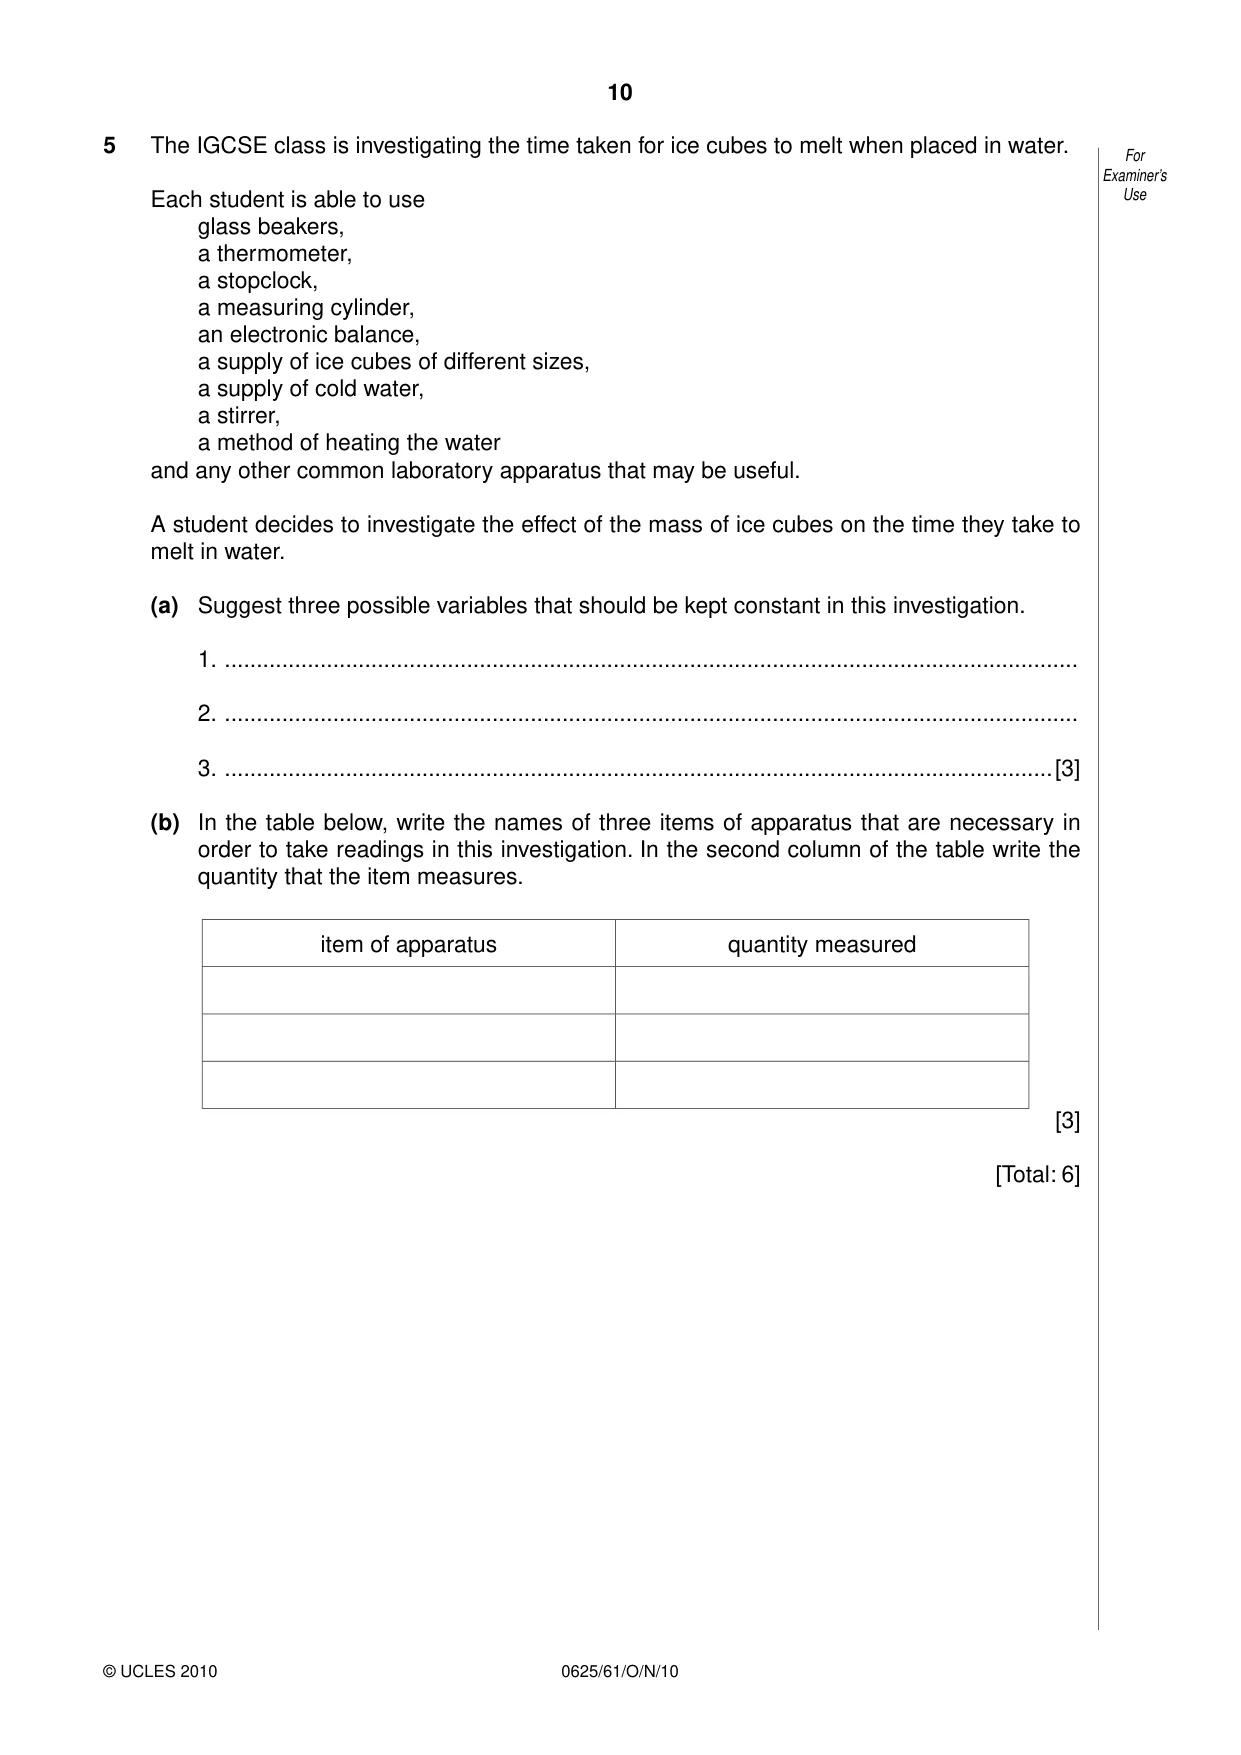
5 The IGCSE class is investigating the time taken for ice cubes to melt when placed in water. For Examiner’s Each student is able to use Use glass beakers, a thermometer, a stopclock, a measuring cylinder, an electronic balance, a supply of ice cubes of different sizes, a supply of cold water, a stirrer, a method of heating the water and any other common laboratory apparatus that may be useful. A student decides to investigate the effect of the mass of ice cubes on the time they take to melt in water. (a) Suggest three possible variables that should be kept constant in this investigation. 1. ...................................................................................................................................... 2. ...................................................................................................................................... 3. ..................................................................................................................................[3] (b) In the table below, write the names of three items of apparatus that are necessary in order to take readings in this investigation. In the second column of the table write the quantity that the item measures. item of apparatus quantity measured [3] [Total: 6]
Mark scheme: 5 (a) any three from: mass/volume/amount of water room temperature temperature of water amount of stirring size/shape of beaker temperature of ice cube number/mass/size of cubes [3] (b) any three from: stopclock: time balance: mass thermometer: temperature measuring cylinder: volume (of water) [3] [Total 6]
More questions on Physical quantities and measurement techniques
What was in this paper
The subtopics covered by these 5 questions, and how many questions each got. Open one in a new tab to see every Cambridge question on it.
What you needed in this session
Cambridge’s own grade thresholds for 2010 Oct/Nov, Paper 6 · Variant 1. A higher threshold means an easier paper — the bar moves with how the cohort did.