Cambridge IGCSE Physics 0625 — 2010 Oct/Nov Paper 6 · Variant 2
0625/62/O/N/10 · 5 questions · 40 marks · ≈45 min
The question paper and its mark scheme, free to read here and free to download. This is Cambridge’s own paper, exactly as it was sat.
Question paper12 pages
Mark scheme4 pages
Answers below. Sit the paper first if you are practising.
Questions as text
Q1 · An IGCSE student is determining the density of the material of a metre rule
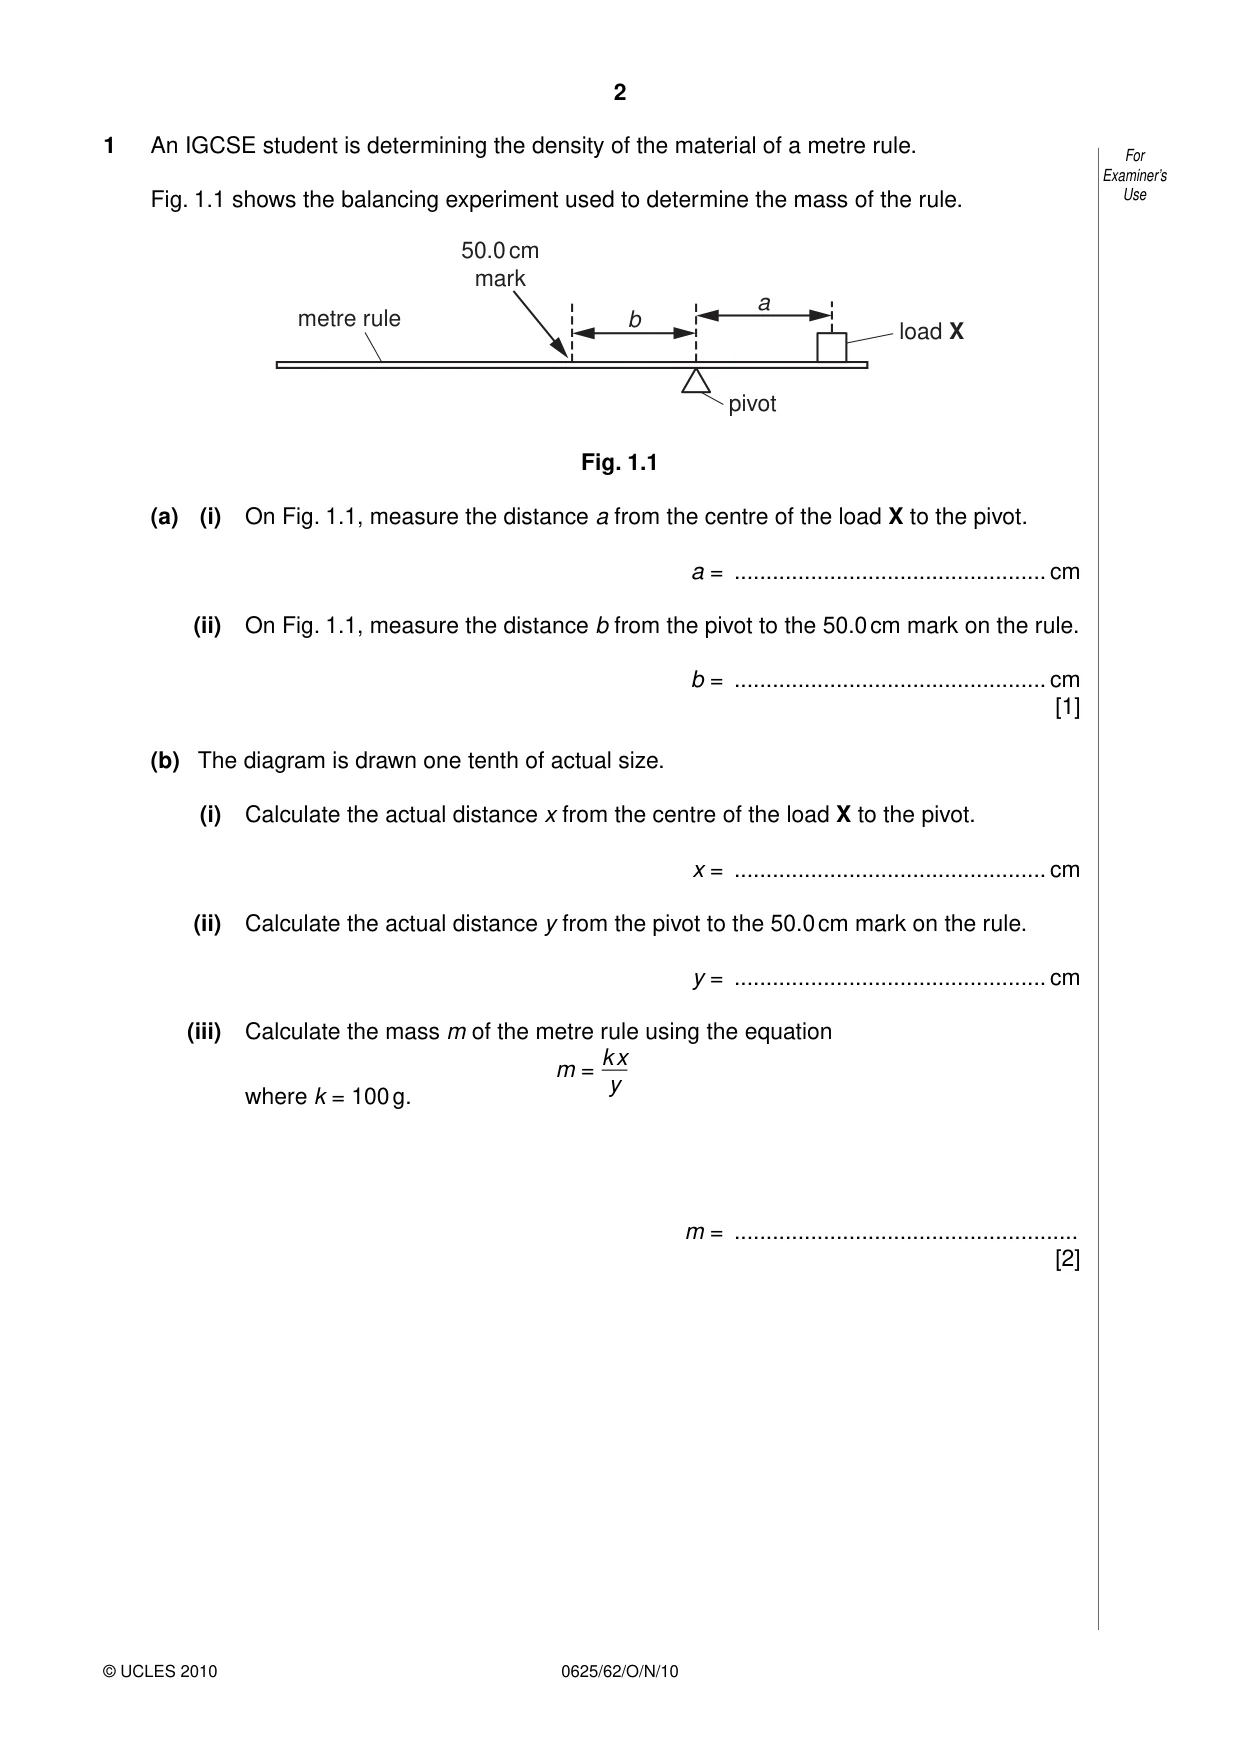
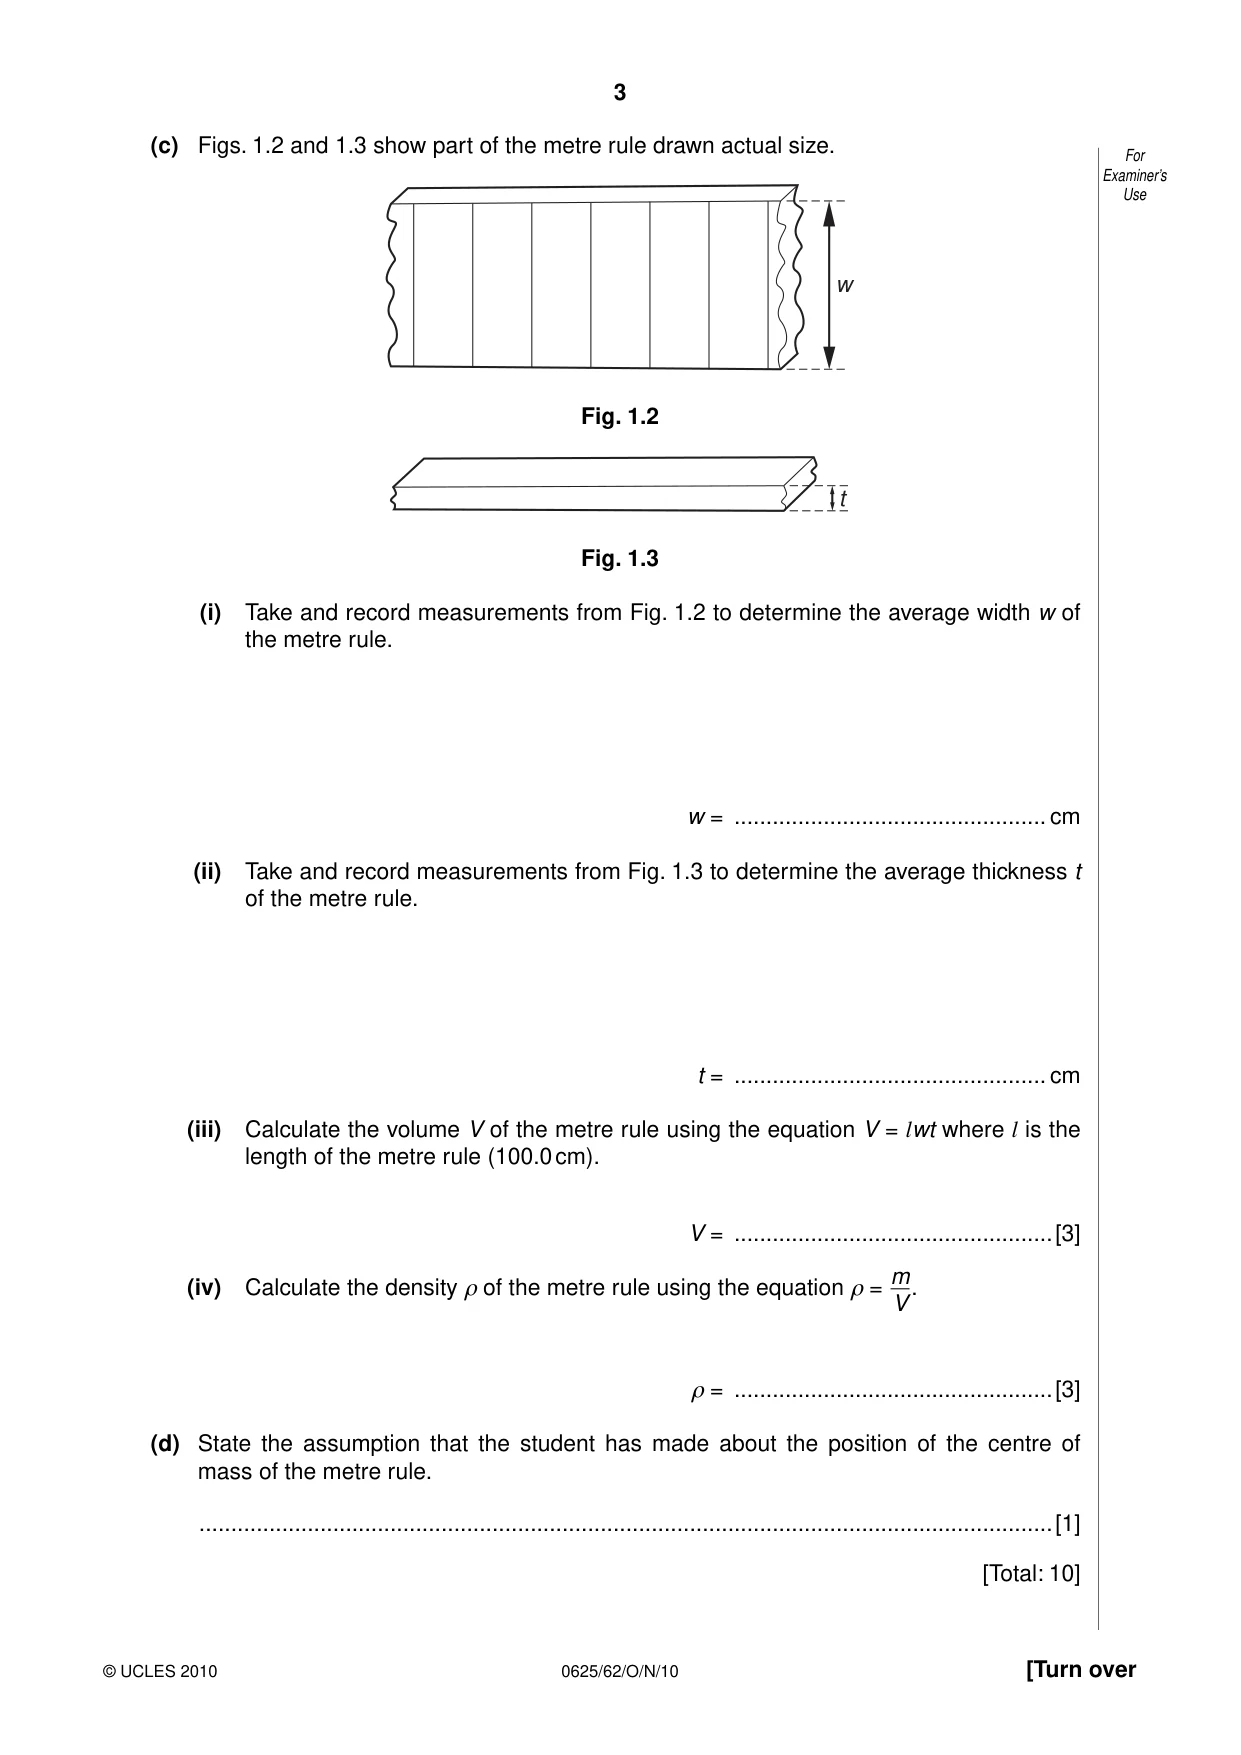
1 An IGCSE student is determining the density of the material of a metre rule. For Examiner’s Fig. 1.1 shows the balancing experiment used to determine the mass of the rule. Use 50.0 cm mark a metre rule b load X pivot Fig. 1.1 (a) (i) On Fig. 1.1, measure the distance a from the centre of the load X to the pivot. a = ................................................. cm (ii) On Fig. 1.1, measure the distance b from the pivot to the 50.0 cm mark on the rule. b = ................................................. cm [1] (b) The diagram is drawn one tenth of actual size. (i) Calculate the actual distance x from the centre of the load X to the pivot. x = ................................................. cm (ii) Calculate the actual distance y from the pivot to the 50.0 cm mark on the rule. y = ................................................. cm (iii) Calculate the mass m of the metre rule using the equation k x m = y where k = 100 g. m = ...................................................... [2] (c) Figs. 1.2 and 1.3 show part of the metre rule drawn actual size. For Examiner’s Use w Fig. 1.2 t Fig. 1.3 (i) Take and record measurements from Fig. 1.2 to determine the average width w of the metre rule. w = ................................................. cm (ii) Take and record measurements from Fig. 1.3 to determine the average thickness t of the metre rule. t = ................................................. cm (iii) Calculate the volume V of the metre rule using the equation V = lwt where l is the length of the metre rule (100.0 cm). V = ..................................................[3] m (iv) Calculate the density ρ of the metre rule using the equation ρ = . V ρ = ..................................................[3] (d) State the assumption that the student has made about the position of the centre of mass of the metre rule. ......................................................................................................................................[1] [Total: 10]
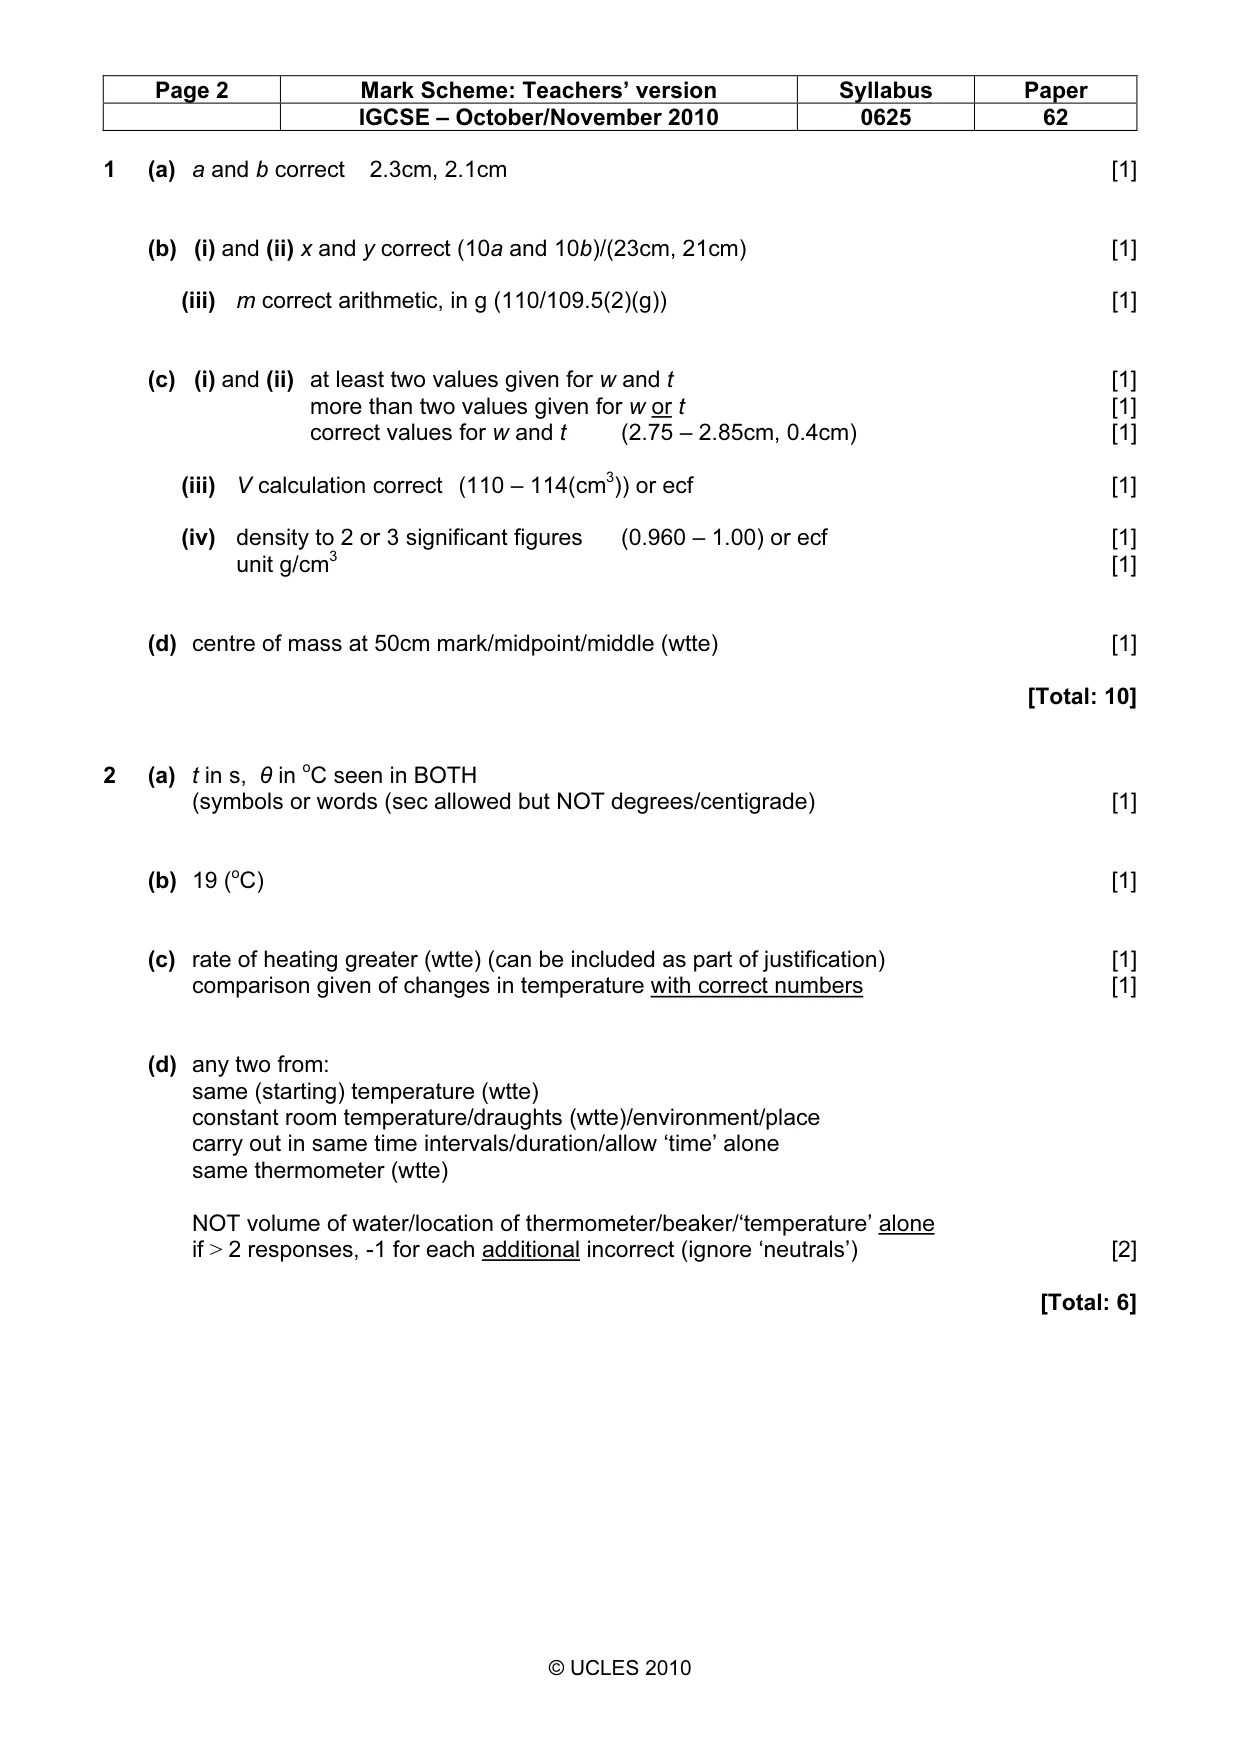
Mark scheme: 1 (a) a and b correct 2.3cm, 2.1cm [1] (b) (i) and (ii) x and y correct (10a and 10b)/(23cm, 21cm) [1] (iii) m correct arithmetic, in g (110/109.5(2)(g)) [1] (c) (i) and (ii) at least two values given for w and t [1] more than two values given for w or t [1] correct values for w and t (2.75 – 2.85cm, 0.4cm) [1] (iii) V calculation correct (110 – 114(cm3)) or ecf [1] (iv) density to 2 or 3 significant figures (0.960 – 1.00) or ecf [1] unit g/cm3 [1] (d) centre of mass at 50cm mark/midpoint/middle (wtte) [1] [Total: 10] o
Q2 · The IGCSE class is investigating the rate of cooling and the rate of heating of a…
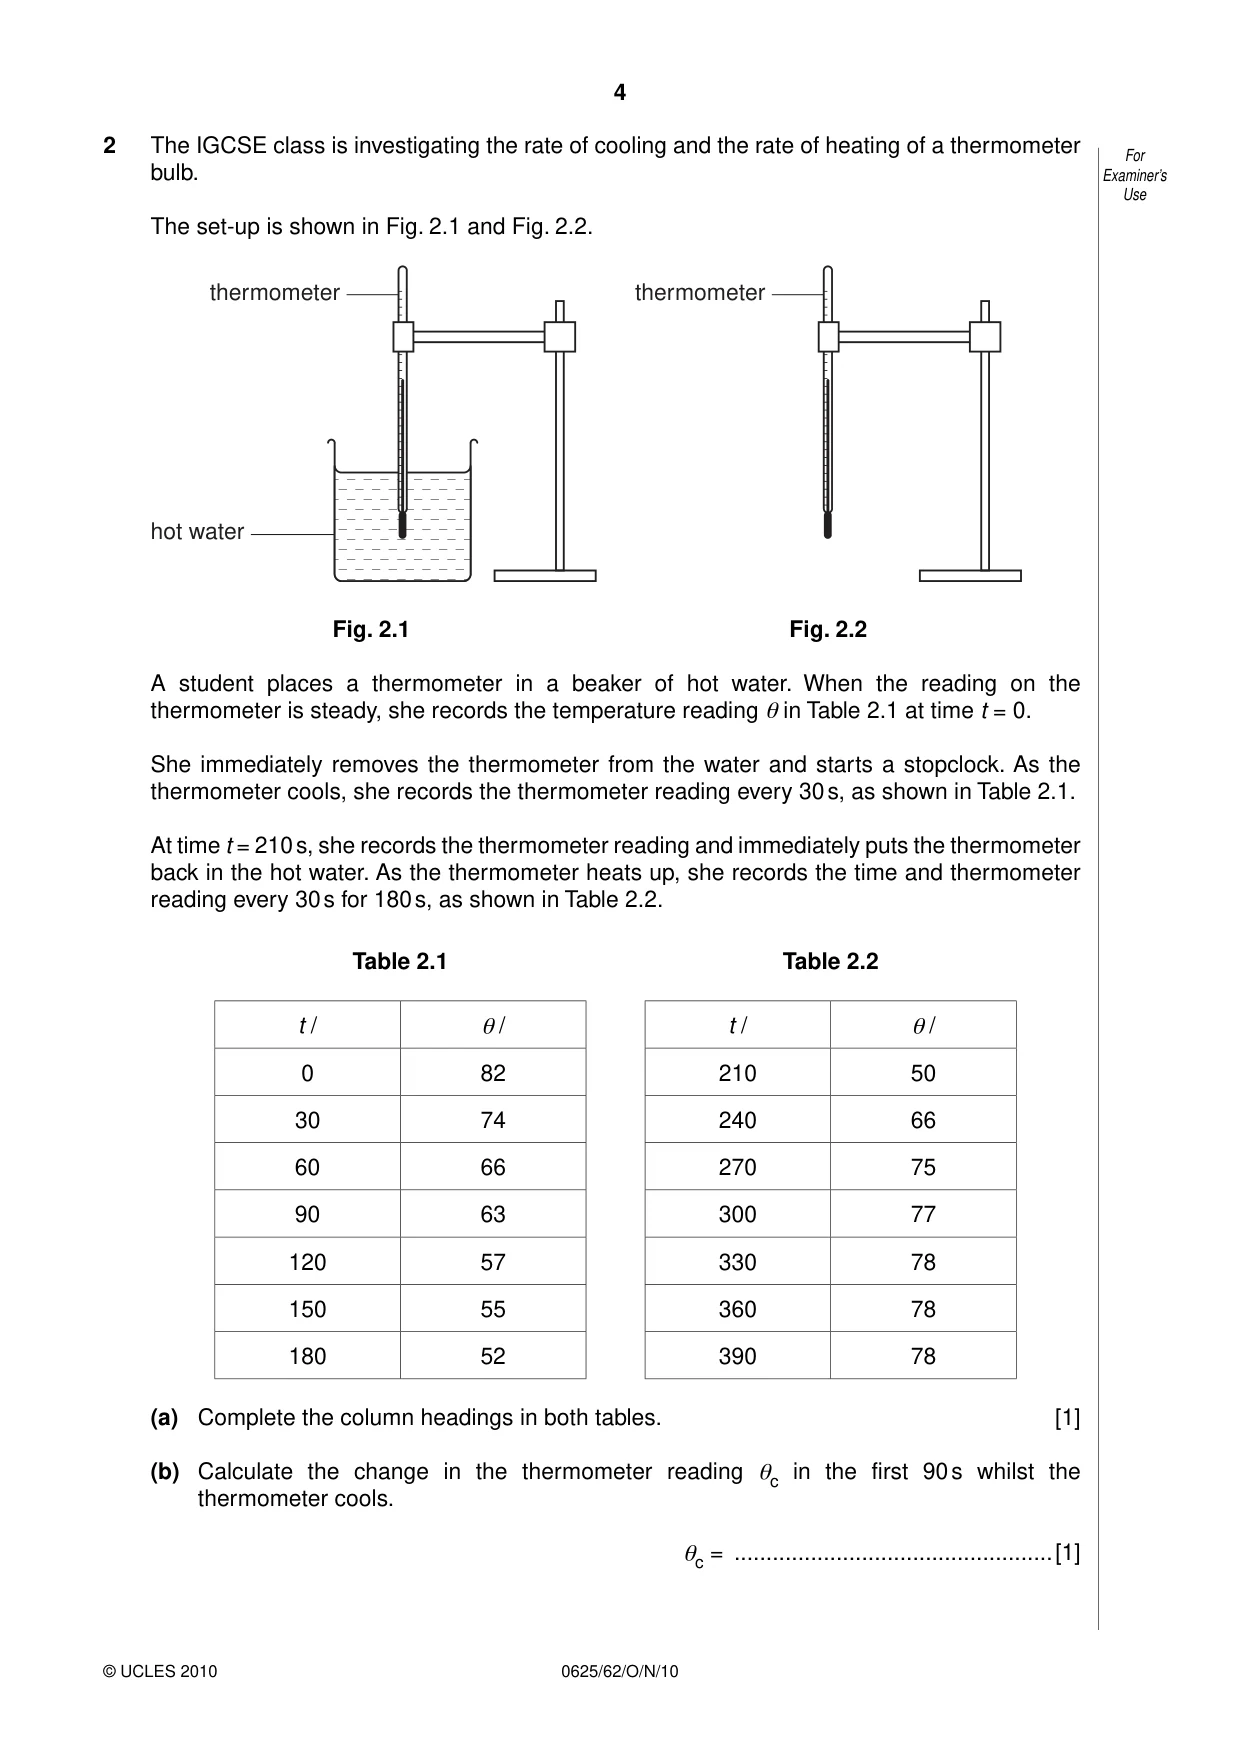
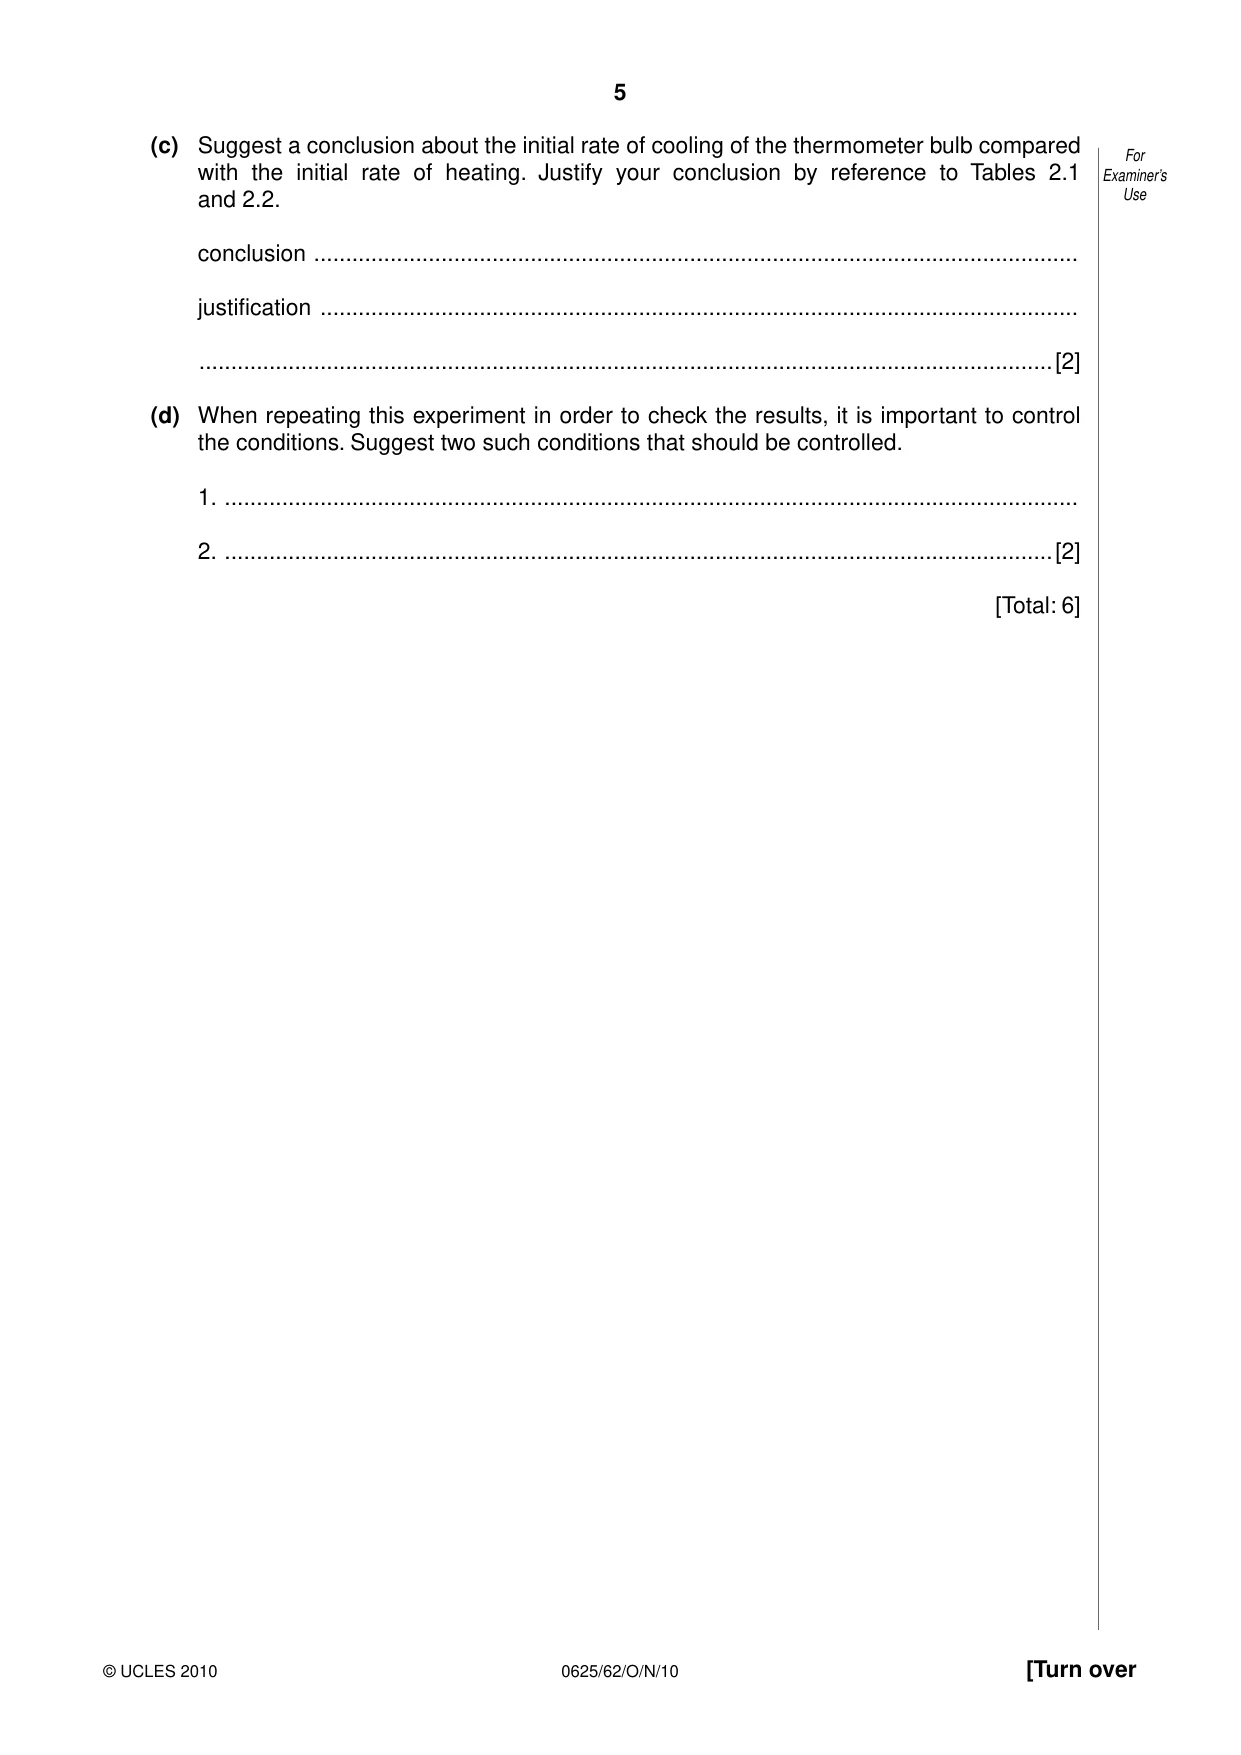
2 The IGCSE class is investigating the rate of cooling and the rate of heating of a thermometer For bulb. Examiner’s Use The set-up is shown in Fig. 2.1 and Fig. 2.2. thermometer thermometer hot water Fig. 2.1 Fig. 2.2 A student places a thermometer in a beaker of hot water. When the reading on the thermometer is steady, she records the temperature reading θ in Table 2.1 at time t = 0. She immediately removes the thermometer from the water and starts a stopclock. As the thermometer cools, she records the thermometer reading every 30 s, as shown in Table 2.1. At time t = 210 s, she records the thermometer reading and immediately puts the thermometer back in the hot water. As the thermometer heats up, she records the time and thermometer reading every 30 s for 180 s, as shown in Table 2.2. Table 2.1 Table 2.2 t / θ / t / θ / 0 82 210 50 30 74 240 66 60 66 270 75 90 63 300 77 120 57 330 78 150 55 360 78 180 52 390 78 (a) Complete the column headings in both tables. [1] (b) Calculate the change in the thermometer reading θc in the first 90 s whilst the thermometer cools. θc = ..................................................[1] (c) Suggest a conclusion about the initial rate of cooling of the thermometer bulb compared For with the initial rate of heating. Justify your conclusion by reference to Tables 2.1 Examiner’s and 2.2. Use conclusion ........................................................................................................................ justification ....................................................................................................................... ......................................................................................................................................[2] (d) When repeating this experiment in order to check the results, it is important to control the conditions. Suggest two such conditions that should be controlled. 1. ...................................................................................................................................... 2. ..................................................................................................................................[2] [Total: 6]
Mark scheme: 2 (a) t in s, θ in oC seen in BOTH (symbols or words (sec allowed but NOT degrees/centigrade) [1] (b) 19 (oC) [1] (c) rate of heating greater (wtte) (can be included as part of justification) [1] comparison given of changes in temperature with correct numbers [1] (d) any two from: same (starting) temperature (wtte) constant room temperature/draughts (wtte)/environment/place carry out in same time intervals/duration/allow ‘time’ alone same thermometer (wtte) NOT volume of water/location of thermometer/beaker/‘temperature’ alone if > 2 responses, -1 for each additional incorrect (ignore ‘neutrals’) [2] [Total: 6] IGCSE – October/November 2010 0625 62
Q3 · The IGCSE class is investigating the potential difference across a resistor
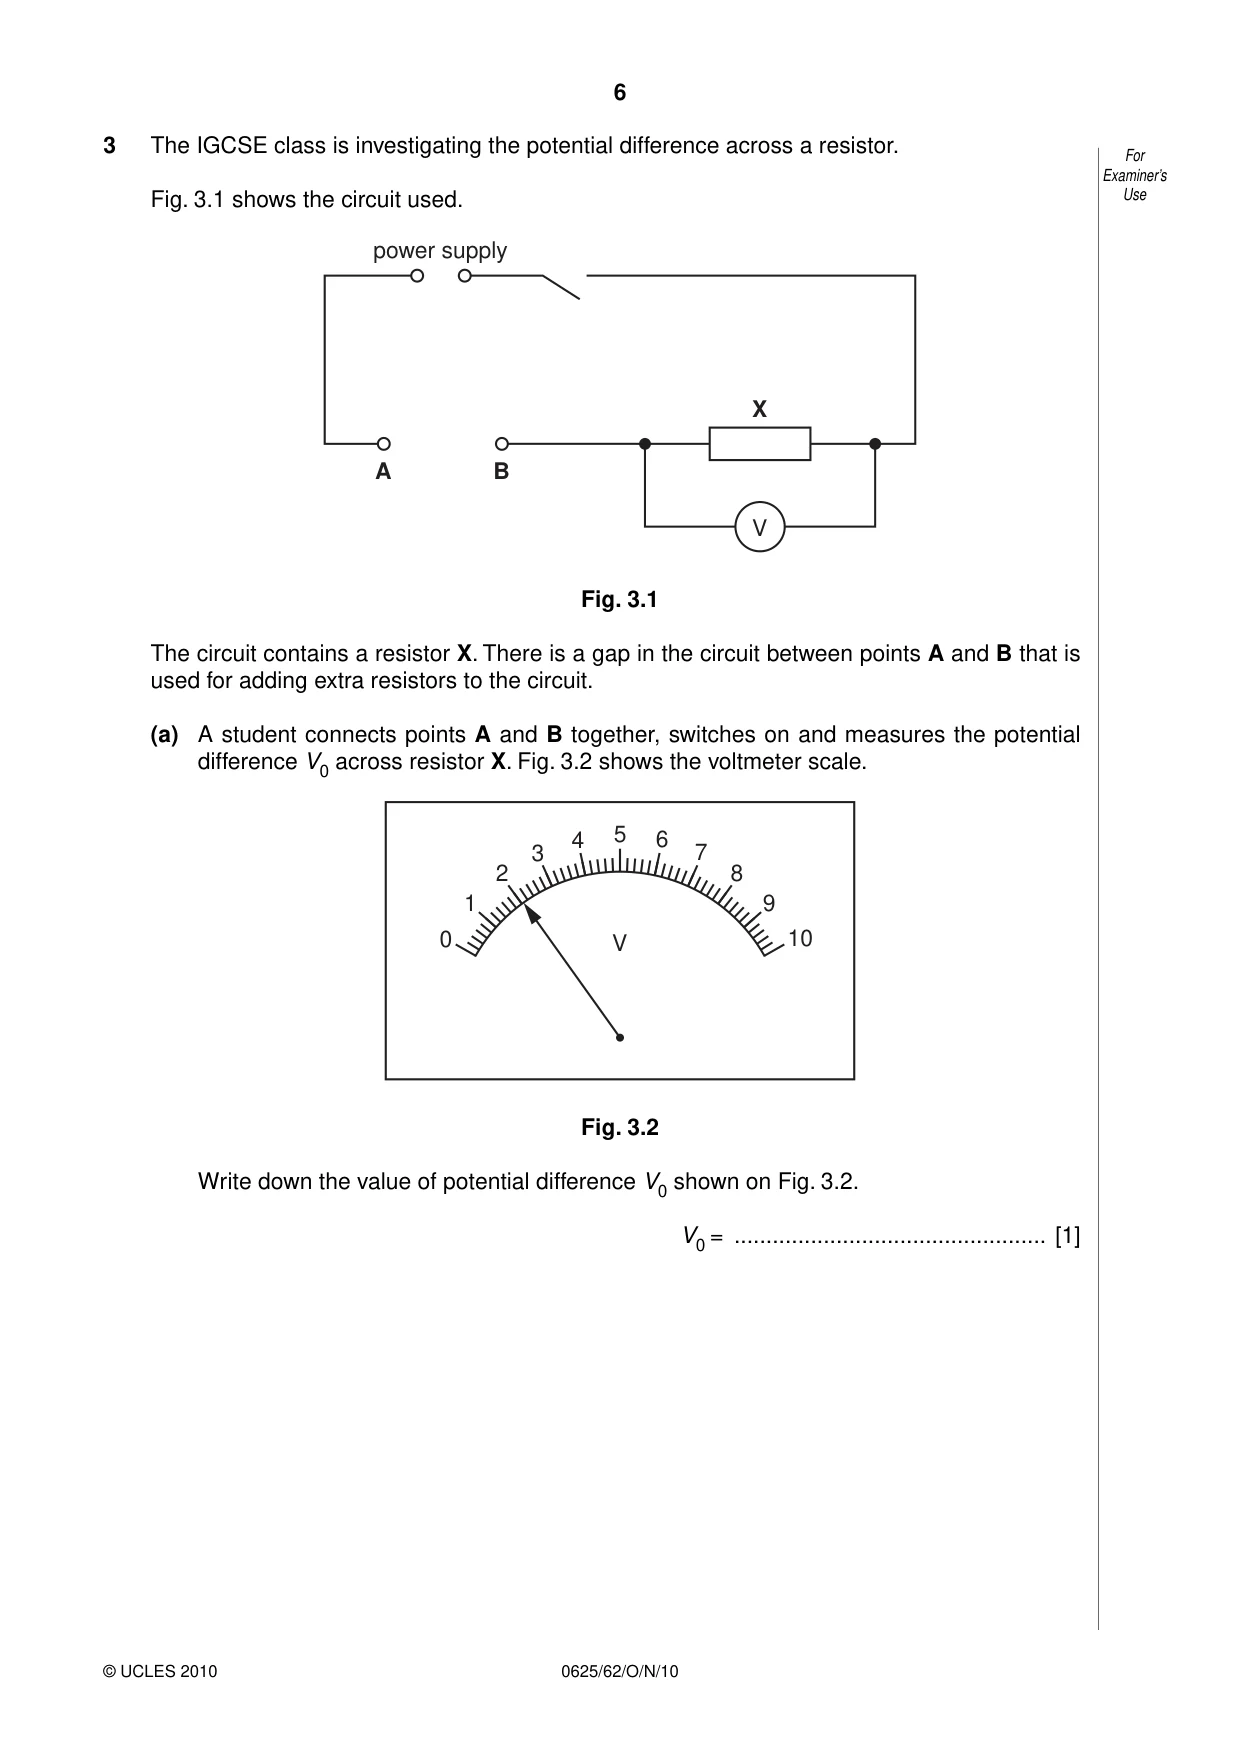
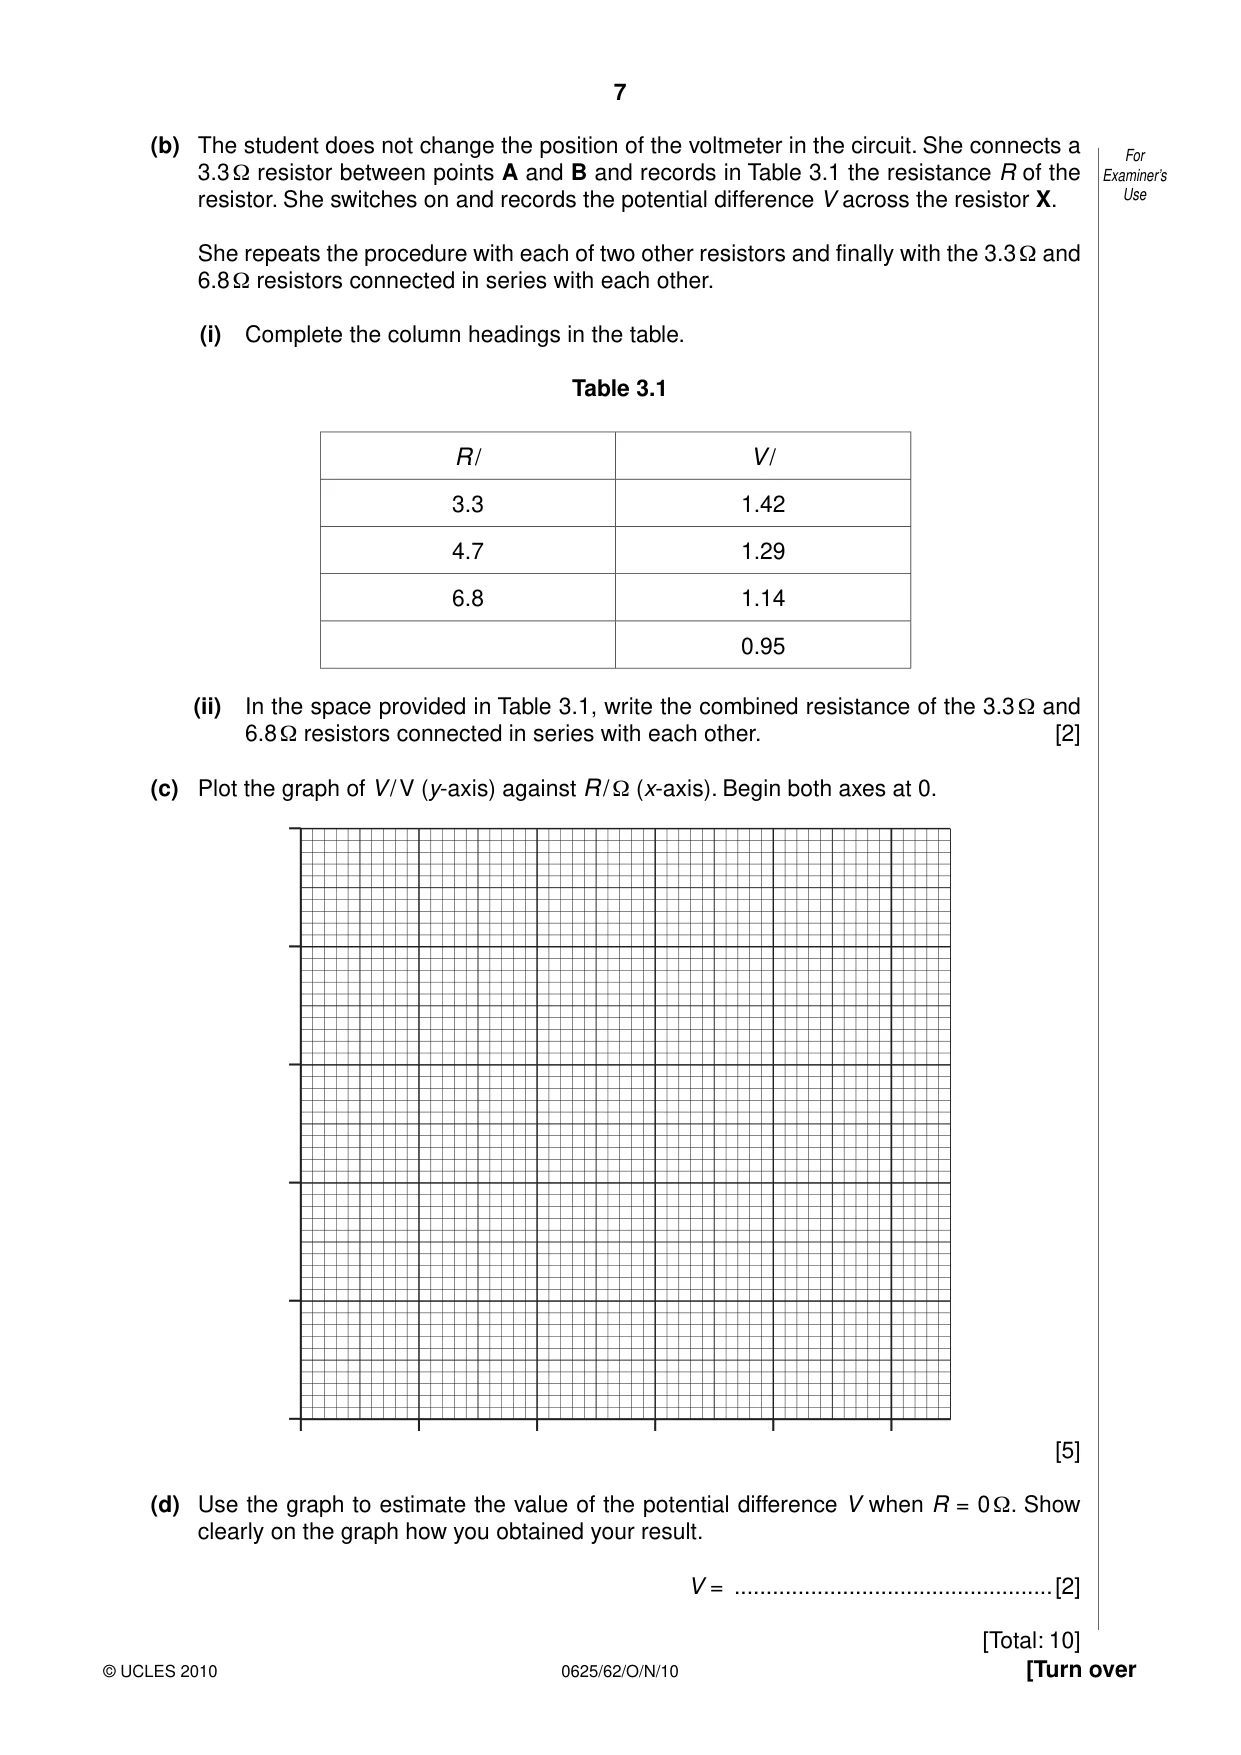
3 The IGCSE class is investigating the potential difference across a resistor. For Examiner’s Fig. 3.1 shows the circuit used. Use power supply X A B V Fig. 3.1 The circuit contains a resistor X. There is a gap in the circuit between points A and B that is used for adding extra resistors to the circuit. (a) A student connects points A and B together, switches on and measures the potential difference V0 across resistor X. Fig. 3.2 shows the voltmeter scale. 4 5 6 3 7 2 8 1 9 0 V 10 Fig. 3.2 Write down the value of potential difference V0 shown on Fig. 3.2. V0 = ................................................. [1] (b) The student does not change the position of the voltmeter in the circuit. She connects a For 3.3 Ω resistor between points A and B and records in Table 3.1 the resistance R of the Examiner’s resistor. She switches on and records the potential difference V across the resistor X. Use She repeats the procedure with each of two other resistors and finally with the 3.3 Ω and 6.8 Ω resistors connected in series with each other. (i) Complete the column headings in the table. Table 3.1 R / V / 3.3 1.42 4.7 1.29 6.8 1.14 0.95 (ii) In the space provided in Table 3.1, write the combined resistance of the 3.3 Ω and 6.8 Ω resistors connected in series with each other. [2] (c) Plot the graph of V / V (y-axis) against R / Ω (x-axis). Begin both axes at 0. [5] (d) Use the graph to estimate the value of the potential difference V when R = 0 Ω. Show clearly on the graph how you obtained your result. V = ..................................................[2] [Total: 10]
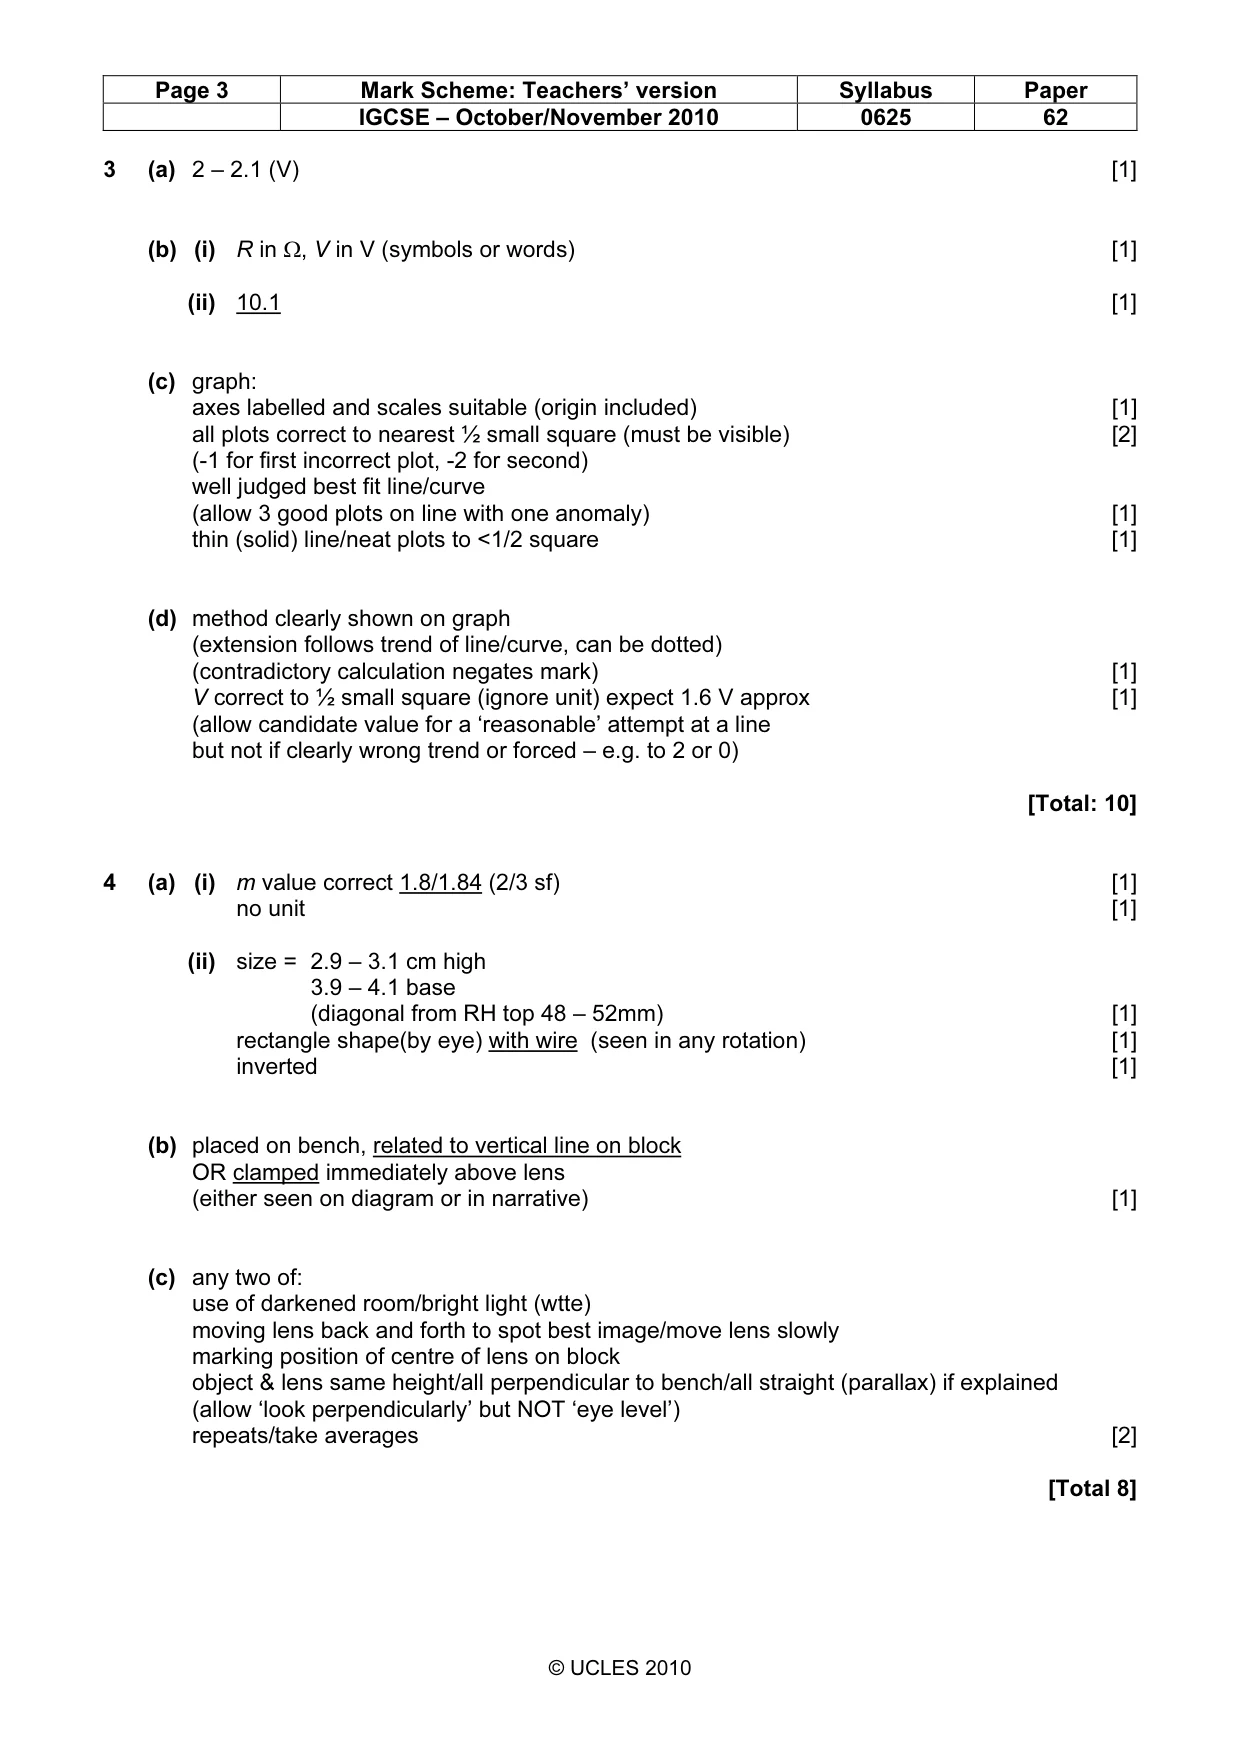
Mark scheme: 3 (a) 2 – 2.1 (V) [1] (b) (i) R in Ω, V in V (symbols or words) [1] (ii) 10.1 [1] (c) graph: axes labelled and scales suitable (origin included) [1] all plots correct to nearest ½ small square (must be visible) [2] (-1 for first incorrect plot, -2 for second) well judged best fit line/curve (allow 3 good plots on line with one anomaly) [1] thin (solid) line/neat plots to <1/2 square [1] (d) method clearly shown on graph (extension follows trend of line/curve, can be dotted) (contradictory calculation negates mark) [1] V correct to ½ small square (ignore unit) expect 1.6 V approx [1] (allow candidate value for a ‘reasonable’ attempt at a line but not if clearly wrong trend or forced – e.g. to 2 or 0) [Total: 10]
Q4 · An IGCSE student carries out a lens experiment to investigate the magnification of an…
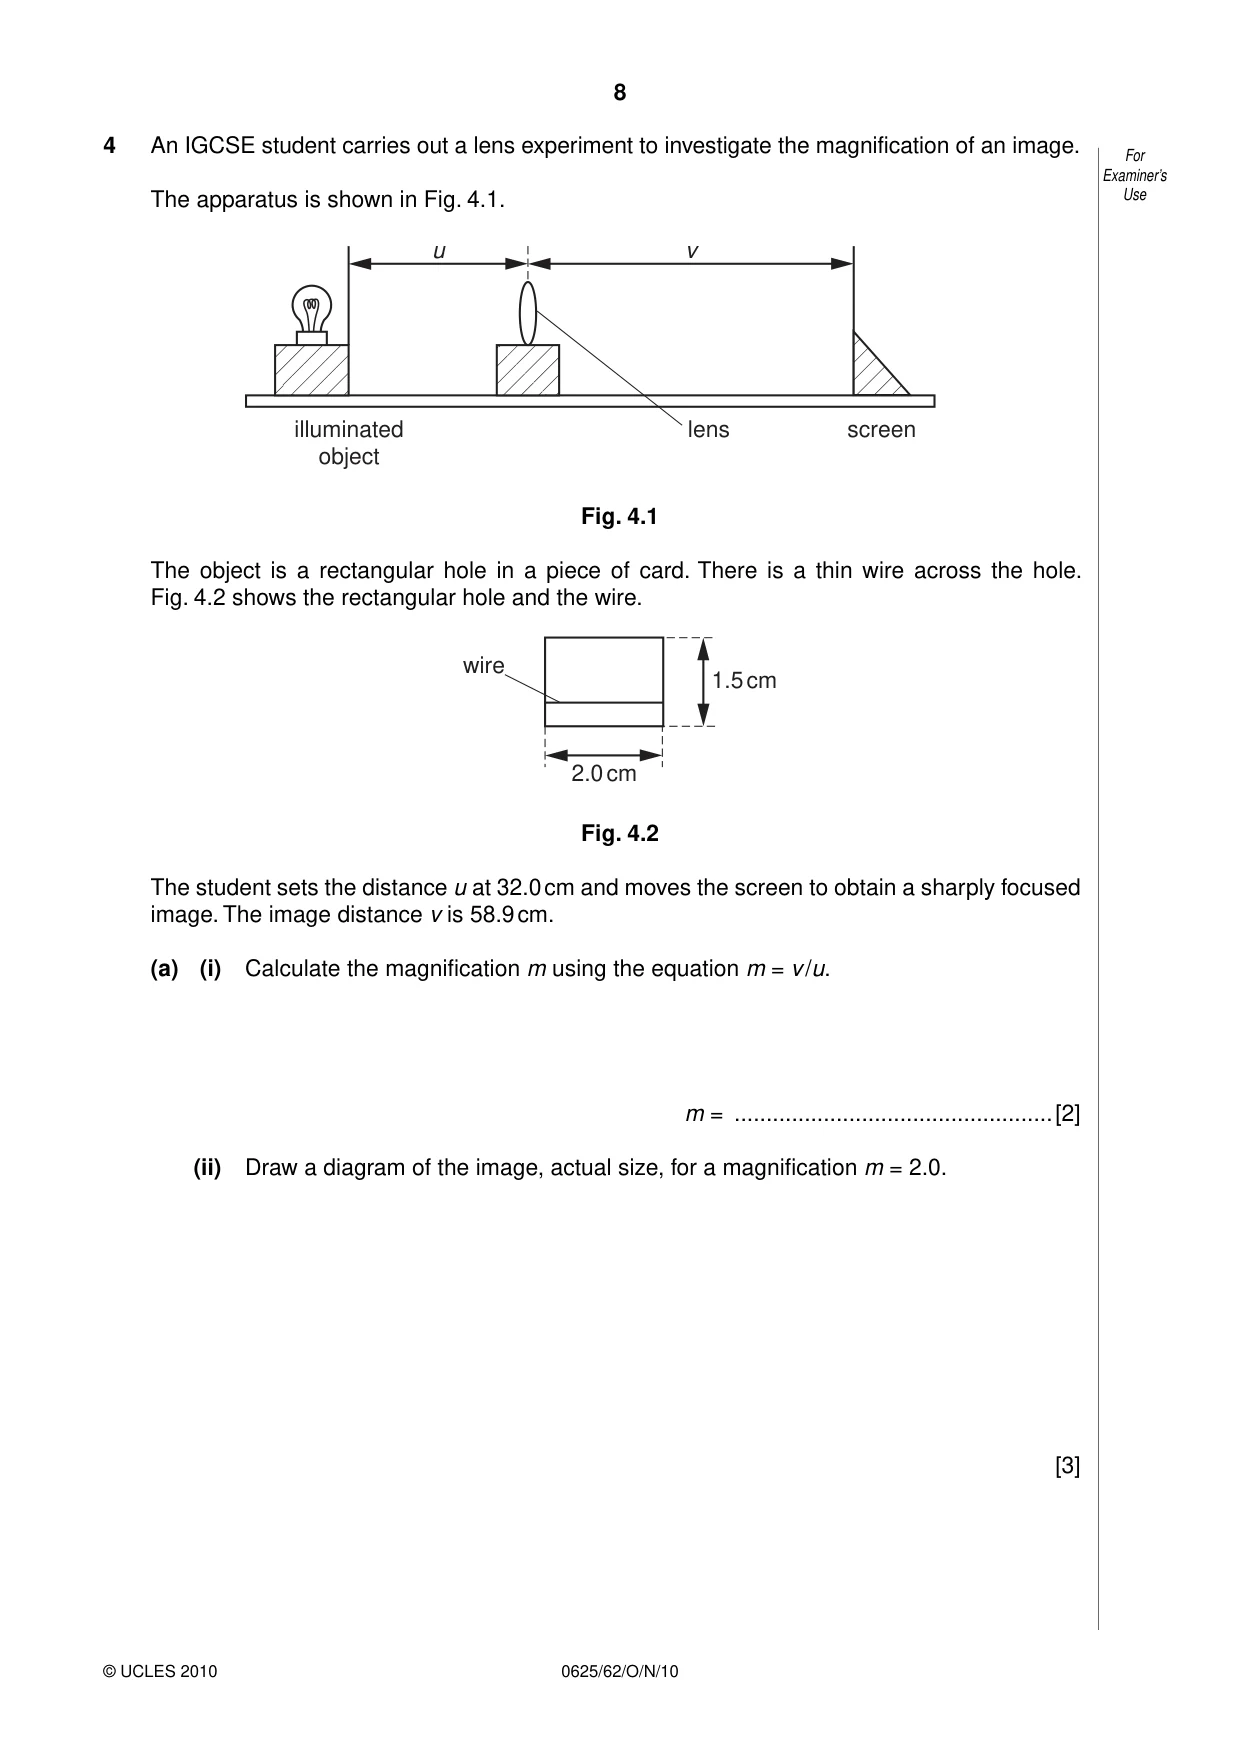
4 An IGCSE student carries out a lens experiment to investigate the magnification of an image. For Examiner’s The apparatus is shown in Fig. 4.1. Use u v illuminated lens screen object Fig. 4.1 The object is a rectangular hole in a piece of card. There is a thin wire across the hole. Fig. 4.2 shows the rectangular hole and the wire. wire 1.5 cm 2.0 cm Fig. 4.2 The student sets the distance u at 32.0 cm and moves the screen to obtain a sharply focused image. The image distance v is 58.9 cm. (a) (i) Calculate the magnification m using the equation m = v /u. m = ..................................................[2] (ii) Draw a diagram of the image, actual size, for a magnification m = 2.0. [3] (b) The object distance u is the distance from the object to the centre of the lens. For Examiner’s Explain briefly how you would position a metre rule to obtain an accurate value for u. Use You may draw a diagram. .......................................................................................................................................... .......................................................................................................................................... ......................................................................................................................................[1] (c) Suggest two precautions that you would take in this experiment in order to obtain reliable readings. 1. ...................................................................................................................................... 2. ..................................................................................................................................[2] [Total: 8]
Mark scheme: 4 (a) (i) m value correct 1.8/1.84 (2/3 sf) [1] no unit [1] (ii) size = 2.9 – 3.1 cm high 3.9 – 4.1 base (diagonal from RH top 48 – 52mm) [1] rectangle shape(by eye) with wire (seen in any rotation) [1] inverted [1] (b) placed on bench, related to vertical line on block OR clamped immediately above lens (either seen on diagram or in narrative) [1] (c) any two of: use of darkened room/bright light (wtte) moving lens back and forth to spot best image/move lens slowly marking position of centre of lens on block object & lens same height/all perpendicular to bench/all straight (parallax) if explained (allow ‘look perpendicularly’ but NOT ‘eye level’) repeats/take averages [2] [Total 8] IGCSE – October/November 2010 0625 62
Q5 · The IGCSE class is investigating the rate at which salt dissolves in water
5 The IGCSE class is investigating the rate at which salt dissolves in water. For Examiner’s Each student is able to use Use glass beakers, a thermometer, a stopclock, a measuring cylinder, an electronic balance, a supply of salt, a supply of cold water, a stirrer, a method of heating the water and any other common laboratory apparatus that may be useful. A student decides to investigate the effect of temperature on the rate at which salt dissolves in water by observing the time taken for small amounts of salt to dissolve in water at different temperatures. (a) Suggest three possible variables that should be kept constant in this investigation. 1. ...................................................................................................................................... 2. ...................................................................................................................................... 3. ..................................................................................................................................[3] (b) In the table below, write the names of three items of apparatus that are necessary in order to take the readings in this investigation. In the second column of the table write the quantity that the item measures. item of apparatus quantity measured [3] [Total: 6]
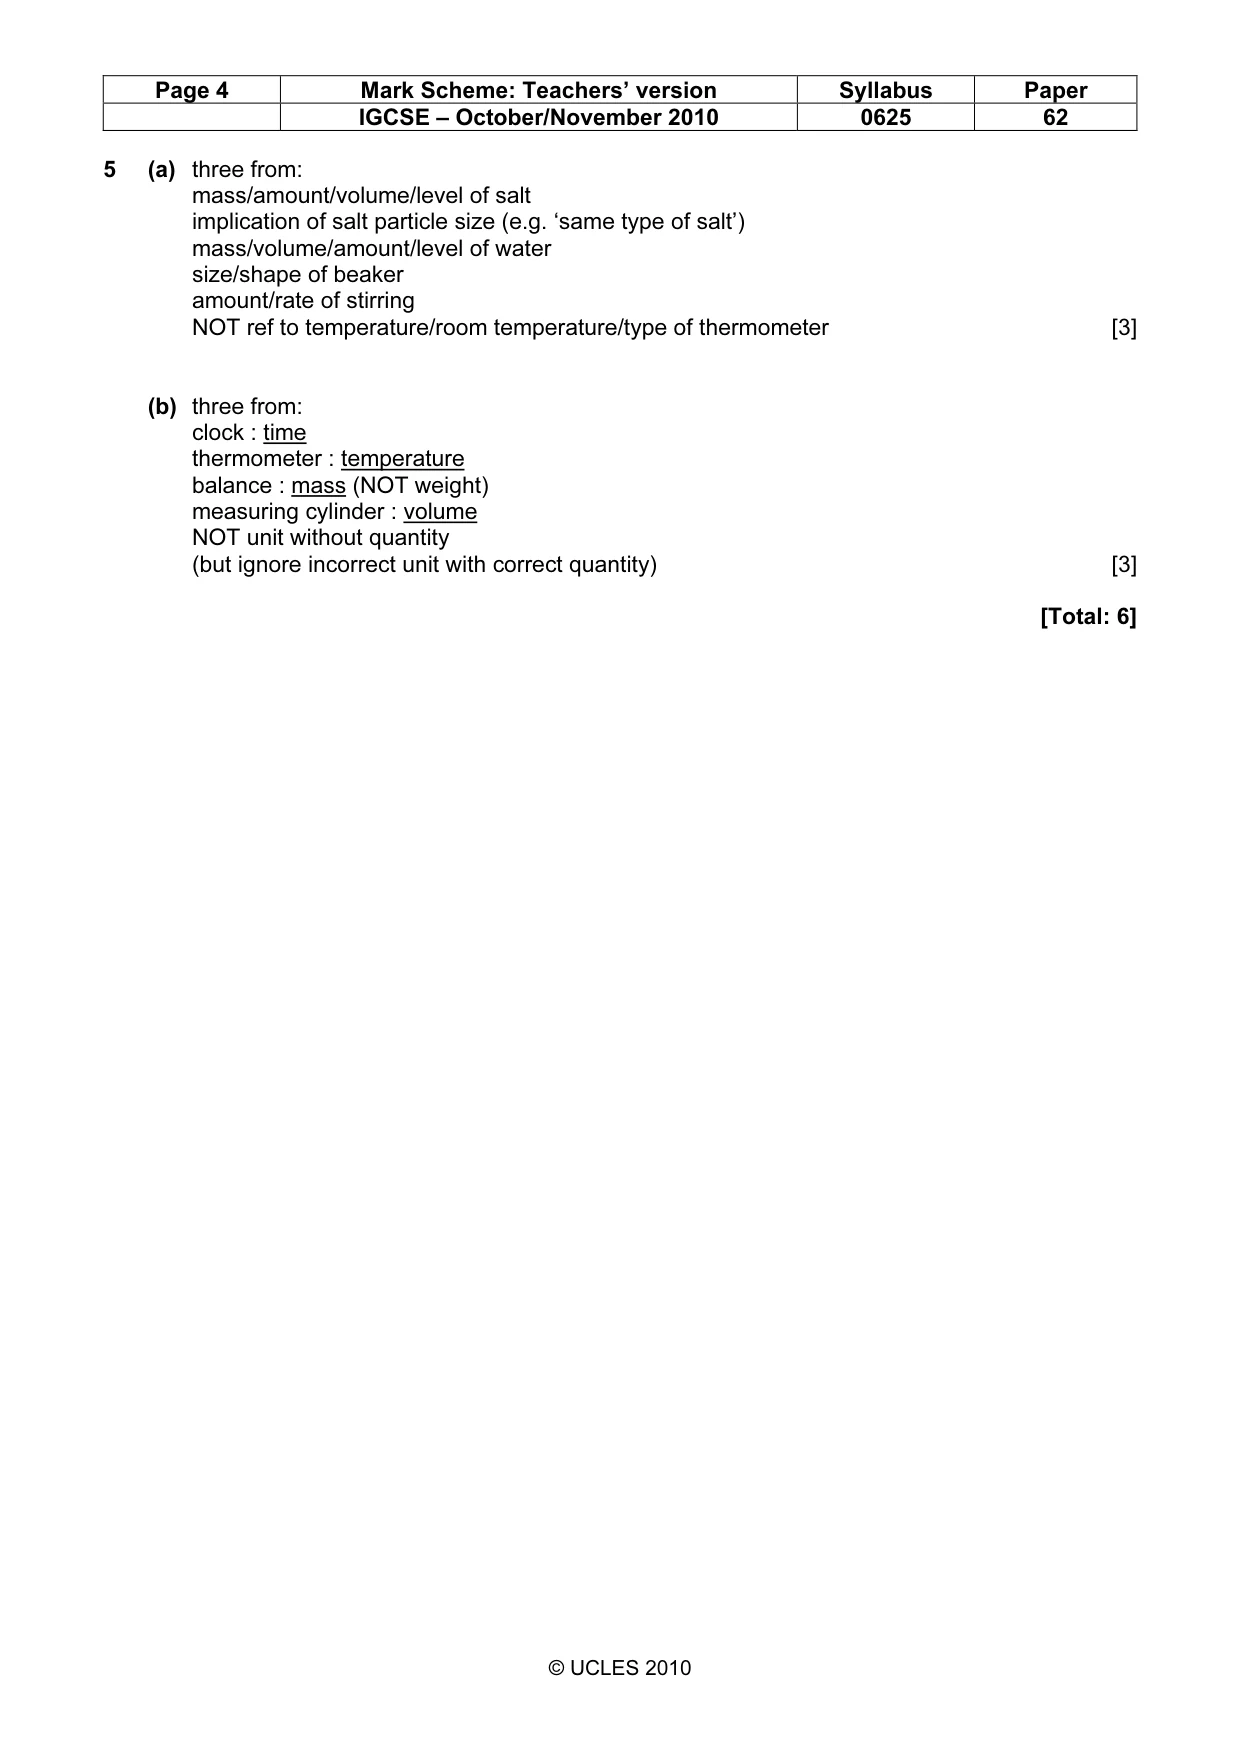
Mark scheme: 5 (a) three from: mass/amount/volume/level of salt implication of salt particle size (e.g. ‘same type of salt’) mass/volume/amount/level of water size/shape of beaker amount/rate of stirring NOT ref to temperature/room temperature/type of thermometer [3] (b) three from: clock : time thermometer : temperature balance : mass (NOT weight) measuring cylinder : volume NOT unit without quantity (but ignore incorrect unit with correct quantity) [3] [Total: 6]
What was in this paper
The subtopics covered by these 5 questions, and how many questions each got. Open one in a new tab to see every Cambridge question on it.
What you needed in this session
Cambridge’s own grade thresholds for 2010 Oct/Nov, Paper 6 · Variant 2. A higher threshold means an easier paper — the bar moves with how the cohort did.