Cambridge IGCSE Physical Science 0652 — 2024 Oct/Nov Paper 5 · Variant 1
0652/51/O/N/24 · 4 questions · 40 marks · ≈45 min
The question paper and its mark scheme, free to read here and free to download. This is Cambridge’s own paper, exactly as it was sat.
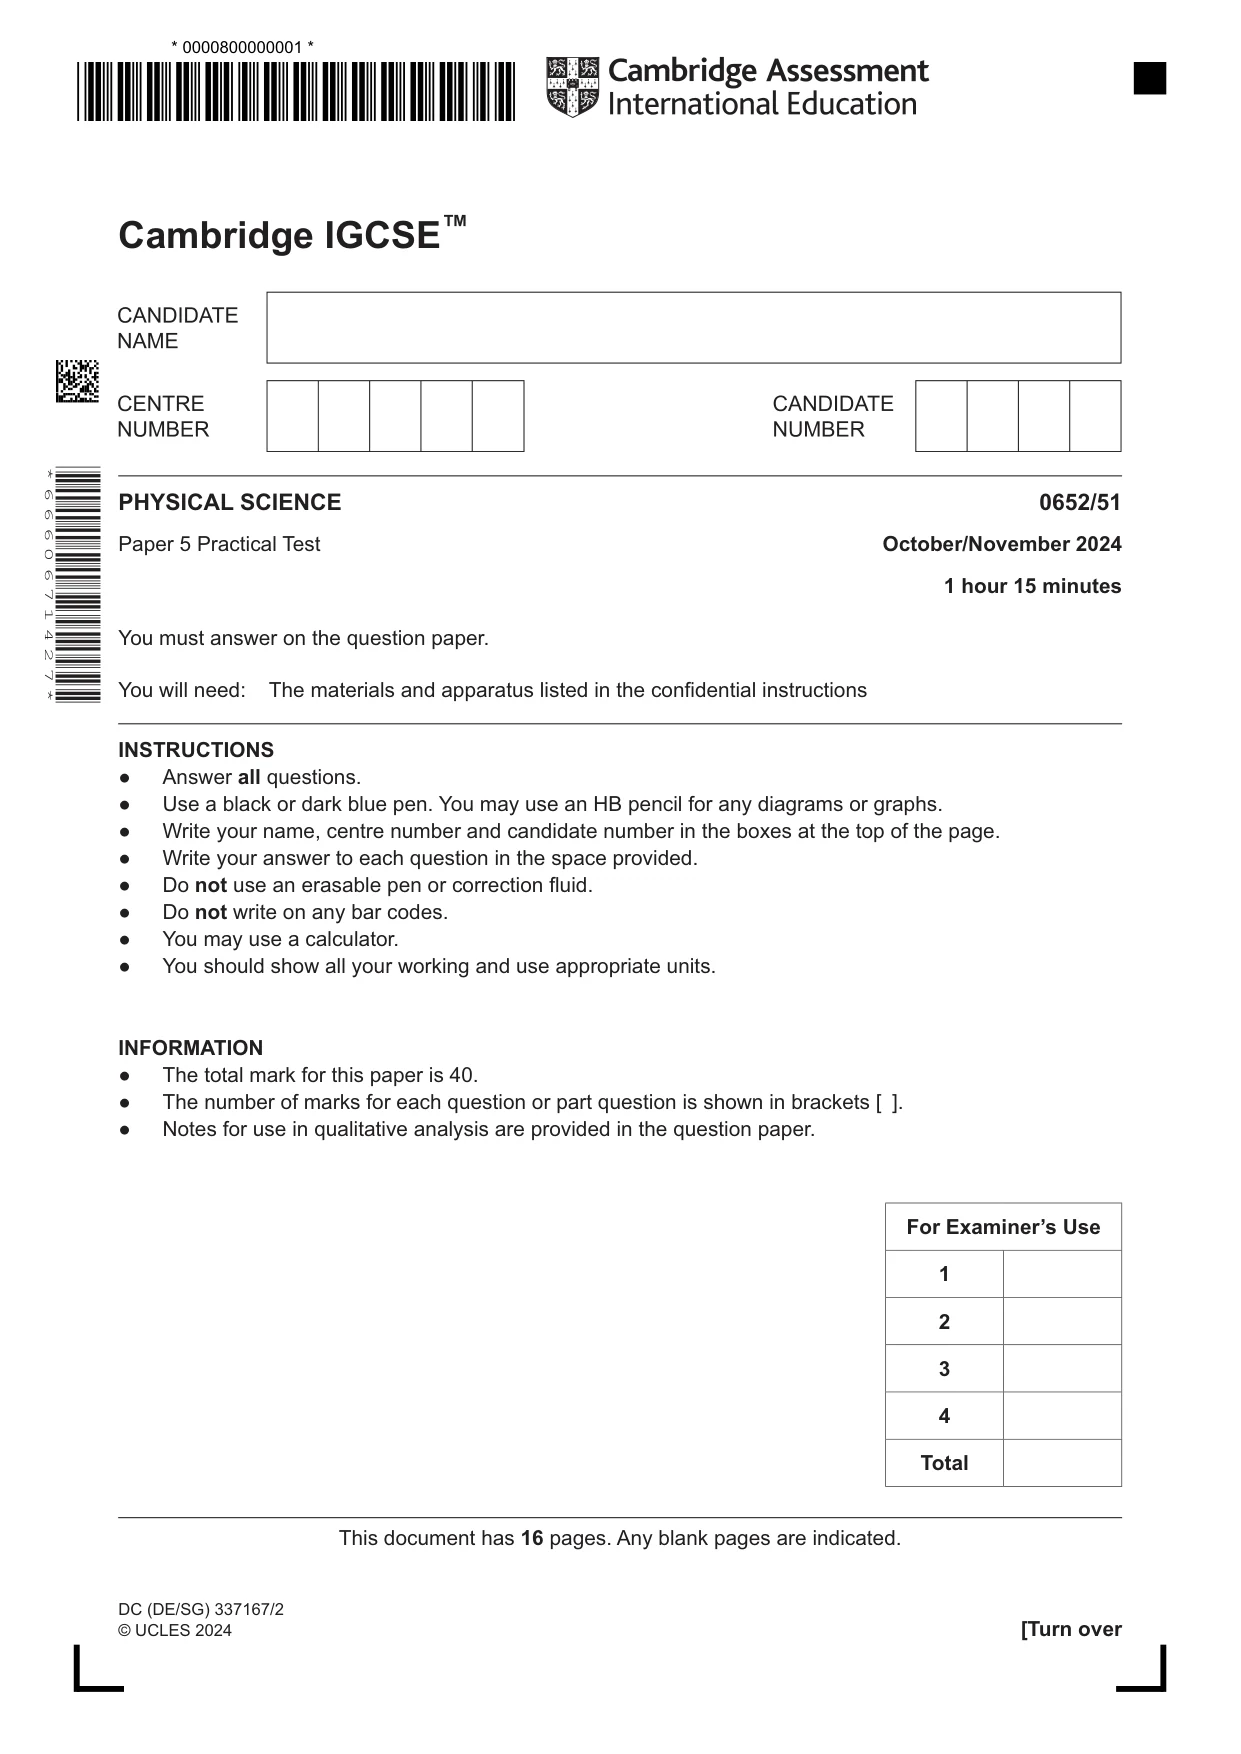
Question paper16 pages





Mark scheme7 pages
Answers below. Sit the paper first if you are practising.
Questions as text
Q1 · You are going to investigate the neutralisation of the alkali aqueous sodium hydroxide by…
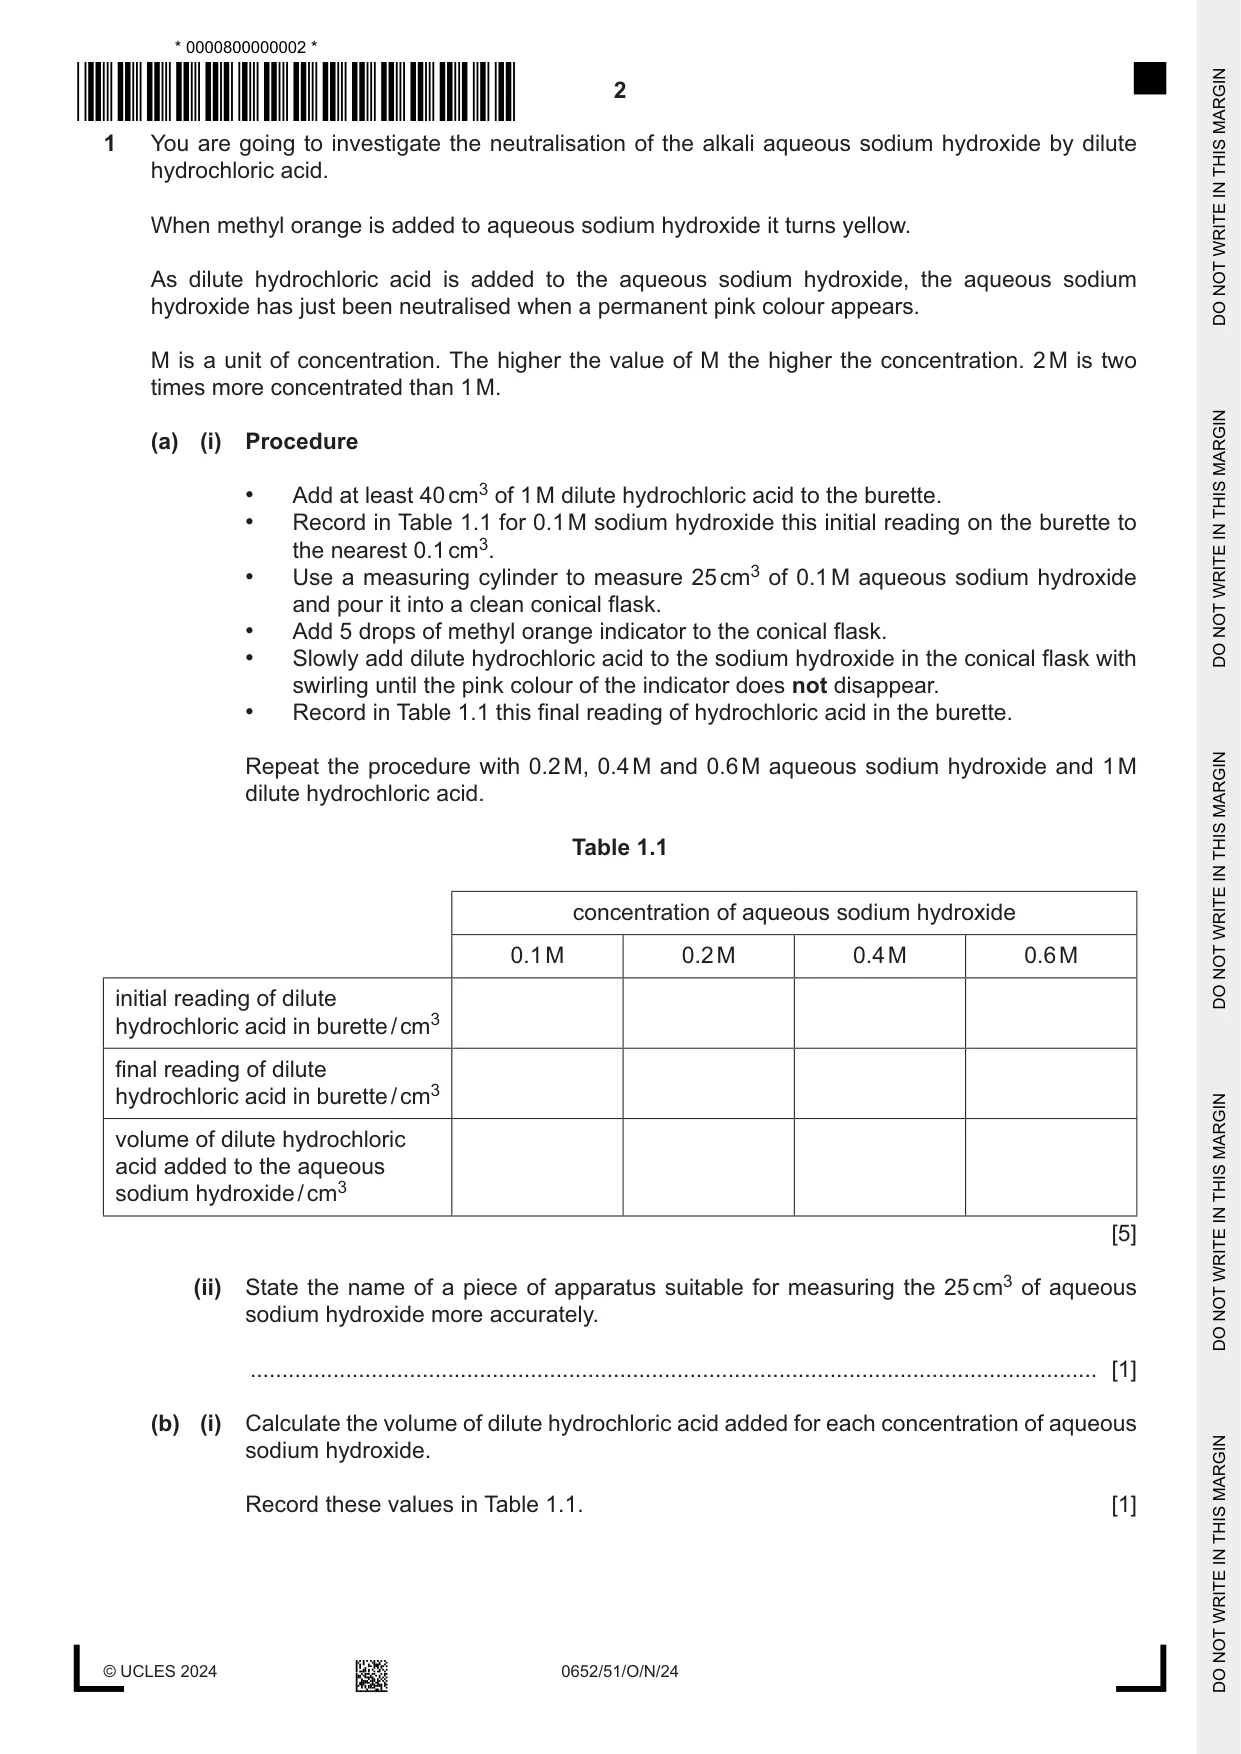
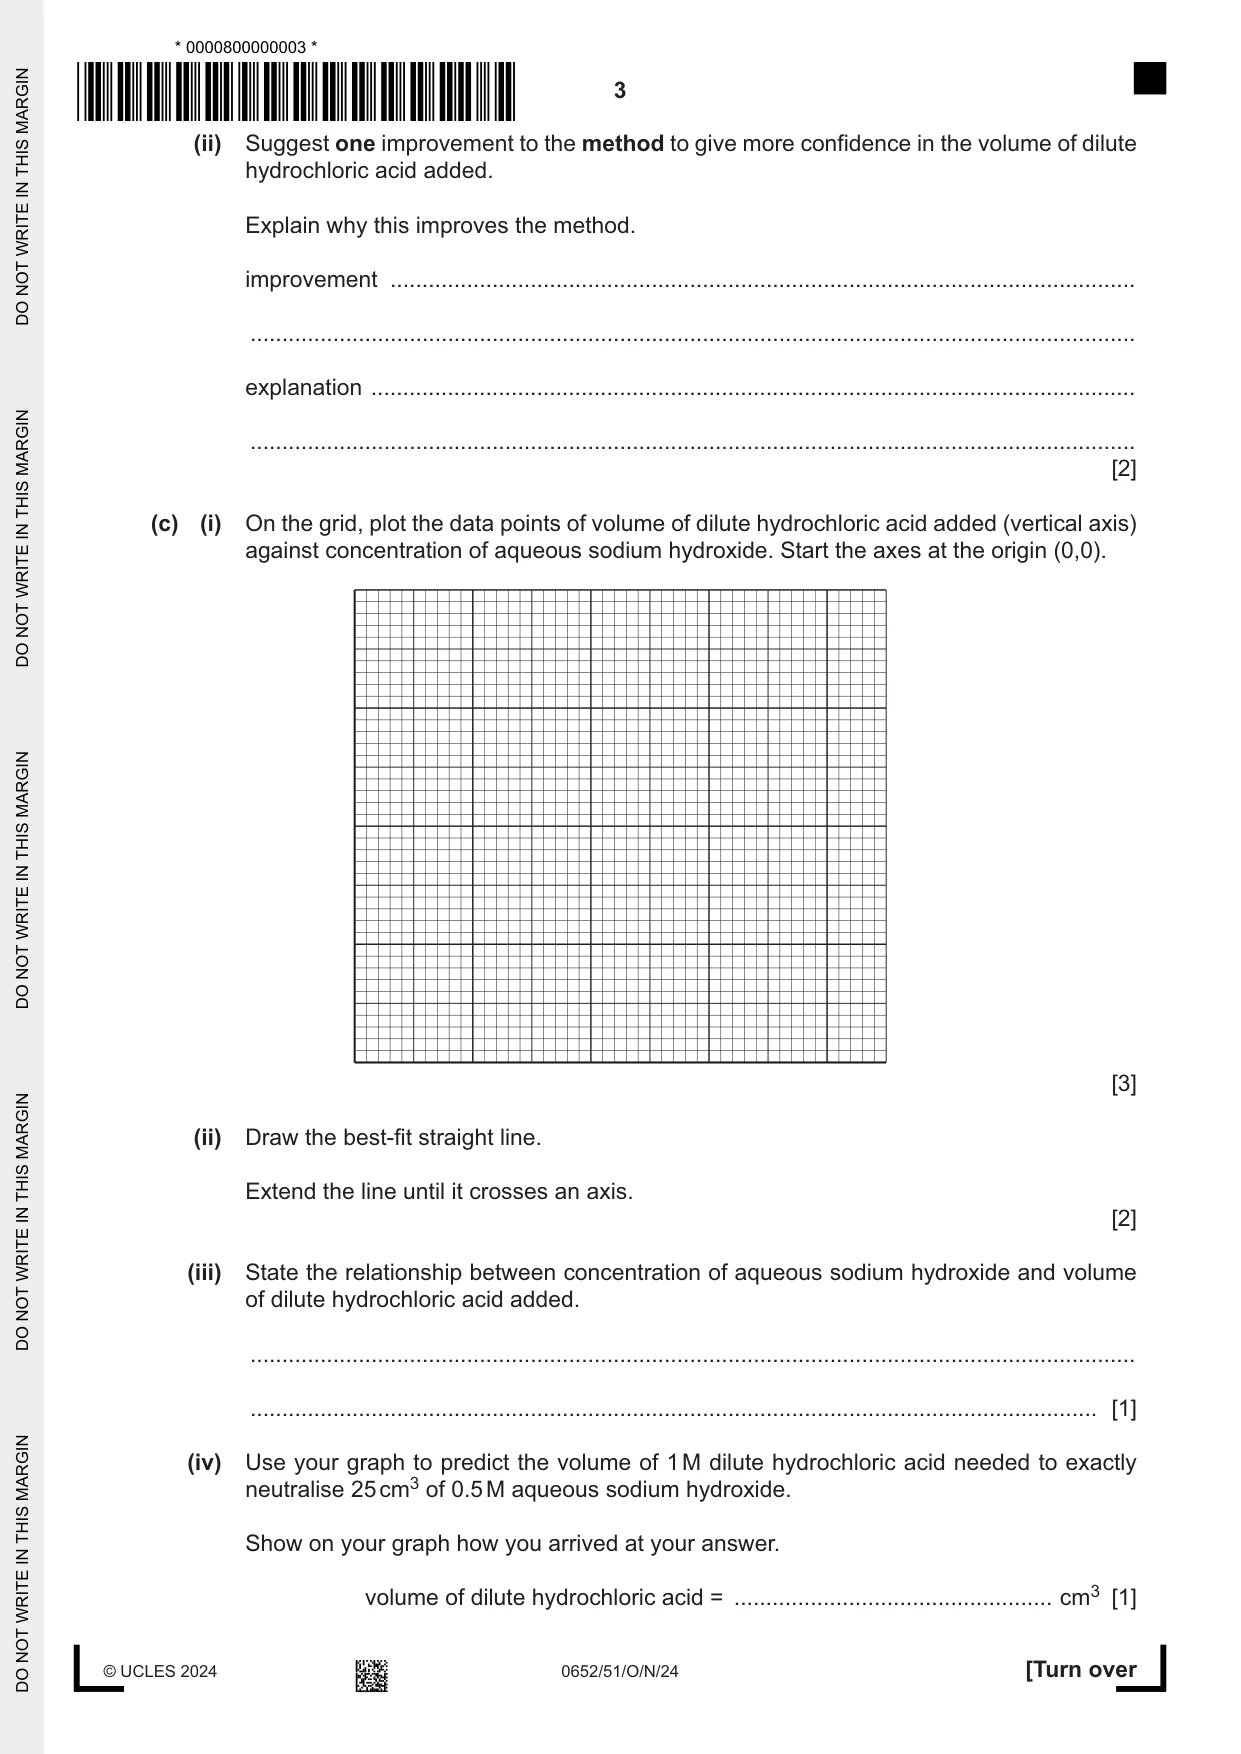
1 You are going to investigate the neutralisation of the alkali aqueous sodium hydroxide by dilute hydrochloric acid. When methyl orange is added to aqueous sodium hydroxide it turns yellow. As dilute hydrochloric acid is added to the aqueous sodium hydroxide, the aqueous sodium hydroxide has just been neutralised when a permanent pink colour appears. M is a unit of concentration. The higher the value of M the higher the concentration. 2 M is two times more concentrated than 1 M. (a) (i) Procedure • Add at least 40 cm3 of 1 M dilute hydrochloric acid to the burette. • Record in Table 1.1 for 0.1 M sodium hydroxide this initial reading on the burette to the nearest 0.1 cm3. • Use a measuring cylinder to measure 25 cm3 of 0.1 M aqueous sodium hydroxide and pour it into a clean conical flask. • Add 5 drops of methyl orange indicator to the conical flask. • Slowly add dilute hydrochloric acid to the sodium hydroxide in the conical flask with swirling until the pink colour of the indicator does not disappear. • Record in Table 1.1 this final reading of hydrochloric acid in the burette. Repeat the procedure with 0.2 M, 0.4 M and 0.6 M aqueous sodium hydroxide and 1 M dilute hydrochloric acid. Table 1.1 concentration of aqueous sodium hydroxide 0.1 M 0.2 M 0.4 M 0.6 M initial reading of dilute hydrochloric acid in burette / cm3 final reading of dilute hydrochloric acid in burette / cm3 volume of dilute hydrochloric acid added to the aqueous sodium hydroxide / cm3 [5] (ii) State the name of a piece of apparatus suitable for measuring the 25 cm3 of aqueous sodium hydroxide more accurately. ..................................................................................................................................... [1] (b) (i) Calculate the volume of dilute hydrochloric acid added for each concentration of aqueous sodium hydroxide. Record these values in Table 1.1. [1] (ii) Suggest one improvement to the method to give more confidence in the volume of dilute hydrochloric acid added. Explain why this improves the method. improvement ..................................................................................................................... ........................................................................................................................................... explanation ........................................................................................................................ ........................................................................................................................................... [2] (c) (i) On the grid, plot the data points of volume of dilute hydrochloric acid added (vertical axis) against concentration of aqueous sodium hydroxide. Start the axes at the origin (0,0). [3] (ii) Draw the best-fit straight line. Extend the line until it crosses an axis. [2] (iii) State the relationship between concentration of aqueous sodium hydroxide and volume of dilute hydrochloric acid added. ........................................................................................................................................... ..................................................................................................................................... [1] (iv) Use your graph to predict the volume of 1 M dilute hydrochloric acid needed to exactly neutralise 25 cm3 of 0.5 M aqueous sodium hydroxide. Show on your graph how you arrived at your answer. volume of dilute hydrochloric acid = .................................................. cm3 [1] (v) A student repeats your experiment but uses 2 M dilute hydrochloric acid in the burette instead of 1 M dilute hydrochloric acid. Draw a line on the grid to show the results the student gets. Label this line E. [2] [Total: 18]
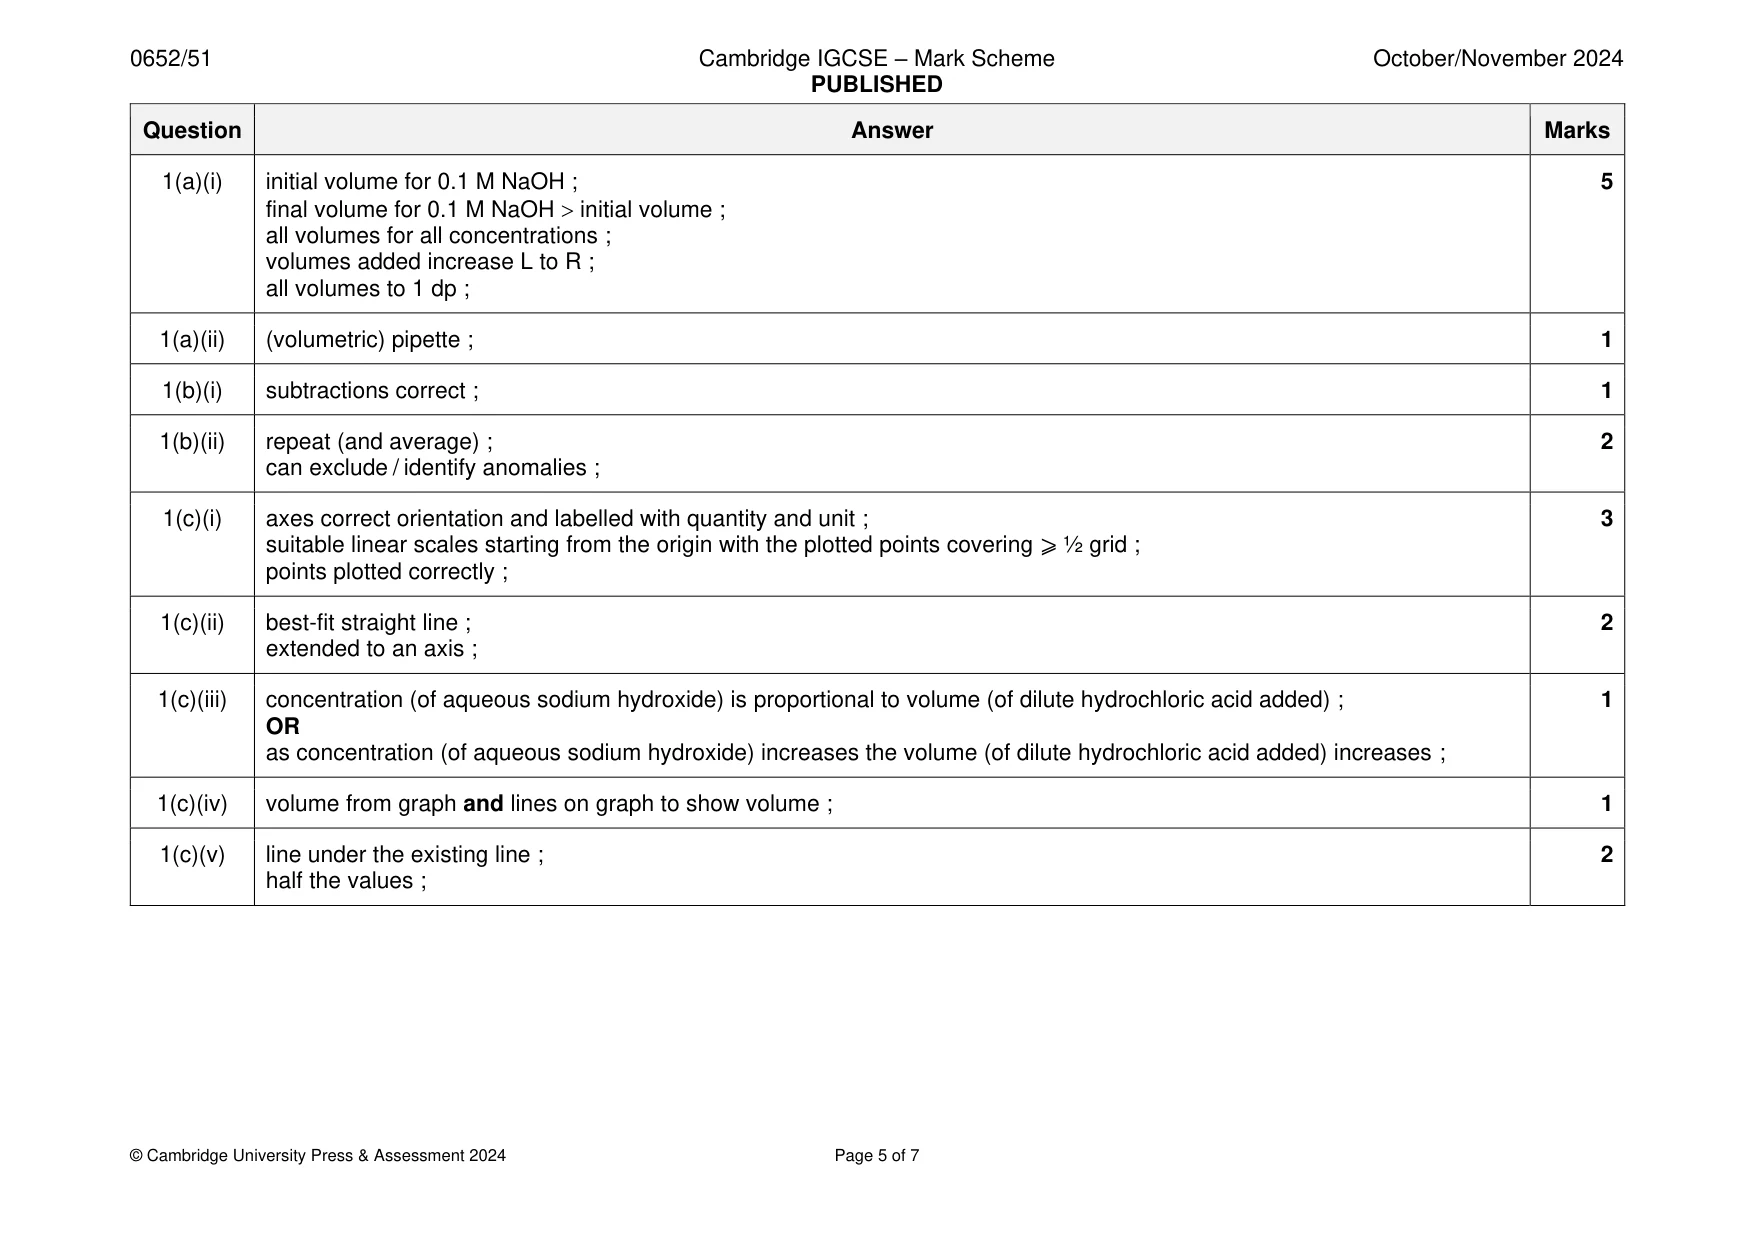
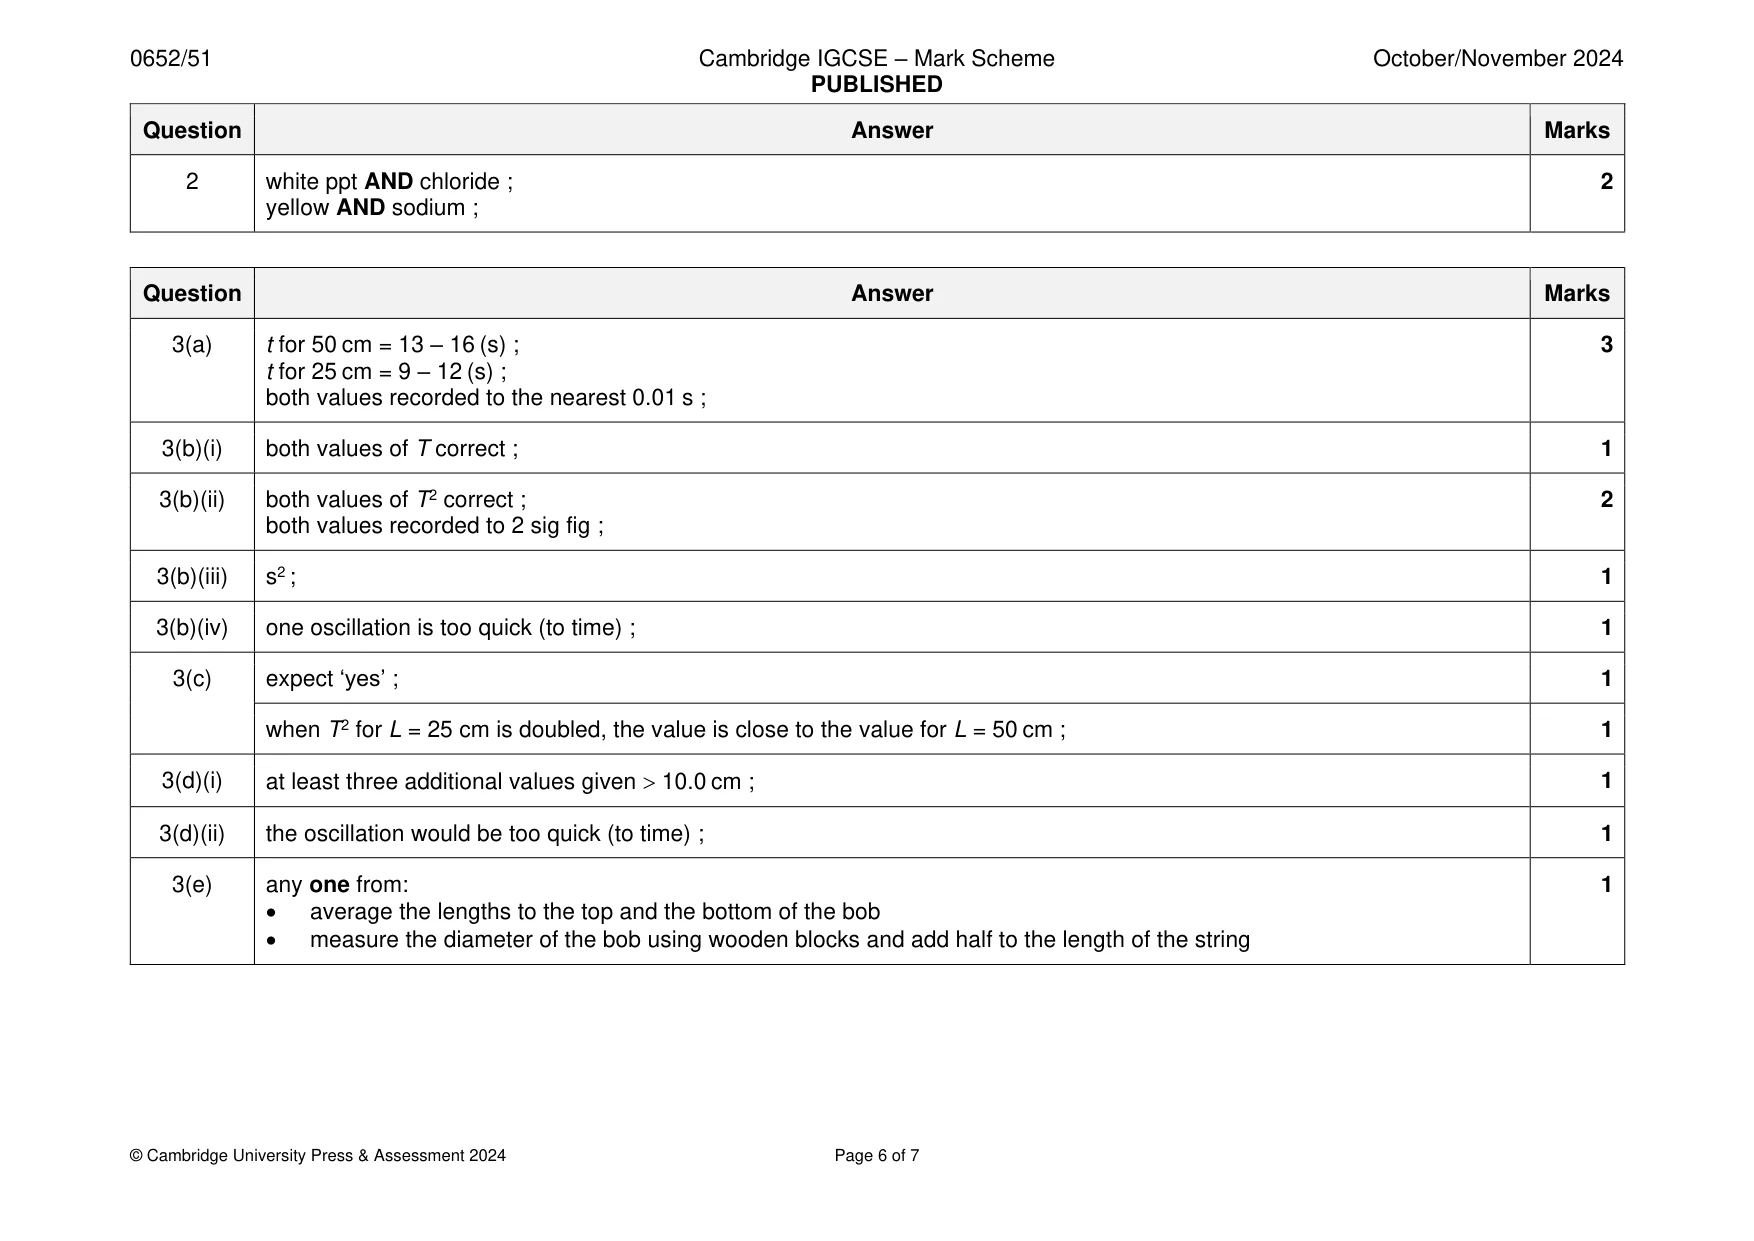
Mark scheme: Question Answer Marks 1(a)(i) initial volume for 0.1 M NaOH ; 5 final volume for 0.1 M NaOH initial volume ; all volumes for all concentrations ; volumes added increase L to R ; all volumes to 1 dp ; 1(a)(ii) (volumetric) pipette ; 1 1(b)(i) subtractions correct ; 1 1(b)(ii) repeat (and average) ; 2 can exclude / identify anomalies ; 1(c)(i) axes correct orientation and labelled with quantity and unit ; 3 suitable linear scales starting from the origin with the plotted points covering ⩾ ½ grid ; points plotted correctly ; 1(c)(ii) best-fit straight line ; 2 extended to an axis ; 1(c)(iii) concentration (of aqueous sodium hydroxide) is proportional to volume (of dilute hydrochloric acid added) ; 1 OR as concentration (of aqueous sodium hydroxide) increases the volume (of dilute hydrochloric acid added) increases ; 1(c)(iv) volume from graph and lines on graph to show volume ; 1 1(c)(v) line under the existing line ; 2 half the values ;
Q2 · You are going to investigate the solution made when dilute hydrochloric acid exactly…
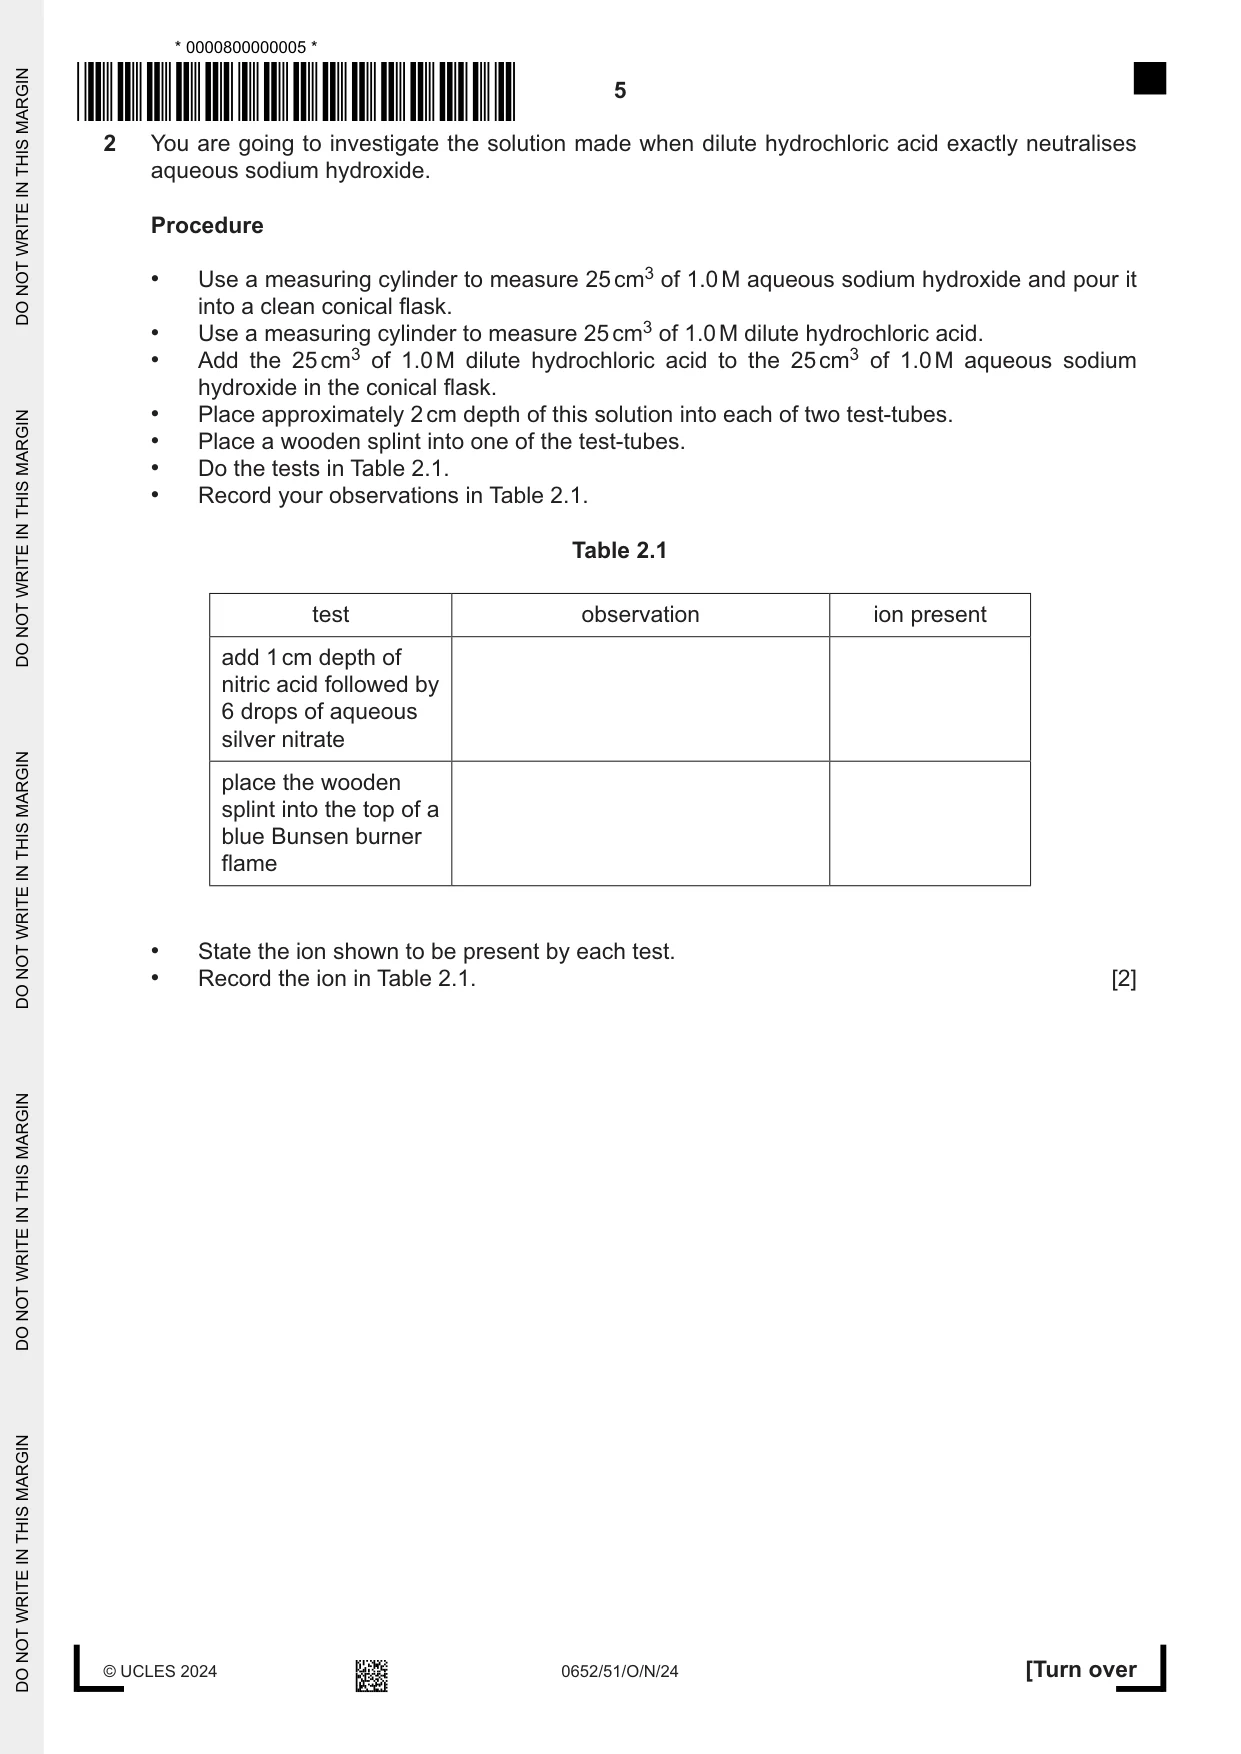
2 You are going to investigate the solution made when dilute hydrochloric acid exactly neutralises aqueous sodium hydroxide. Procedure • Use a measuring cylinder to measure 25 cm3 of 1.0 M aqueous sodium hydroxide and pour it into a clean conical flask. • Use a measuring cylinder to measure 25 cm3 of 1.0 M dilute hydrochloric acid. • Add the 25 cm3 of 1.0 M dilute hydrochloric acid to the 25 cm3 of 1.0 M aqueous sodium hydroxide in the conical flask. • Place approximately 2 cm depth of this solution into each of two test-tubes. • Place a wooden splint into one of the test-tubes. • Do the tests in Table 2.1. • Record your observations in Table 2.1. Table 2.1 test observation ion present add 1 cm depth of nitric acid followed by 6 drops of aqueous silver nitrate place the wooden splint into the top of a blue Bunsen burner flame • State the ion shown to be present by each test. • Record the ion in Table 2.1. [2]
Mark scheme: 2 white ppt AND chloride ; 2 yellow AND sodium ;
Q3 · In this experiment you are going to investigate how the length of a pendulum affects the…
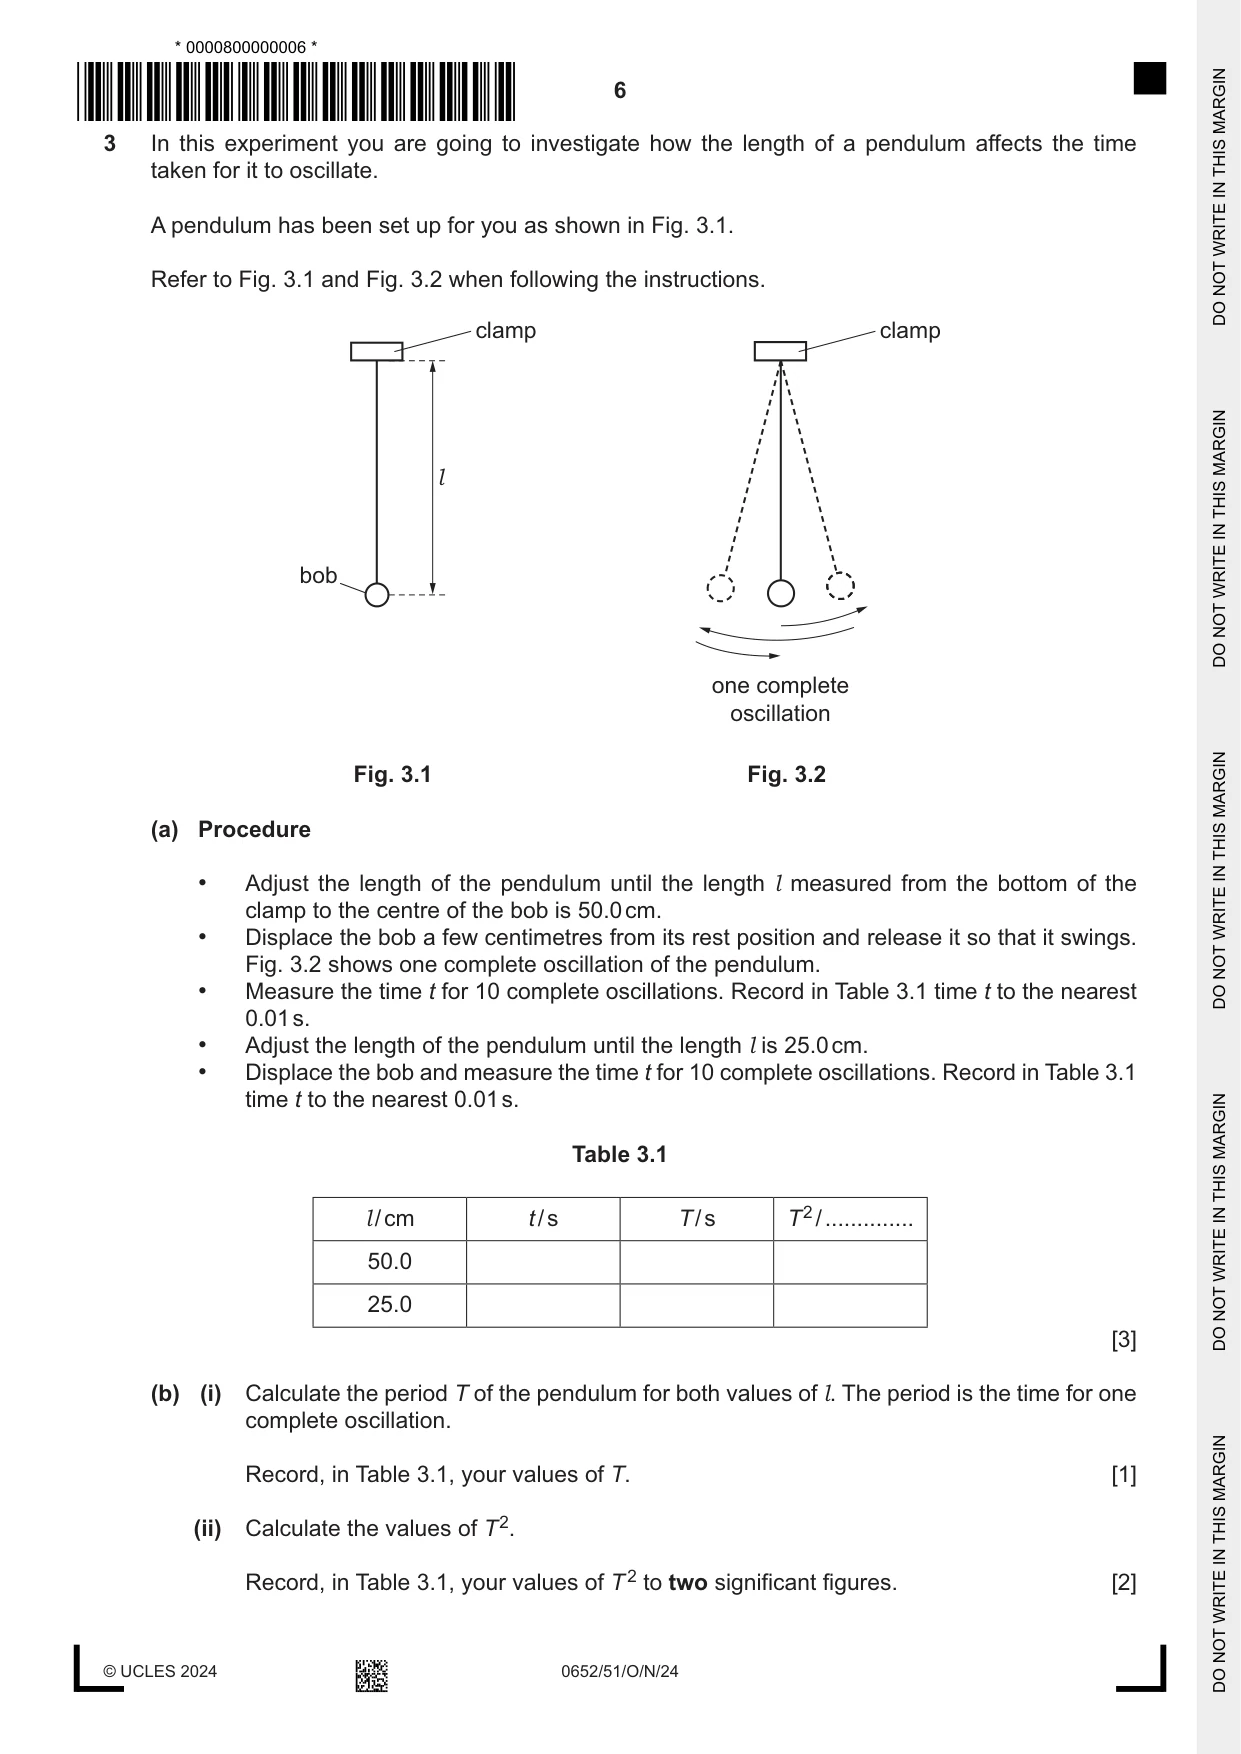
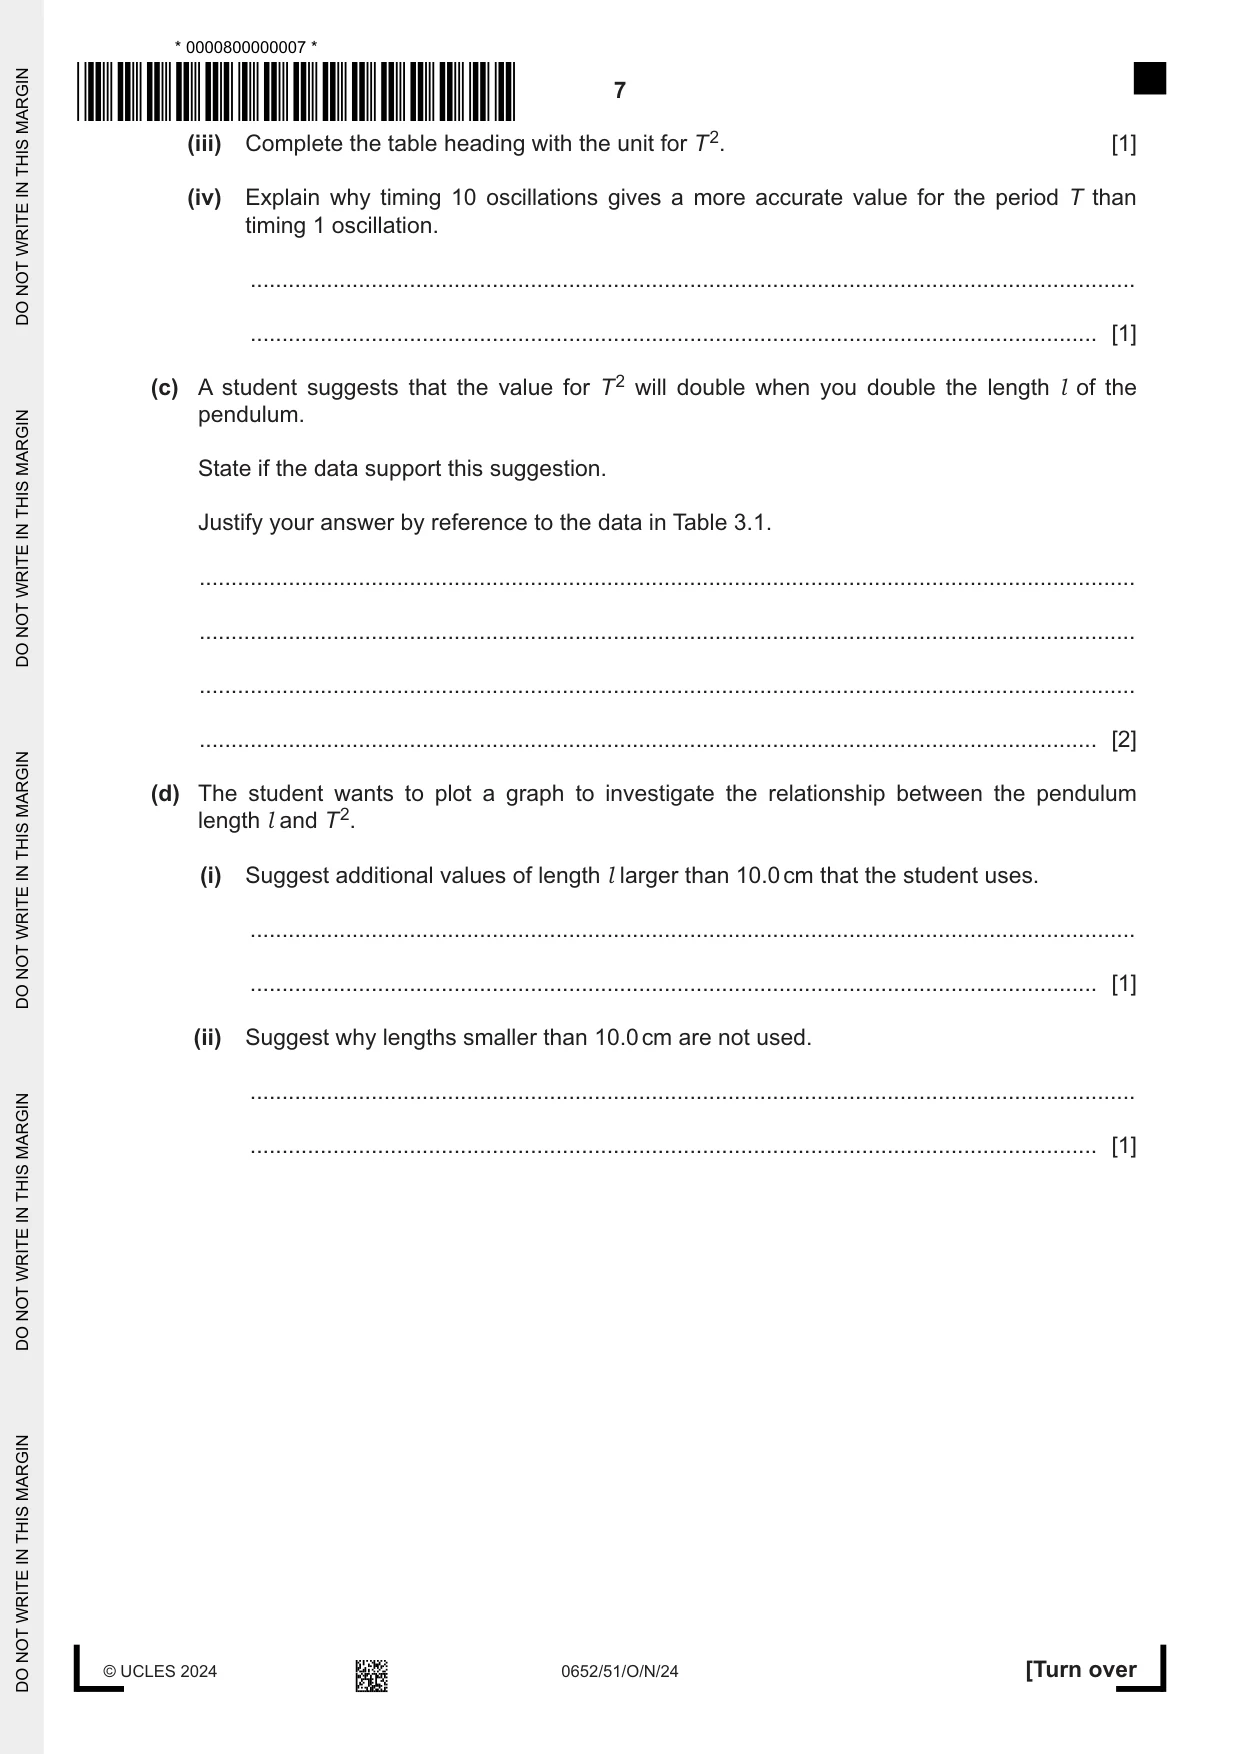
3 In this experiment you are going to investigate how the length of a pendulum affects the time taken for it to oscillate. A pendulum has been set up for you as shown in Fig. 3.1. Refer to Fig. 3.1 and Fig. 3.2 when following the instructions. clamp clamp l bob one complete oscillation Fig. 3.1 Fig. 3.2 (a) Procedure • Adjust the length of the pendulum until the length l measured from the bottom of the clamp to the centre of the bob is 50.0 cm. • Displace the bob a few centimetres from its rest position and release it so that it swings. Fig. 3.2 shows one complete oscillation of the pendulum. • Measure the time t for 10 complete oscillations. Record in Table 3.1 time t to the nearest 0.01 s. • Adjust the length of the pendulum until the length l is 25.0 cm. • Displace the bob and measure the time t for 10 complete oscillations. Record in Table 3.1 time t to the nearest 0.01 s. Table 3.1 l / cm t / s T / s T 2 / .............. 50.0 25.0 [3] (b) (i) Calculate the period T of the pendulum for both values of l. The period is the time for one complete oscillation. Record, in Table 3.1, your values of T. [1] (ii) Calculate the values of T 2. Record, in Table 3.1, your values of T 2 to two significant figures. [2] (iii) Complete the table heading with the unit for T 2. [1] (iv) Explain why timing 10 oscillations gives a more accurate value for the period T than timing 1 oscillation. ........................................................................................................................................... ..................................................................................................................................... [1] (c) A student suggests that the value for T 2 will double when you double the length l of the pendulum. State if the data support this suggestion. Justify your answer by reference to the data in Table 3.1. ................................................................................................................................................... ................................................................................................................................................... ................................................................................................................................................... ............................................................................................................................................. [2] (d) The student wants to plot a graph to investigate the relationship between the pendulum length l and T 2. (i) Suggest additional values of length l larger than 10.0 cm that the student uses. ........................................................................................................................................... ..................................................................................................................................... [1] (ii) Suggest why lengths smaller than 10.0 cm are not used. ........................................................................................................................................... ..................................................................................................................................... [1] (e) It is difficult to measure from the bottom of the clamp to the centre of the pendulum bob accurately. Describe how to make an accurate measurement. You may draw a diagram to help explain your answer. ................................................................................................................................................... ............................................................................................................................................. [1] [Total: 13] Question 4 starts on page 10
Mark scheme: 3(a) t for 50 cm = 13 – 16 (s) ; 3 t for 25 cm = 9 – 12 (s) ; both values recorded to the nearest 0.01 s ; 3(b)(i) both values of T correct ; 1 3(b)(ii) both values of T2 correct ; 2 both values recorded to 2 sig fig ; 3(b)(iii) s2 ; 1 3(b)(iv) one oscillation is too quick (to time) ; 1 3(c) expect ‘yes’ ; 1 when T2 for L = 25 cm is doubled, the value is close to the value for L = 50 cm ; 1 3(d)(i) at least three additional values given 10.0 cm ; 1 3(d)(ii) the oscillation would be too quick (to time) ; 1 3(e) any one from: 1 • average the lengths to the top and the bottom of the bob • measure the diameter of the bob using wooden blocks and add half to the length of the string
Q4 · When an object falls through a liquid, the liquid causes a force resisting the motion of…
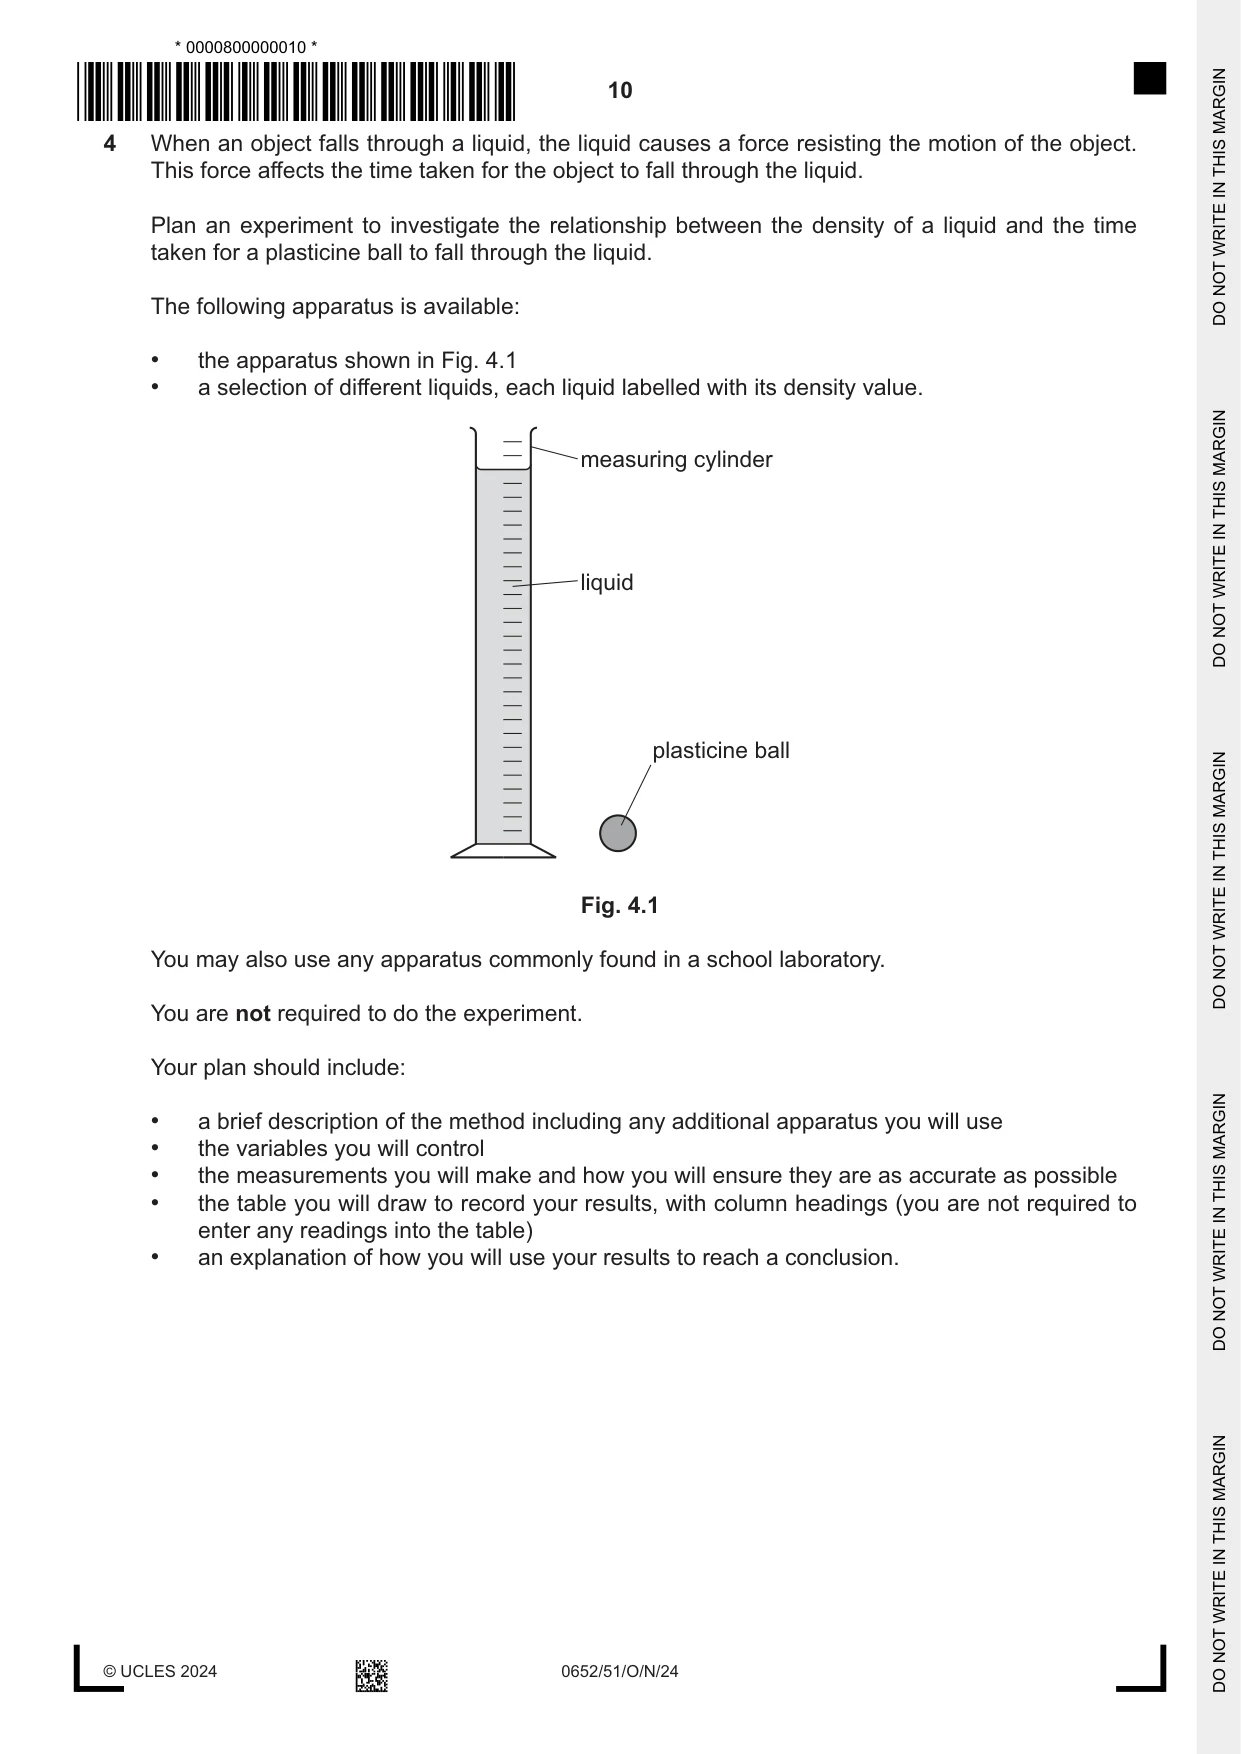
4 When an object falls through a liquid, the liquid causes a force resisting the motion of the object. This force affects the time taken for the object to fall through the liquid. Plan an experiment to investigate the relationship between the density of a liquid and the time taken for a plasticine ball to fall through the liquid. The following apparatus is available: • the apparatus shown in Fig. 4.1 • a selection of different liquids, each liquid labelled with its density value. measuring cylinder liquid plasticine ball Fig. 4.1 You may also use any apparatus commonly found in a school laboratory. You are not required to do the experiment. Your plan should include: • a brief description of the method including any additional apparatus you will use • the variables you will control • the measurements you will make and how you will ensure they are as accurate as possible • the table you will draw to record your results, with column headings (you are not required to enter any readings into the table) • an explanation of how you will use your results to reach a conclusion. .......................................................................................................................................................... .......................................................................................................................................................... .......................................................................................................................................................... .......................................................................................................................................................... .......................................................................................................................................................... .......................................................................................................................................................... .......................................................................................................................................................... .......................................................................................................................................................... .......................................................................................................................................................... .......................................................................................................................................................... .......................................................................................................................................................... .......................................................................................................................................................... .......................................................................................................................................................... .......................................................................................................................................................... .......................................................................................................................................................... .......................................................................................................................................................... .......................................................................................................................................................... .......................................................................................................................................................... .......................................................................................................................................................... .......................................................................................................................................................... .......................................................................................................................................................... .......................................................................................................................................................... .......................................................................................................................................................... .......................................................................................................................................................... .......................................................................................................................................................... .......................................................................................................................................................... .......................................................................................................................................................... .................................................................................................................................................... [7]
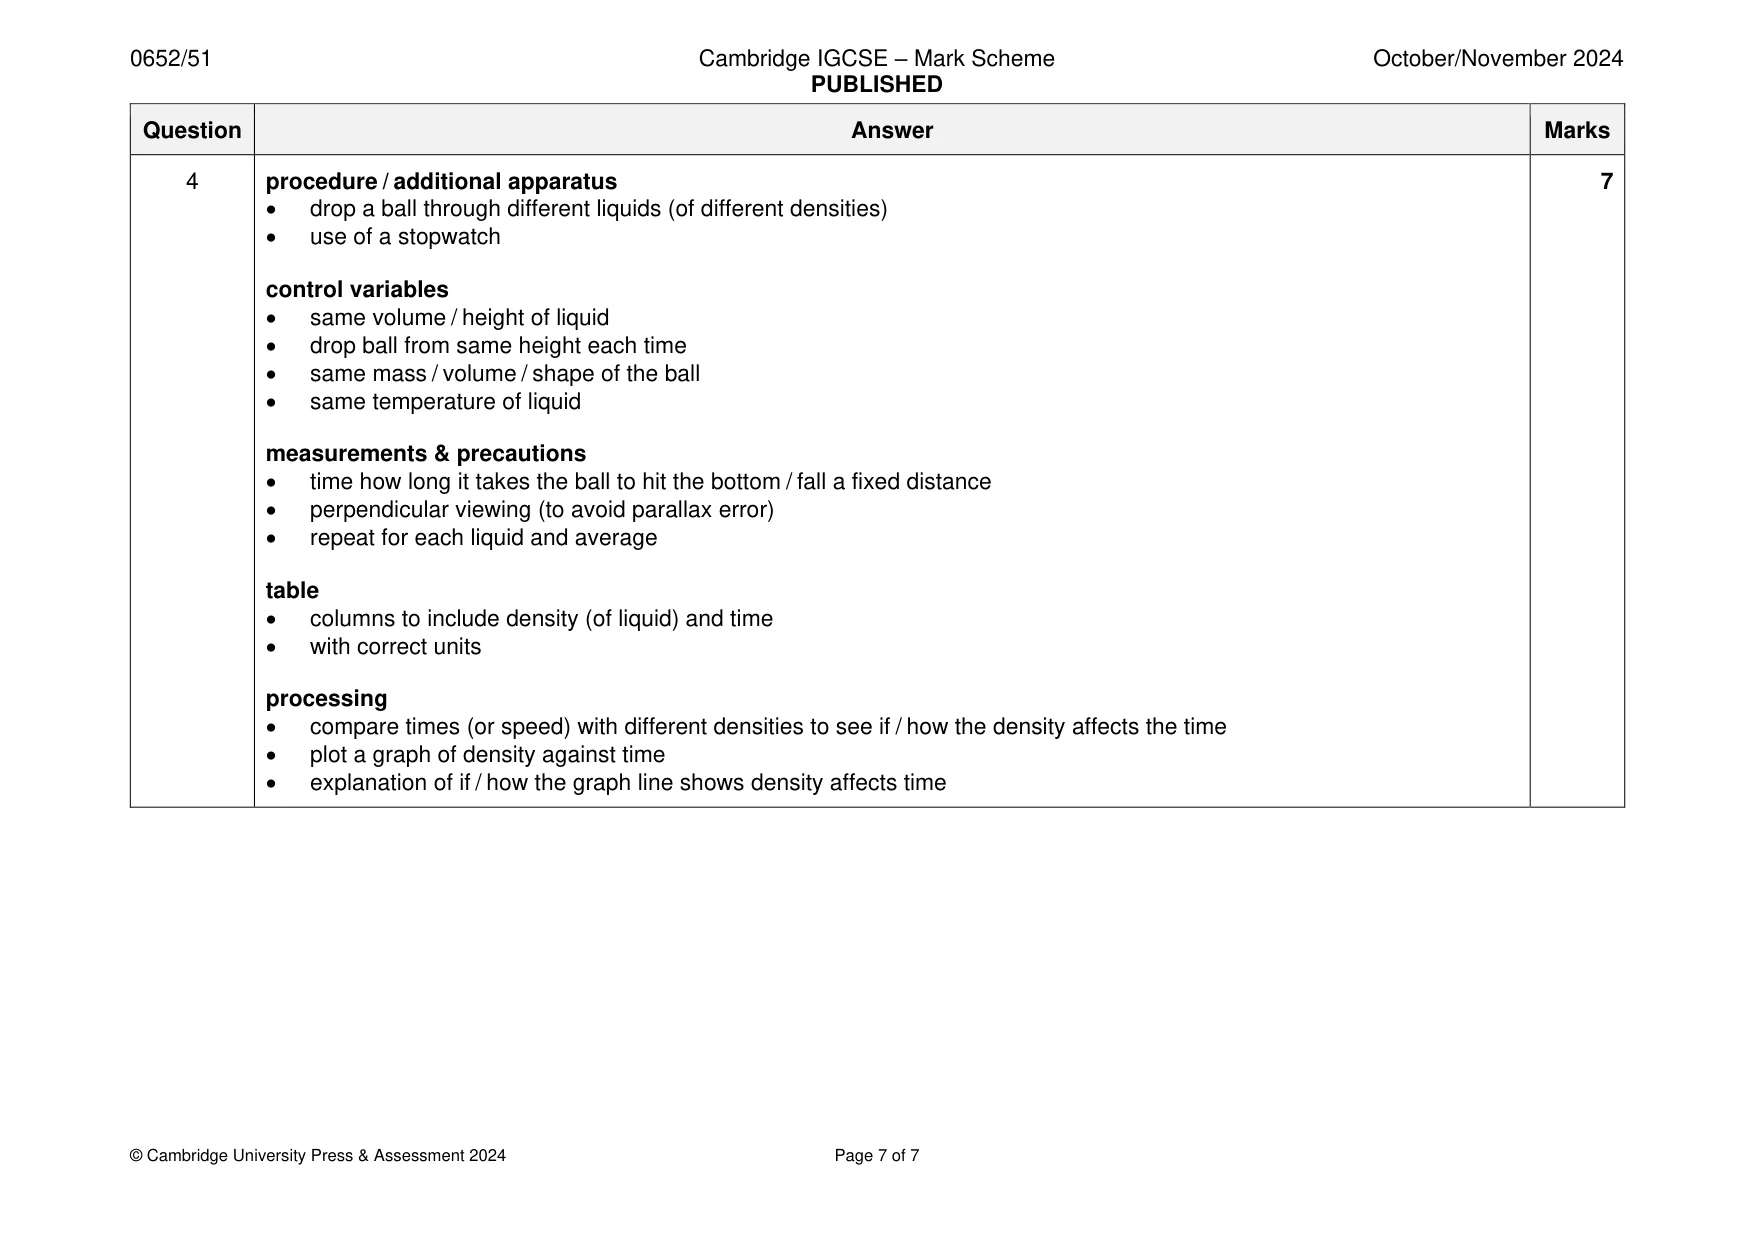
Mark scheme: 4 procedure / additional apparatus 7 • drop a ball through different liquids (of different densities) • use of a stopwatch control variables • same volume / height of liquid • drop ball from same height each time • same mass / volume / shape of the ball • same temperature of liquid measurements & precautions • time how long it takes the ball to hit the bottom / fall a fixed distance • perpendicular viewing (to avoid parallax error) • repeat for each liquid and average table • columns to include density (of liquid) and time • with correct units processing • compare times (or speed) with different densities to see if / how the density affects the time • plot a graph of density against time • explanation of if / how the graph line shows density affects time
What was in this paper
The subtopics covered by these 4 questions, and how many questions each got. Open one in a new tab to see every Cambridge question on it.
What you needed in this session
Cambridge’s own grade thresholds for 2024 Oct/Nov, Paper 5 · Variant 1. A higher threshold means an easier paper — the bar moves with how the cohort did.