Cambridge IGCSE Physical Science 0652 — 2022 Oct/Nov Paper 5 · Variant 1
0652/51/O/N/22 · 4 questions · 40 marks · ≈45 min
The question paper and its mark scheme, free to read here and free to download. This is Cambridge’s own paper, exactly as it was sat.
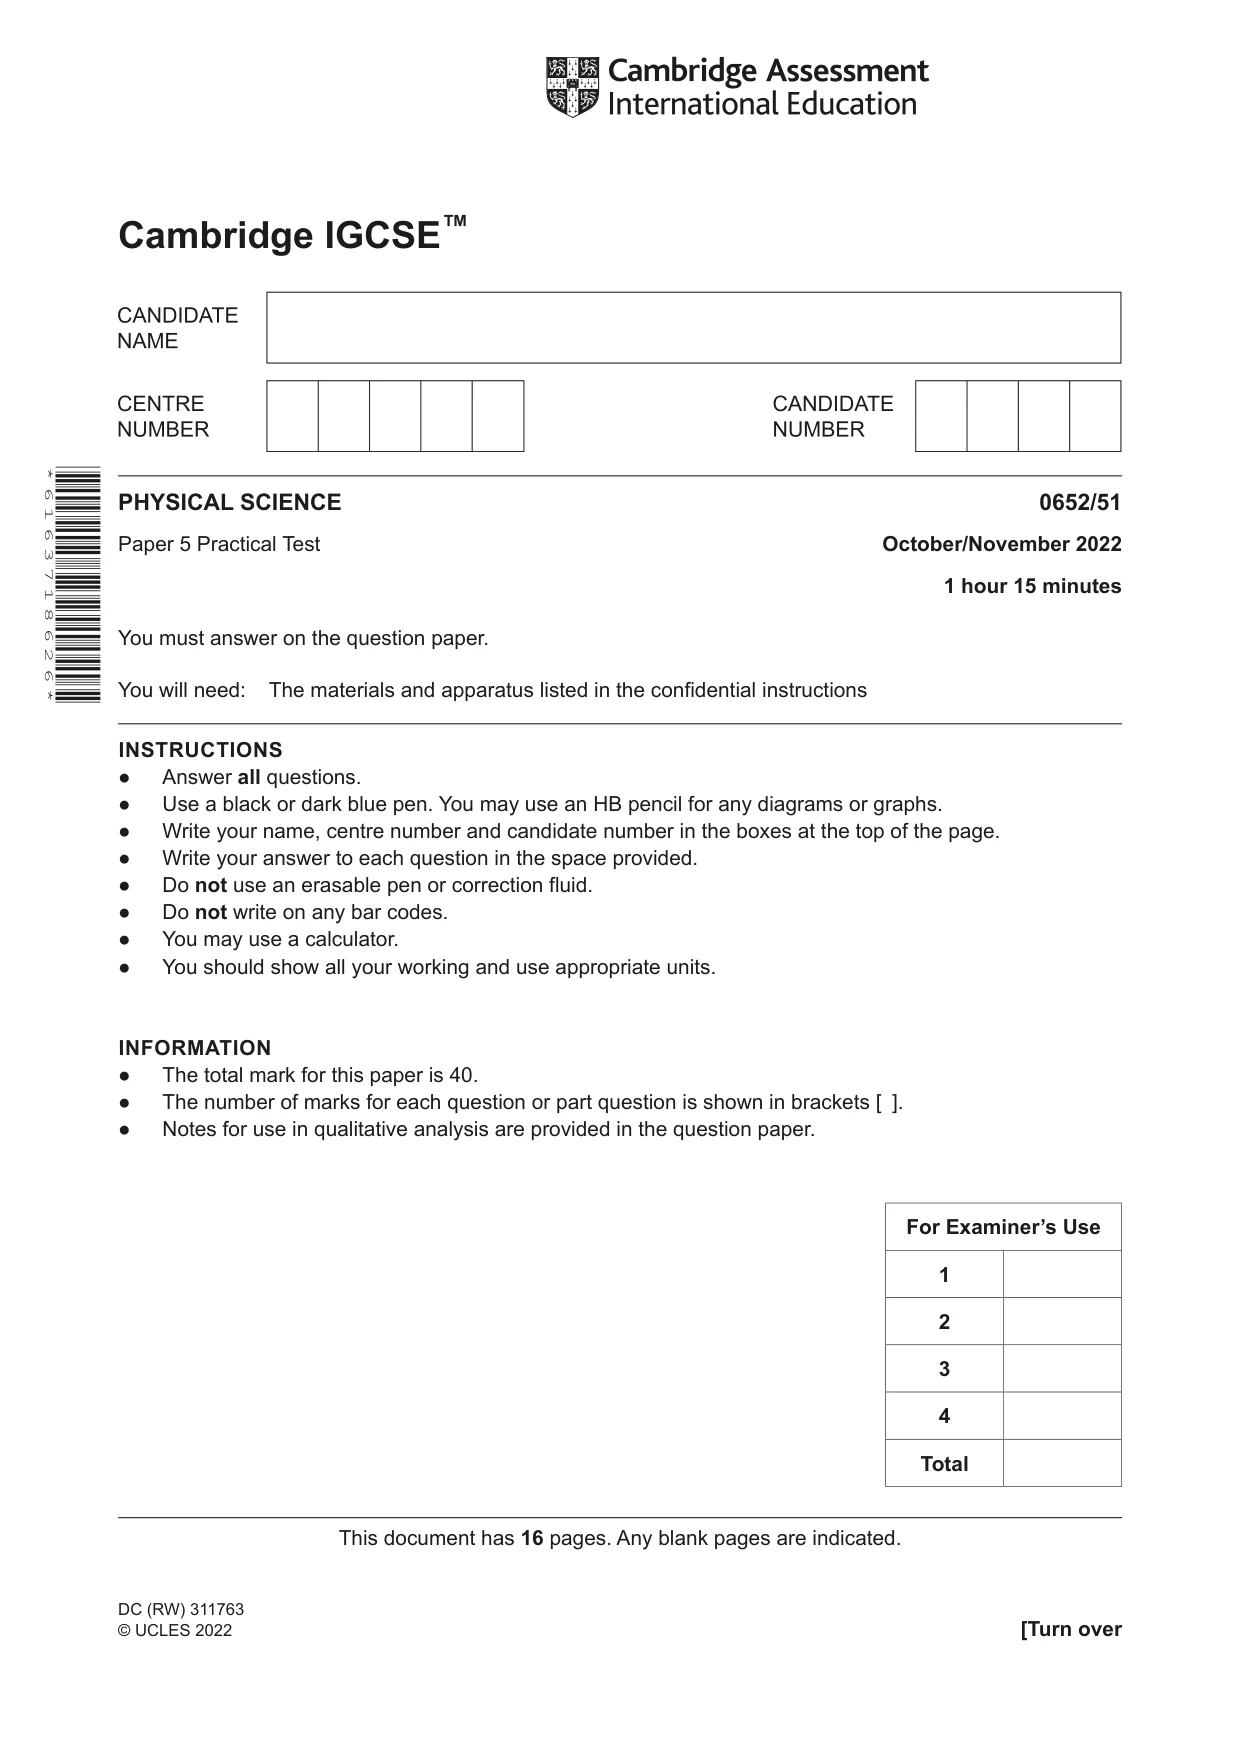
Question paper16 pages



Mark scheme8 pages
Answers below. Sit the paper first if you are practising.
Questions as text
Q1 · You are going to find the value of x in the formula of sodium carbonate crystals…
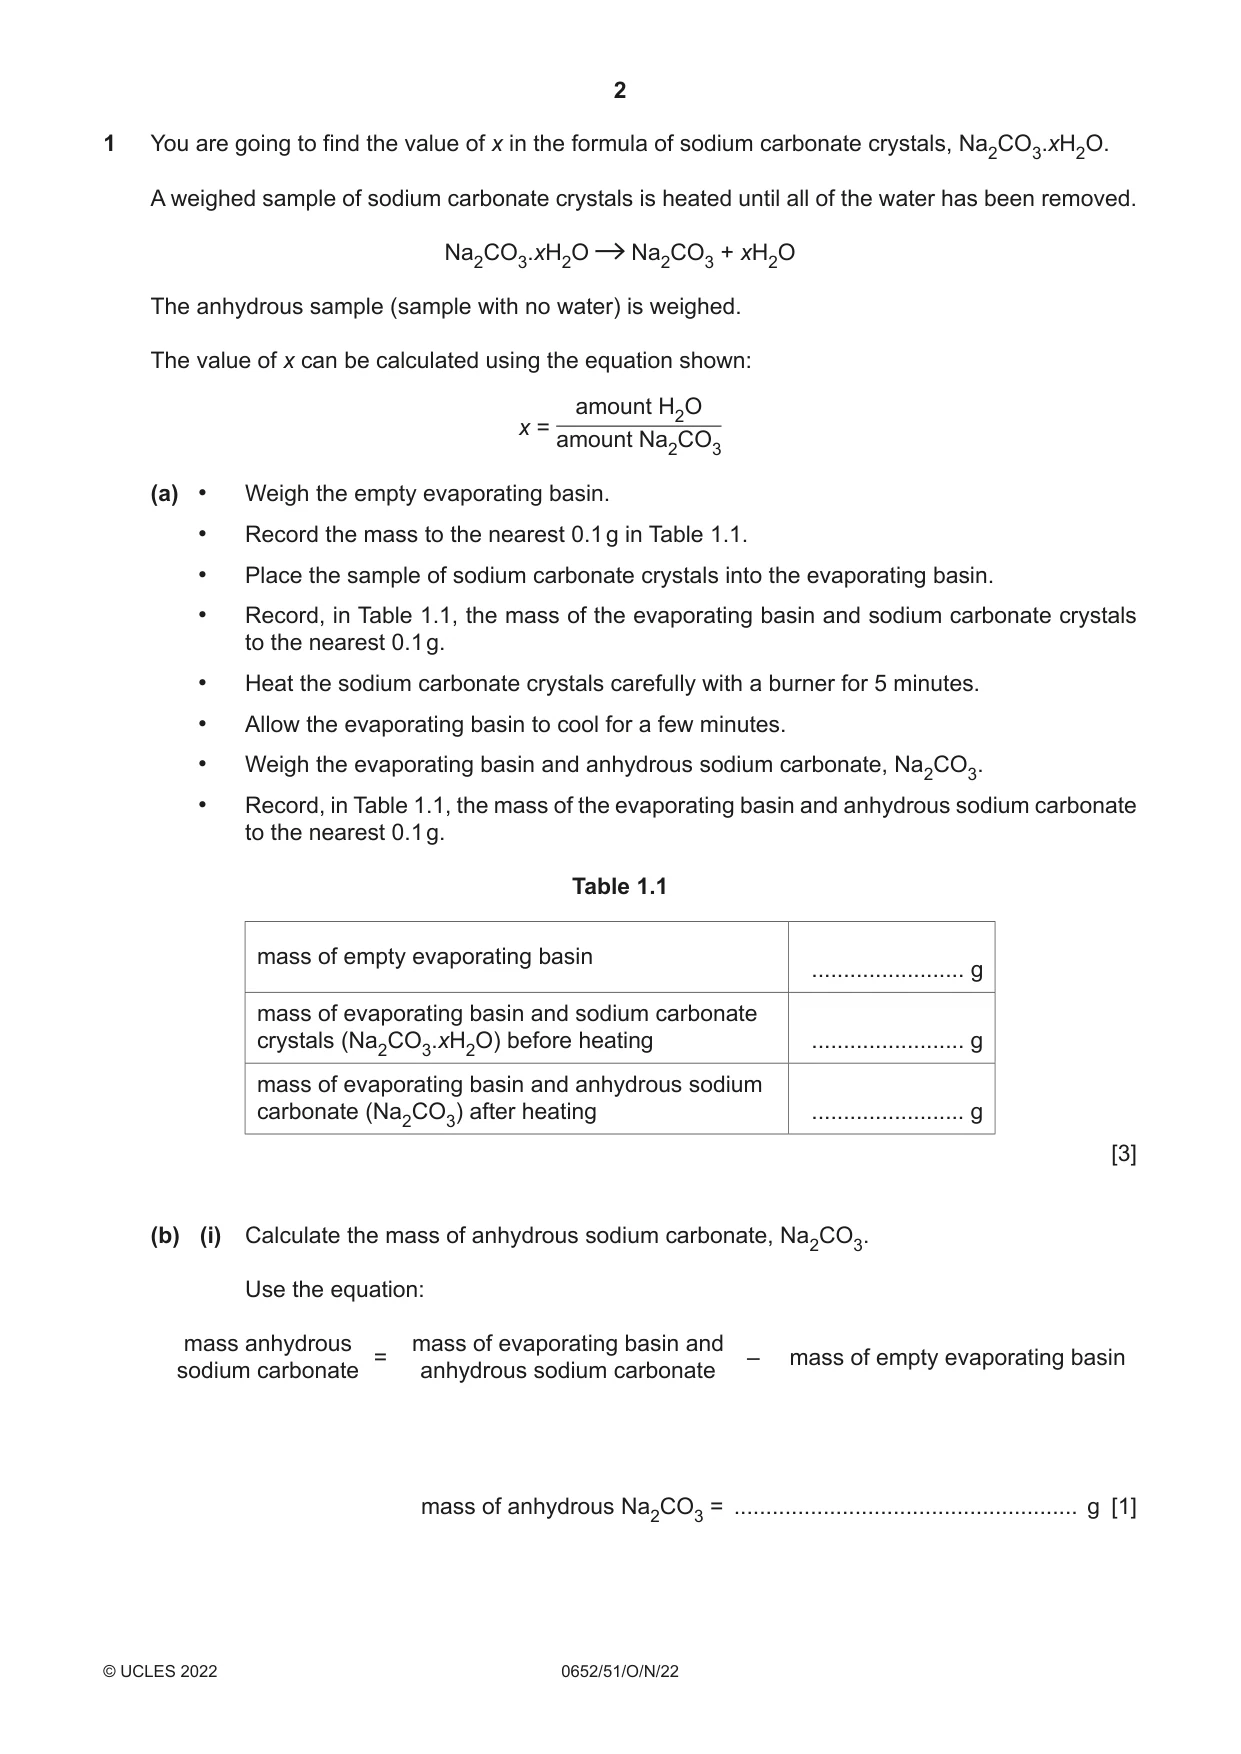
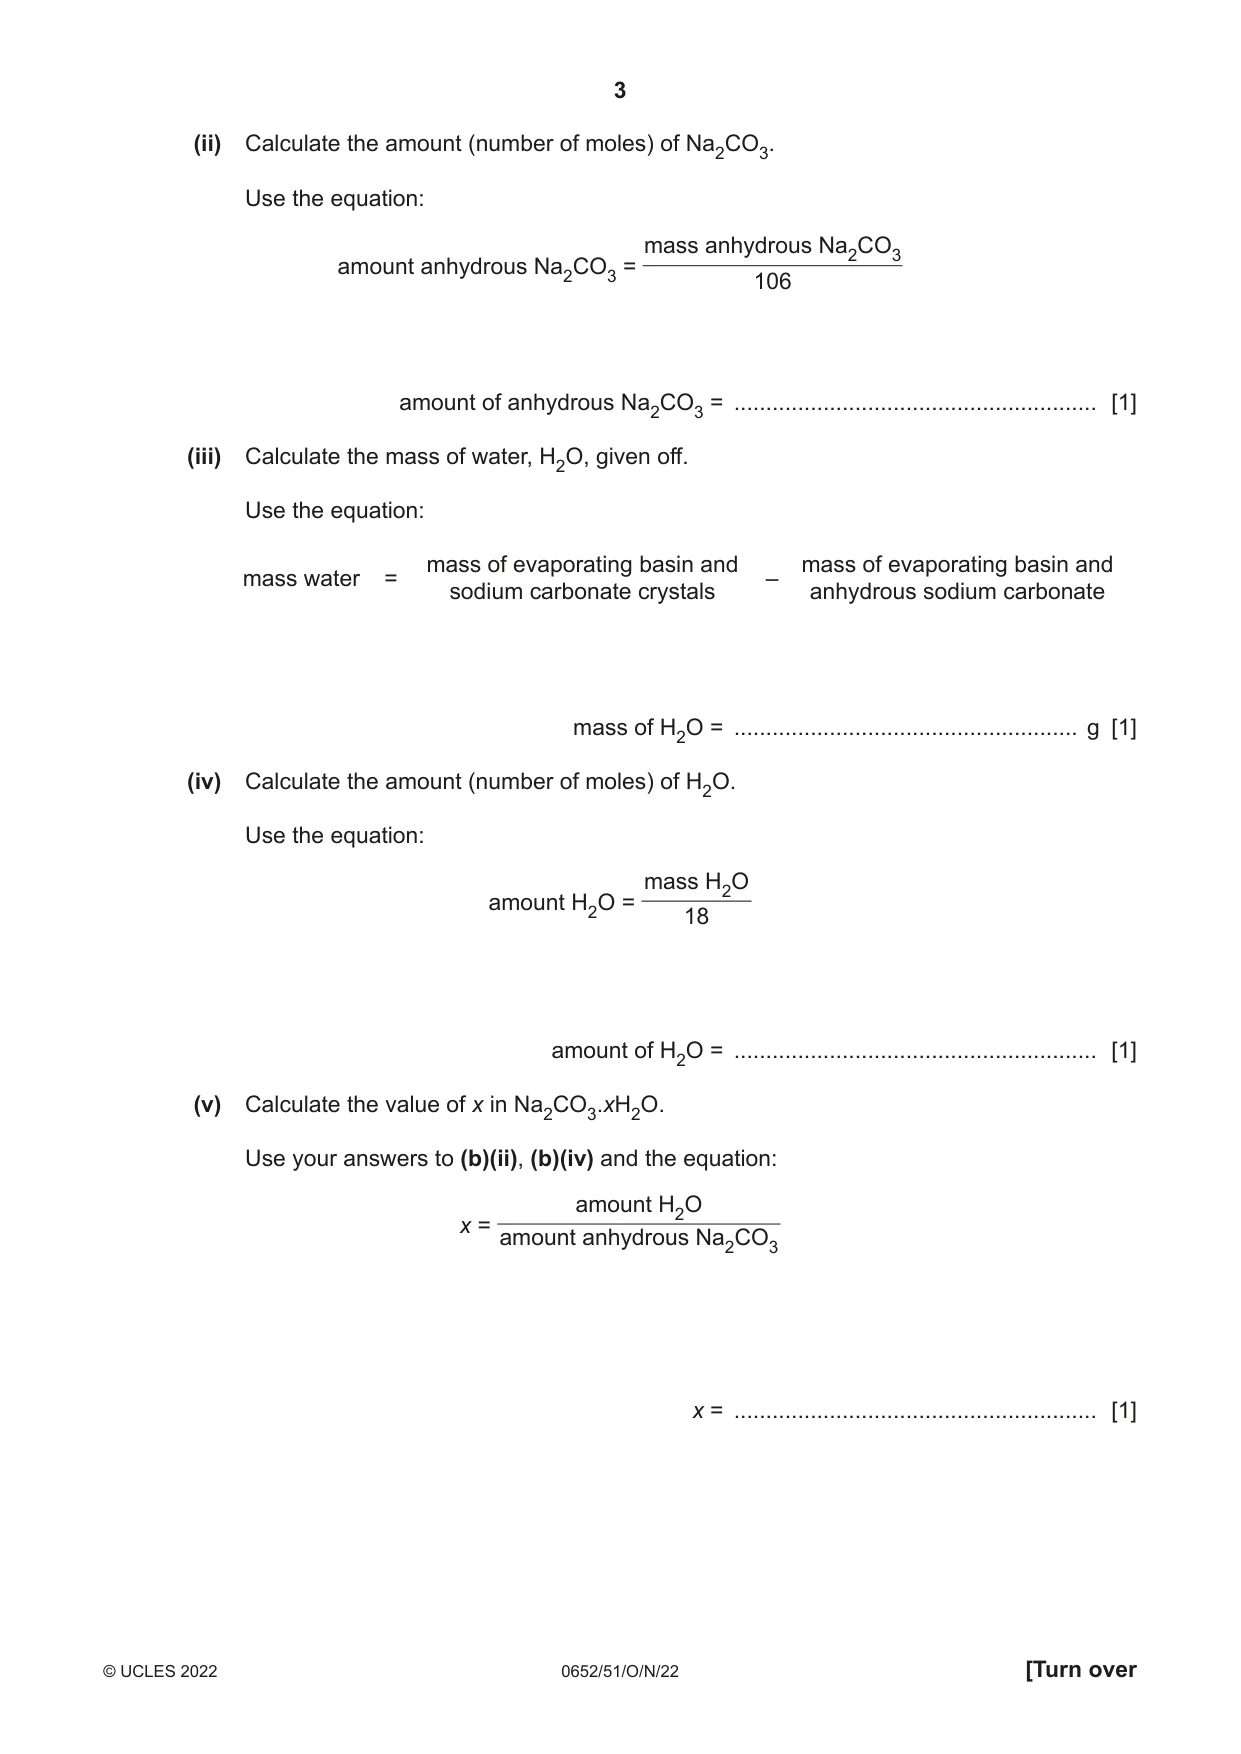
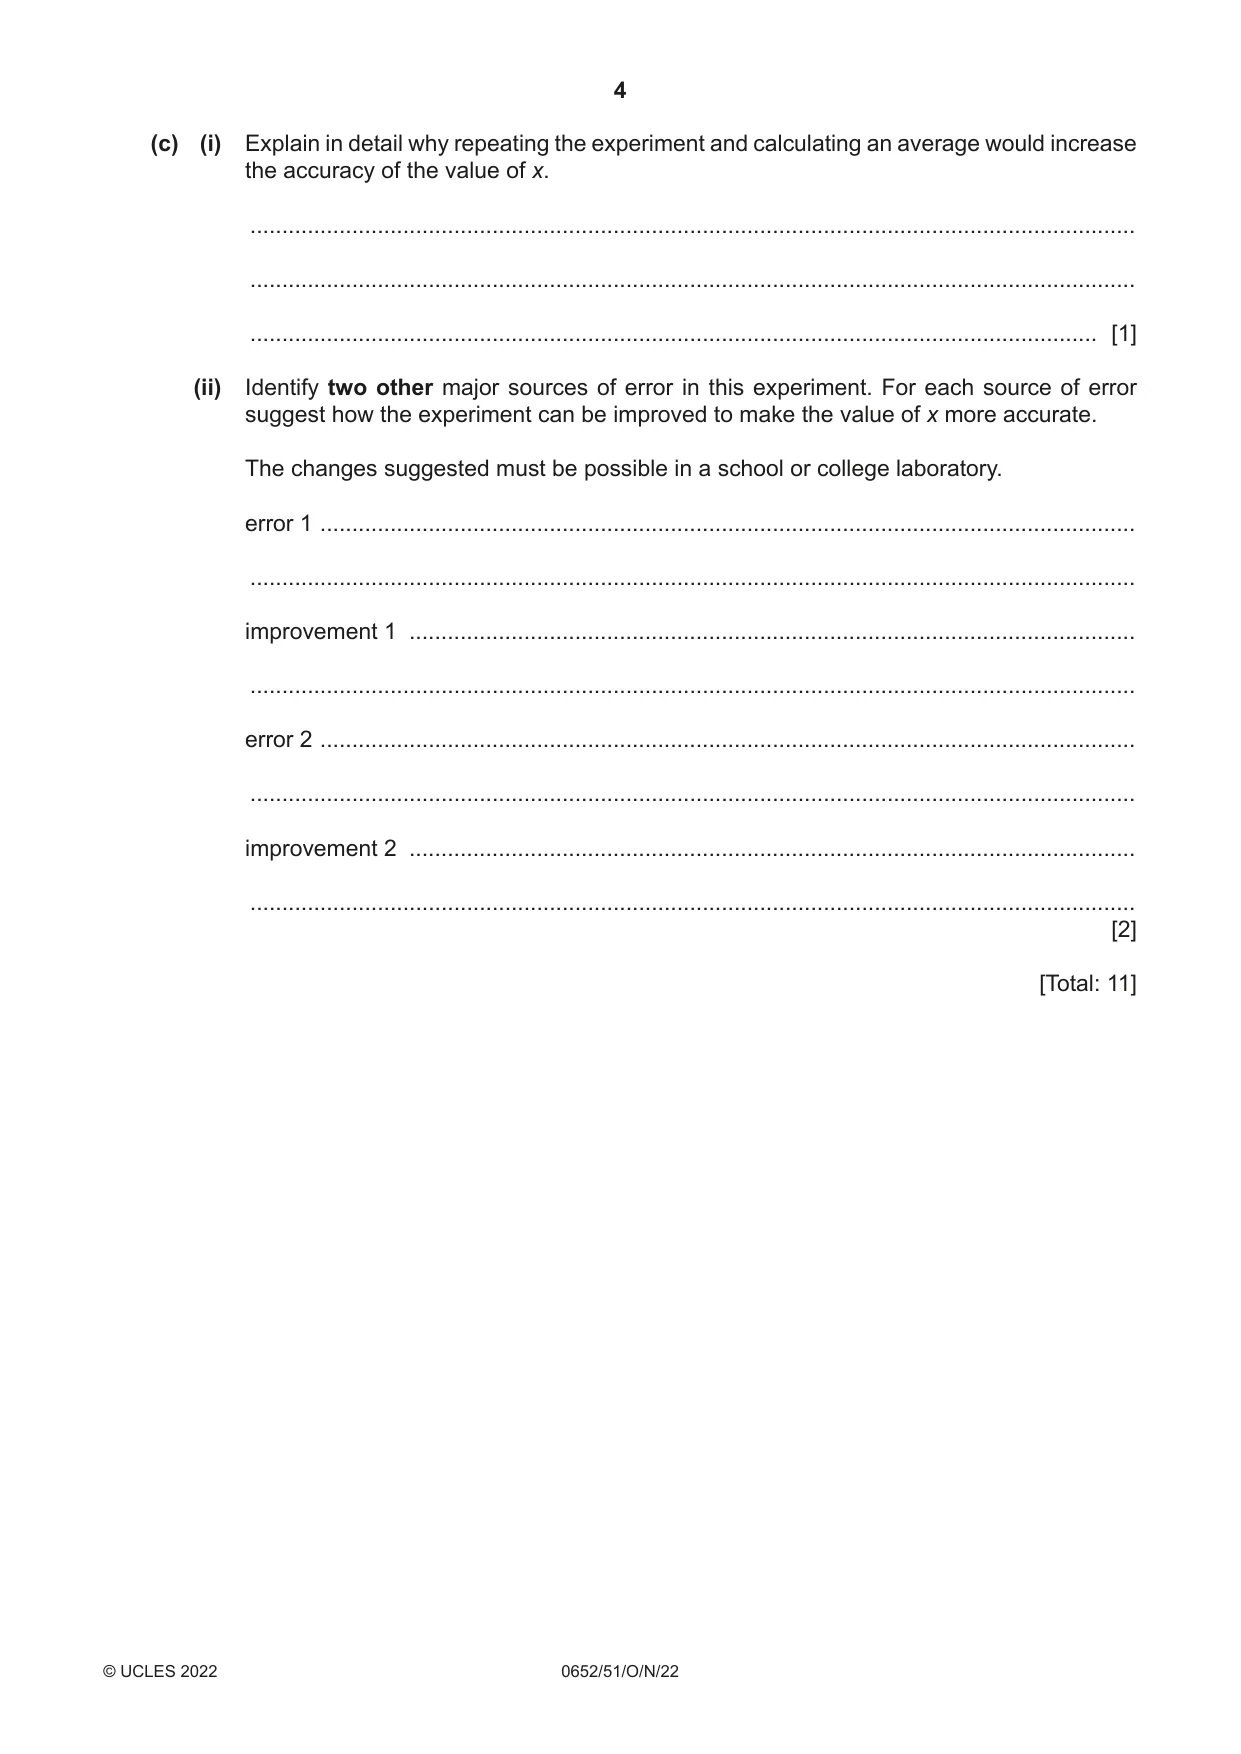
1 You are going to find the value of x in the formula of sodium carbonate crystals, Na2CO3.xH2O. A weighed sample of sodium carbonate crystals is heated until all of the water has been removed. Na2CO3.xH2O Na2CO3 + xH2O The anhydrous sample (sample with no water) is weighed. The value of x can be calculated using the equation shown: amount H2O x = amount Na2CO3 (a) • Weigh the empty evaporating basin. • Record the mass to the nearest 0.1 g in Table 1.1. • Place the sample of sodium carbonate crystals into the evaporating basin. • Record, in Table 1.1, the mass of the evaporating basin and sodium carbonate crystals to the nearest 0.1 g. • Heat the sodium carbonate crystals carefully with a burner for 5 minutes. • Allow the evaporating basin to cool for a few minutes. • Weigh the evaporating basin and anhydrous sodium carbonate, Na2CO3. • Record, in Table 1.1, the mass of the evaporating basin and anhydrous sodium carbonate to the nearest 0.1 g. Table 1.1 mass of empty evaporating basin ........................ g mass of evaporating basin and sodium carbonate crystals (Na2CO3.xH2O) before heating ........................ g mass of evaporating basin and anhydrous sodium carbonate (Na2CO3) after heating ........................ g [3] (b) (i) Calculate the mass of anhydrous sodium carbonate, Na2CO3. Use the equation: mass anhydrous mass of evaporating basin and = – mass of empty evaporating basin sodium carbonate anhydrous sodium carbonate mass of anhydrous Na2CO3 = ...................................................... g [1] (ii) Calculate the amount (number of moles) of Na2CO3. Use the equation: mass anhydrous Na2CO3 amount anhydrous Na2CO3 = 106 amount of anhydrous Na2CO3 = ......................................................... [1] (iii) Calculate the mass of water, H2O, given off. Use the equation: mass of evaporating basin and mass of evaporating basin and mass water = – sodium carbonate crystals anhydrous sodium carbonate mass of H2O = ...................................................... g [1] (iv) Calculate the amount (number of moles) of H2O. Use the equation: mass H2O amount H2O = 18 amount of H2O = ......................................................... [1] (v) Calculate the value of x in Na2CO3.xH2O. Use your answers to (b)(ii), (b)(iv) and the equation: amount H2O x = amount anhydrous Na2CO3 x = ......................................................... [1] (c) (i) Explain in detail why repeating the experiment and calculating an average would increase the accuracy of the value of x. ........................................................................................................................................... ........................................................................................................................................... ..................................................................................................................................... [1] (ii) Identify two other major sources of error in this experiment. For each source of error suggest how the experiment can be improved to make the value of x more accurate. The changes suggested must be possible in a school or college laboratory. error 1 ................................................................................................................................ ........................................................................................................................................... improvement 1 .................................................................................................................. ........................................................................................................................................... error 2 ................................................................................................................................ ........................................................................................................................................... improvement 2 .................................................................................................................. ........................................................................................................................................... [2] [Total: 11] Question 2 begins over the page
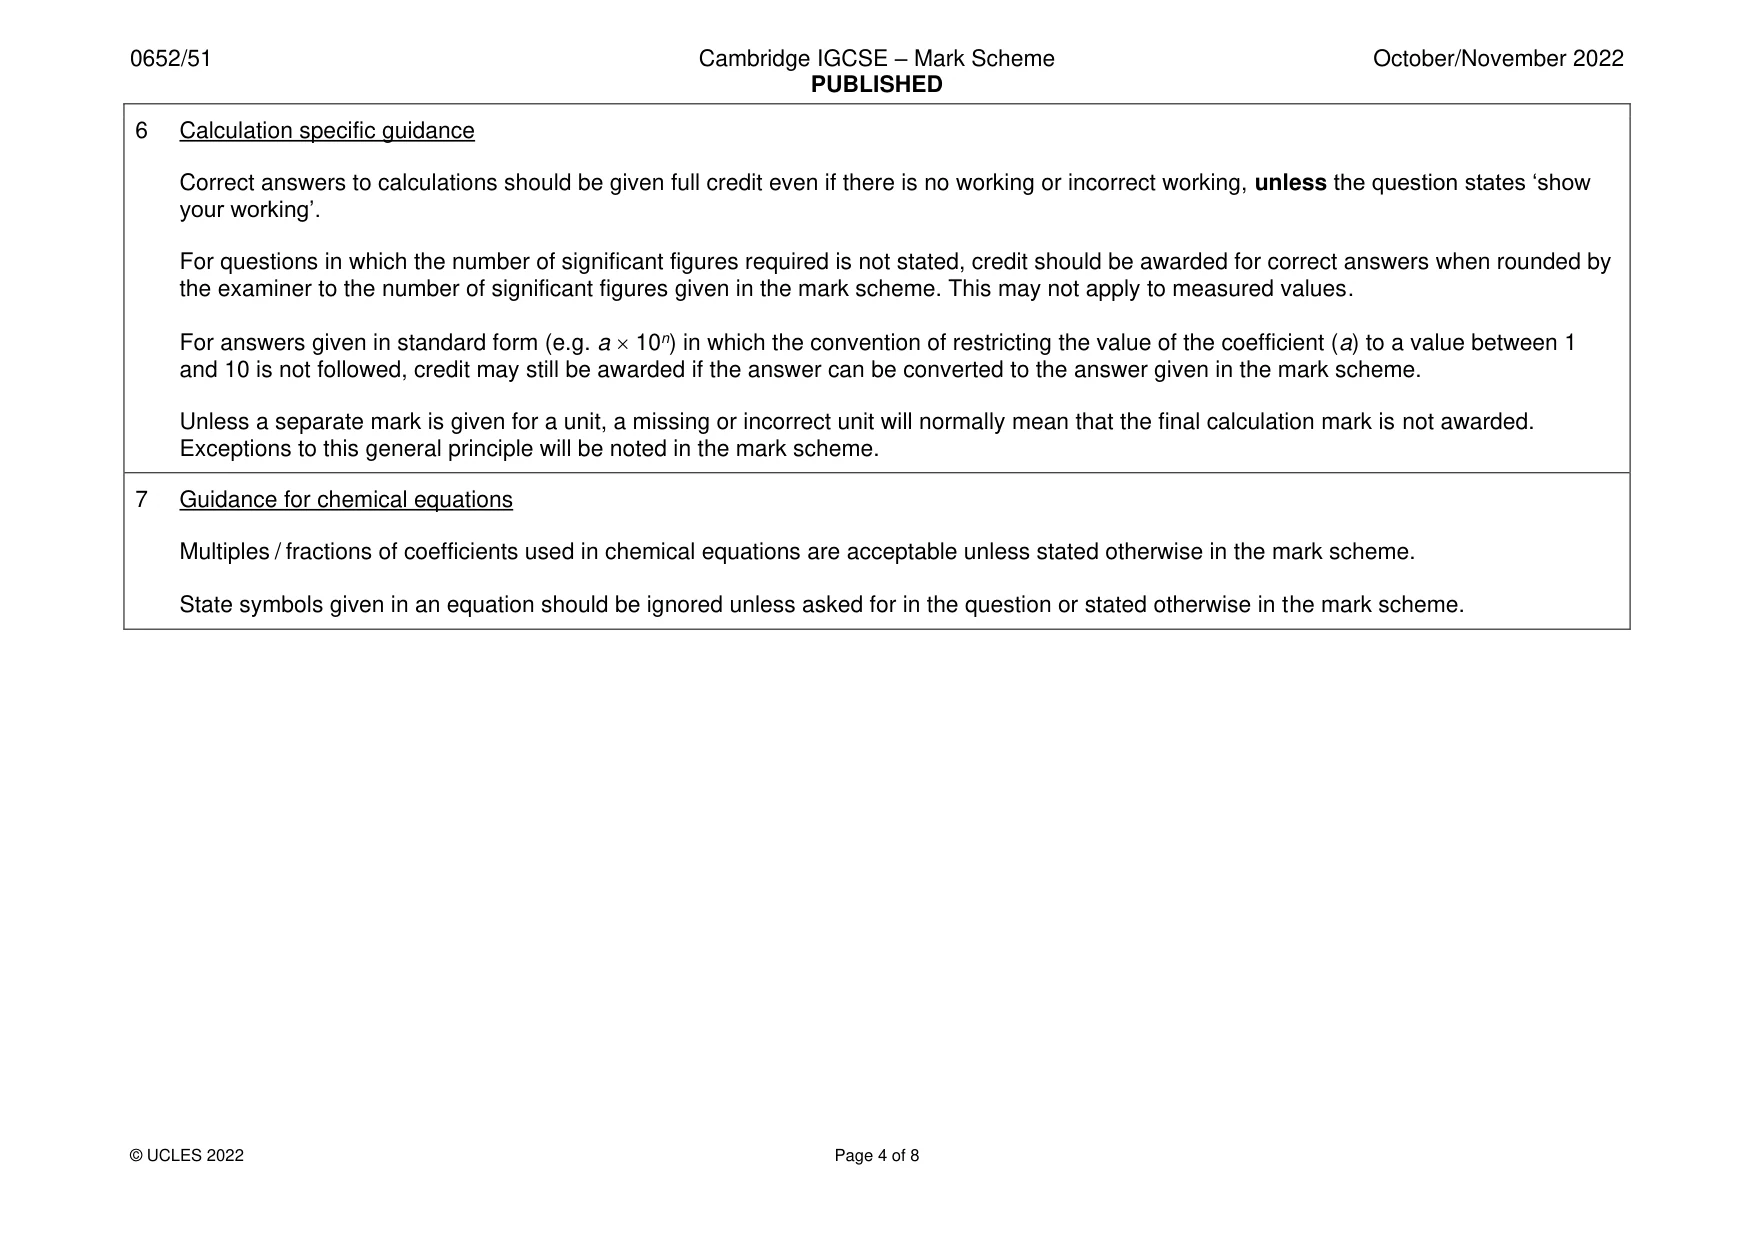
Mark scheme: Question Answer Marks 1(a) has 3 masses 1 all masses to 0.1 g 1 mass after heating less than before heating 1 1(b)(i) basin and anhydrous sodium carbonate − empty basin 1 1(b)(ii) (b)(i) / 106 1 1b(iii) mass crystals − mass anhydrous 1 1(b)(iv) 1(b)(iii) / 18 1 1(b)(v) (b)(iv) / (b)(ii) 1 1(c)(i) identifies anomalies / outliers / reduces (effects of) error 1 1(c)(ii) Any two from: 2 not all water evaporated and heat for longer / to constant mass spitting of the solid and lid / crucible and lid etc. mass / loss water etc inaccurate and use a larger mass of crystals
Q2 · You are going to identify three colourless solutions, A, B and C
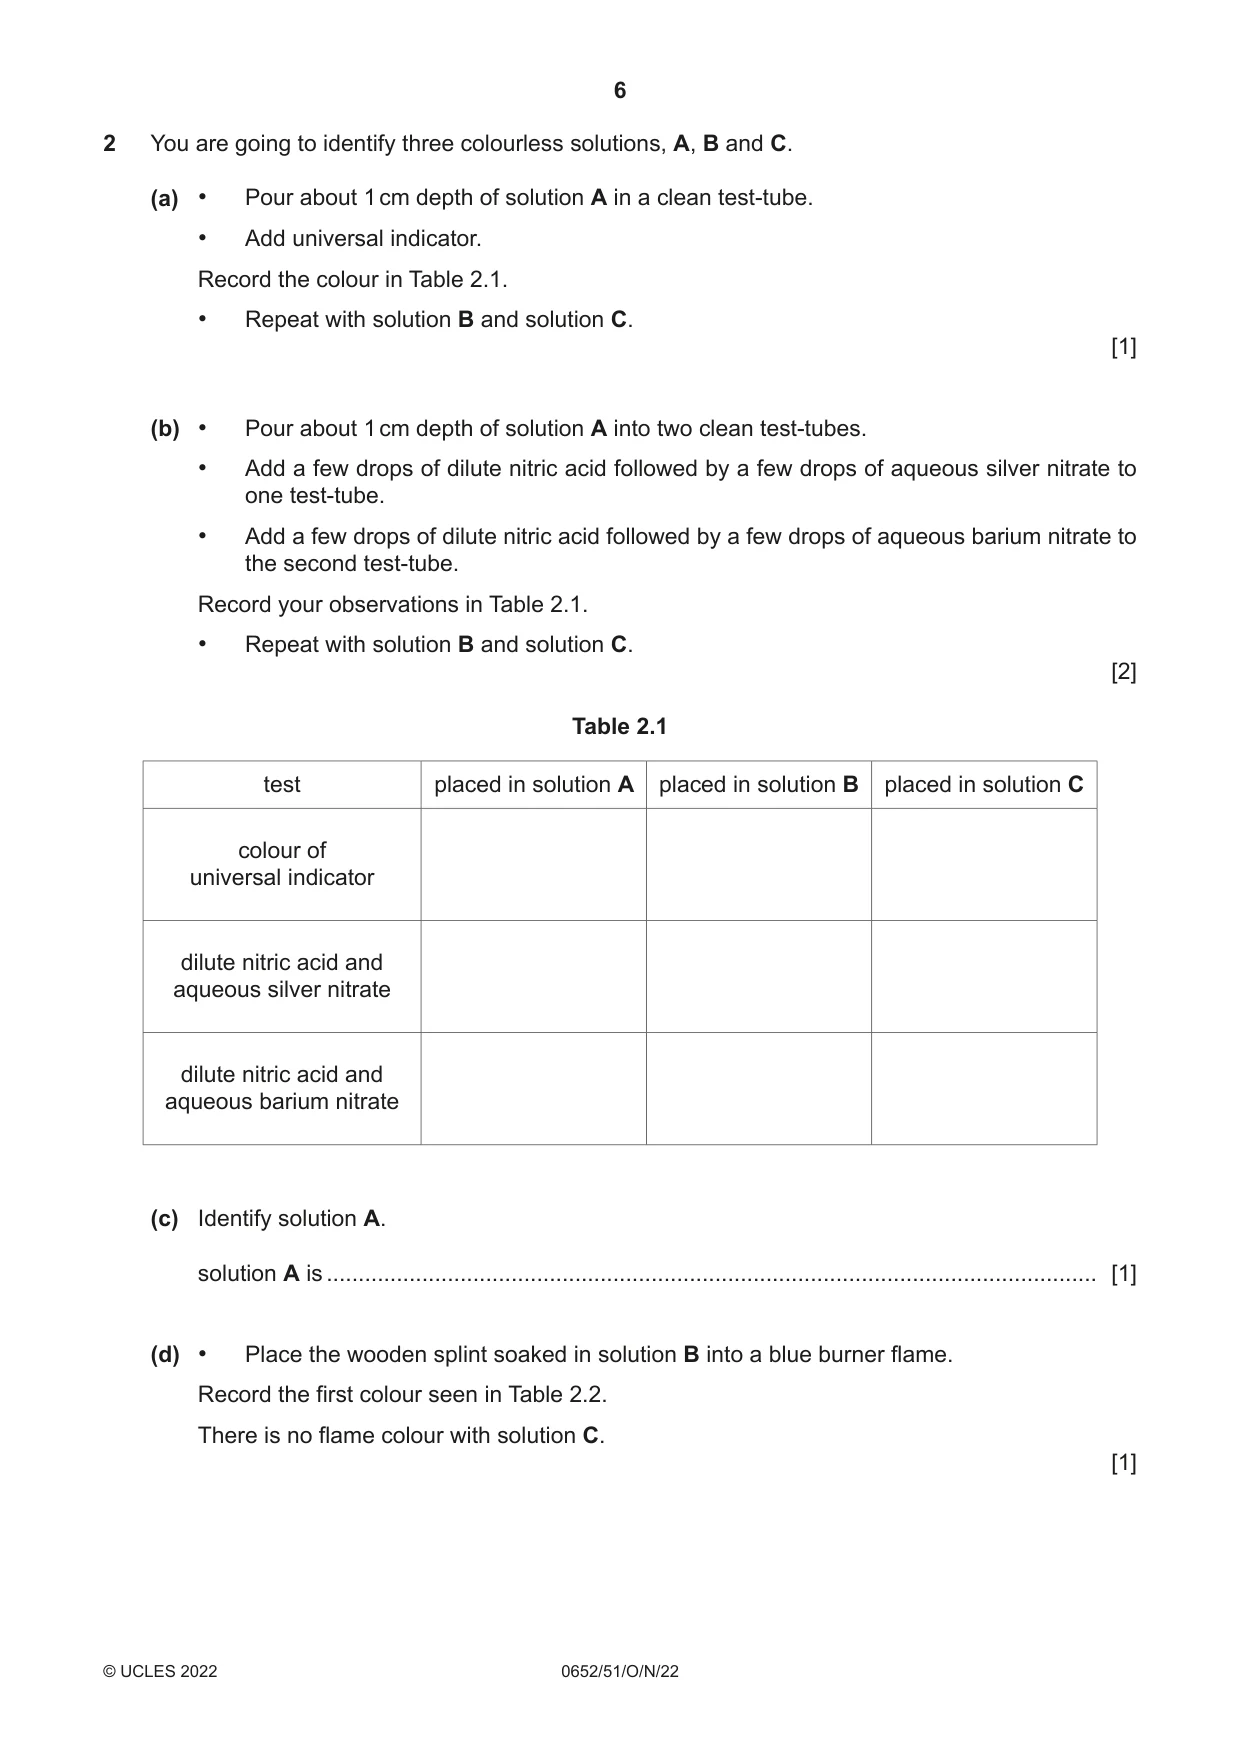
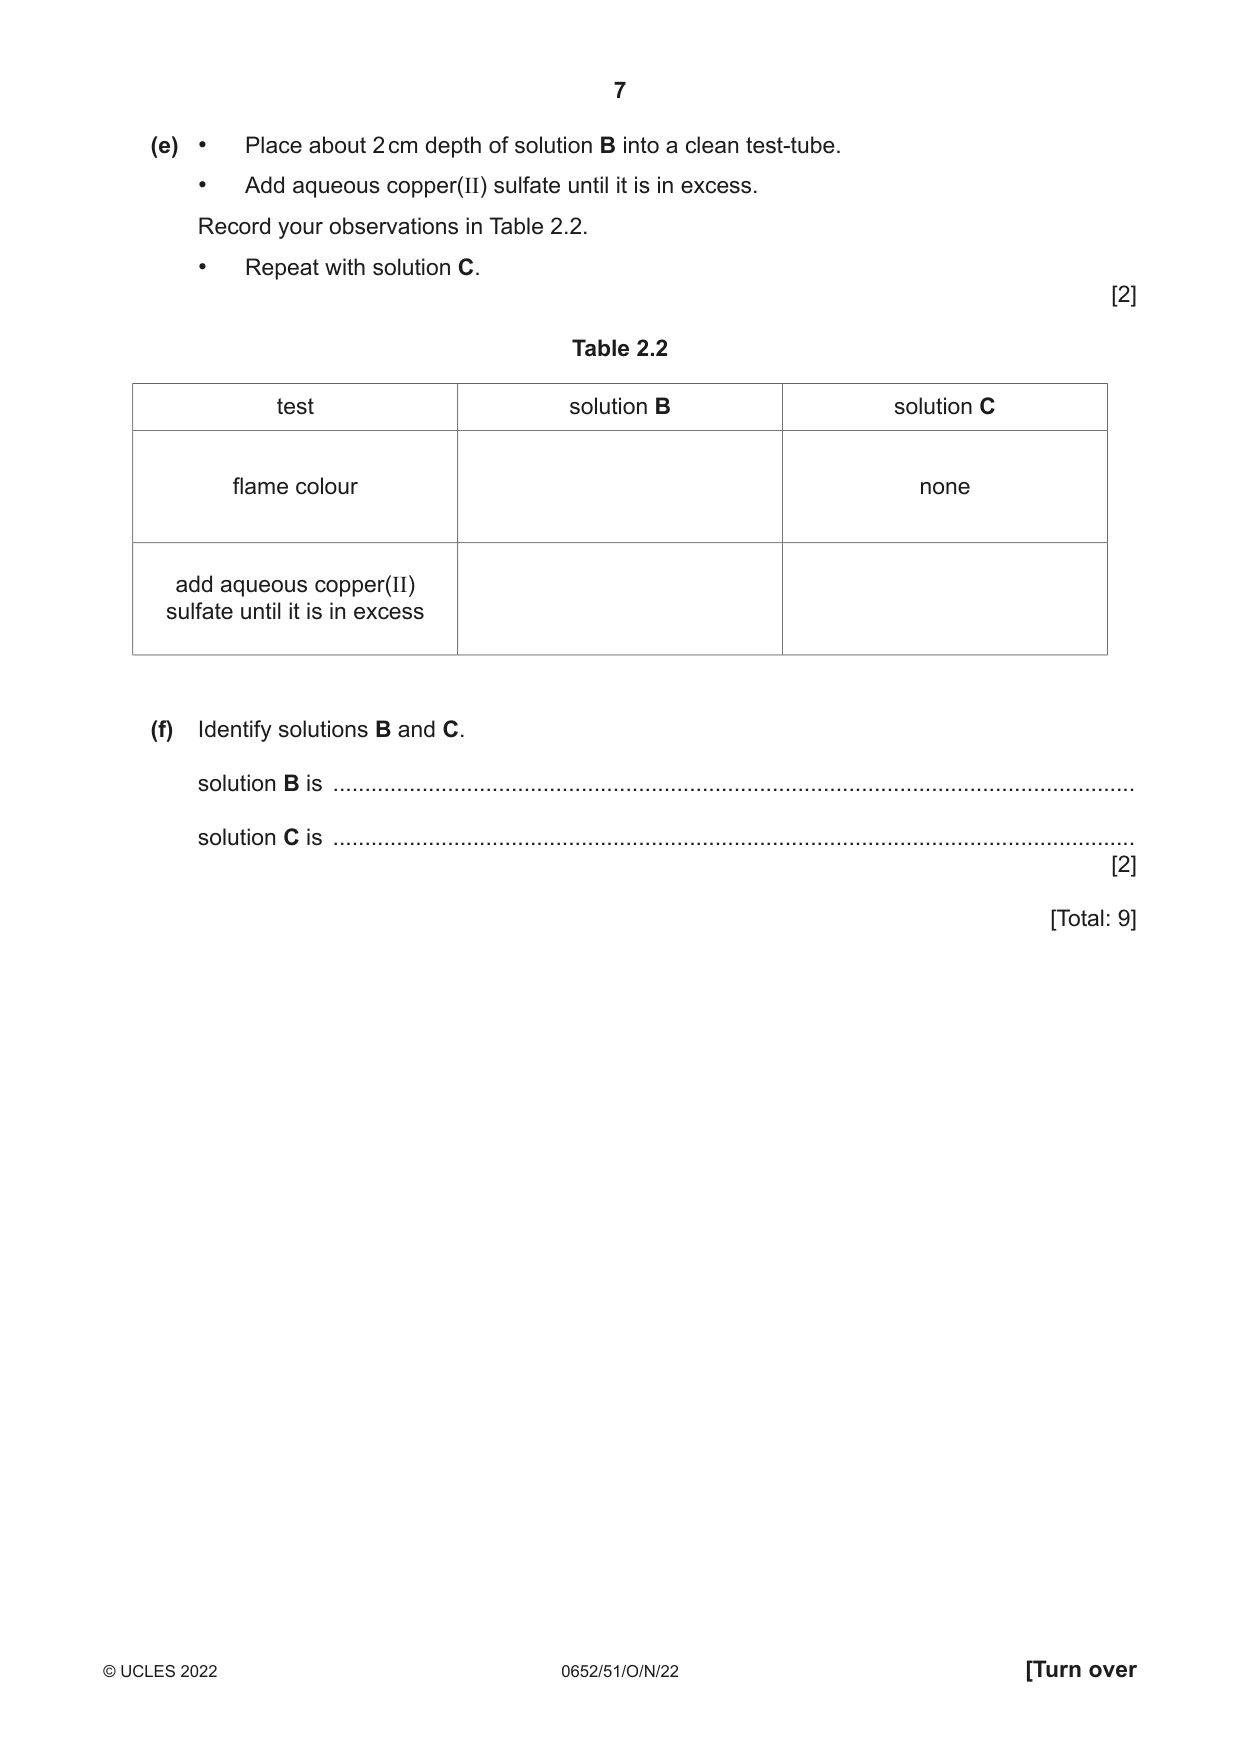
2 You are going to identify three colourless solutions, A, B and C. (a) • Pour about 1 cm depth of solution A in a clean test-tube. • Add universal indicator. Record the colour in Table 2.1. • Repeat with solution B and solution C. [1] (b) • Pour about 1 cm depth of solution A into two clean test-tubes. • Add a few drops of dilute nitric acid followed by a few drops of aqueous silver nitrate to one test-tube. • Add a few drops of dilute nitric acid followed by a few drops of aqueous barium nitrate to the second test-tube. Record your observations in Table 2.1. • Repeat with solution B and solution C. [2] Table 2.1 test placed in solution A placed in solution B placed in solution C colour of universal indicator dilute nitric acid and aqueous silver nitrate dilute nitric acid and aqueous barium nitrate (c) Identify solution A. solution A is ......................................................................................................................... [1] (d) • Place the wooden splint soaked in solution B into a blue burner flame. Record the first colour seen in Table 2.2. There is no flame colour with solution C. [1] (e) • Place about 2 cm depth of solution B into a clean test-tube. • Add aqueous copper(II) sulfate until it is in excess. Record your observations in Table 2.2. • Repeat with solution C. [2] Table 2.2 test solution B solution C flame colour none add aqueous copper(II) sulfate until it is in excess (f) Identify solutions B and C. solution B is .............................................................................................................................. solution C is .............................................................................................................................. [2] [Total: 9]
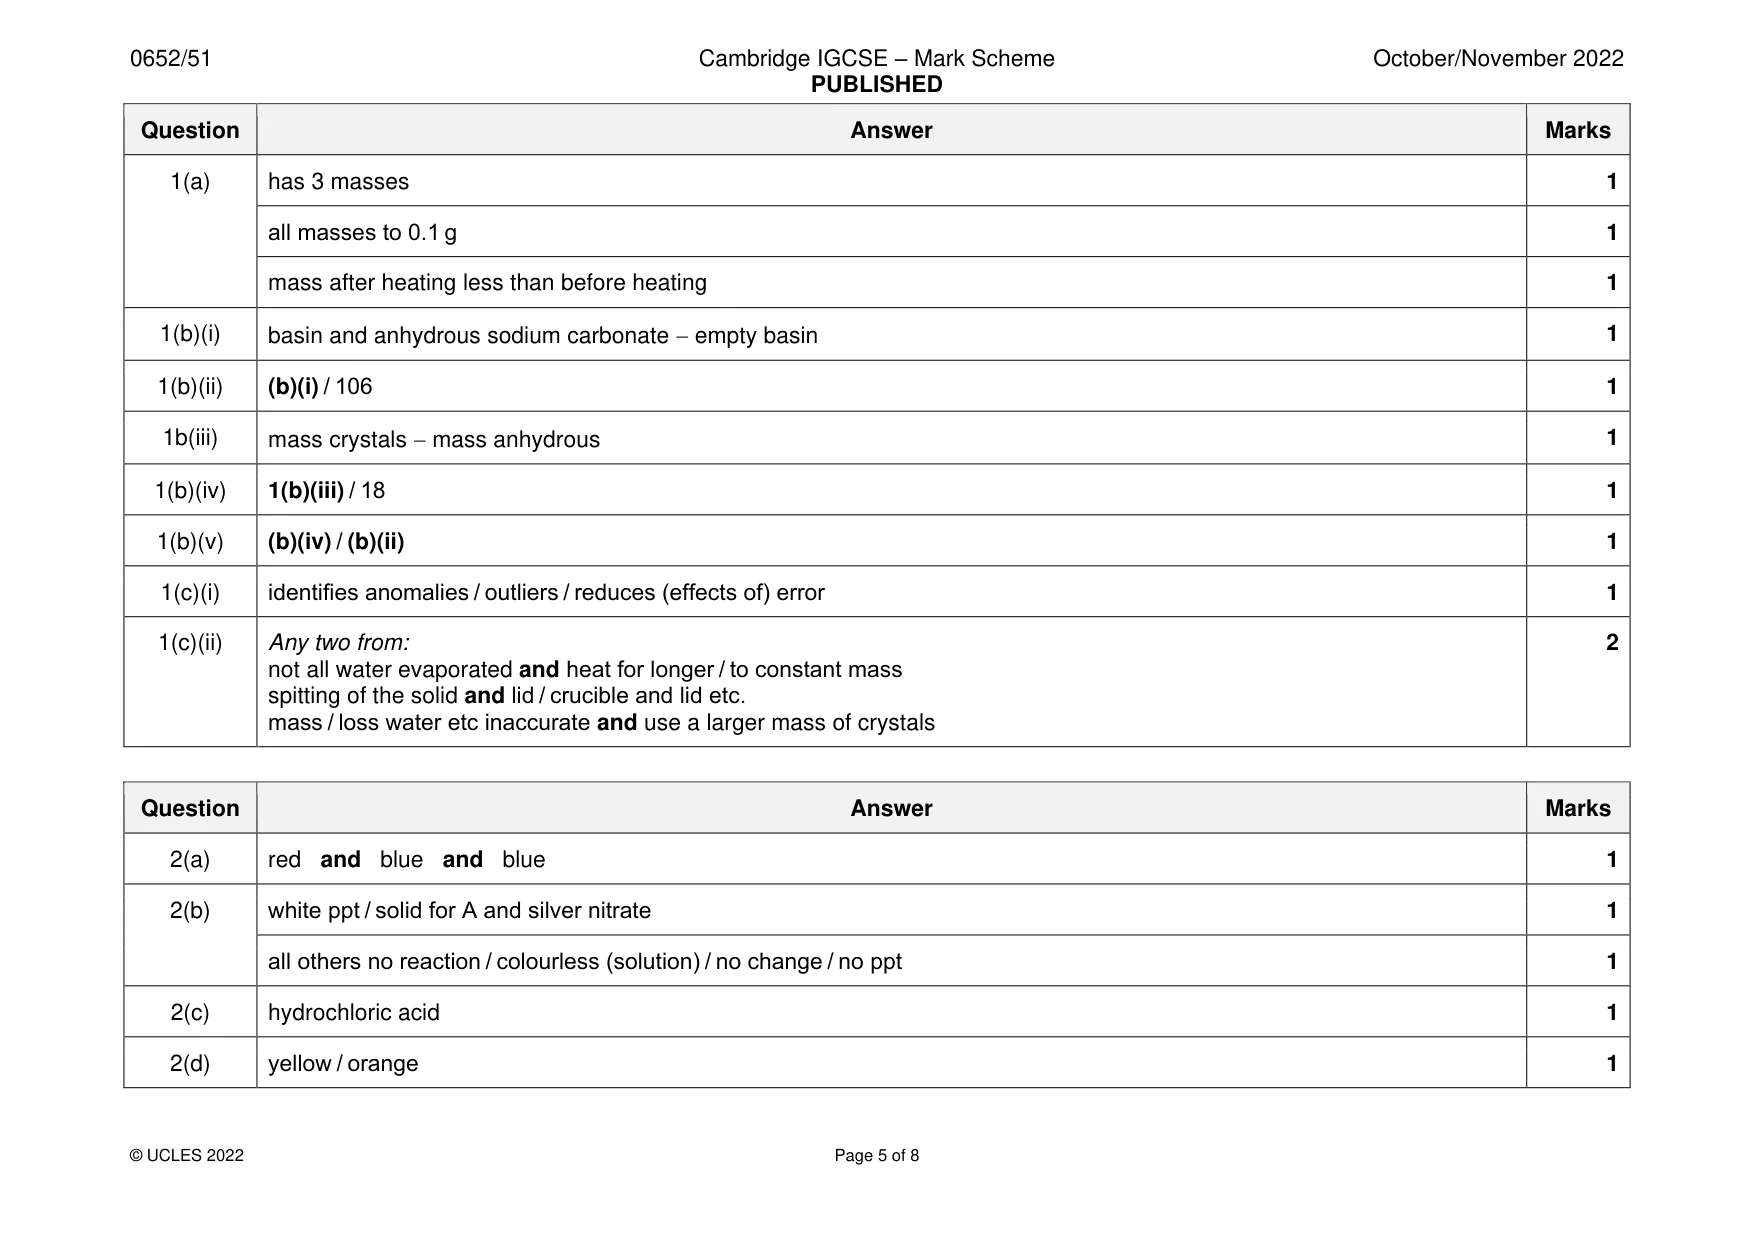
Mark scheme: 2(a) red and blue and blue 1 2(b) white ppt / solid for A and silver nitrate 1 all others no reaction / colourless (solution) / no change / no ppt 1 2(c) hydrochloric acid 1 2(d) yellow / orange 1 2(e) (pale) blue ppt / solid 1 deep blue (solution) (then (pale) blue ppt) 1 2(f) sodium hydroxide 1 ammonia solution / ammonium hydroxide 1
Q3 · In this experiment, you will determine the resistance of a resistor X
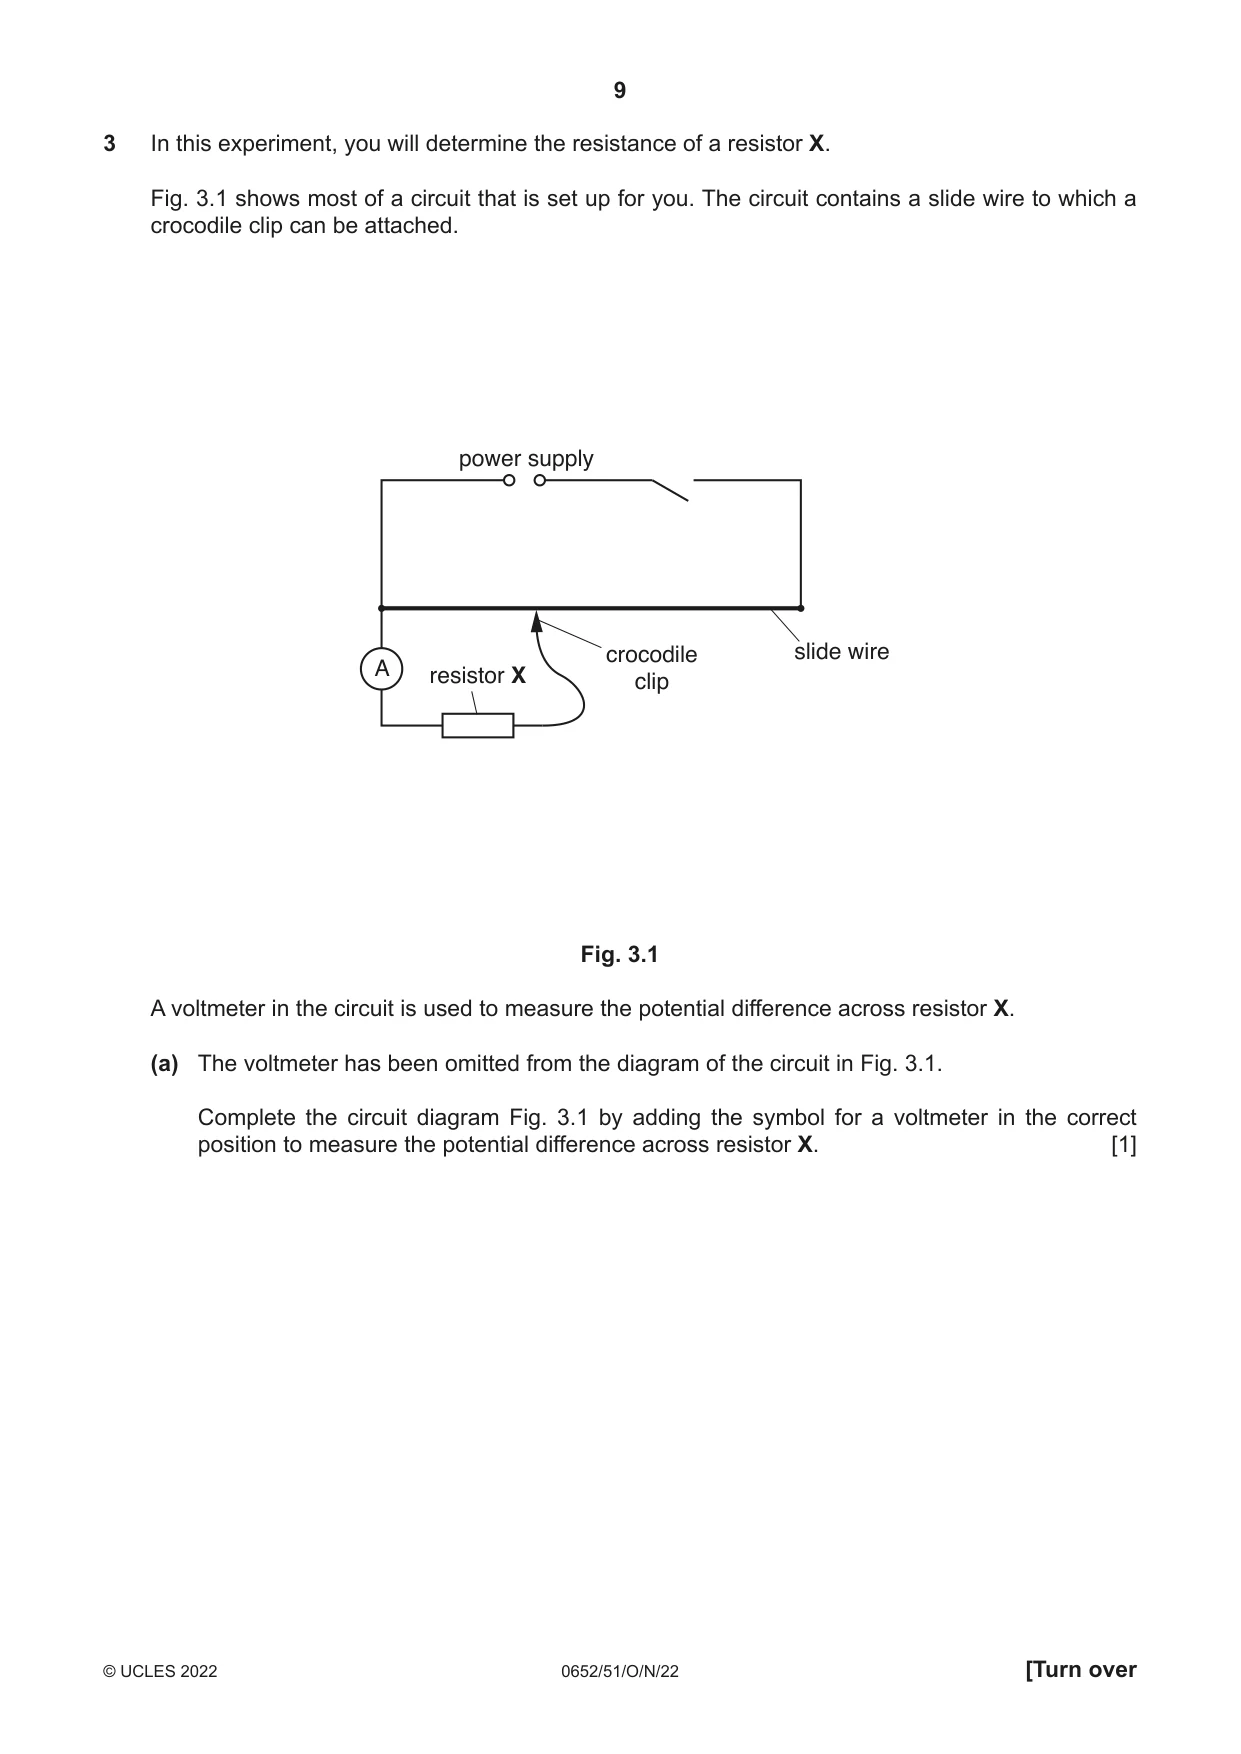
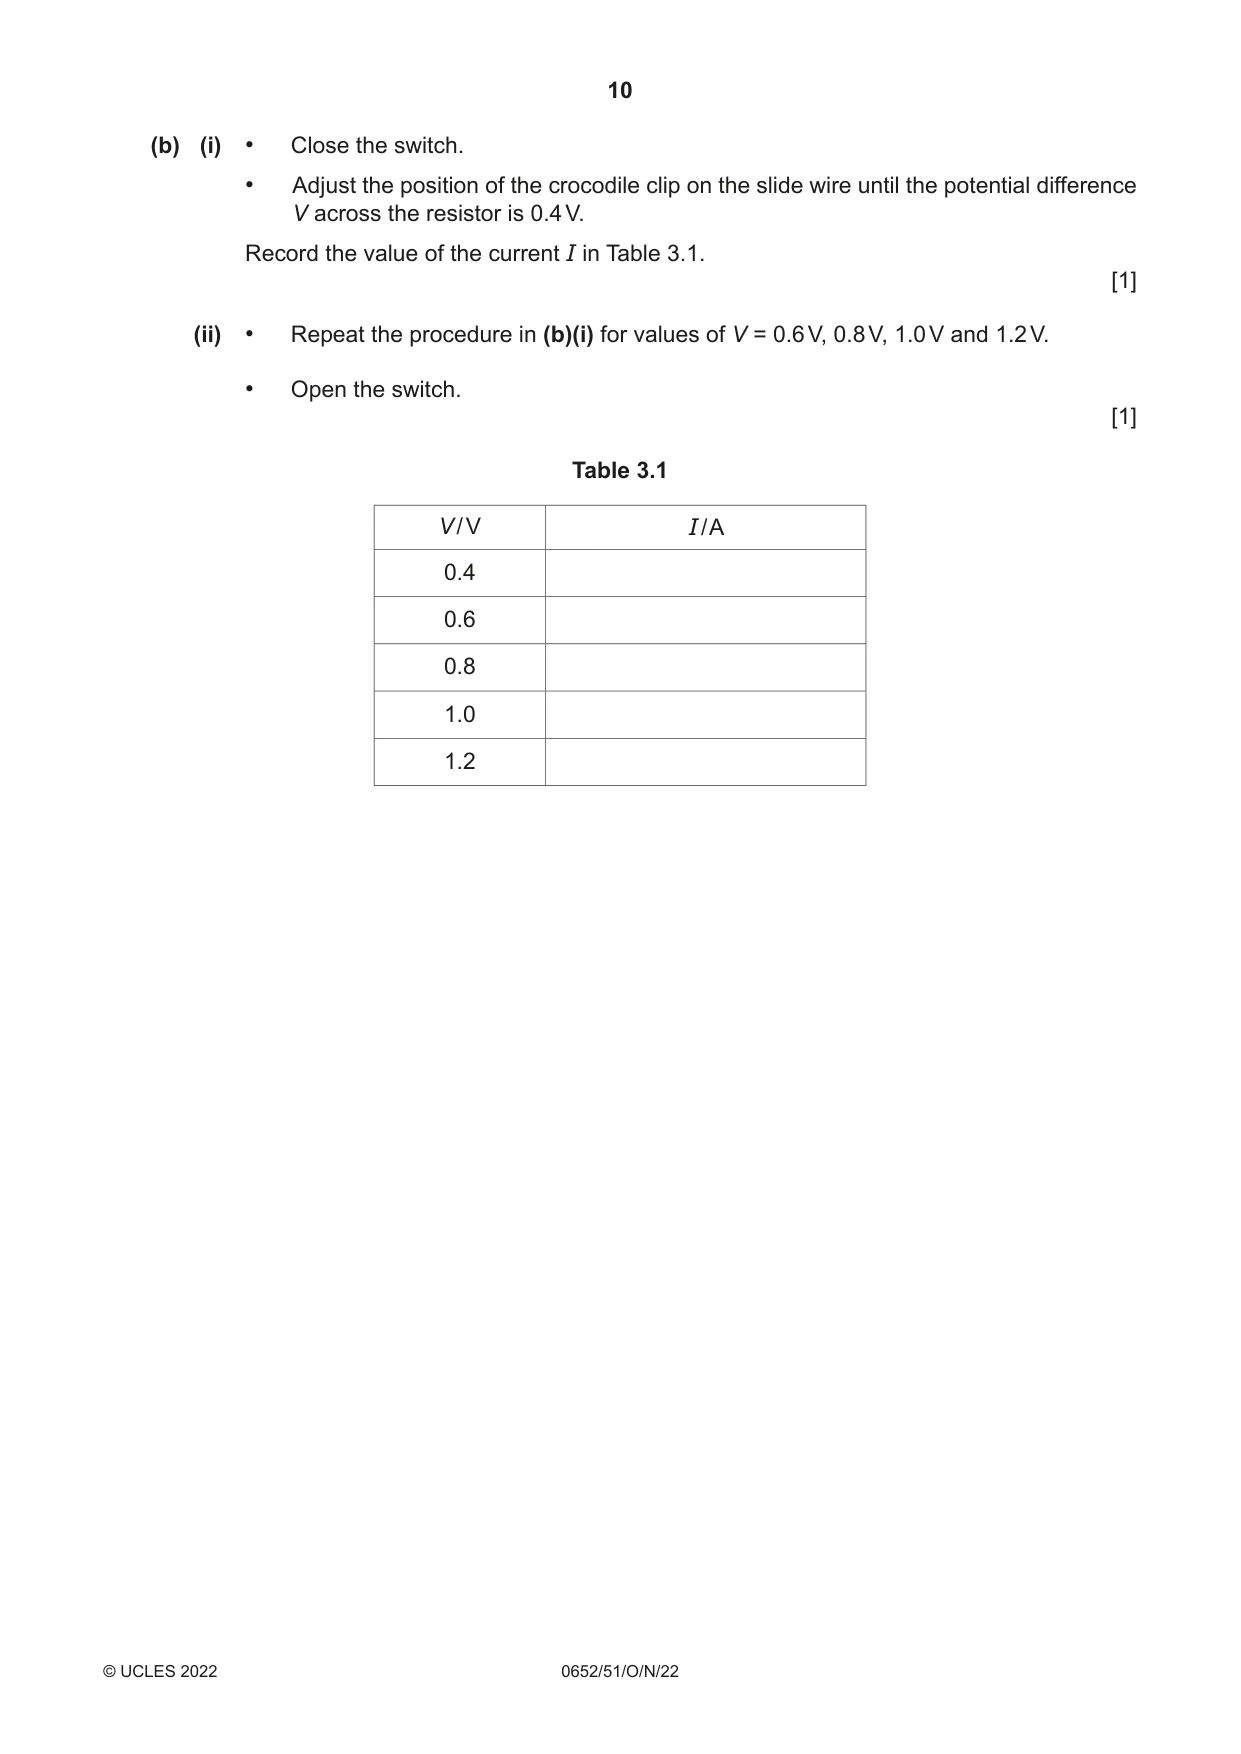
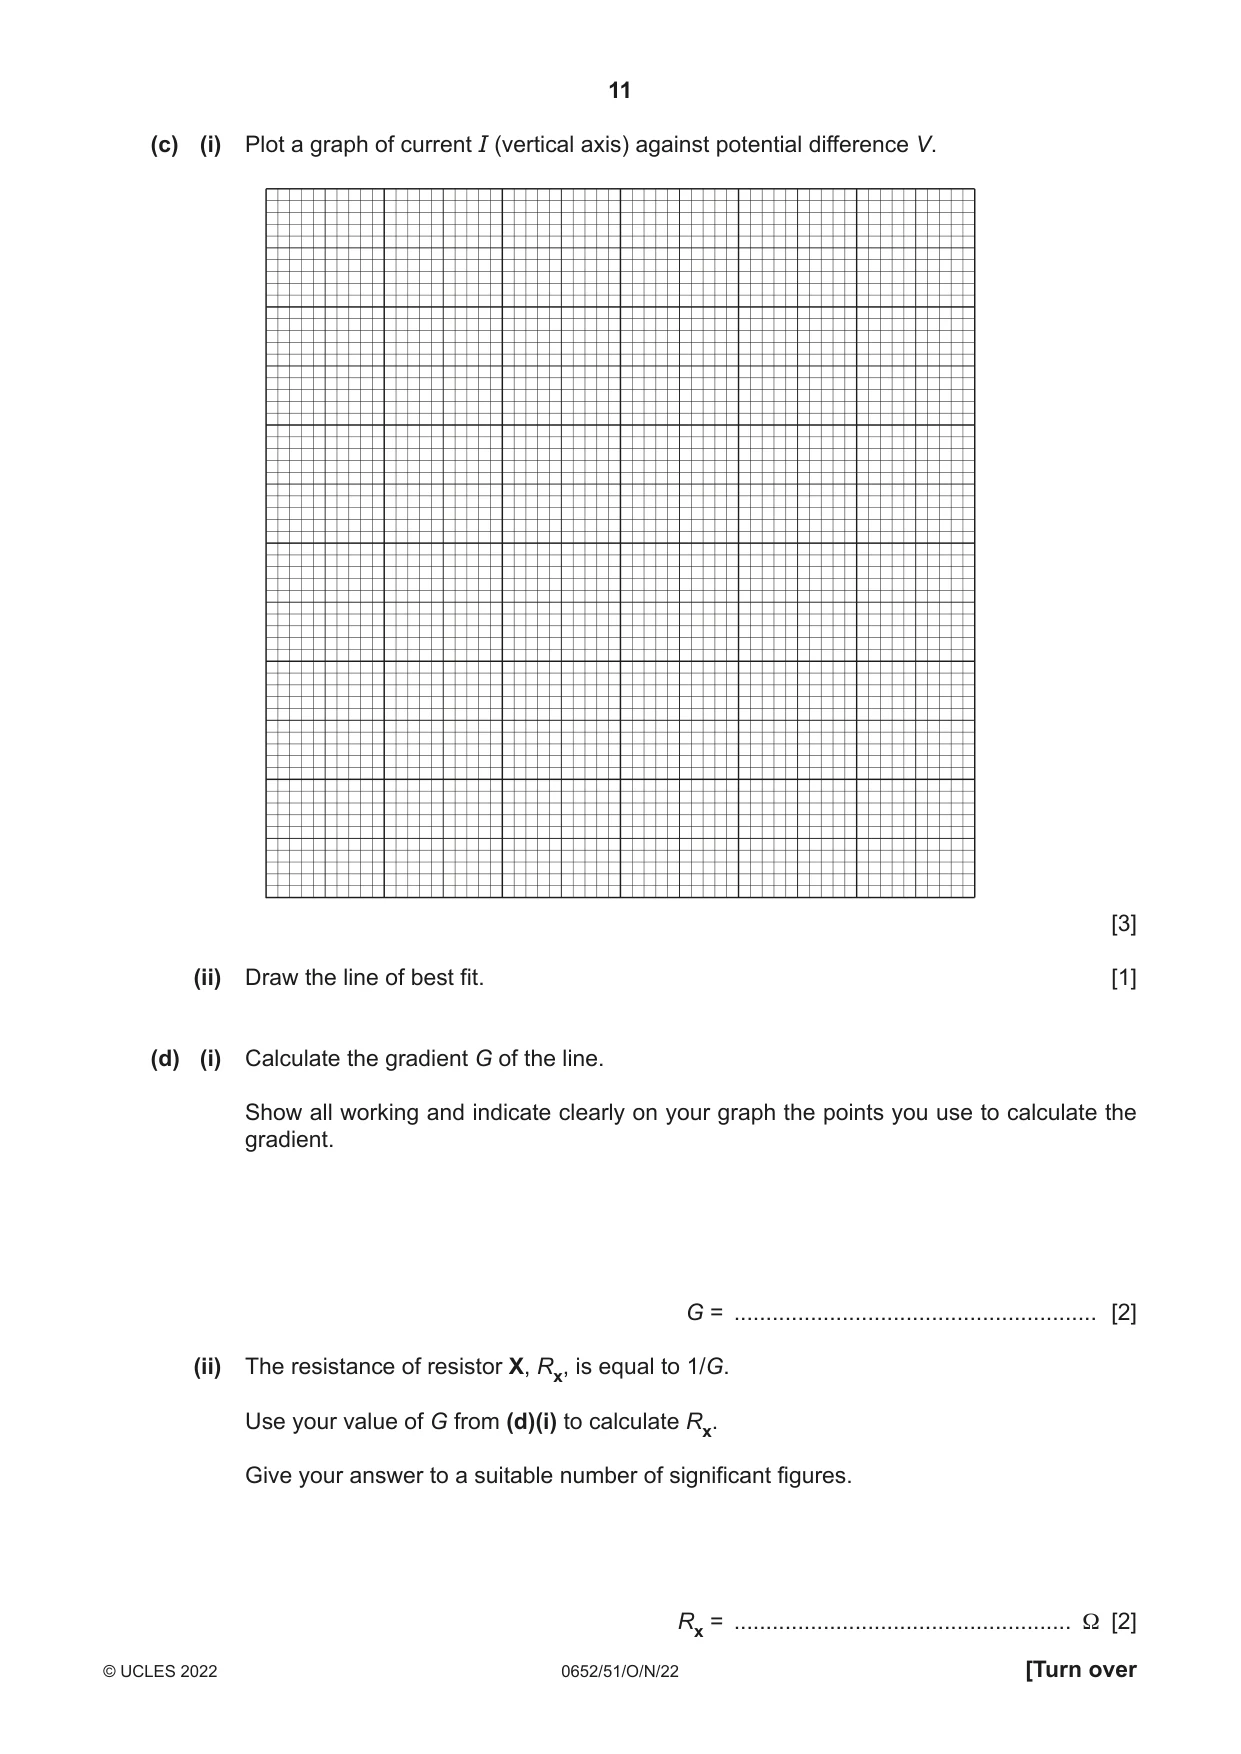
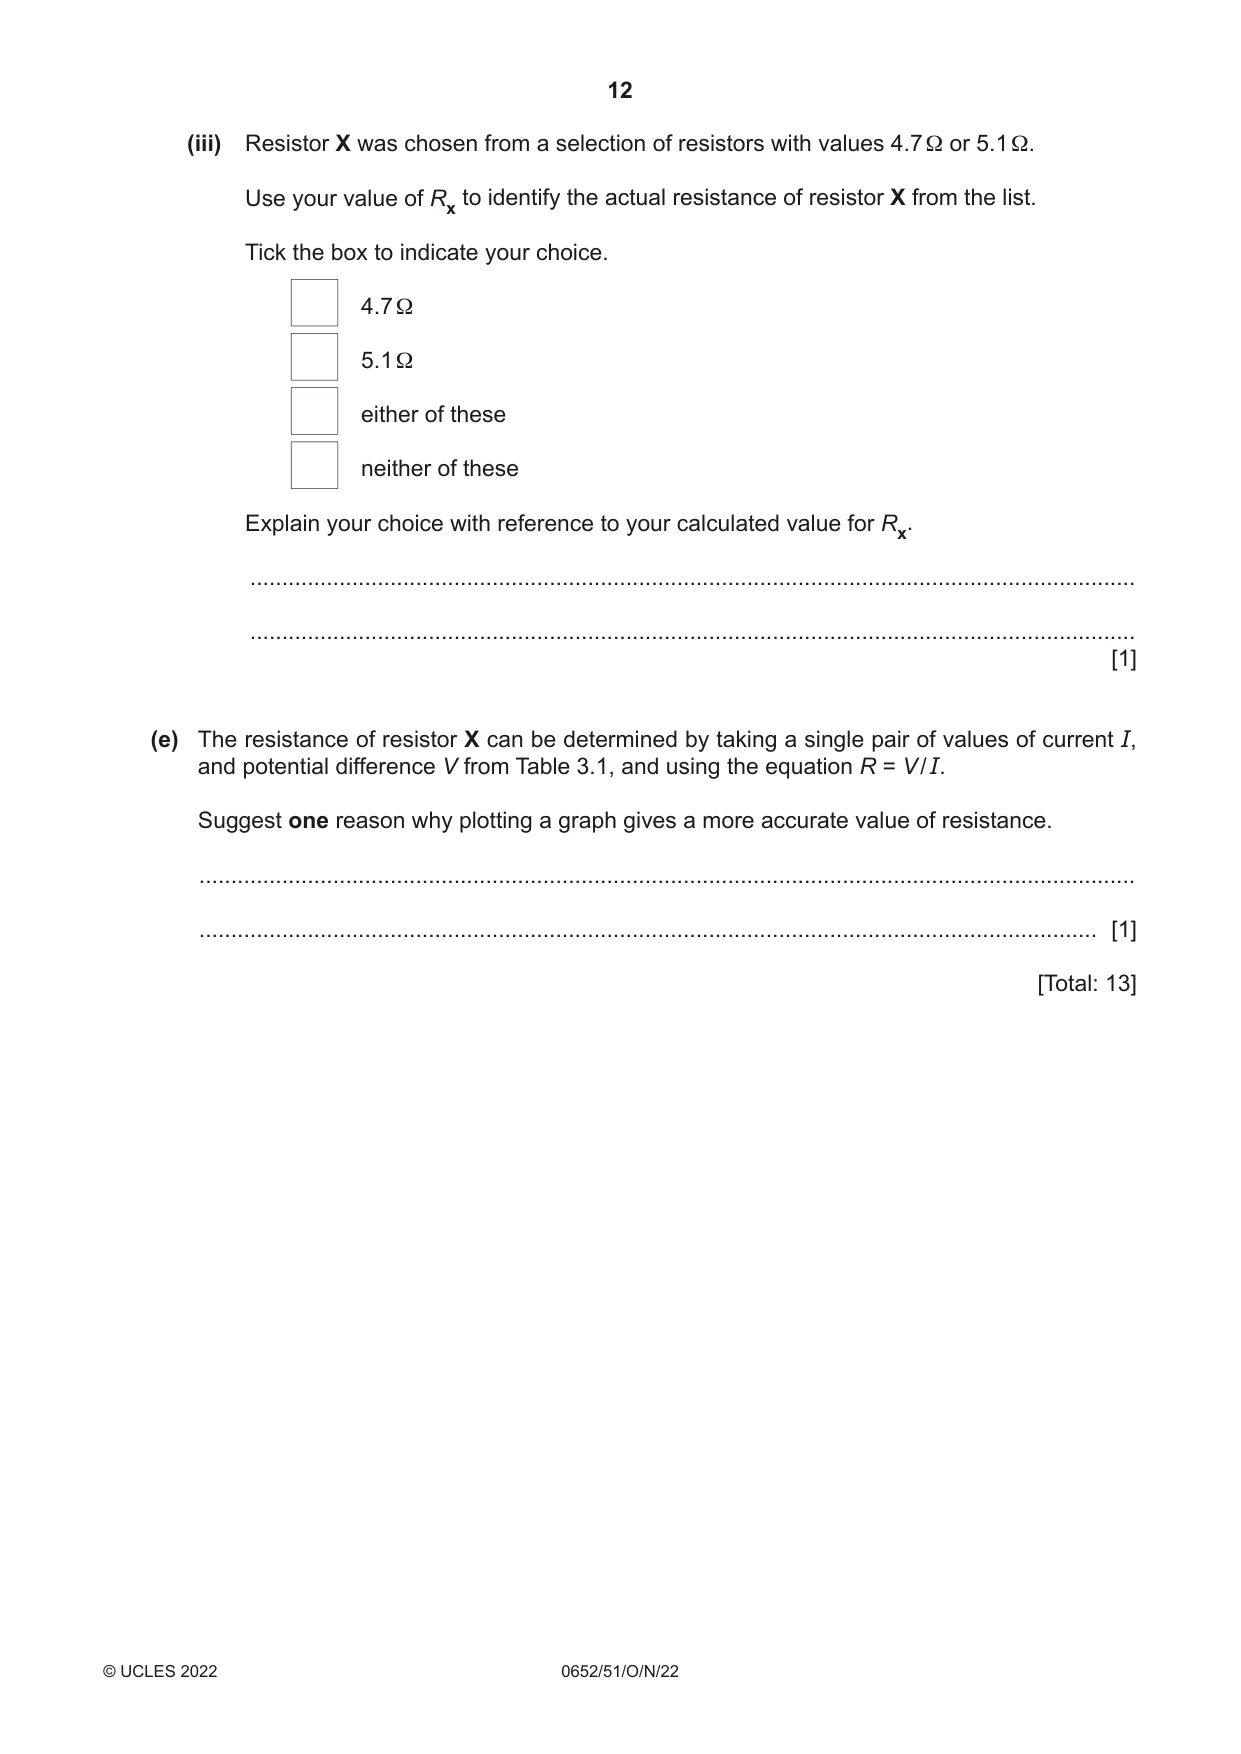
3 In this experiment, you will determine the resistance of a resistor X. Fig. 3.1 shows most of a circuit that is set up for you. The circuit contains a slide wire to which a crocodile clip can be attached. power supply crocodile slide wire A resistor X clip Fig. 3.1 A voltmeter in the circuit is used to measure the potential difference across resistor X. (a) The voltmeter has been omitted from the diagram of the circuit in Fig. 3.1. Complete the circuit diagram Fig. 3.1 by adding the symbol for a voltmeter in the correct position to measure the potential difference across resistor X. [1] (b) (i) • Close the switch. • Adjust the position of the crocodile clip on the slide wire until the potential difference V across the resistor is 0.4 V. Record the value of the current I in Table 3.1. [1] (ii) • Repeat the procedure in (b)(i) for values of V = 0.6 V, 0.8 V, 1.0 V and 1.2 V. • Open the switch. [1] Table 3.1 V / V I / A 0.4 0.6 0.8 1.0 1.2 (c) (i) Plot a graph of current I (vertical axis) against potential difference V. [3] (ii) Draw the line of best fit. [1] (d) (i) Calculate the gradient G of the line. Show all working and indicate clearly on your graph the points you use to calculate the gradient. G = ......................................................... [2] (ii) The resistance of resistor X, Rx, is equal to 1/G. Use your value of G from (d)(i) to calculate Rx. Give your answer to a suitable number of significant figures. Rx = ..................................................... Ω [2] (iii) Resistor X was chosen from a selection of resistors with values 4.7 Ω or 5.1 Ω. Use your value of Rx to identify the actual resistance of resistor X from the list. Tick the box to indicate your choice. 4.7 Ω 5.1 Ω either of these neither of these Explain your choice with reference to your calculated value for Rx. ........................................................................................................................................... ........................................................................................................................................... [1] (e) The resistance of resistor X can be determined by taking a single pair of values of current I, and potential difference V from Table 3.1, and using the equation R = V / I. Suggest one reason why plotting a graph gives a more accurate value of resistance. ................................................................................................................................................... ............................................................................................................................................. [1] [Total: 13]
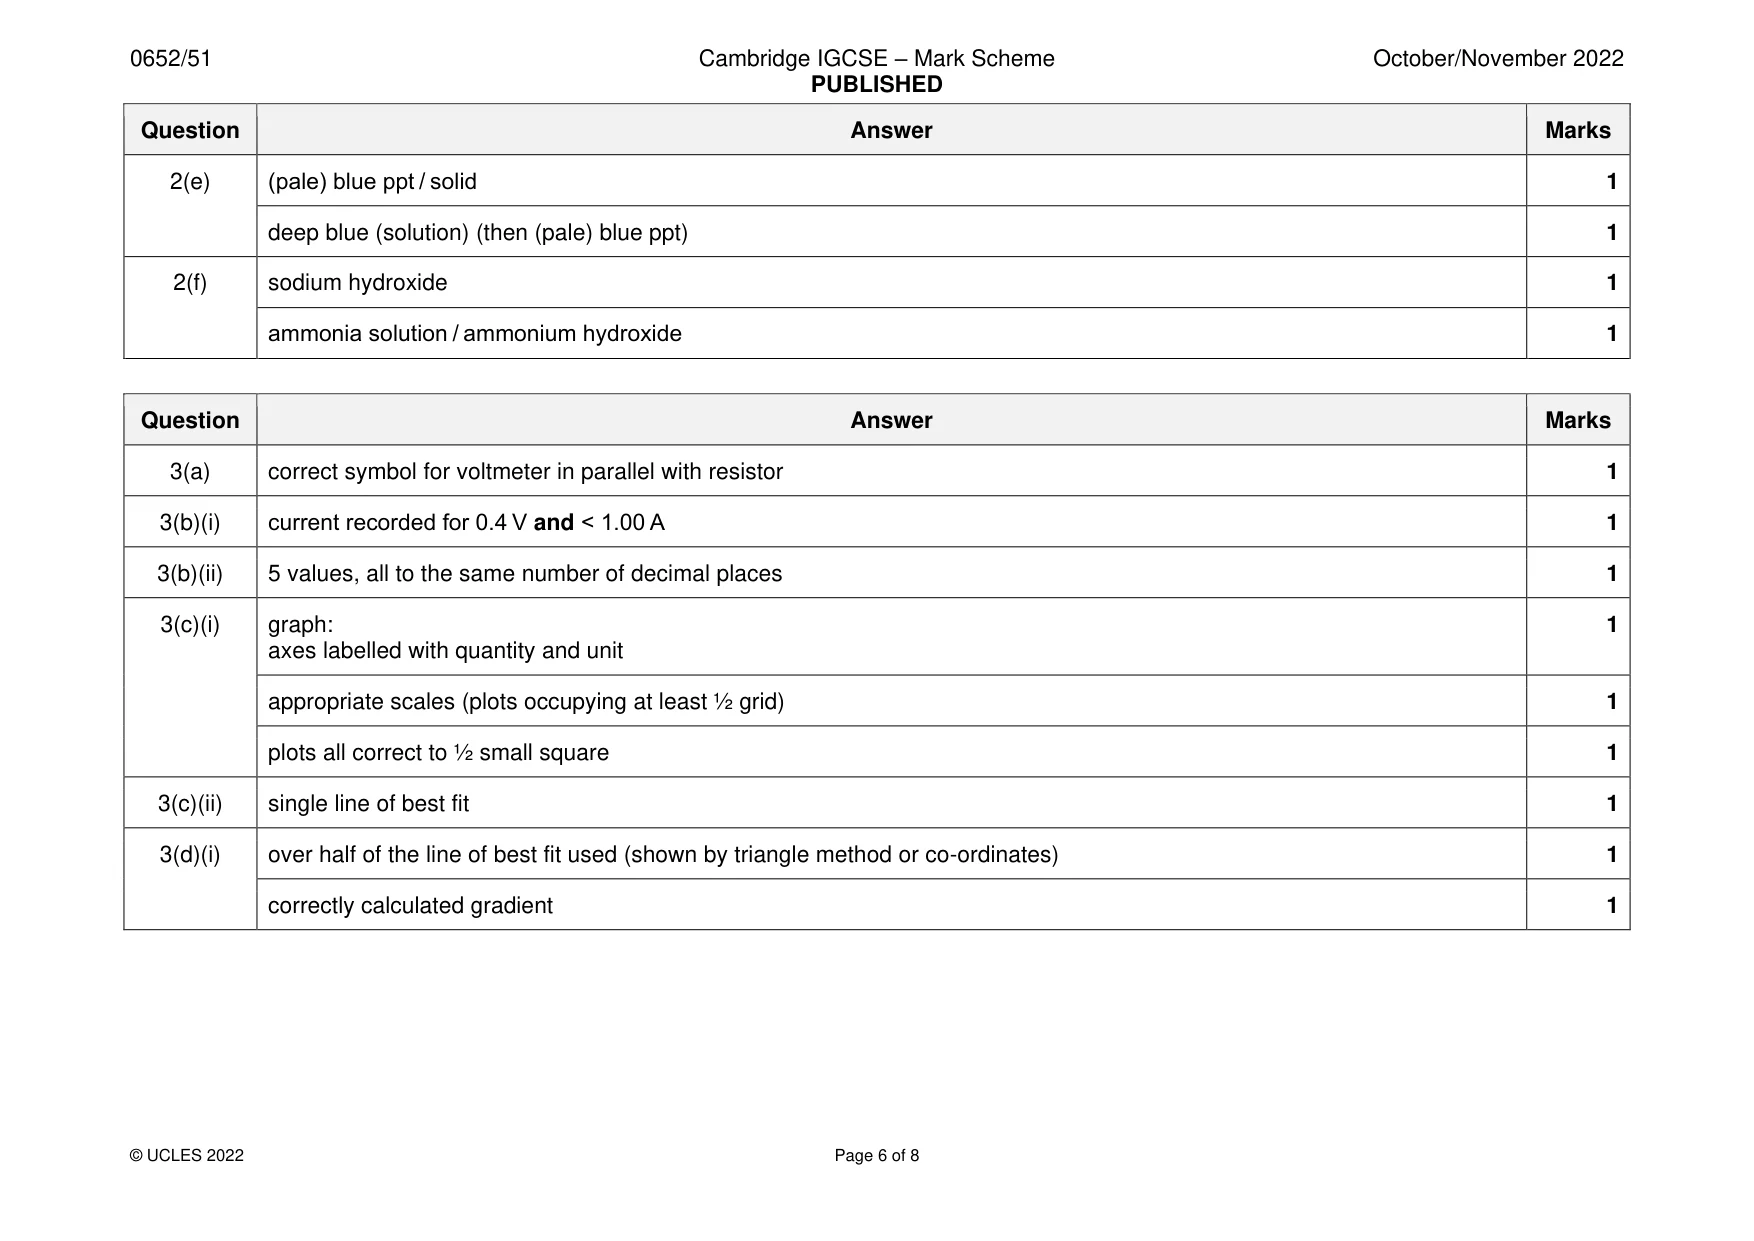
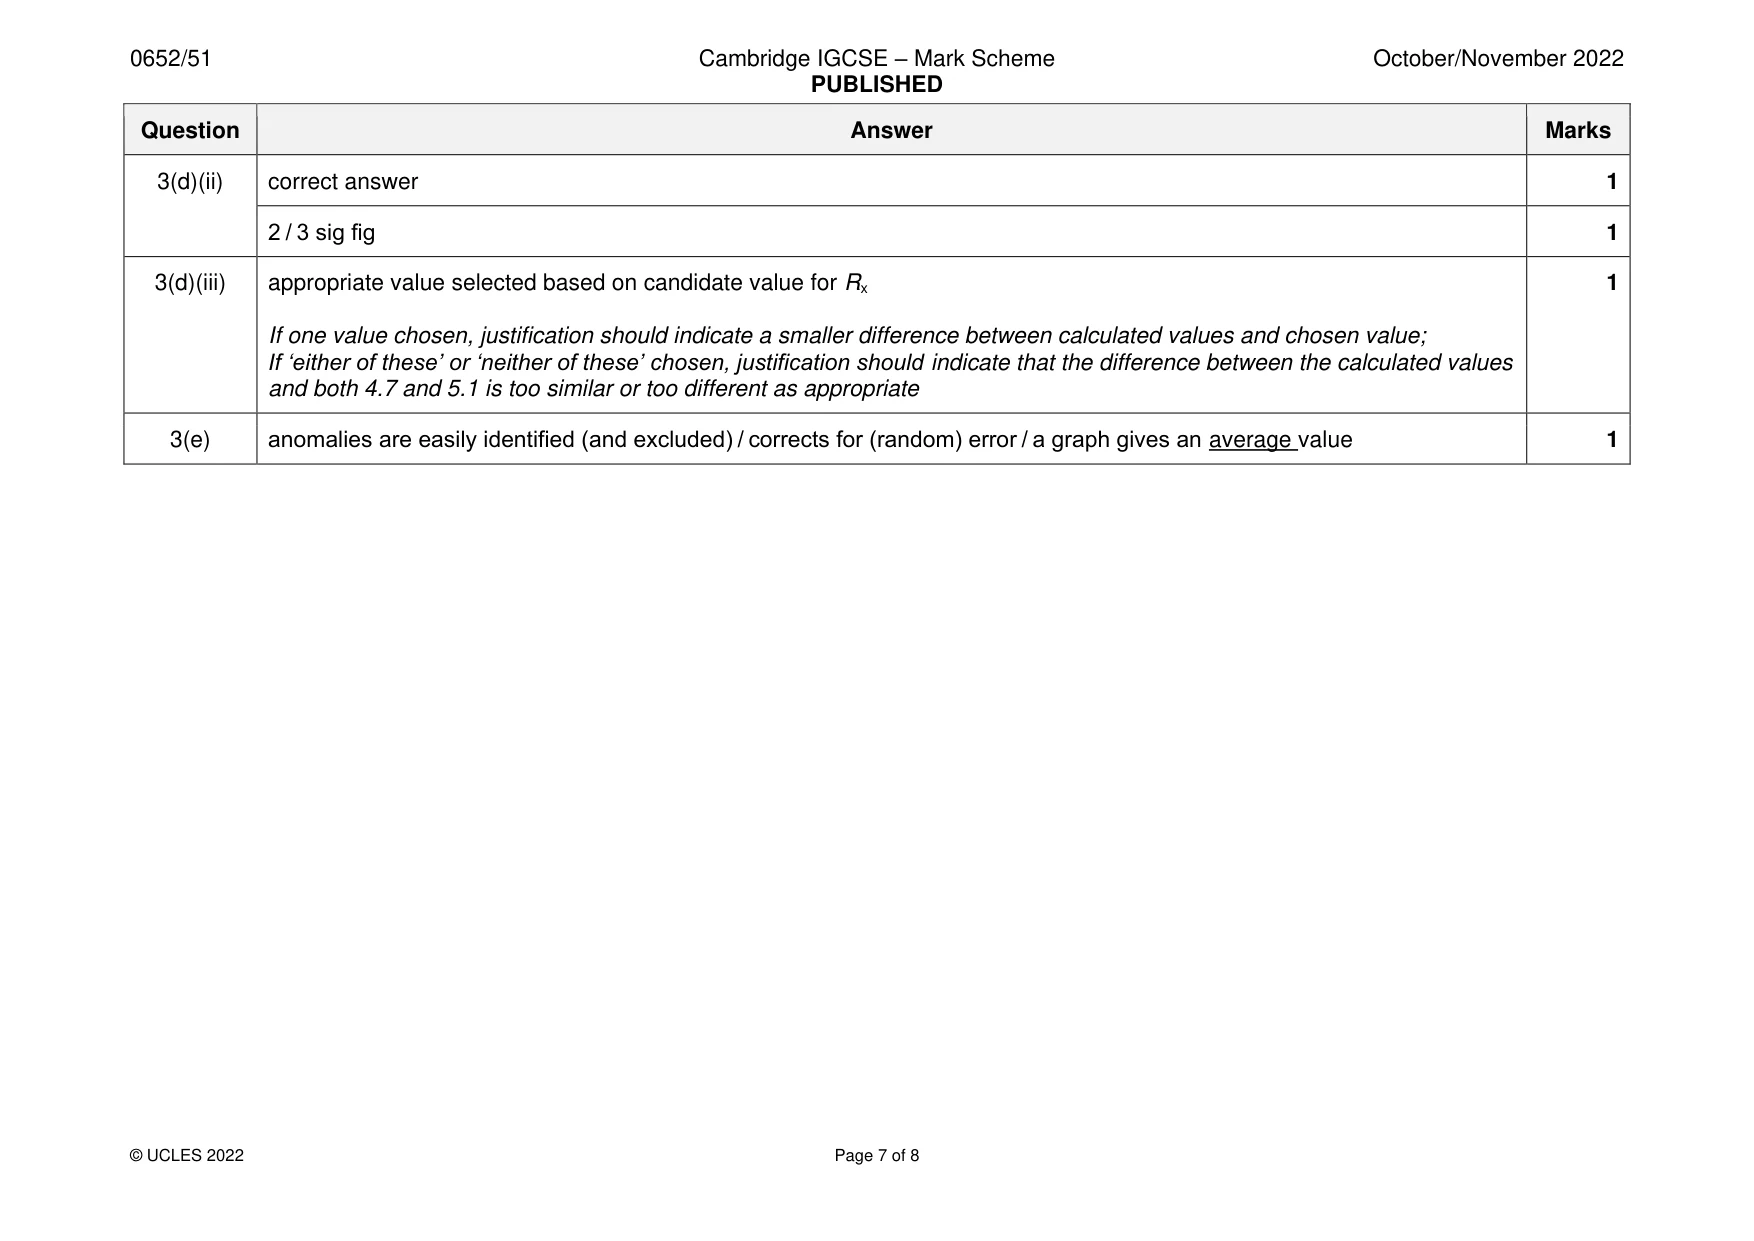
Mark scheme: 3(a) correct symbol for voltmeter in parallel with resistor 1 3(b)(i) current recorded for 0.4 V and < 1.00 A 1 3(b)(ii) 5 values, all to the same number of decimal places 1 3(c)(i) graph: 1 axes labelled with quantity and unit appropriate scales (plots occupying at least ½ grid) 1 plots all correct to ½ small square 1 3(c)(ii) single line of best fit 1 3(d)(i) over half of the line of best fit used (shown by triangle method or co-ordinates) 1 correctly calculated gradient 1 3(d)(ii) correct answer 1 2 / 3 sig fig 1 3(d)(iii) appropriate value selected based on candidate value for Rx 1 If one value chosen, justification should indicate a smaller difference between calculated values and chosen value; If ‘either of these’ or ‘neither of these’ chosen, justification should indicate that the difference between the calculated values and both 4.7 and 5.1 is too similar or too different as appropriate 3(e) anomalies are easily identified (and excluded) / corrects for (random) error / a graph gives an average value 1
Q4 · A student suggests that the starting temperature of hot water affects its rate of cooling
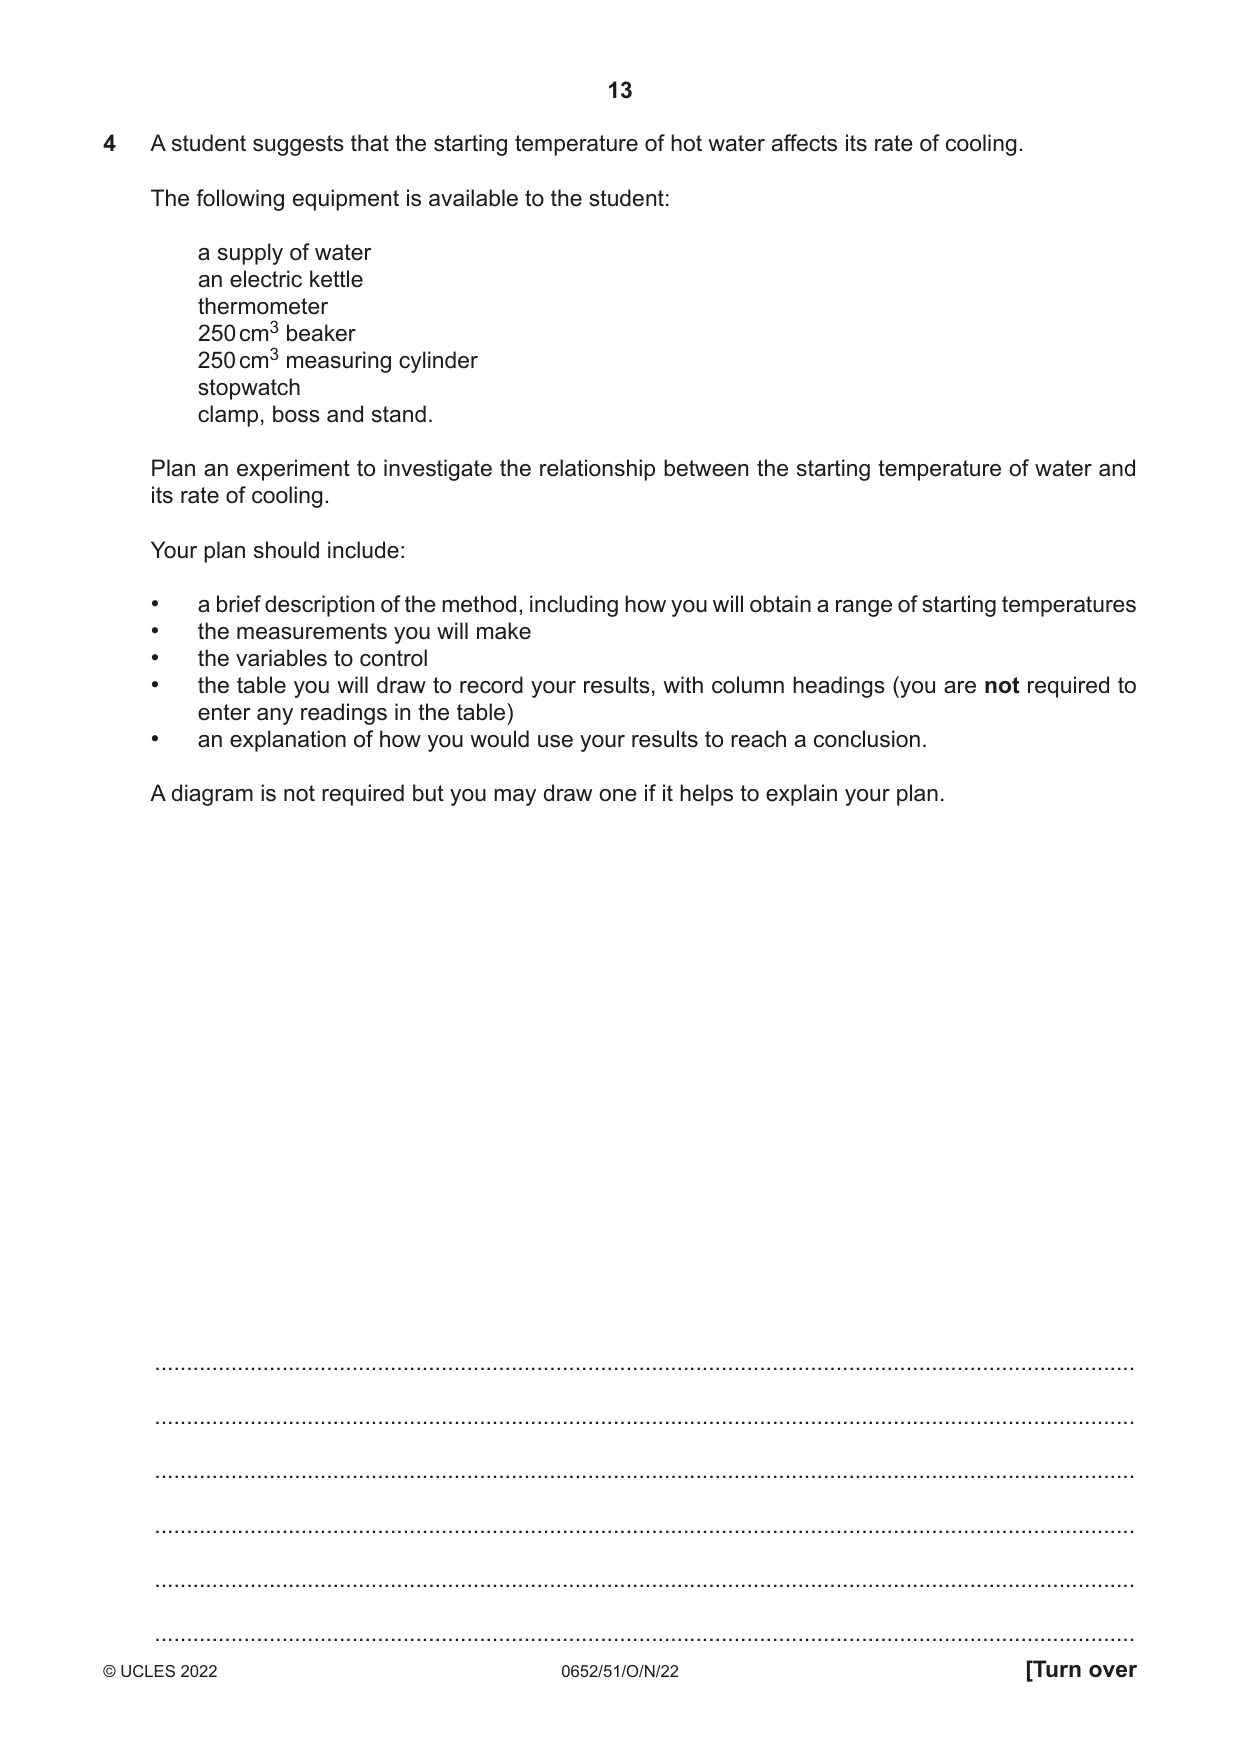
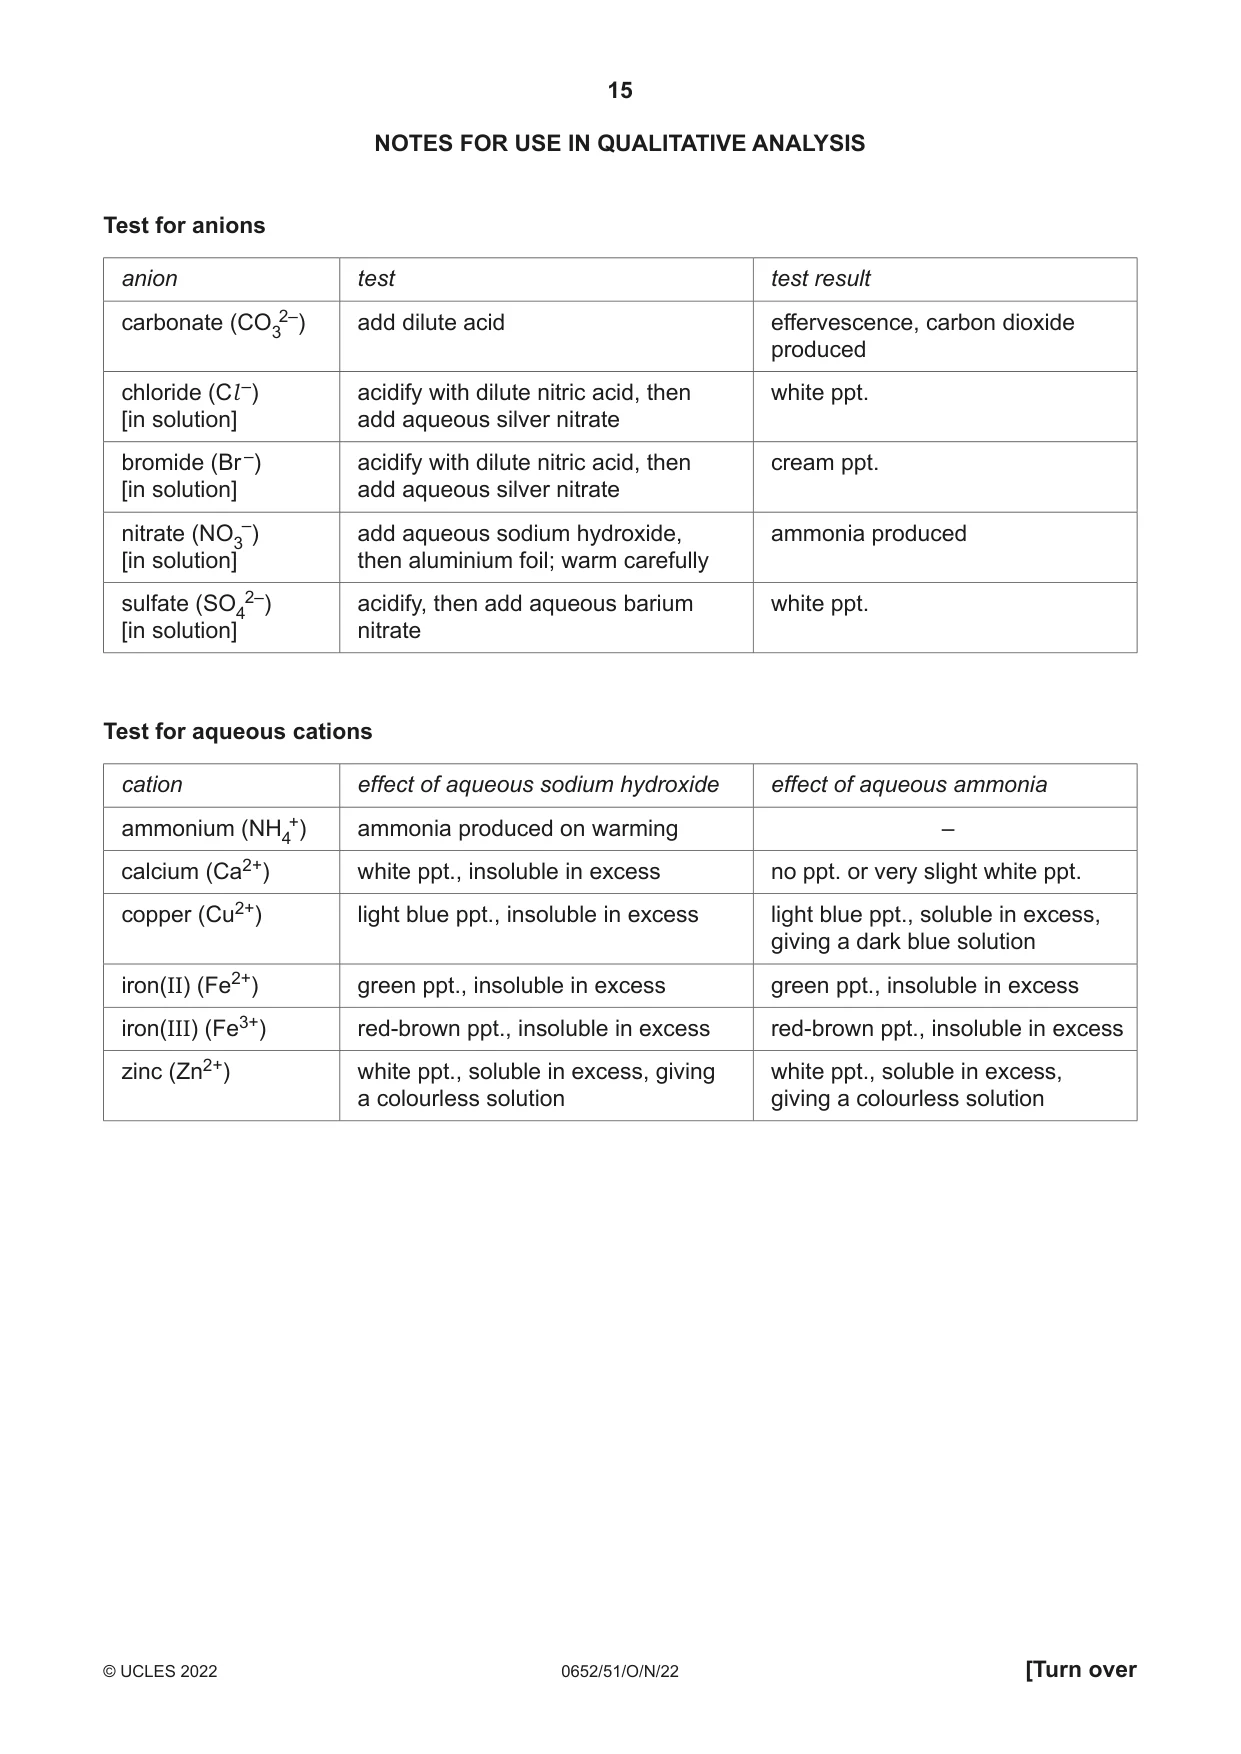
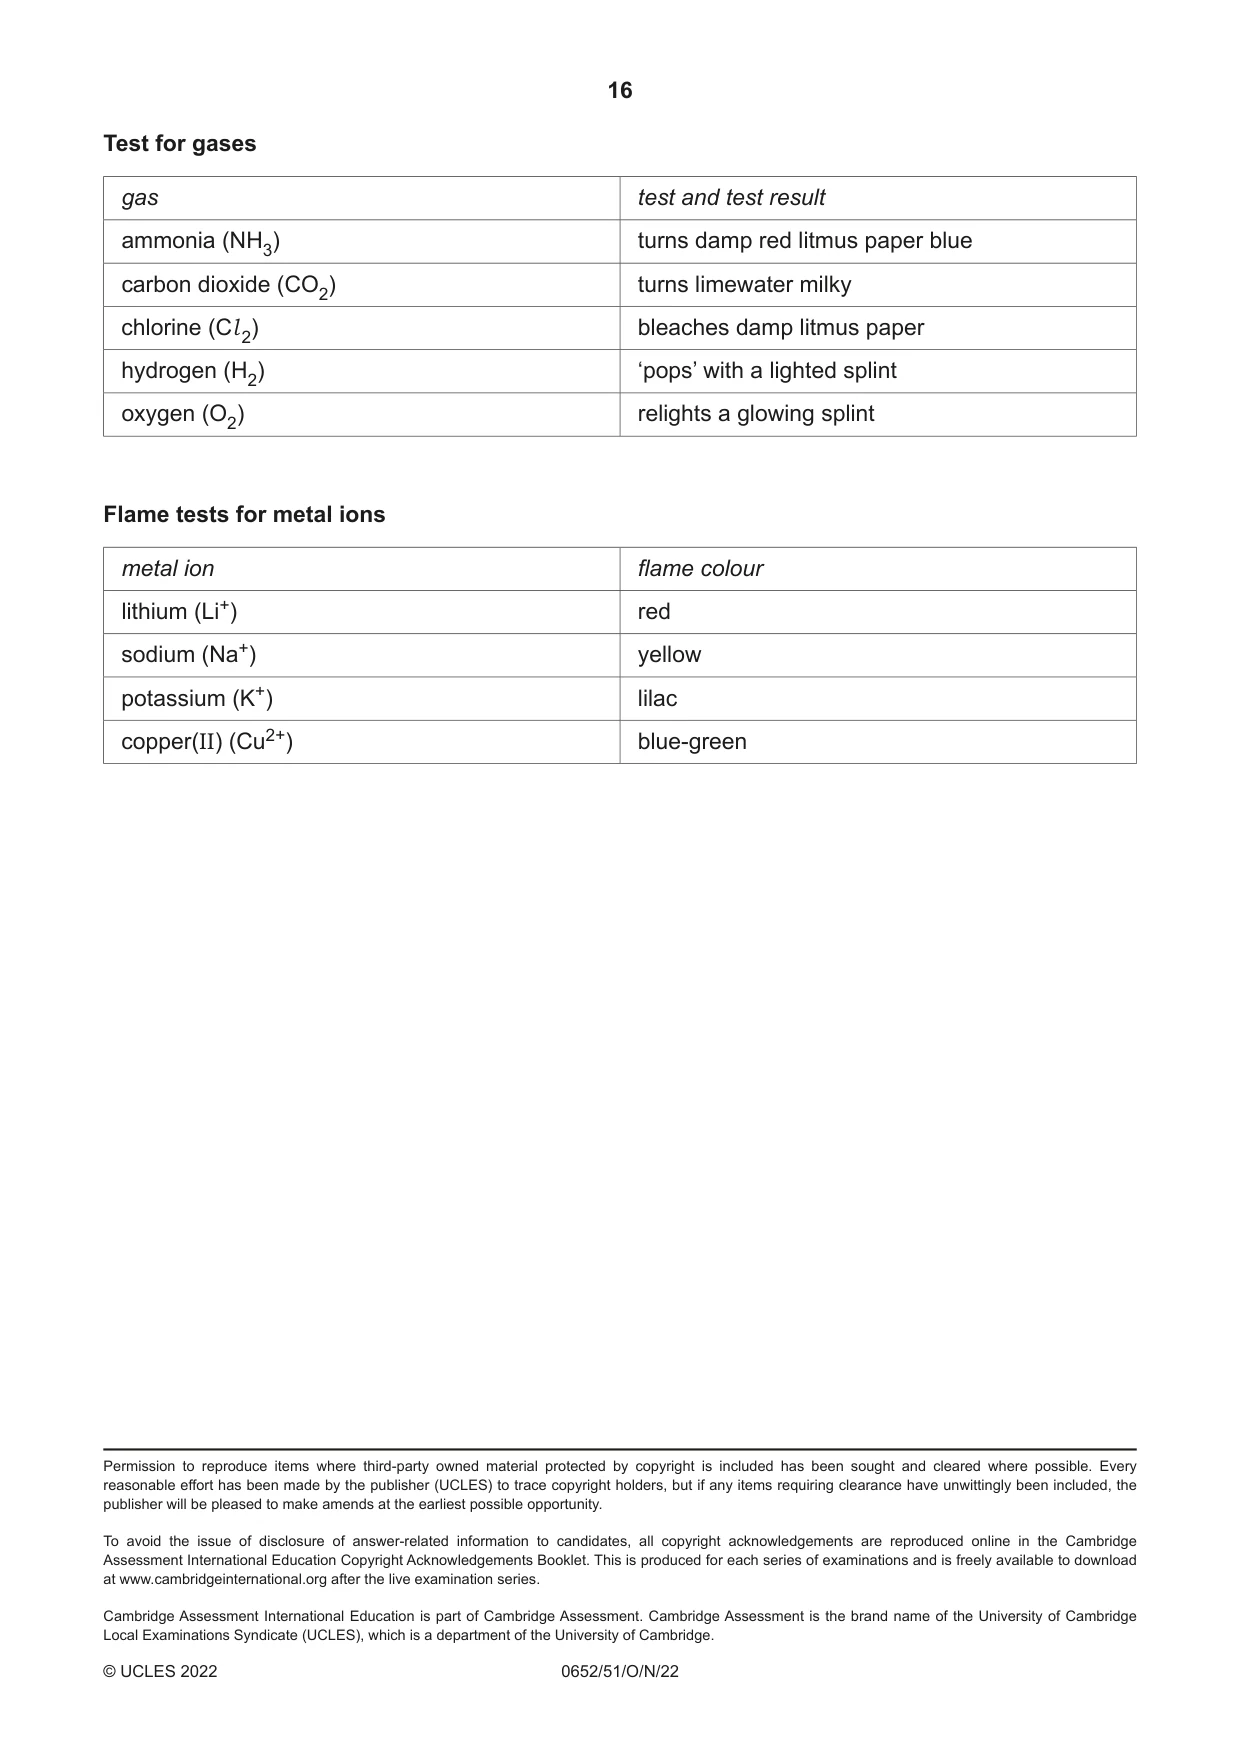
4 A student suggests that the starting temperature of hot water affects its rate of cooling. The following equipment is available to the student: a supply of water an electric kettle thermometer 250 cm3 beaker 250 cm3 measuring cylinder stopwatch clamp, boss and stand. Plan an experiment to investigate the relationship between the starting temperature of water and its rate of cooling. Your plan should include: • a brief description of the method, including how you will obtain a range of starting temperatures • the measurements you will make • the variables to control • the table you will draw to record your results, with column headings (you are not required to enter any readings in the table) • an explanation of how you would use your results to reach a conclusion. A diagram is not required but you may draw one if it helps to explain your plan. .......................................................................................................................................................... .......................................................................................................................................................... .......................................................................................................................................................... .......................................................................................................................................................... .......................................................................................................................................................... .......................................................................................................................................................... .......................................................................................................................................................... .......................................................................................................................................................... .......................................................................................................................................................... .......................................................................................................................................................... .......................................................................................................................................................... .......................................................................................................................................................... .......................................................................................................................................................... .......................................................................................................................................................... .......................................................................................................................................................... .......................................................................................................................................................... .......................................................................................................................................................... .......................................................................................................................................................... .......................................................................................................................................................... .......................................................................................................................................................... .......................................................................................................................................................... .......................................................................................................................................................... .......................................................................................................................................................... .......................................................................................................................................................... .......................................................................................................................................................... .......................................................................................................................................................... .......................................................................................................................................................... .......................................................................................................................................................... .......................................................................................................................................................... .......................................................................................................................................................... .......................................................................................................................................................... .......................................................................................................................................................... .................................................................................................................................................... [7] NOTES FOR USE IN QUALITATIVE ANALYSIS Test for anions anion test test result carbonate (CO32–) add dilute acid effervescence, carbon dioxide produced chloride (Cl –) acidify with dilute nitric acid, then white ppt. [in solution] add aqueous silver nitrate bromide (Br –) acidify with dilute nitric acid, then cream ppt. [in solution] add aqueous silver nitrate nitrate (NO3–) add aqueous sodium hydroxide, ammonia produced [in solution] then aluminium foil; warm carefully sulfate (SO42–) acidify, then add aqueous barium white ppt. [in solution] nitrate Test for aqueous cations cation effect of aqueous sodium hydroxide effect of aqueous ammonia ammonium (NH4+) ammonia produced on warming – calcium (Ca2+) white ppt., insoluble in excess no ppt. or very slight white ppt. copper (Cu2+) light blue ppt., insoluble in excess light blue ppt., soluble in excess, giving a dark blue solution iron(II) (Fe2+) green ppt., insoluble in excess green ppt., insoluble in excess iron(III) (Fe3+) red-brown ppt., insoluble in excess red-brown ppt., insoluble in excess zinc (Zn2+) white ppt., soluble in excess, giving white ppt., soluble in excess, a colourless solution giving a colourless solution
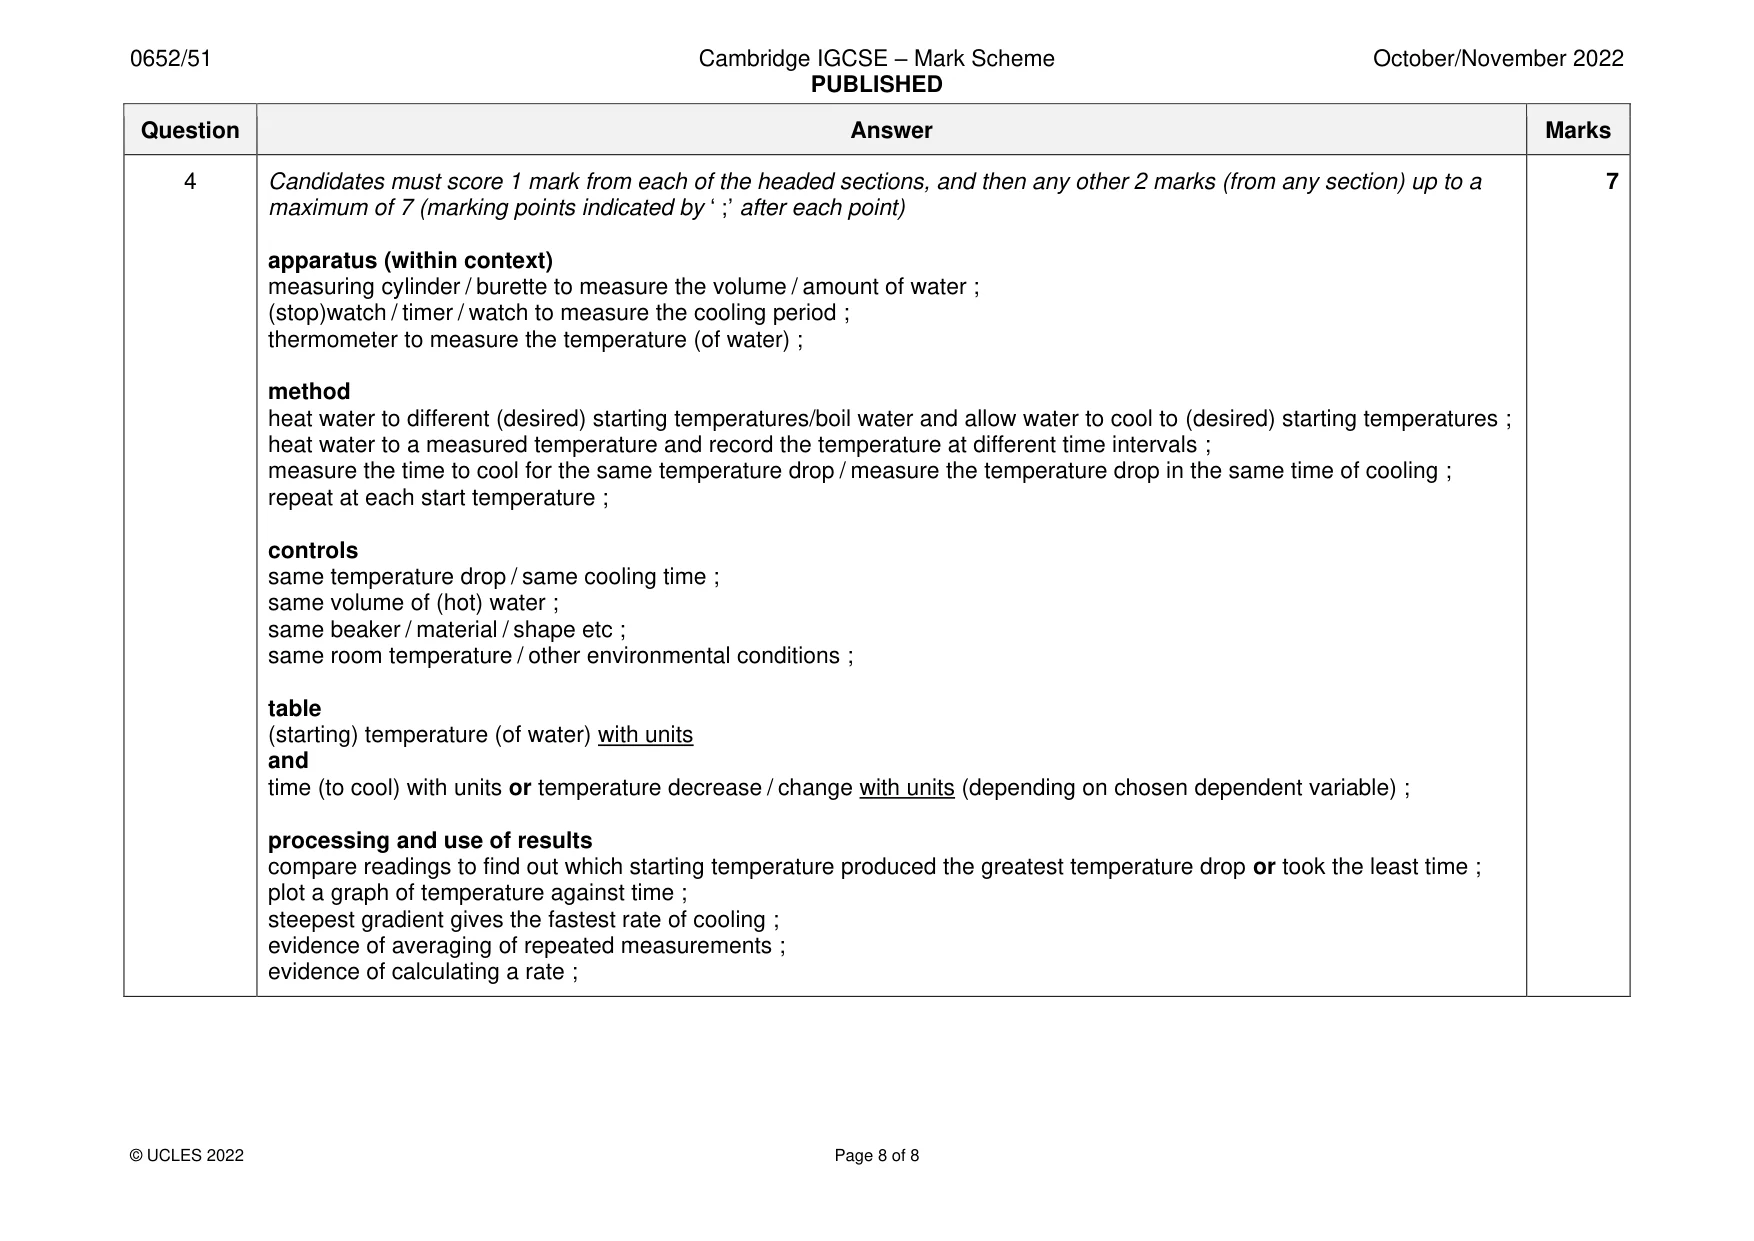
Mark scheme: 4 Candidates must score 1 mark from each of the headed sections, and then any other 2 marks (from any section) up to a 7 maximum of 7 (marking points indicated by ‘ ;’ after each point) apparatus (within context) measuring cylinder / burette to measure the volume / amount of water ; (stop)watch / timer / watch to measure the cooling period ; thermometer to measure the temperature (of water) ; method heat water to different (desired) starting temperatures/boil water and allow water to cool to (desired) starting temperatures ; heat water to a measured temperature and record the temperature at different time intervals ; measure the time to cool for the same temperature drop / measure the temperature drop in the same time of cooling ; repeat at each start temperature ; controls same temperature drop / same cooling time ; same volume of (hot) water ; same beaker / material / shape etc ; same room temperature / other environmental conditions ; table (starting) temperature (of water) with units and time (to cool) with units or temperature decrease / change with units (depending on chosen dependent variable) ; processing and use of results compare readings to find out which starting temperature produced the greatest temperature drop or took the least time ; plot a graph of temperature against time ; steepest gradient gives the fastest rate of cooling ; evidence of averaging of repeated measurements ; evidence of calculating a rate ;
What was in this paper
The subtopics covered by these 4 questions, and how many questions each got. Open one in a new tab to see every Cambridge question on it.
What you needed in this session
Cambridge’s own grade thresholds for 2022 Oct/Nov, Paper 5 · Variant 1. A higher threshold means an easier paper — the bar moves with how the cohort did.