Cambridge IGCSE Physical Science 0652 — 2017 Oct/Nov Paper 5 · Variant 1
0652/51/O/N/17 · 2 questions · 30 marks · ≈34 min
The question paper and its mark scheme, free to read here and free to download. This is Cambridge’s own paper, exactly as it was sat.
Question paper8 pages

Mark scheme3 pages
Answers below. Sit the paper first if you are practising.
Questions as text
Q1 · Notes for use in Qualitative Analysis for this question are printed on page 8
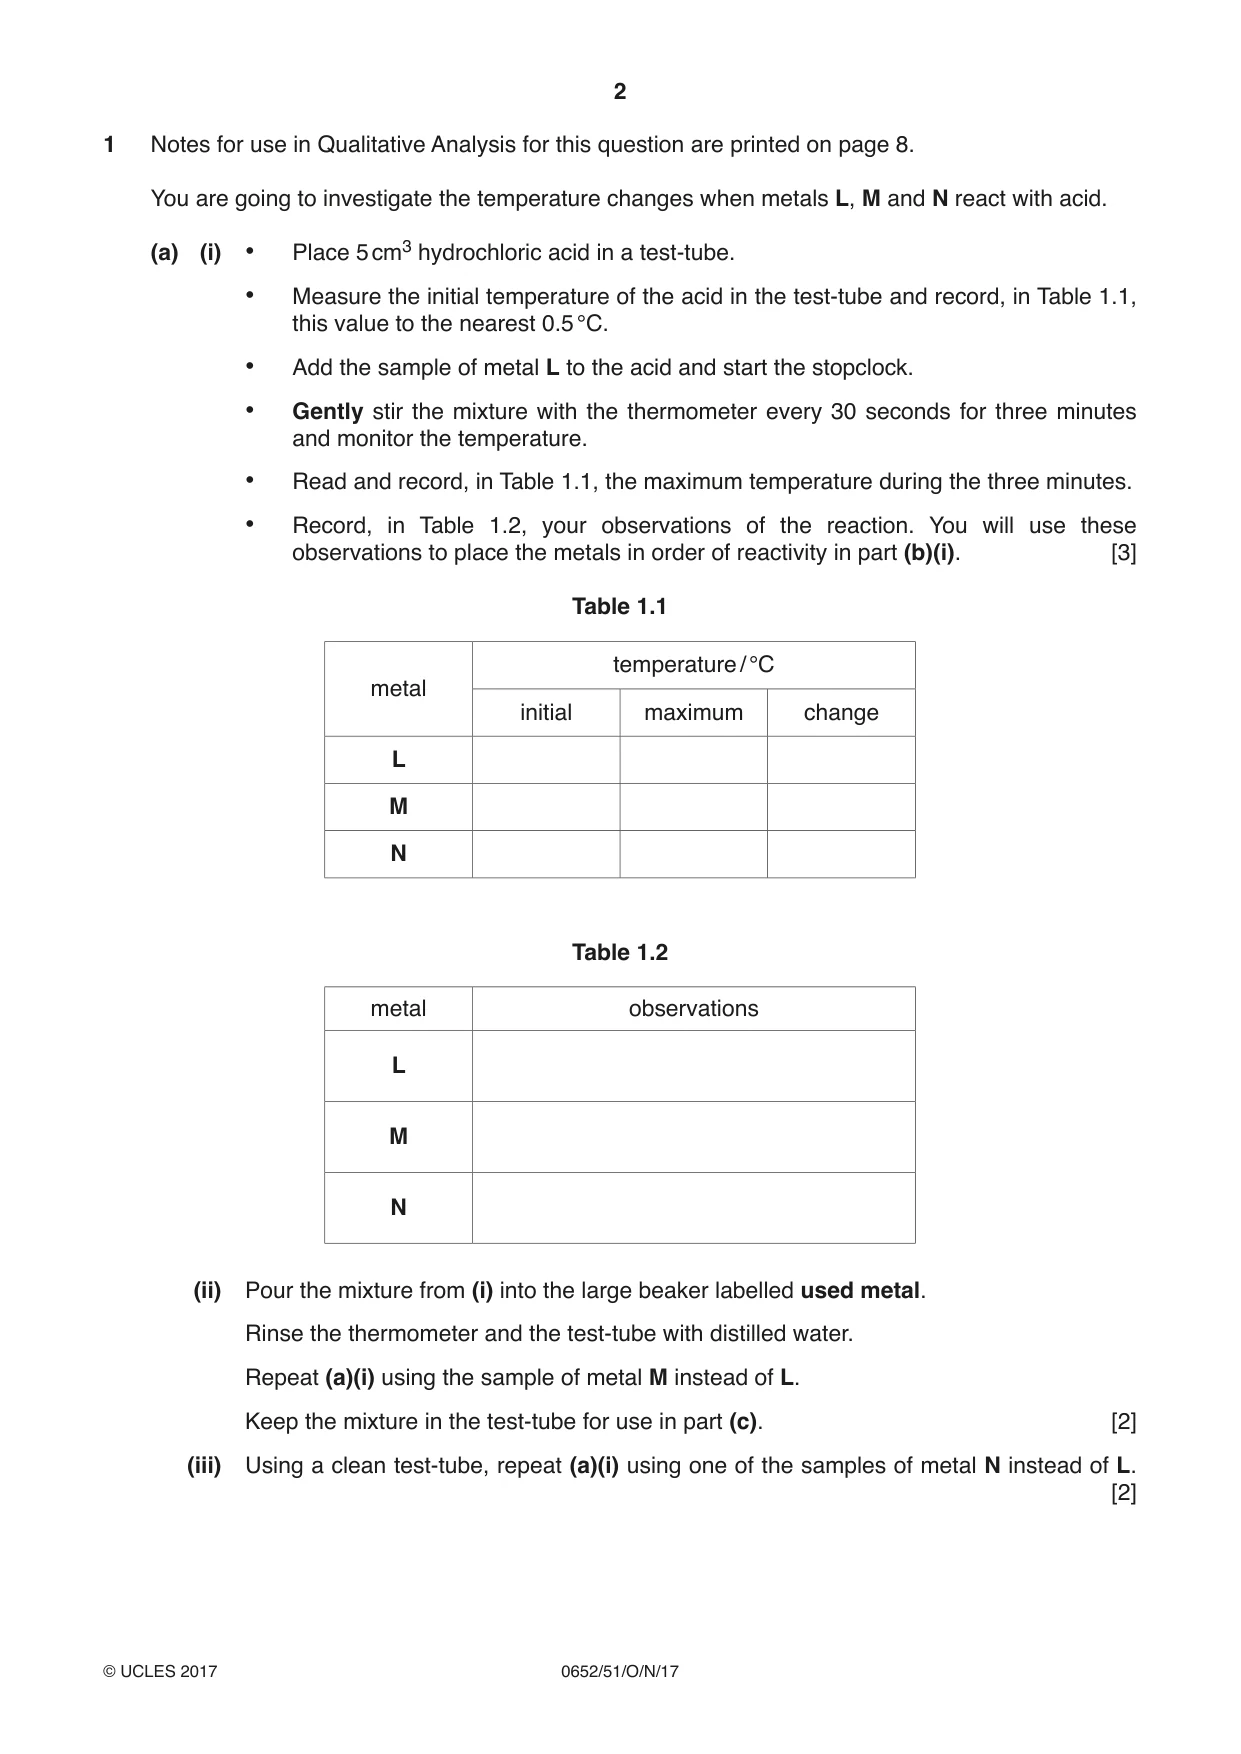
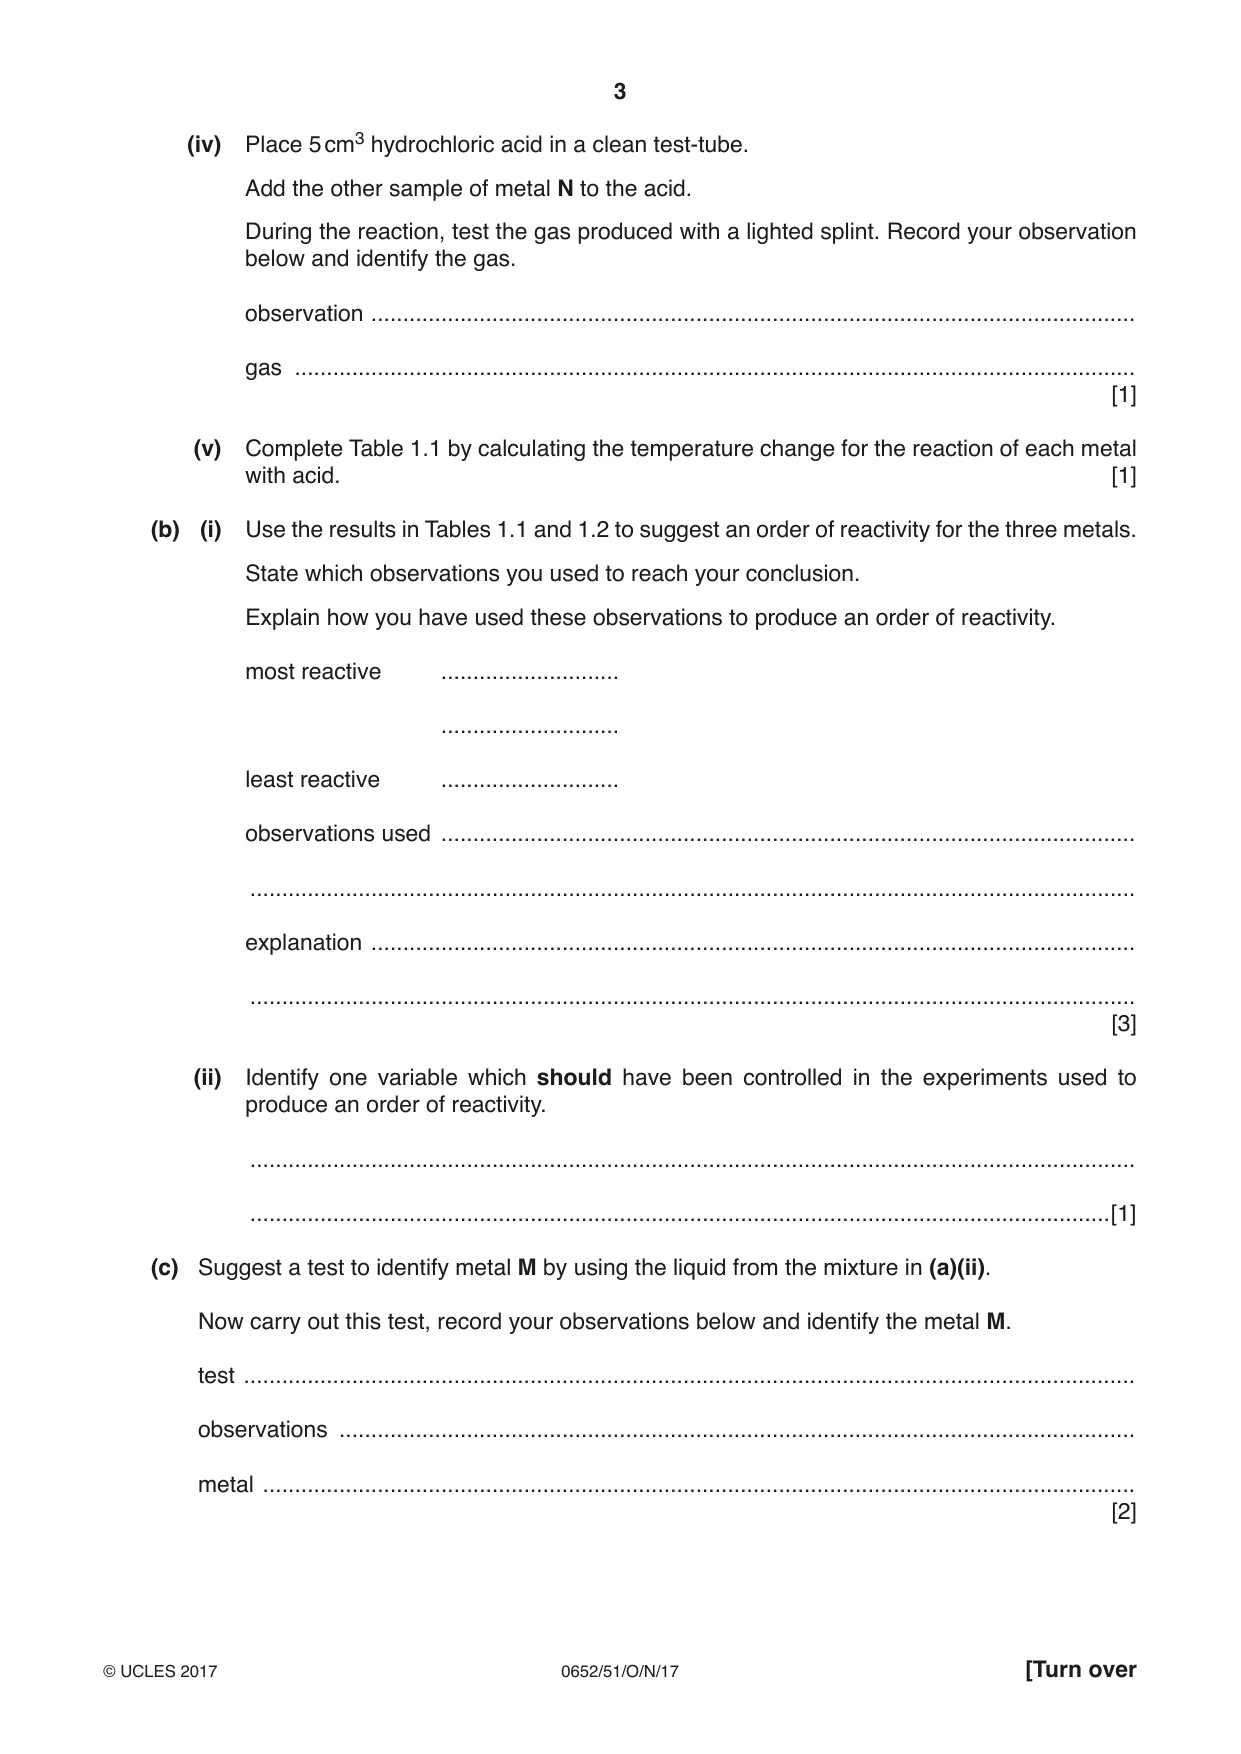
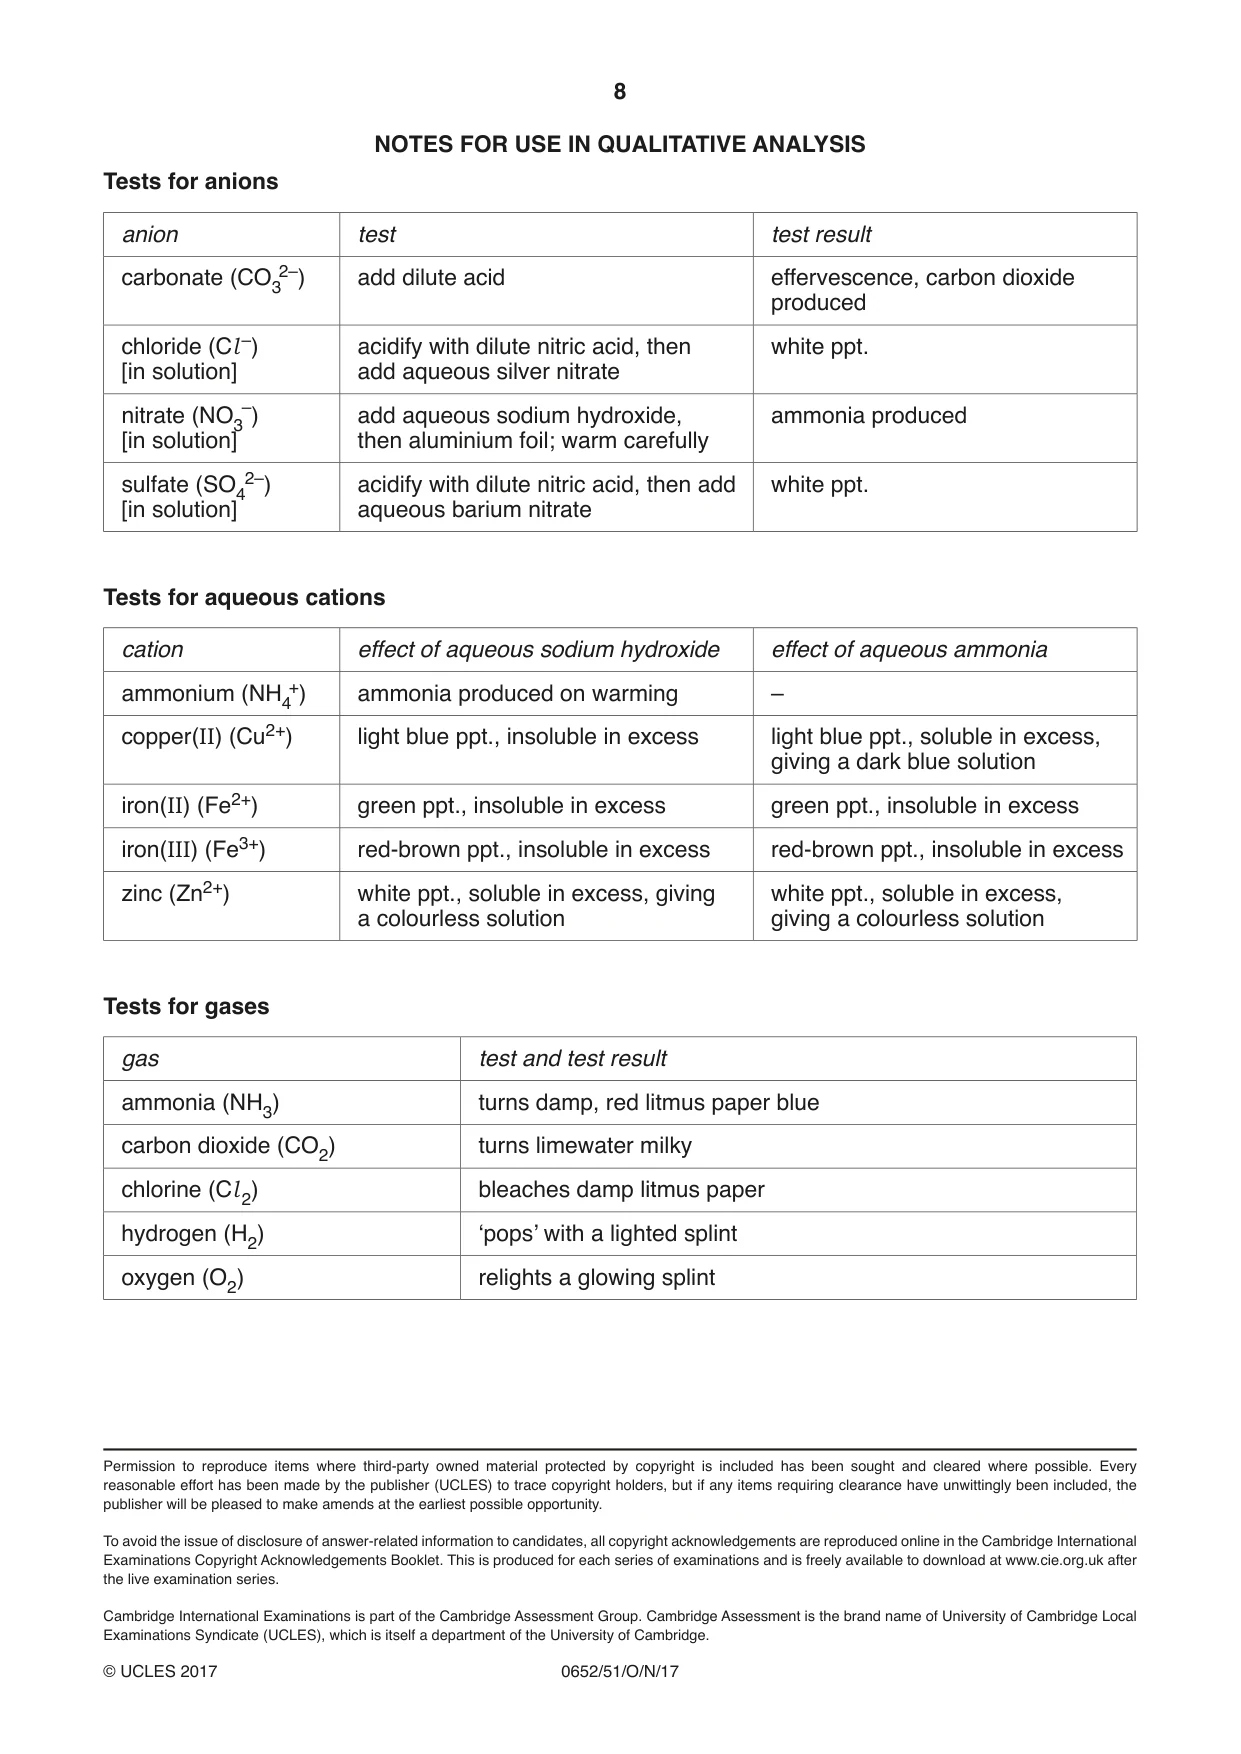
1 Notes for use in Qualitative Analysis for this question are printed on page 8. You are going to investigate the temperature changes when metals L, M and N react with acid. (a) (i) • Place 5 cm3 hydrochloric acid in a test-tube. • Measure the initial temperature of the acid in the test-tube and record, in Table 1.1, this value to the nearest 0.5 °C. • Add the sample of metal L to the acid and start the stopclock. • Gently stir the mixture with the thermometer every 30 seconds for three minutes and monitor the temperature. • Read and record, in Table 1.1, the maximum temperature during the three minutes. • Record, in Table 1.2, your observations of the reaction. You will use these observations to place the metals in order of reactivity in part (b)(i). [3] Table 1.1 temperature / °C metal initial maximum change L M N Table 1.2 metal observations L M N (ii) Pour the mixture from (i) into the large beaker labelled used metal. Rinse the thermometer and the test-tube with distilled water. Repeat (a)(i) using the sample of metal M instead of L. Keep the mixture in the test-tube for use in part (c). [2] (iii) Using a clean test-tube, repeat (a)(i) using one of the samples of metal N instead of L. [2] (iv) Place 5 cm3 hydrochloric acid in a clean test-tube. Add the other sample of metal N to the acid. During the reaction, test the gas produced with a lighted splint. Record your observation below and identify the gas. observation ........................................................................................................................ gas .................................................................................................................................... [1] (v) Complete Table 1.1 by calculating the temperature change for the reaction of each metal with acid. [1] (b) (i) Use the results in Tables 1.1 and 1.2 to suggest an order of reactivity for the three metals. State which observations you used to reach your conclusion. Explain how you have used these observations to produce an order of reactivity. most reactive ............................ ............................ least reactive ............................ observations used ............................................................................................................. ........................................................................................................................................... explanation ........................................................................................................................ ........................................................................................................................................... [3] (ii) Identify one variable which should have been controlled in the experiments used to produce an order of reactivity. ........................................................................................................................................... .......................................................................................................................................[1] (c) Suggest a test to identify metal M by using the liquid from the mixture in (a)(ii). Now carry out this test, record your observations below and identify the metal M. test ............................................................................................................................................ observations ............................................................................................................................. metal ......................................................................................................................................... [2]
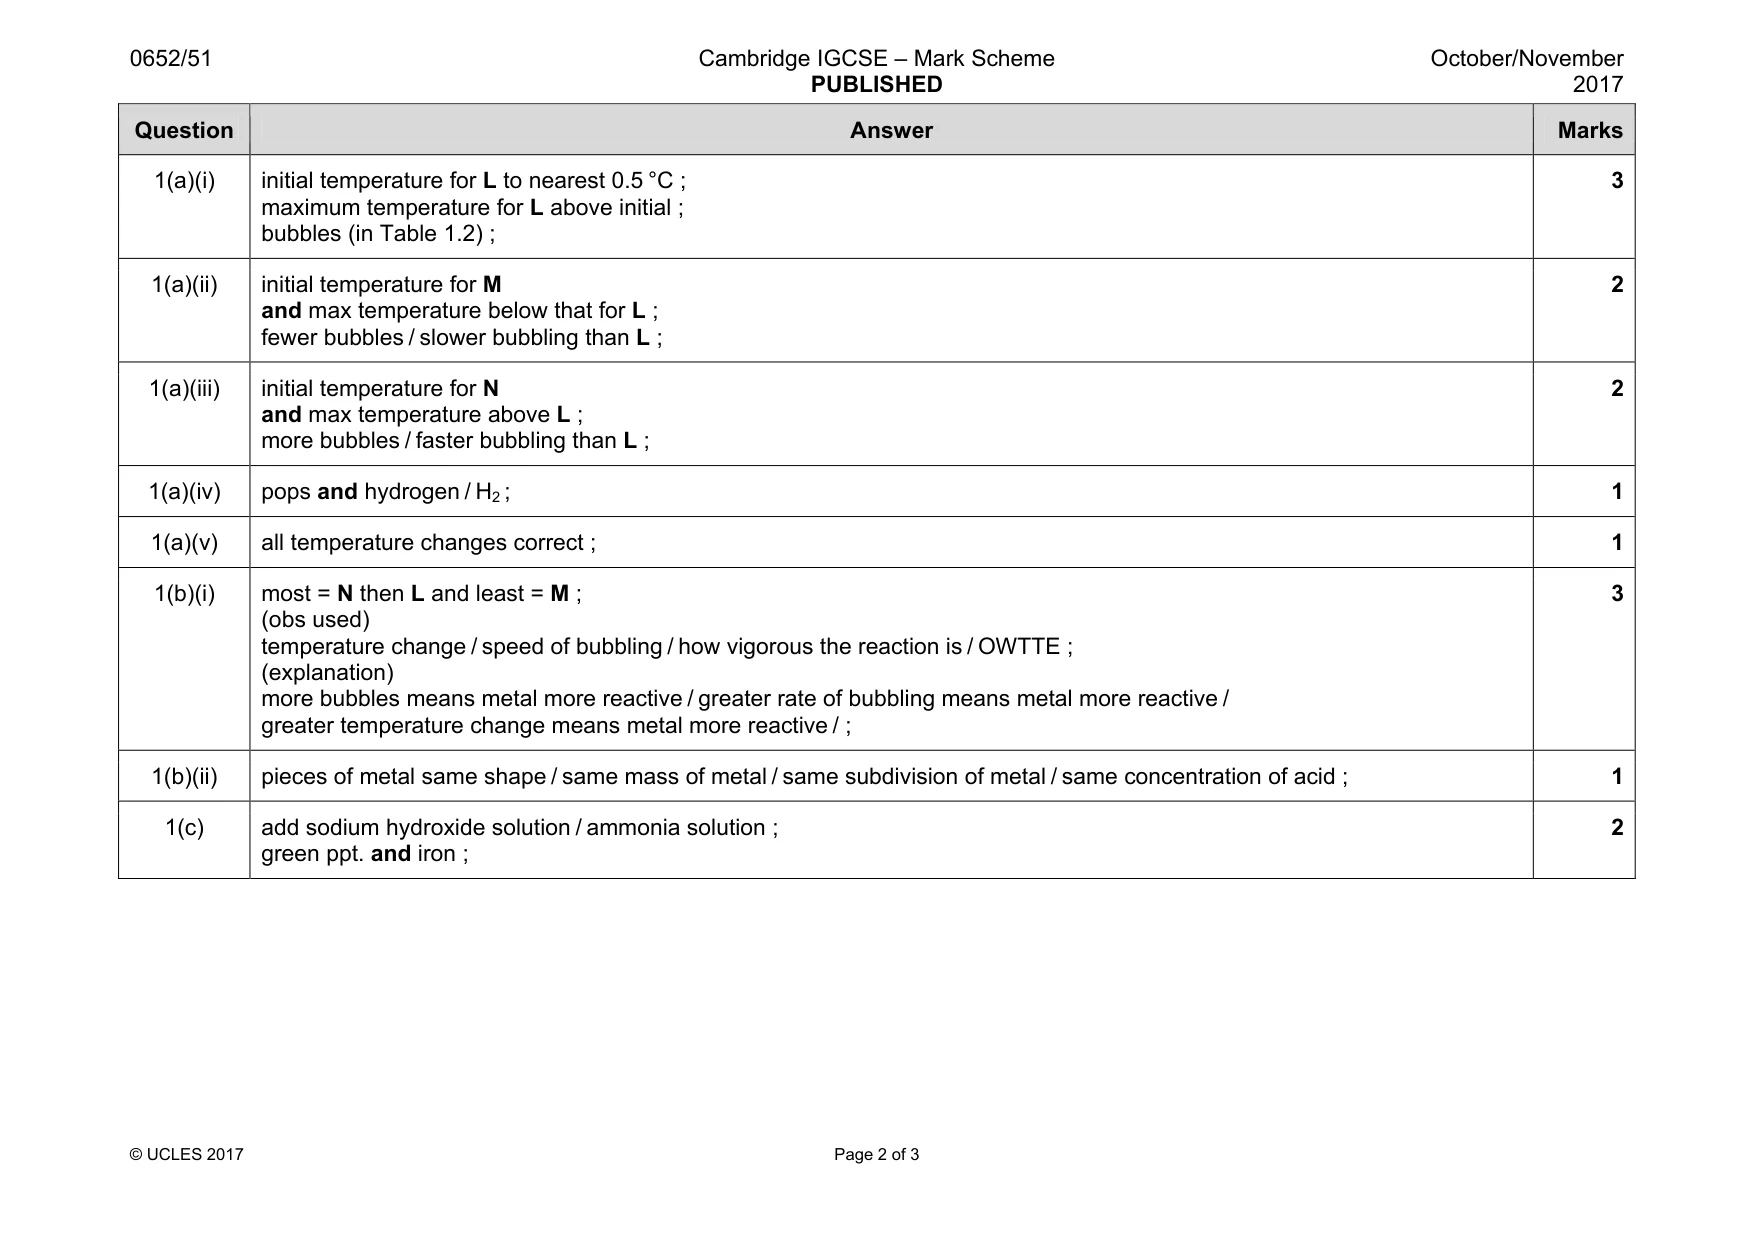
Mark scheme: 1(a)(i) initial temperature for L to nearest 0.5 °C ; maximum temperature for L above initial ; bubbles (in Table 1.2) ; 3 1(a)(ii) initial temperature for M and max temperature below that for L ; fewer bubbles / slower bubbling than L ; 2 1(a)(iii) initial temperature for N and max temperature above L ; more bubbles / faster bubbling than L ; 2 1(a)(iv) pops and hydrogen / H2 ; 1 1(a)(v) all temperature changes correct ; 1 1(b)(i) most = N then L and least = M ; (obs used) temperature change / speed of bubbling / how vigorous the reaction is / OWTTE ; (explanation) more bubbles means metal more reactive / greater rate of bubbling means metal more reactive / greater temperature change means metal more reactive / ; 3 1(b)(ii) pieces of metal same shape / same mass of metal / same subdivision of metal / same concentration of acid ; 1 1(c) add sodium hydroxide solution / ammonia solution ; green ppt. and iron ; 2
Q2 · You are going to investigate the cooling of two beakers of hot water, P and Q
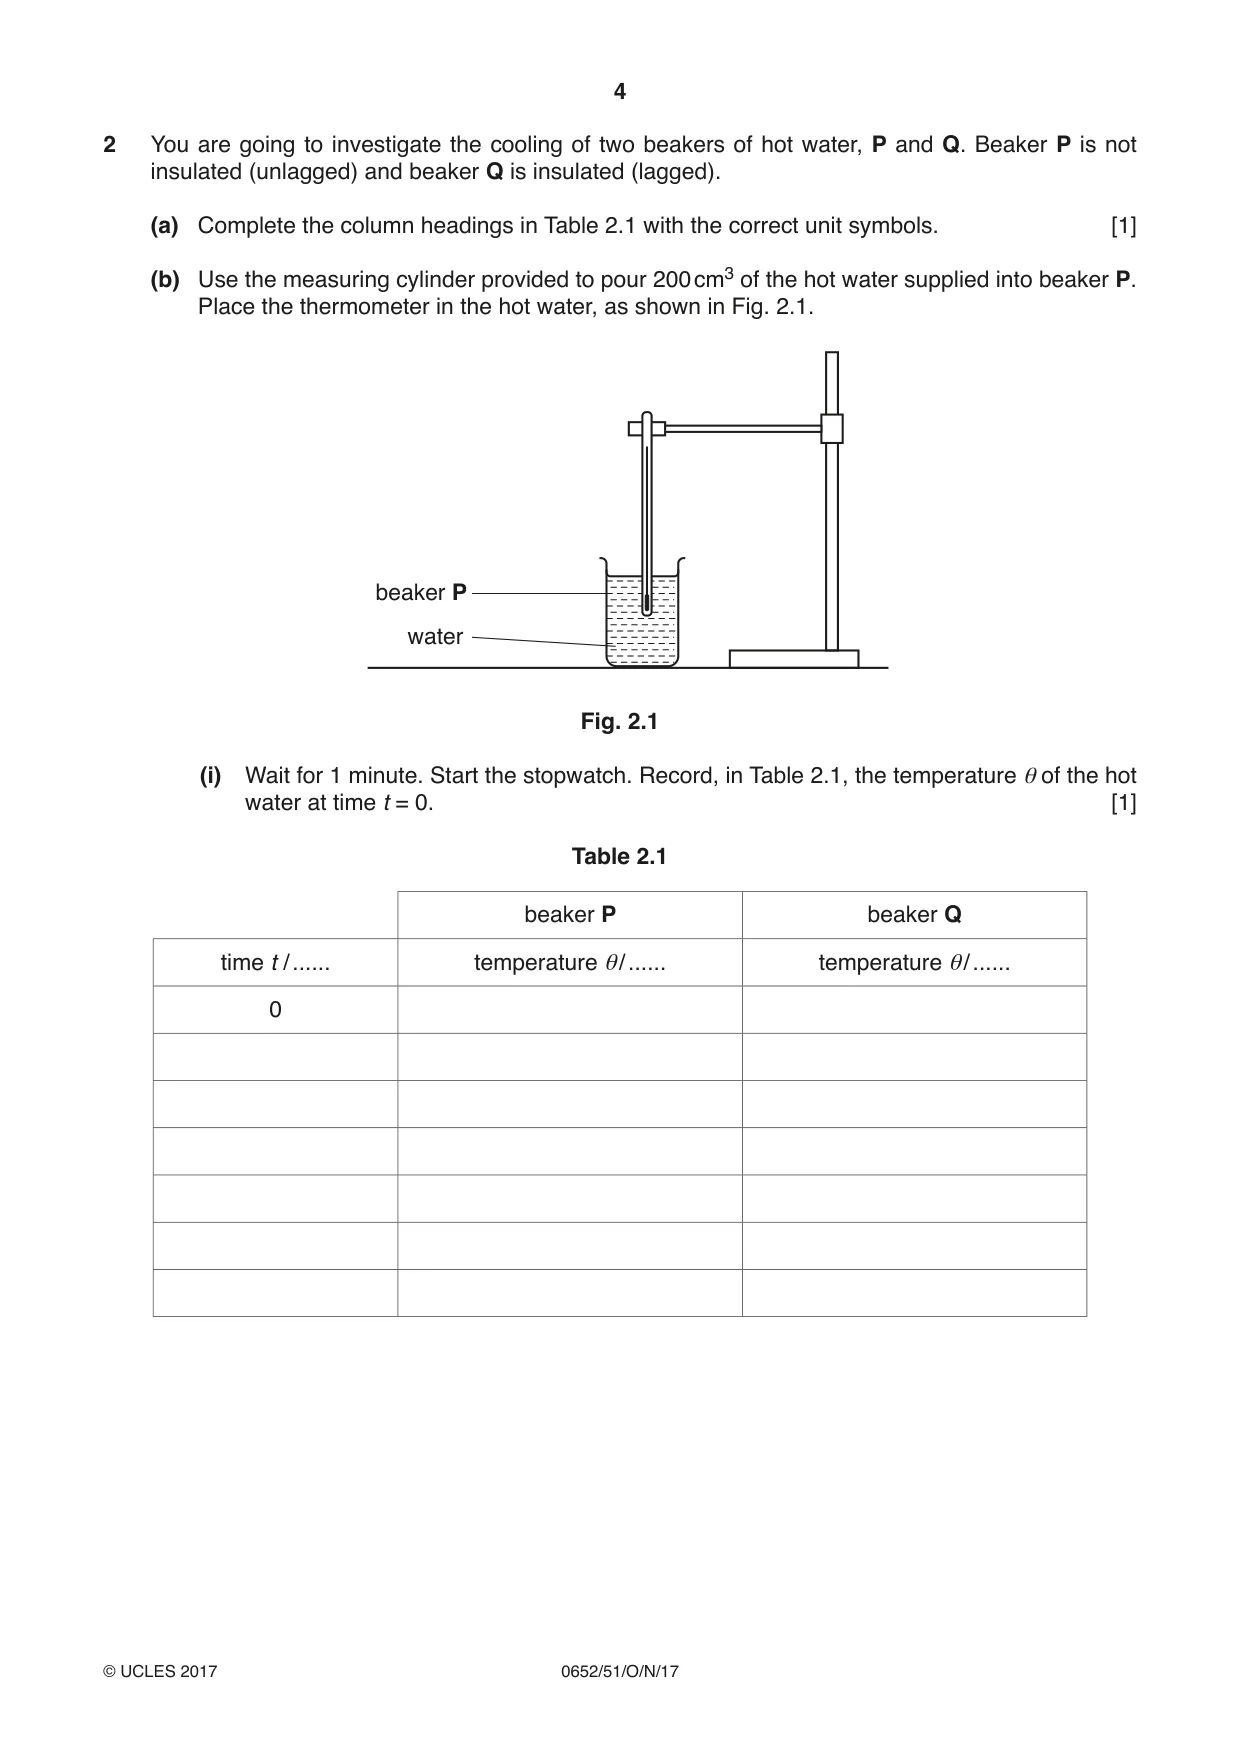
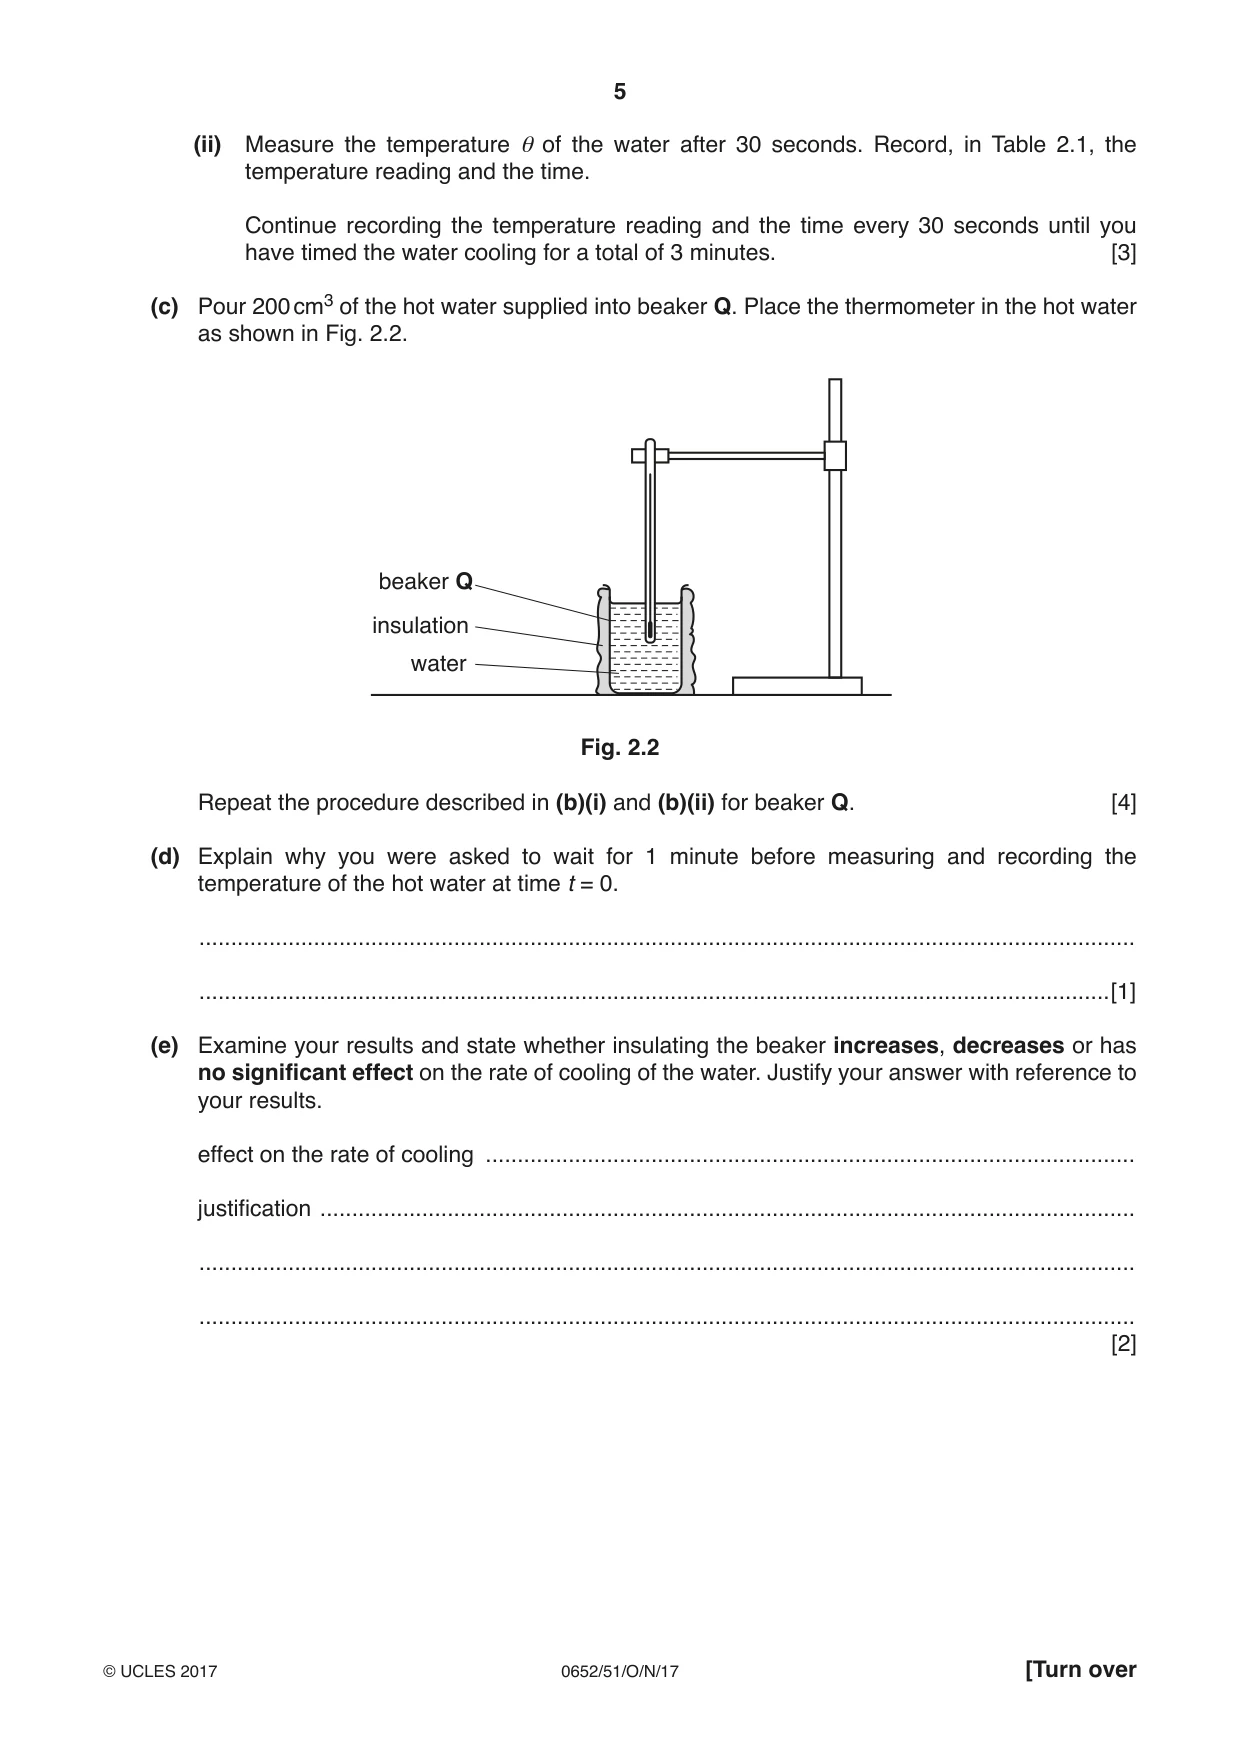
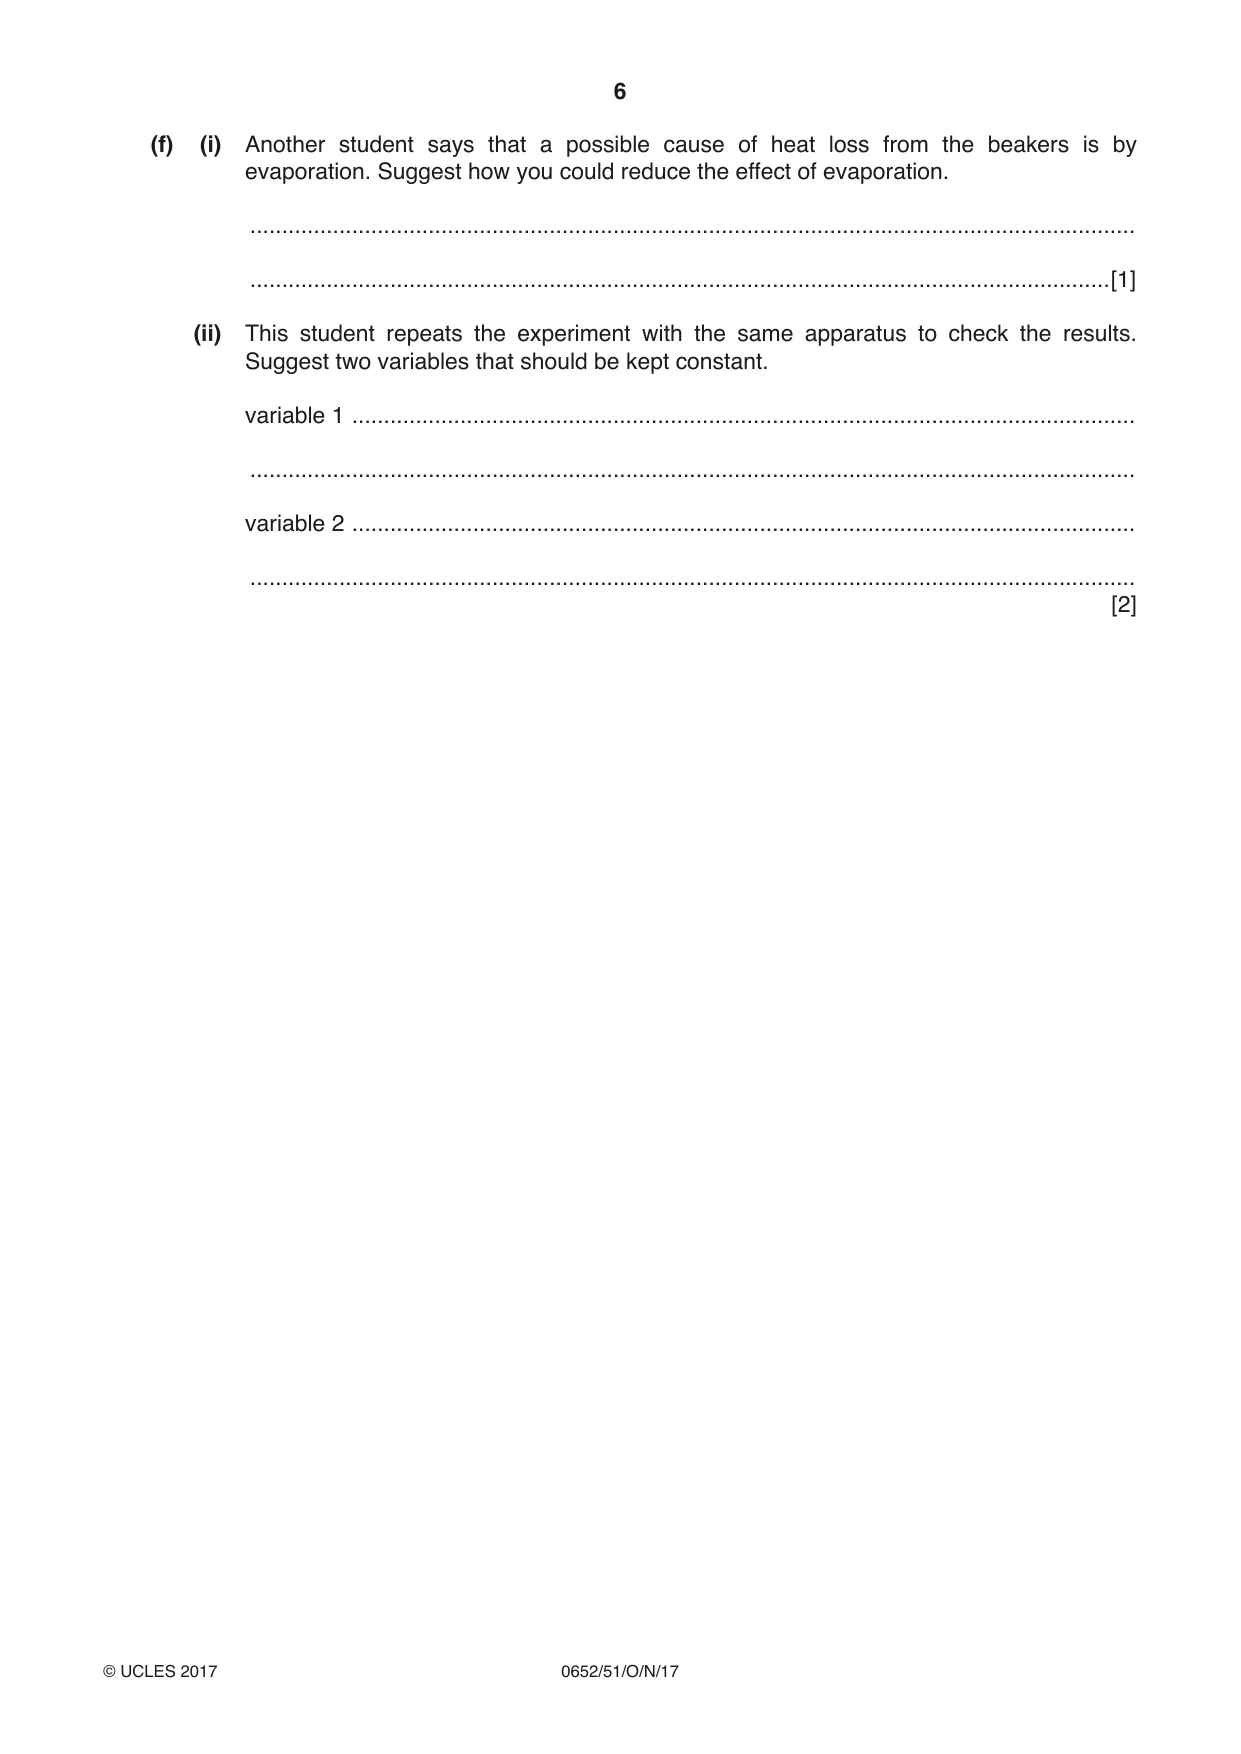
2 You are going to investigate the cooling of two beakers of hot water, P and Q. Beaker P is not insulated (unlagged) and beaker Q is insulated (lagged). (a) Complete the column headings in Table 2.1 with the correct unit symbols. [1] (b) Use the measuring cylinder provided to pour 200 cm3 of the hot water supplied into beaker P. Place the thermometer in the hot water, as shown in Fig. 2.1. beaker P water Fig. 2.1 (i) Wait for 1 minute. Start the stopwatch. Record, in Table 2.1, the temperature θ of the hot water at time t = 0. [1] Table 2.1 beaker P beaker Q time t / ...... temperature θ/ ...... temperature θ/ ...... 0 (ii) Measure the temperature θ of the water after 30 seconds. Record, in Table 2.1, the temperature reading and the time. Continue recording the temperature reading and the time every 30 seconds until you have timed the water cooling for a total of 3 minutes. [3] (c) Pour 200 cm3 of the hot water supplied into beaker Q. Place the thermometer in the hot water as shown in Fig. 2.2. beaker Q insulation water Fig. 2.2 Repeat the procedure described in (b)(i) and (b)(ii) for beaker Q. [4] (d) Explain why you were asked to wait for 1 minute before measuring and recording the temperature of the hot water at time t = 0. ................................................................................................................................................... ...............................................................................................................................................[1] (e) Examine your results and state whether insulating the beaker increases, decreases or has no significant effect on the rate of cooling of the water. Justify your answer with reference to your results. effect on the rate of cooling ...................................................................................................... justification ................................................................................................................................ ................................................................................................................................................... ................................................................................................................................................... [2] (f) (i) Another student says that a possible cause of heat loss from the beakers is by evaporation. Suggest how you could reduce the effect of evaporation. ........................................................................................................................................... .......................................................................................................................................[1] (ii) This student repeats the experiment with the same apparatus to check the results. Suggest two variables that should be kept constant. variable 1 ........................................................................................................................... ........................................................................................................................................... variable 2 ........................................................................................................................... ........................................................................................................................................... [2]
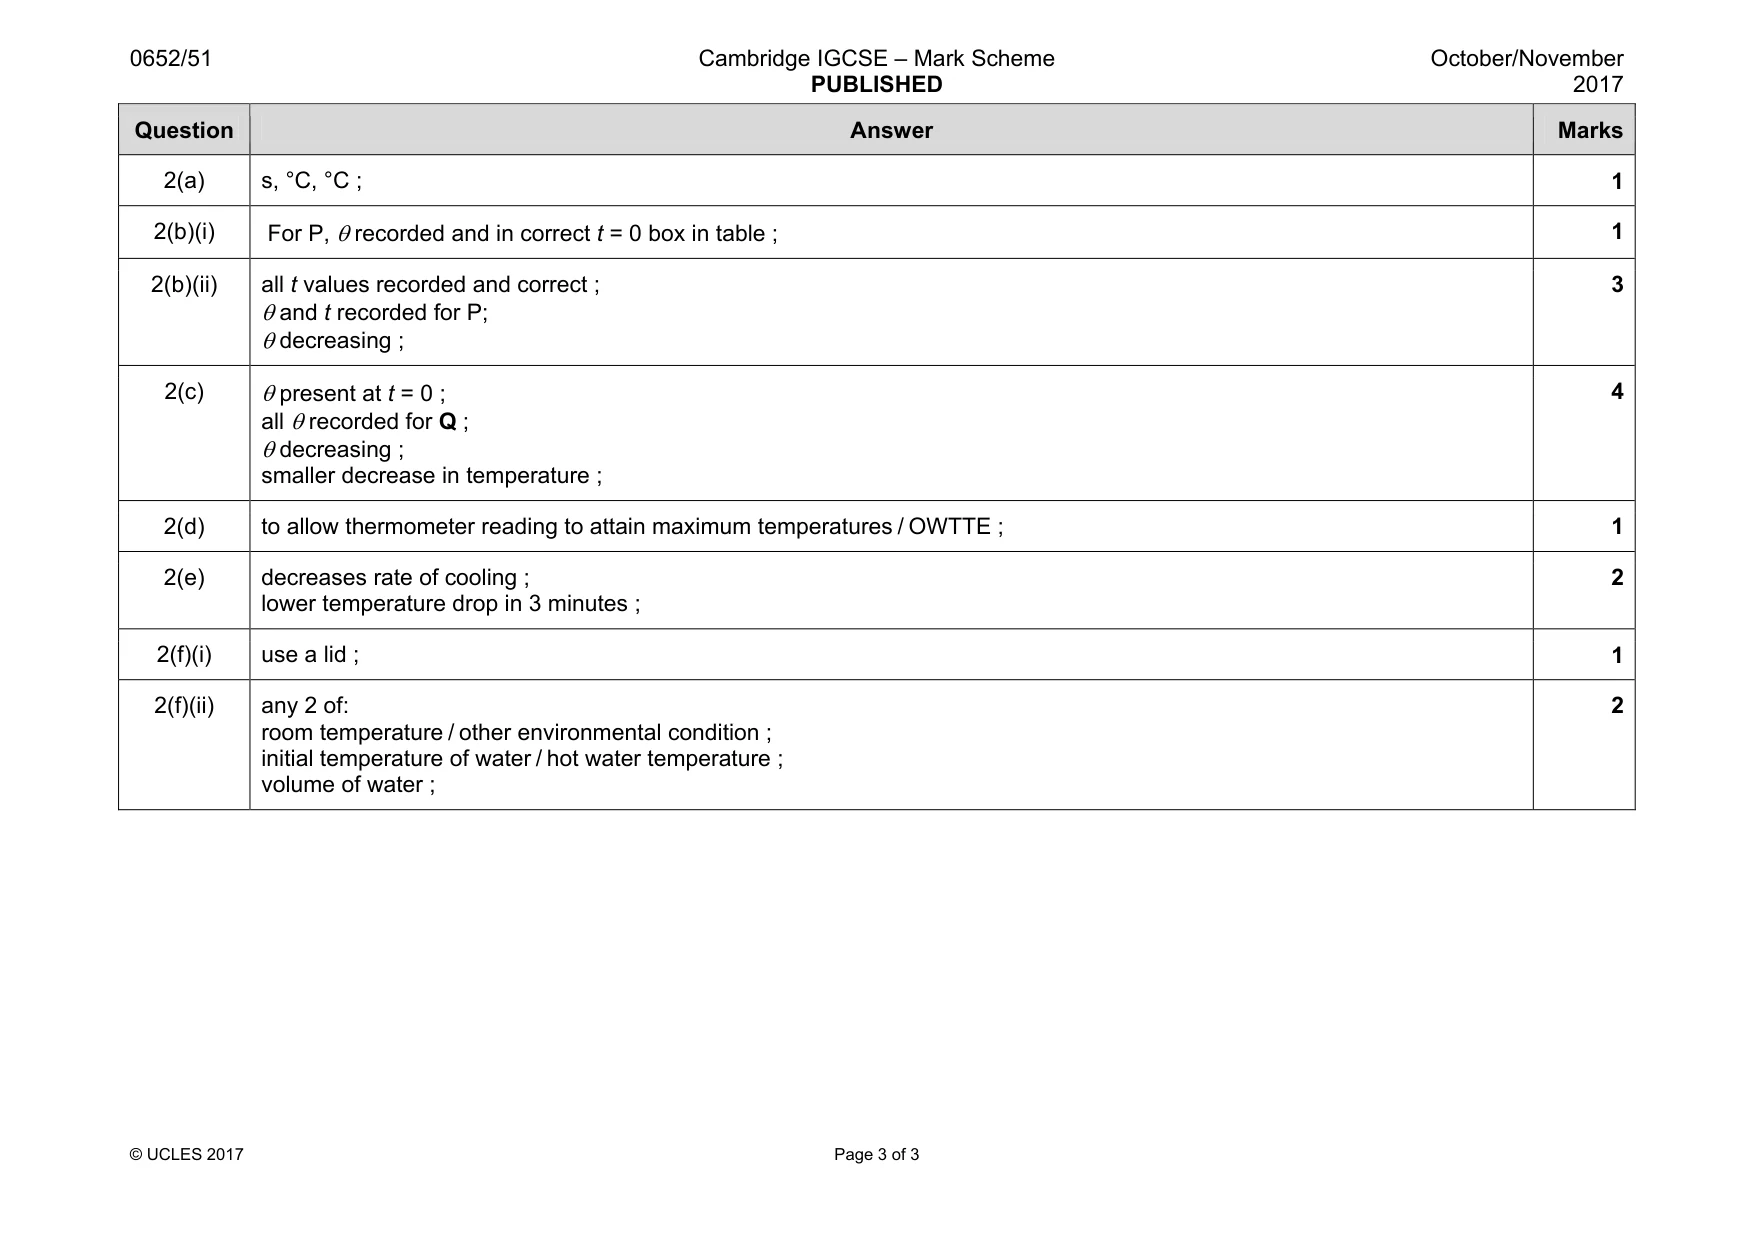
Mark scheme: 2(a) s, °C, °C ; 1 2(b)(i) For P, θ recorded and in correct t = 0 box in table ; 1 2(b)(ii) all t values recorded and correct ; θ and t recorded for P; θ decreasing ; 3 2(c) θ present at t = 0 ; all θ recorded for Q ; θ decreasing ; smaller decrease in temperature ; 4 2(d) to allow thermometer reading to attain maximum temperatures / OWTTE ; 1 2(e) decreases rate of cooling ; lower temperature drop in 3 minutes ; 2 2(f)(i) use a lid ; 1 2(f)(ii) any 2 of: room temperature / other environmental condition ; initial temperature of water / hot water temperature ; volume of water ; 2
What was in this paper
The subtopics covered by these 2 questions, and how many questions each got. Open one in a new tab to see every Cambridge question on it.
What you needed in this session
Cambridge’s own grade thresholds for 2017 Oct/Nov, Paper 5 · Variant 1. A higher threshold means an easier paper — the bar moves with how the cohort did.