Cambridge IGCSE Mathematics (with coursework) 0581 — 2010 May/June Paper 4 · Variant 1
0581/41/M/J/10
The question paper and its mark scheme, free to read here and free to download. This is Cambridge’s own paper, exactly as it was sat.
Question paper20 pages
Mark scheme5 pages
Answers below. Sit the paper first if you are practising.
Paper as text
Question paper, page 1
This document consists of 19 printed pages and 1 blank page. IB10 06_0581_41/FP © UCLES 2010 [Turn over *5902669097* UNIVERSITY OF CAMBRIDGE INTERNATIONAL EXAMINATIONS International General Certificate of Secondary Education MATHEMATICS 0581/41 Paper 4 (Extended) May/June 2010 2 hours 30 minutes Candidates answer on the Question Paper. Additional Materials: Electronic calculator Geometrical instruments Mathematical tables (optional) Tracing paper (optional) READ THESE INSTRUCTIONS FIRST Write your Centre number, candidate number and name on all the work you hand in. Write in dark blue or black pen. You may use a pencil for any diagrams or graphs. Do not use staples, paper clips, highlighters, glue or correction fluid. Do NOT WRITE IN ANY BARCODES. Answer all questions. If working is needed for any question it must be shown below that question. Electronic calculators should be used. If the degree of accuracy is not specified in the question, and if the answer is not exact, give the answer to three significant figures. Give answers in degrees to one decimal place. For π use either your calculator value or 3.142. At the end of the examination, fasten all your work securely together. The number of marks is given in brackets [ ] at the end of each question or part question. The total of the marks for this paper is 130. www.XtremePapers.com
Question paper, page 2
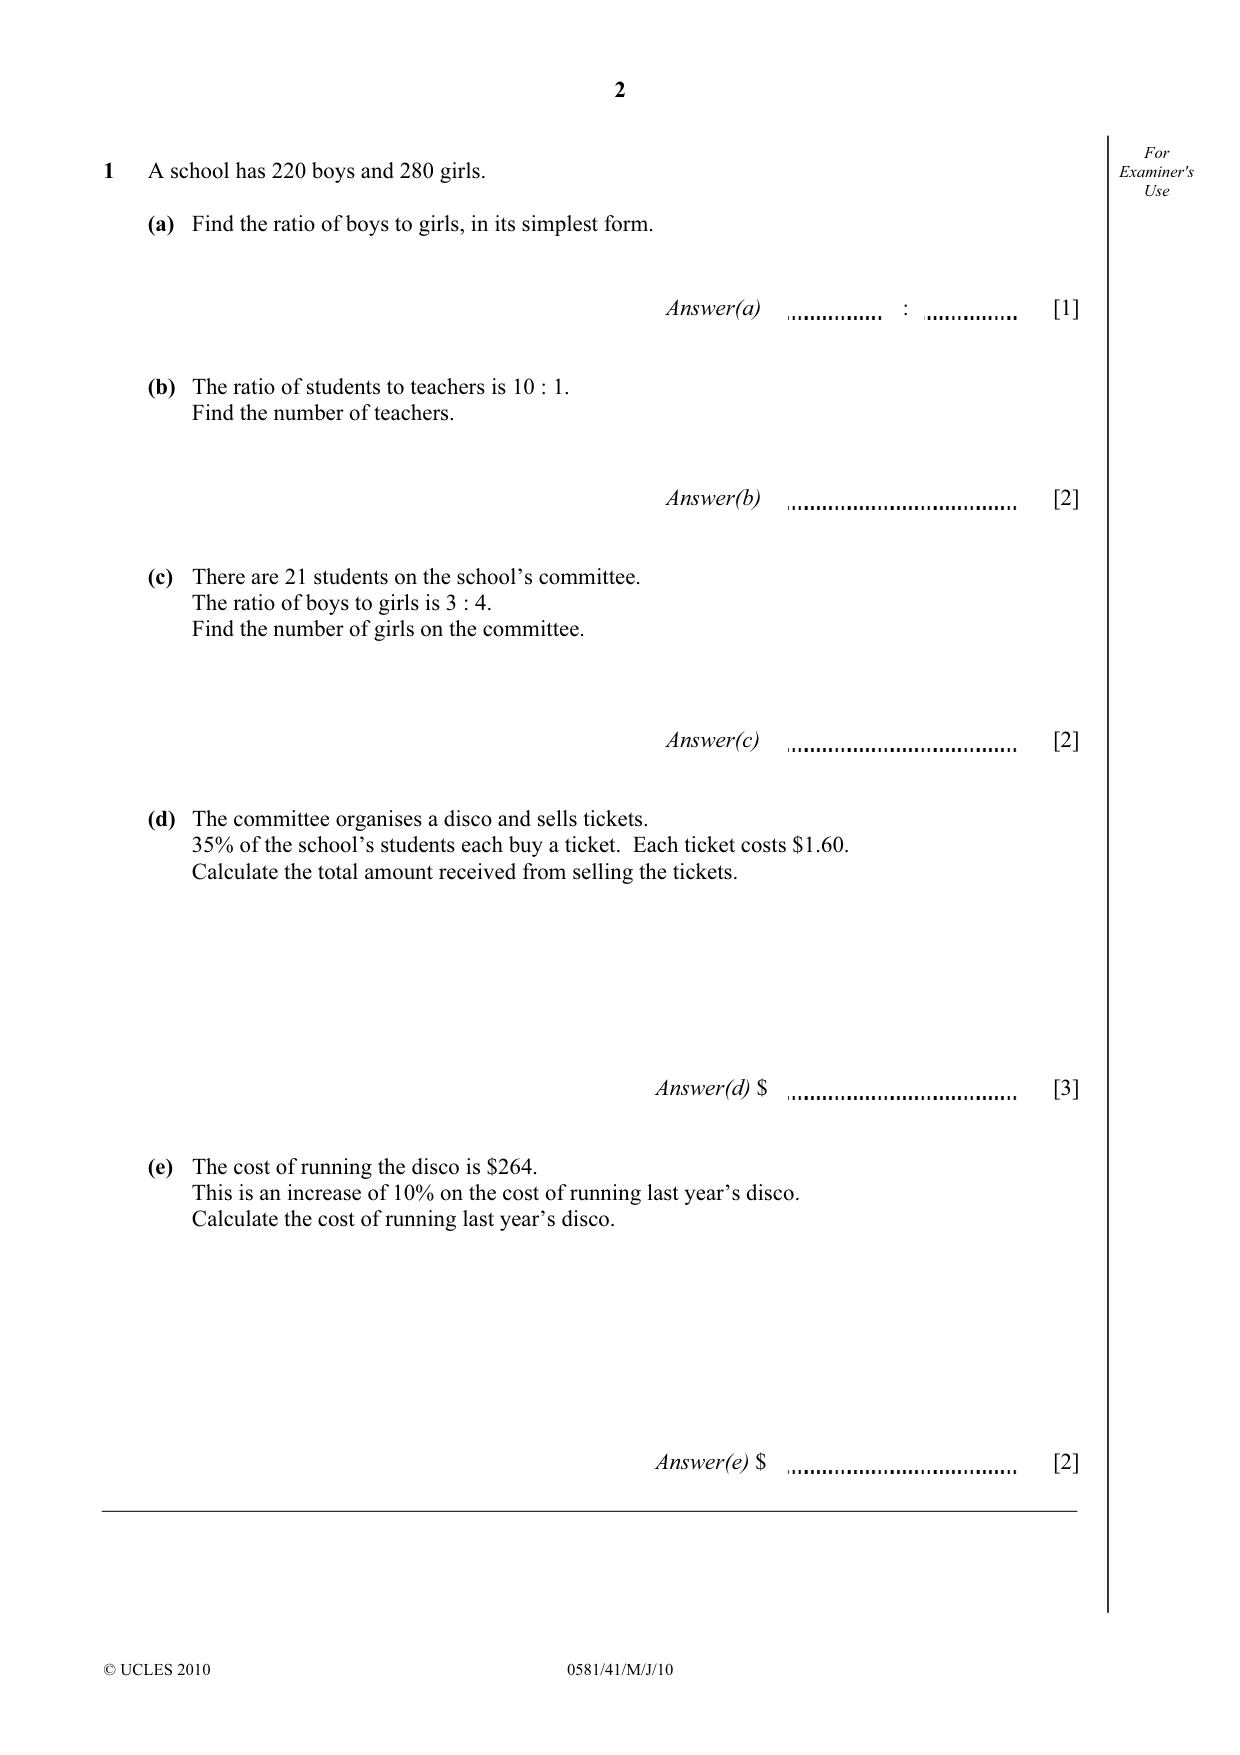
2 © UCLES 2010 0581/41/M/J/10 For Examiner's Use 1 A school has 220 boys and 280 girls. (a) Find the ratio of boys to girls, in its simplest form. Answer(a) : [1] (b) The ratio of students to teachers is 10 : 1. Find the number of teachers. Answer(b) [2] (c) There are 21 students on the school’s committee. The ratio of boys to girls is 3 : 4. Find the number of girls on the committee. Answer(c) [2] (d) The committee organises a disco and sells tickets. 35% of the school’s students each buy a ticket. Each ticket costs $1.60. Calculate the total amount received from selling the tickets. Answer(d) $ [3] (e) The cost of running the disco is $264. This is an increase of 10% on the cost of running last year’s disco. Calculate the cost of running last year’s disco. Answer(e) $ [2]
Question paper, page 3
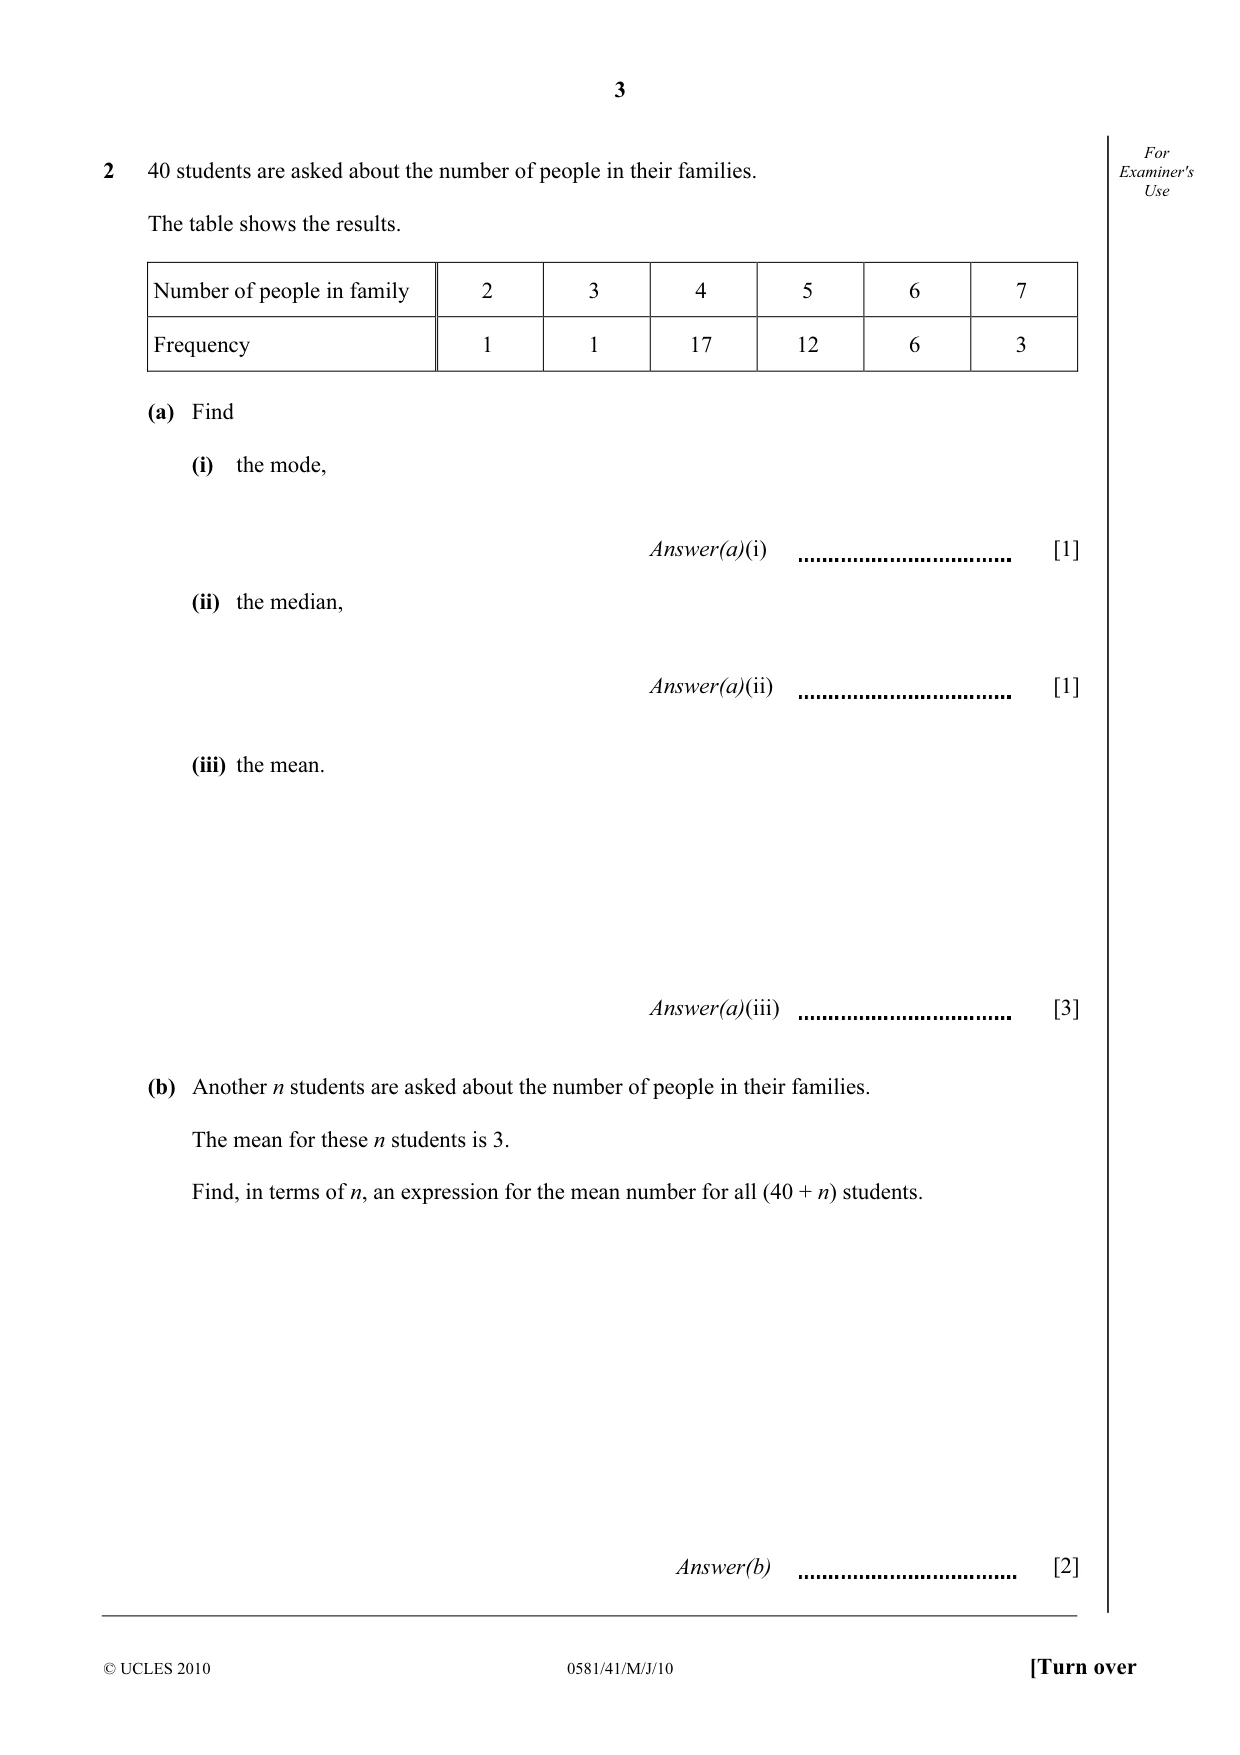
3 © UCLES 2010 0581/41/M/J/10 [Turn over For Examiner's Use 2 40 students are asked about the number of people in their families. The table shows the results. Number of people in family 2 3 4 5 6 7 Frequency 1 1 17 12 6 3 (a) Find (i) the mode, Answer(a)(i) [1] (ii) the median, Answer(a)(ii) [1] (iii) the mean. Answer(a)(iii) [3] (b) Another n students are asked about the number of people in their families. The mean for these n students is 3. Find, in terms of n, an expression for the mean number for all (40 + n) students. Answer(b) [2]
Question paper, page 4
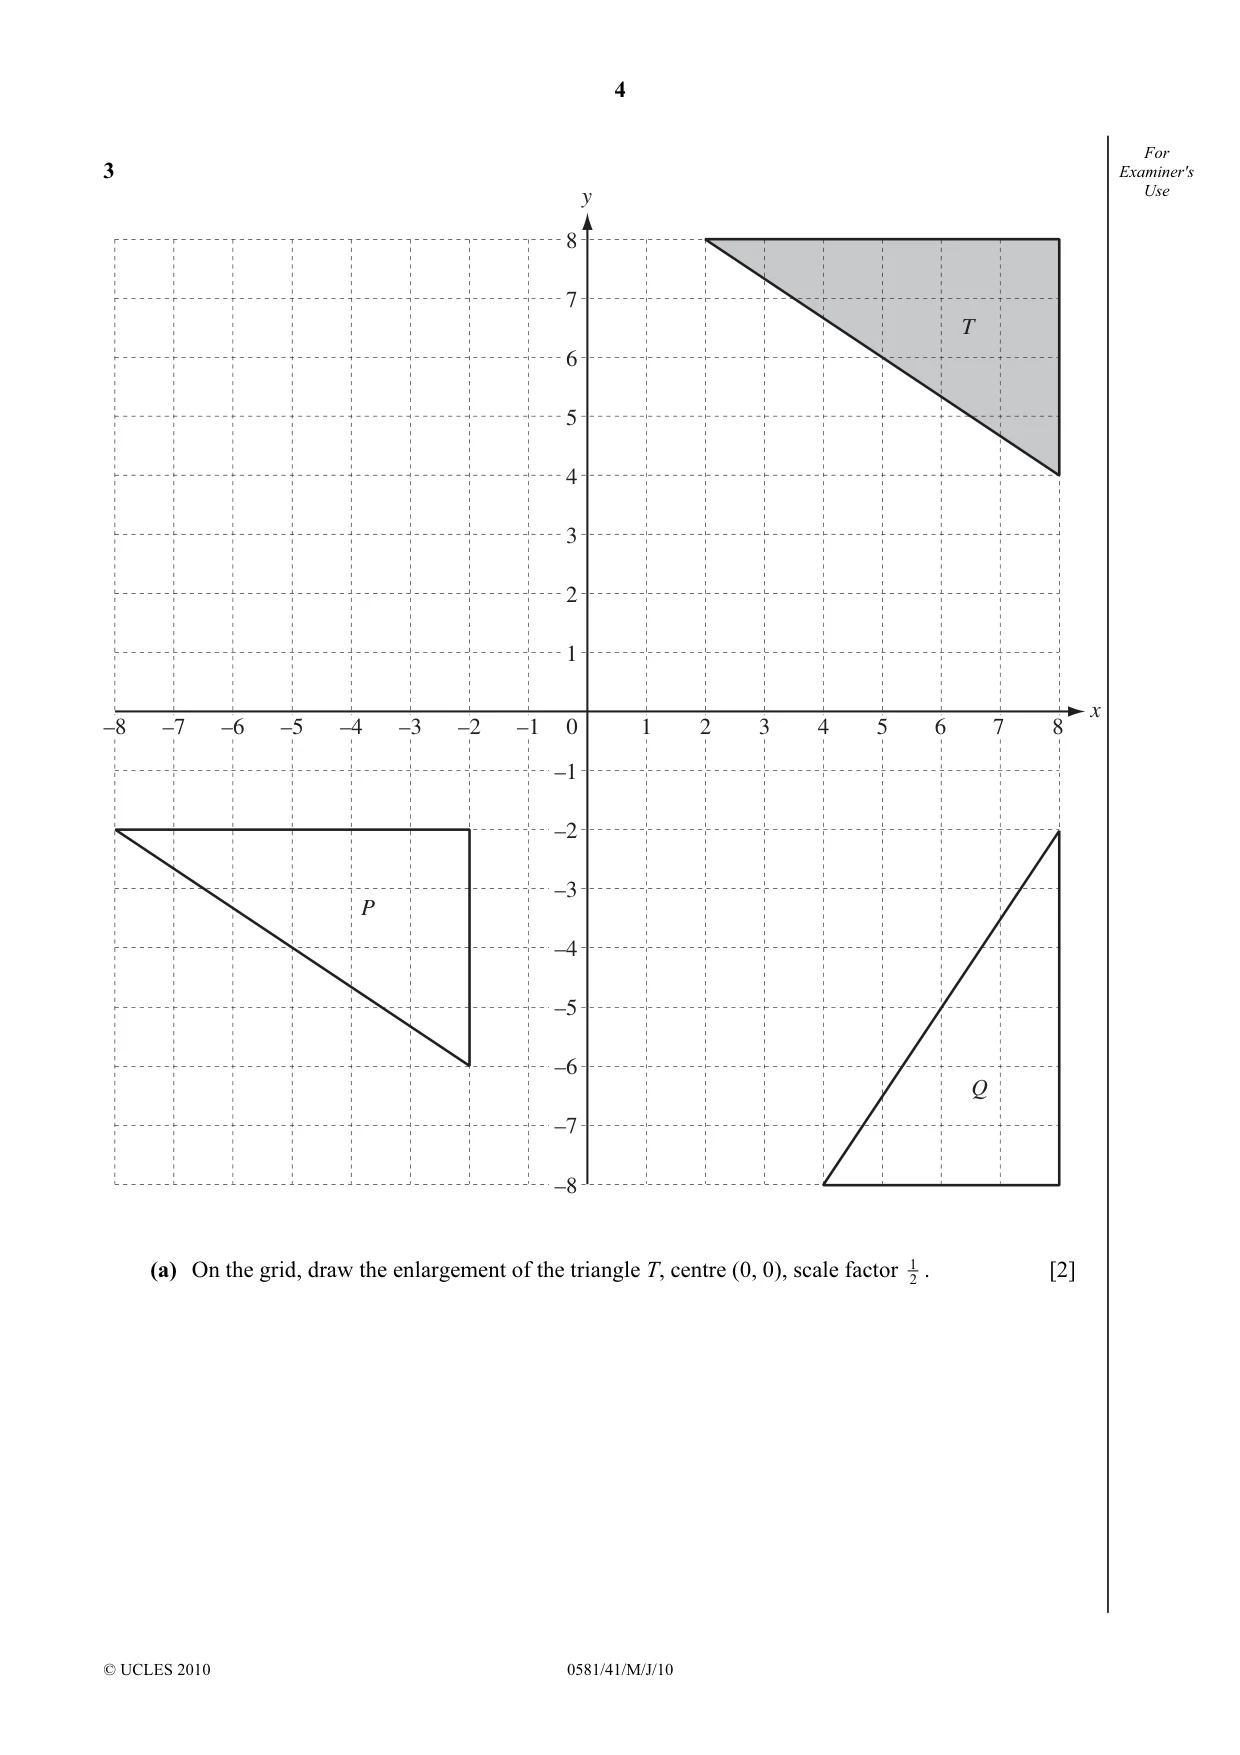
4 © UCLES 2010 0581/41/M/J/10 For Examiner's Use 3 T Q P 8 7 6 5 4 3 2 1 –1 –2 –3 –4 –5 –6 –7 –8 0 –1 –2 –3 –4 –5 –6 –7 –8 5 6 7 8 4 3 2 1 y x (a) On the grid, draw the enlargement of the triangle T, centre (0, 0), scale factor 2 1 . [2]
Question paper, page 5
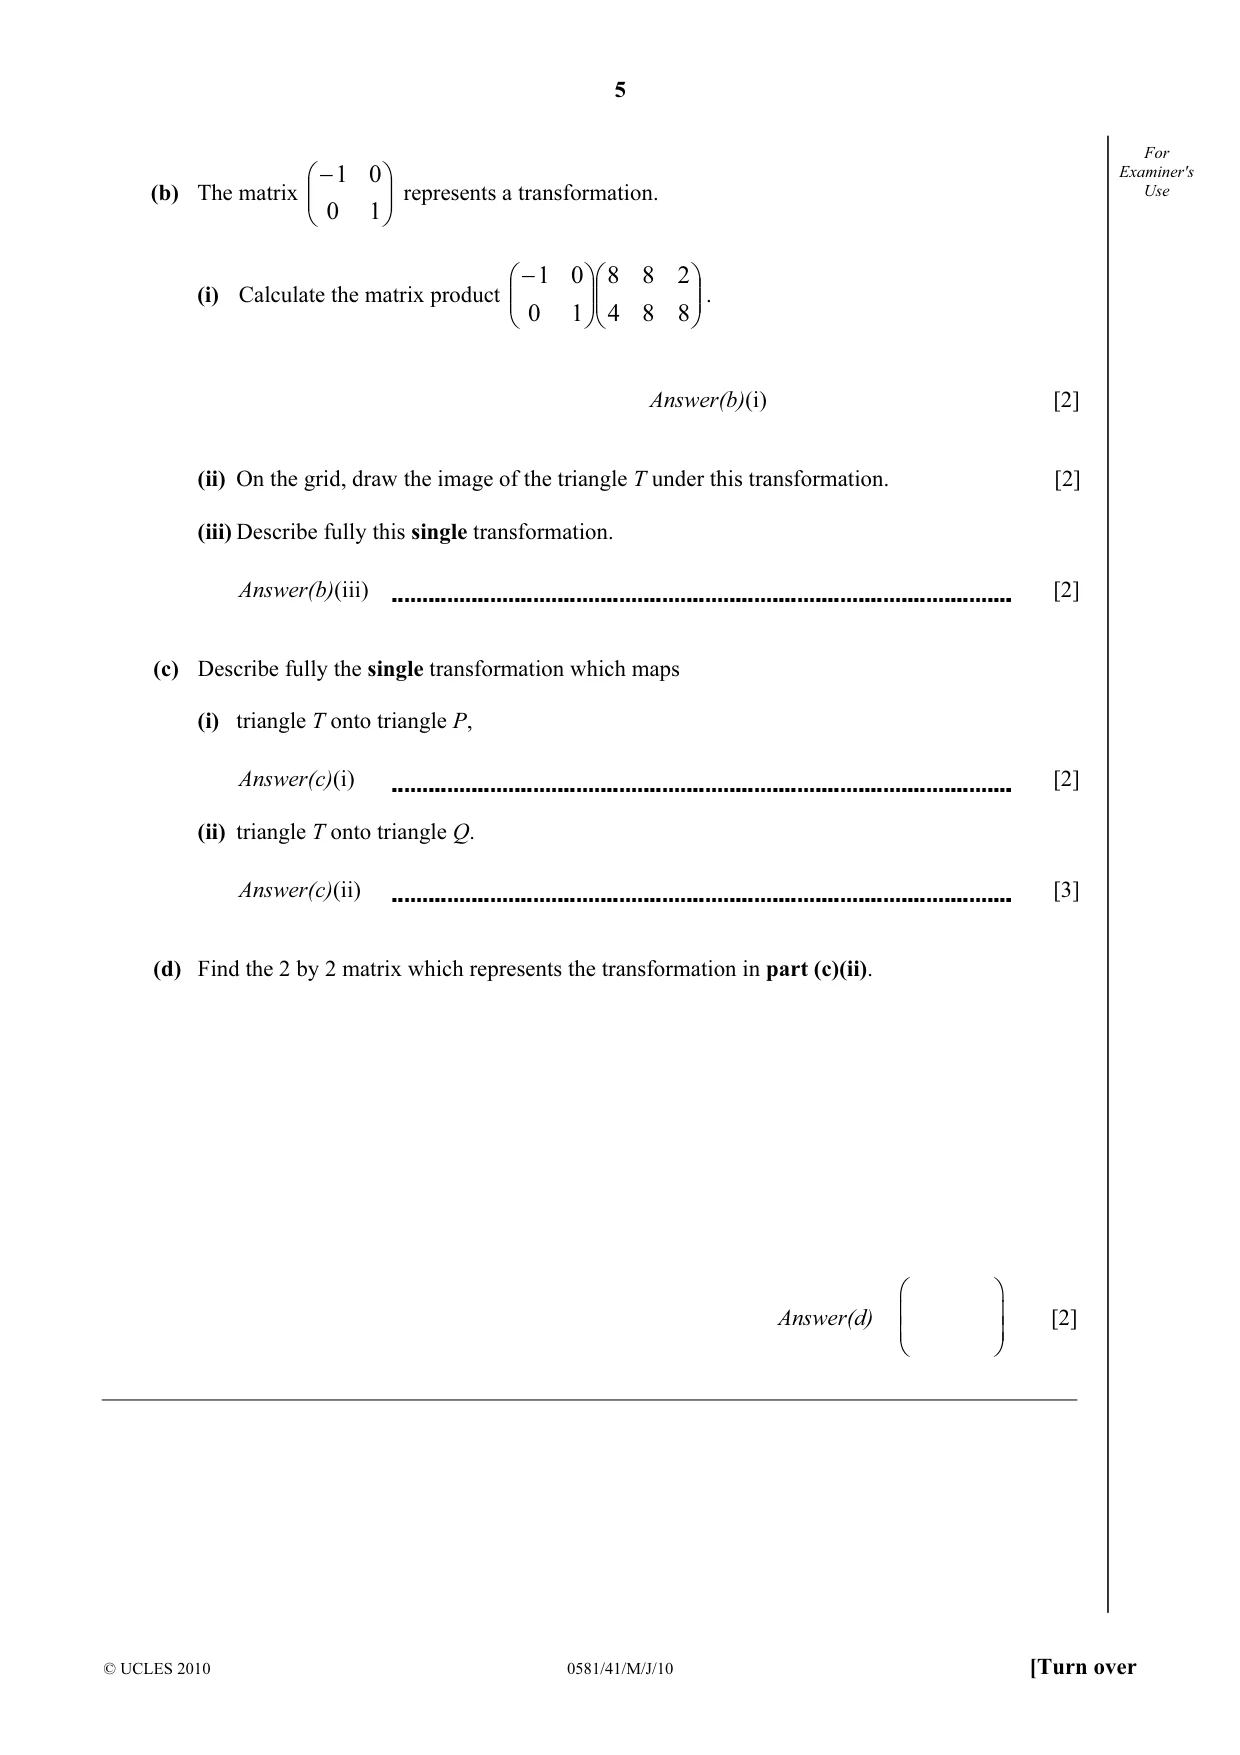
5 © UCLES 2010 0581/41/M/J/10 [Turn over For Examiner's Use (b) The matrix − 1 0 0 1 represents a transformation. (i) Calculate the matrix product − 8 8 4 2 8 8 1 0 0 1 . Answer(b)(i) [2] (ii) On the grid, draw the image of the triangle T under this transformation. [2] (iii) Describe fully this single transformation. Answer(b)(iii) [2] (c) Describe fully the single transformation which maps (i) triangle T onto triangle P, Answer(c)(i) [2] (ii) triangle T onto triangle Q. Answer(c)(ii) [3] (d) Find the 2 by 2 matrix which represents the transformation in part (c)(ii). Answer(d) [2]
Question paper, page 6
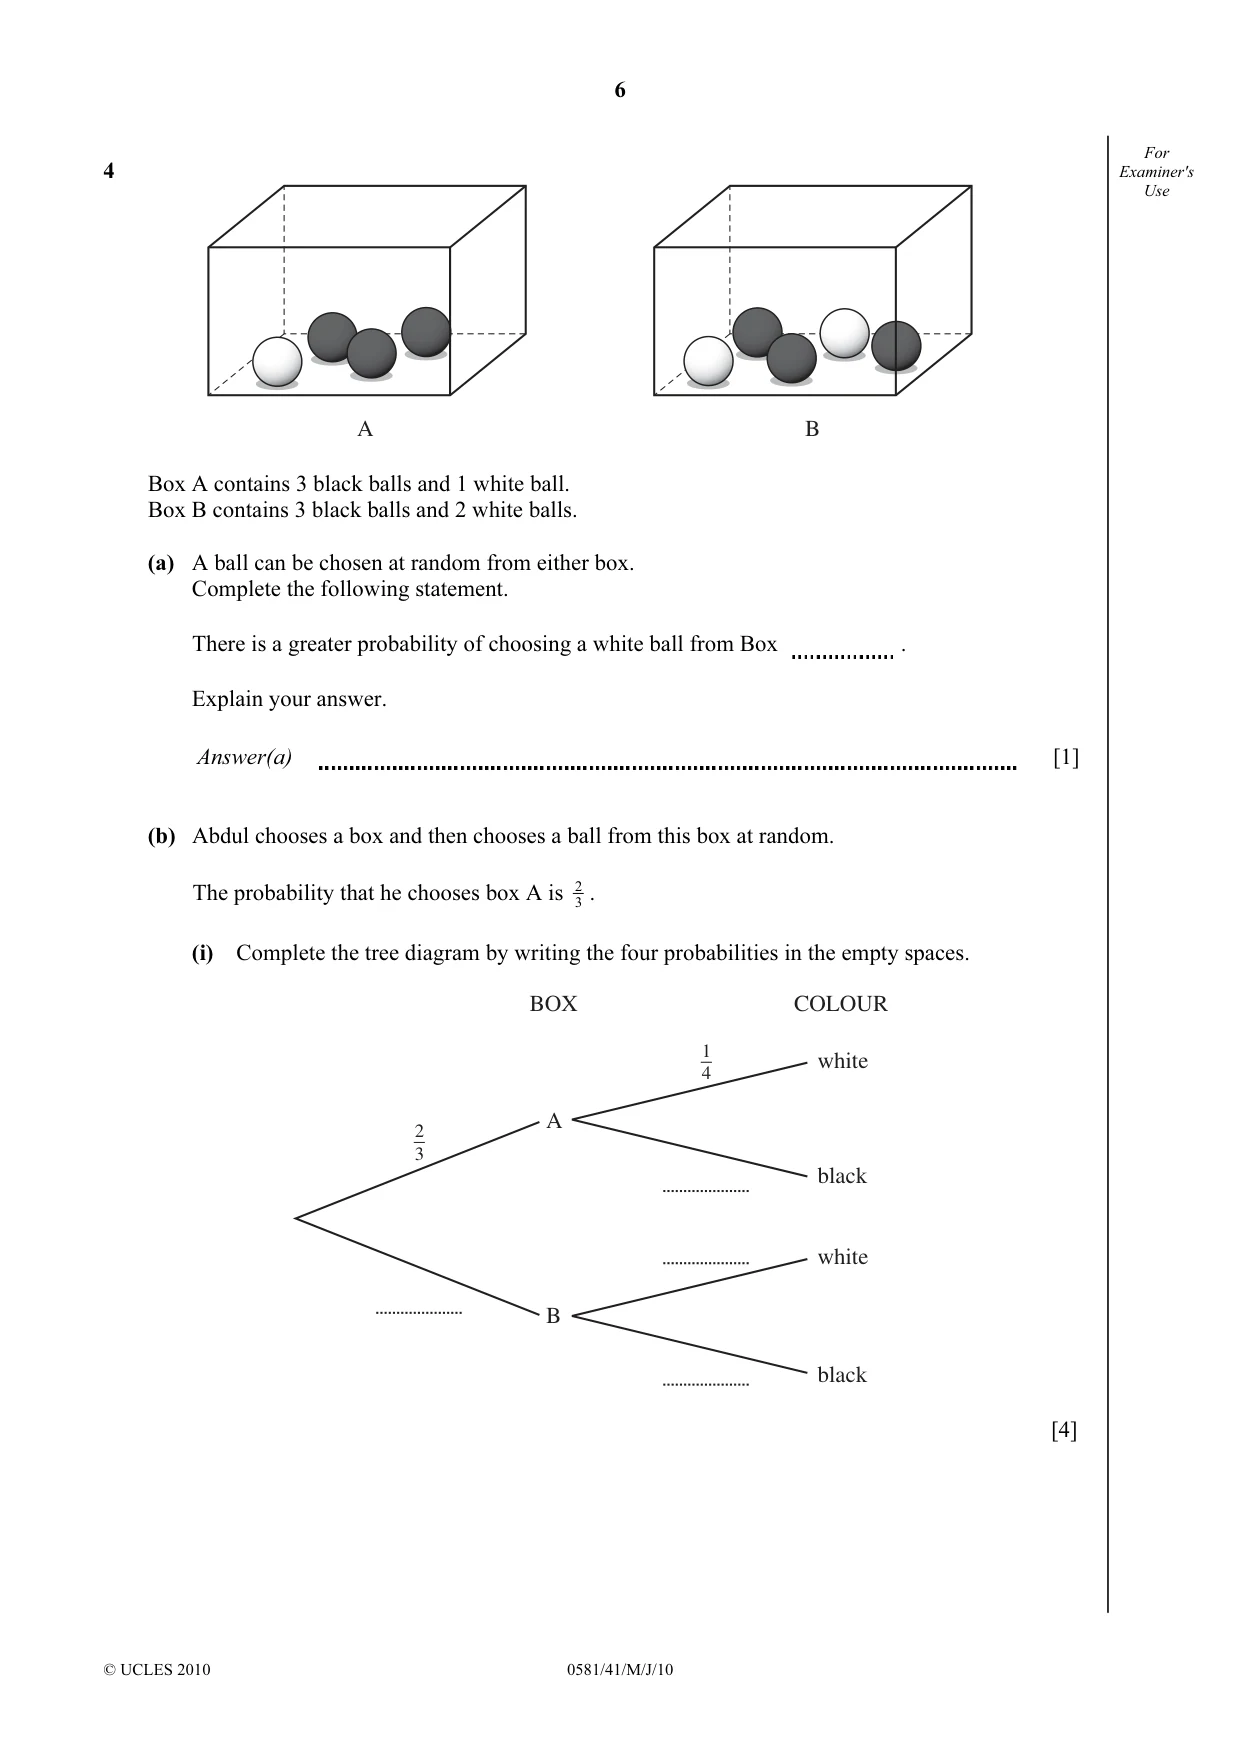
6 © UCLES 2010 0581/41/M/J/10 For Examiner's Use 4 A B Box A contains 3 black balls and 1 white ball. Box B contains 3 black balls and 2 white balls. (a) A ball can be chosen at random from either box. Complete the following statement. There is a greater probability of choosing a white ball from Box . Explain your answer. Answer(a) [1] (b) Abdul chooses a box and then chooses a ball from this box at random. The probability that he chooses box A is 3 2 . (i) Complete the tree diagram by writing the four probabilities in the empty spaces. BOX COLOUR A B 2 3 1 4 white black black white [4]
Question paper, page 7
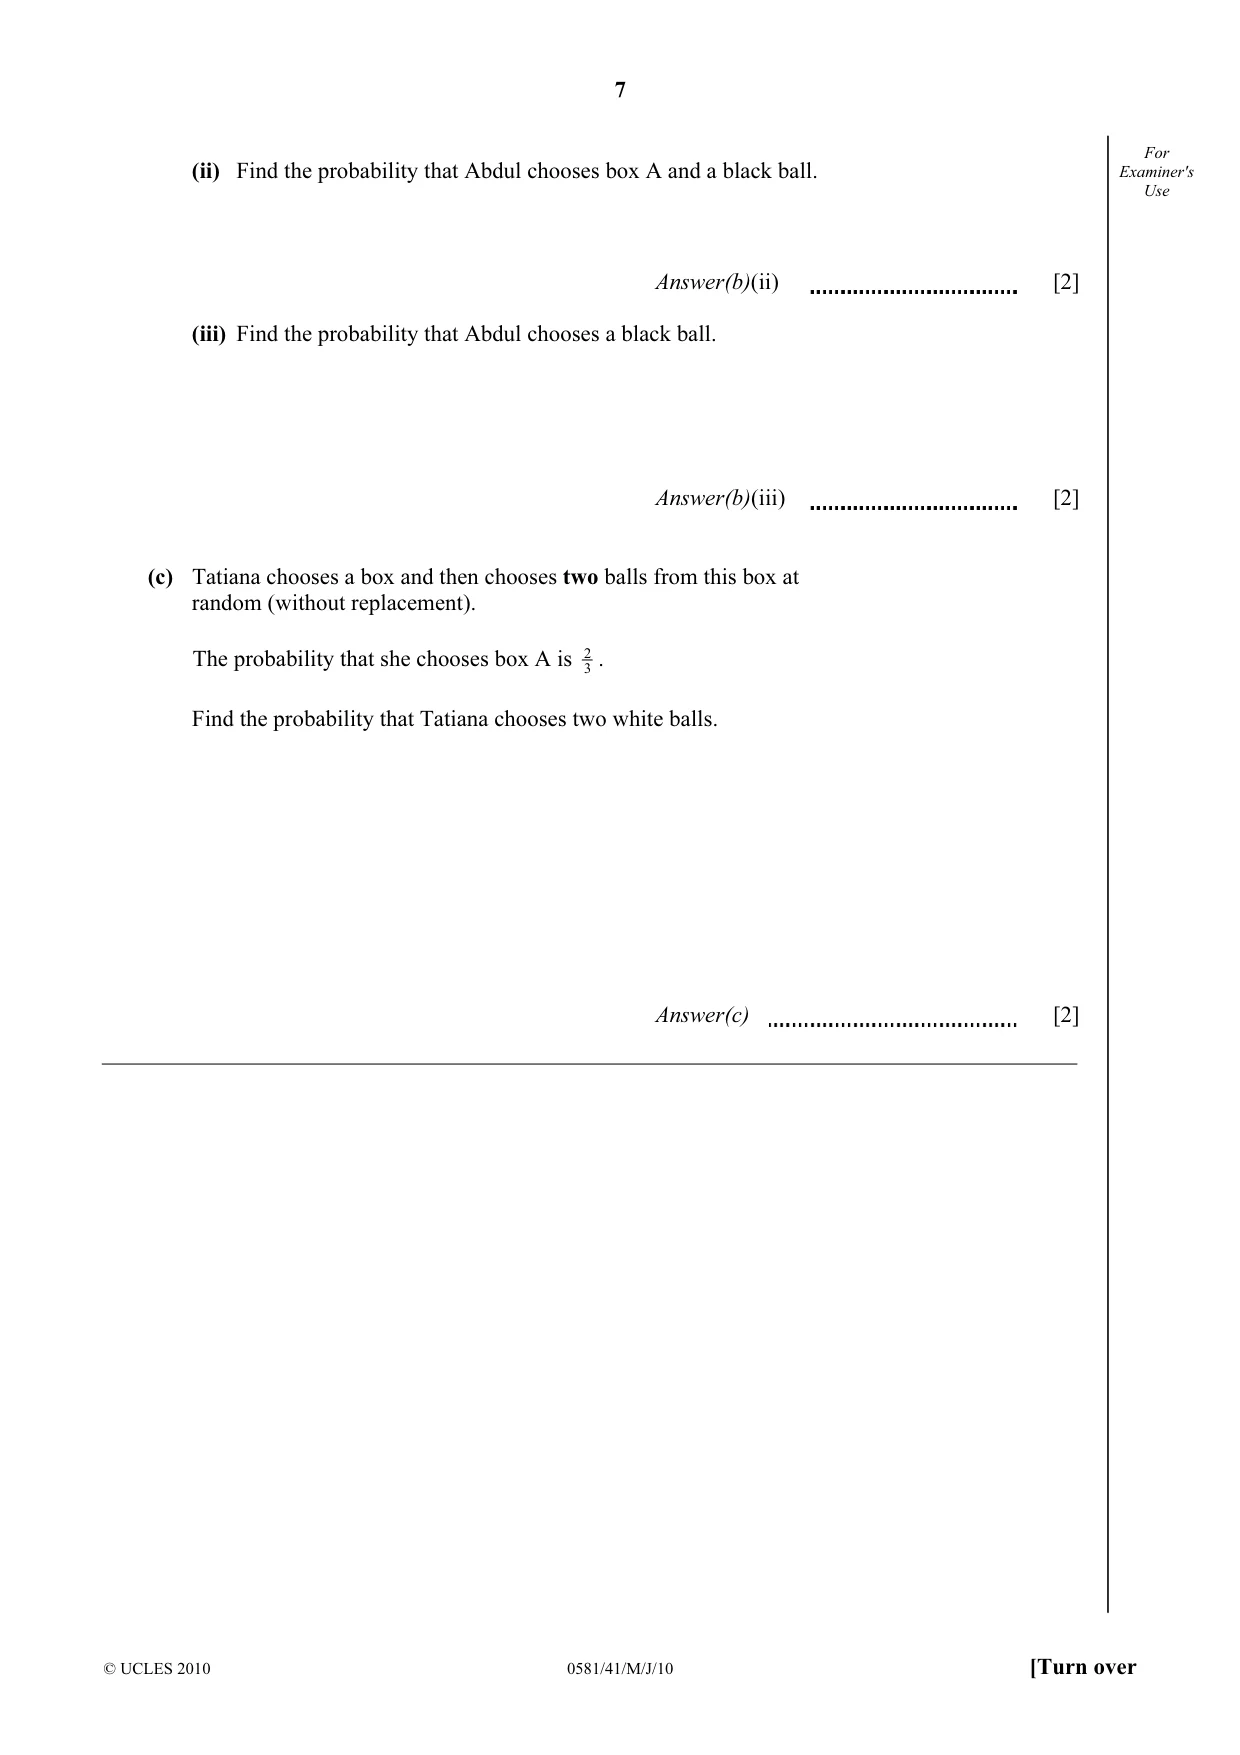
7 © UCLES 2010 0581/41/M/J/10 [Turn over For Examiner's Use (ii) Find the probability that Abdul chooses box A and a black ball. Answer(b)(ii) [2] (iii) Find the probability that Abdul chooses a black ball. Answer(b)(iii) [2] (c) Tatiana chooses a box and then chooses two balls from this box at random (without replacement). The probability that she chooses box A is 3 2 . Find the probability that Tatiana chooses two white balls. Answer(c) [2]
Question paper, page 8
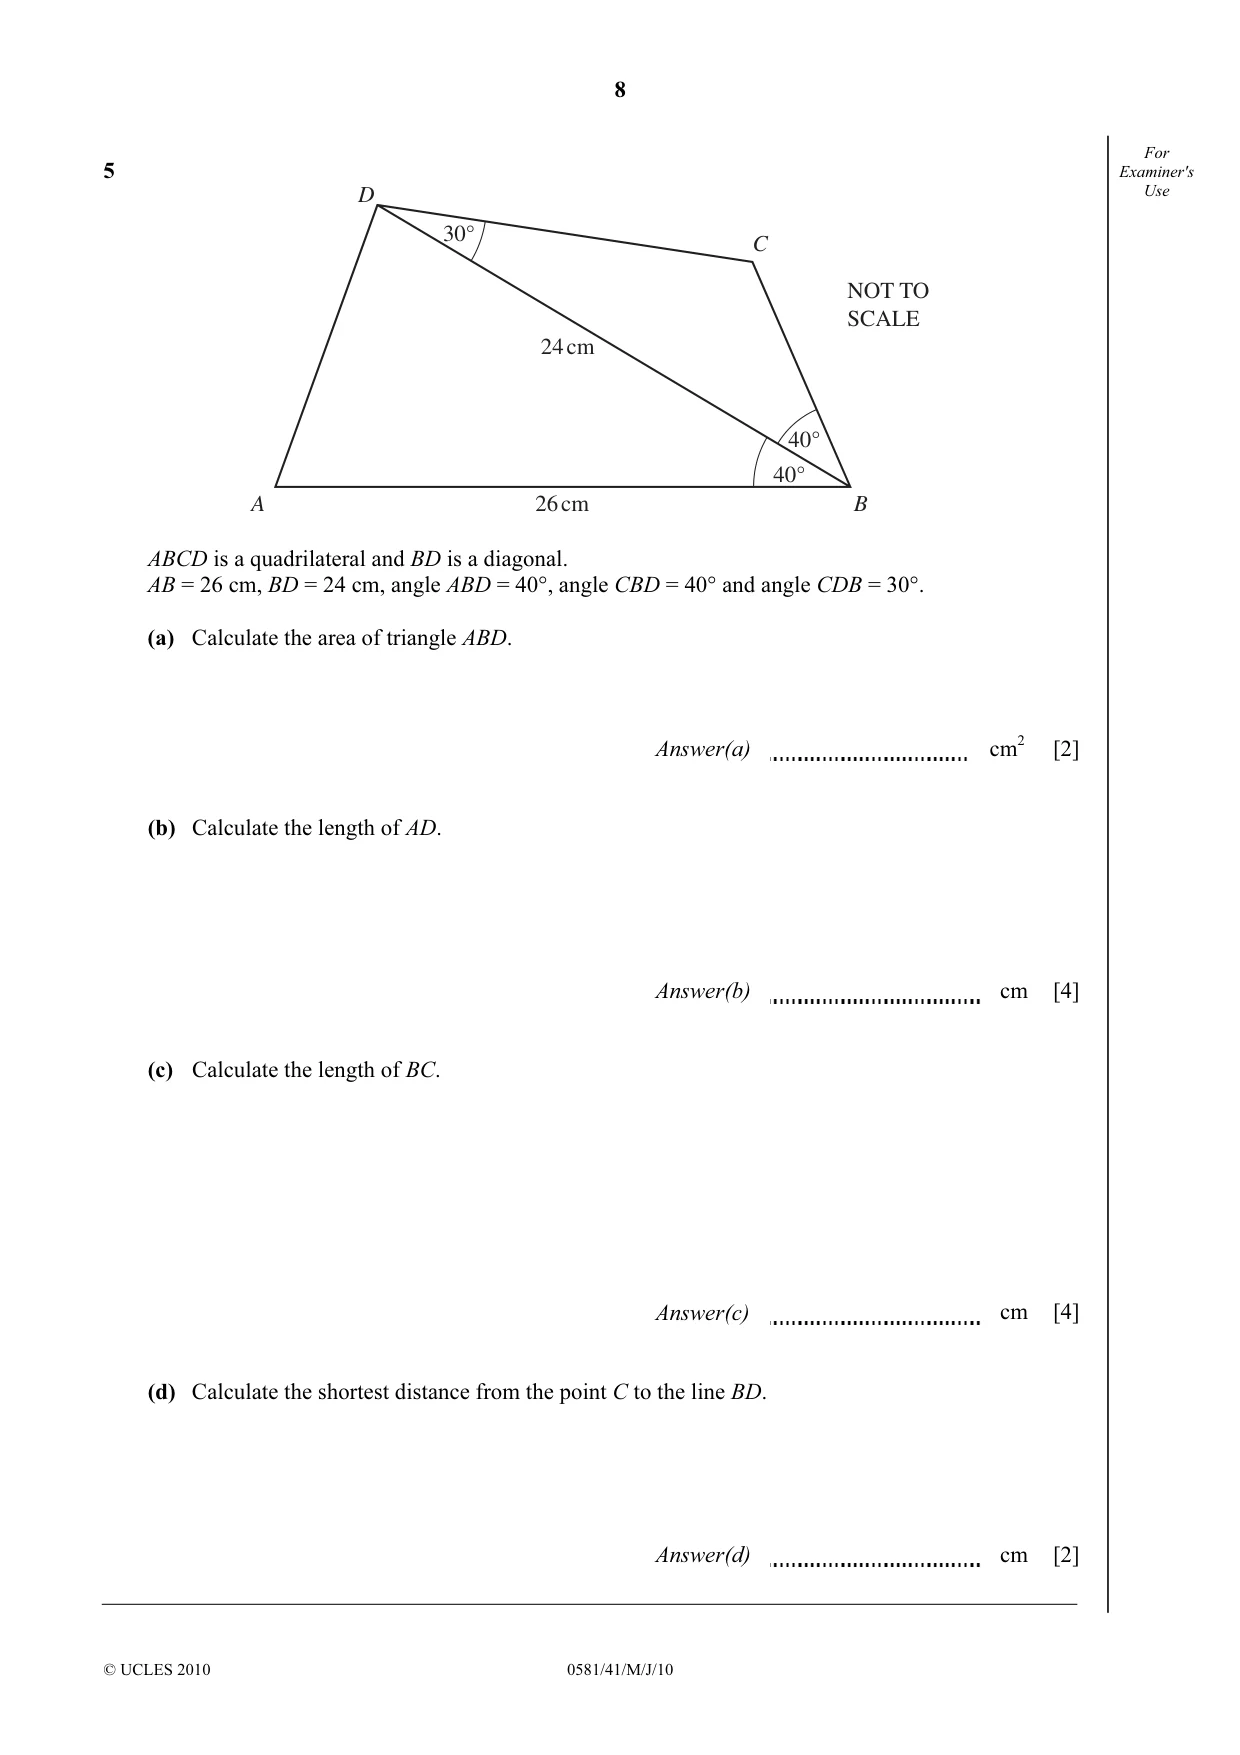
8 © UCLES 2010 0581/41/M/J/10 For Examiner's Use 5 30° 40° 40° D A B C 24 cm 26 cm NOT TO SCALE ABCD is a quadrilateral and BD is a diagonal. AB = 26 cm, BD = 24 cm, angle ABD = 40°, angle CBD = 40° and angle CDB = 30°. (a) Calculate the area of triangle ABD. Answer(a) cm2 [2] (b) Calculate the length of AD. Answer(b) cm [4] (c) Calculate the length of BC. Answer(c) cm [4] (d) Calculate the shortest distance from the point C to the line BD. Answer(d) cm [2]
Question paper, page 9
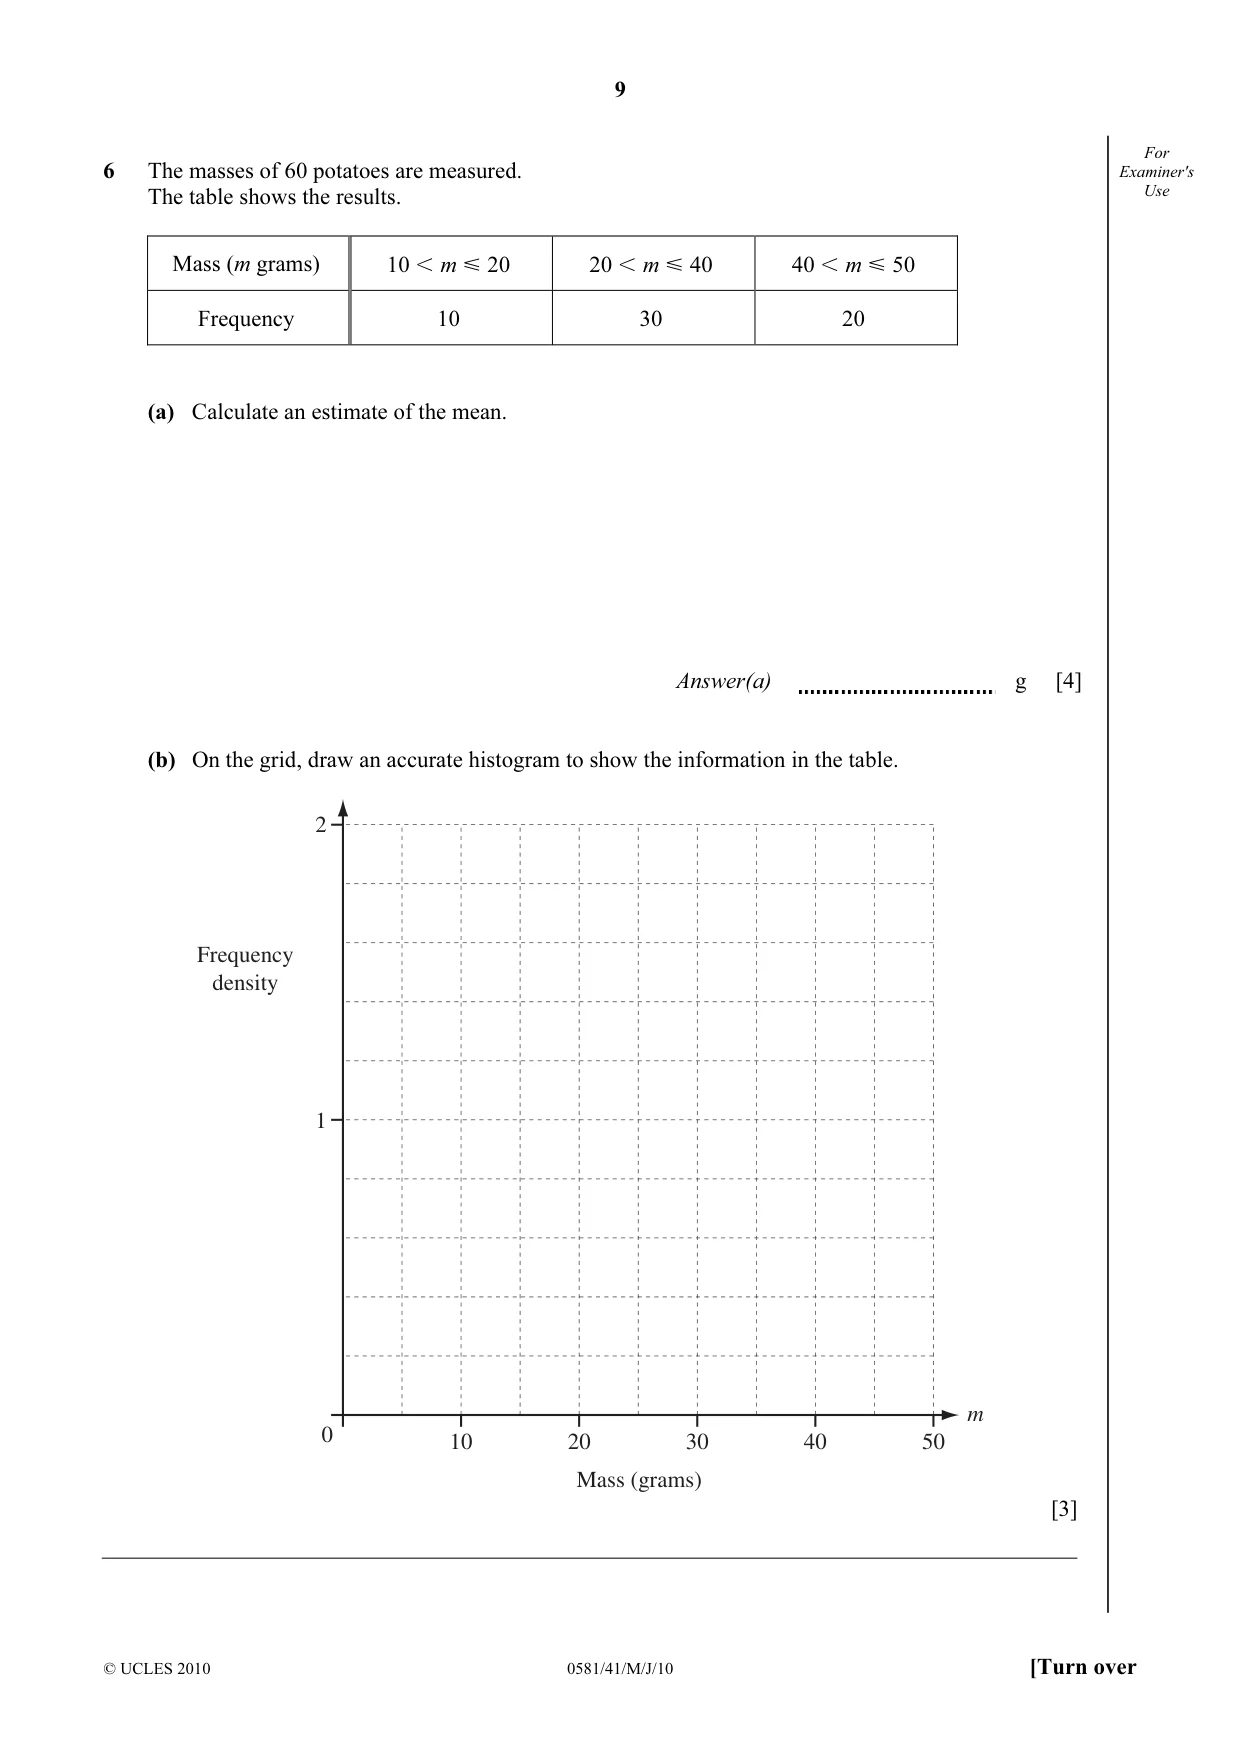
9 © UCLES 2010 0581/41/M/J/10 [Turn over For Examiner's Use 6 The masses of 60 potatoes are measured. The table shows the results. Mass (m grams) 10 I m Y 20 20 I m Y 40 40 I m Y 50 Frequency 10 30 20 (a) Calculate an estimate of the mean. Answer(a) g [4] (b) On the grid, draw an accurate histogram to show the information in the table. 2 1 0 10 20 30 40 50 Frequency density Mass (grams) m [3]
Question paper, page 10
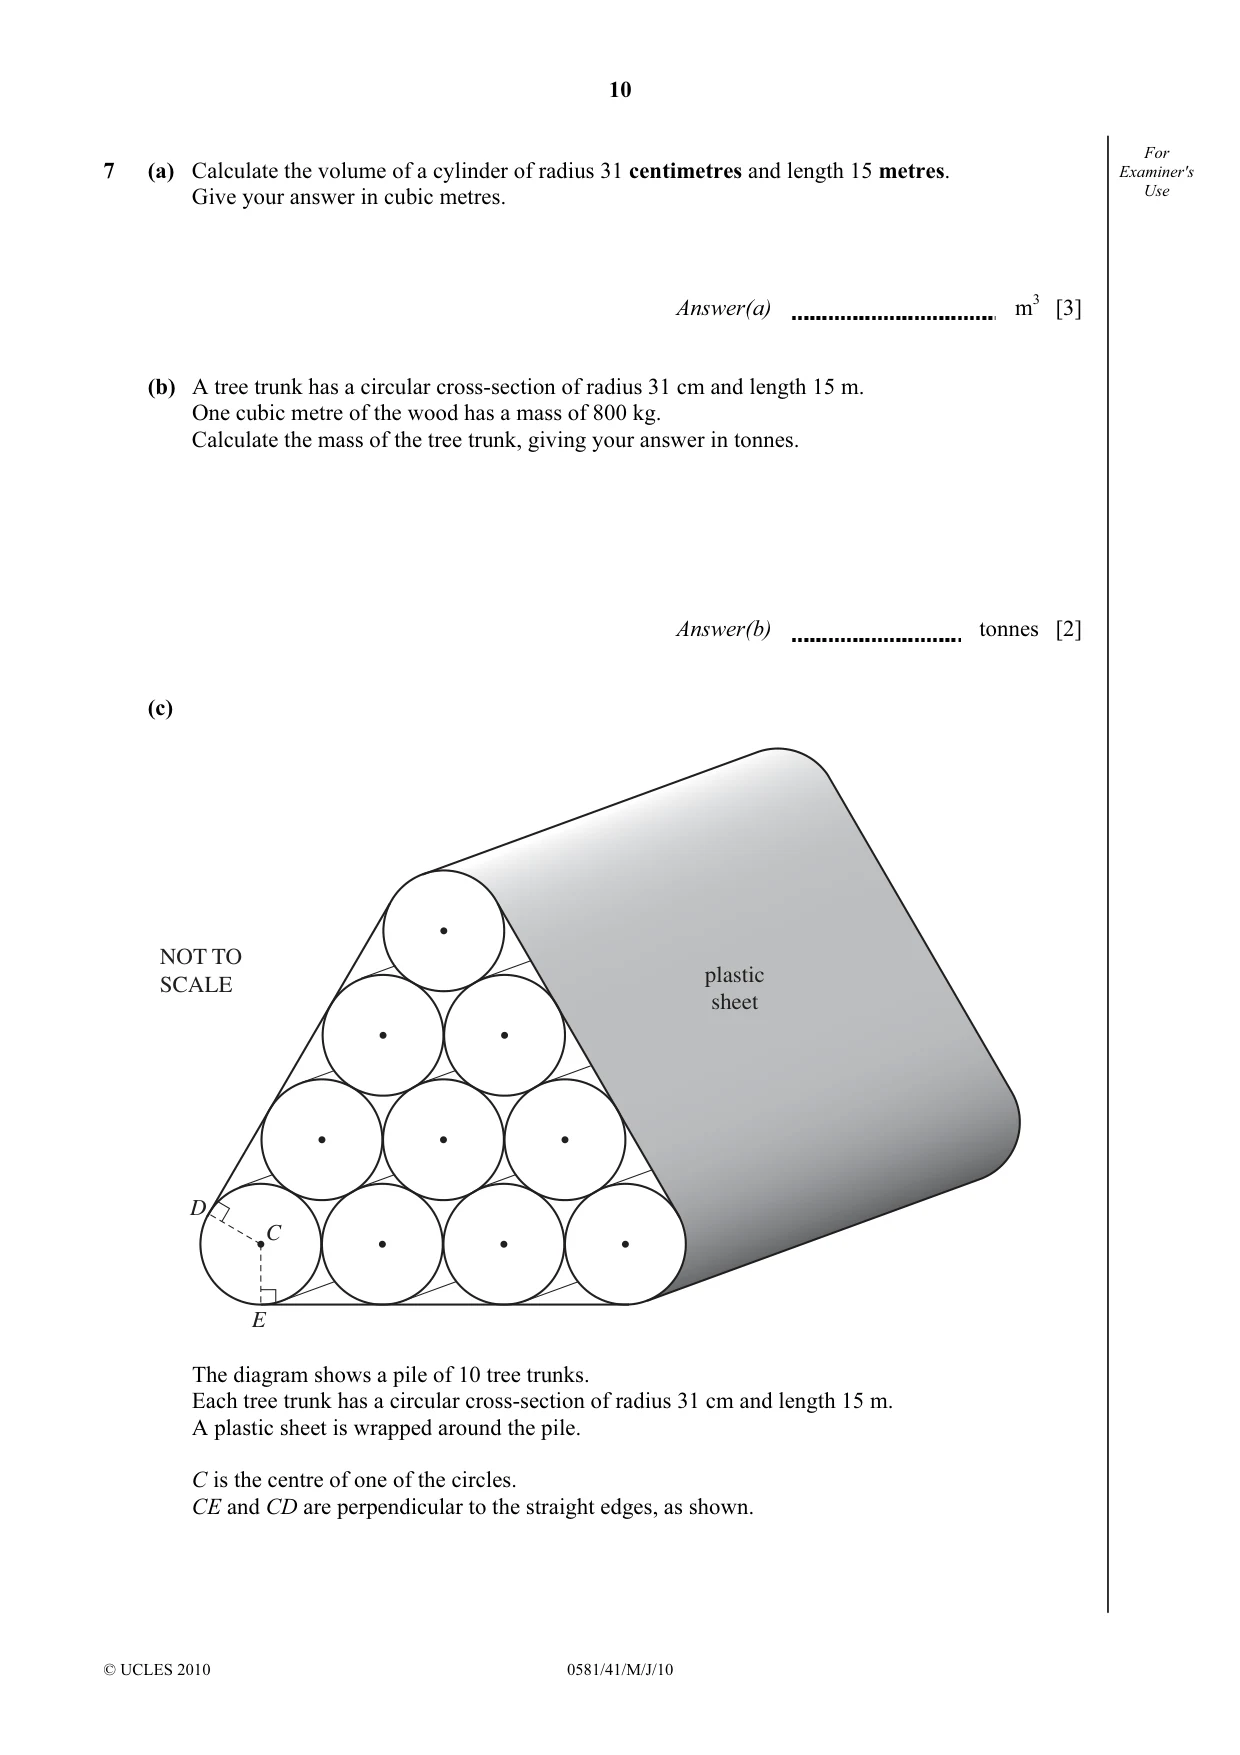
10 © UCLES 2010 0581/41/M/J/10 For Examiner's Use 7 (a) Calculate the volume of a cylinder of radius 31 centimetres and length 15 metres. Give your answer in cubic metres. Answer(a) m3 [3] (b) A tree trunk has a circular cross-section of radius 31 cm and length 15 m. One cubic metre of the wood has a mass of 800 kg. Calculate the mass of the tree trunk, giving your answer in tonnes. Answer(b) tonnes [2] (c) plastic sheet C D E NOT TO SCALE The diagram shows a pile of 10 tree trunks. Each tree trunk has a circular cross-section of radius 31 cm and length 15 m. A plastic sheet is wrapped around the pile. C is the centre of one of the circles. CE and CD are perpendicular to the straight edges, as shown.
Question paper, page 11
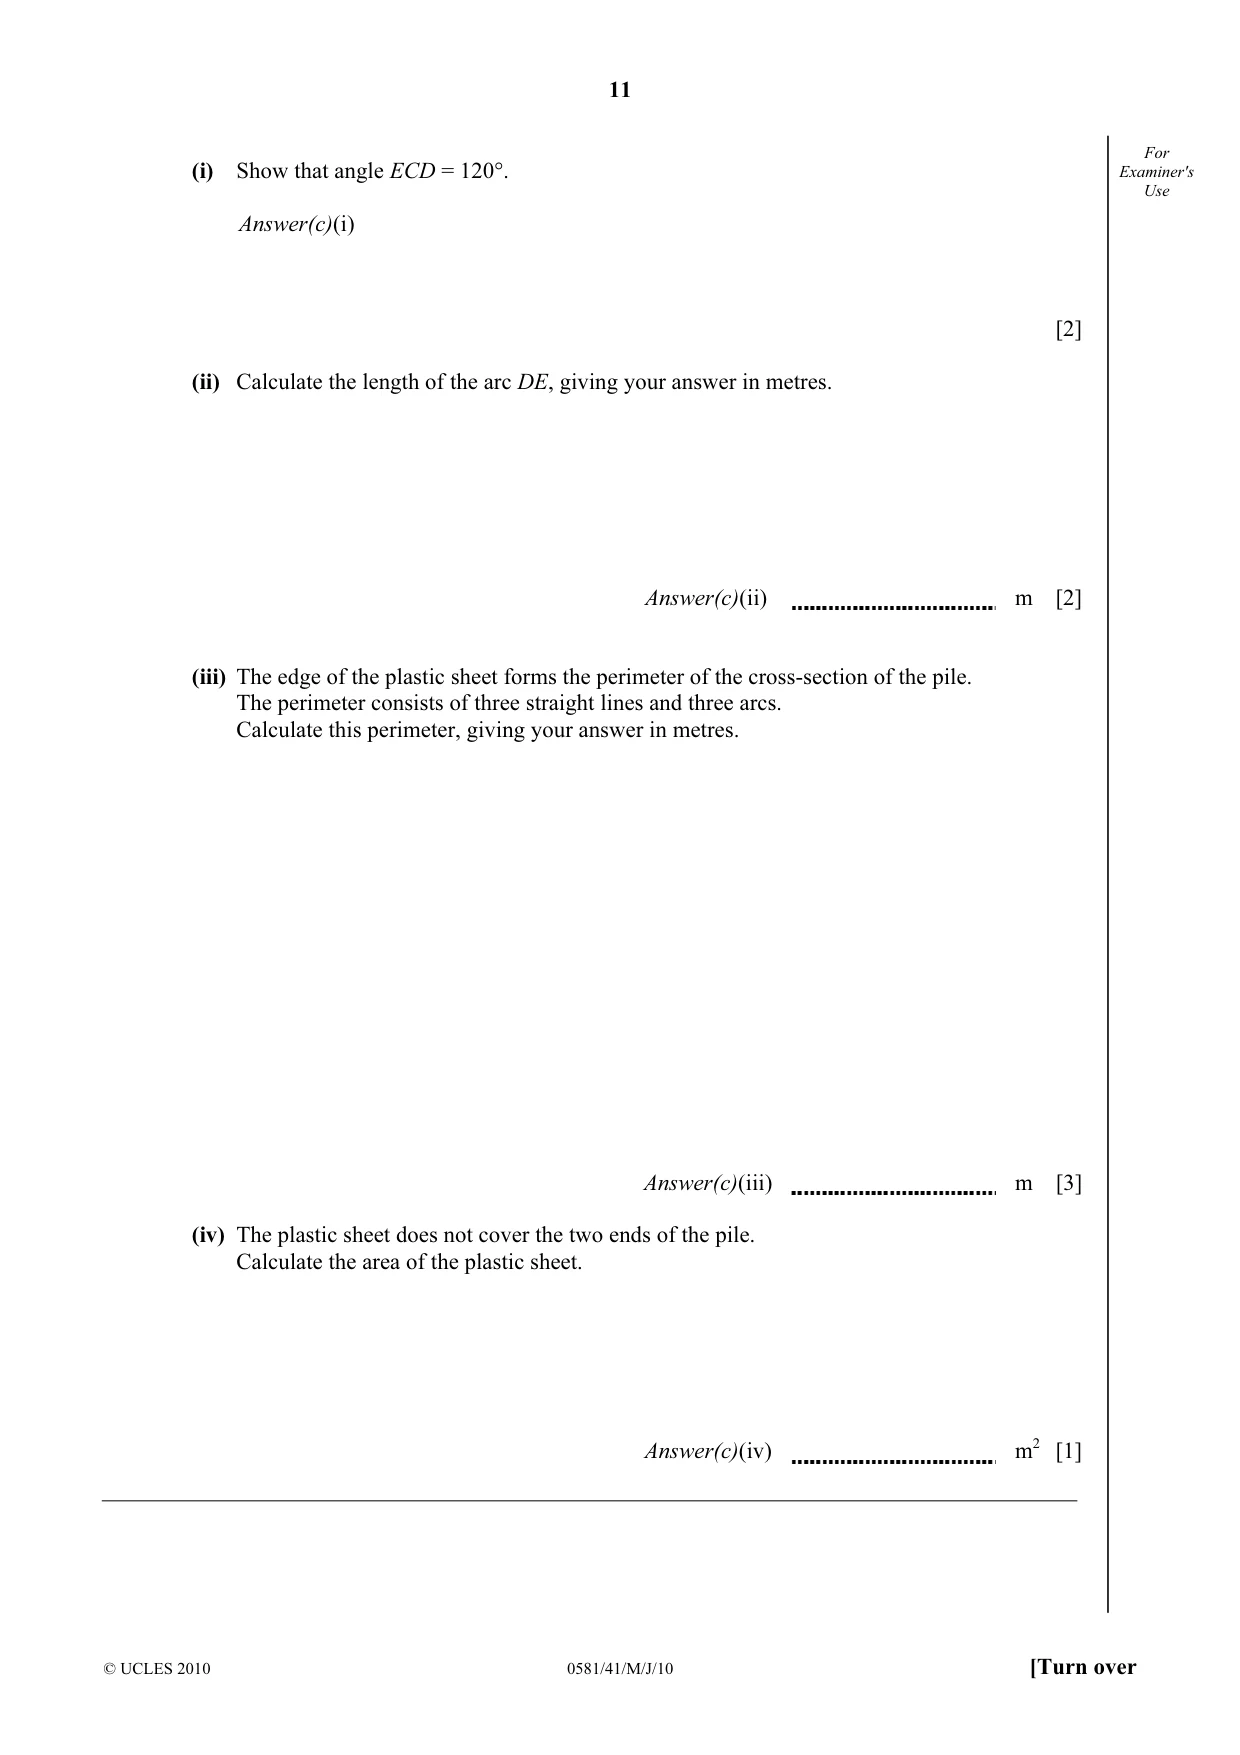
11 © UCLES 2010 0581/41/M/J/10 [Turn over For Examiner's Use (i) Show that angle ECD = 120°. Answer(c)(i) [2] (ii) Calculate the length of the arc DE, giving your answer in metres. Answer(c)(ii) m [2] (iii) The edge of the plastic sheet forms the perimeter of the cross-section of the pile. The perimeter consists of three straight lines and three arcs. Calculate this perimeter, giving your answer in metres. Answer(c)(iii) m [3] (iv) The plastic sheet does not cover the two ends of the pile. Calculate the area of the plastic sheet. Answer(c)(iv) m2 [1]
Question paper, page 12
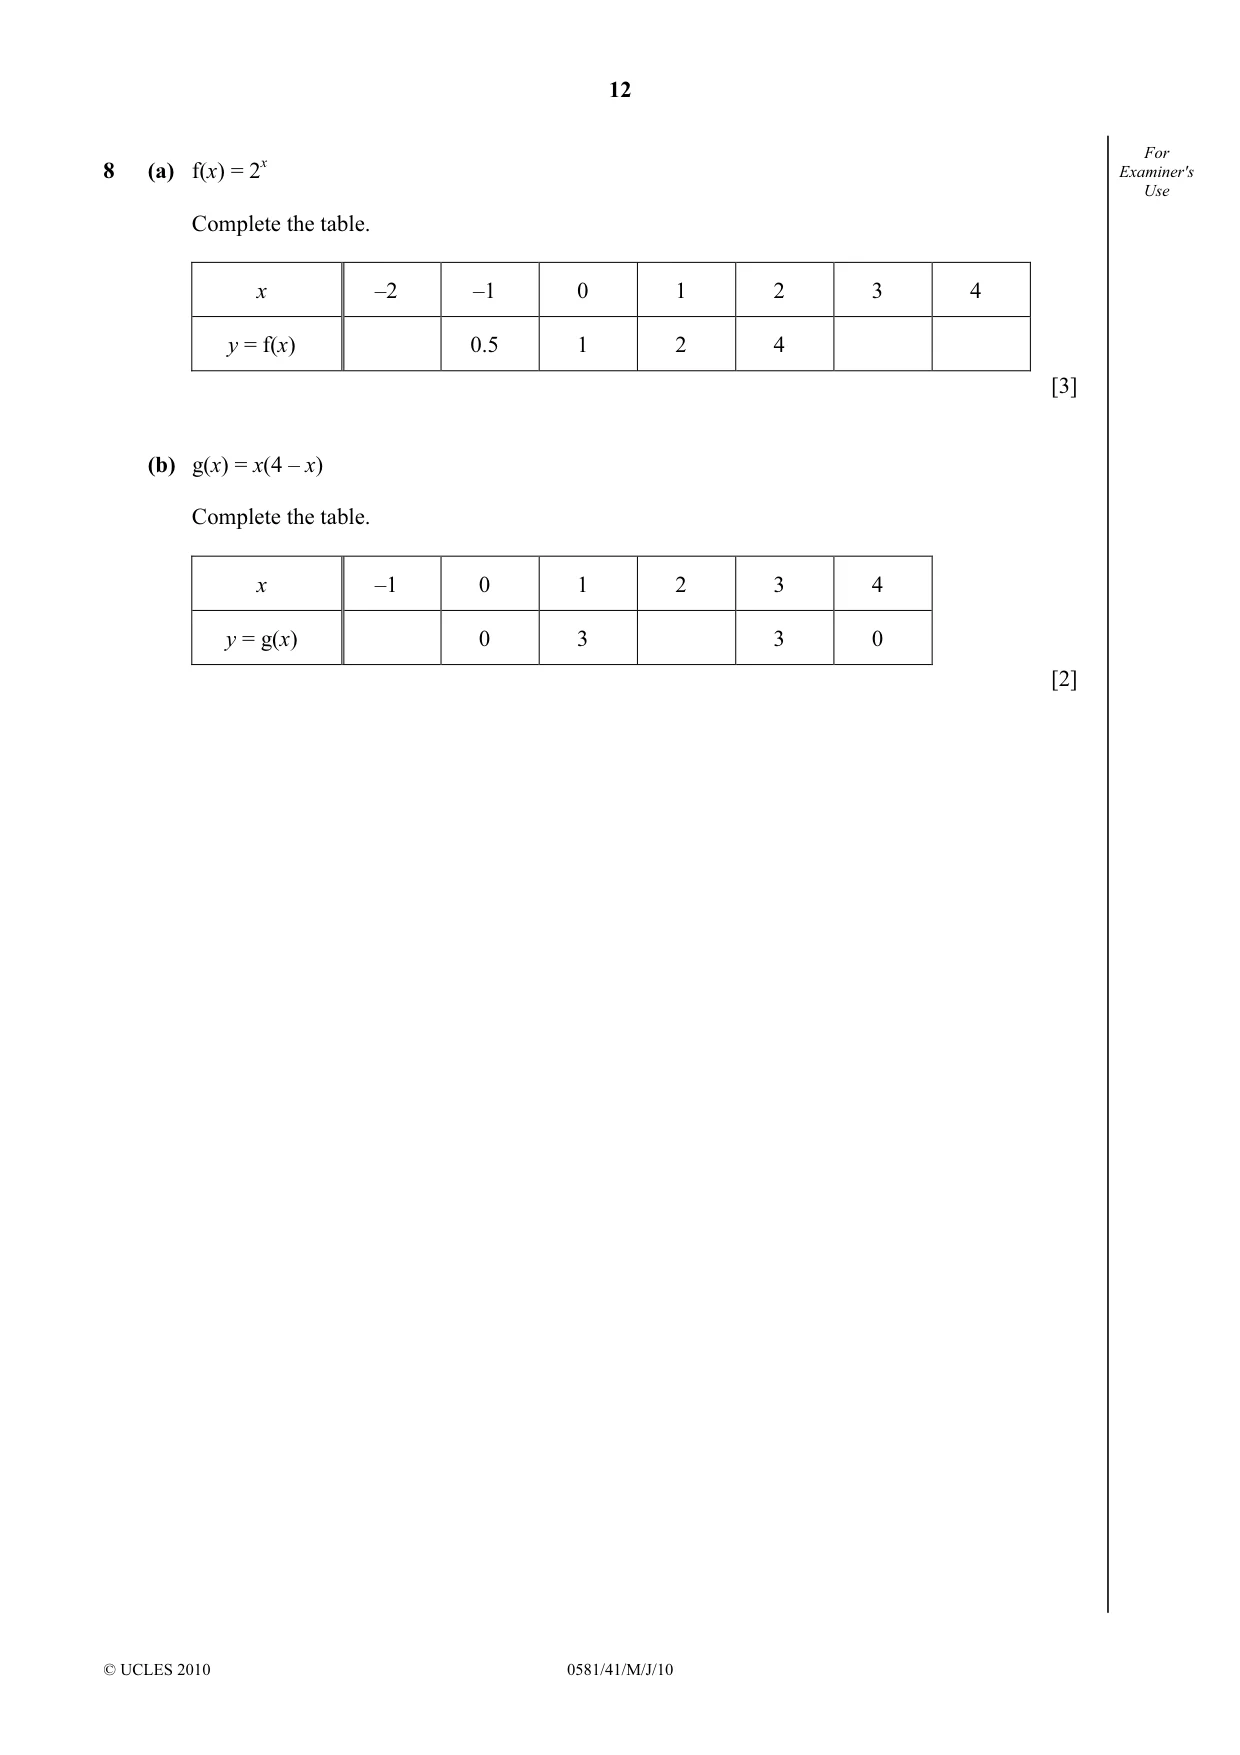
12 © UCLES 2010 0581/41/M/J/10 For Examiner's Use 8 (a) f(x) = 2x Complete the table. x –2 –1 0 1 2 3 4 y = f(x) 0.5 1 2 4 [3] (b) g(x) = x(4 – x) Complete the table. x –1 0 1 2 3 4 y = g(x) 0 3 3 0 [2]
Question paper, page 13
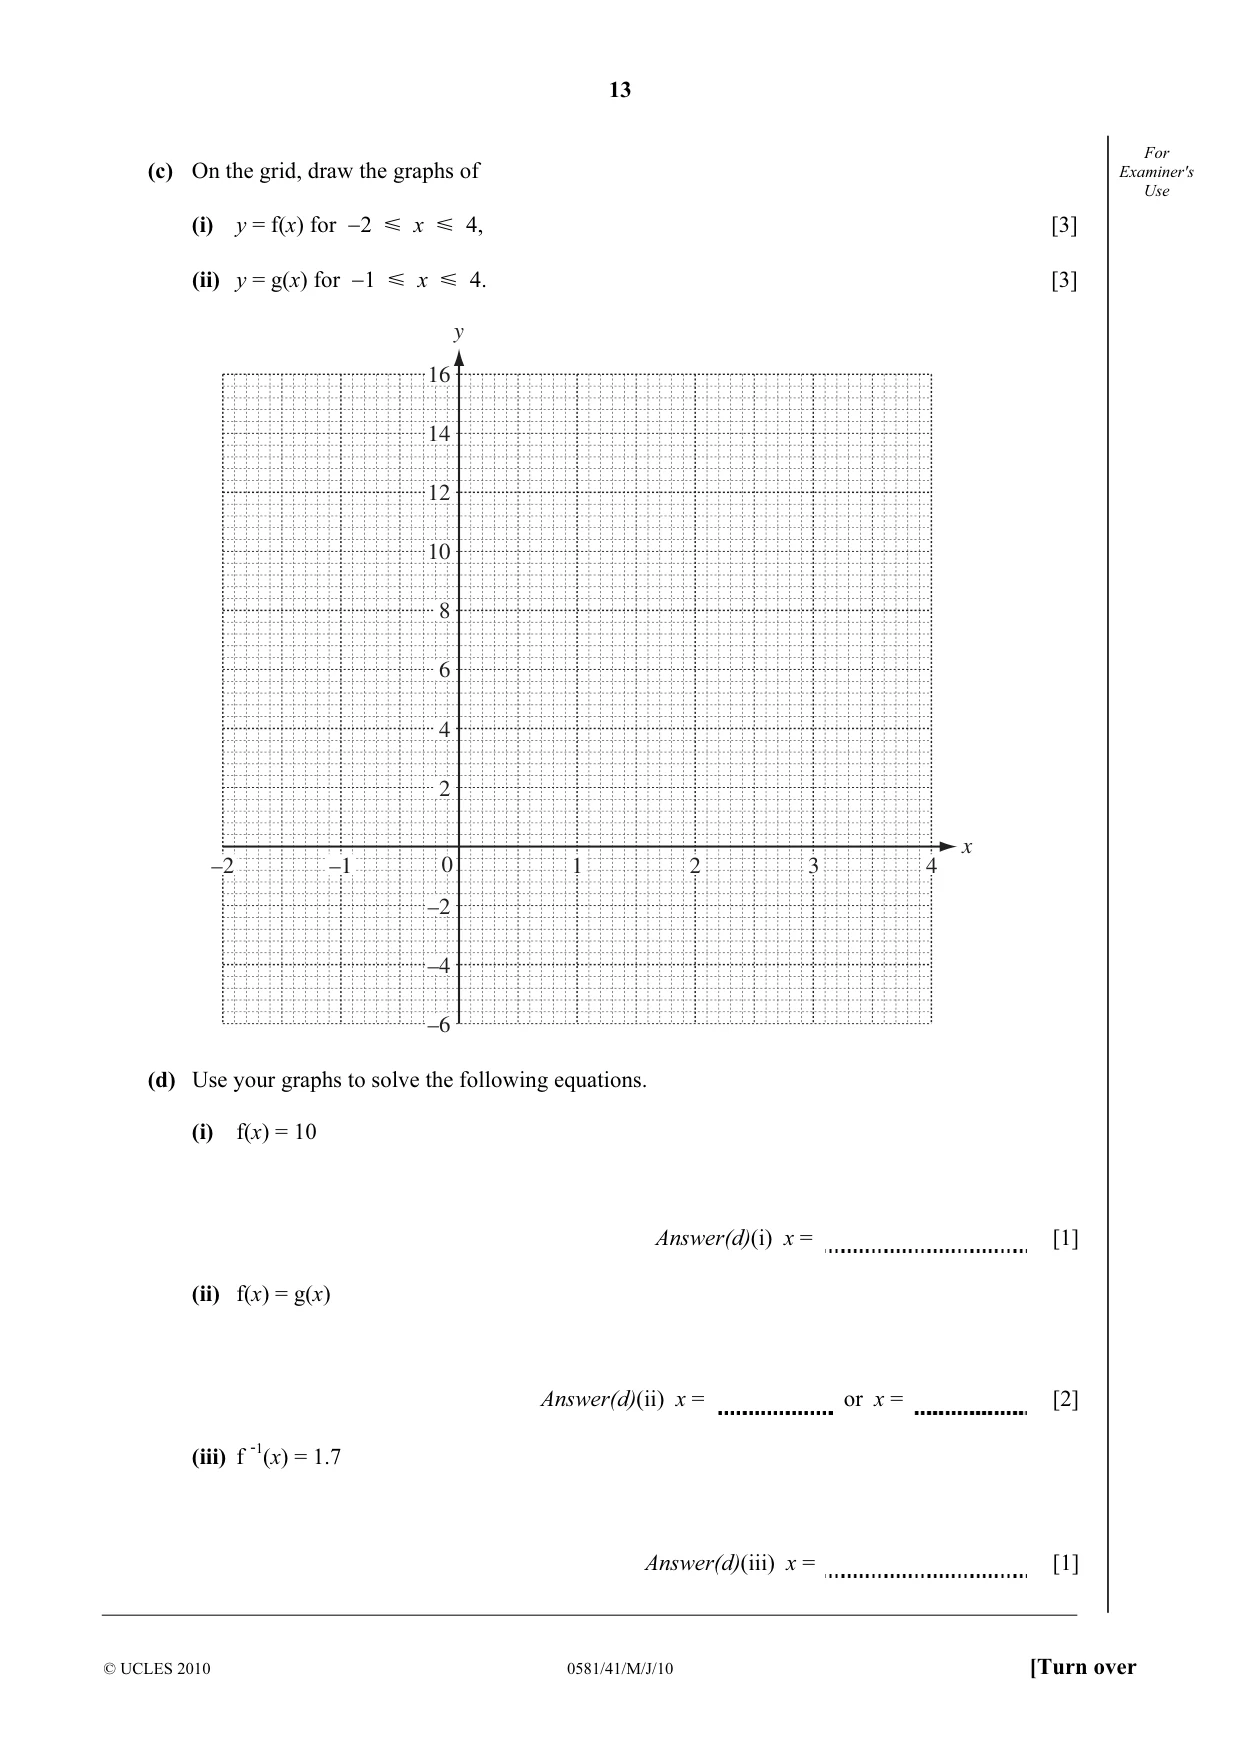
13 © UCLES 2010 0581/41/M/J/10 [Turn over For Examiner's Use (c) On the grid, draw the graphs of (i) y = f(x) for −2 Y x Y 4, [3] (ii) y = g(x) for −1 Y x Y 4. [3] 16 14 12 10 8 6 4 2 –2 –4 –6 0 –1 1 2 3 4 –2 x y (d) Use your graphs to solve the following equations. (i) f(x) = 10 Answer(d)(i) x = [1] (ii) f(x) = g(x) Answer(d)(ii) x = or x = [2] (iii) f -1(x) = 1.7 Answer(d)(iii) x = [1]
Question paper, page 14
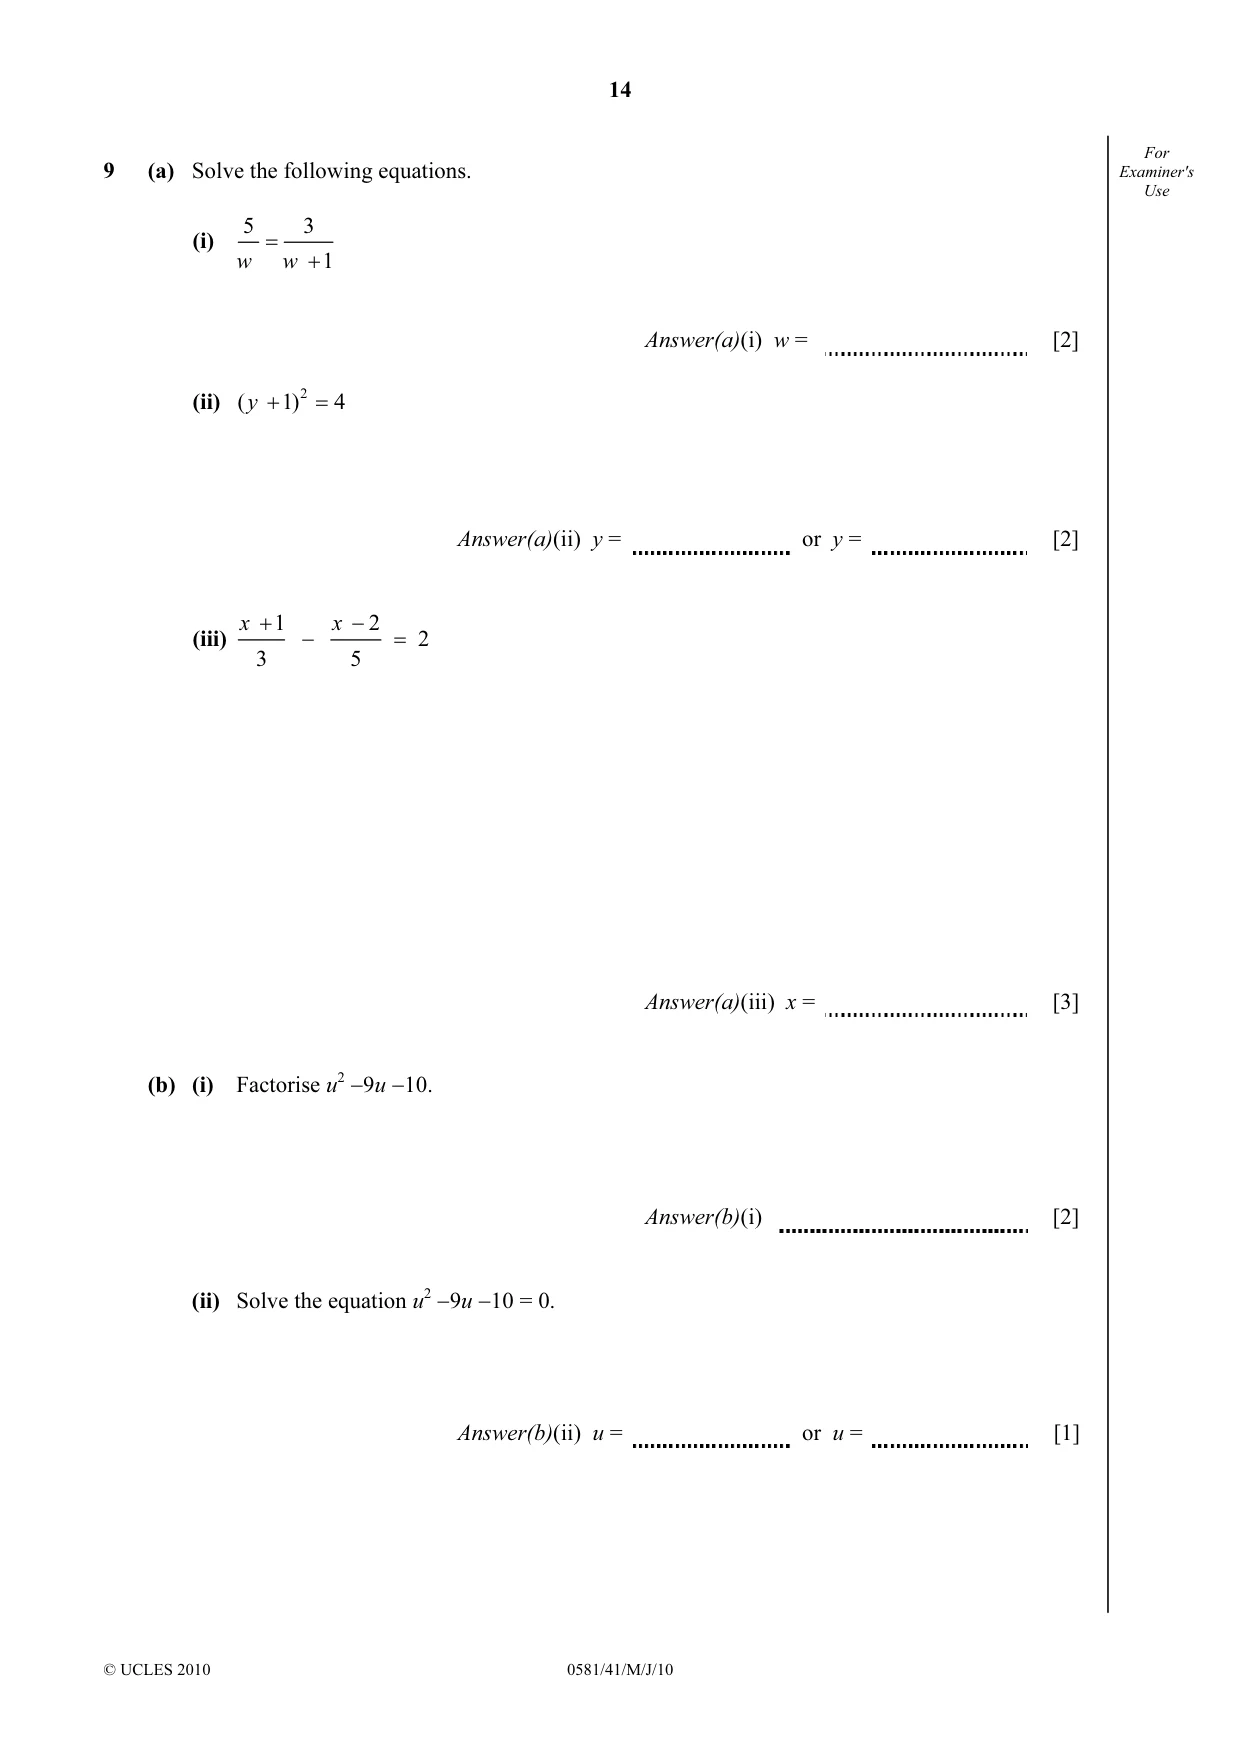
14 © UCLES 2010 0581/41/M/J/10 For Examiner's Use 9 (a) Solve the following equations. (i) 5 3 1 w w = + Answer(a)(i) w = [2] (ii) 2 ( 1) 4 y + = Answer(a)(ii) y = or y = [2] (iii) 1 2 2 3 5 x x + − − = Answer(a)(iii) x = [3] (b) (i) Factorise u2 −9u −10. Answer(b)(i) [2] (ii) Solve the equation u2 −9u −10 = 0. Answer(b)(ii) u = or u = [1]
Question paper, page 15
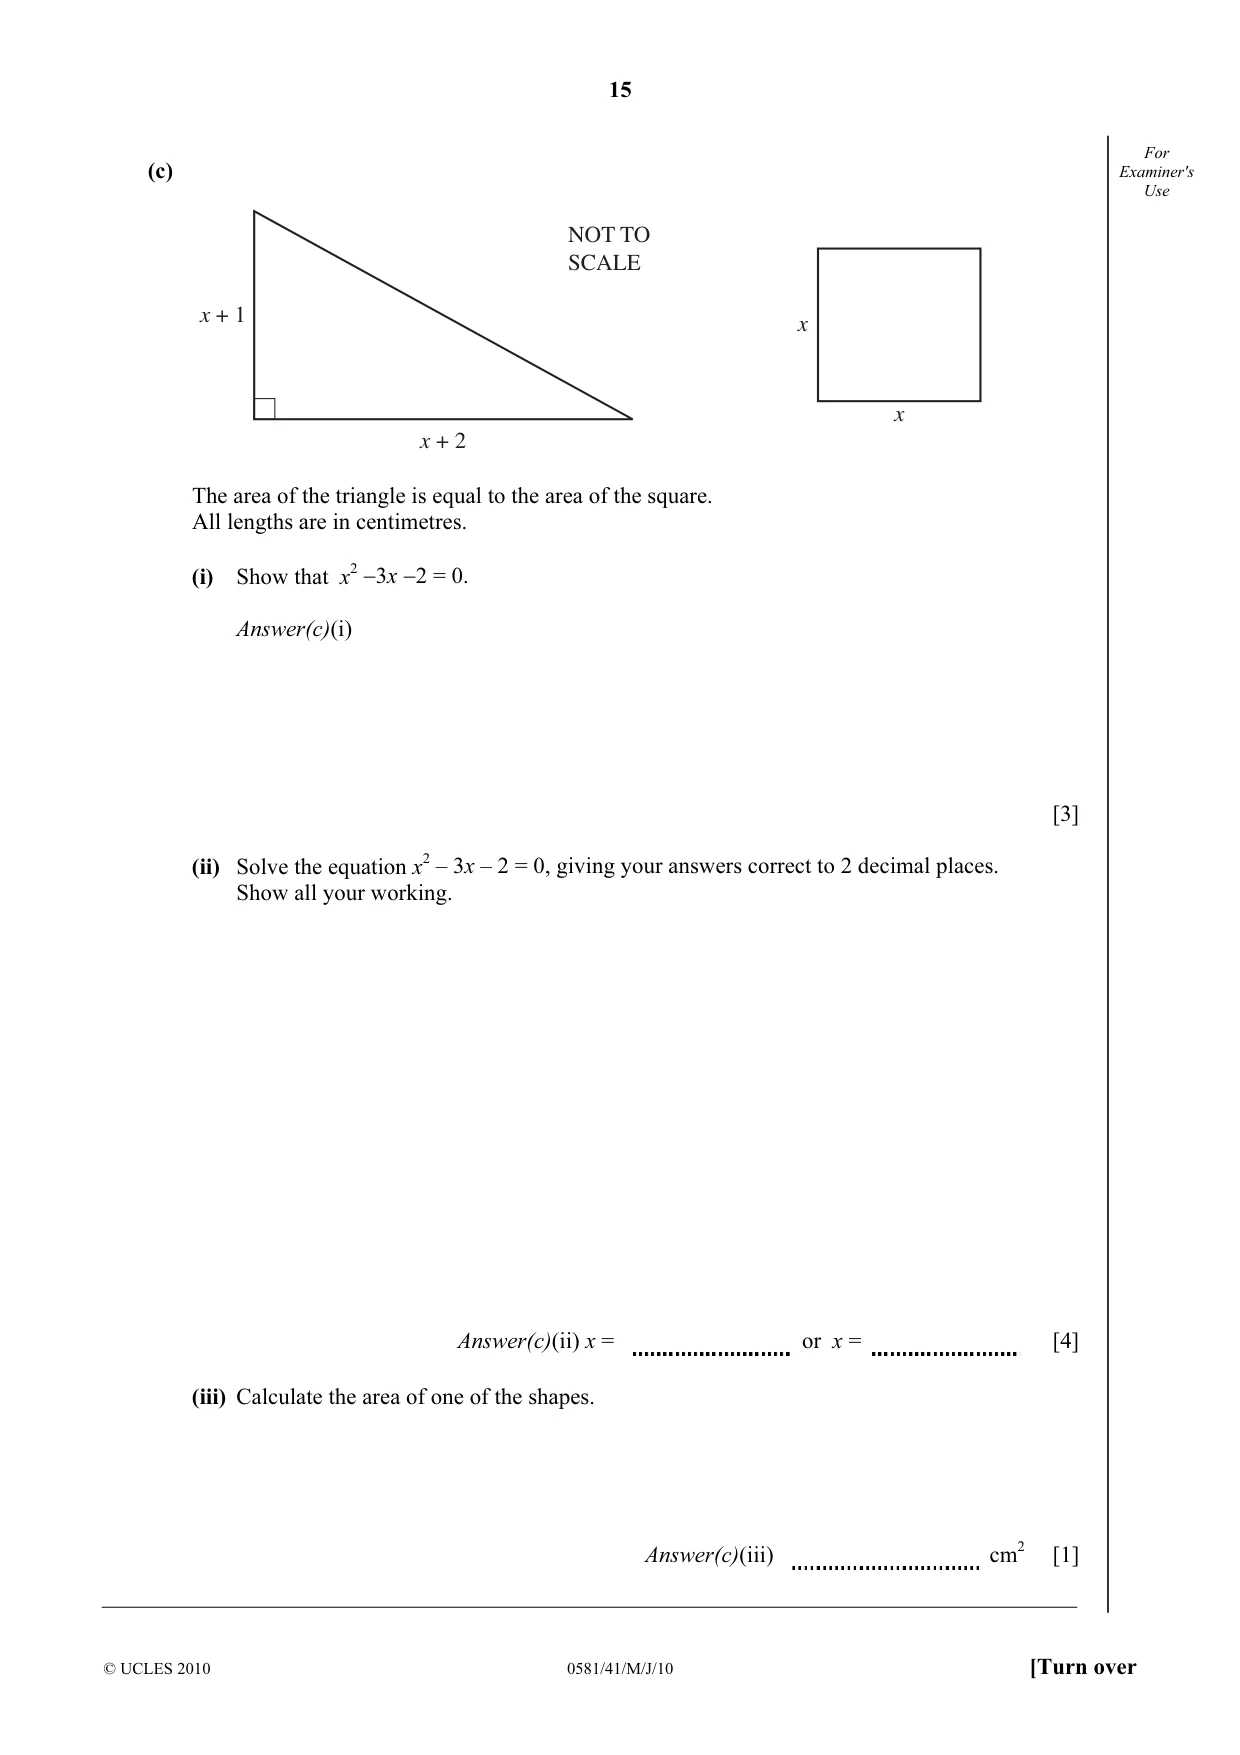
15 © UCLES 2010 0581/41/M/J/10 [Turn over For Examiner's Use (c) x + 1 x + 2 x x NOT TO SCALE The area of the triangle is equal to the area of the square. All lengths are in centimetres. (i) Show that x2 −3x −2 = 0. Answer(c)(i) [3] (ii) Solve the equation x2 – 3x – 2 = 0, giving your answers correct to 2 decimal places. Show all your working. Answer(c)(ii) x = or x = [4] (iii) Calculate the area of one of the shapes. Answer(c)(iii) cm2 [1]
Question paper, page 16
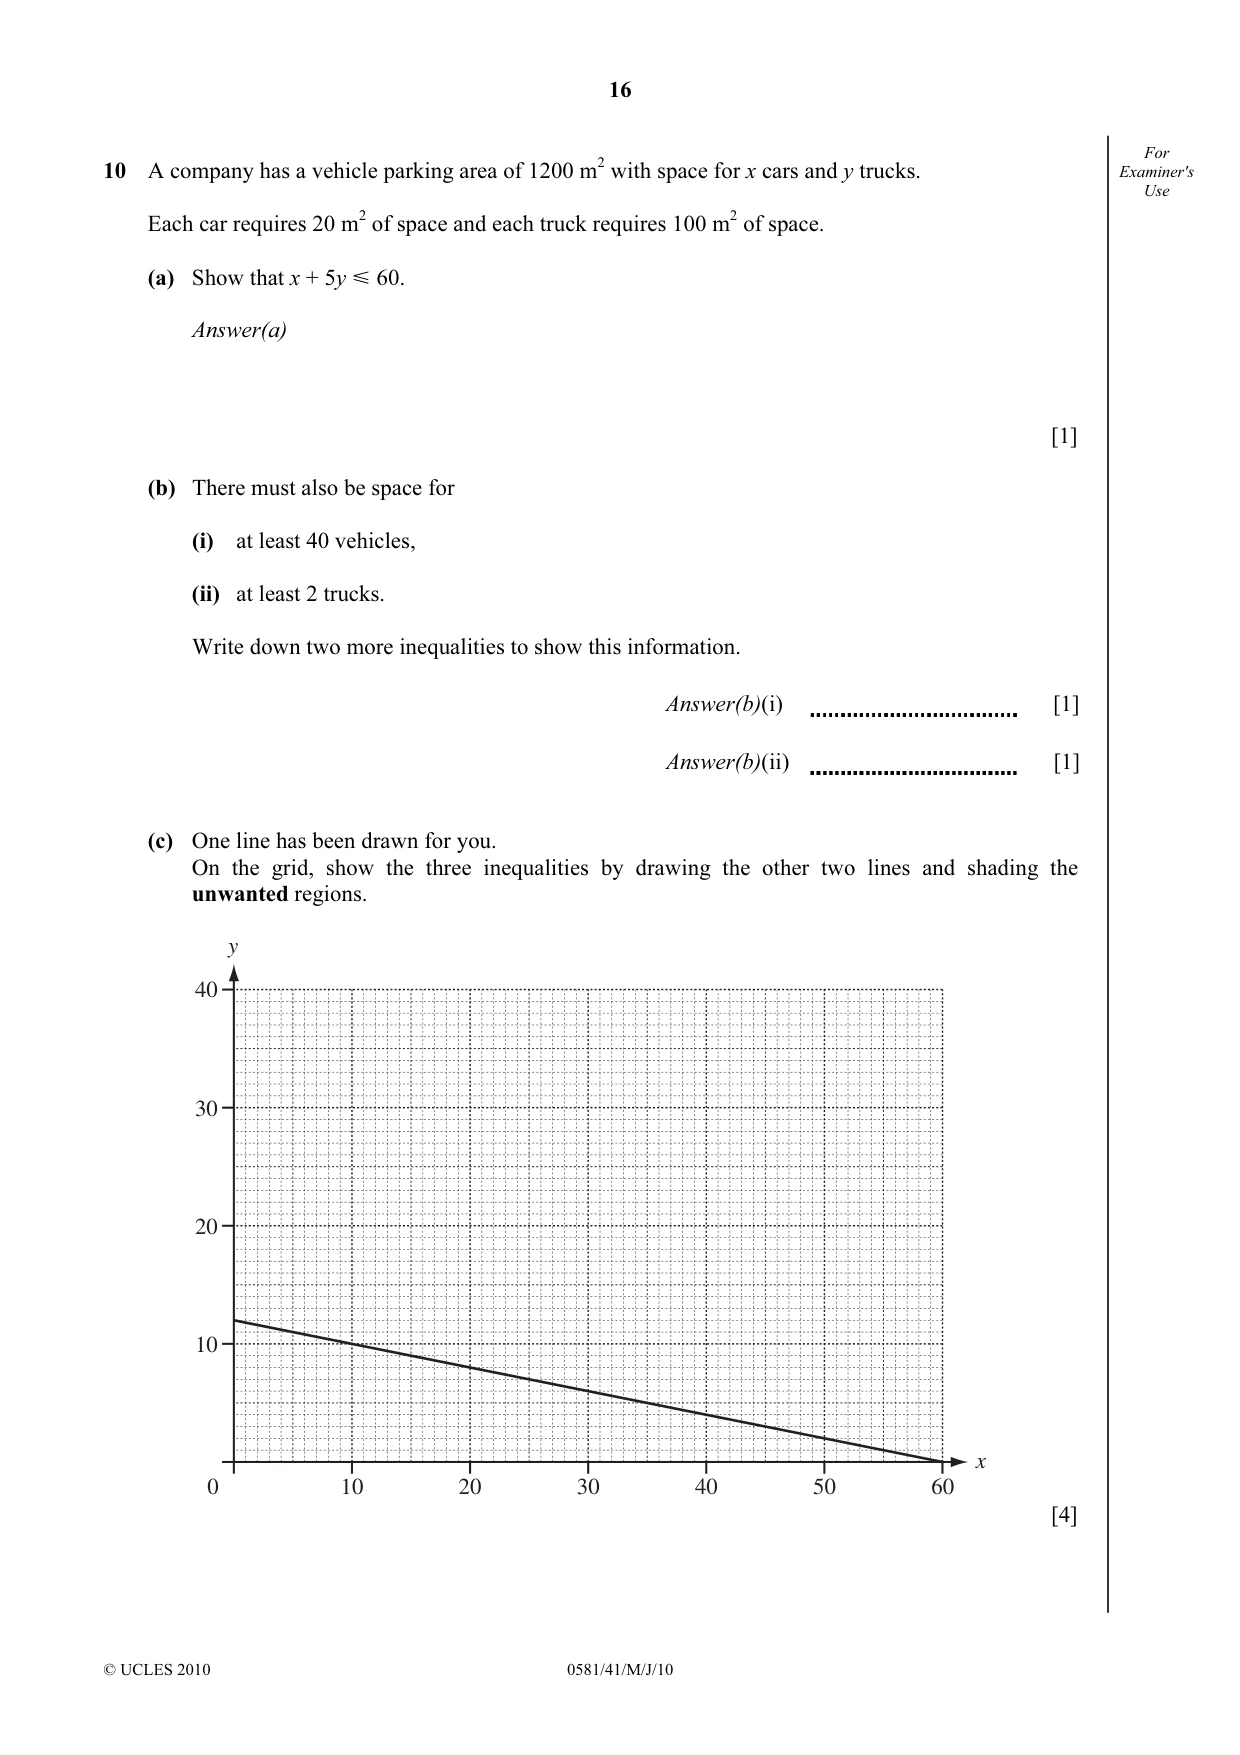
16 © UCLES 2010 0581/41/M/J/10 For Examiner's Use 10 A company has a vehicle parking area of 1200 m2 with space for x cars and y trucks. Each car requires 20 m2 of space and each truck requires 100 m2 of space. (a) Show that x + 5y Y 60. Answer(a) [1] (b) There must also be space for (i) at least 40 vehicles, (ii) at least 2 trucks. Write down two more inequalities to show this information. Answer(b)(i) [1] Answer(b)(ii) [1] (c) One line has been drawn for you. On the grid, show the three inequalities by drawing the other two lines and shading the unwanted regions. 40 30 20 10 0 10 20 30 40 50 60 y x [4]
Question paper, page 17
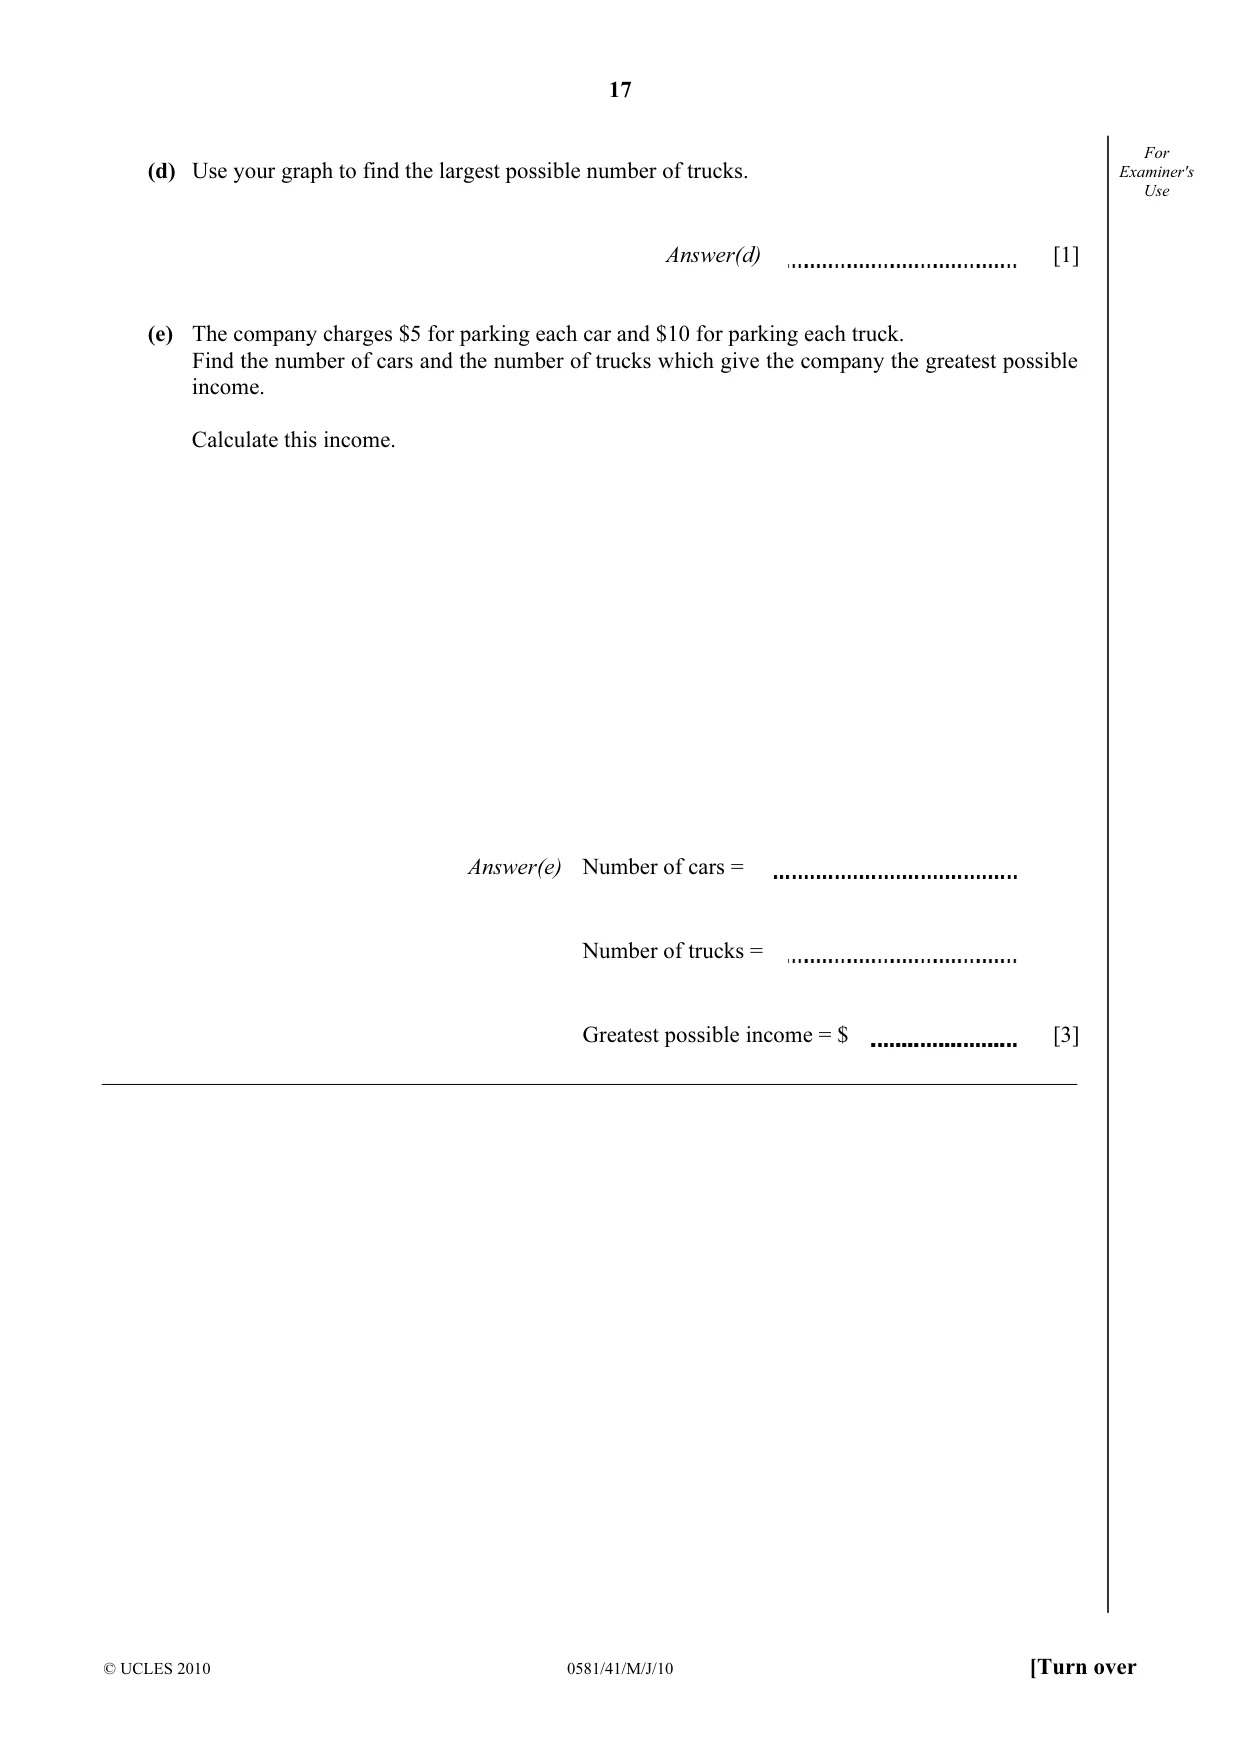
17 © UCLES 2010 0581/41/M/J/10 [Turn over For Examiner's Use (d) Use your graph to find the largest possible number of trucks. Answer(d) [1] (e) The company charges $5 for parking each car and $10 for parking each truck. Find the number of cars and the number of trucks which give the company the greatest possible income. Calculate this income. Answer(e) Number of cars = Number of trucks = Greatest possible income = $ [3]
Question paper, page 18
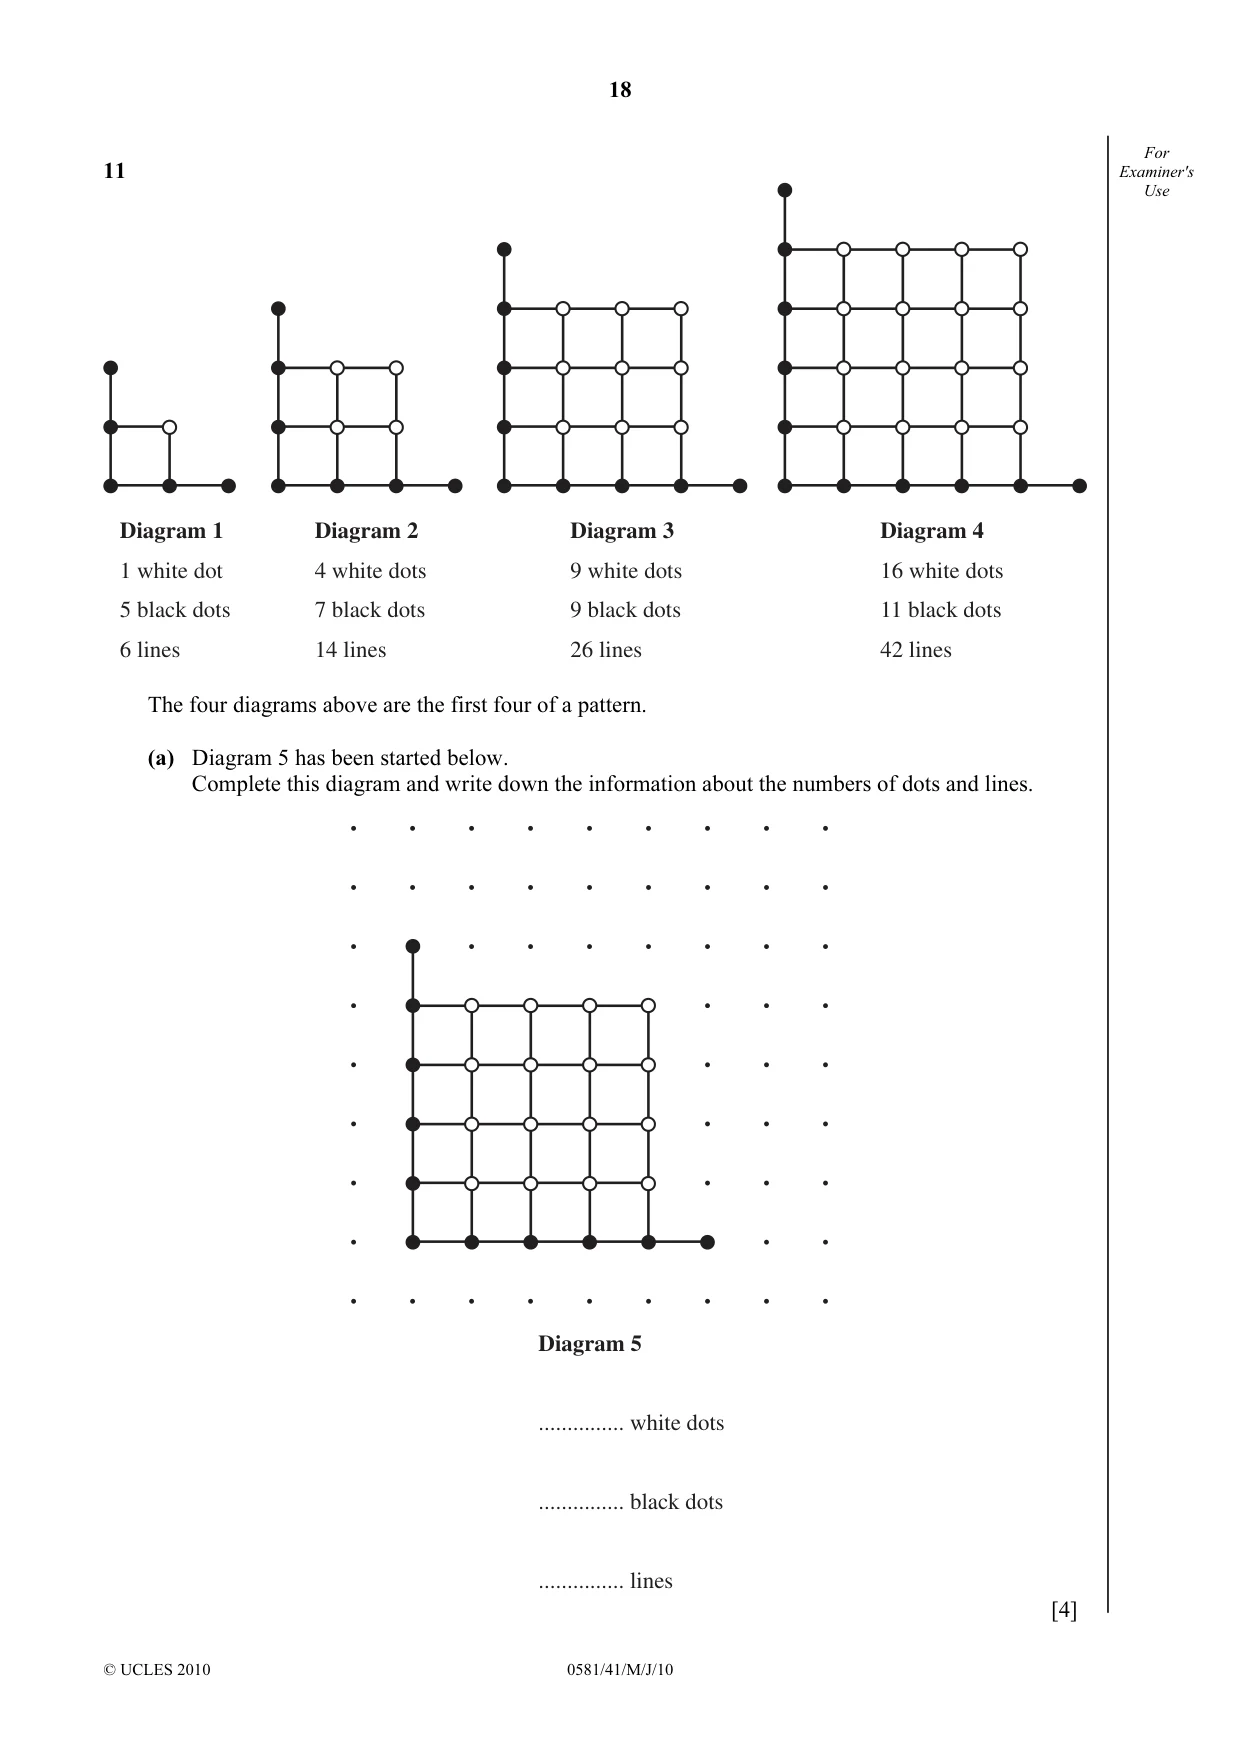
18 © UCLES 2010 0581/41/M/J/10 For Examiner's Use 11 Diagram 4 16 white dots 11 black dots 42 lines Diagram 3 9 white dots 9 black dots 26 lines Diagram 2 4 white dots 7 black dots 14 lines Diagram 1 1 white dot 5 black dots 6 lines The four diagrams above are the first four of a pattern. (a) Diagram 5 has been started below. Complete this diagram and write down the information about the numbers of dots and lines. Diagram 5 … white dots … black dots … lines [4]
Question paper, page 19
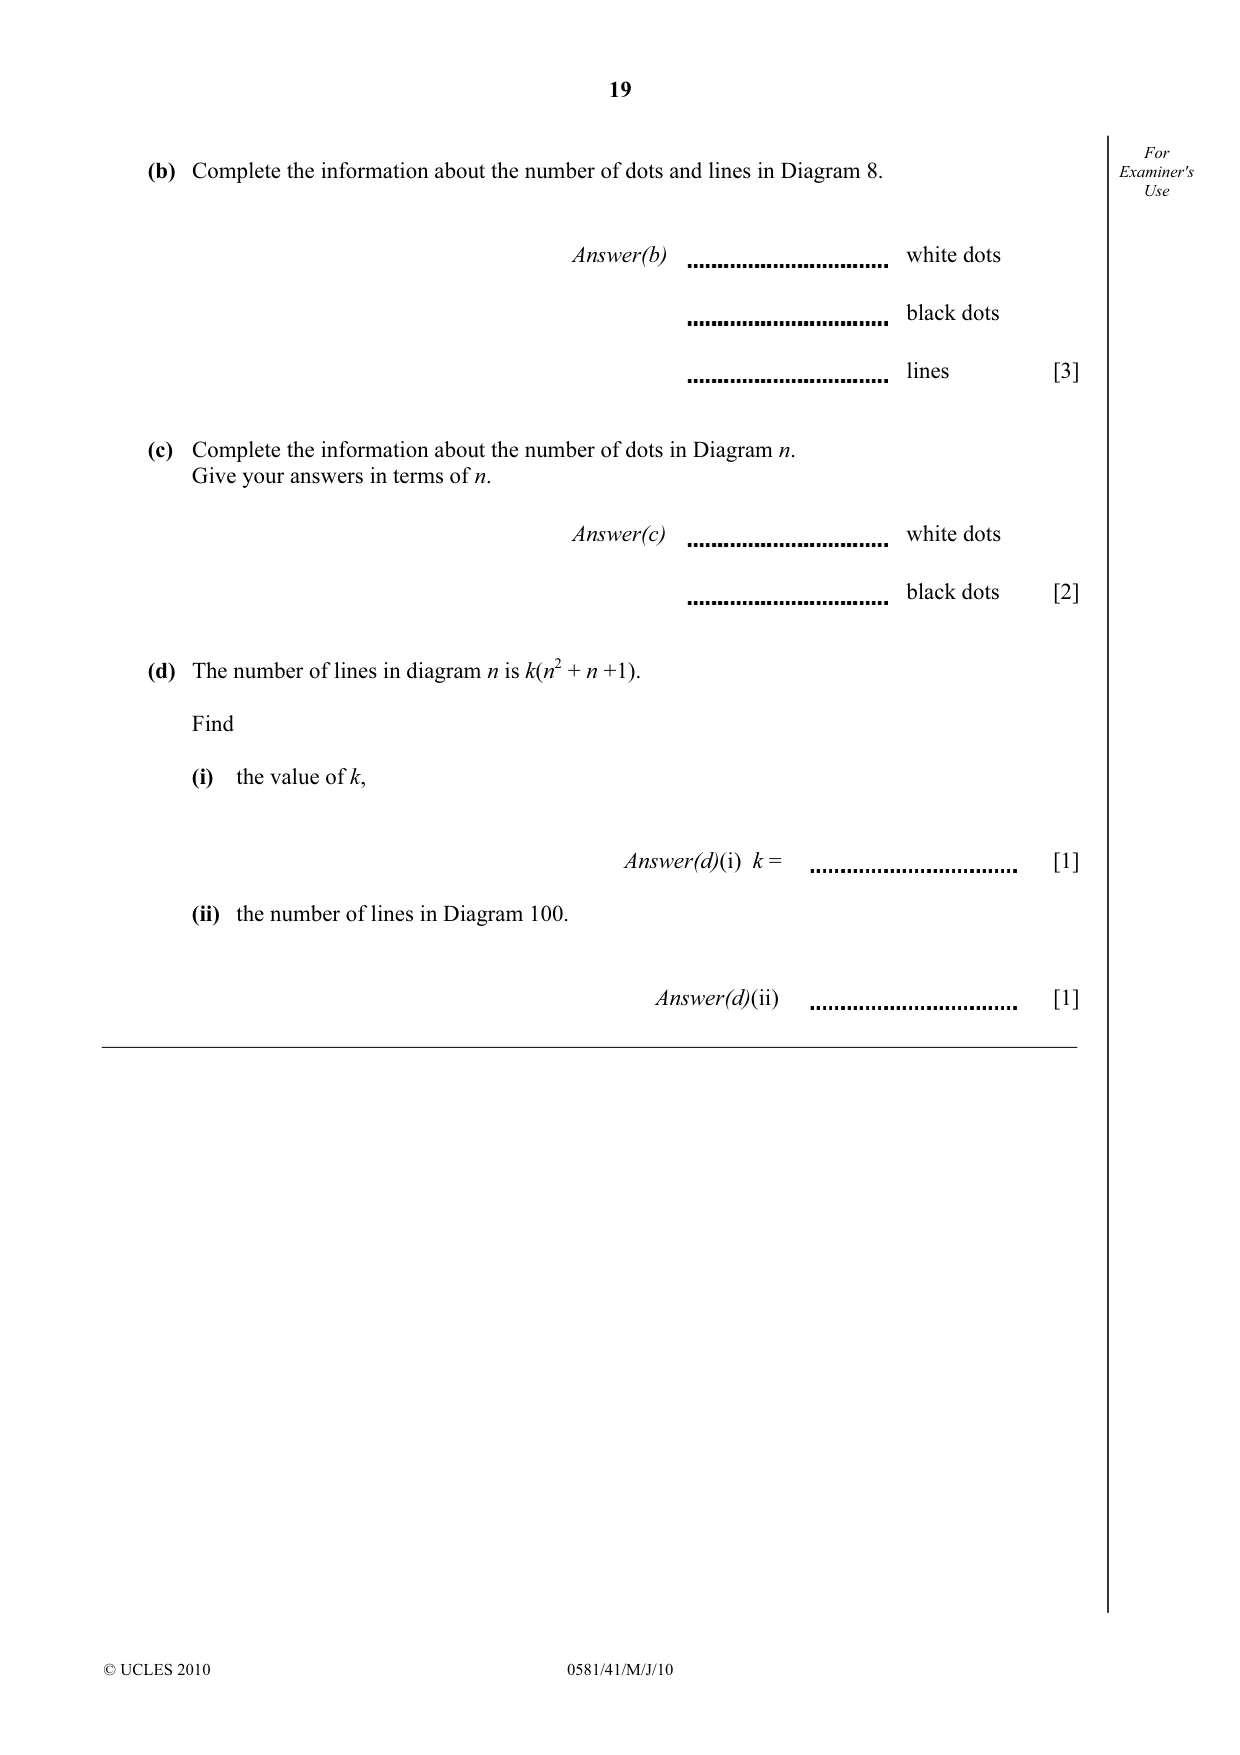
19 © UCLES 2010 0581/41/M/J/10 For Examiner's Use (b) Complete the information about the number of dots and lines in Diagram 8. Answer(b) white dots black dots lines [3] (c) Complete the information about the number of dots in Diagram n. Give your answers in terms of n. Answer(c) white dots black dots [2] (d) The number of lines in diagram n is k(n2 + n +1). Find (i) the value of k, Answer(d)(i) k = [1] (ii) the number of lines in Diagram 100. Answer(d)(ii) [1]
Question paper, page 20
20 Permission to reproduce items where third-party owned material protected by copyright is included has been sought and cleared where possible. Every reasonable effort has been made by the publisher (UCLES) to trace copyright holders, but if any items requiring clearance have unwittingly been included, the publisher will be pleased to make amends at the earliest possible opportunity. University of Cambridge International Examinations is part of the Cambridge Assessment Group. Cambridge Assessment is the brand name of University of Cambridge Local Examinations Syndicate (UCLES), which is itself a department of the University of Cambridge. 0581/41/M/J/10 BLANK PAGE
Mark scheme, page 1
UNIVERSITY OF CAMBRIDGE INTERNATIONAL EXAMINATIONS International General Certificate of Secondary Education MARK SCHEME for the May/June 2010 question paper for the guidance of teachers 0581 MATHEMATICS 0581/41 Paper 41 (Extended), maximum raw mark 130 This mark scheme is published as an aid to teachers and candidates, to indicate the requirements of the examination. It shows the basis on which Examiners were instructed to award marks. It does not indicate the details of the discussions that took place at an Examiners’ meeting before marking began, which would have considered the acceptability of alternative answers. Mark schemes must be read in conjunction with the question papers and the report on the examination. • CIE will not enter into discussions or correspondence in connection with these mark schemes. CIE is publishing the mark schemes for the May/June 2010 question papers for most IGCSE, GCE Advanced Level and Advanced Subsidiary Level syllabuses and some Ordinary Level syllabuses. www.XtremePapers.com
Mark scheme, page 2
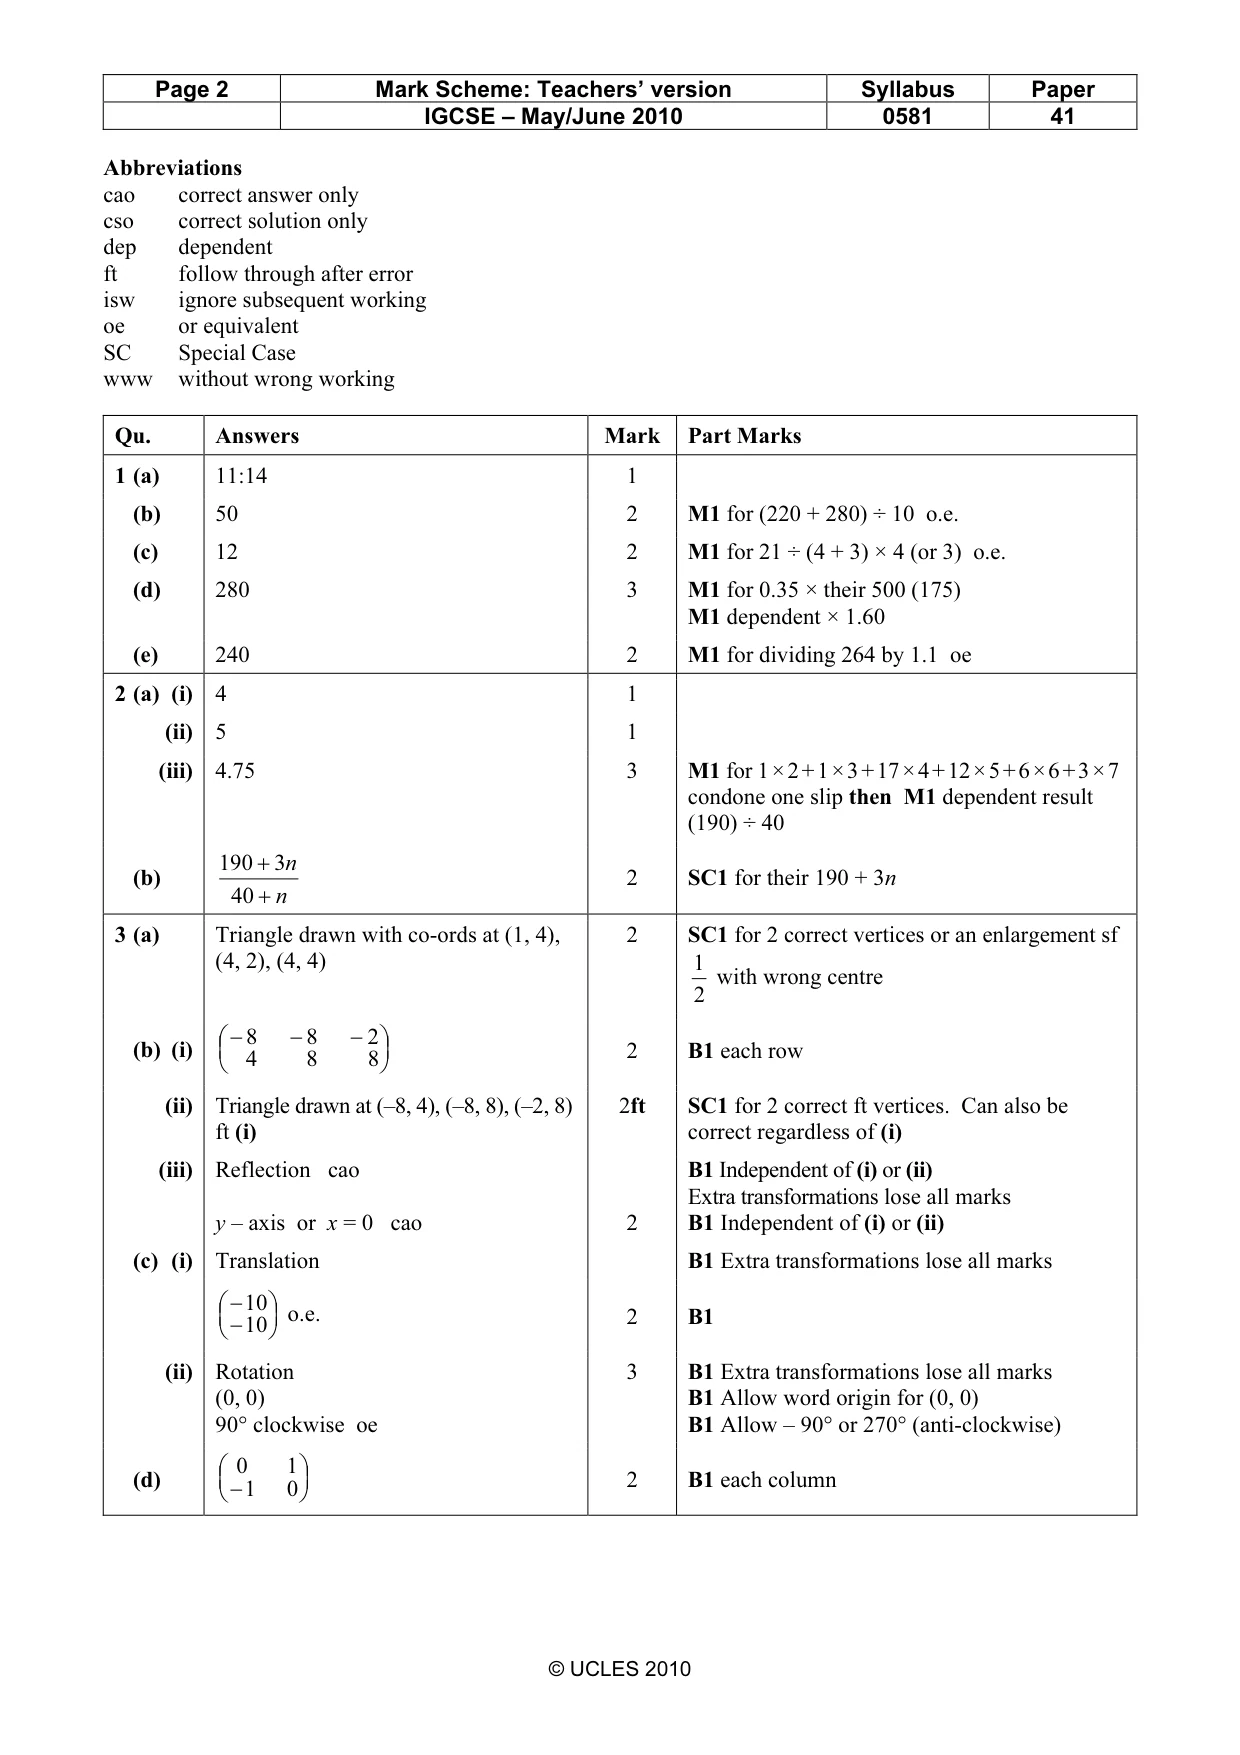
Page 2 Mark Scheme: Teachers’ version Syllabus Paper IGCSE – May/June 2010 0581 41 © UCLES 2010 Abbreviations cao correct answer only cso correct solution only dep dependent ft follow through after error isw ignore subsequent working oe or equivalent SC Special Case www without wrong working Qu. Answers Mark Part Marks 1 (a) 11:14 1 (b) 50 2 M1 for (220 + 280) ÷ 10 o.e. (c) 12 2 M1 for 21 ÷ (4 + 3) × 4 (or 3) o.e. (d) 280 3 M1 for 0.35 × their 500 (175) M1 dependent × 1.60 (e) 240 2 M1 for dividing 264 by 1.1 oe 2 (a) (i) 4 1 (ii) 5 1 (iii) 4.75 3 M1 for 1 × 2 + 1 × 3 + 17 × 4 + 12 × 5 + 6 × 6 + 3 × 7 condone one slip then M1 dependent result (190) ÷ 40 (b) n n + + 40 3 190 2 SC1 for their 190 + 3n 3 (a) Triangle drawn with co-ords at (1, 4), (4, 2), (4, 4) 2 SC1 for 2 correct vertices or an enlargement sf 2 1 with wrong centre (b) (i) − − − 8 8 4 2 8 8 2 B1 each row (ii) Triangle drawn at (–8, 4), (–8, 8), (–2, 8) ft (i) 2ft SC1 for 2 correct ft vertices. Can also be correct regardless of (i) (iii) Reflection cao y – axis or x = 0 cao 2 B1 Independent of (i) or (ii) Extra transformations lose all marks B1 Independent of (i) or (ii) (c) (i) Translation B1 Extra transformations lose all marks − − 10 10 o.e. 2 B1 (ii) Rotation (0, 0) 90° clockwise oe 3 B1 Extra transformations lose all marks B1 Allow word origin for (0, 0) B1 Allow – 90° or 270° (anti-clockwise) (d) − 0 1 1 0 2 B1 each column
Mark scheme, page 3
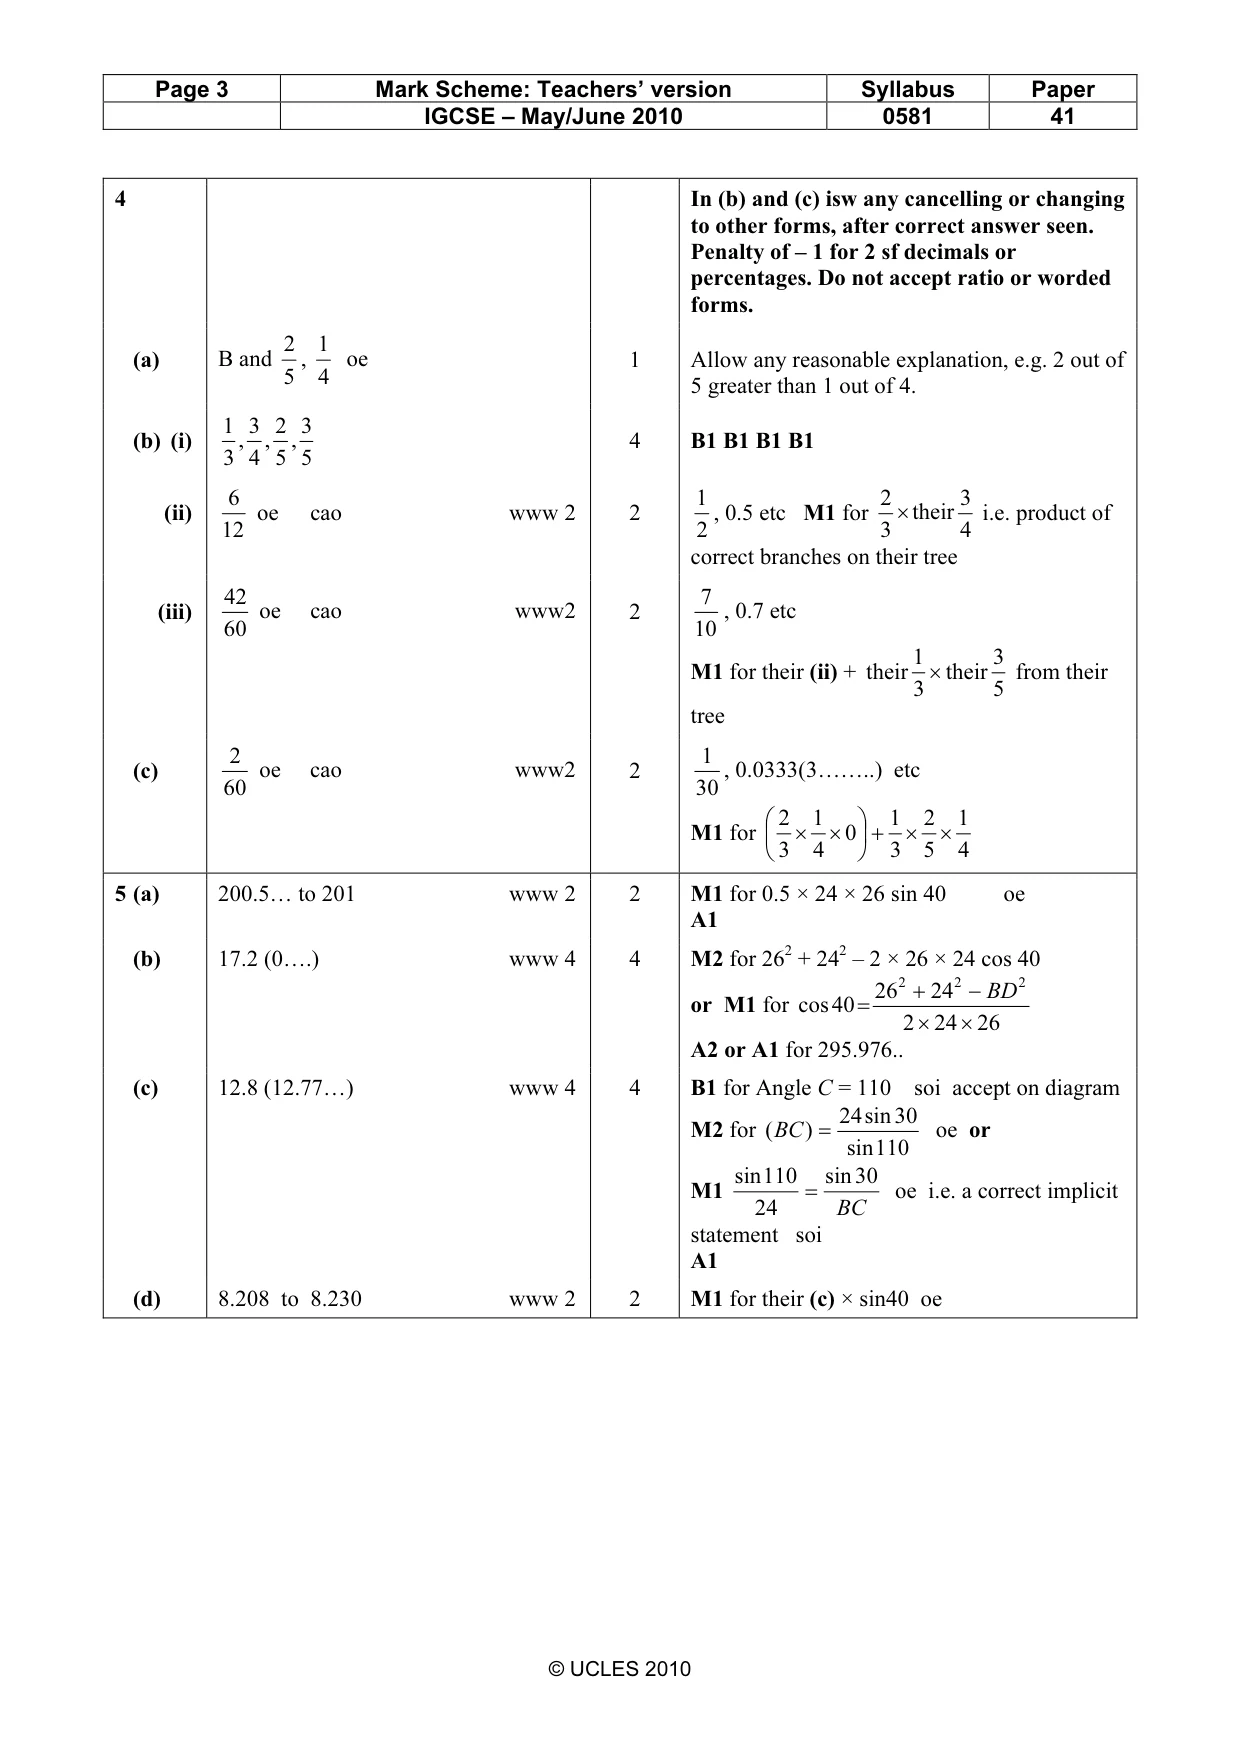
Page 3 Mark Scheme: Teachers’ version Syllabus Paper IGCSE – May/June 2010 0581 41 © UCLES 2010 4 In (b) and (c) isw any cancelling or changing to other forms, after correct answer seen. Penalty of – 1 for 2 sf decimals or percentages. Do not accept ratio or worded forms. (a) B and 5 2 , 4 1 oe 1 Allow any reasonable explanation, e.g. 2 out of 5 greater than 1 out of 4. (b) (i) 5 3 , 5 2 , 4 3 , 3 1 4 B1 B1 B1 B1 (ii) 12 6 oe cao www 2 2 2 1 , 0.5 etc M1 for 4 3 their 3 2 × i.e. product of correct branches on their tree (iii) 60 42 oe cao www2 2 10 7 , 0.7 etc M1 for their (ii) + 5 3 their 3 1 their × from their tree (c) 60 2 oe cao www2 2 30 1 , 0.0333(3……..) etc M1 for 4 1 5 2 3 1 0 4 1 3 2 × × + × × 5 (a) 200.5… to 201 www 2 2 M1 for 0.5 × 24 × 26 sin 40 oe A1 (b) 17.2 (0….) www 4 4 M2 for 262 + 242 – 2 × 26 × 24 cos 40 or M1 for 26 24 2 24 26 40 cos 2 2 2 × × − + = BD A2 or A1 for 295.976.. (c) 12.8 (12.77…) www 4 4 B1 for Angle C = 110 soi accept on diagram M2 for 110 sin 30 sin 24 ) ( = BC oe or M1 BC 30 sin 24 110 sin = oe i.e. a correct implicit statement soi A1 (d) 8.208 to 8.230 www 2 2 M1 for their (c) × sin40 oe
Mark scheme, page 4
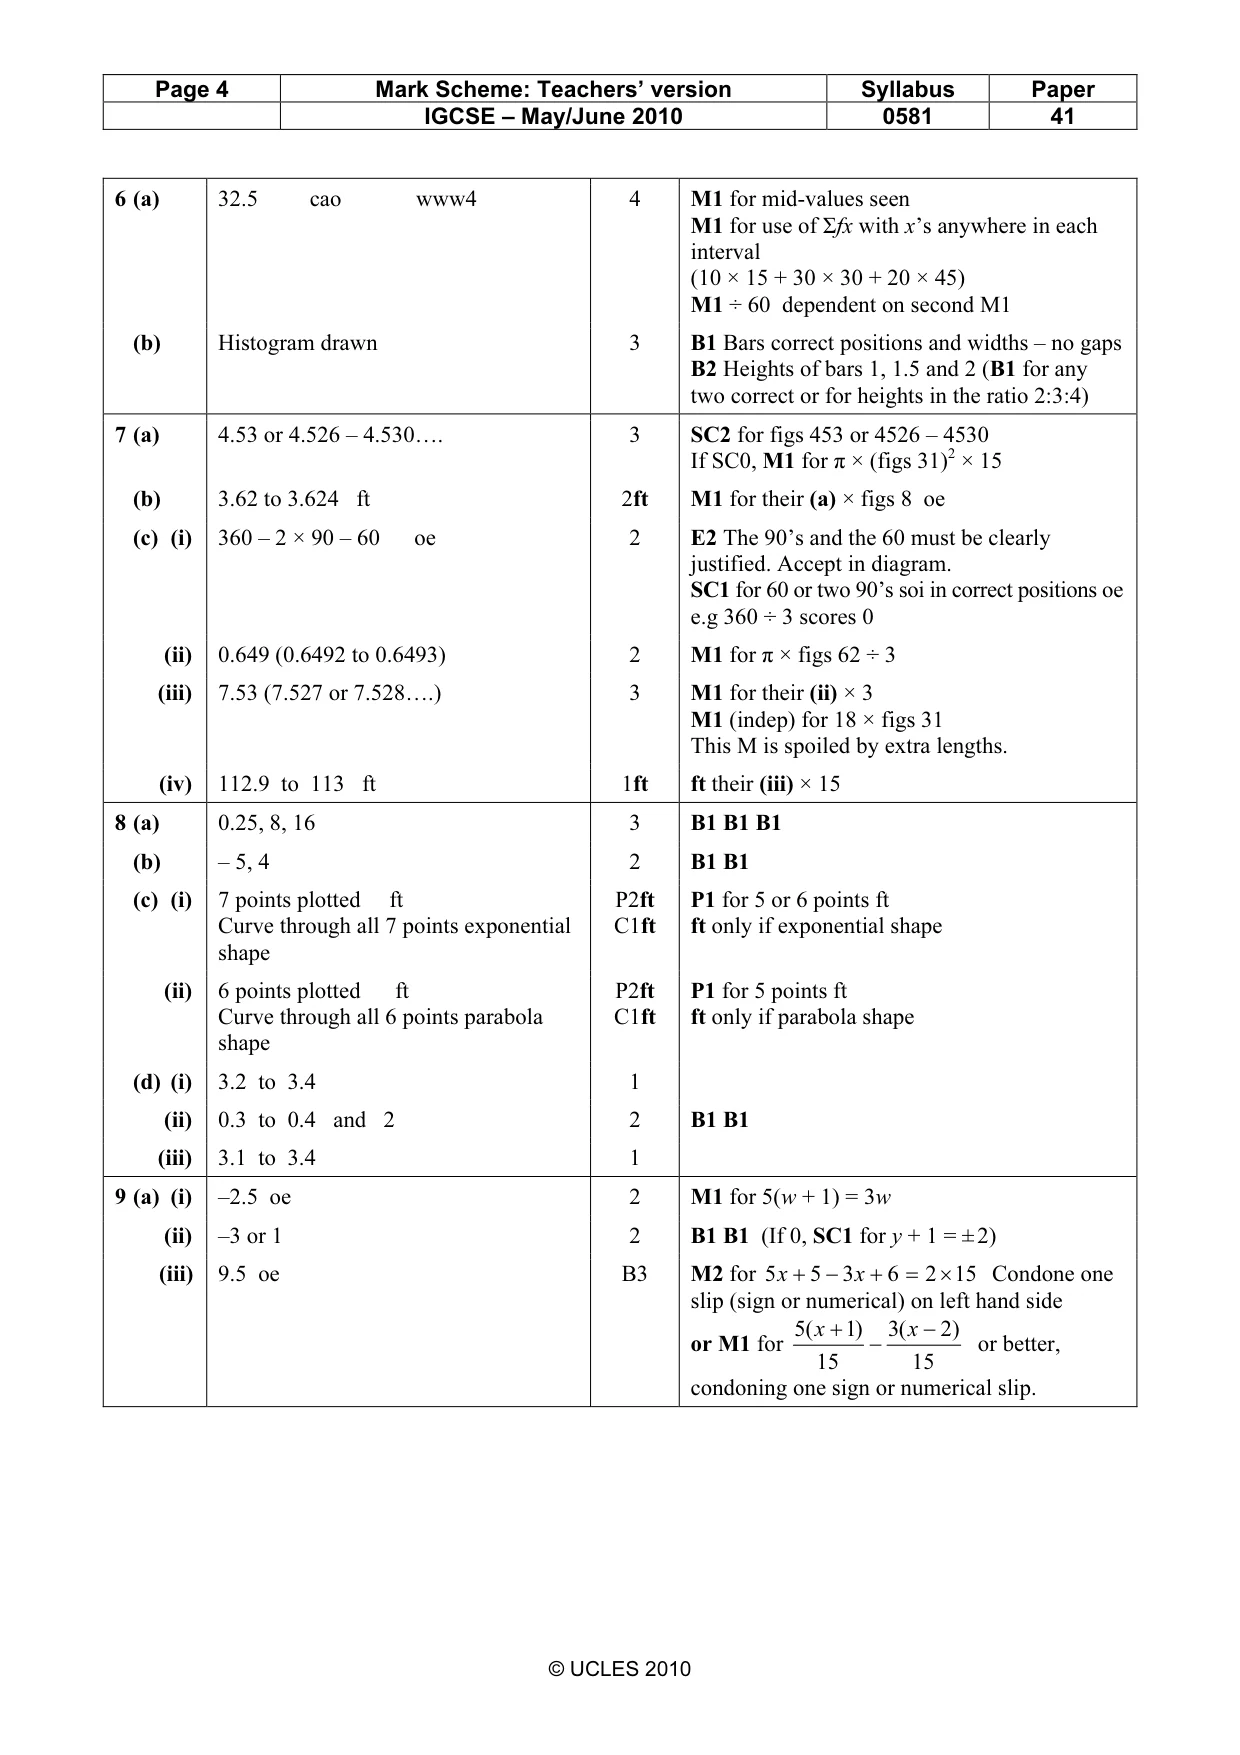
Page 4 Mark Scheme: Teachers’ version Syllabus Paper IGCSE – May/June 2010 0581 41 © UCLES 2010 6 (a) 32.5 cao www4 4 M1 for mid-values seen M1 for use of Σfx with x’s anywhere in each interval (10 × 15 + 30 × 30 + 20 × 45) M1 ÷ 60 dependent on second M1 (b) Histogram drawn 3 B1 Bars correct positions and widths – no gaps B2 Heights of bars 1, 1.5 and 2 (B1 for any two correct or for heights in the ratio 2:3:4) 7 (a) 4.53 or 4.526 – 4.530…. 3 SC2 for figs 453 or 4526 – 4530 If SC0, M1 for π × (figs 31)2 × 15 (b) 3.62 to 3.624 ft 2ft M1 for their (a) × figs 8 oe (c) (i) 360 – 2 × 90 – 60 oe 2 E2 The 90’s and the 60 must be clearly justified. Accept in diagram. SC1 for 60 or two 90’s soi in correct positions oe e.g 360 ÷ 3 scores 0 (ii) 0.649 (0.6492 to 0.6493) 2 M1 for π × figs 62 ÷ 3 (iii) 7.53 (7.527 or 7.528….) 3 M1 for their (ii) × 3 M1 (indep) for 18 × figs 31 This M is spoiled by extra lengths. (iv) 112.9 to 113 ft 1ft ft their (iii) × 15 8 (a) 0.25, 8, 16 3 B1 B1 B1 (b) – 5, 4 2 B1 B1 (c) (i) 7 points plotted ft Curve through all 7 points exponential shape P2ft C1ft P1 for 5 or 6 points ft ft only if exponential shape (ii) 6 points plotted ft Curve through all 6 points parabola shape P2ft C1ft P1 for 5 points ft ft only if parabola shape (d) (i) 3.2 to 3.4 1 (ii) 0.3 to 0.4 and 2 2 B1 B1 (iii) 3.1 to 3.4 1 9 (a) (i) –2.5 oe 2 M1 for 5(w + 1) = 3w (ii) –3 or 1 2 B1 B1 (If 0, SC1 for y + 1 = ± 2) (iii) 9.5 oe B3 M2 for 15 2 6 3 5 5 × = + − + x x Condone one slip (sign or numerical) on left hand side or M1 for 15 ) 2 ( 3 15 )1 ( 5 − − + x x or better, condoning one sign or numerical slip.
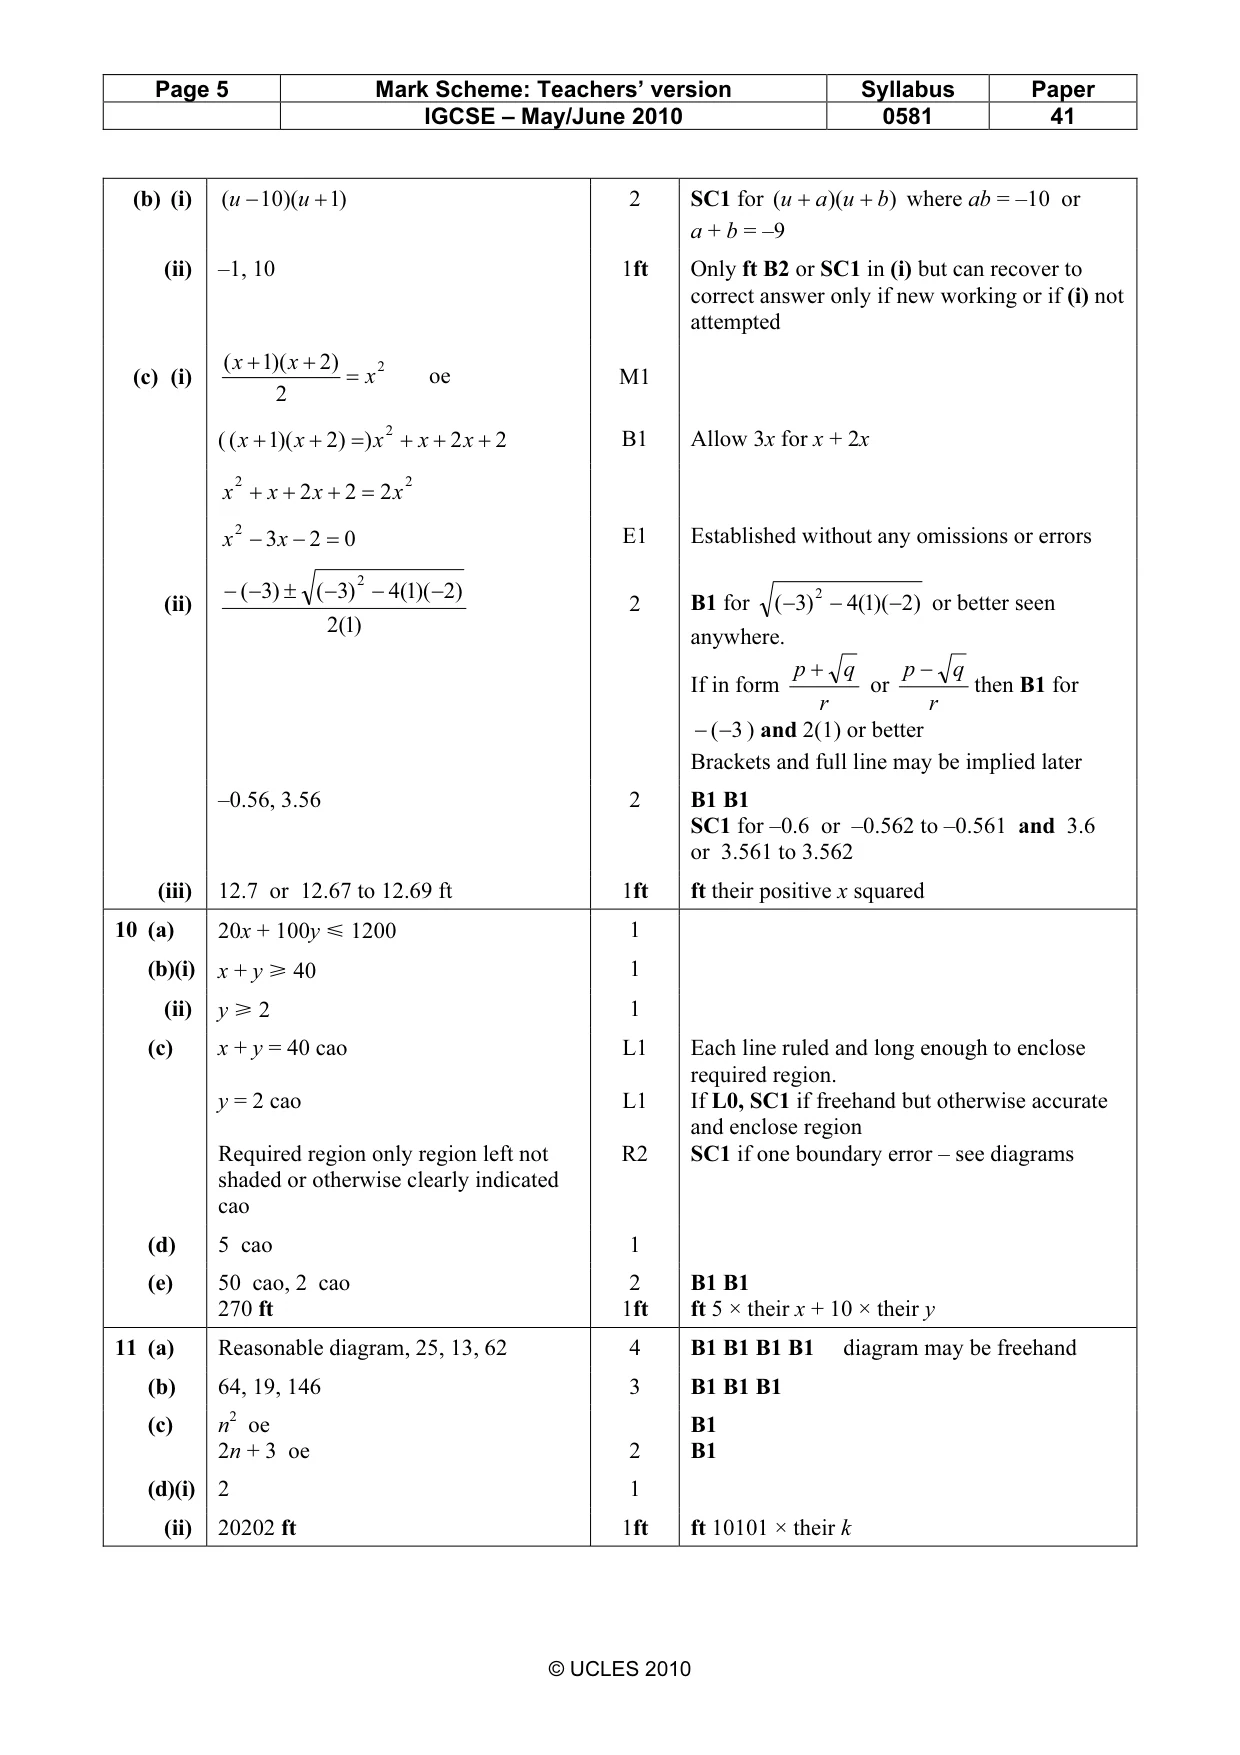
Mark scheme, page 5
Page 5 Mark Scheme: Teachers’ version Syllabus Paper IGCSE – May/June 2010 0581 41 © UCLES 2010 (b) (i) )1 )( 10 ( + − u u 2 SC1 for ) )( ( b u a u + + where ab = –10 or a + b = –9 (ii) –1, 10 1ft Only ft B2 or SC1 in (i) but can recover to correct answer only if new working or if (i) not attempted (c) (i) 2 2 ) 2 )( 1 ( x x x = + + oe M1 ( 2 2 ) ) 2 )( 1 ( 2 + + + = + + x x x x x B1 Allow 3x for x + 2x 2 2 2 2 2 x x x x = + + + 0 2 3 2 = − −x x E1 Established without any omissions or errors (ii) )1( 2 ) 2 )( 1( 4 )3 ( ) 3 ( 2 − − − ± − − 2 B1 for ) 2 )( 1( 4 ) 3 ( 2 − − − or better seen anywhere. If in form r q p + or r q p − then B1 for 3 (− − ) and 2(1) or better Brackets and full line may be implied later –0.56, 3.56 2 B1 B1 SC1 for –0.6 or –0.562 to –0.561 and 3.6 or 3.561 to 3.562 (iii) 12.7 or 12.67 to 12.69 ft 1ft ft their positive x squared 10 (a) 20x + 100y Y 1200 1 (b)(i) x + y [ 40 1 (ii) y [ 2 1 (c) x + y = 40 cao y = 2 cao Required region only region left not shaded or otherwise clearly indicated cao L1 L1 R2 Each line ruled and long enough to enclose required region. If L0, SC1 if freehand but otherwise accurate and enclose region SC1 if one boundary error – see diagrams (d) 5 cao 1 (e) 50 cao, 2 cao 270 ft 2 1ft B1 B1 ft 5 × their x + 10 × their y 11 (a) Reasonable diagram, 25, 13, 62 4 B1 B1 B1 B1 diagram may be freehand (b) 64, 19, 146 3 B1 B1 B1 (c) n2 oe 2n + 3 oe 2 B1 B1 (d)(i) 2 1 (ii) 20202 ft 1ft ft 10101 × their k