Cambridge IGCSE Mathematics 0580 — 2012 Oct/Nov Paper 3 · Variant 2
0580/32/O/N/12 · 9 questions · 104 marks · ≈117 min
The question paper and its mark scheme, free to read here and free to download. This is Cambridge’s own paper, exactly as it was sat.
Question paper16 pages
Mark scheme6 pages
Answers below. Sit the paper first if you are practising.
Questions as text
Q1 · An area of 94 500 m2 in a city is developed
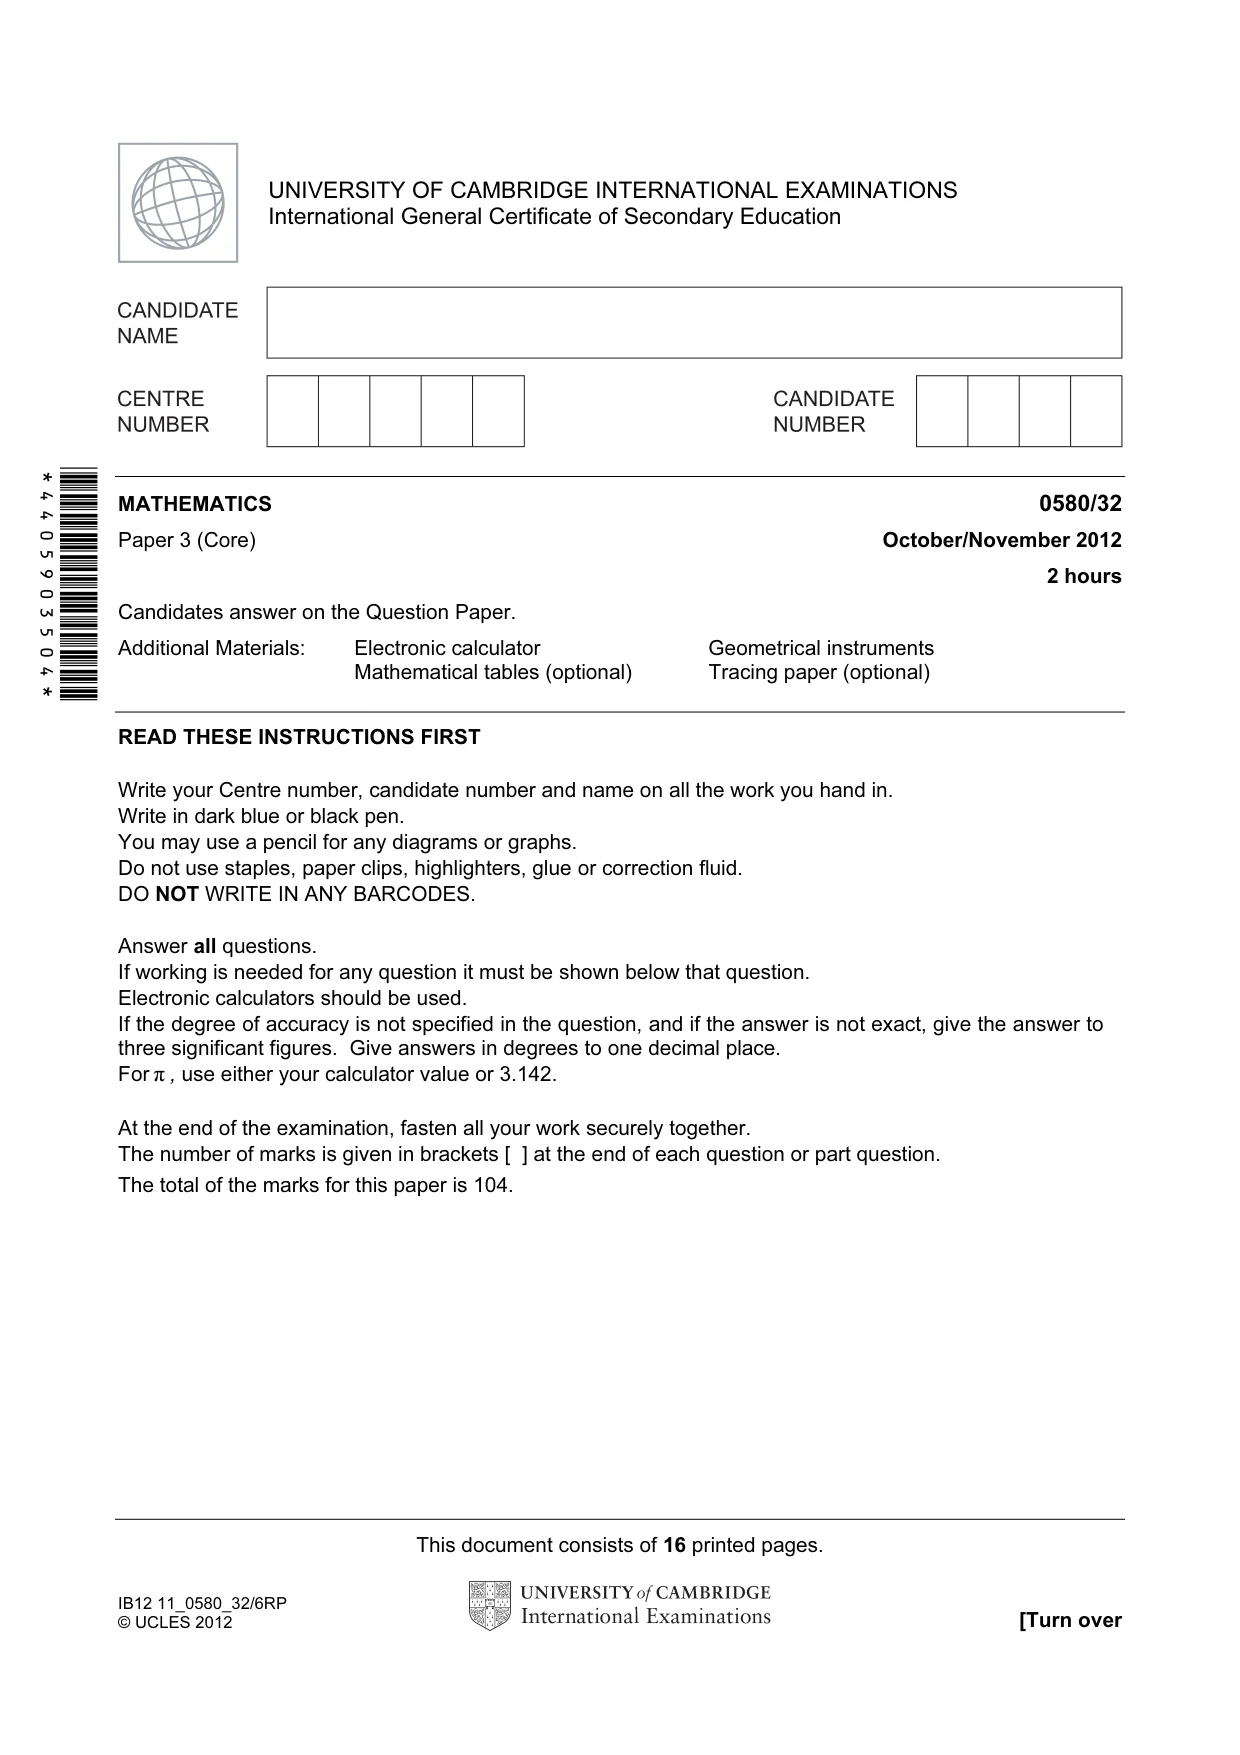
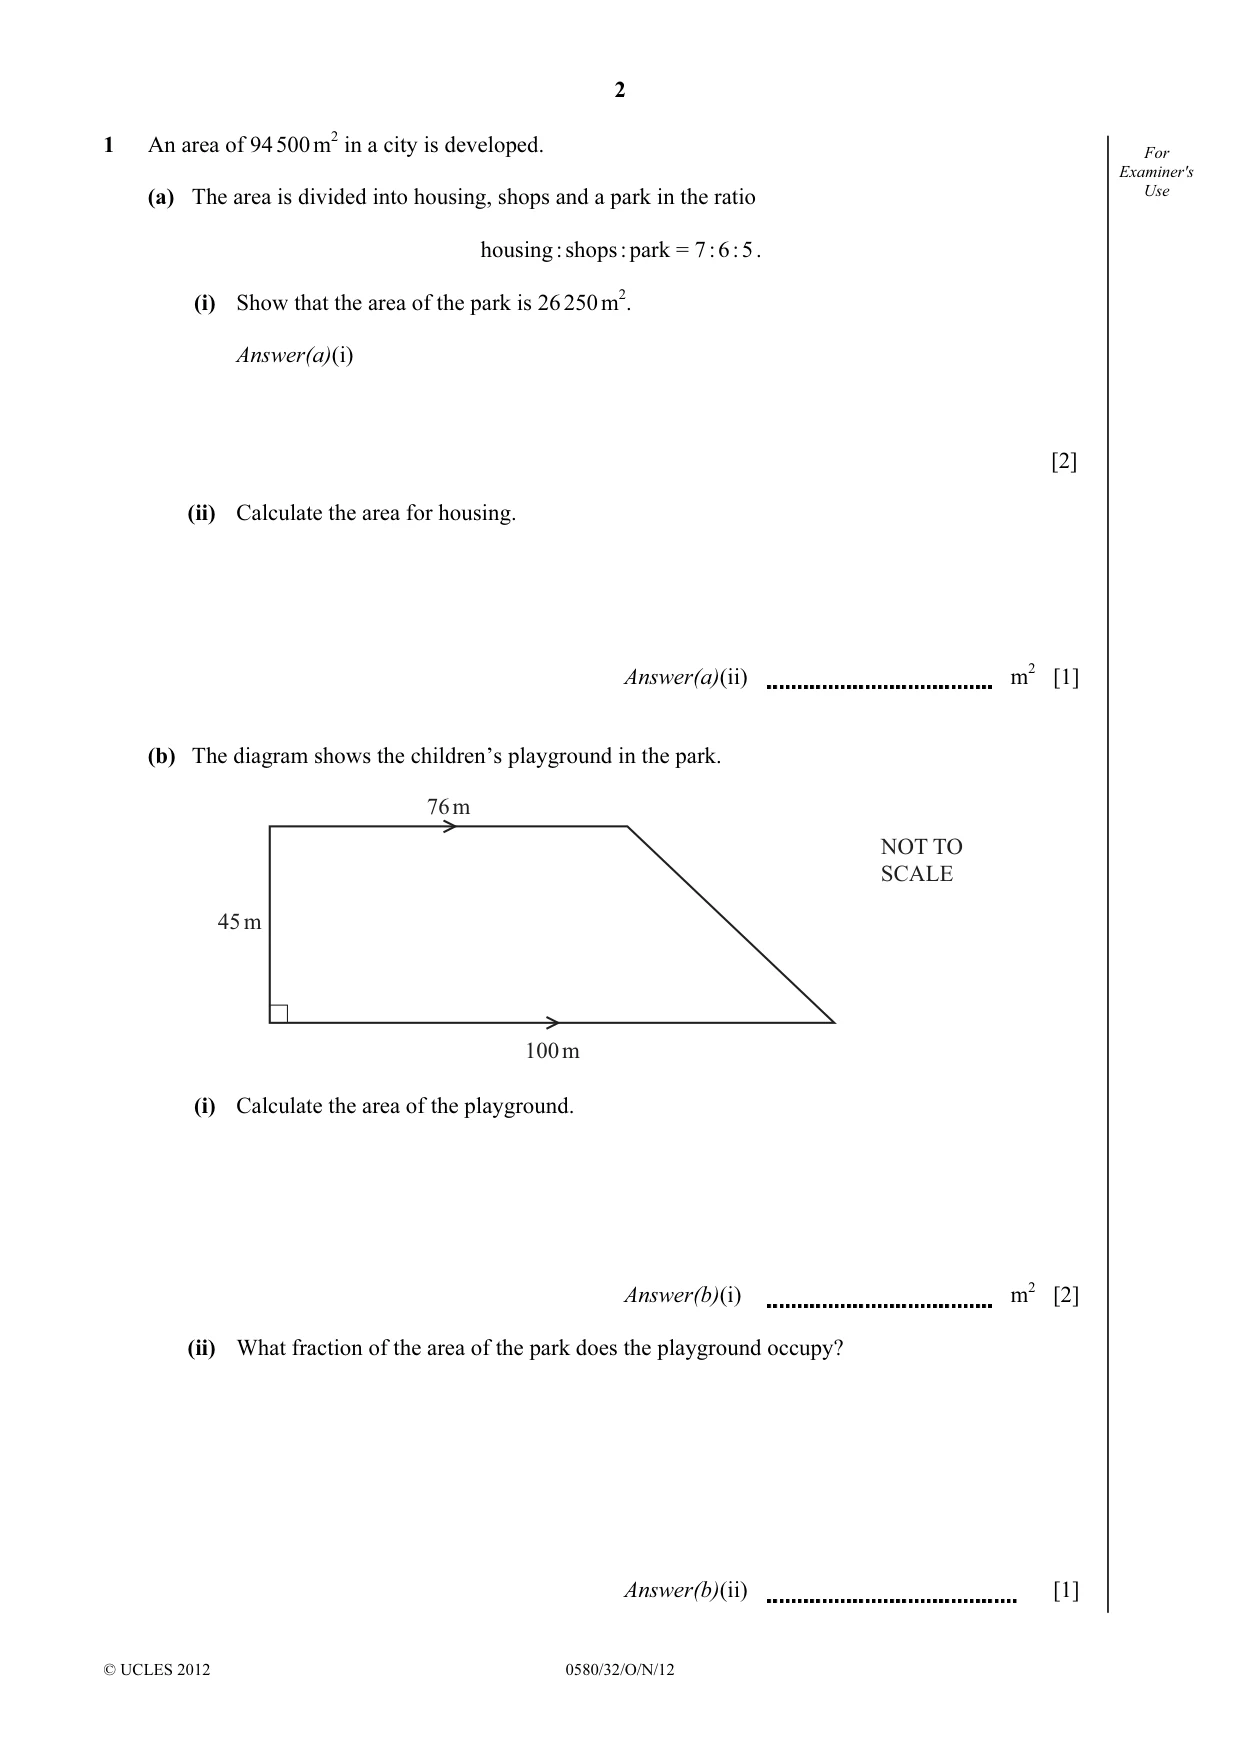
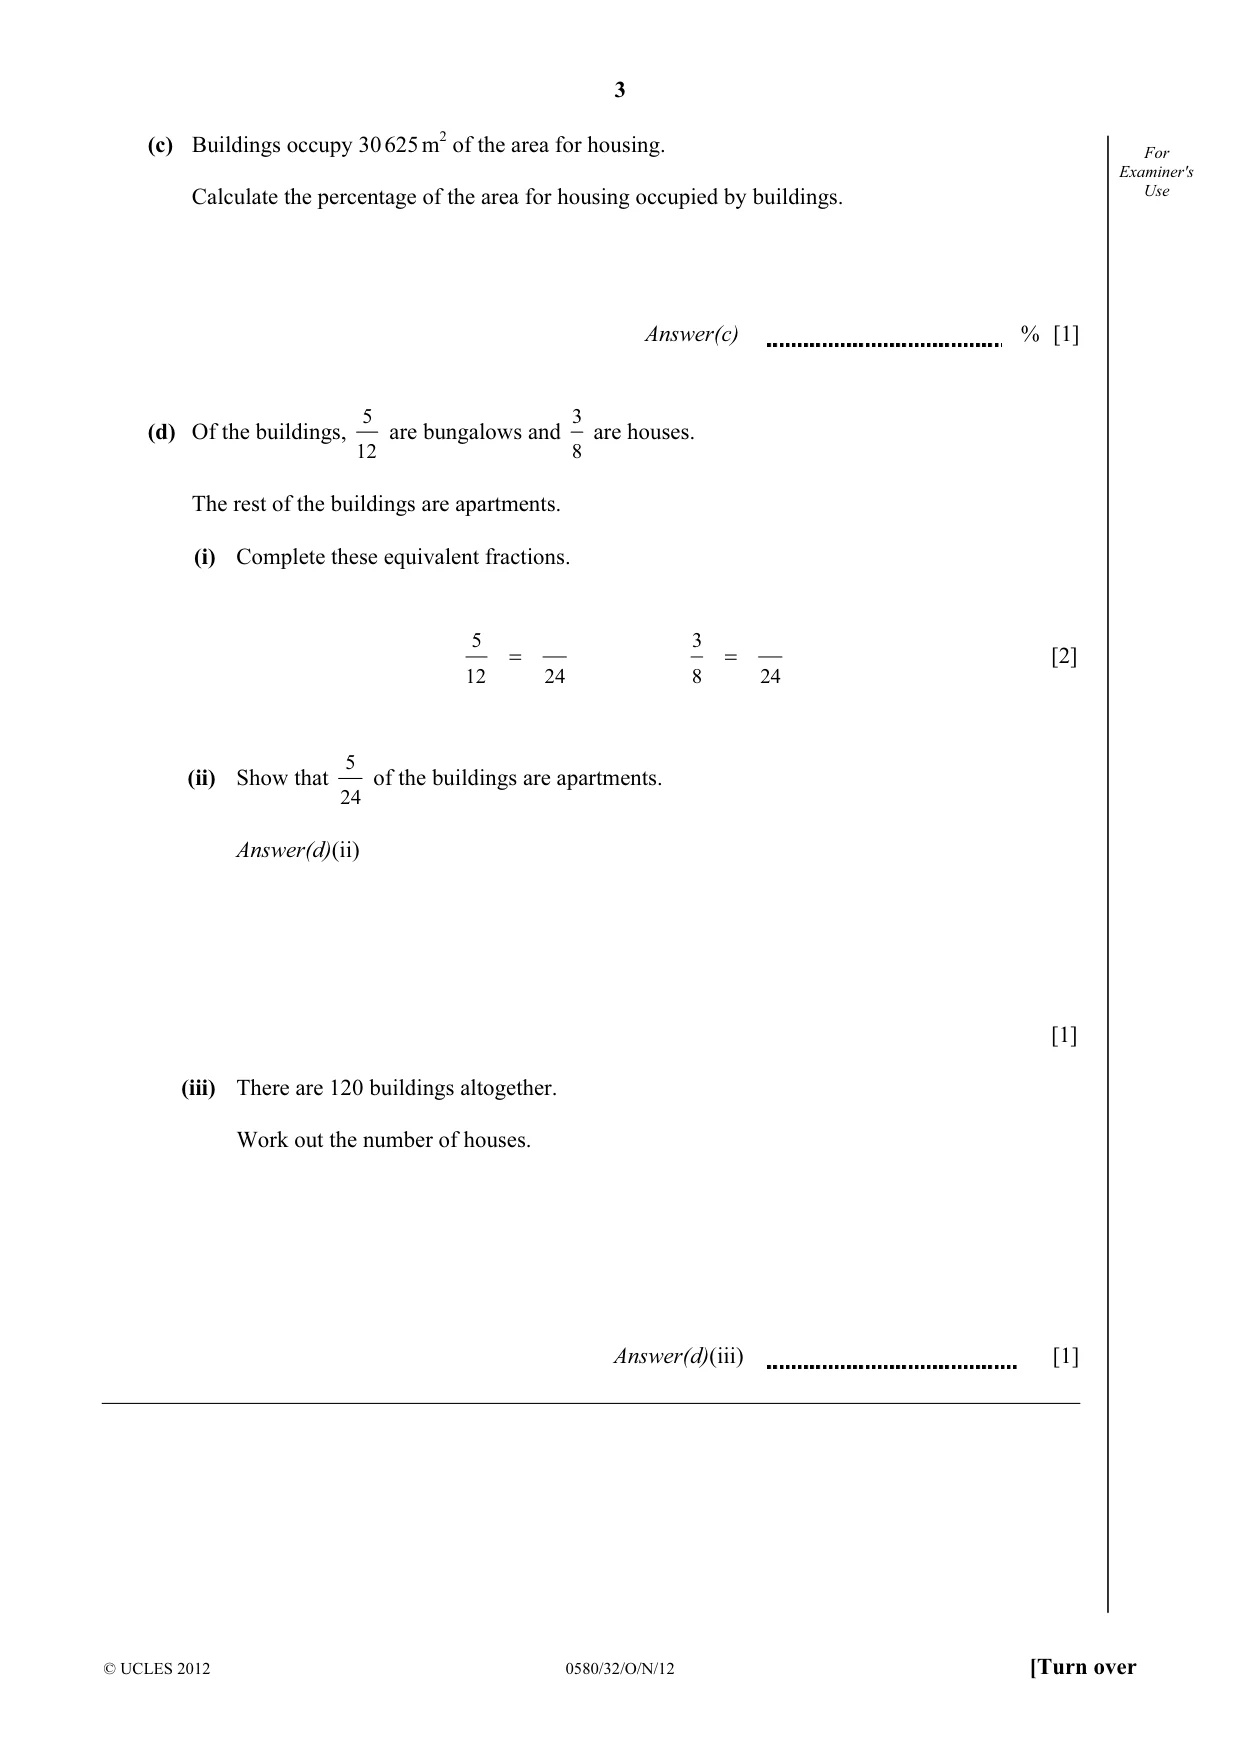
1 An area of 94 500 m2 in a city is developed. For Examiner's Use (a) The area is divided into housing, shops and a park in the ratio housing : shops : park = 7 : 6 : 5 . (i) Show that the area of the park is 26 250 m2. Answer(a)(i) [2] (ii) Calculate the area for housing. Answer(a)(ii) m2 [1] (b) The diagram shows the children’s playground in the park. 76 m NOT TO SCALE 45 m 100 m (i) Calculate the area of the playground. Answer(b)(i) m2 [2] (ii) What fraction of the area of the park does the playground occupy? Answer(b)(ii) [1] (c) Buildings occupy 30 625 m2 of the area for housing. For Examiner's Use Calculate the percentage of the area for housing occupied by buildings. Answer(c) % [1] 5 3 (d) Of the buildings, are bungalows and are houses. 12 8 The rest of the buildings are apartments. (i) Complete these equivalent fractions. 5 3 = = [2] 12 24 8 24 5 (ii) Show that of the buildings are apartments. 24 Answer(d)(ii) [1] (iii) There are 120 buildings altogether. Work out the number of houses. Answer(d)(iii) [1]
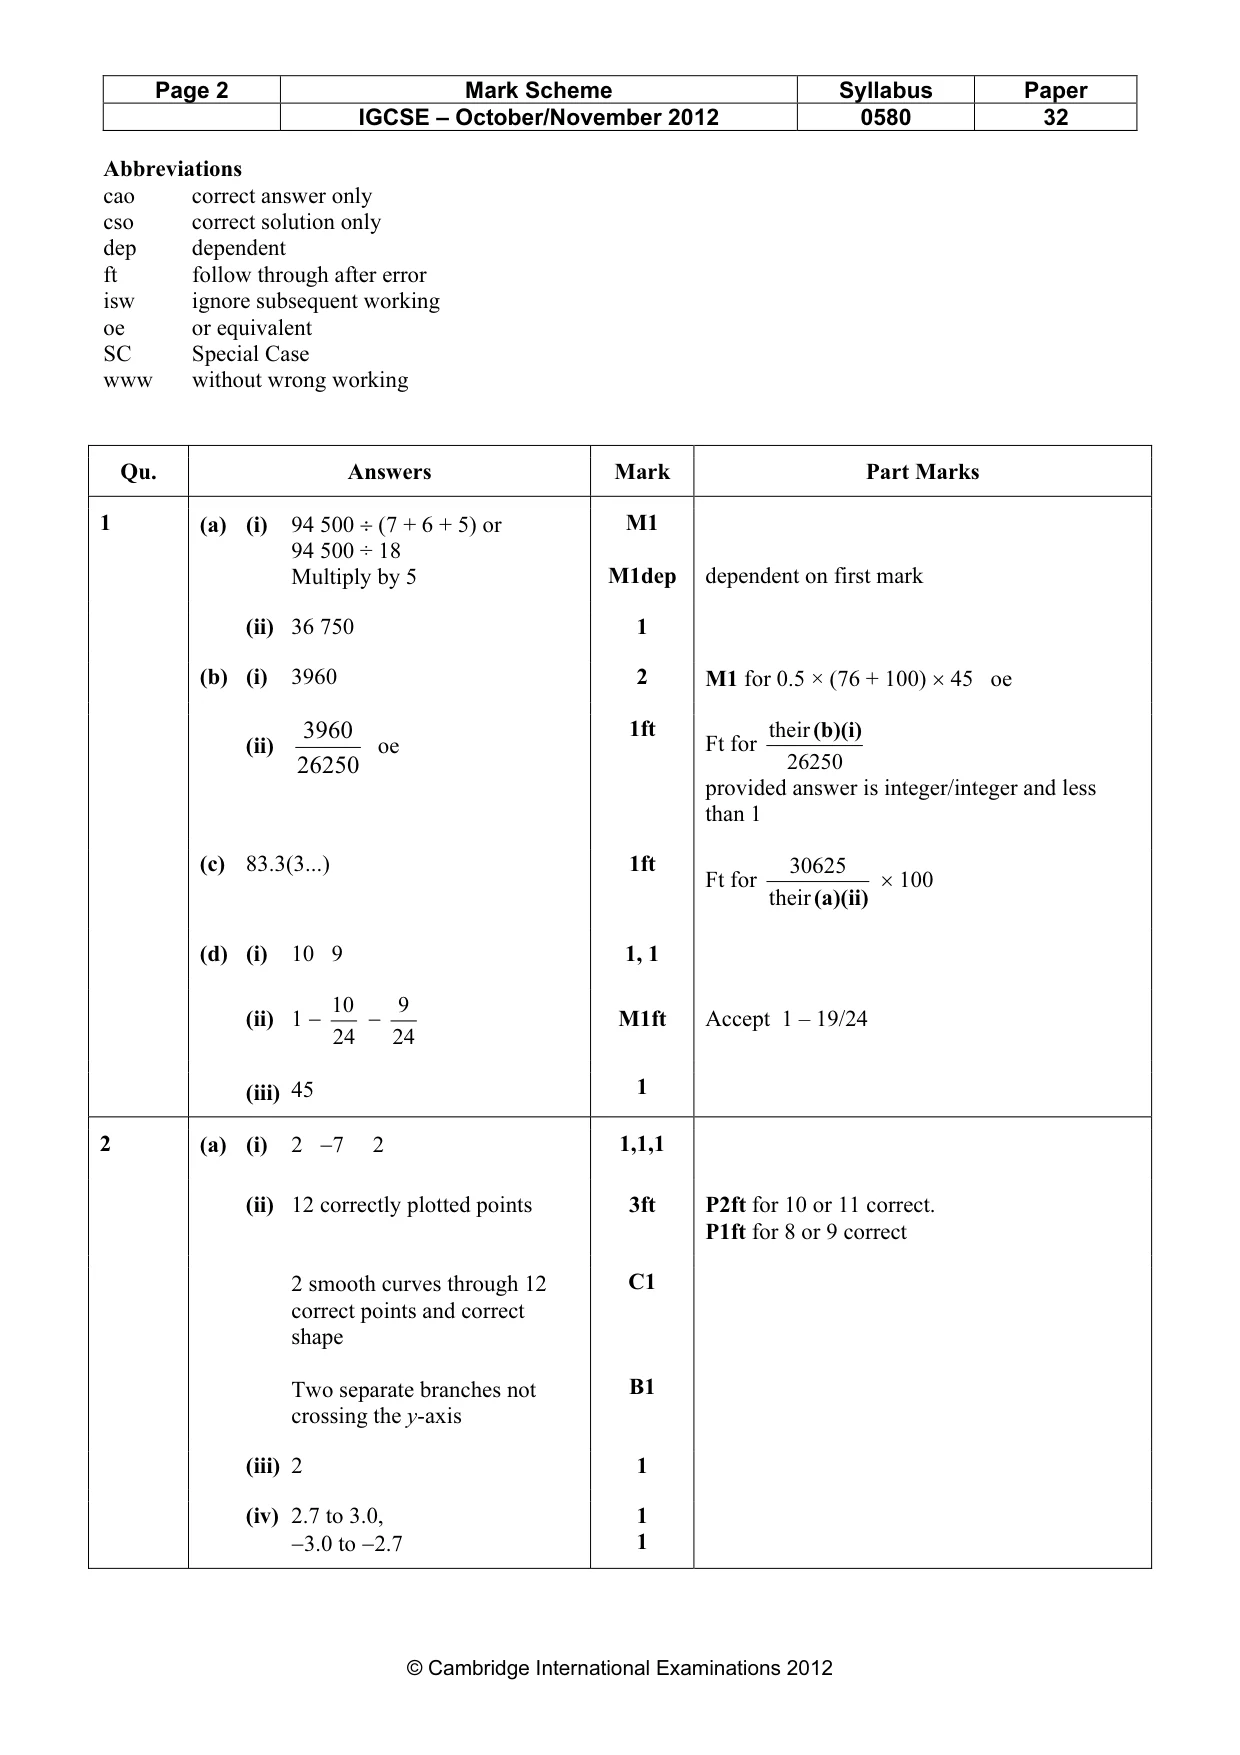
Mark scheme: Qu. Answers Mark Part Marks 1 (a) (i) 94 500 ÷ (7 + 6 + 5) or M1 94 500 ÷ 18 Multiply by 5 M1dep dependent on first mark (ii) 36 750 1 (b) (i) 3960 2 M1 for 0.5 × (76 + 100) × 45 oe 3960 1ft their(b)(i) (ii) oe Ft for 26250 26250 provided answer is integer/integer and less than 1 (c) 83.3(3...) 1ft 30625 Ft for × 100 their (a)(ii) (d) (i) 10 9 1, 1 10 9 (ii) 1 − − M1ft Accept 1 – 19/24 24 24 (iii) 45 1
Q2 · For 2 (a) The table shows some values of the function y = x O
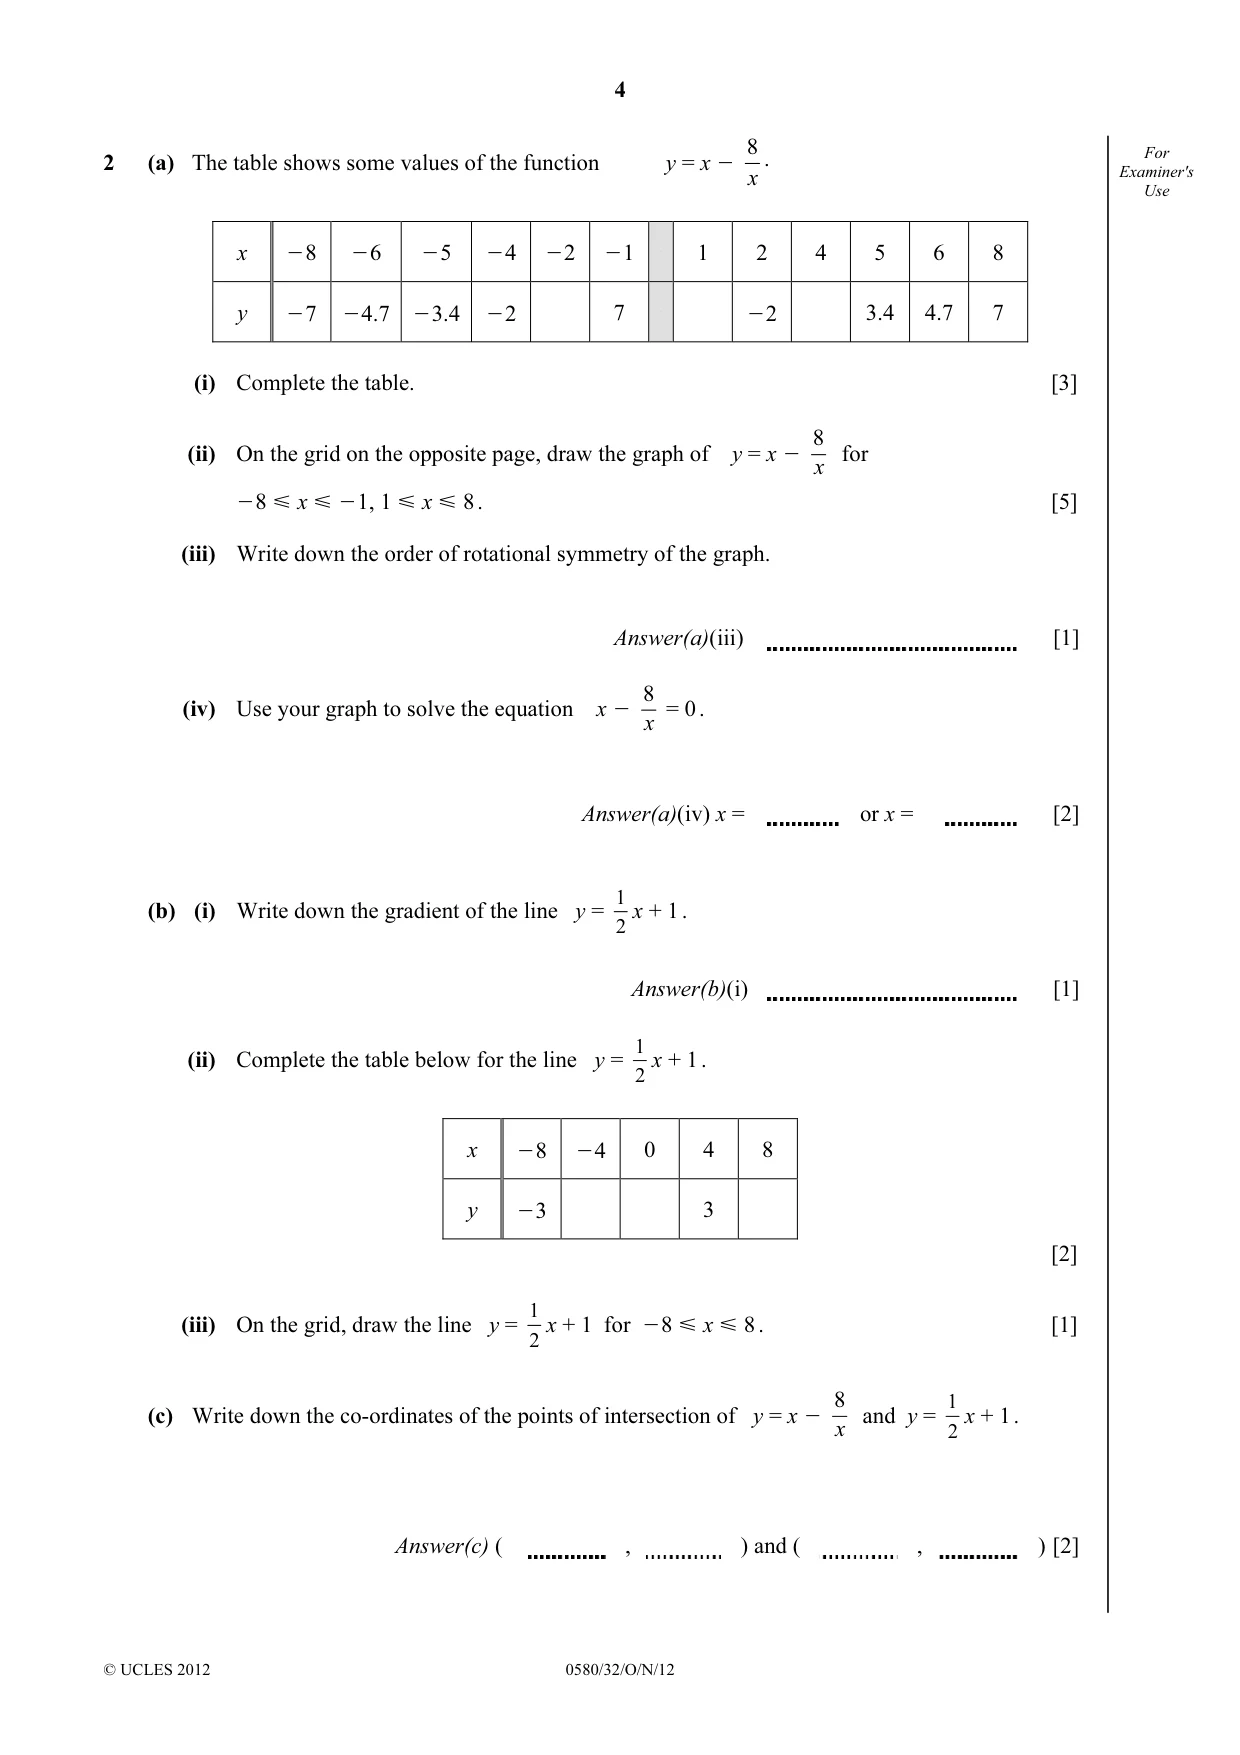
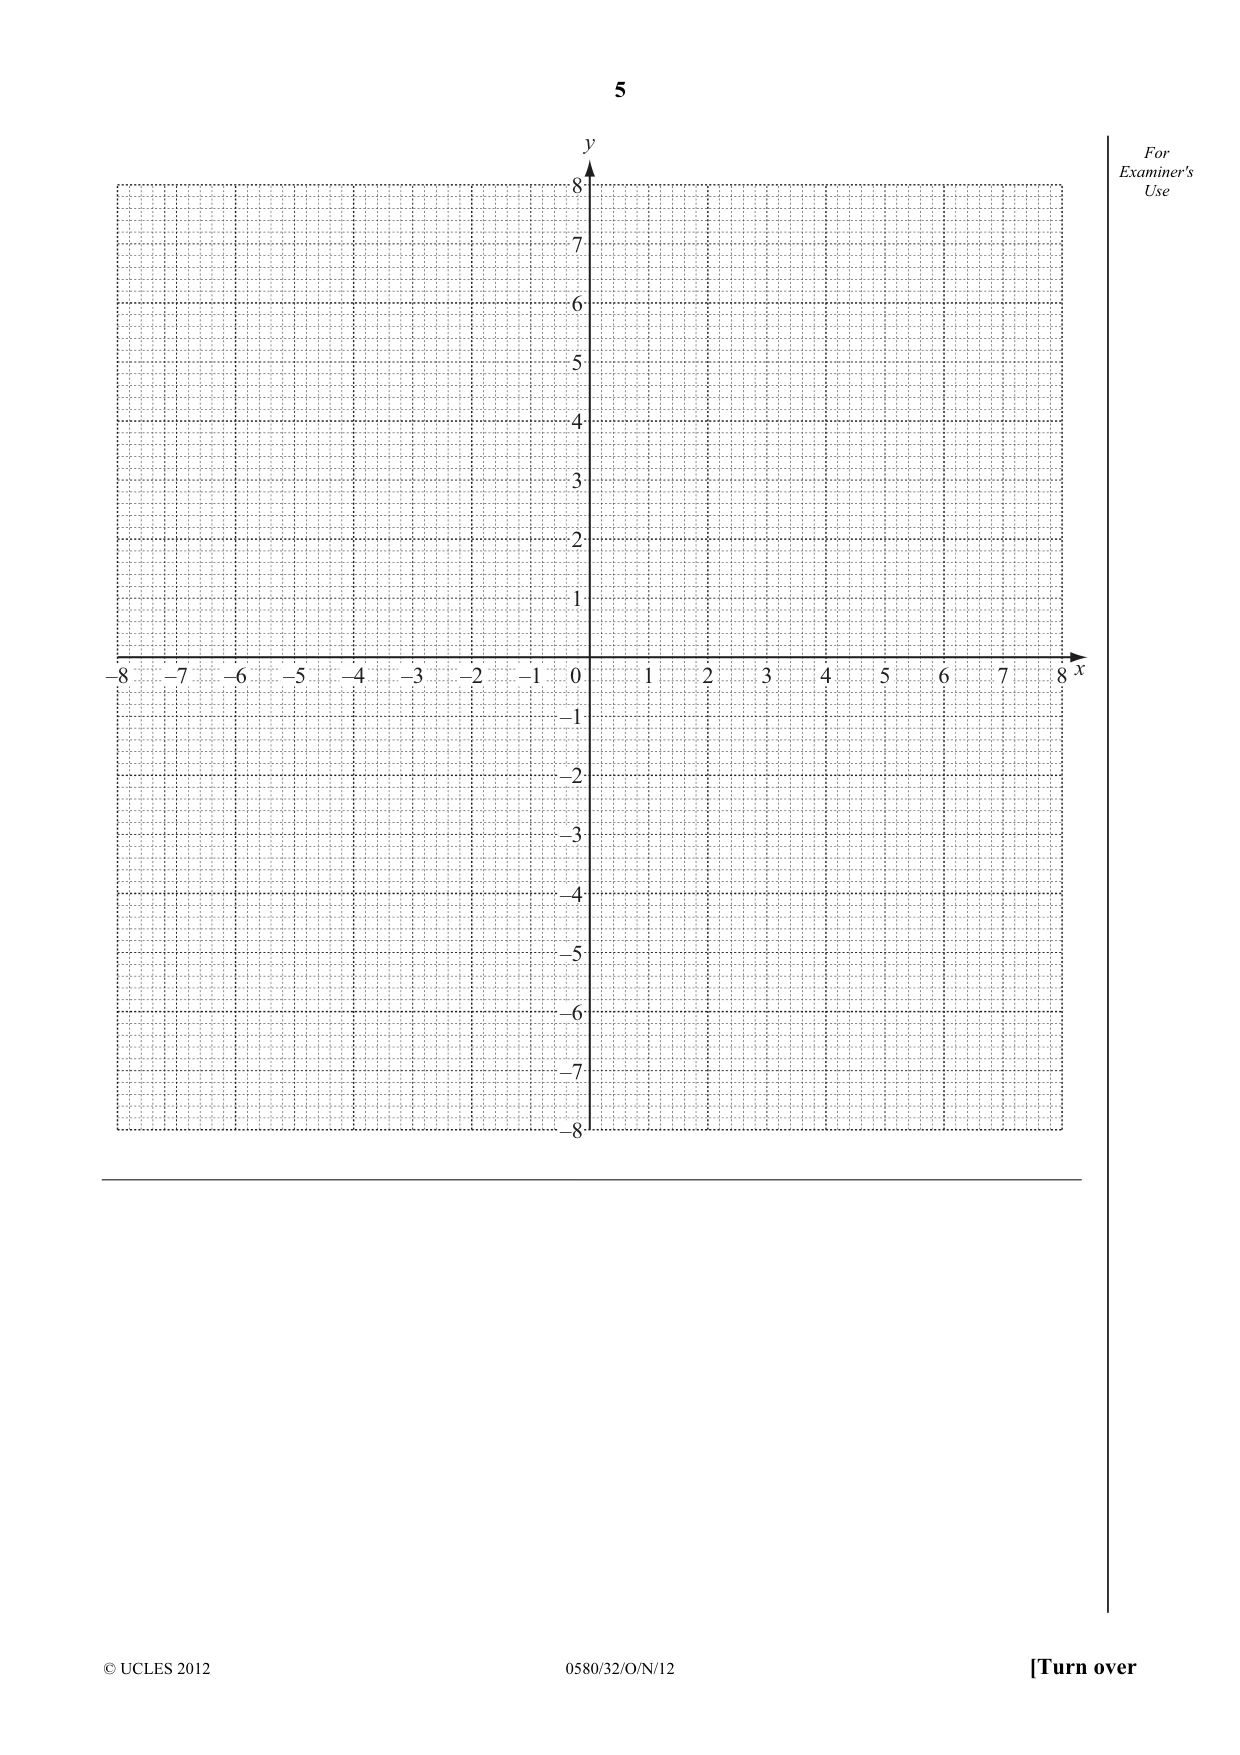
8 For 2 (a) The table shows some values of the function y = x O . Examiner's x Use x O8 O6 O5 O4 O2 O1 1 2 4 5 6 8 y O7 O4.7 O3.4 O2 7 O2 3.4 4.7 7 (i) Complete the table. [3] 8 (ii) On the grid on the opposite page, draw the graph of y = x O for x O8 Y x Y O1, 1 Y x Y 8 . [5] (iii) Write down the order of rotational symmetry of the graph. Answer(a)(iii) [1] 8 (iv) Use your graph to solve the equation x O = 0 . x Answer(a)(iv) x = or x = [2] 1 (b) (i) Write down the gradient of the line y = x + 1 . 2 Answer(b)(i) [1] 1 (ii) Complete the table below for the line y = x + 1 . 2 x O8 O4 0 4 8 y O3 3 [2] 1 (iii) On the grid, draw the line y = x + 1 for O8 Y x Y 8 . [1] 2 8 1 (c) Write down the co-ordinates of the points of intersection of y = x O and y = x + 1 . x 2 Answer(c) ( , ) and ( , ) [2] y For Examiner's 8 Use 7 6 5 4 3 2 1 x–8 –7 –6 –5 –4 –3 –2 –1 0 1 2 3 4 5 6 7 8 –1 –2 –3 –4 –5 –6 –7 –8
Mark scheme: 2 (a) (i) 2 −7 2 1,1,1 (ii) 12 correctly plotted points 3ft P2ft for 10 or 11 correct. P1ft for 8 or 9 correct 2 smooth curves through 12 C1 correct points and correct shape Two separate branches not B1 crossing the y-axis (iii) 2 1 (iv) 2.7 to 3.0, 1 −3.0 to −2.7 1 IGCSE – October/November 2012 0580 32 (b) (i) 1 or 0.5 2 1 (ii) −1 1 5 2 B1 for 2 correct (iii) Correct ruled continuous line 1 drawn (c) (5.0 to 5.2, 3.5 to 3.7) 1ft Ft ± 0.1 from their intersections (−3.2 to –3.0, −0.7 to –0.5) 1ft
Q3 · For l Examiner's Use C B A F E D P (a) Describe fully the single transformation that maps…
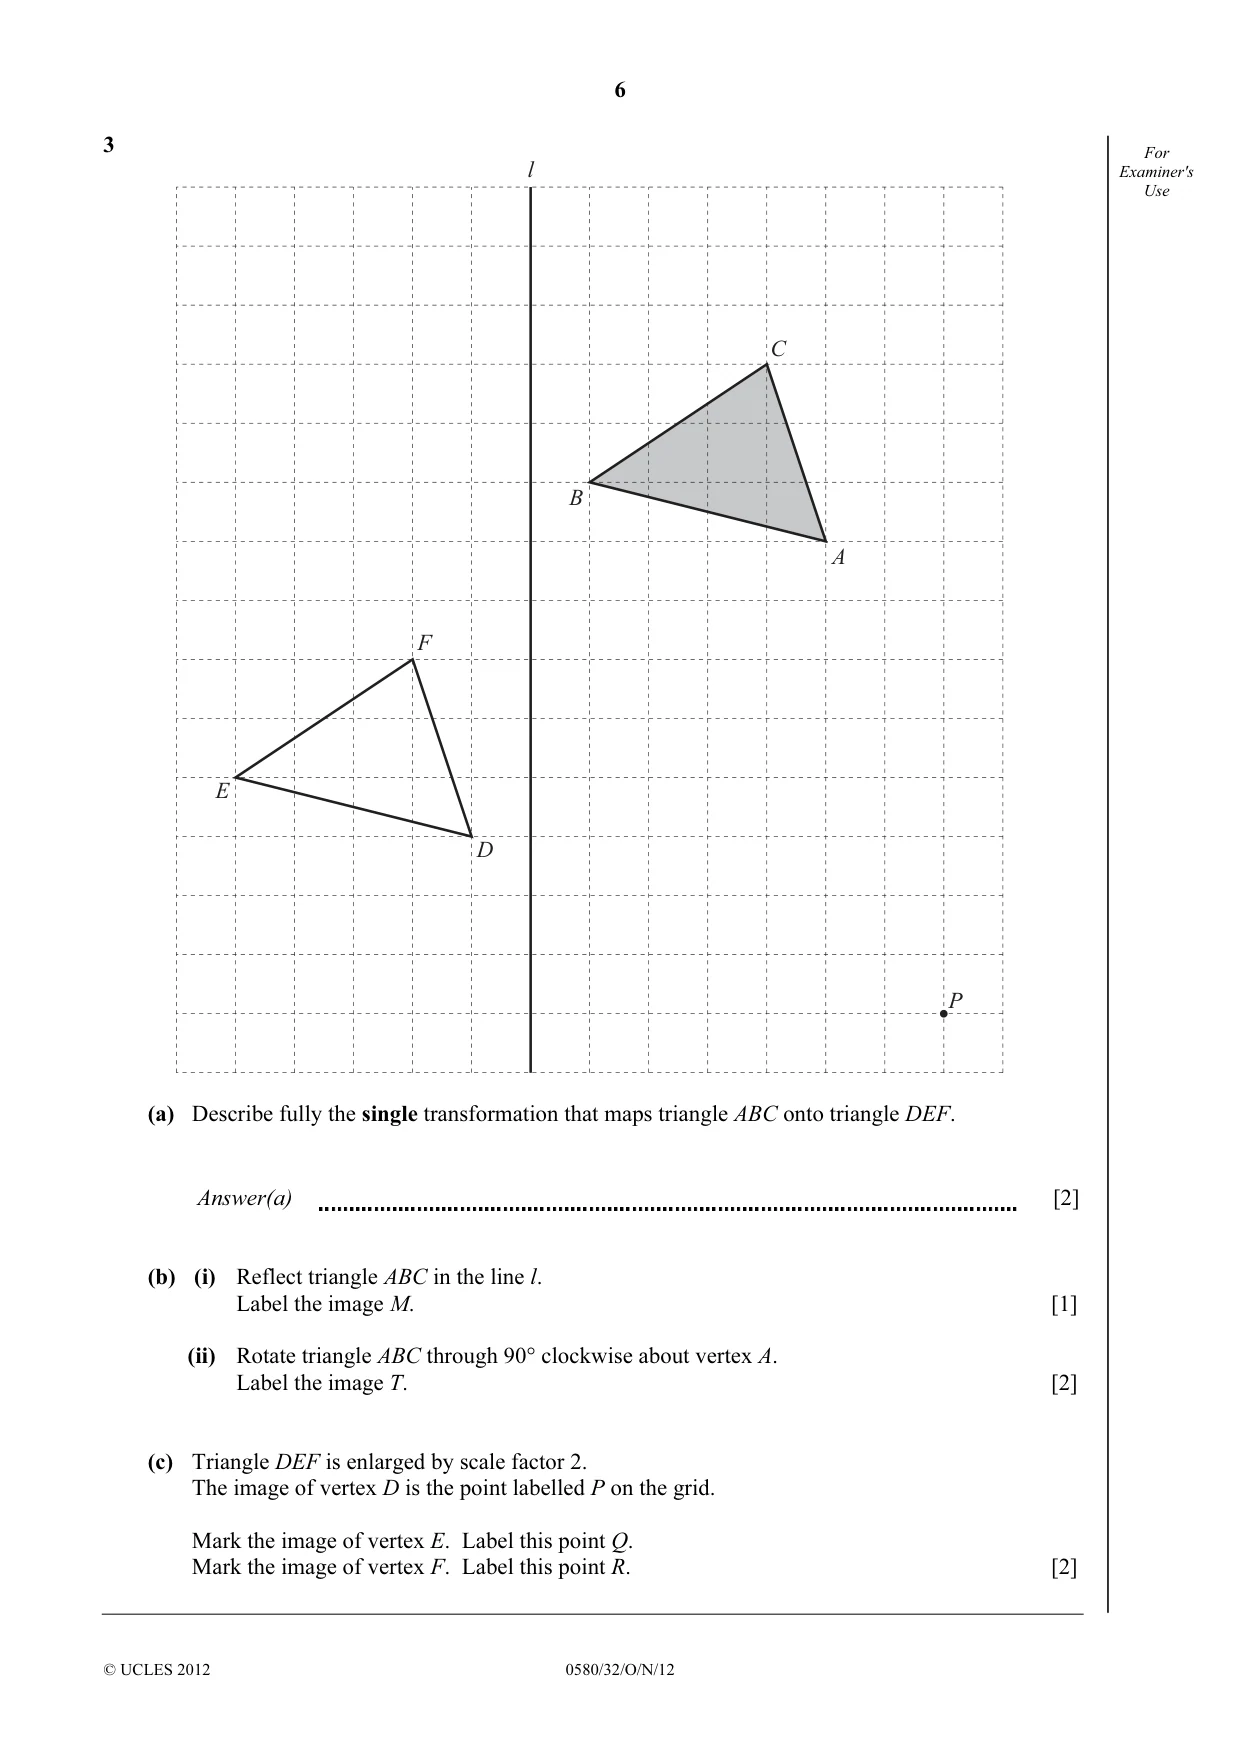
3 For l Examiner's Use C B A F E D P (a) Describe fully the single transformation that maps triangle ABC onto triangle DEF. Answer(a) [2] (b) (i) Reflect triangle ABC in the line l. Label the image M. [1] (ii) Rotate triangle ABC through 90° clockwise about vertex A. Label the image T. [2] (c) Triangle DEF is enlarged by scale factor 2. The image of vertex D is the point labelled P on the grid. Mark the image of vertex E. Label this point Q. Mark the image of vertex F. Label this point R. [2]
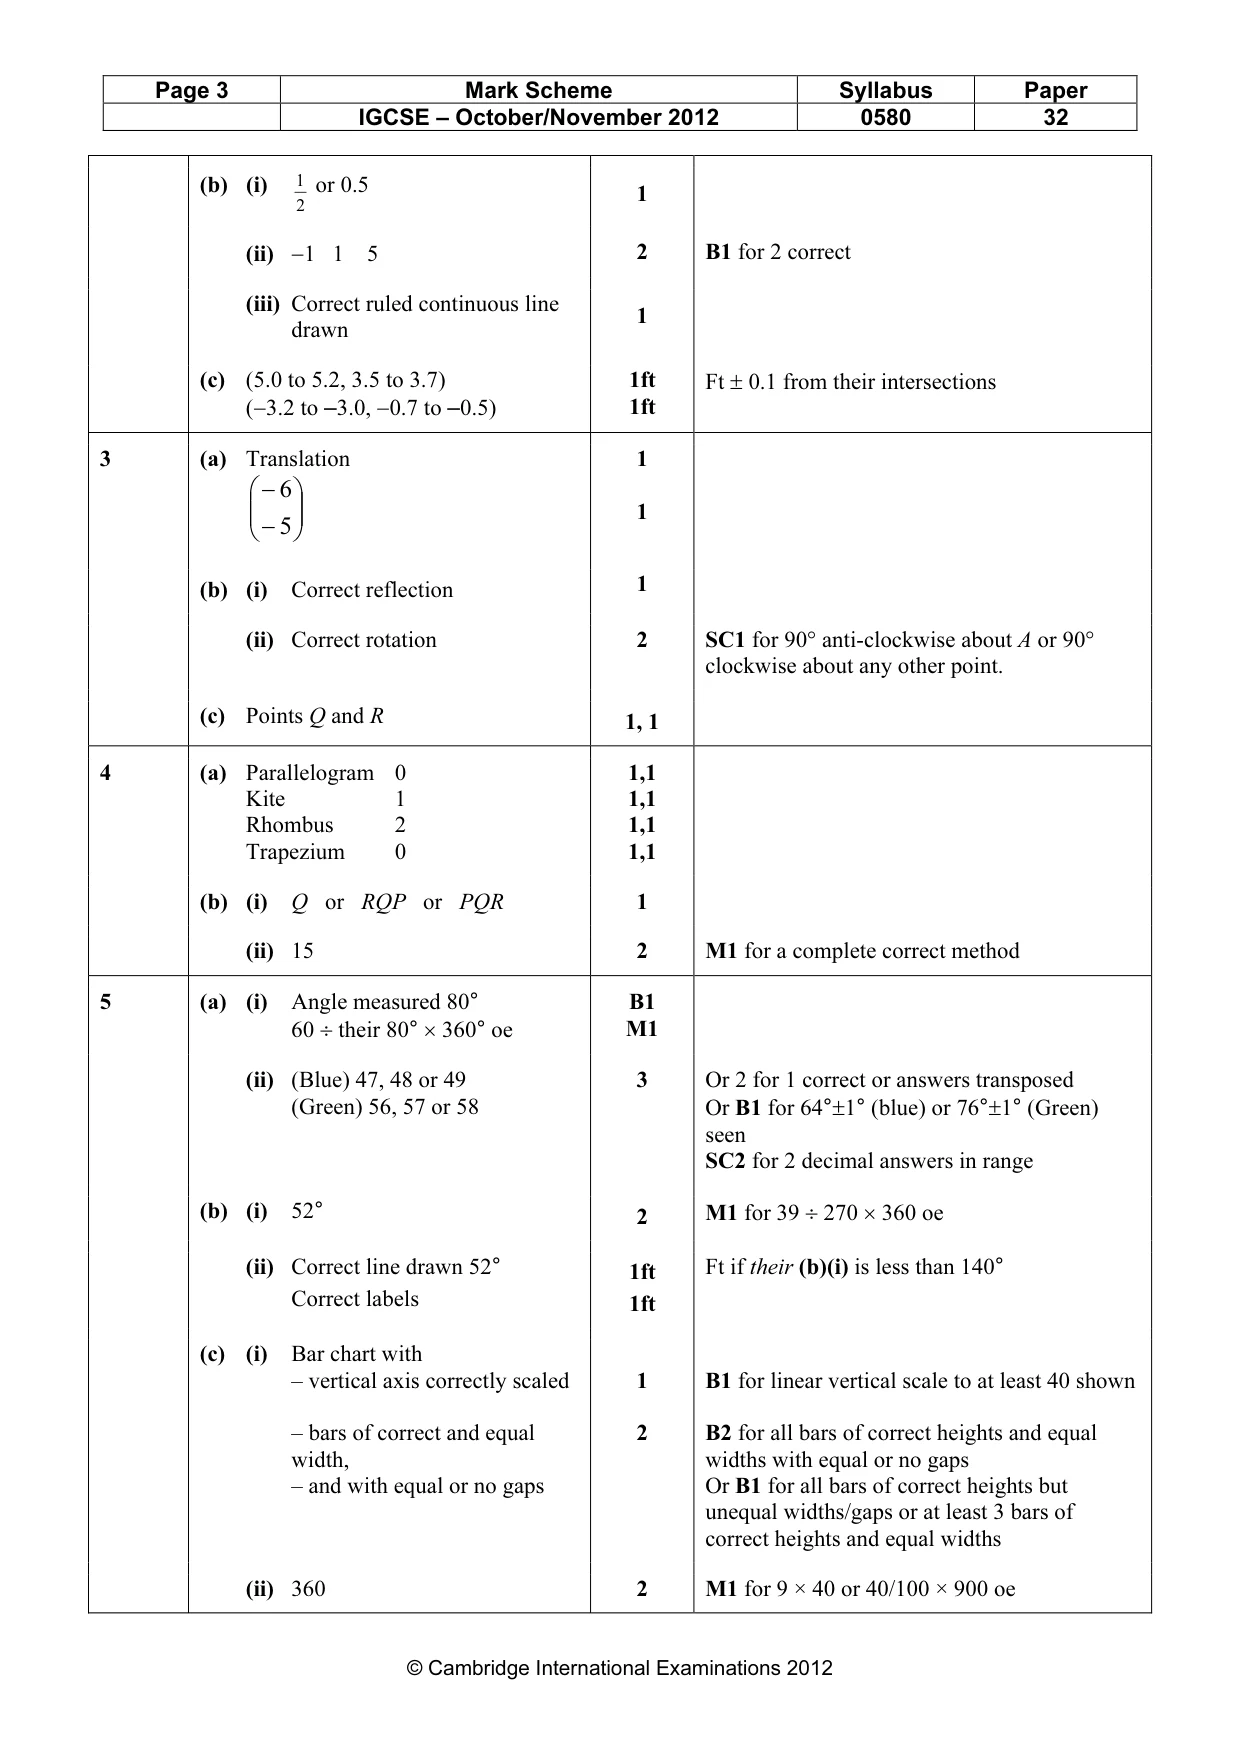
Mark scheme: 3 (a) Translation 1 − 6 1 − 5 (b) (i) Correct reflection 1 (ii) Correct rotation 2 SC1 for 90° anti-clockwise about A or 90° clockwise about any other point. (c) Points Q and R 1, 1
Q4 · For Examiner's Use A B C D Complete the table for each of the different quadrilaterals A…
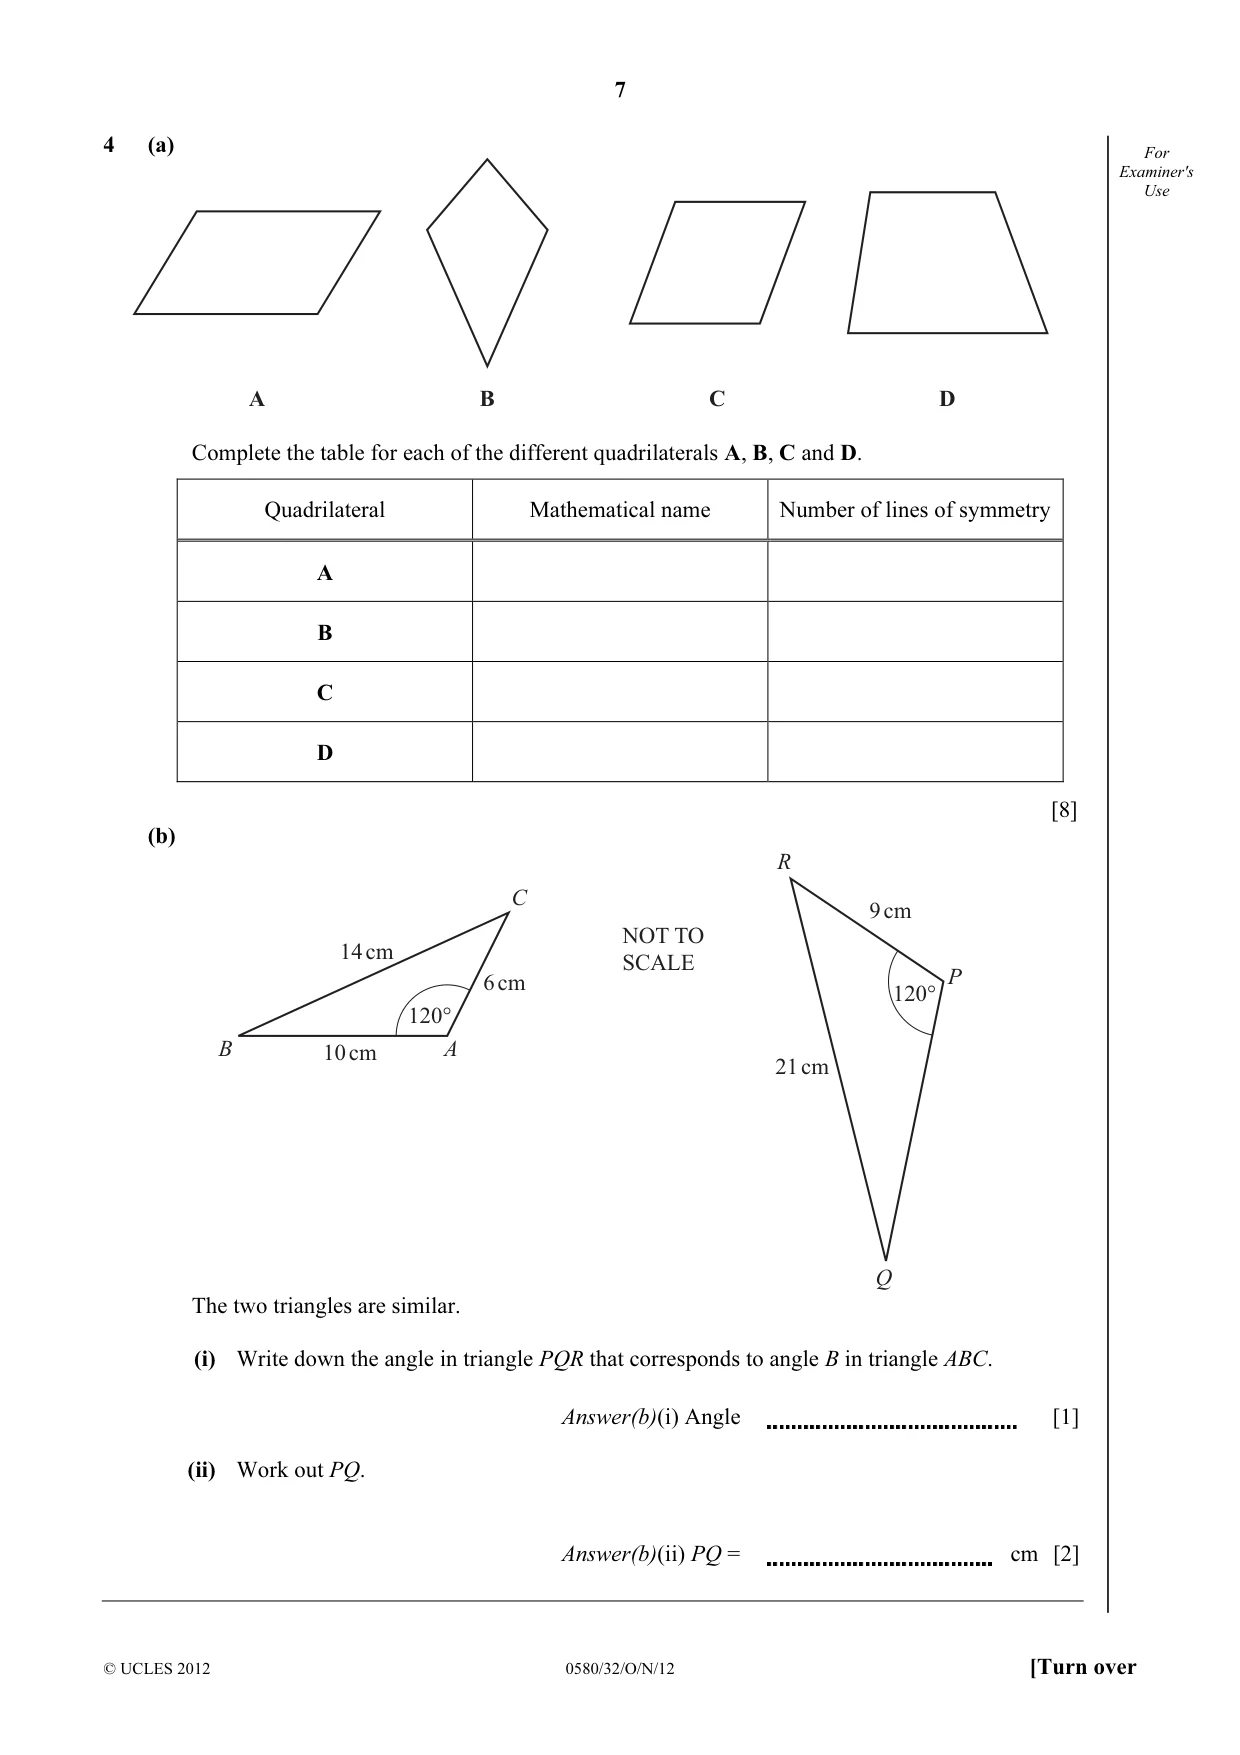
4 (a) For Examiner's Use A B C D Complete the table for each of the different quadrilaterals A, B, C and D. Quadrilateral Mathematical name Number of lines of symmetry A B C D [8] (b) R C 9 cm NOT TO 14 cm SCALE 6 cm P 120° 120° B 10 cm A 21 cm Q The two triangles are similar. (i) Write down the angle in triangle PQR that corresponds to angle B in triangle ABC. Answer(b)(i) Angle [1] (ii) Work out PQ. Answer(b)(ii) PQ = cm [2]
Mark scheme: 4 (a) Parallelogram 0 1,1 Kite 1 1,1 Rhombus 2 1,1 Trapezium 0 1,1 (b) (i) Q or RQP or PQR 1 (ii) 15 2 M1 for a complete correct method
Q5 · The colours of the cars at a car centre are red, blue, green, black and white
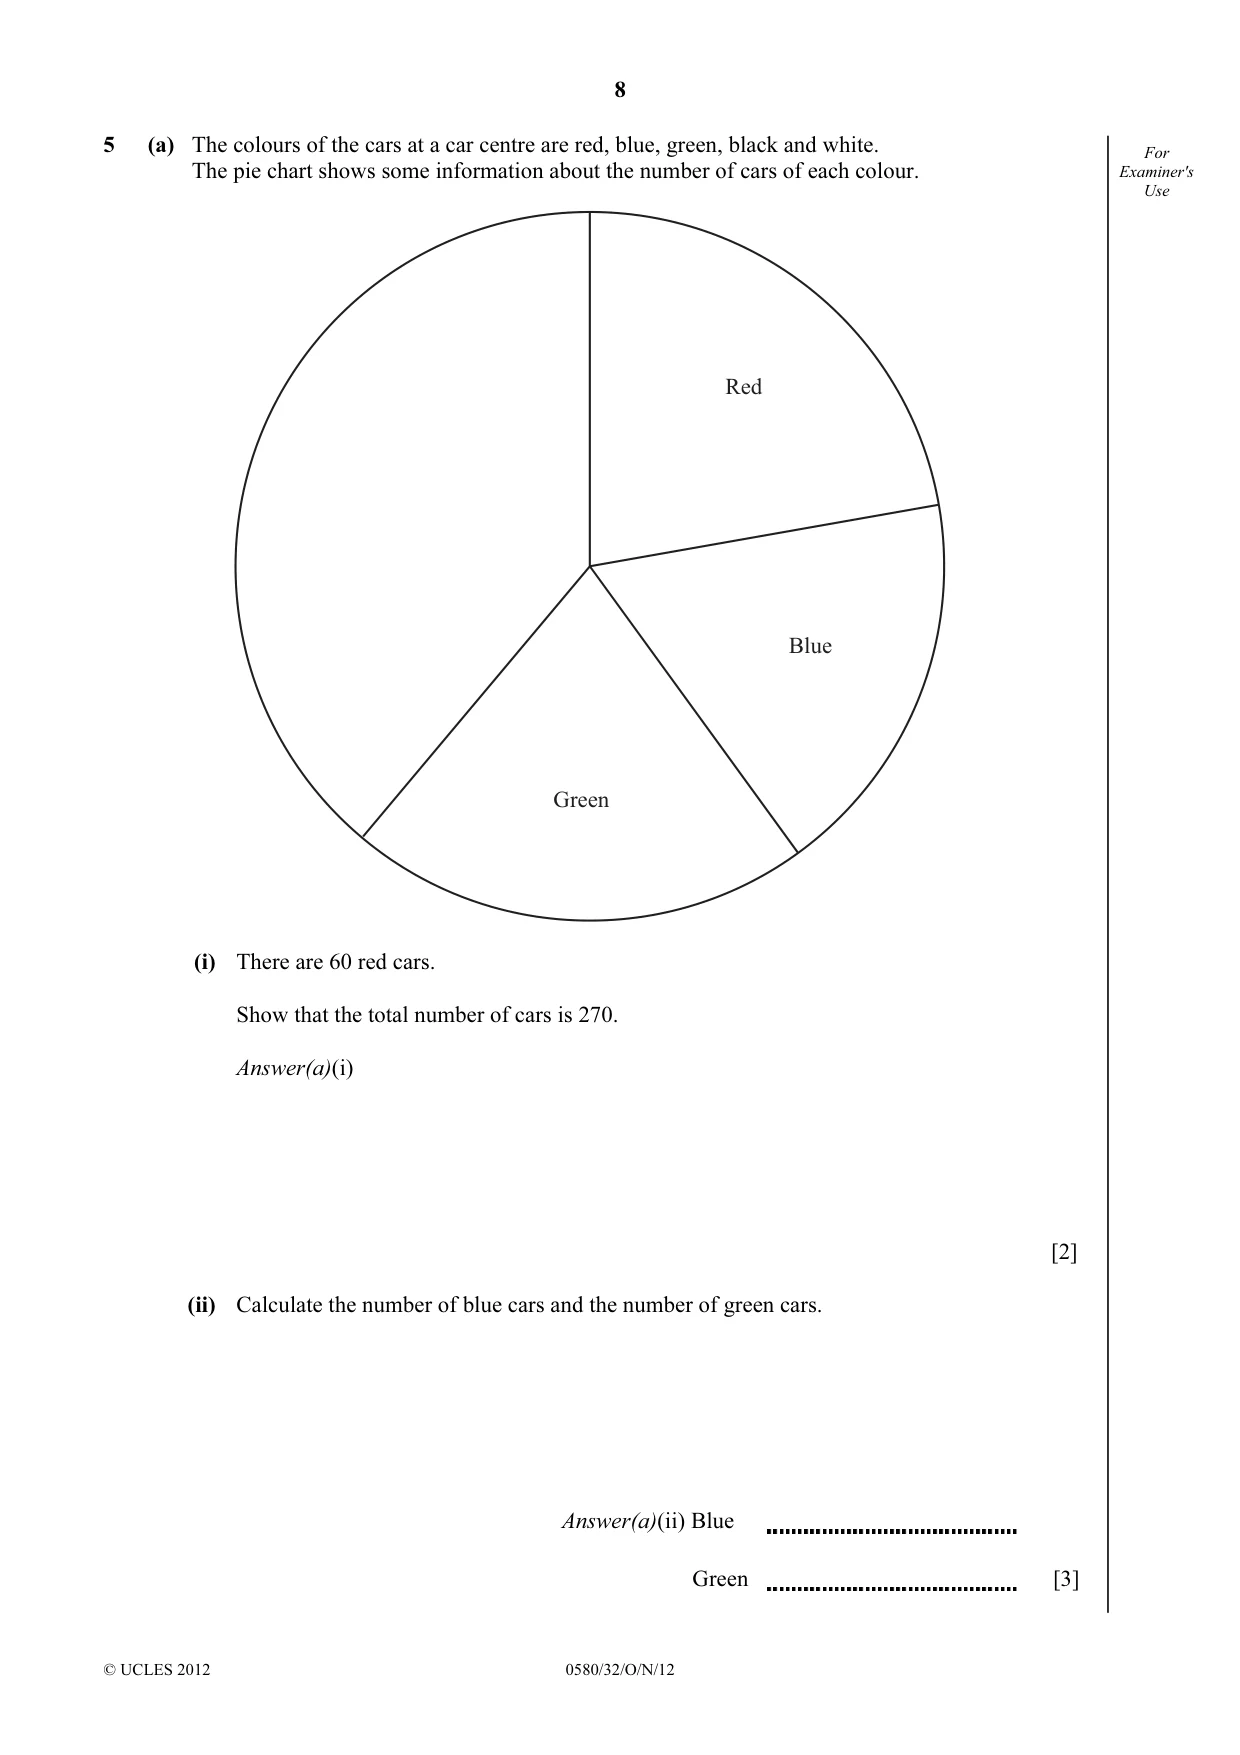
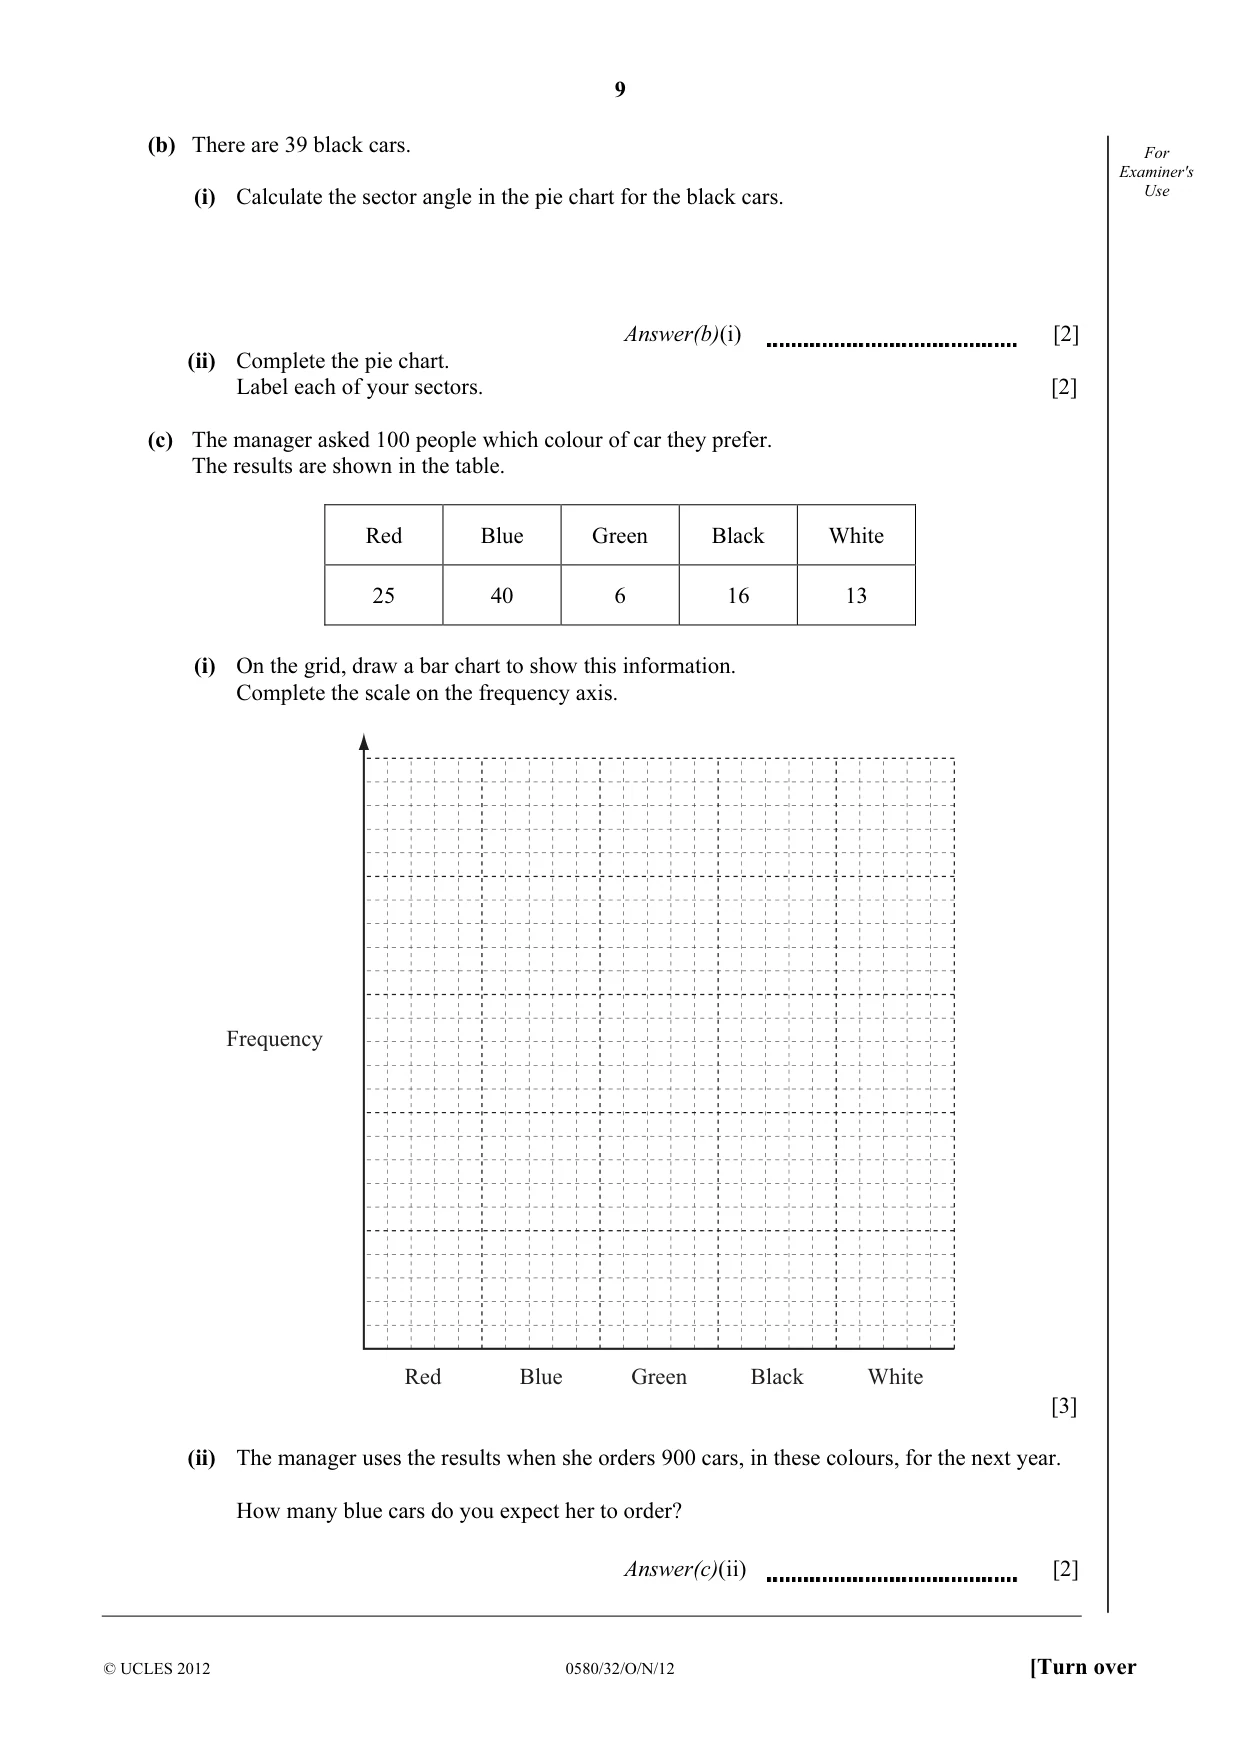
5 (a) The colours of the cars at a car centre are red, blue, green, black and white. For The pie chart shows some information about the number of cars of each colour. Examiner's Use Red Blue Green (i) There are 60 red cars. Show that the total number of cars is 270. Answer(a)(i) [2] (ii) Calculate the number of blue cars and the number of green cars. Answer(a)(ii) Blue Green [3] (b) There are 39 black cars. For Examiner's Use (i) Calculate the sector angle in the pie chart for the black cars. Answer(b)(i) [2] (ii) Complete the pie chart. Label each of your sectors. [2] (c) The manager asked 100 people which colour of car they prefer. The results are shown in the table. Red Blue Green Black White 25 40 6 16 13 (i) On the grid, draw a bar chart to show this information. Complete the scale on the frequency axis. Frequency Red Blue Green Black White [3] (ii) The manager uses the results when she orders 900 cars, in these colours, for the next year. How many blue cars do you expect her to order? Answer(c)(ii) [2]
Mark scheme: 5 (a) (i) Angle measured 80° B1 60 ÷ their 80° × 360° oe M1 (ii) (Blue) 47, 48 or 49 3 Or 2 for 1 correct or answers transposed (Green) 56, 57 or 58 Or B1 for 64°±1° (blue) or 76°±1° (Green) seen SC2 for 2 decimal answers in range (b) (i) 52° 2 M1 for 39 ÷ 270 × 360 oe (ii) Correct line drawn 52° 1ft Ft if their (b)(i) is less than 140° Correct labels 1ft (c) (i) Bar chart with – vertical axis correctly scaled 1 B1 for linear vertical scale to at least 40 shown – bars of correct and equal 2 B2 for all bars of correct heights and equal width, widths with equal or no gaps – and with equal or no gaps Or B1 for all bars of correct heights but unequal widths/gaps or at least 3 bars of correct heights and equal widths (ii) 360 2 M1 for 9 × 40 or 40/100 × 900 oe IGCSE – October/November 2012 0580 32
Q6 · Johno travelled from his home on the North Island of New Zealand to Blenheim on the South…
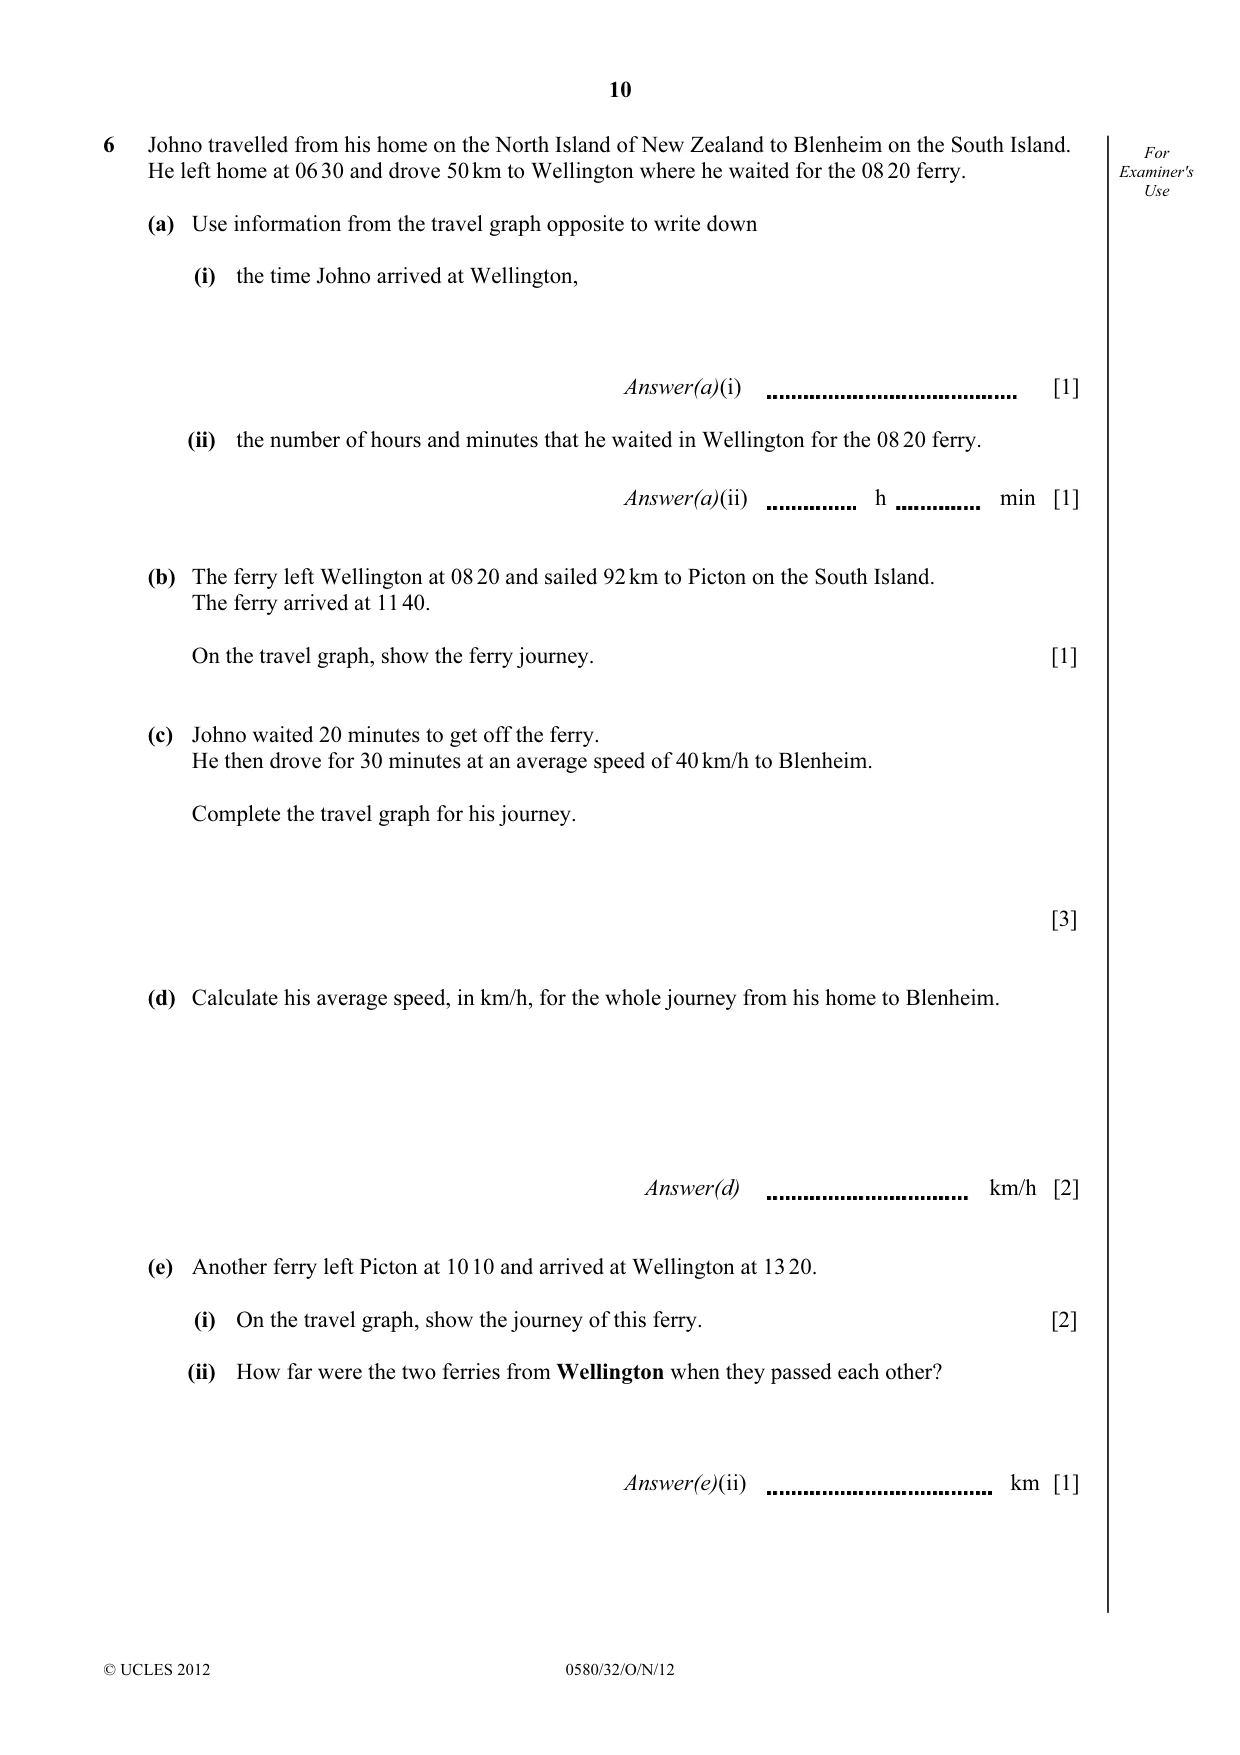
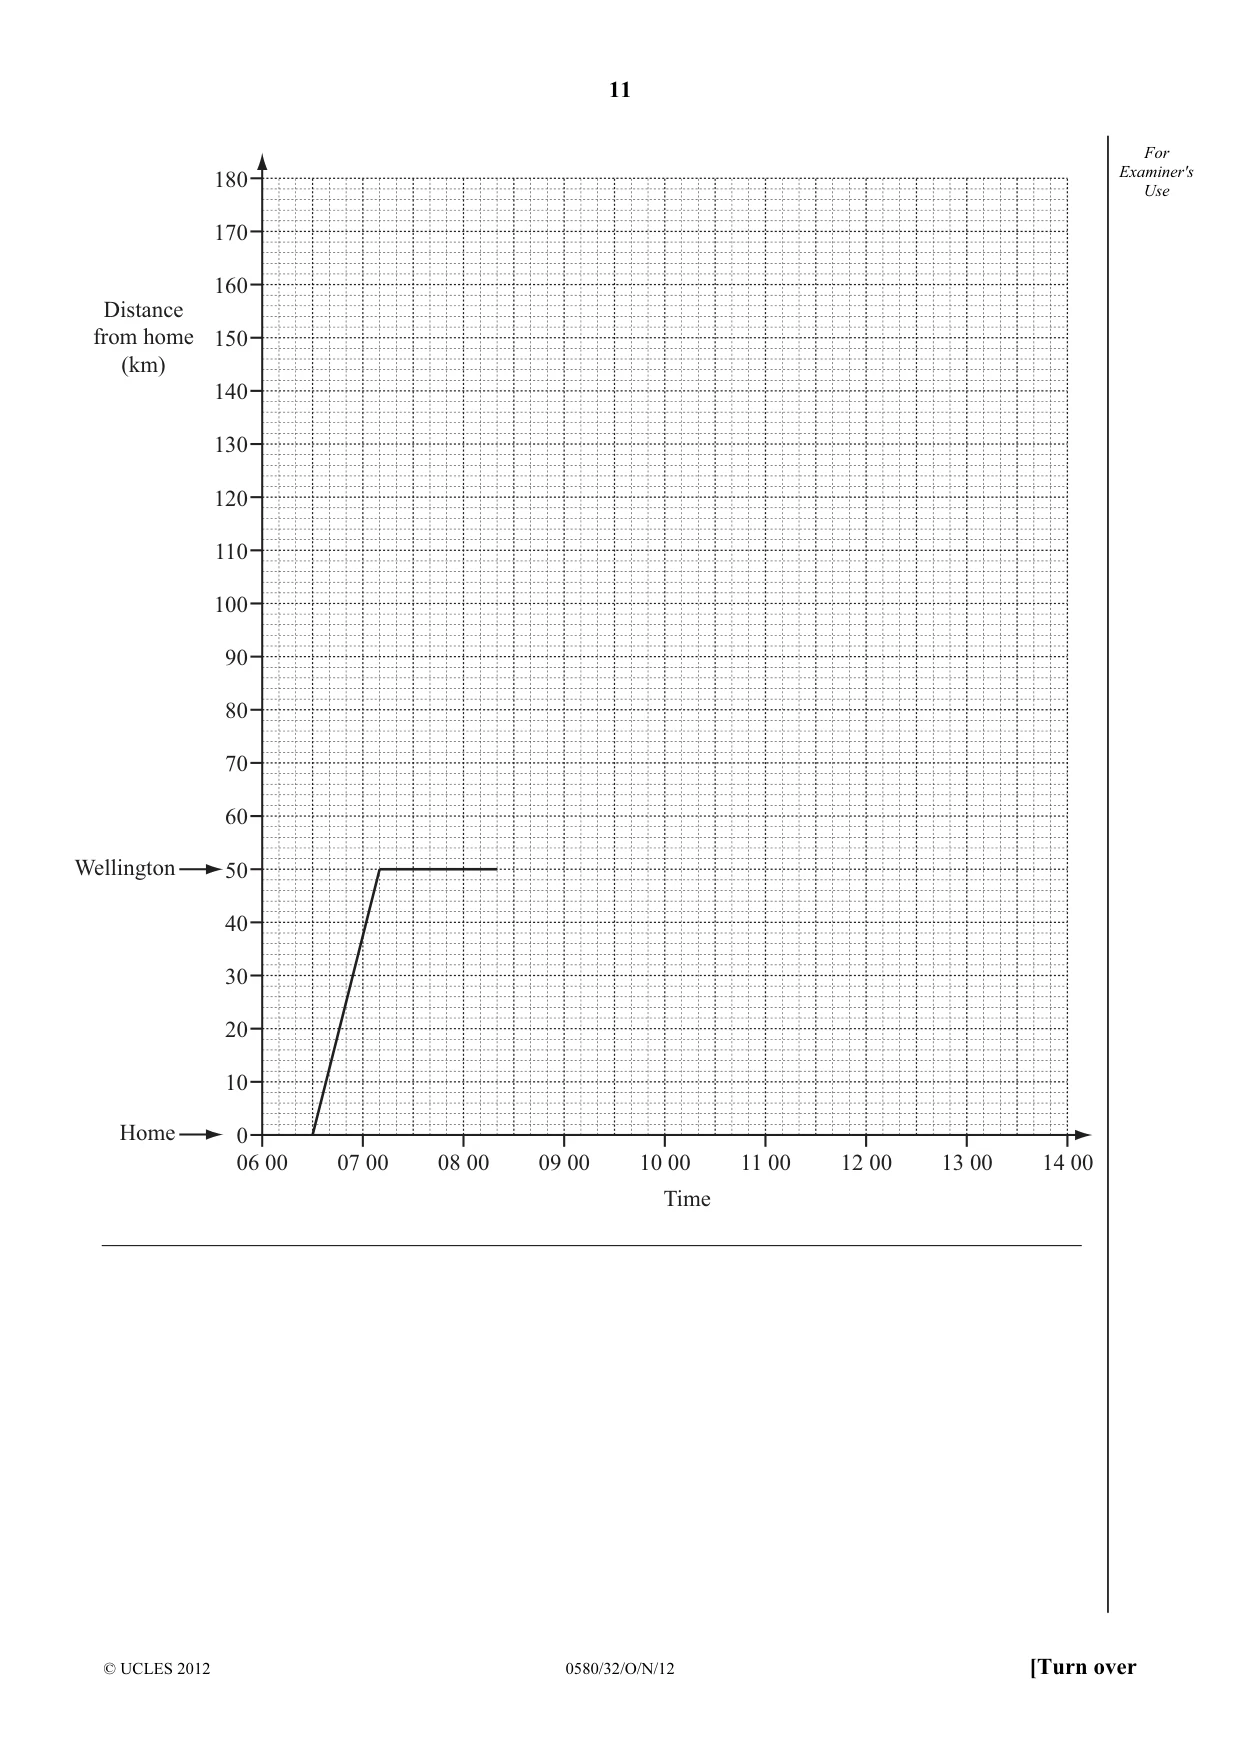
6 Johno travelled from his home on the North Island of New Zealand to Blenheim on the South Island. For He left home at 06 30 and drove 50 km to Wellington where he waited for the 08 20 ferry. Examiner's Use (a) Use information from the travel graph opposite to write down (i) the time Johno arrived at Wellington, Answer(a)(i) [1] (ii) the number of hours and minutes that he waited in Wellington for the 08 20 ferry. Answer(a)(ii) h min [1] (b) The ferry left Wellington at 08 20 and sailed 92 km to Picton on the South Island. The ferry arrived at 11 40. On the travel graph, show the ferry journey. [1] (c) Johno waited 20 minutes to get off the ferry. He then drove for 30 minutes at an average speed of 40 km/h to Blenheim. Complete the travel graph for his journey. [3] (d) Calculate his average speed, in km/h, for the whole journey from his home to Blenheim. Answer(d) km/h [2] (e) Another ferry left Picton at 10 10 and arrived at Wellington at 13 20. (i) On the travel graph, show the journey of this ferry. [2] (ii) How far were the two ferries from Wellington when they passed each other? Answer(e)(ii) km [1] For Examiner's 180 Use 170 160 Distance from home 150 (km) 140 130 120 110 100 90 80 70 60 Wellington 50 40 30 20 10 Home 0 06 00 07 00 08 00 09 00 10 00 11 00 12 00 13 00 14 00 Time
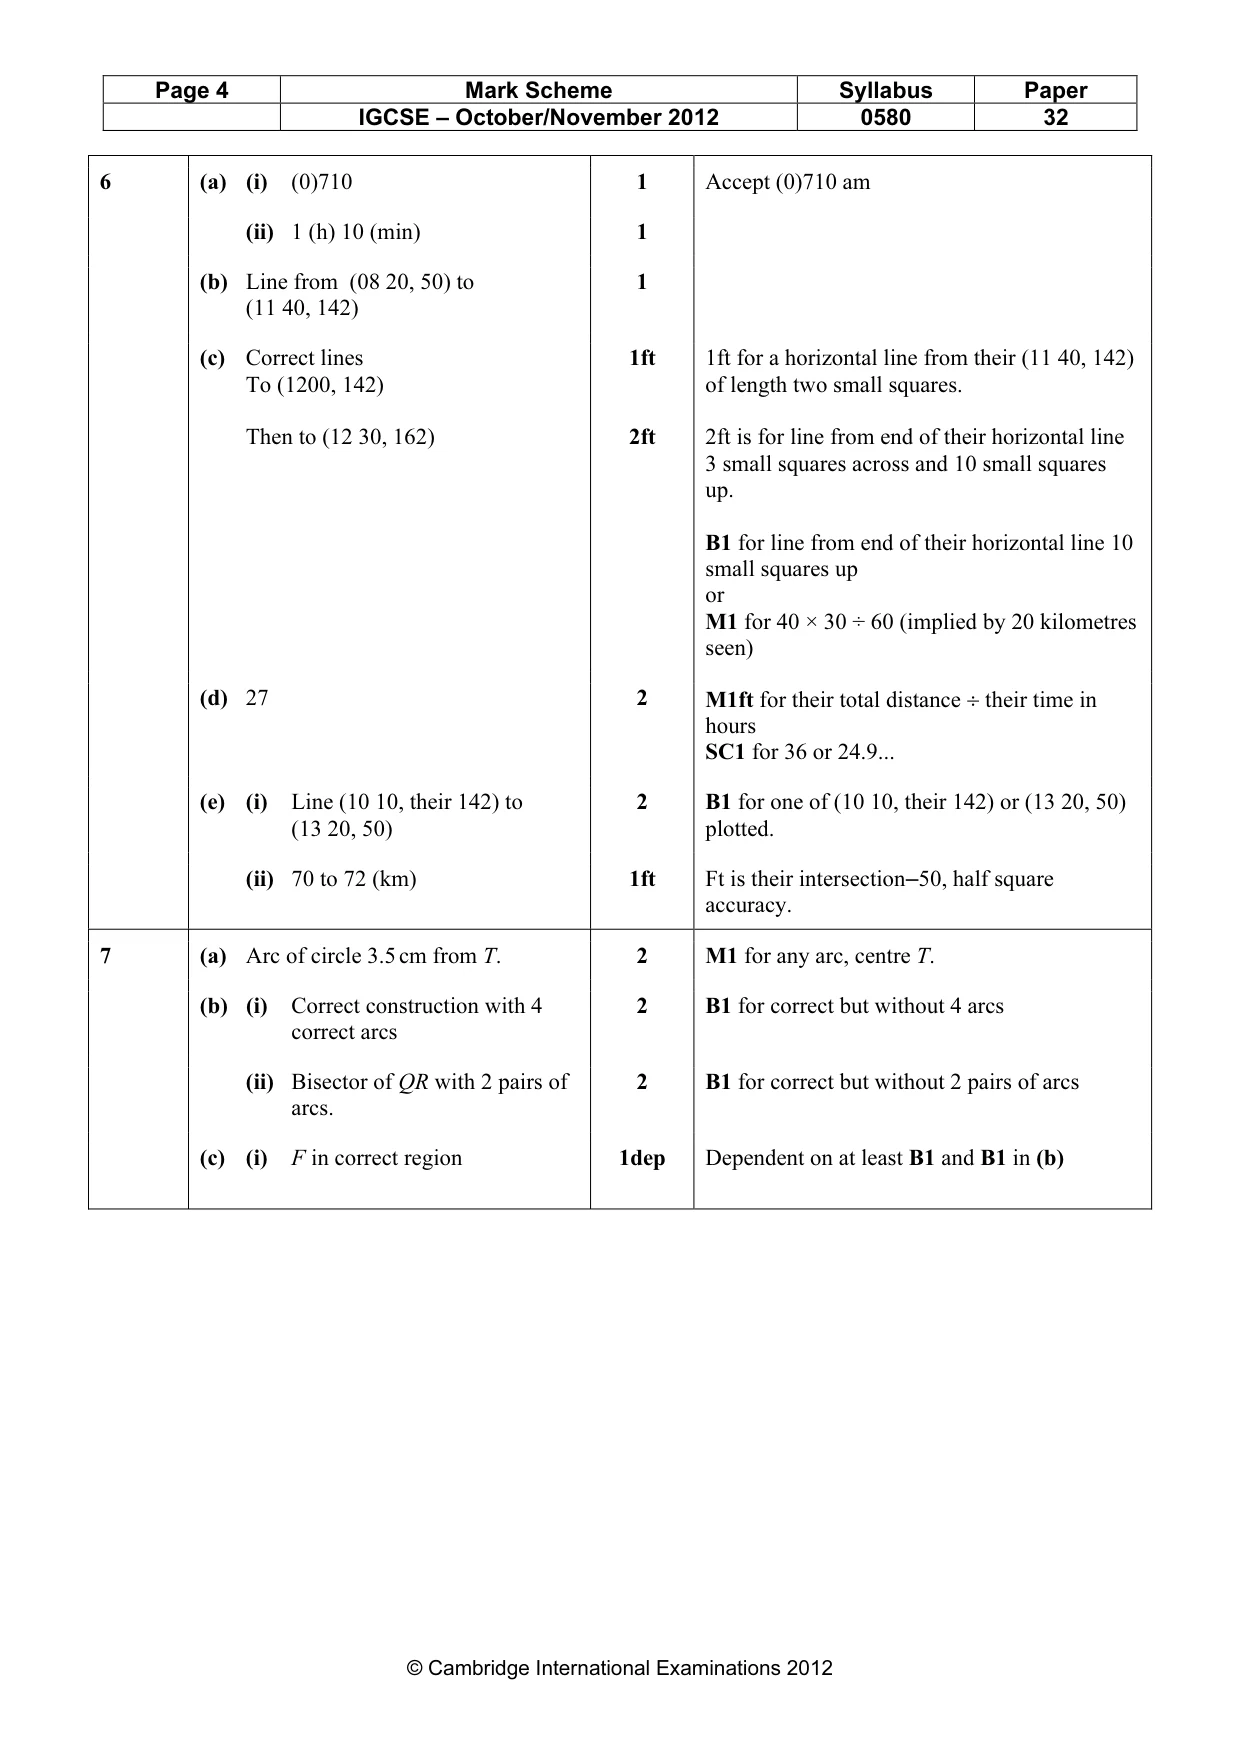
Mark scheme: 6 (a) (i) (0)710 1 Accept (0)710 am (ii) 1 (h) 10 (min) 1 (b) Line from (08 20, 50) to 1 (11 40, 142) (c) Correct lines 1ft 1ft for a horizontal line from their (11 40, 142) To (1200, 142) of length two small squares. Then to (12 30, 162) 2ft 2ft is for line from end of their horizontal line 3 small squares across and 10 small squares up. B1 for line from end of their horizontal line 10 small squares up or M1 for 40 × 30 ÷ 60 (implied by 20 kilometres seen) (d) 27 2 M1ft for their total distance ÷ their time in hours SC1 for 36 or 24.9... (e) (i) Line (10 10, their 142) to 2 B1 for one of (10 10, their 142) or (13 20, 50) (13 20, 50) plotted. (ii) 70 to 72 (km) 1ft Ft is their intersection–50, half square accuracy.
Q7 · The diagram shows the plan of a field QRST
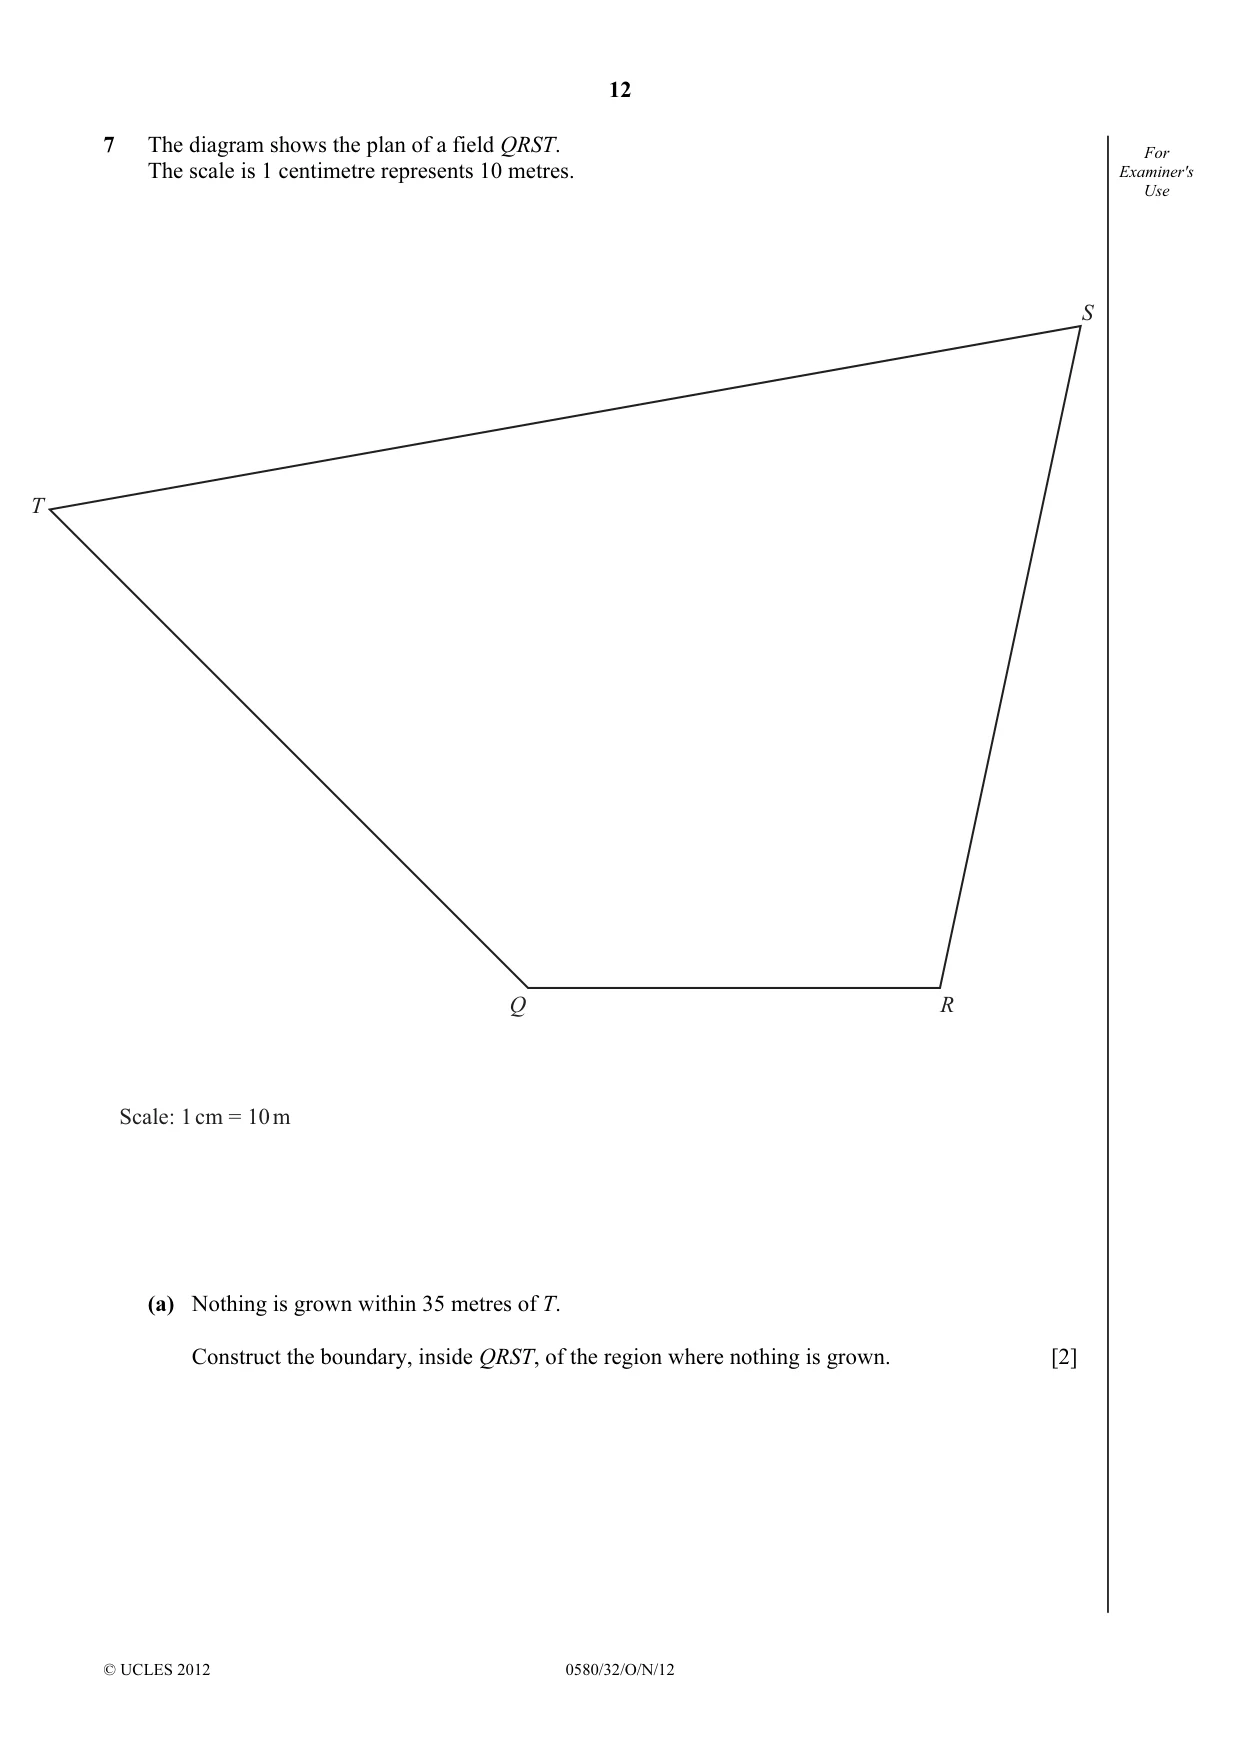
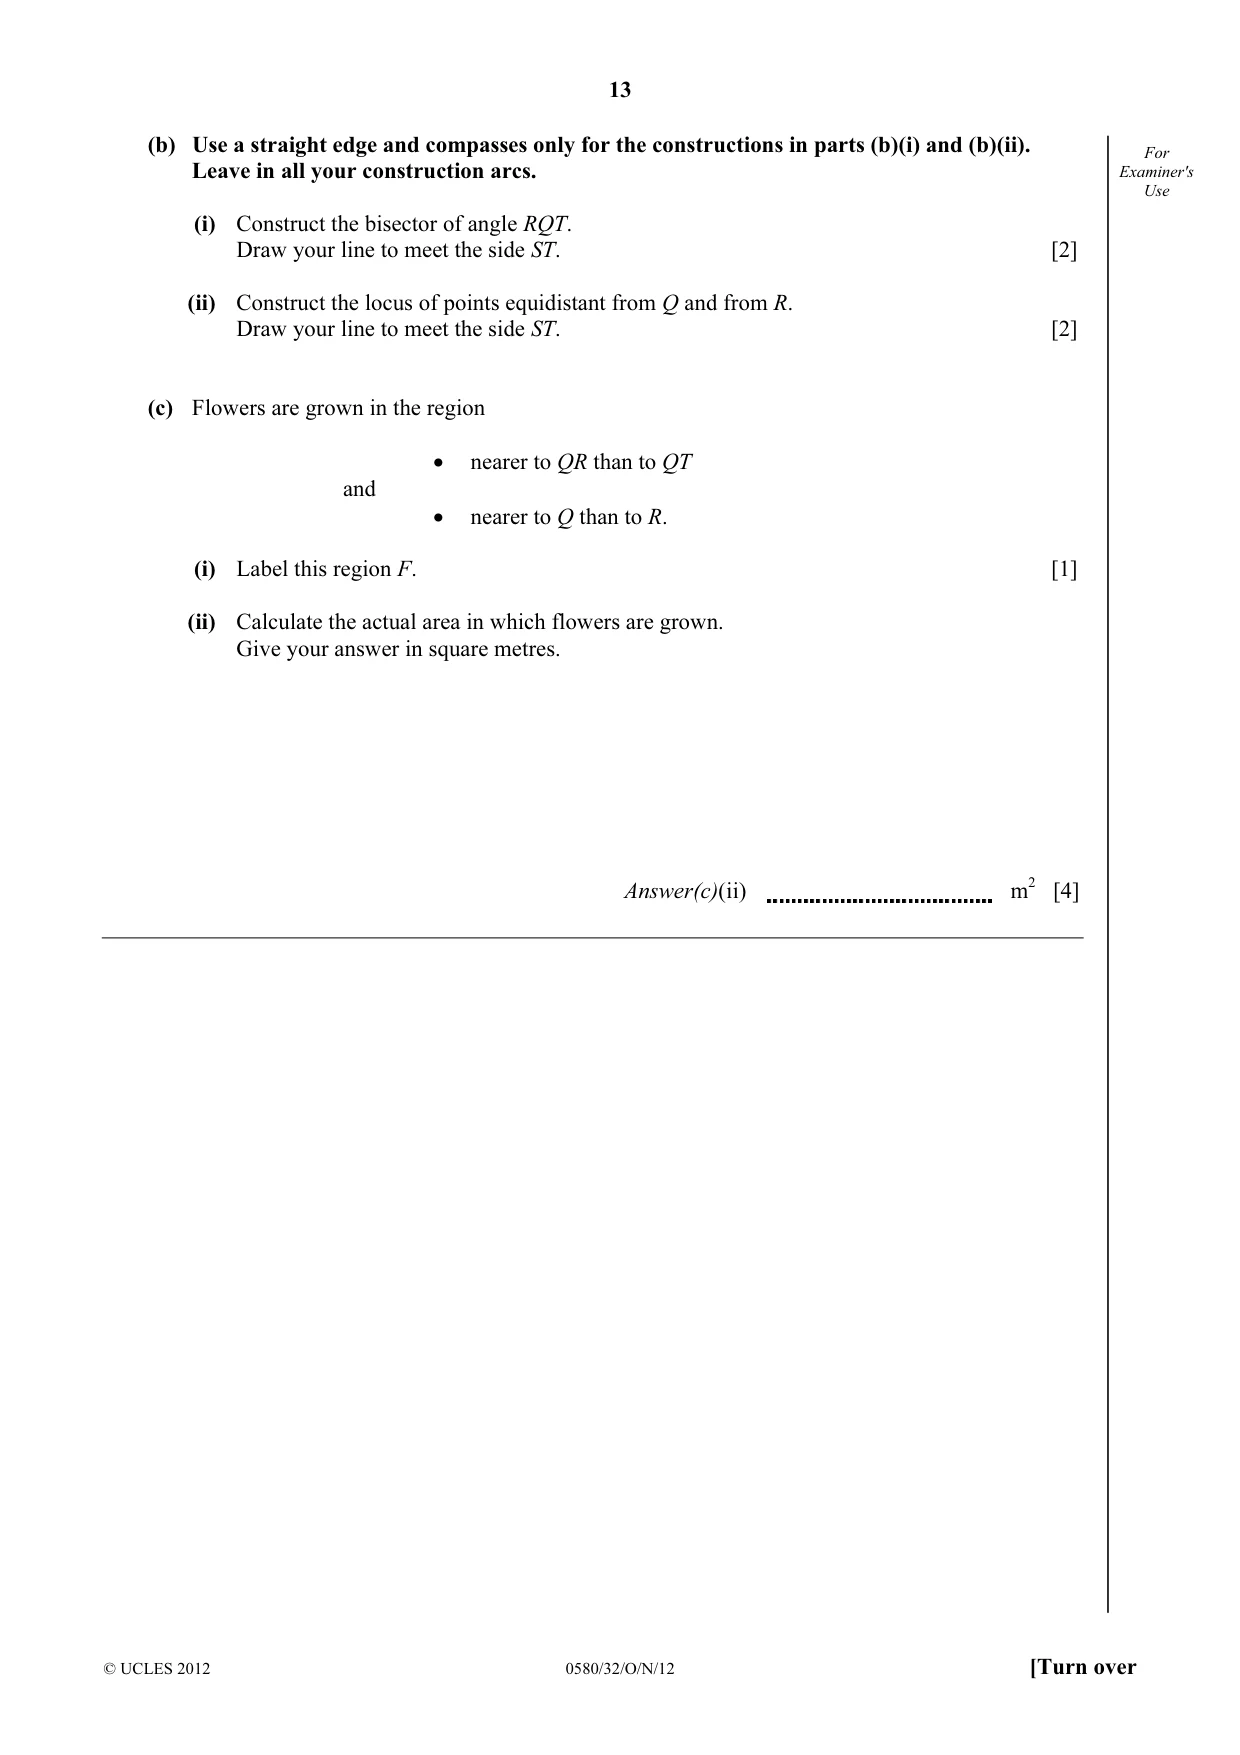
7 The diagram shows the plan of a field QRST. For The scale is 1 centimetre represents 10 metres. Examiner's Use S T Q R Scale: 1 cm = 10 m (a) Nothing is grown within 35 metres of T. Construct the boundary, inside QRST, of the region where nothing is grown. [2] (b) Use a straight edge and compasses only for the constructions in parts (b)(i) and (b)(ii). For Leave in all your construction arcs. Examiner's Use (i) Construct the bisector of angle RQT. Draw your line to meet the side ST. [2] (ii) Construct the locus of points equidistant from Q and from R. Draw your line to meet the side ST. [2] (c) Flowers are grown in the region • nearer to QR than to QT and • nearer to Q than to R. (i) Label this region F. [1] (ii) Calculate the actual area in which flowers are grown. Give your answer in square metres. Answer(c)(ii) m2 [4]
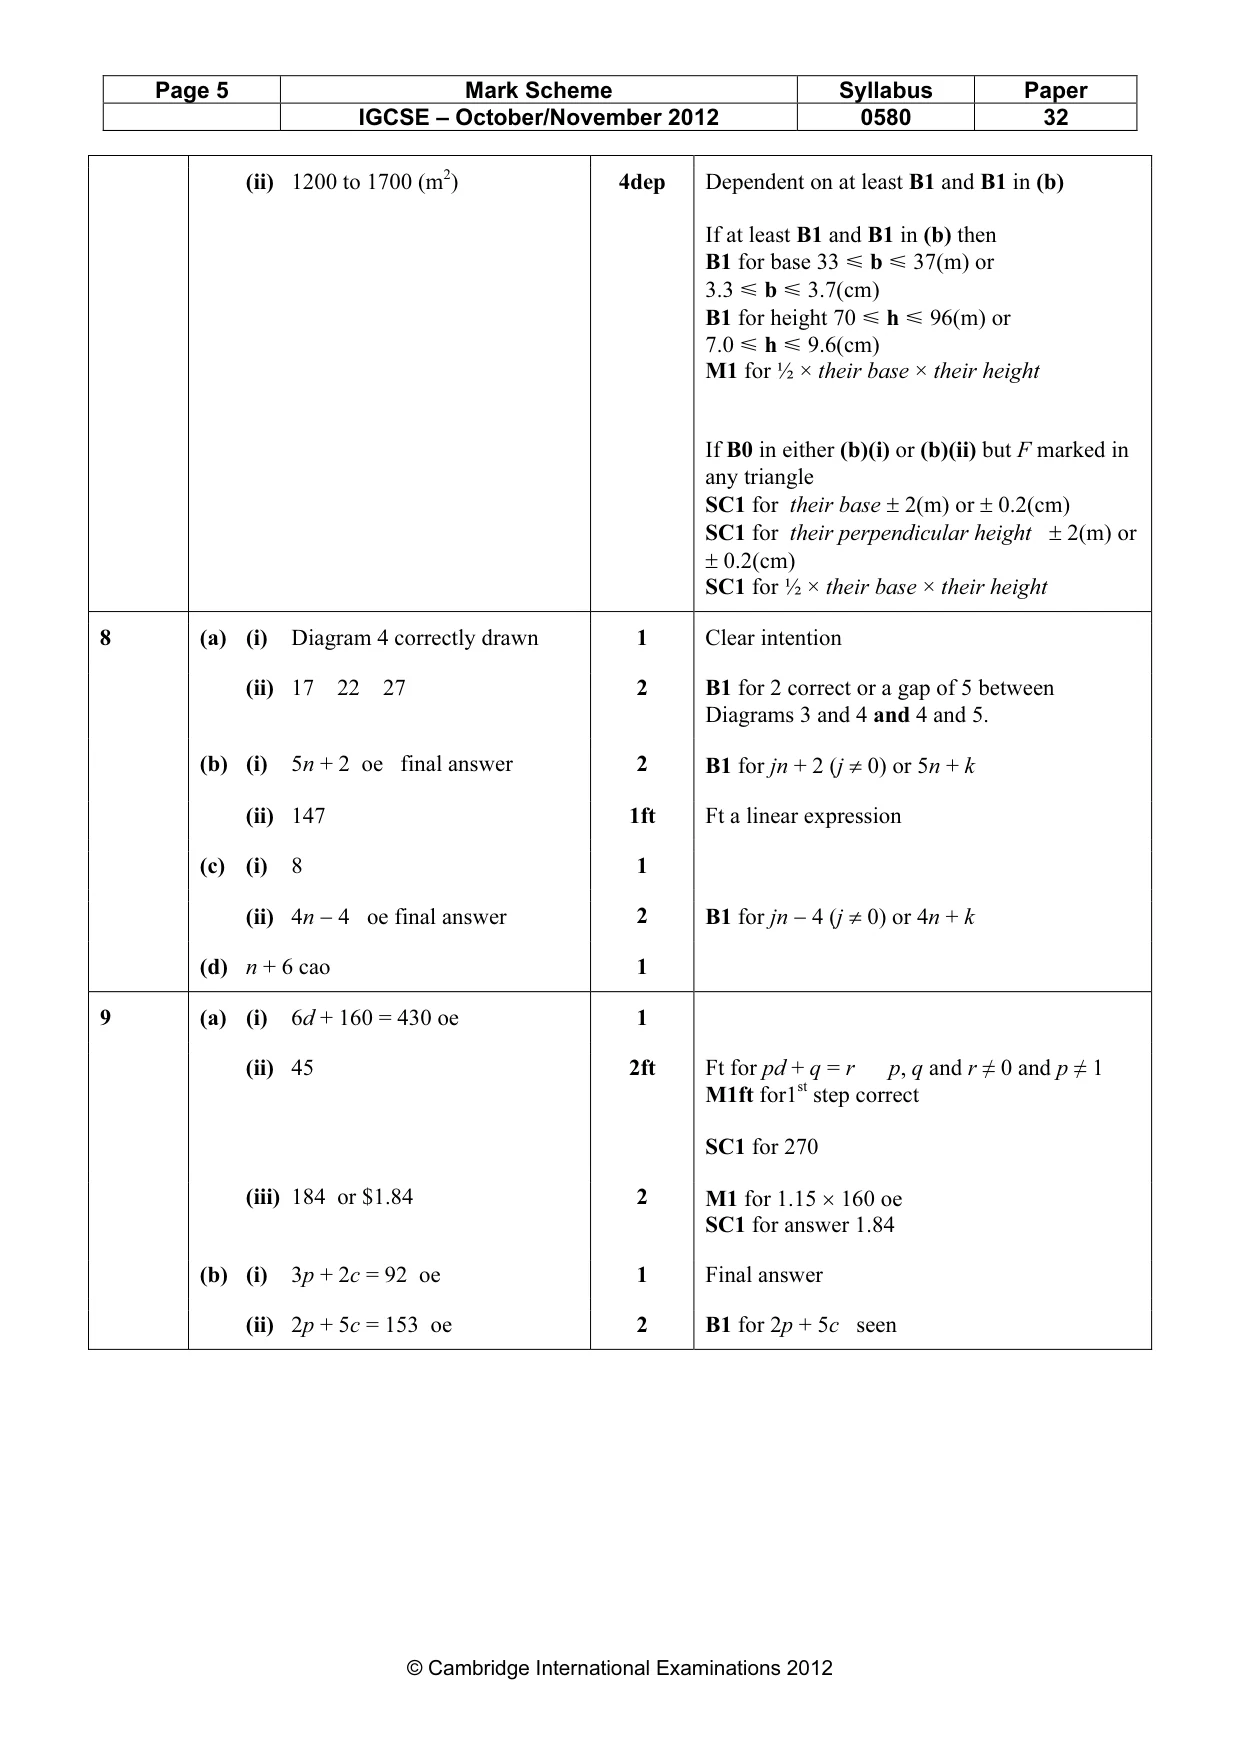
Mark scheme: 7 (a) Arc of circle 3.5 cm from T. 2 M1 for any arc, centre T. (b) (i) Correct construction with 4 2 B1 for correct but without 4 arcs correct arcs (ii) Bisector of QR with 2 pairs of 2 B1 for correct but without 2 pairs of arcs arcs. (c) (i) F in correct region 1dep Dependent on at least B1 and B1 in (b) IGCSE – October/November 2012 0580 32 (ii) 1200 to 1700 (m2) 4dep Dependent on at least B1 and B1 in (b) If at least B1 and B1 in (b) then B1 for base 33 Y b Y 37(m) or 3.3 Y b Y 3.7(cm) B1 for height 70 Y h Y 96(m) or 7.0 Y h Y 9.6(cm) M1 for ½ × their base × their height If B0 in either (b)(i) or (b)(ii) but F marked in any triangle SC1 for their base ± 2(m) or ± 0.2(cm) SC1 for their perpendicular height ± 2(m) or ± 0.2(cm) SC1 for ½ × their base × their height
Q8 · For Examiner's Use Diagram 1 Diagram 2 Diagram 3 Diagram 4 (a) This pattern of diagrams…
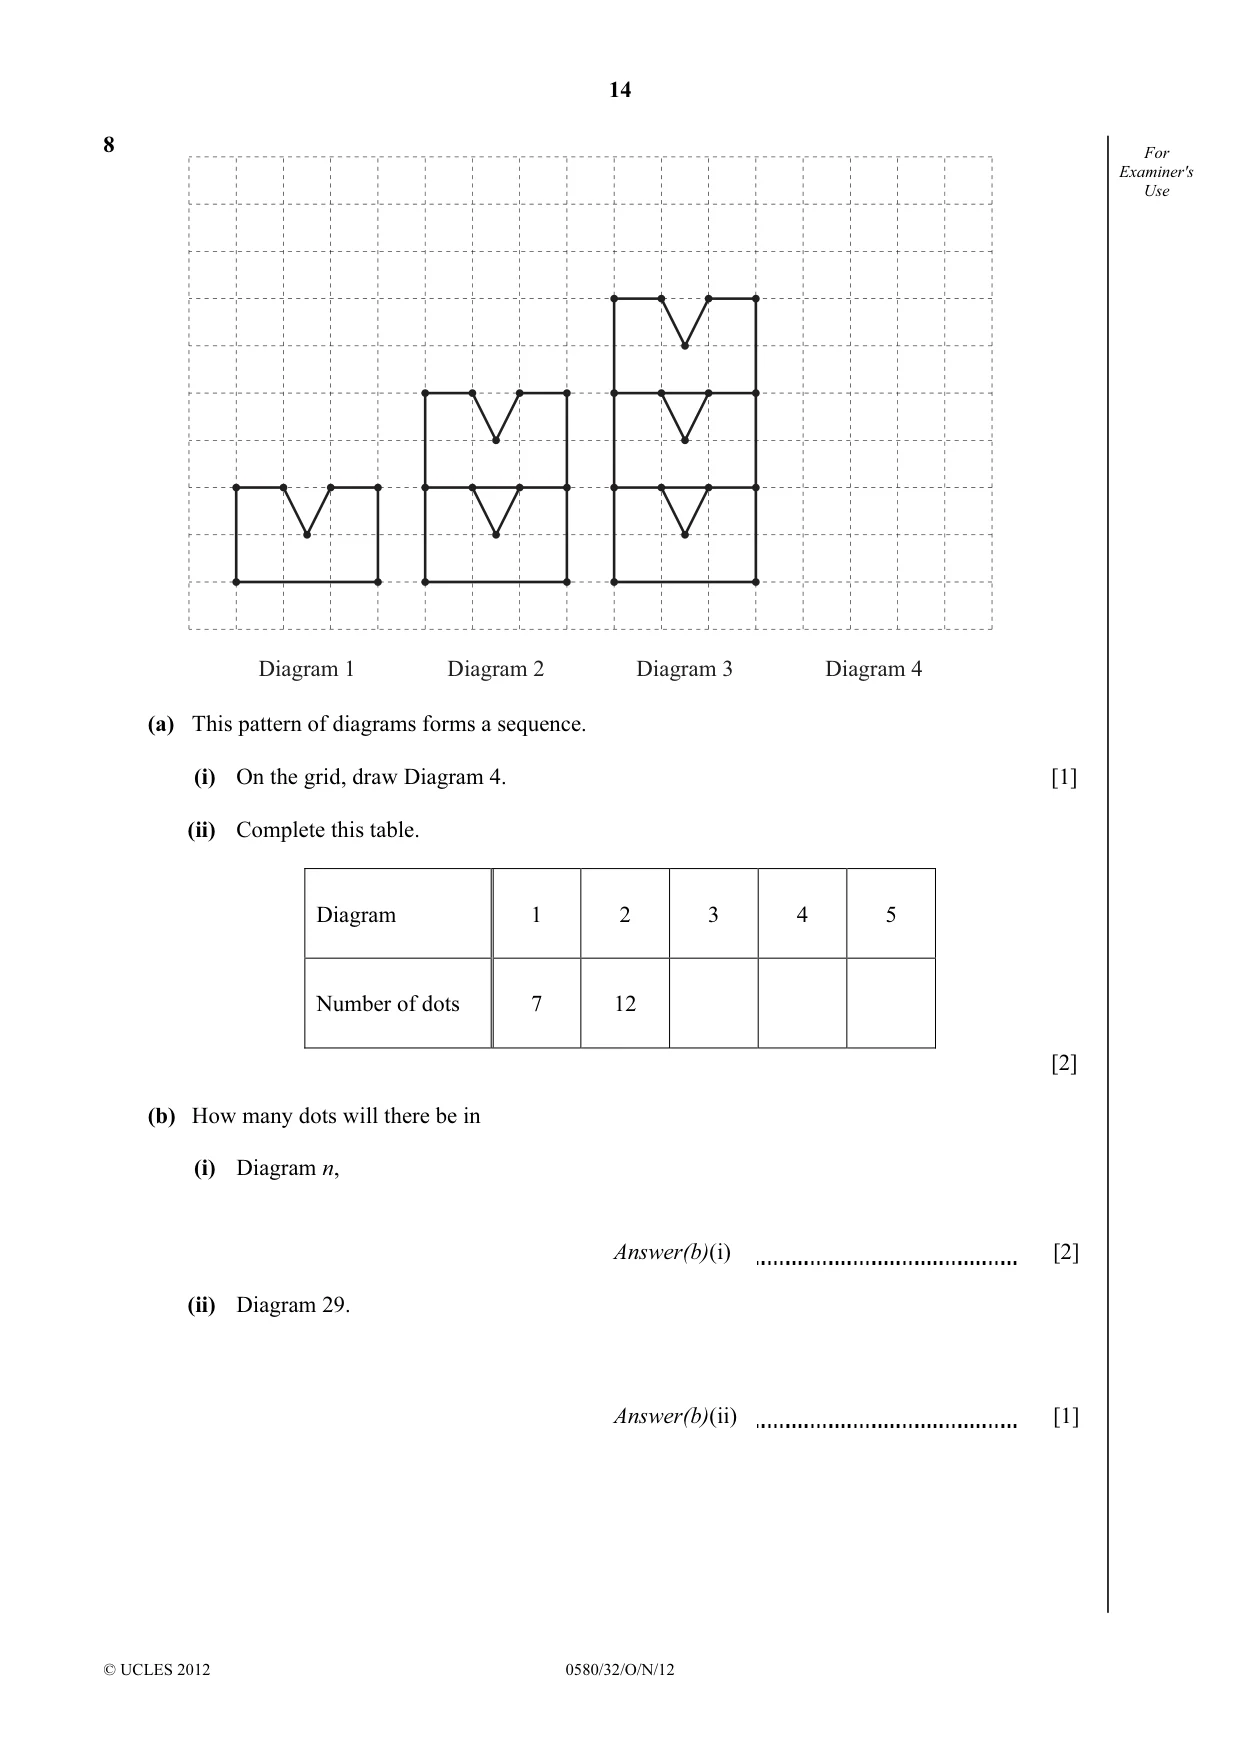
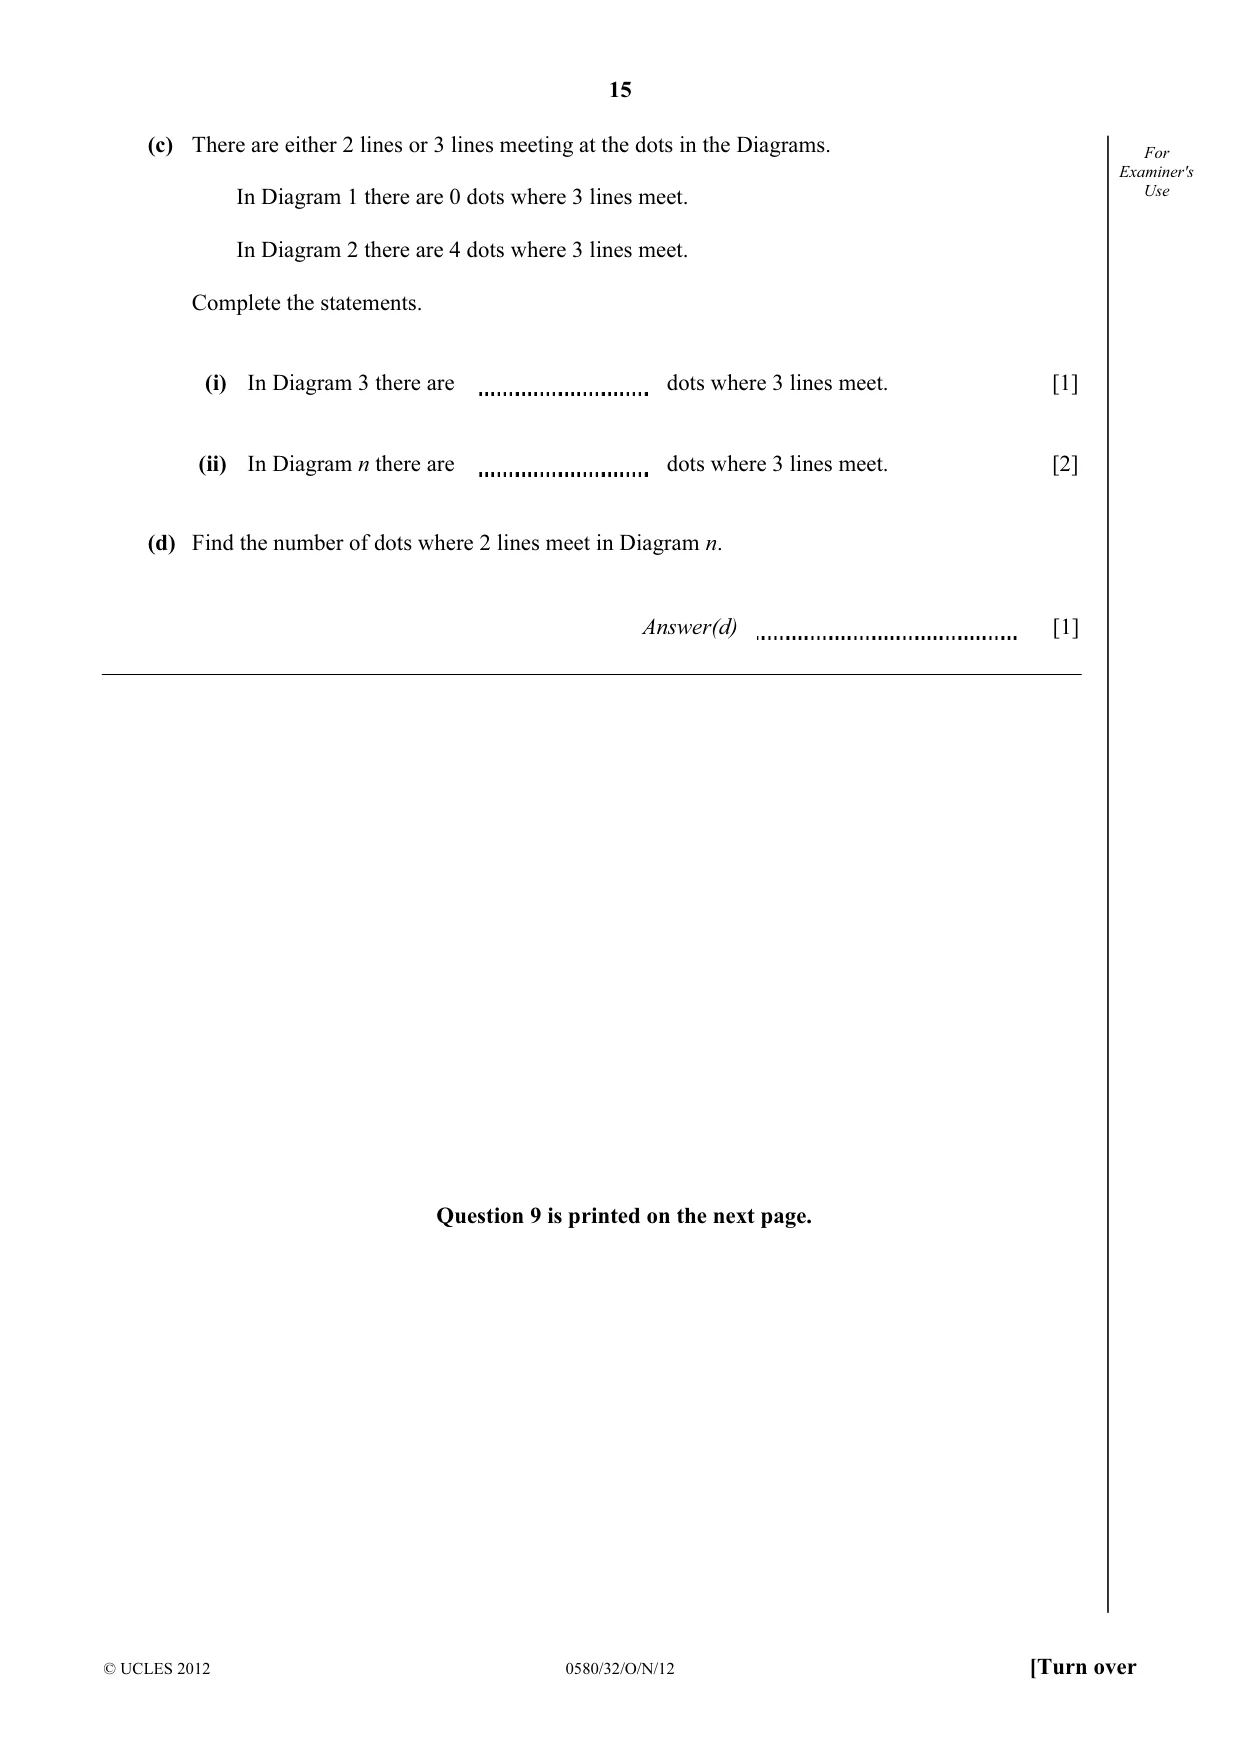
8 For Examiner's Use Diagram 1 Diagram 2 Diagram 3 Diagram 4 (a) This pattern of diagrams forms a sequence. (i) On the grid, draw Diagram 4. [1] (ii) Complete this table. Diagram 1 2 3 4 5 Number of dots 7 12 [2] (b) How many dots will there be in (i) Diagram n, Answer(b)(i) [2] (ii) Diagram 29. Answer(b)(ii) [1] (c) There are either 2 lines or 3 lines meeting at the dots in the Diagrams. For Examiner's Use In Diagram 1 there are 0 dots where 3 lines meet. In Diagram 2 there are 4 dots where 3 lines meet. Complete the statements. (i) In Diagram 3 there are dots where 3 lines meet. [1] (ii) In Diagram n there are dots where 3 lines meet. [2] (d) Find the number of dots where 2 lines meet in Diagram n. Answer(d) [1] Question 9 is printed on the next page.
Mark scheme: 8 (a) (i) Diagram 4 correctly drawn 1 Clear intention (ii) 17 22 27 2 B1 for 2 correct or a gap of 5 between Diagrams 3 and 4 and 4 and 5. (b) (i) 5n + 2 oe final answer 2 B1 for jn + 2 (j ≠ 0) or 5n + k (ii) 147 1ft Ft a linear expression (c) (i) 8 1 (ii) 4n − 4 oe final answer 2 B1 for jn − 4 (j ≠ 0) or 4n + k (d) n + 6 cao 1
Q9 · Each day from Monday to Saturday Caroline buys a newspaper, costing d cents
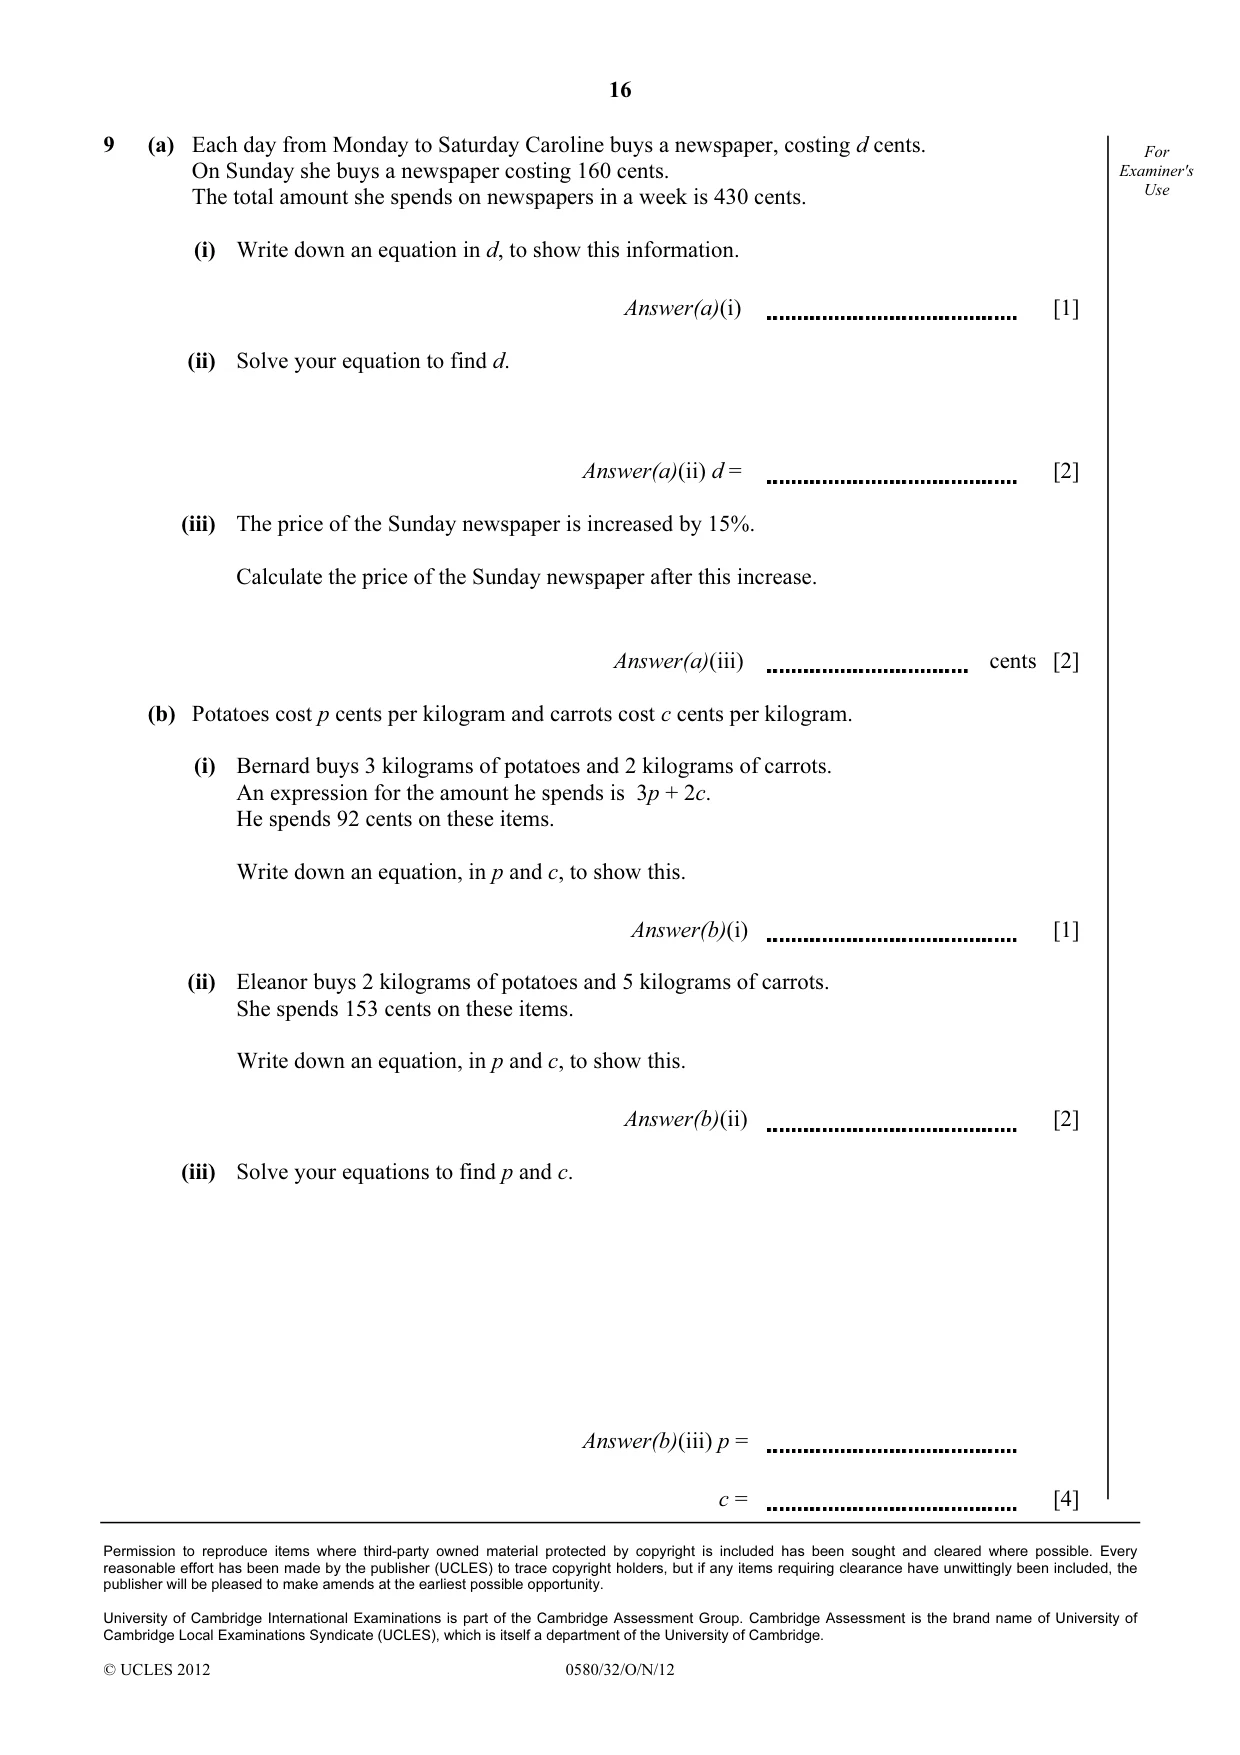
9 (a) Each day from Monday to Saturday Caroline buys a newspaper, costing d cents. For On Sunday she buys a newspaper costing 160 cents. Examiner's Use The total amount she spends on newspapers in a week is 430 cents. (i) Write down an equation in d, to show this information. Answer(a)(i) [1] (ii) Solve your equation to find d. Answer(a)(ii) d = [2] (iii) The price of the Sunday newspaper is increased by 15%. Calculate the price of the Sunday newspaper after this increase. Answer(a)(iii) cents [2] (b) Potatoes cost p cents per kilogram and carrots cost c cents per kilogram. (i) Bernard buys 3 kilograms of potatoes and 2 kilograms of carrots. An expression for the amount he spends is 3p + 2c. He spends 92 cents on these items. Write down an equation, in p and c, to show this. Answer(b)(i) [1] (ii) Eleanor buys 2 kilograms of potatoes and 5 kilograms of carrots. She spends 153 cents on these items. Write down an equation, in p and c, to show this. Answer(b)(ii) [2] (iii) Solve your equations to find p and c. Answer(b)(iii) p = c = [4]
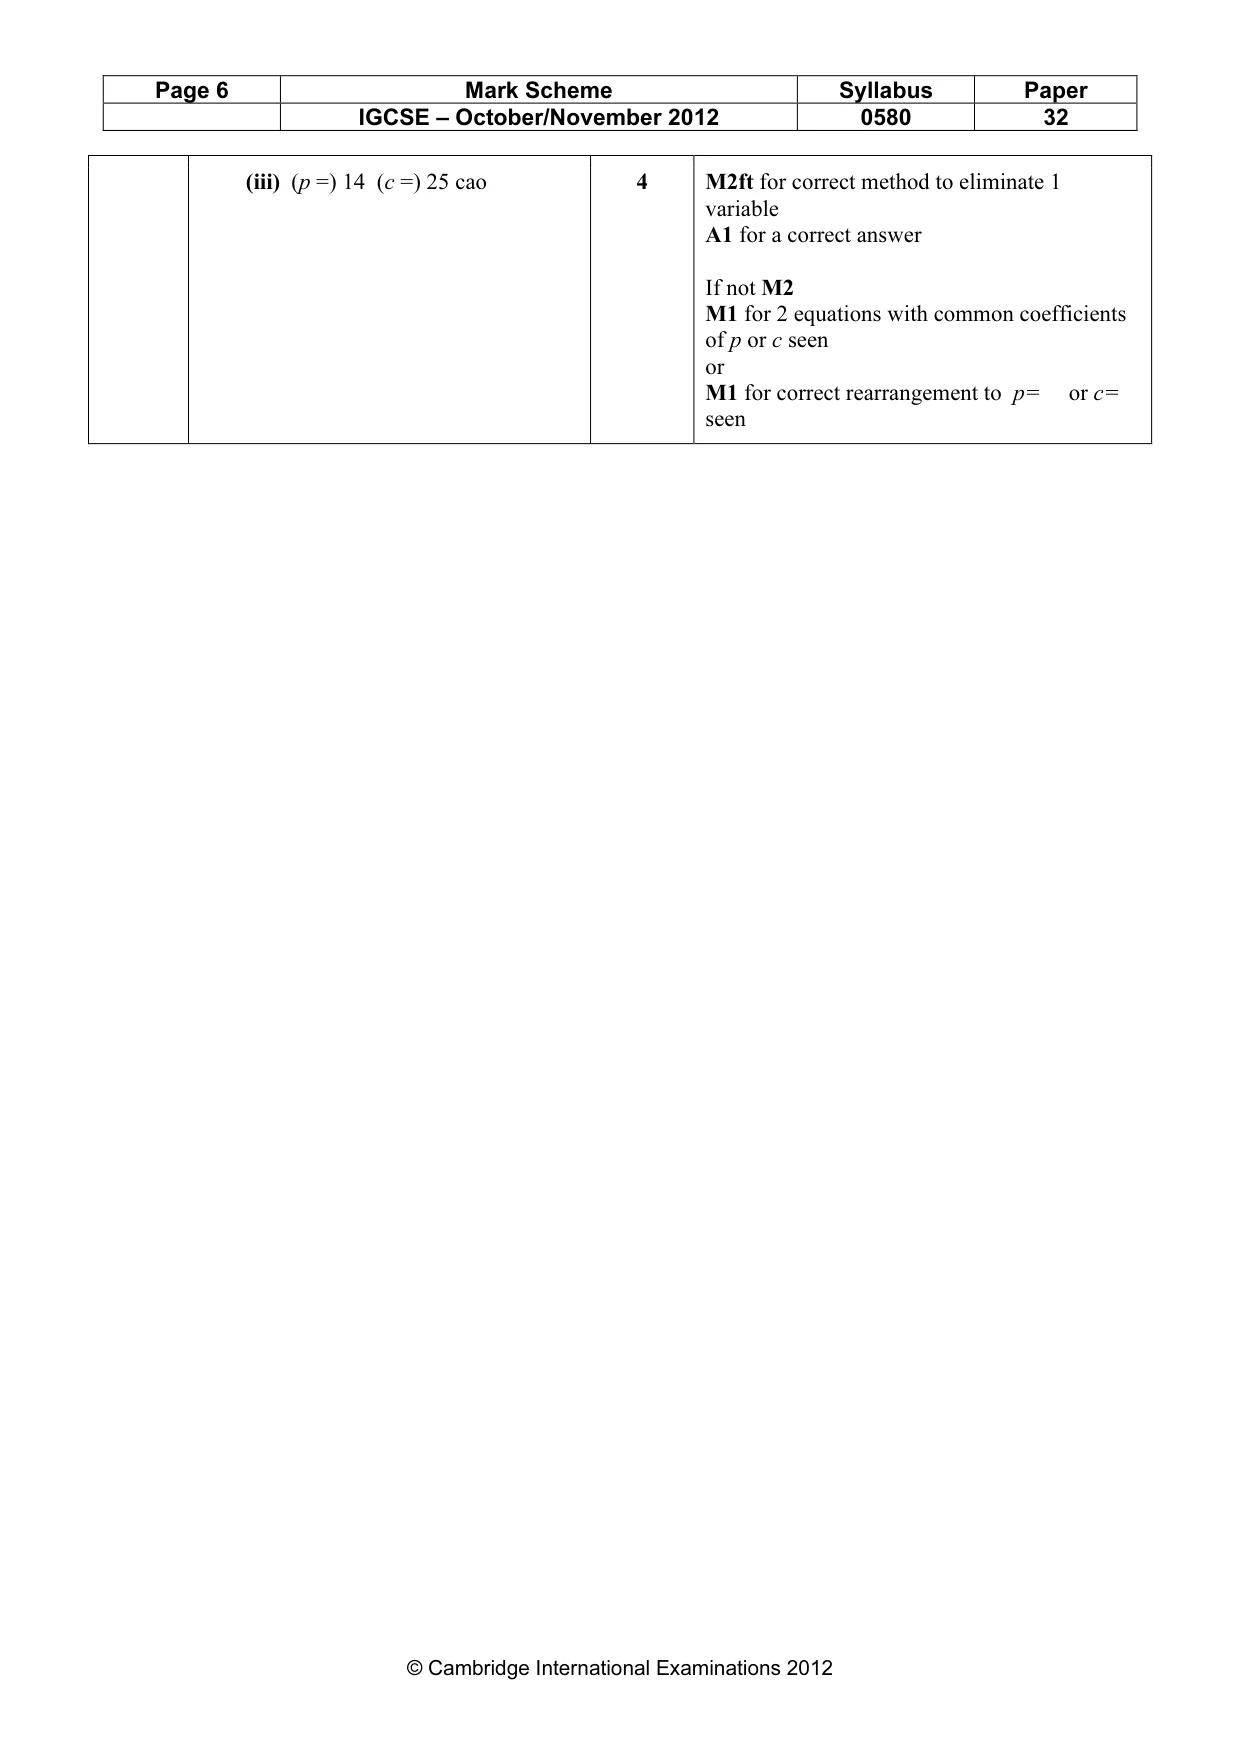
Mark scheme: 9 (a) (i) 6d + 160 = 430 oe 1 (ii) 45 2ft Ft for pd + q = r p, q and r ≠ 0 and p ≠ 1 M1ft for1st step correct SC1 for 270 (iii) 184 or $1.84 2 M1 for 1.15 × 160 oe SC1 for answer 1.84 (b) (i) 3p + 2c = 92 oe 1 Final answer (ii) 2p + 5c = 153 oe 2 B1 for 2p + 5c seen IGCSE – October/November 2012 0580 32 (iii) (p =) 14 (c =) 25 cao 4 M2ft for correct method to eliminate 1 variable A1 for a correct answer If not M2 M1 for 2 equations with common coefficients of p or c seen or M1 for correct rearrangement to p= or c= seen
What was in this paper
The subtopics covered by these 9 questions, and how many questions each got. Open one in a new tab to see every Cambridge question on it.