Cambridge IGCSE Mathematics 0580 — 2025 Oct/Nov Paper 3 · Variant 2
0580/32/O/N/25 · 28 questions · 80 marks · 90 min
The question paper and its mark scheme, free to read here and free to download. This is Cambridge’s own paper, exactly as it was sat.
Question paper16 pages
Mark scheme10 pages
Answers below. Sit the paper first if you are practising.
Questions as text
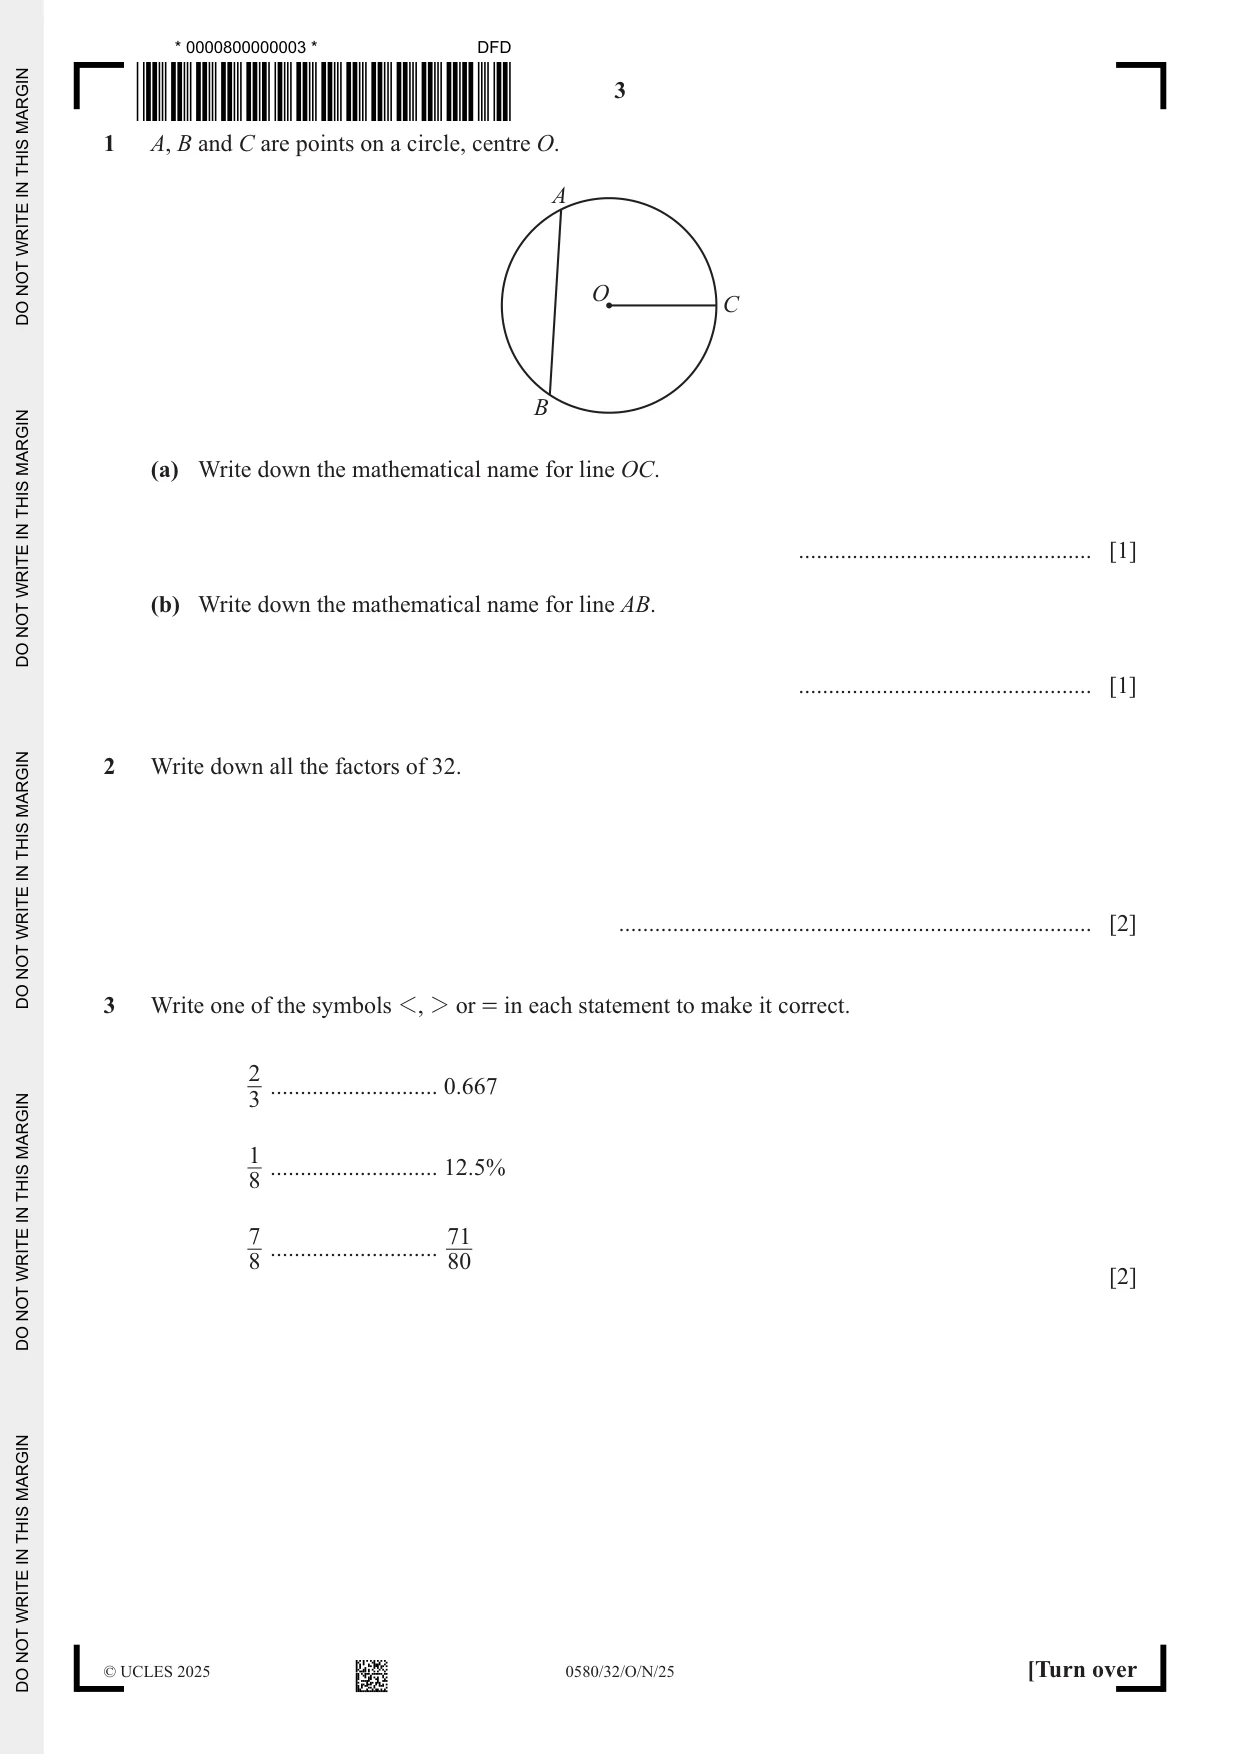
Q1 · A, B and C are points on a circle, centre O
1 A, B and C are points on a circle, centre O. A O C B (a) Write down the mathematical name for line OC. ................................................. [1] (b) Write down the mathematical name for line AB. ................................................. [1]
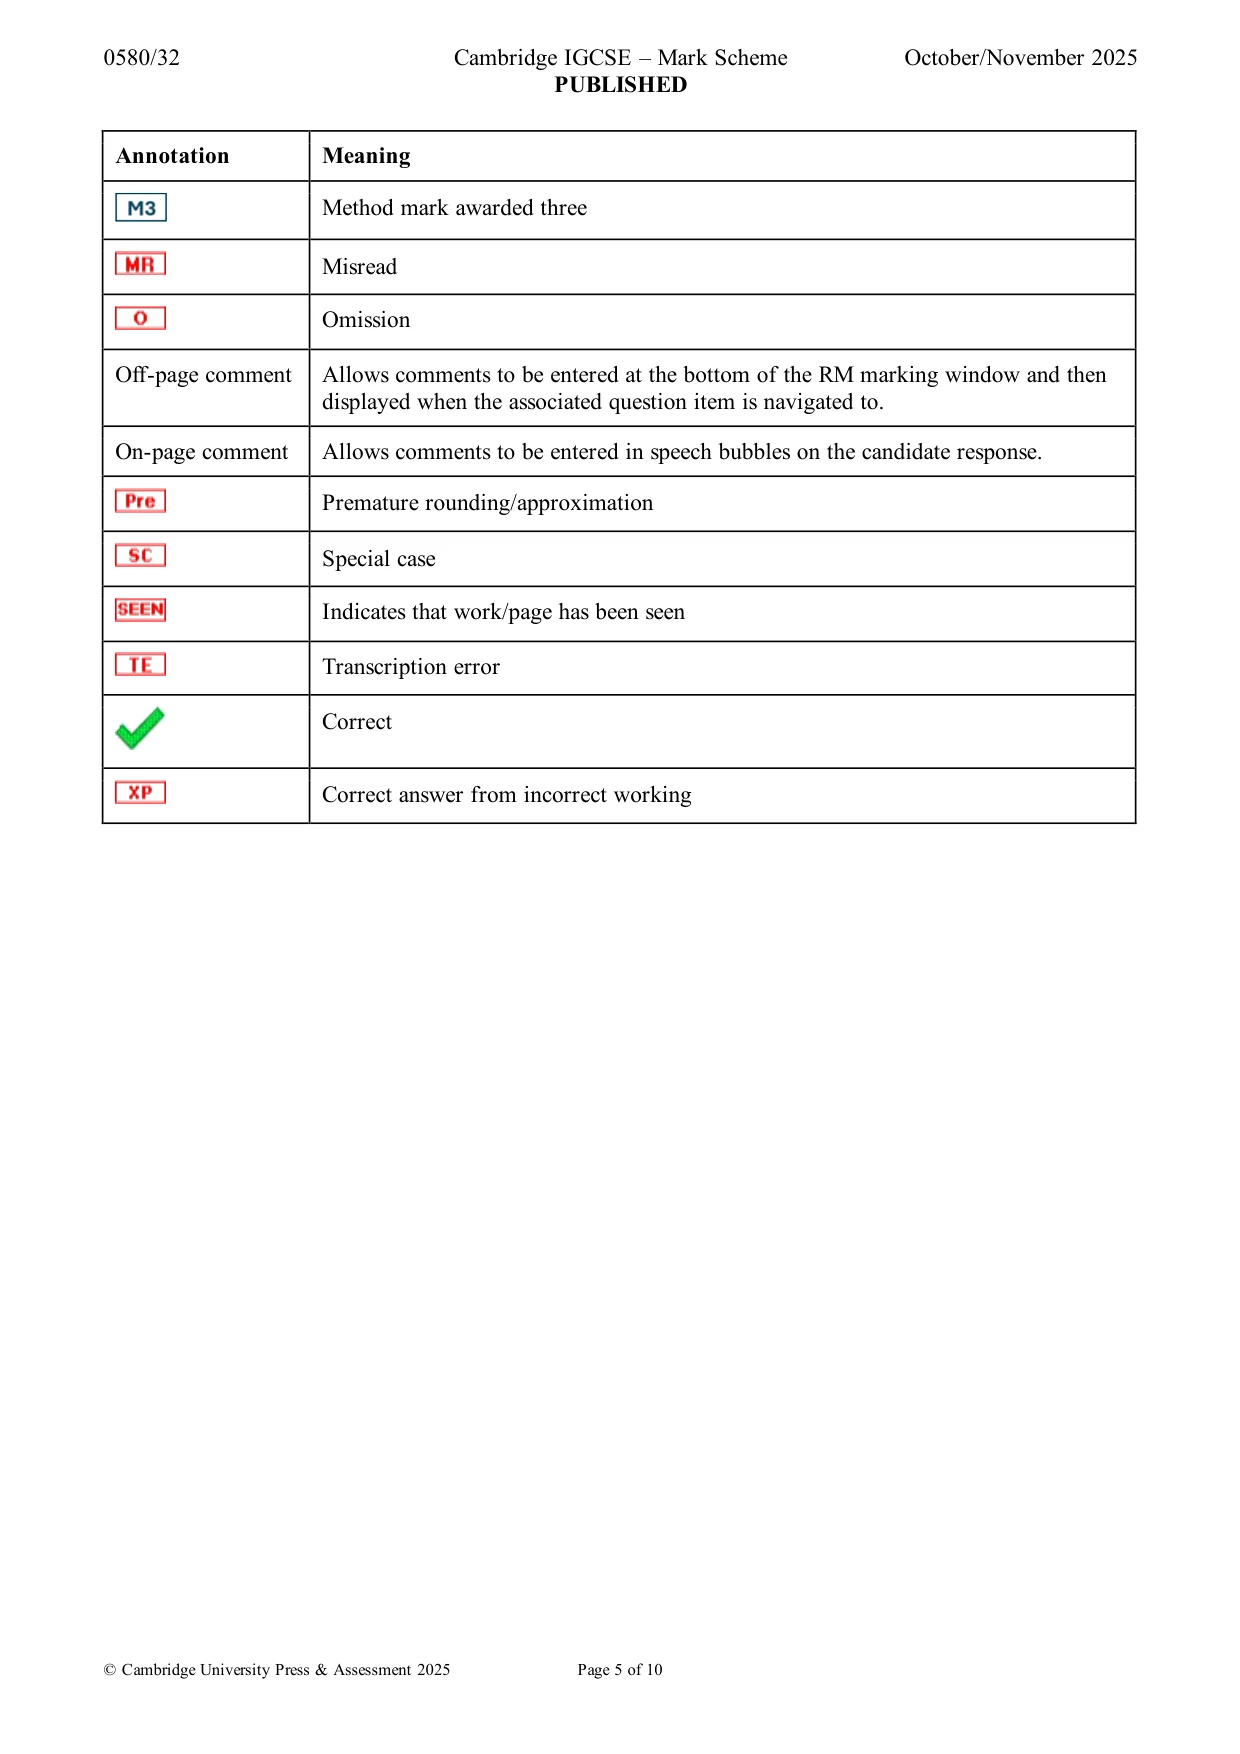
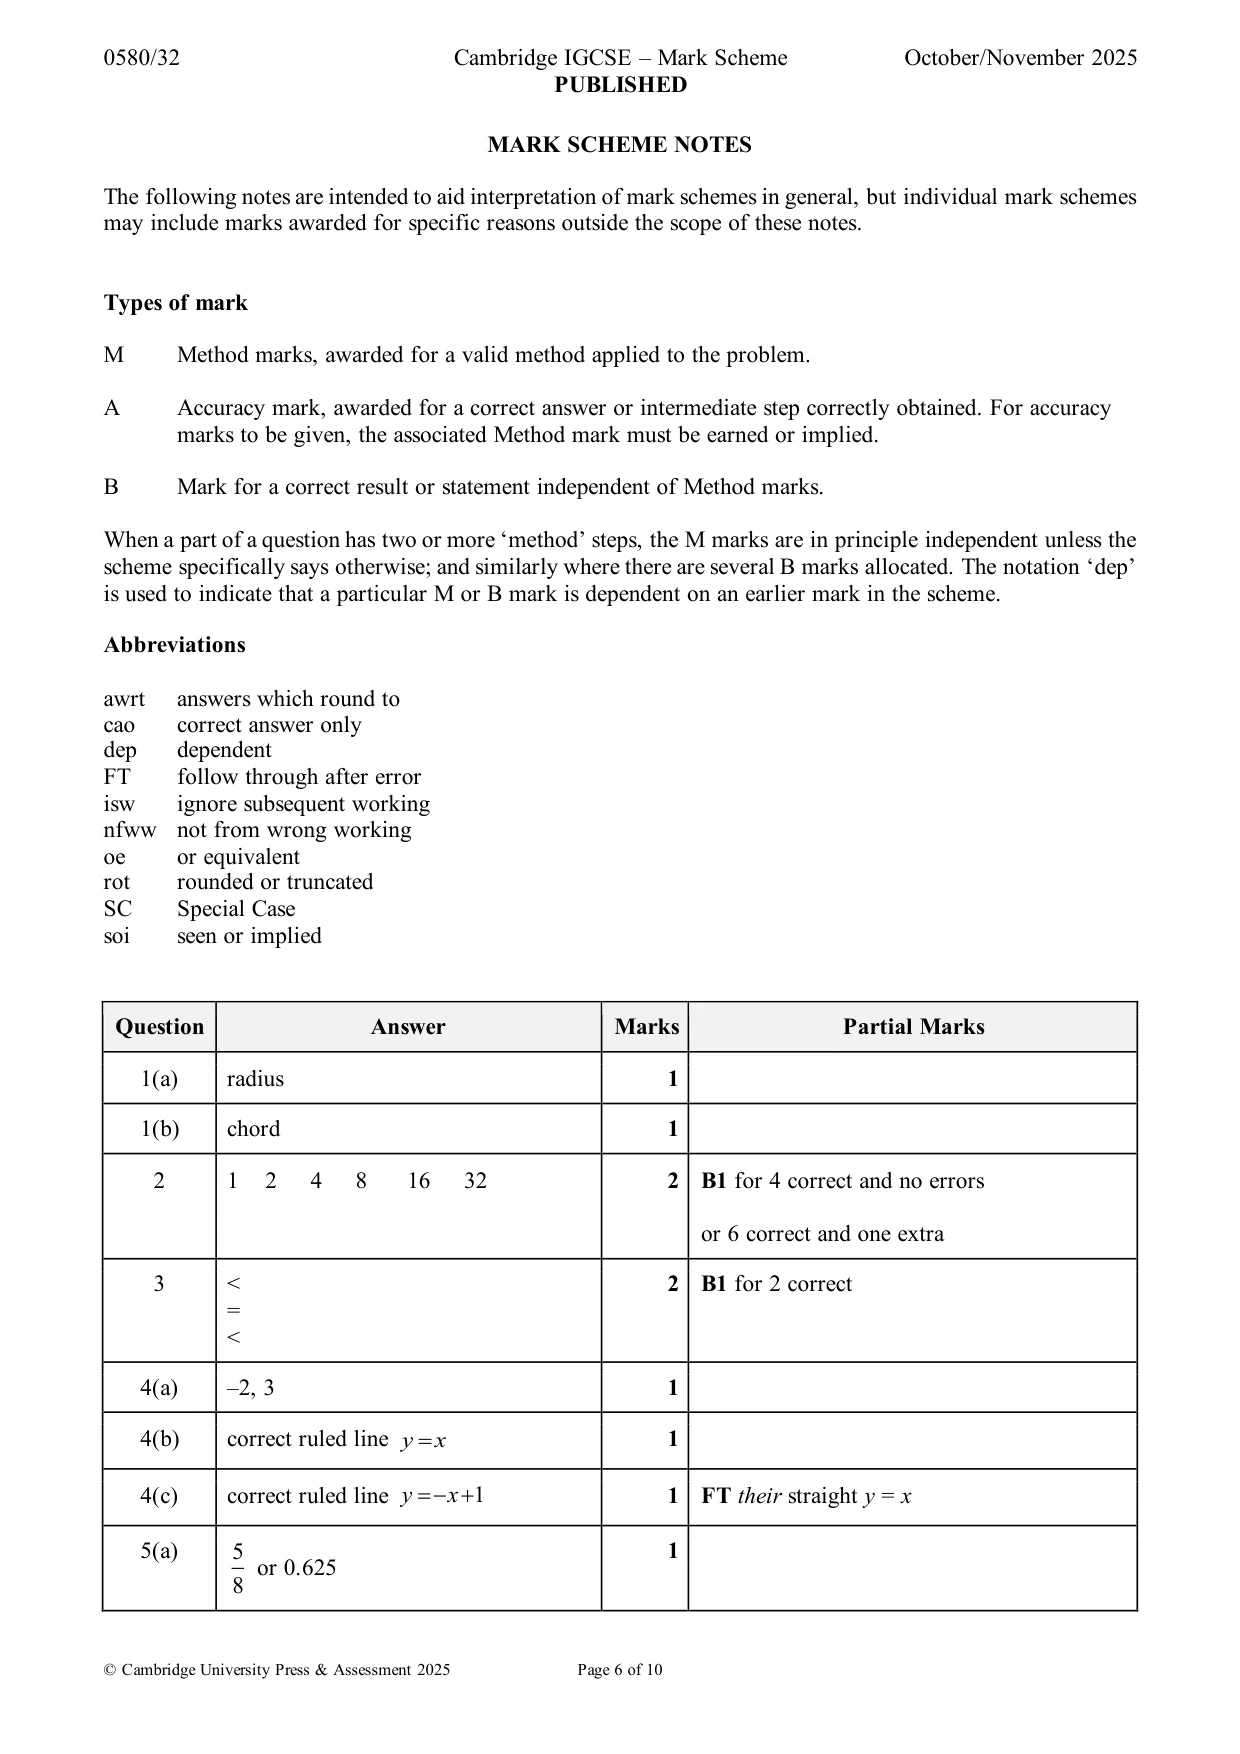
Mark scheme: Question Answer Marks Partial Marks 1(a) radius 1 1(b) chord 1
Q2 · Write down all the factors of 32
2 Write down all the factors of 32. ............................................................................... [2]
Mark scheme: 2 1 2 4 8 16 32 2 B1 for 4 correct and no errors or 6 correct and one extra
Q3 · Write one of the symbols 1, 2 or = in each statement to make it correct
3 Write one of the symbols 1, 2 or = in each statement to make it correct. 2 ............................ 0.667 3 1 ............................ 12.5% 8 7 71 ............................ 8 80 [2]
Mark scheme: 3 < 2 B1 for 2 correct = <
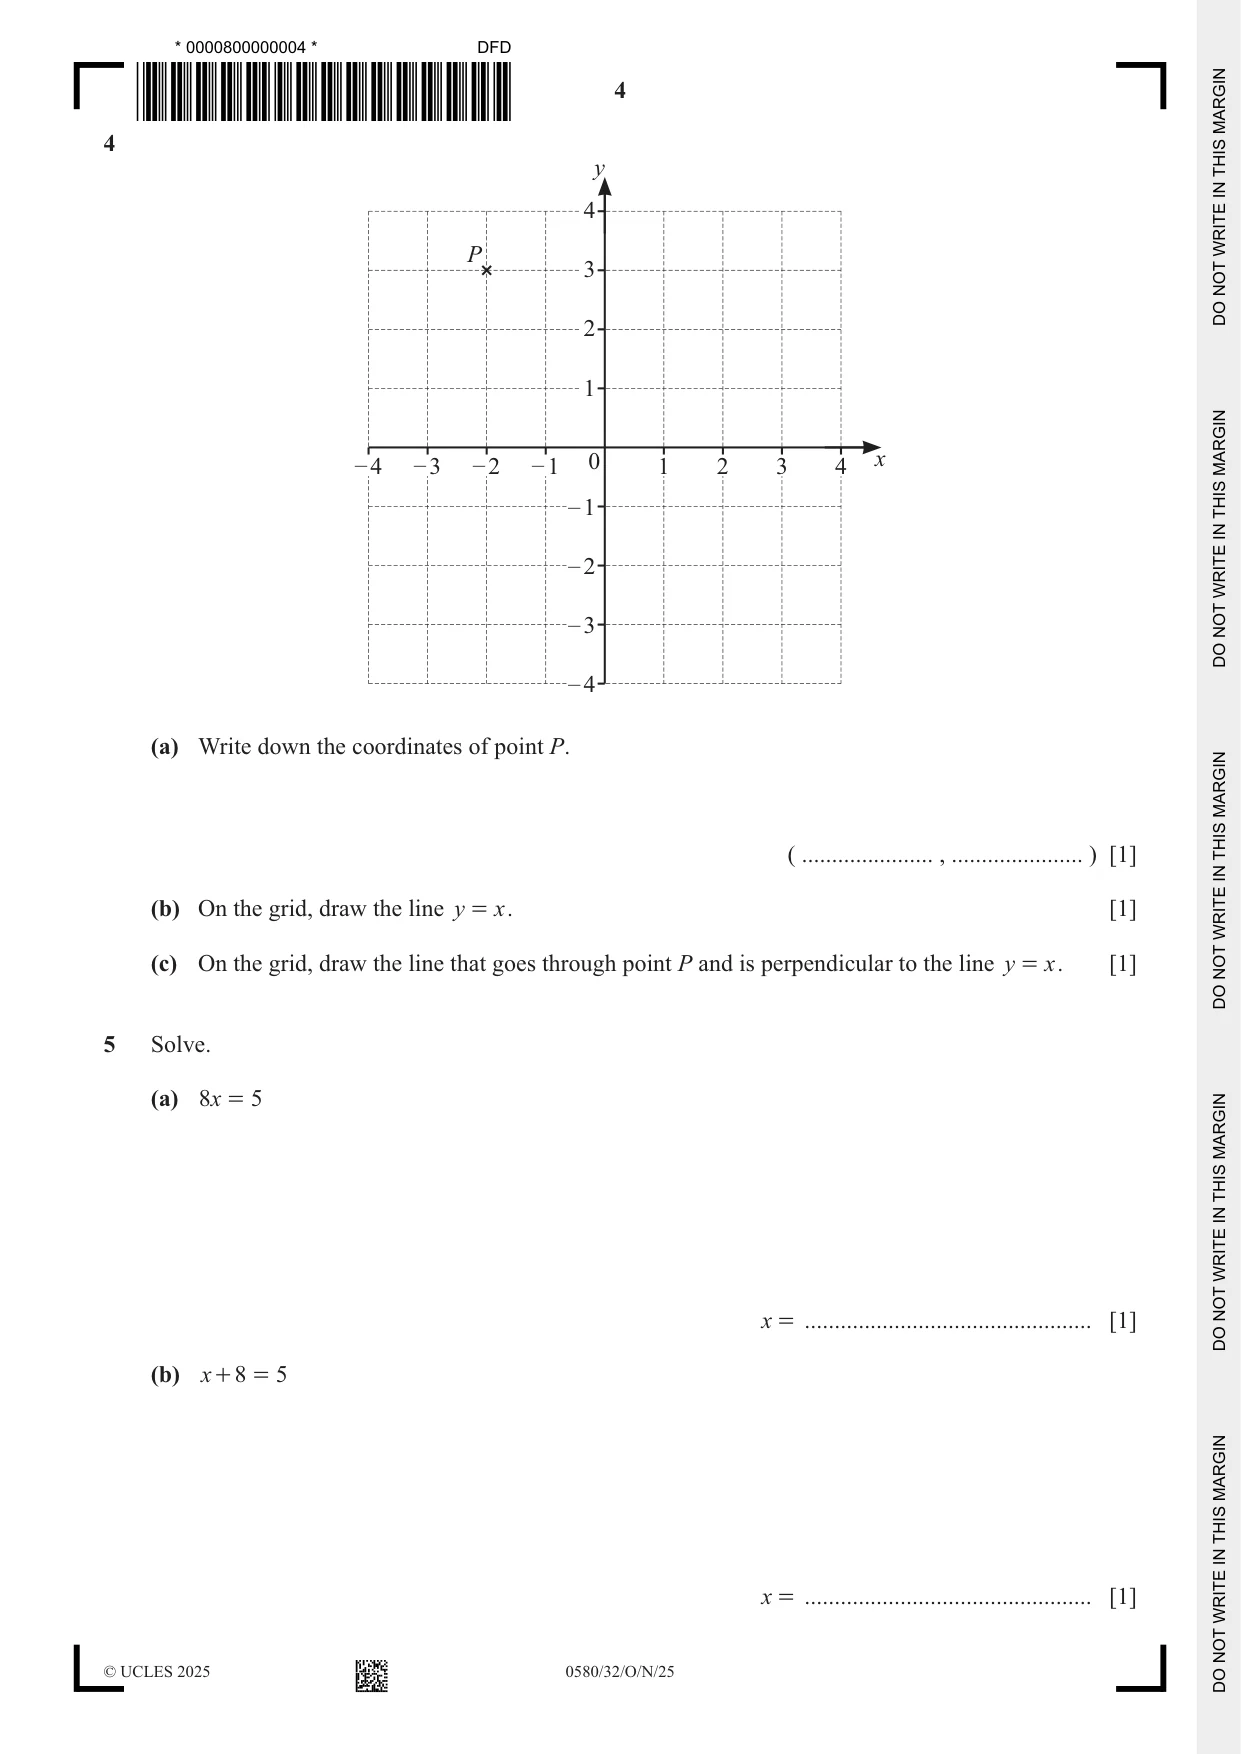
Q4 · Y 4 P 3 2 1 – 4 – 3 – 2 – 1 0 1 2 3 4 x – 1 – 2 – 3 – 4 (a) Write down the coordinates of…
4 y 4 P 3 2 1 – 4 – 3 – 2 – 1 0 1 2 3 4 x – 1 – 2 – 3 – 4 (a) Write down the coordinates of point P. ( ...................... , ...................... ) [1] (b) On the grid, draw the line y = x . [1] (c) On the grid, draw the line that goes through point P and is perpendicular to the line y = x . [1]
Mark scheme: 4(a) –2, 3 1 4(b) correct ruled line y = x 1 4(c) correct ruled line y =−+x 1 1 FT their straight y = x
Question 5
5 Solve. (a) 8x = 5 x = ................................................ [1] (b) x + 8 = 5 x = ................................................ [1]
Mark scheme: 5(a) 5 1 or 0.625 8 5(b) −3 1
Q6 · 0 1 8 27 39 51 59 81 From the list of numbers, write down (a) a square number…
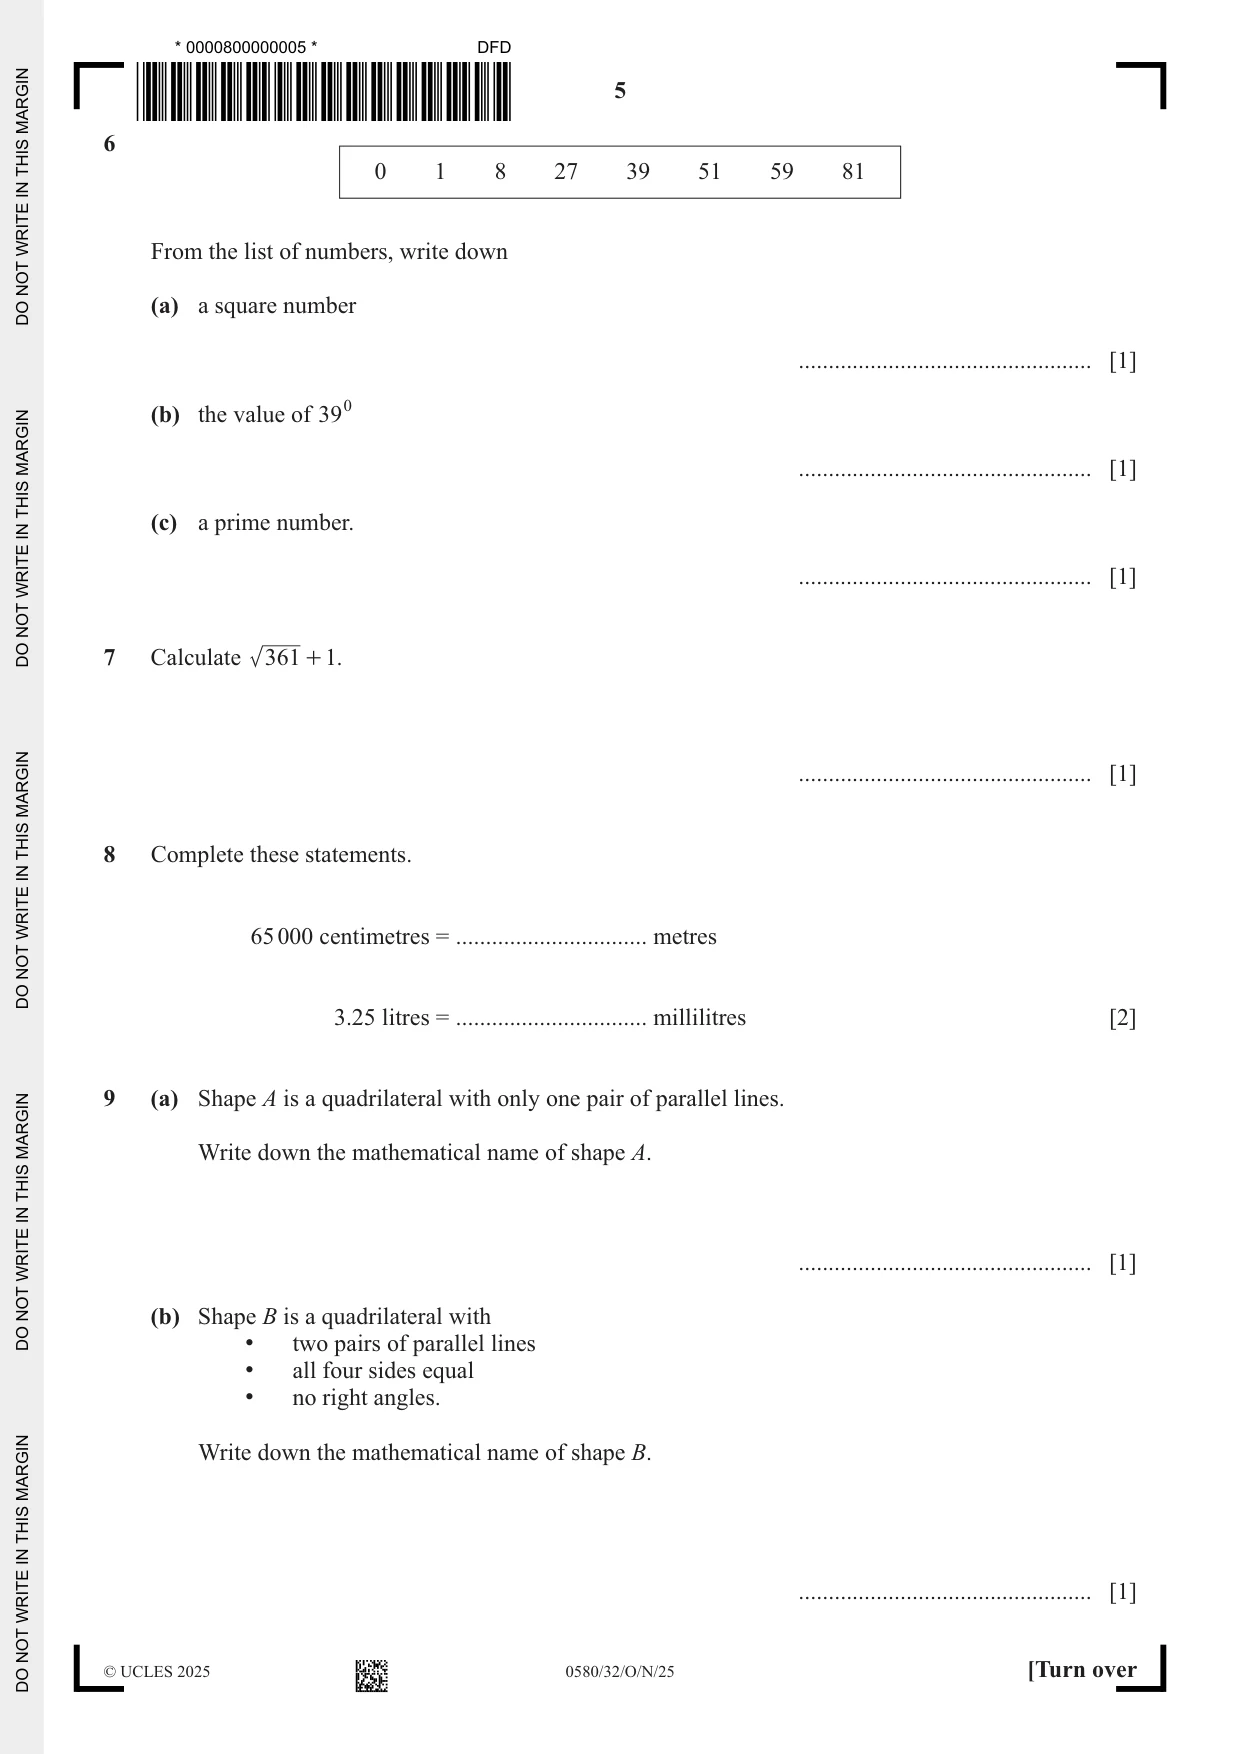
6 0 1 8 27 39 51 59 81 From the list of numbers, write down (a) a square number ................................................. [1] (b) the value of 390 ................................................. [1] (c) a prime number. ................................................. [1]
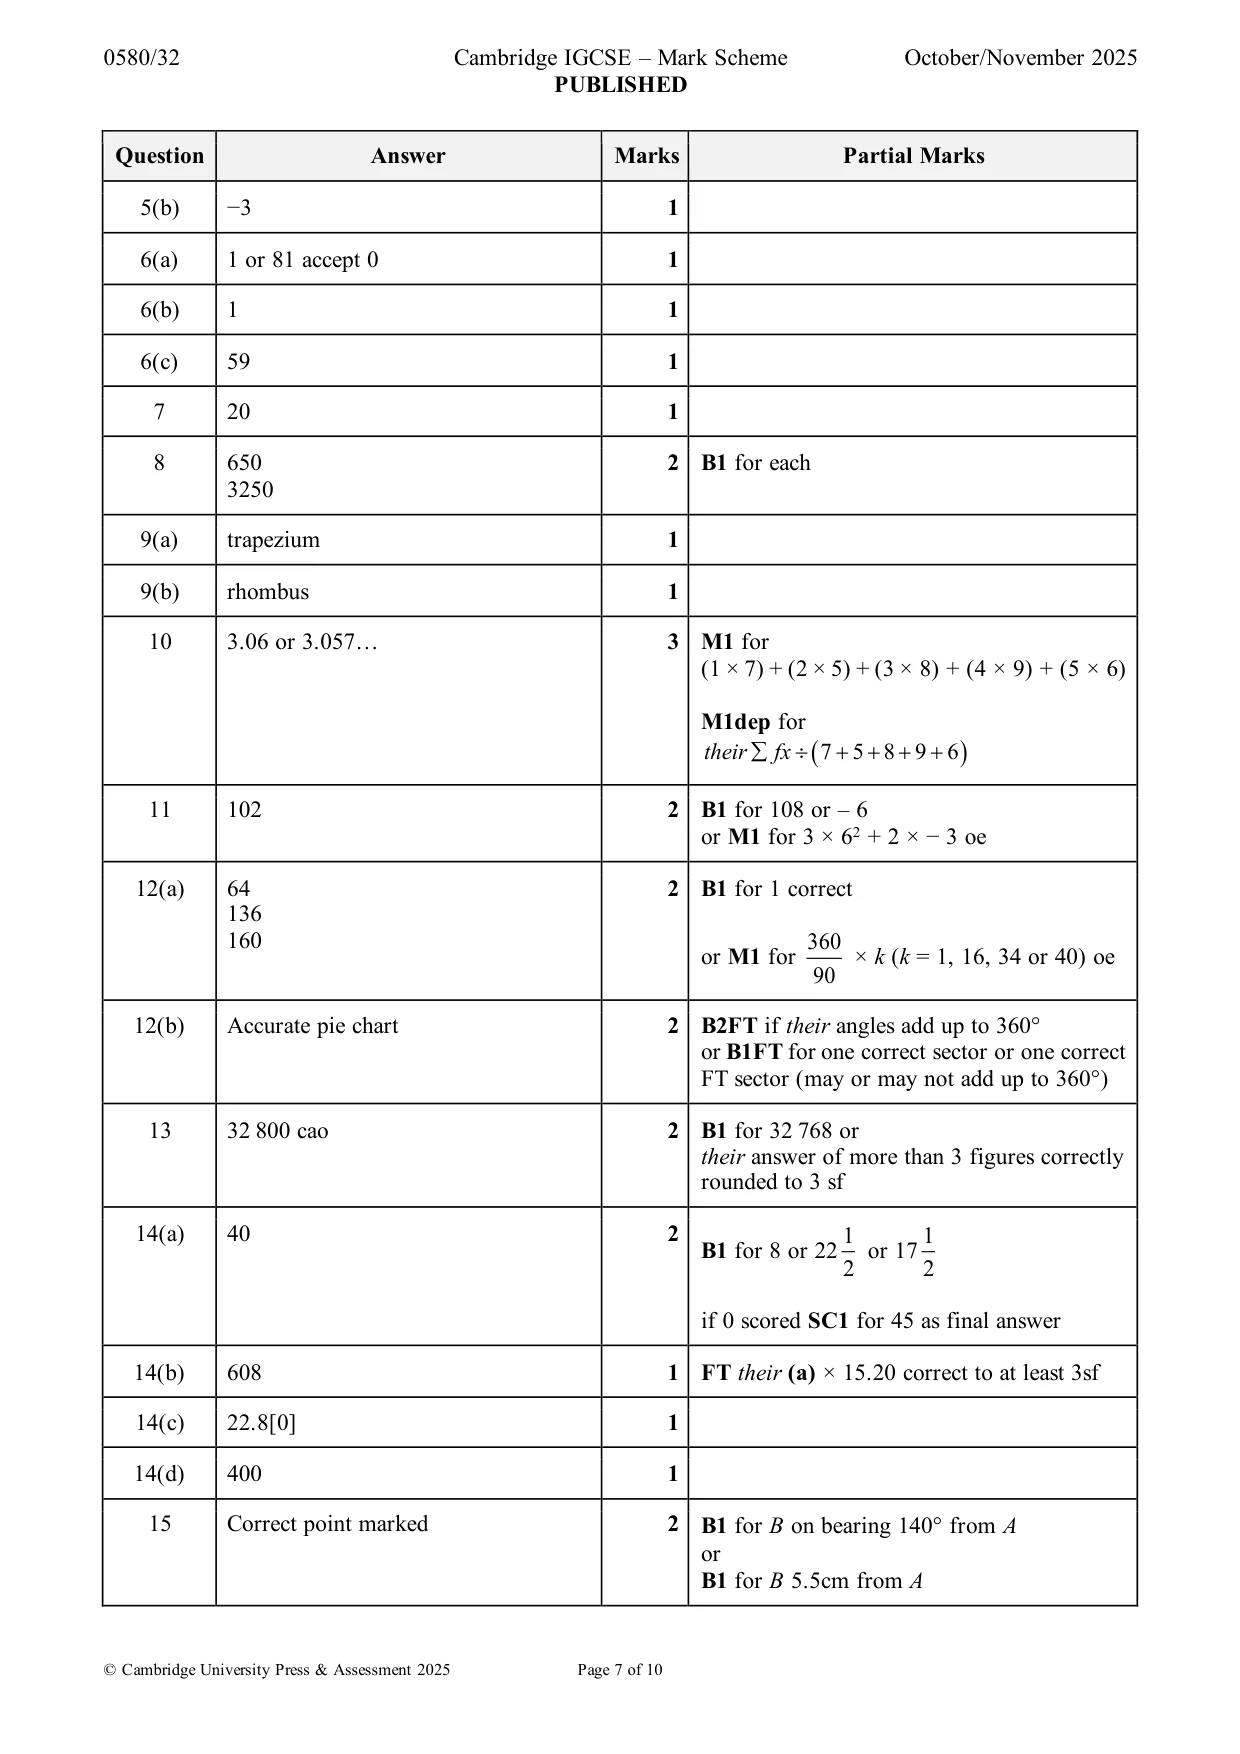
Mark scheme: 6(a) 1 or 81 accept 0 1 6(b) 1 1 6(c) 59 1
Q7 · Calculate 361 + 1
7 Calculate 361 + 1. ................................................. [1]
Mark scheme: 7 20 1
Question 8
8 Complete these statements. 65 000 centimetres = ................................ metres 3.25 litres = ................................ millilitres [2]
Mark scheme: 8 650 2 B1 for each 3250
Q9 · Shape A is a quadrilateral with only one pair of parallel lines
9 (a) Shape A is a quadrilateral with only one pair of parallel lines. Write down the mathematical name of shape A. ................................................. [1] (b) Shape B is a quadrilateral with • two pairs of parallel lines • all four sides equal • no right angles. Write down the mathematical name of shape B. ................................................. [1]
Mark scheme: 9(a) trapezium 1 9(b) rhombus 1
Q10 · The bar chart shows the frequency of each score on a spinner
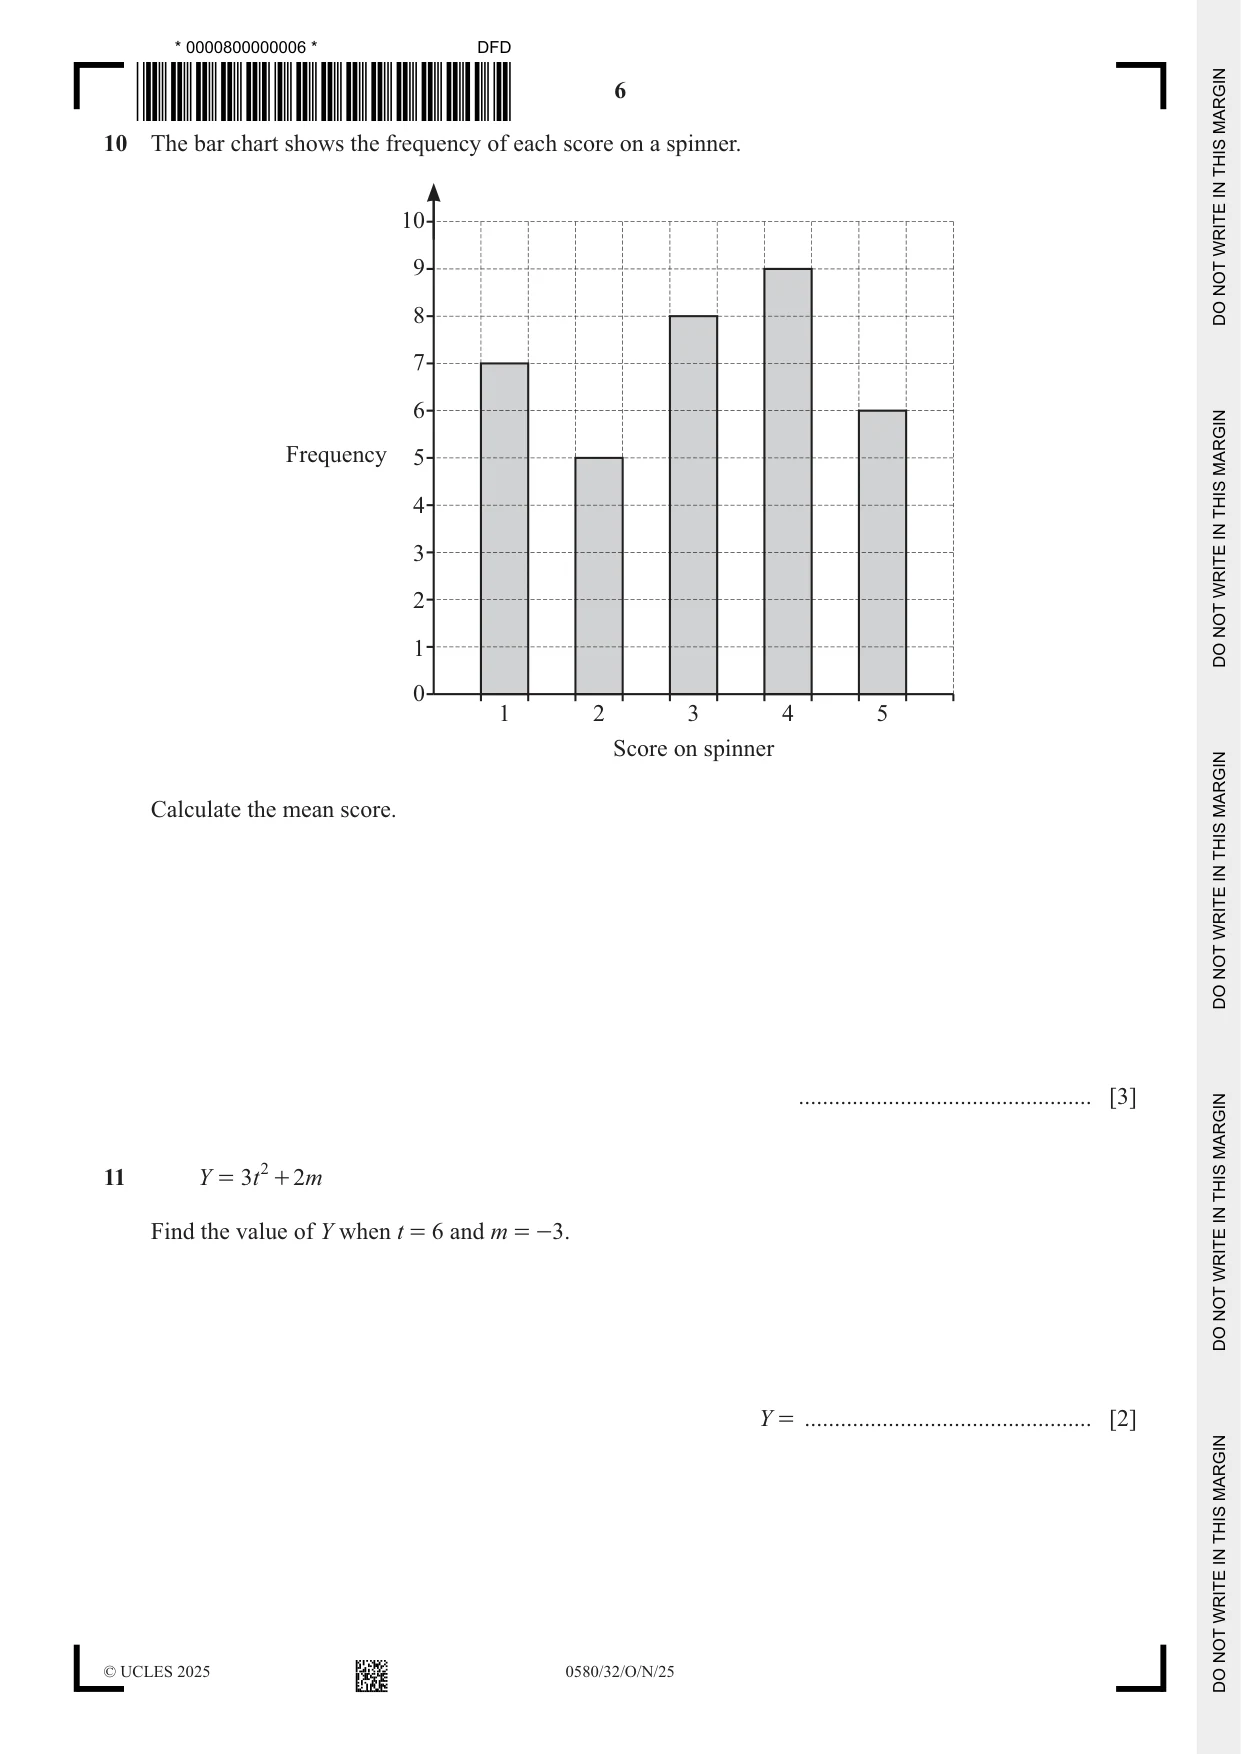
10 The bar chart shows the frequency of each score on a spinner. 10 9 8 7 6 Frequency 5 4 3 2 1 0 1 2 3 4 5 Score on spinner Calculate the mean score. ................................................. [3]
Mark scheme: 10 3.06 or 3.057… 3 M1 for (1 × 7) + (2 × 5) + (3 × 8) + (4 × 9) + (5 × 6) M1dep for their fx ( 7 + 5 + 8 + 9 + 6 )
Q11 · Y = 3t 2 + 2m Find the value of Y when t = 6 and m = -3
11 Y = 3t 2 + 2m Find the value of Y when t = 6 and m = -3. Y = ................................................ [2]
Mark scheme: 11 102 2 B1 for 108 or – 6 or M1 for 3 × 62 + 2 × − 3 oe
Q12 · The table shows the results of a survey about the colour of 90 cars in a car park
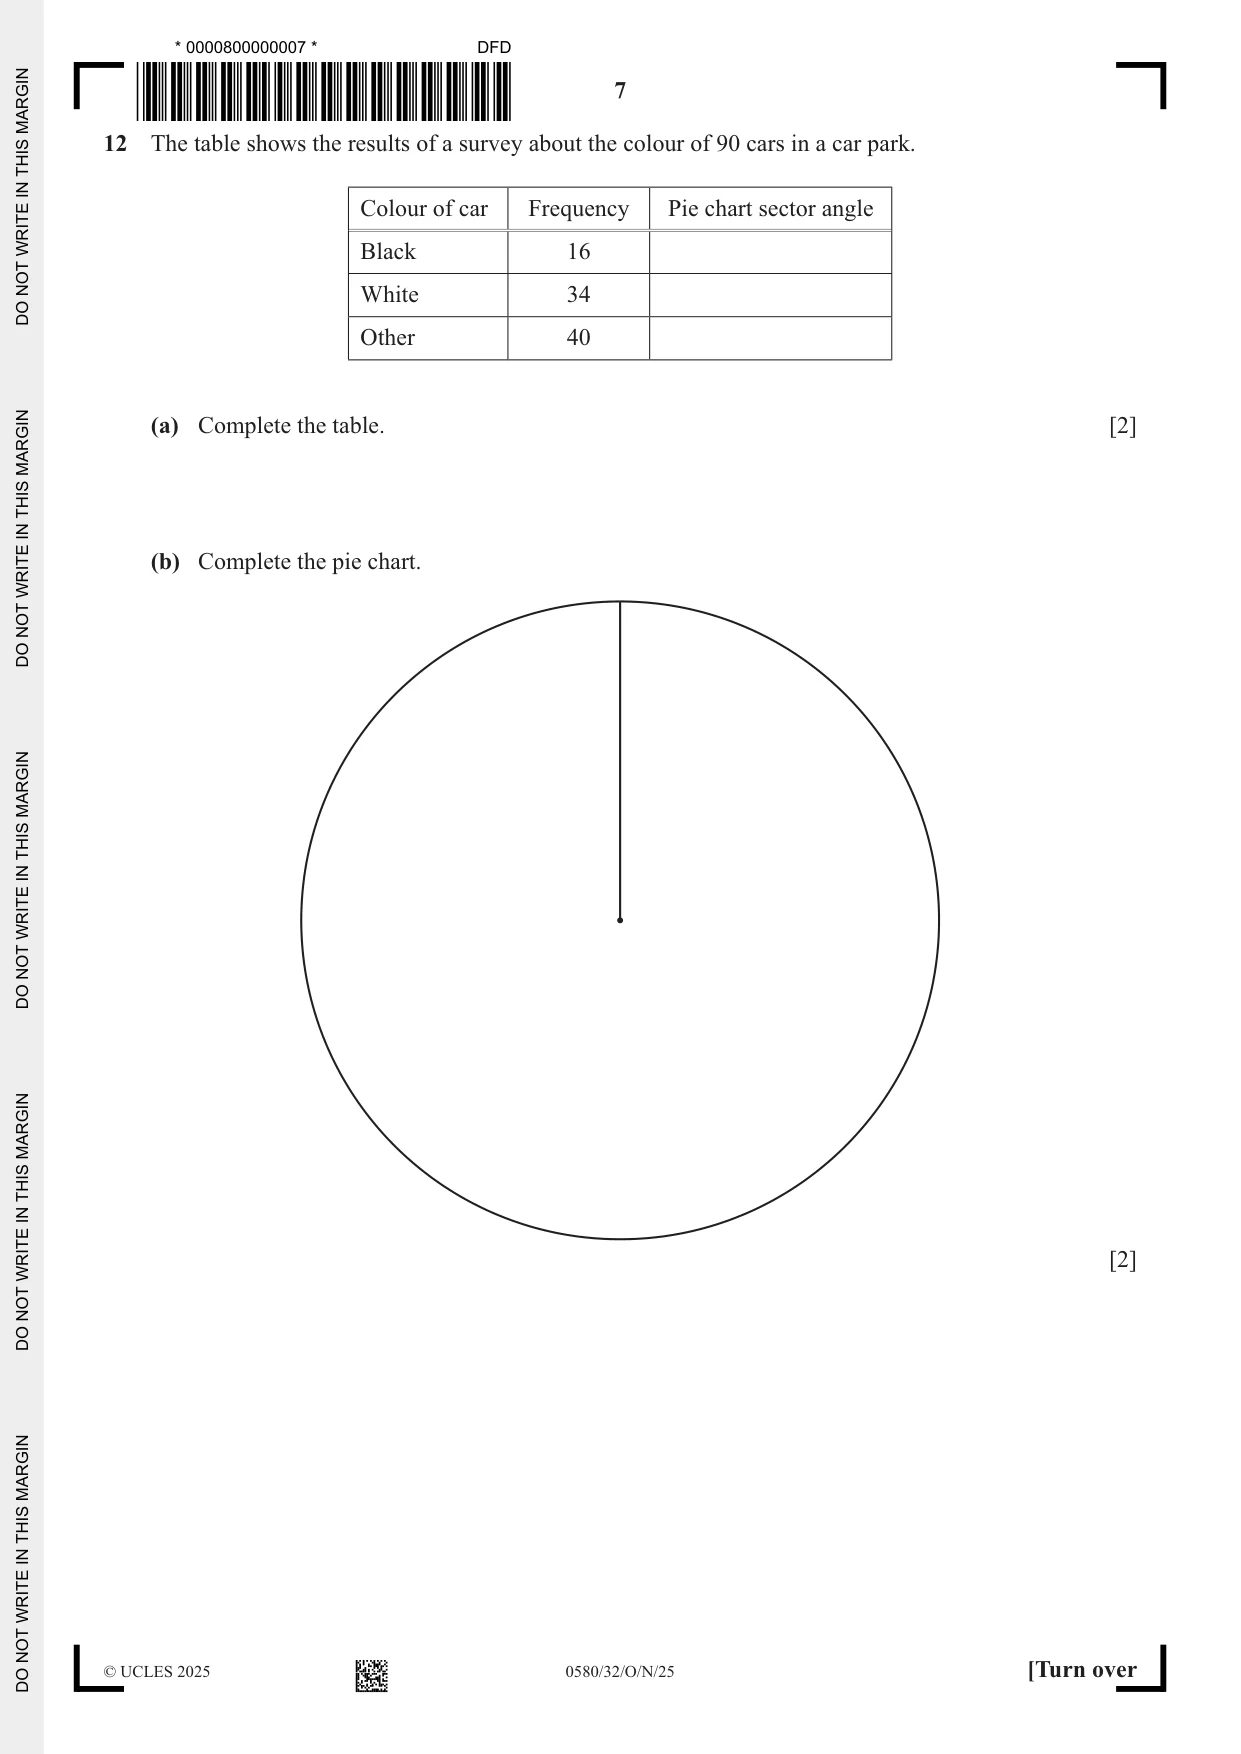
12 The table shows the results of a survey about the colour of 90 cars in a car park. Colour of car Frequency Pie chart sector angle Black 16 White 34 Other 40 (a) Complete the table. [2] (b) Complete the pie chart. [2]
Mark scheme: 12(a) 64 2 B1 for 1 correct 136 160 360 or M1 for × k (k = 1, 16, 34 or 40) oe 90 12(b) Accurate pie chart 2 B2FT if their angles add up to 360° or B1FT for one correct sector or one correct FT sector (may or may not add up to 360°)
Q13 · Find the value of 85
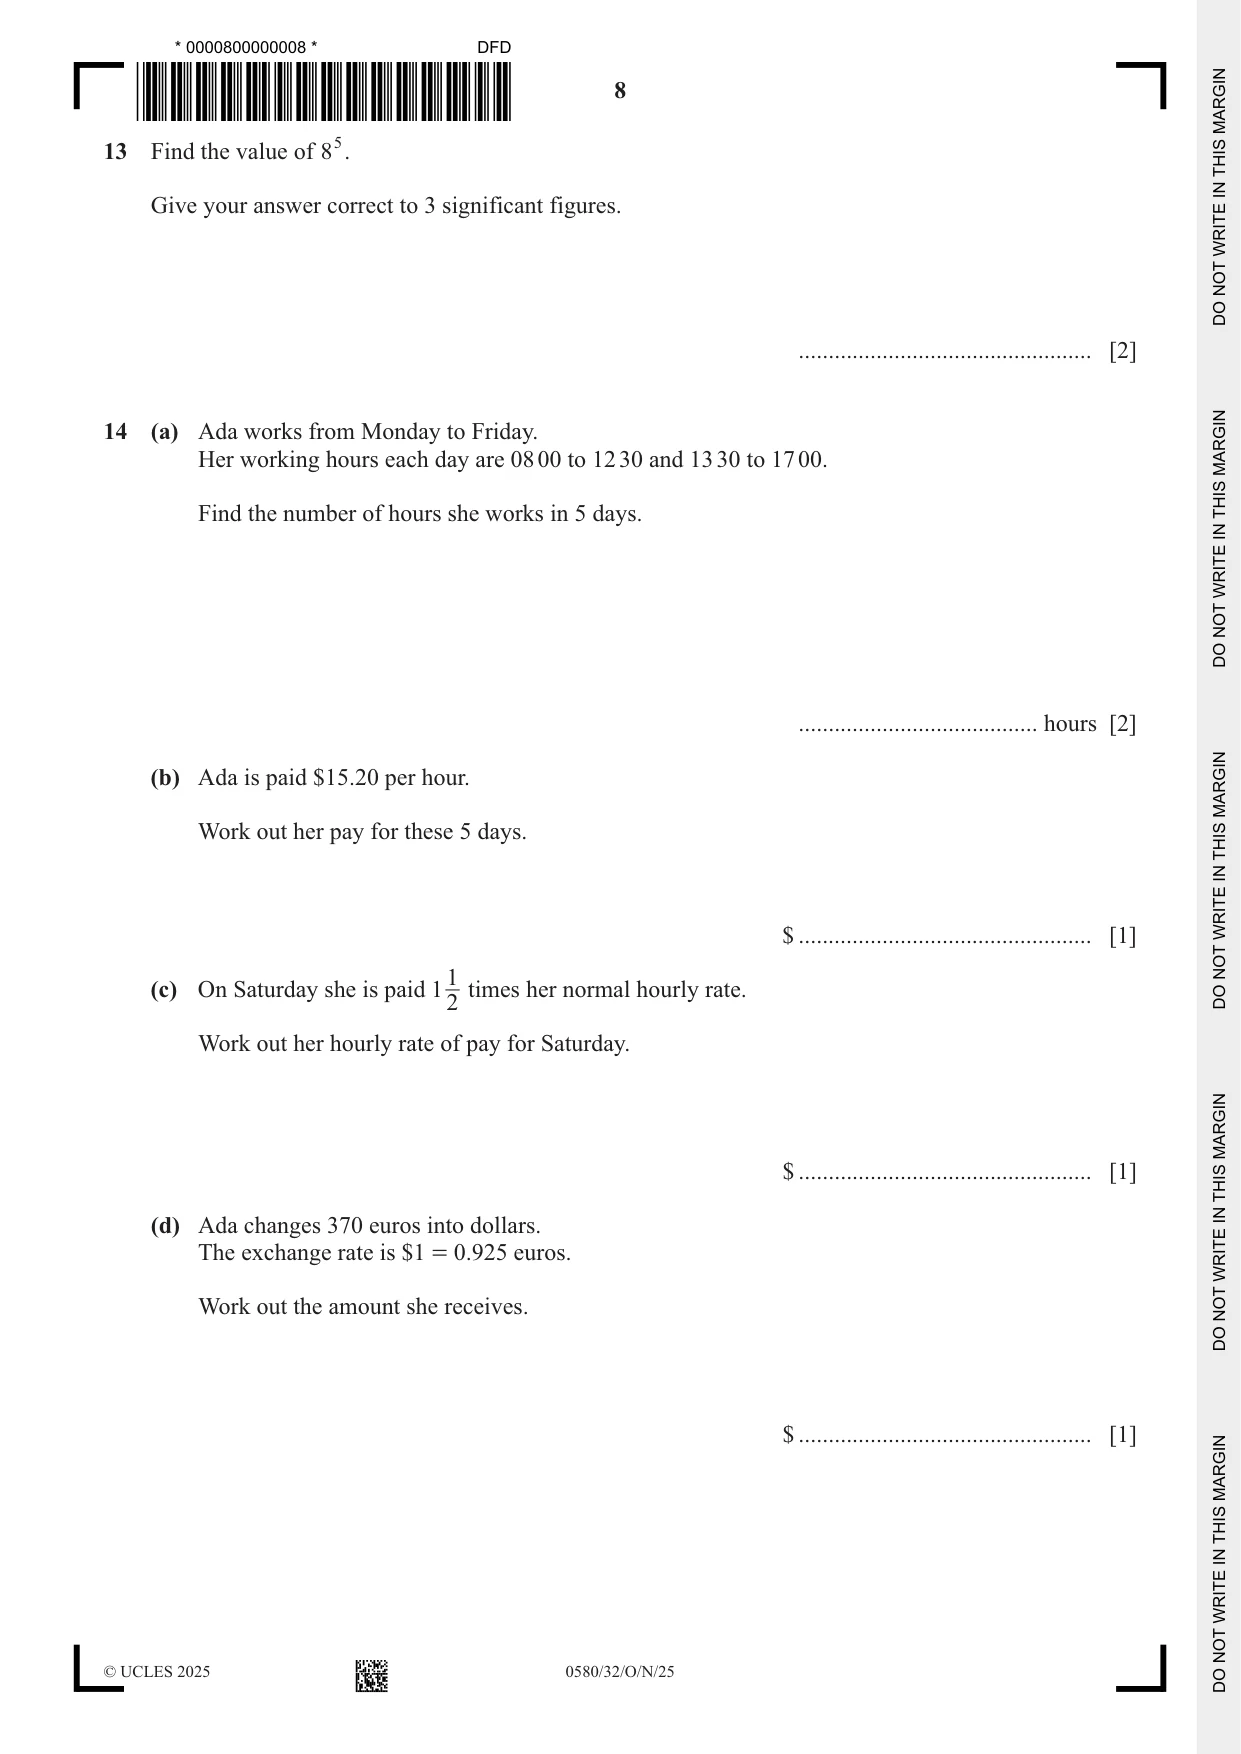
13 Find the value of 85. Give your answer correct to 3 significant figures. ................................................. [2]
Mark scheme: 13 32 800 cao 2 B1 for 32 768 or their answer of more than 3 figures correctly rounded to 3 sf
Q14 · Ada works from Monday to Friday
14 (a) Ada works from Monday to Friday. Her working hours each day are 08 00 to 12 30 and 13 30 to 17 00. Find the number of hours she works in 5 days. ........................................ hours [2] (b) Ada is paid $15.20 per hour. Work out her pay for these 5 days. $ ................................................. [1] 1 (c) On Saturday she is paid 1 times her normal hourly rate. 2 Work out her hourly rate of pay for Saturday. $ ................................................. [1] (d) Ada changes 370 euros into dollars. The exchange rate is $1 = 0.925 euros. Work out the amount she receives. $ ................................................. [1]
Mark scheme: 14(a) 40 2 1 1 B1 for 8 or 22 or 17 2 2 if 0 scored SC1 for 45 as final answer 14(b) 608 1 FT their (a) × 15.20 correct to at least 3sf 14(c) 22.8[0] 1 14(d) 400 1
Q15 · The scale drawing shows the position of ship A
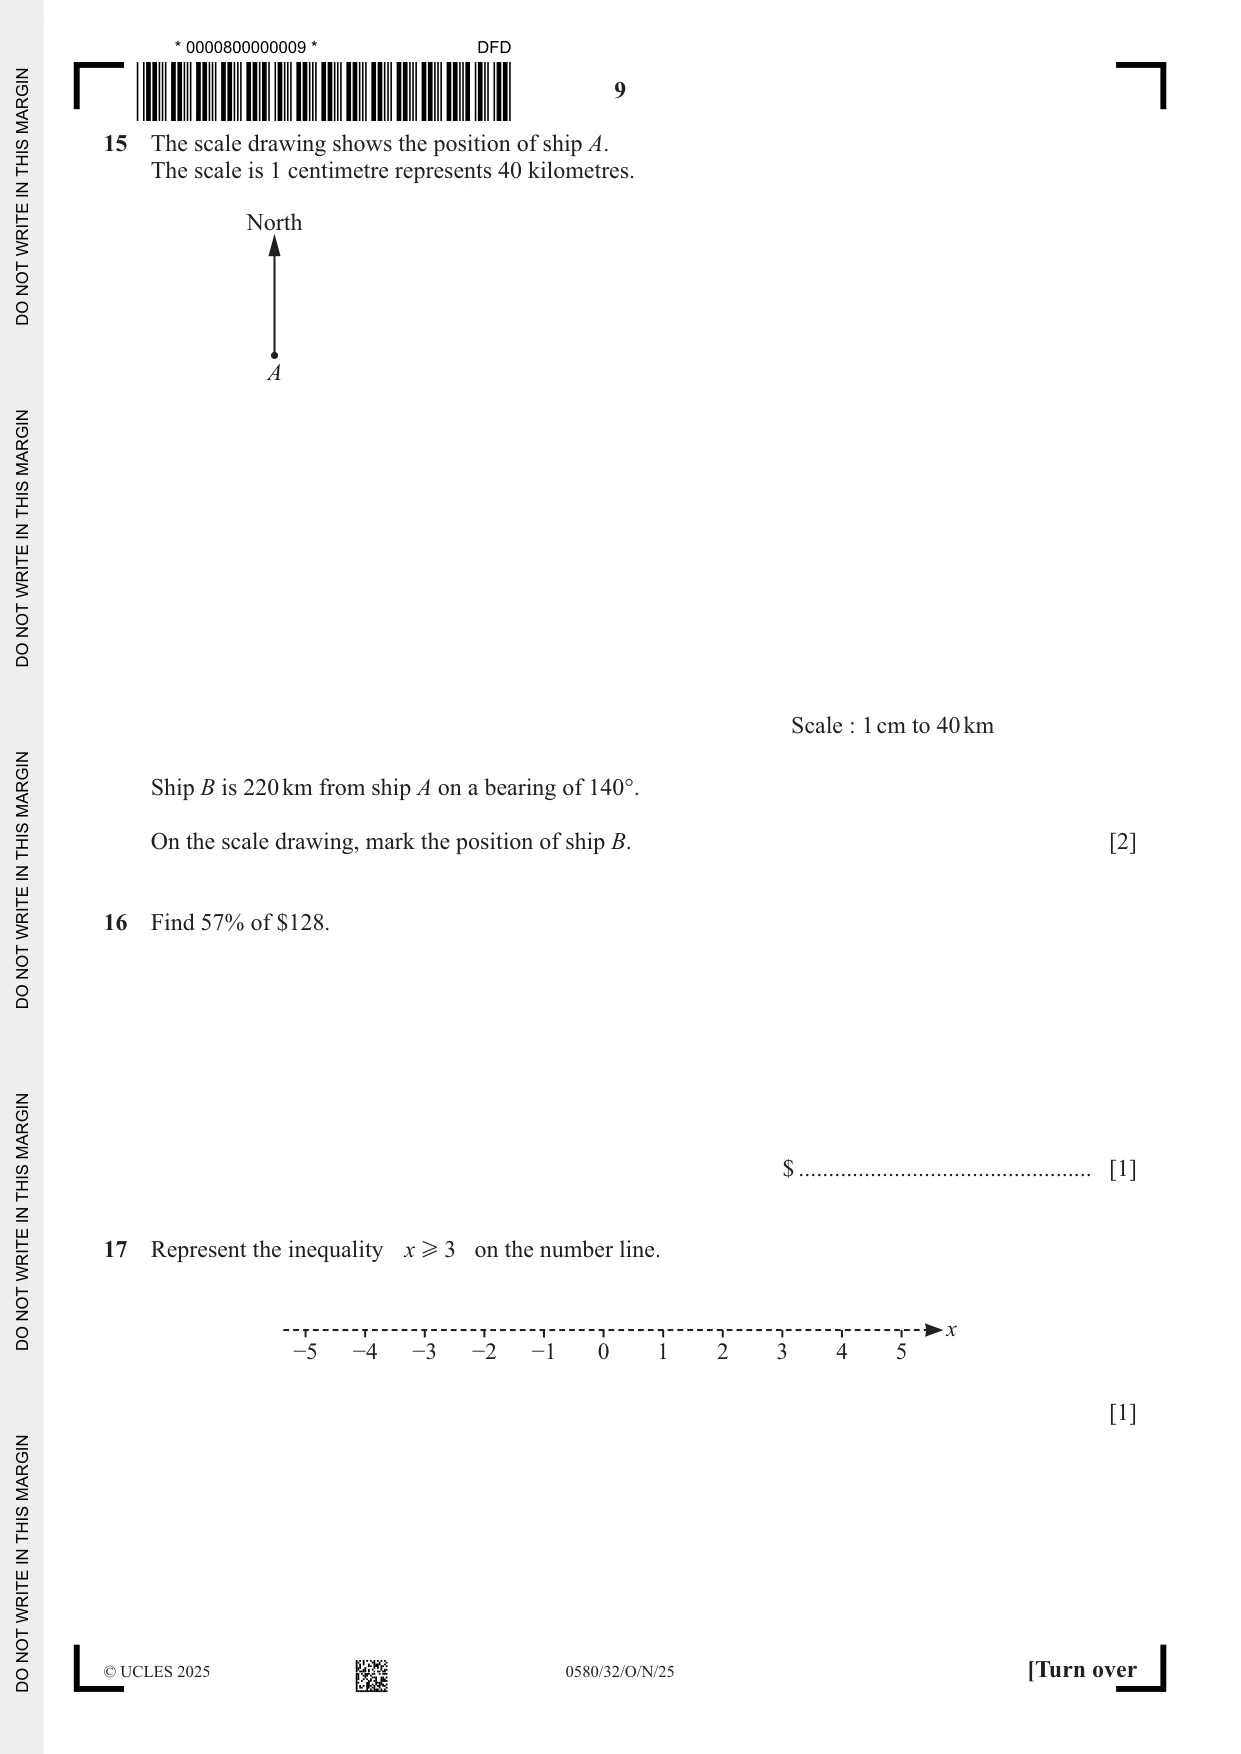
15 The scale drawing shows the position of ship A. The scale is 1 centimetre represents 40 kilometres. North A Scale : 1 cm to 40 km Ship B is 220 km from ship A on a bearing of 140°. On the scale drawing, mark the position of ship B. [2]
Mark scheme: 15 Correct point marked 2 B1 for B on bearing 140° from A or B1 for B 5.5cm from A
Q16 · Find 57% of $128
16 Find 57% of $128. $ ................................................. [1]
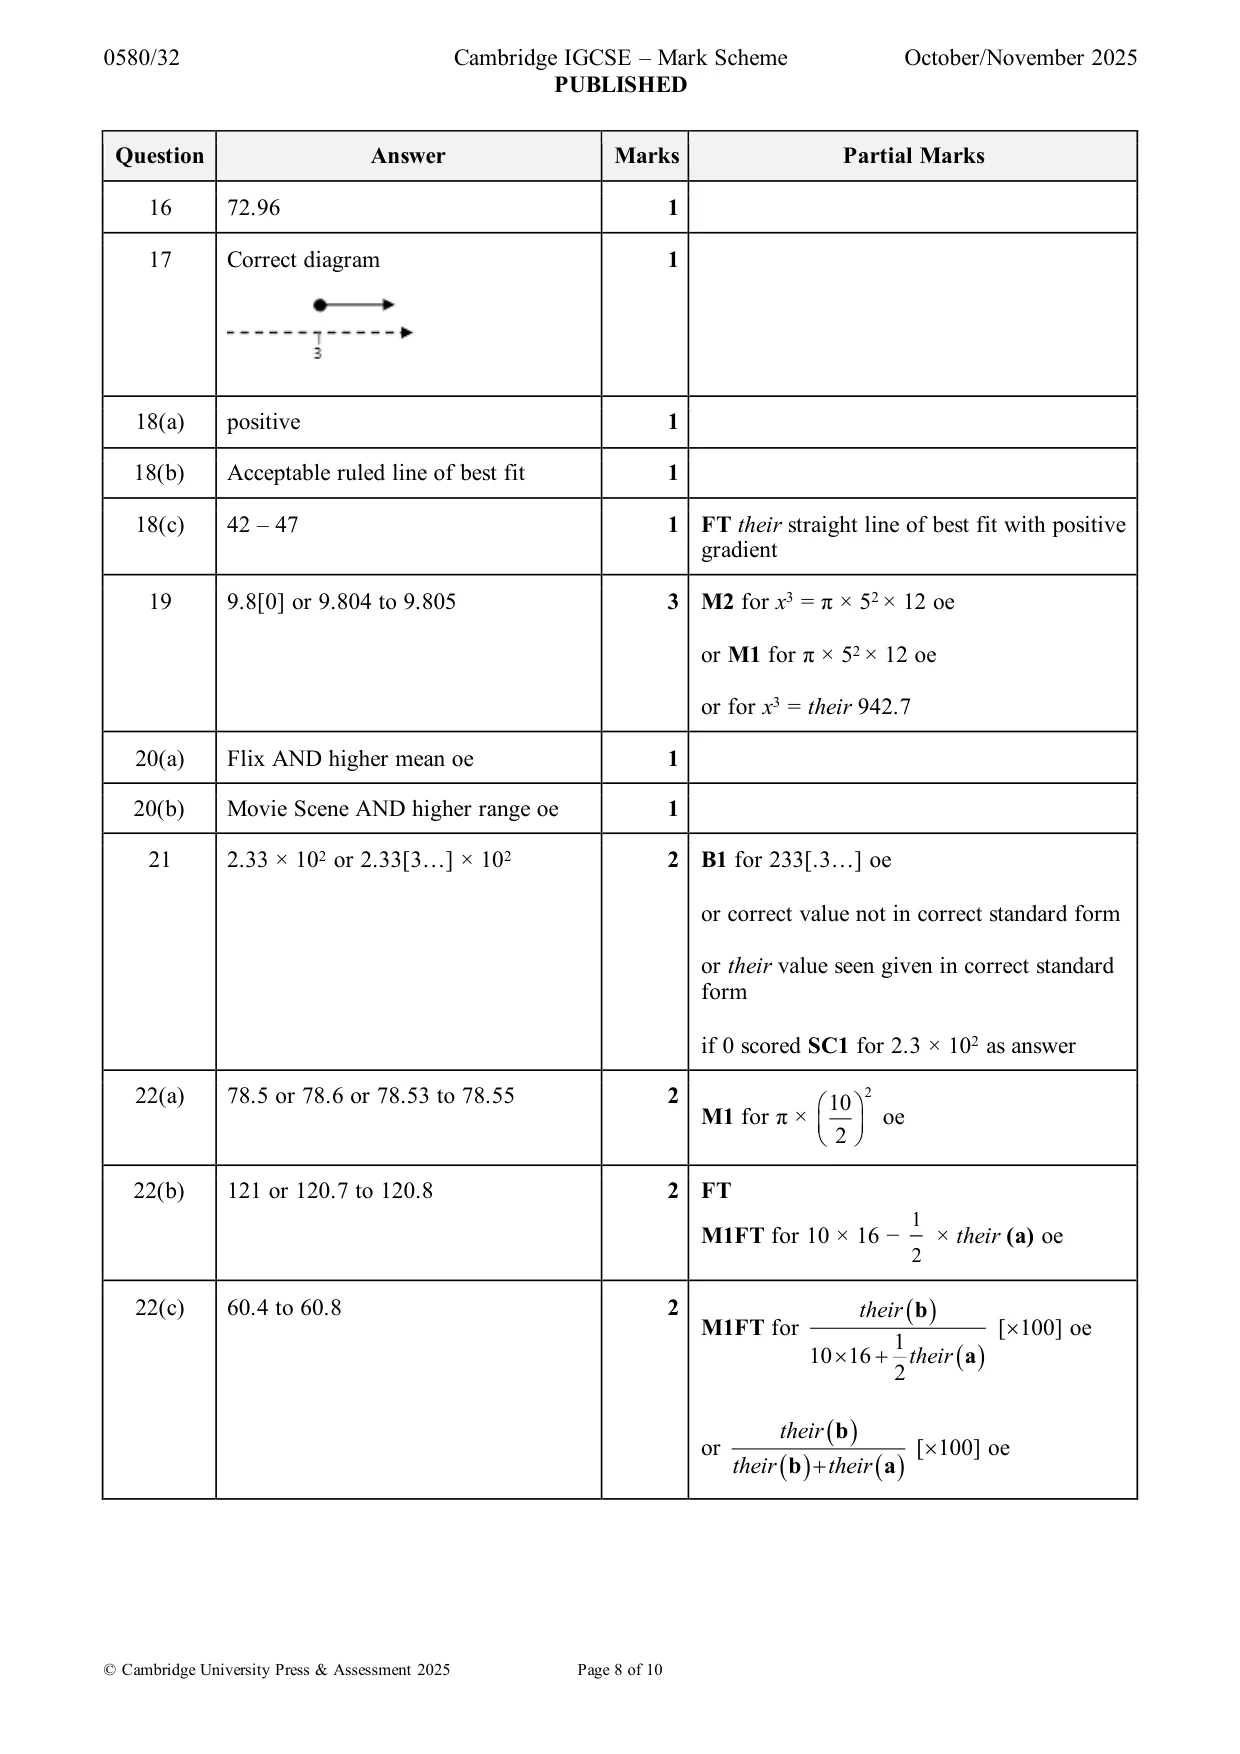
Mark scheme: 16 72.96 1
Q17 · Represent the inequality x H 3 on the number line
17 Represent the inequality x H 3 on the number line. x −5 −4 −3 −2 −1 0 1 2 3 4 5 [1]
Mark scheme: 17 Correct diagram 1
Q18 · A school records the marks students score in Paper 1 and Paper 2 of a subject
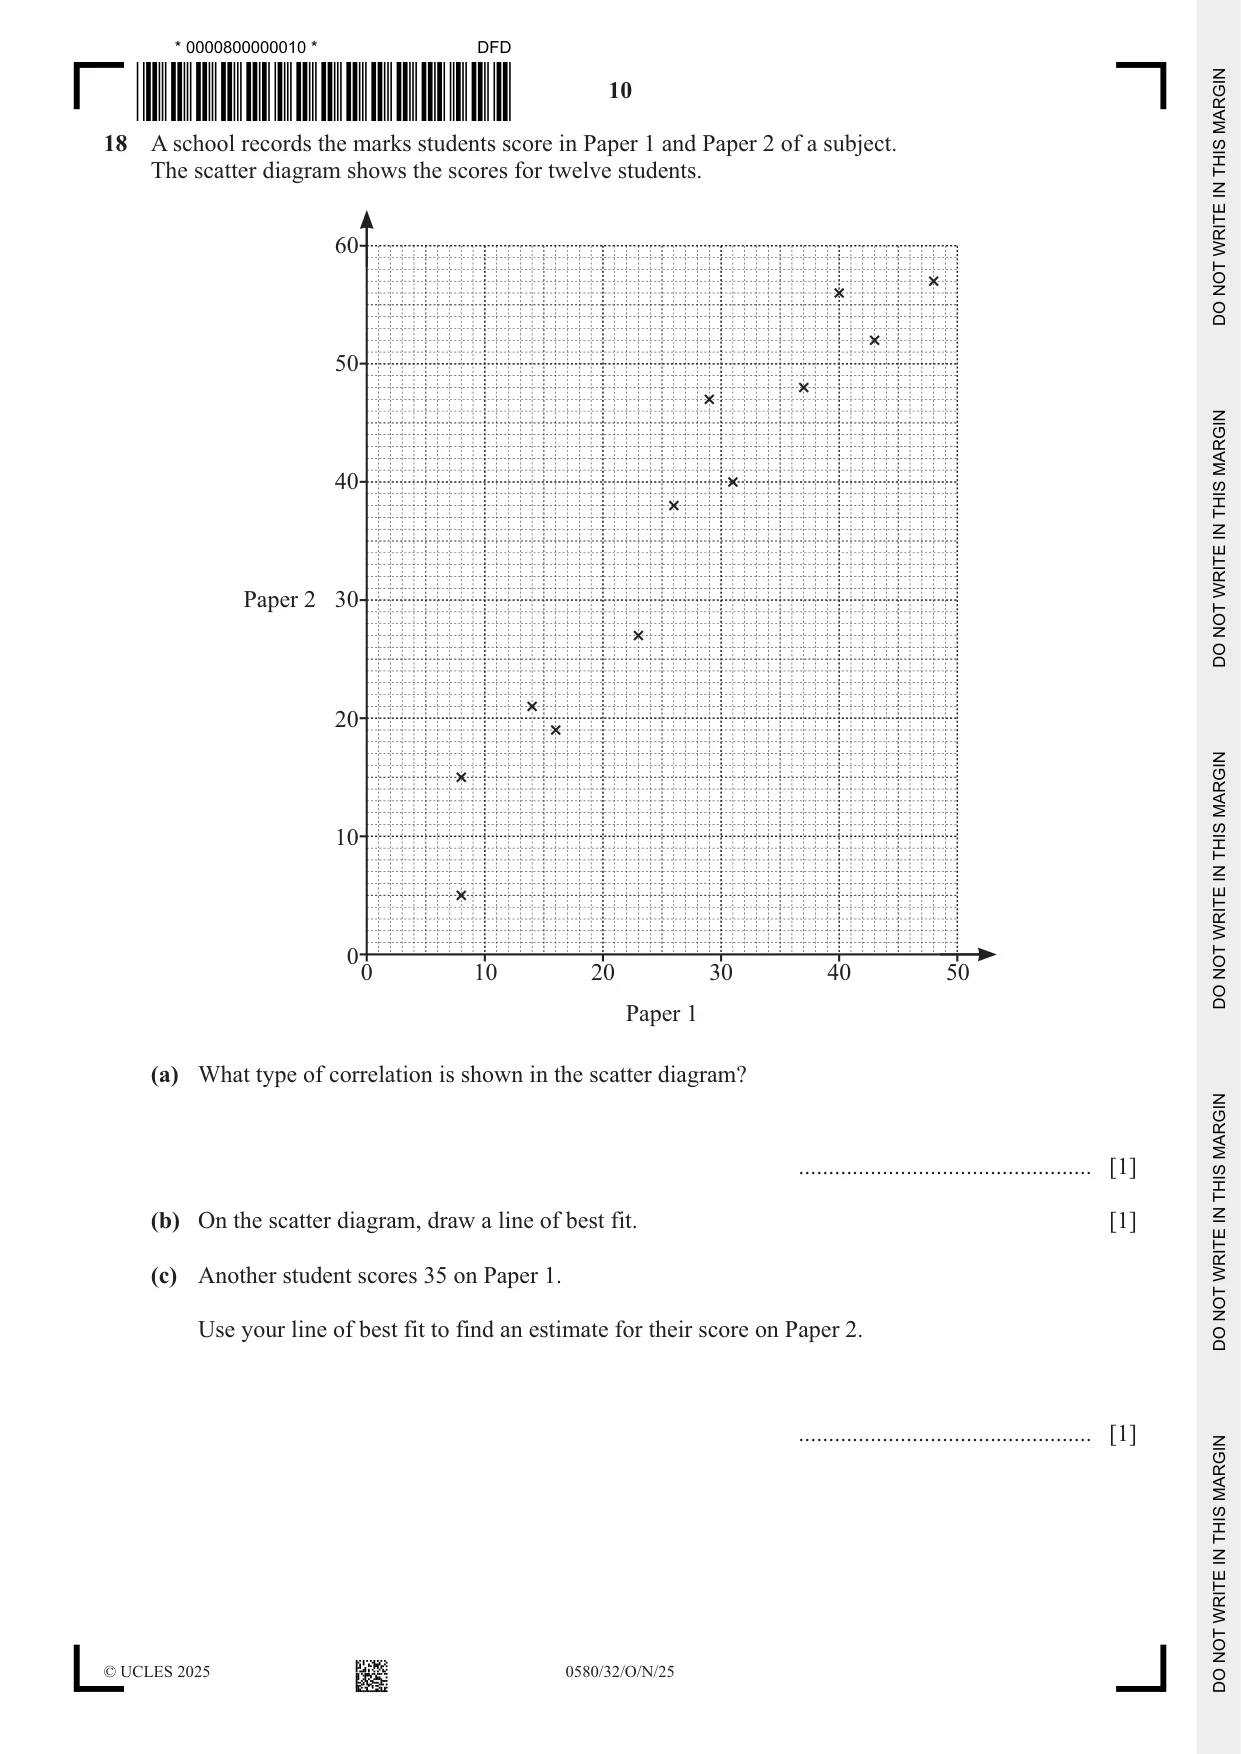
18 A school records the marks students score in Paper 1 and Paper 2 of a subject. The scatter diagram shows the scores for twelve students. 60 50 40 Paper 2 30 20 10 00 10 20 30 40 50 Paper 1 (a) What type of correlation is shown in the scatter diagram? ................................................. [1] (b) On the scatter diagram, draw a line of best fit. [1] (c) Another student scores 35 on Paper 1. Use your line of best fit to find an estimate for their score on Paper 2. ................................................. [1]
Mark scheme: 18(a) positive 1 18(b) Acceptable ruled line of best fit 1 18(c) 42 – 47 1 FT their straight line of best fit with positive gradient
Q19 · The diagram shows a cylinder and a cube
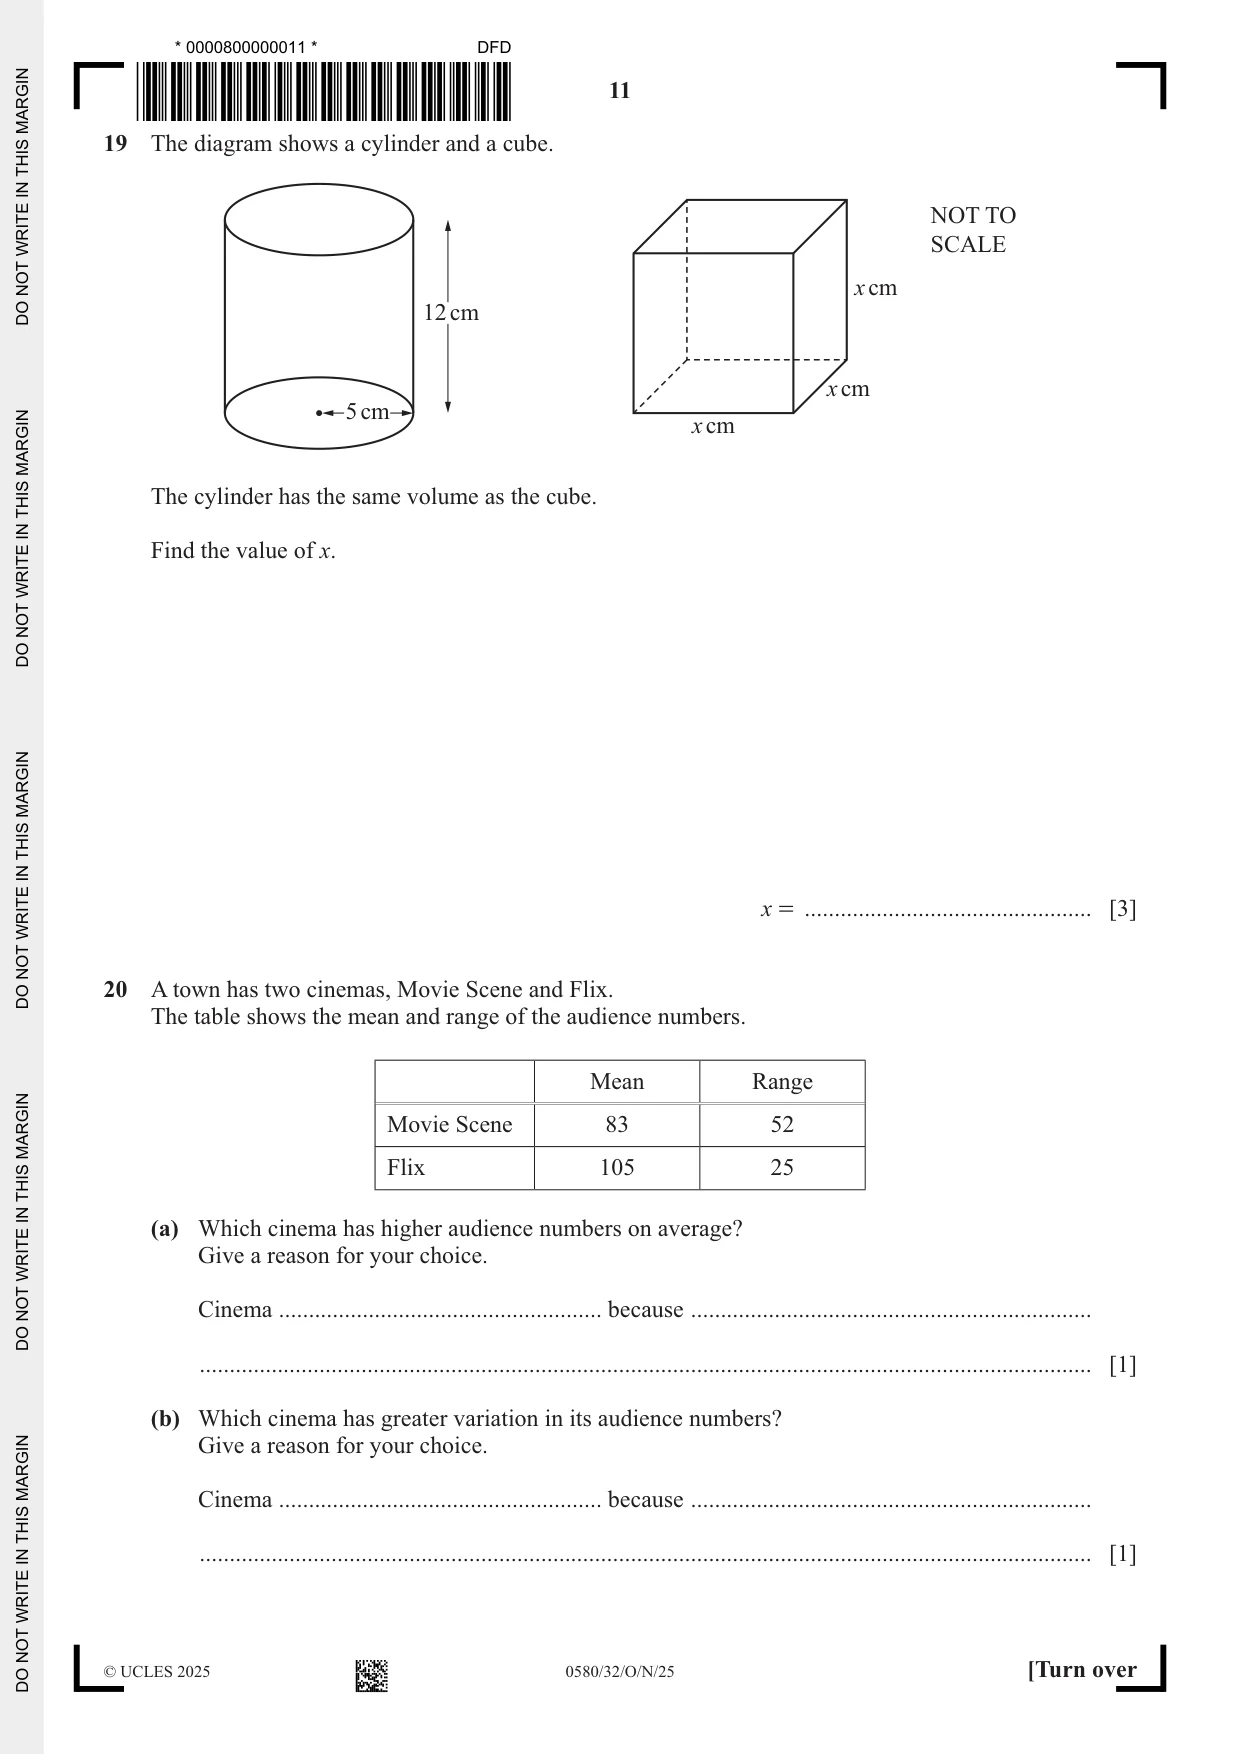
19 The diagram shows a cylinder and a cube. NOT TO SCALE x cm 12 cm x cm 5 cm x cm The cylinder has the same volume as the cube. Find the value of x. x = ................................................ [3]
Mark scheme: 19 9.8[0] or 9.804 to 9.805 3 M2 for x3 = π × 52 × 12 oe or M1 for π × 52 × 12 oe or for x3 = their 942.7
Q20 · A town has two cinemas, Movie Scene and Flix
20 A town has two cinemas, Movie Scene and Flix. The table shows the mean and range of the audience numbers. Mean Range Movie Scene 83 52 Flix 105 25 (a) Which cinema has higher audience numbers on average? Give a reason for your choice. Cinema ...................................................... because ................................................................... ..................................................................................................................................................... [1] (b) Which cinema has greater variation in its audience numbers? Give a reason for your choice. Cinema ...................................................... because ................................................................... ..................................................................................................................................................... [1]
Mark scheme: 20(a) Flix AND higher mean oe 1 20(b) Movie Scene AND higher range oe 1
Q21 · Calculate (5 .6 # 10 -3 ) ' ( 2.4 # 10 -5)
21 Calculate (5 .6 # 10 -3 ) ' ( 2.4 # 10 -5) . Write your answer in standard form. ................................................. [2]
Mark scheme: 21 2.33 × 10² or 2.33[3…] × 102 2 B1 for 233[.3…] oe or correct value not in correct standard form or their value seen given in correct standard form if 0 scored SC1 for 2.3 × 10² as answer
Q22 · NOT TO SCALE 16 m 10 m The diagram shows a garden
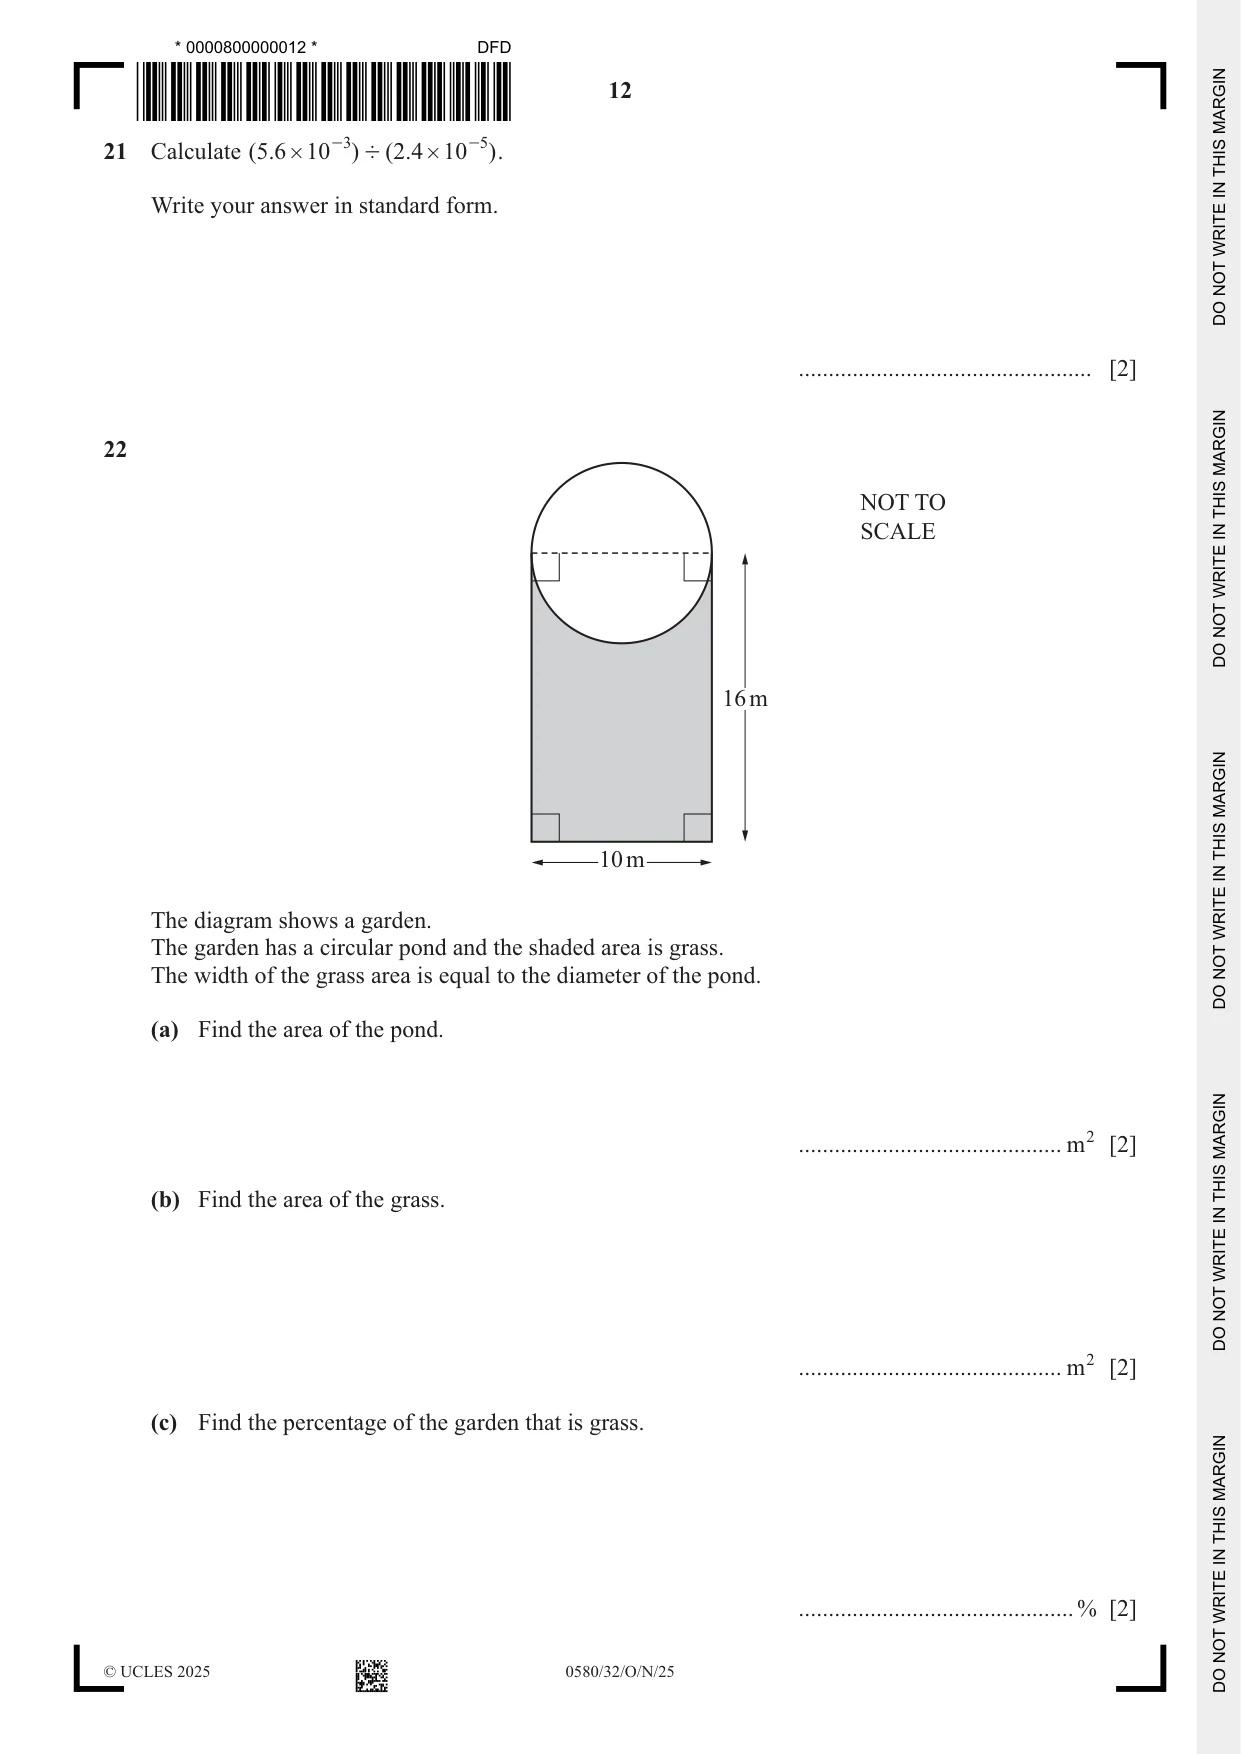
22 NOT TO SCALE 16 m 10 m The diagram shows a garden. The garden has a circular pond and the shaded area is grass. The width of the grass area is equal to the diameter of the pond. (a) Find the area of the pond. ............................................ m2 [2] (b) Find the area of the grass. ............................................ m2 [2] (c) Find the percentage of the garden that is grass. ..............................................% [2]
Mark scheme: 22(a) 78.5 or 78.6 or 78.53 to 78.55 2 2 10 M1 for π × oe 2 22(b) 121 or 120.7 to 120.8 2 FT 1 M1FT for 10 × 16 − × their (a) oe 2 22(c) 60.4 to 60.8 2 their ( b ) M1FT for [100] oe 1 10 16 + their ( a ) 2 their ( b ) or [100] oe their ( b ) + their ( a )
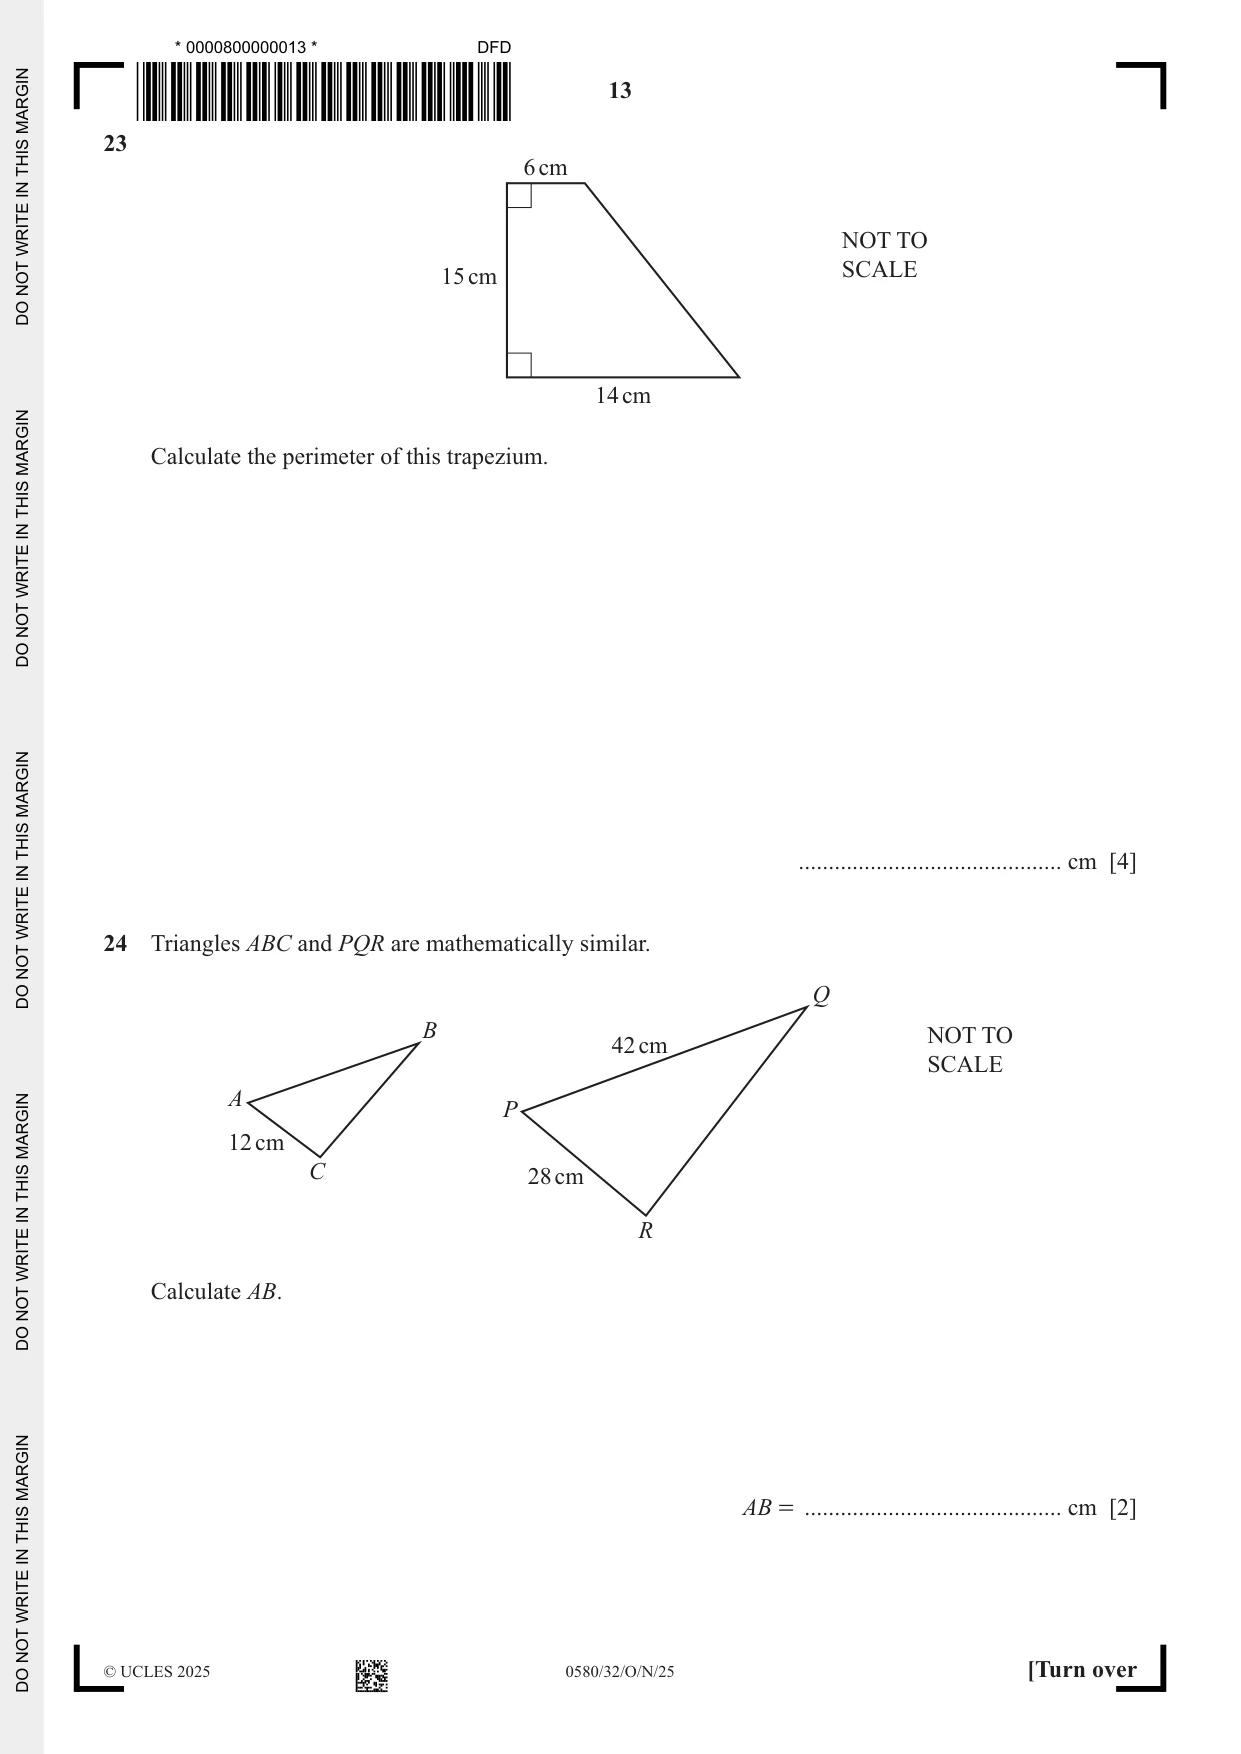
Q23 · 6 cm NOT TO SCALE 15 cm 14 cm Calculate the perimeter of this trapezium
23 6 cm NOT TO SCALE 15 cm 14 cm Calculate the perimeter of this trapezium. ............................................ cm [4]
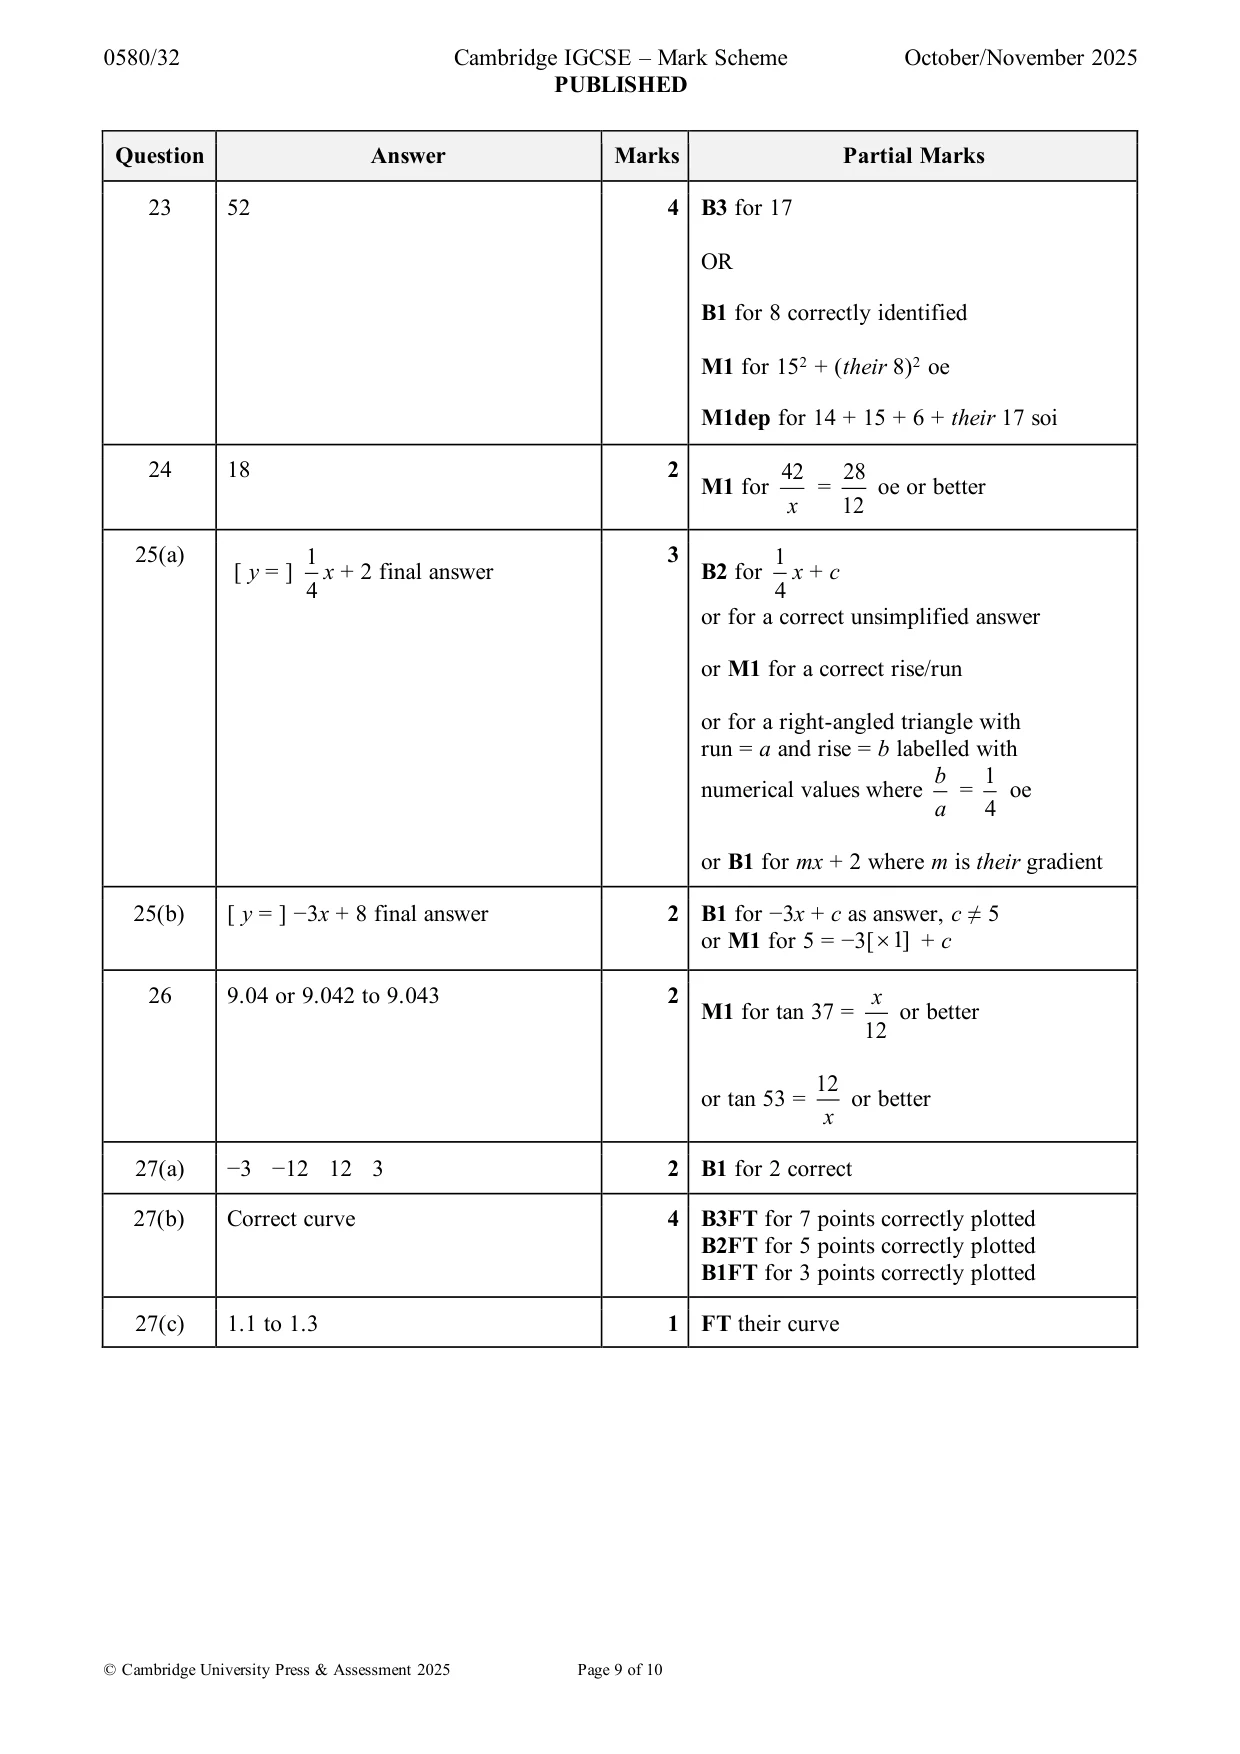
Mark scheme: 23 52 4 B3 for 17 OR B1 for 8 correctly identified M1 for 152 + (their 8)2 oe M1dep for 14 + 15 + 6 + their 17 soi
Q24 · Triangles ABC and PQR are mathematically similar
24 Triangles ABC and PQR are mathematically similar. Q B NOT TO 42 cm SCALE A P 12 cm C 28 cm R Calculate AB. AB = ........................................... cm [2]
Mark scheme: 24 18 2 42 28 M1 for = oe or better x 12
Q25 · The grid shows line L
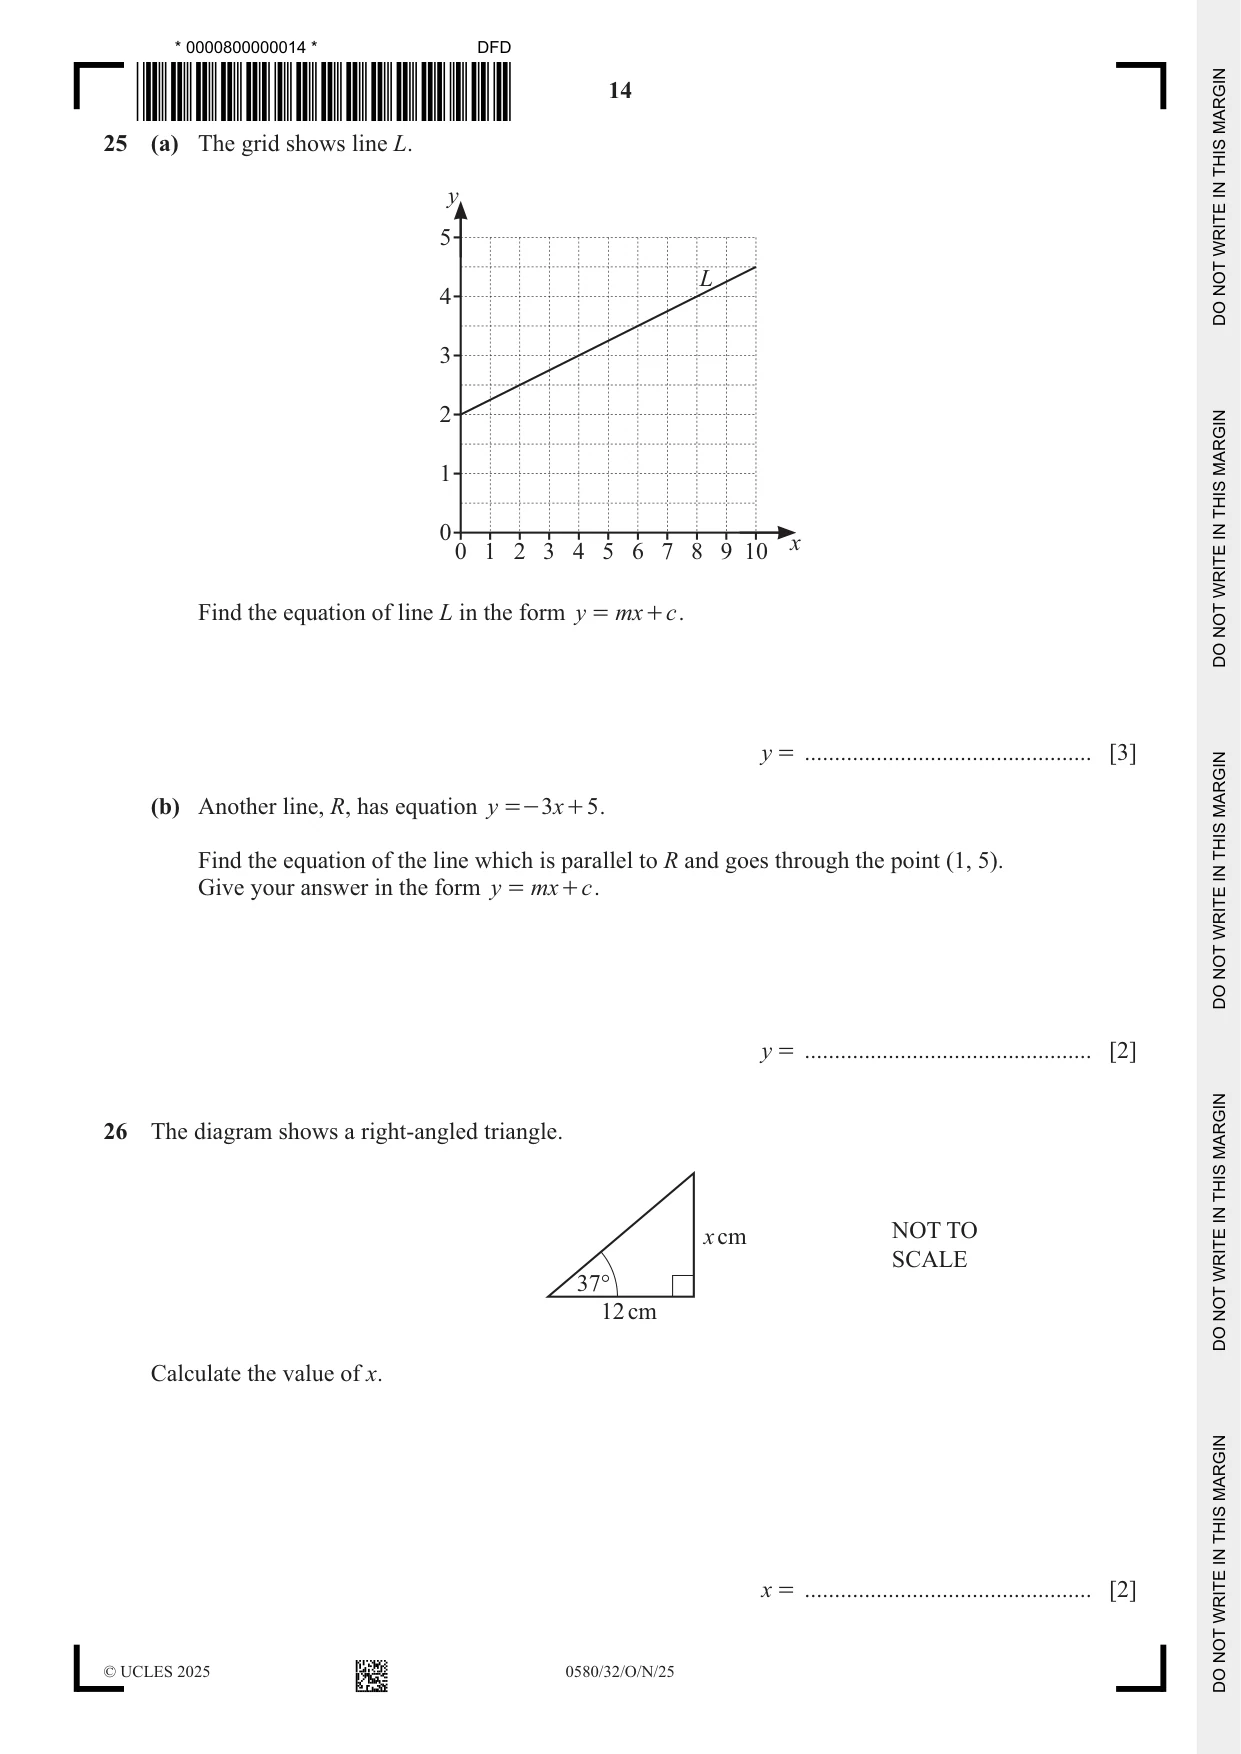
25 (a) The grid shows line L. y 5 L 4 3 2 1 0 x 0 1 2 3 4 5 6 7 8 9 10 Find the equation of line L in the form y = mx + c . y = ................................................ [3] (b) Another line, R, has equation y =- 3x + 5 . Find the equation of the line which is parallel to R and goes through the point (1, 5). Give your answer in the form y = mx + c . y = ................................................ [2]
Mark scheme: 25(a) 1 3 1 [ y = ] x + 2 final answer B2 for x + c 4 4 or for a correct unsimplified answer or M1 for a correct rise/run or for a right-angled triangle with run = a and rise = b labelled with b 1 numerical values where = oe a 4 or B1 for mx + 2 where m is their gradient 25(b) [ y = ] −3x + 8 final answer 2 B1 for −3x + c as answer, c ≠ 5 or M1 for 5 = −3[ 1] + c
Q26 · The diagram shows a right-angled triangle
26 The diagram shows a right-angled triangle. x cm NOT TO SCALE 37° 12 cm Calculate the value of x. x = ................................................ [2]
Mark scheme: 26 9.04 or 9.042 to 9.043 2 x M1 for tan 37 = or better 12 12 or tan 53 = or better x
Q27 · 27 (a) Complete the table of values for y =
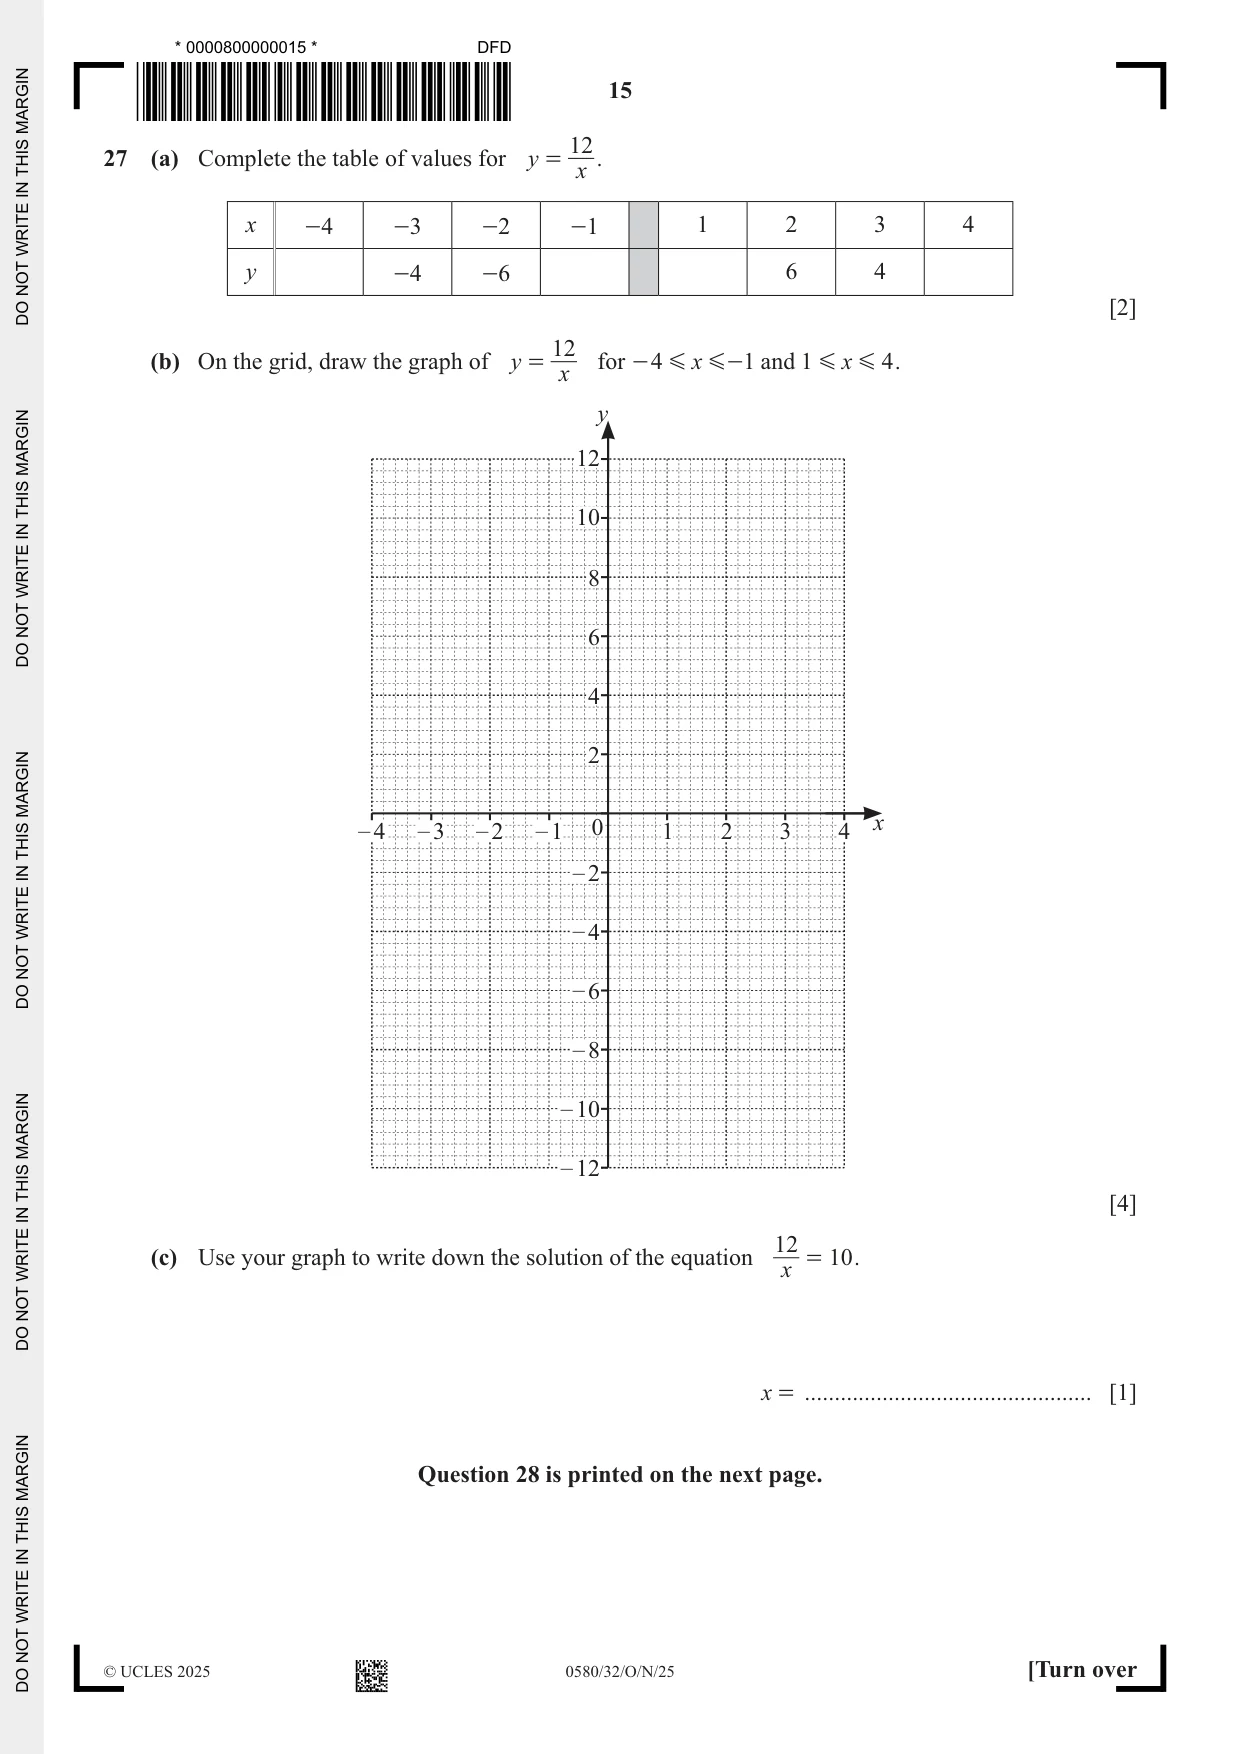
12 27 (a) Complete the table of values for y = . x x -4 -3 -2 -1 1 2 3 4 y -4 -6 6 4 [2] 12 (b) On the grid, draw the graph of y = for - 4 G x G -1 and 1 G x G 4 . x y 12 10 8 6 4 2 – 4 – 3 – 2 – 1 0 1 2 3 4 x – 2 – 4 – 6 – 8 – 10 – 12 [4] 12 (c) Use your graph to write down the solution of the equation = 10 . x x = ................................................ [1] Question 28 is printed on the next page.
Mark scheme: 27(a) −3 −12 12 3 2 B1 for 2 correct 27(b) Correct curve 4 B3FT for 7 points correctly plotted B2FT for 5 points correctly plotted B1FT for 3 points correctly plotted 27(c) 1.1 to 1.3 1 FT their curve
Q28 · Ali invests $2950 in an account paying 12% compound interest
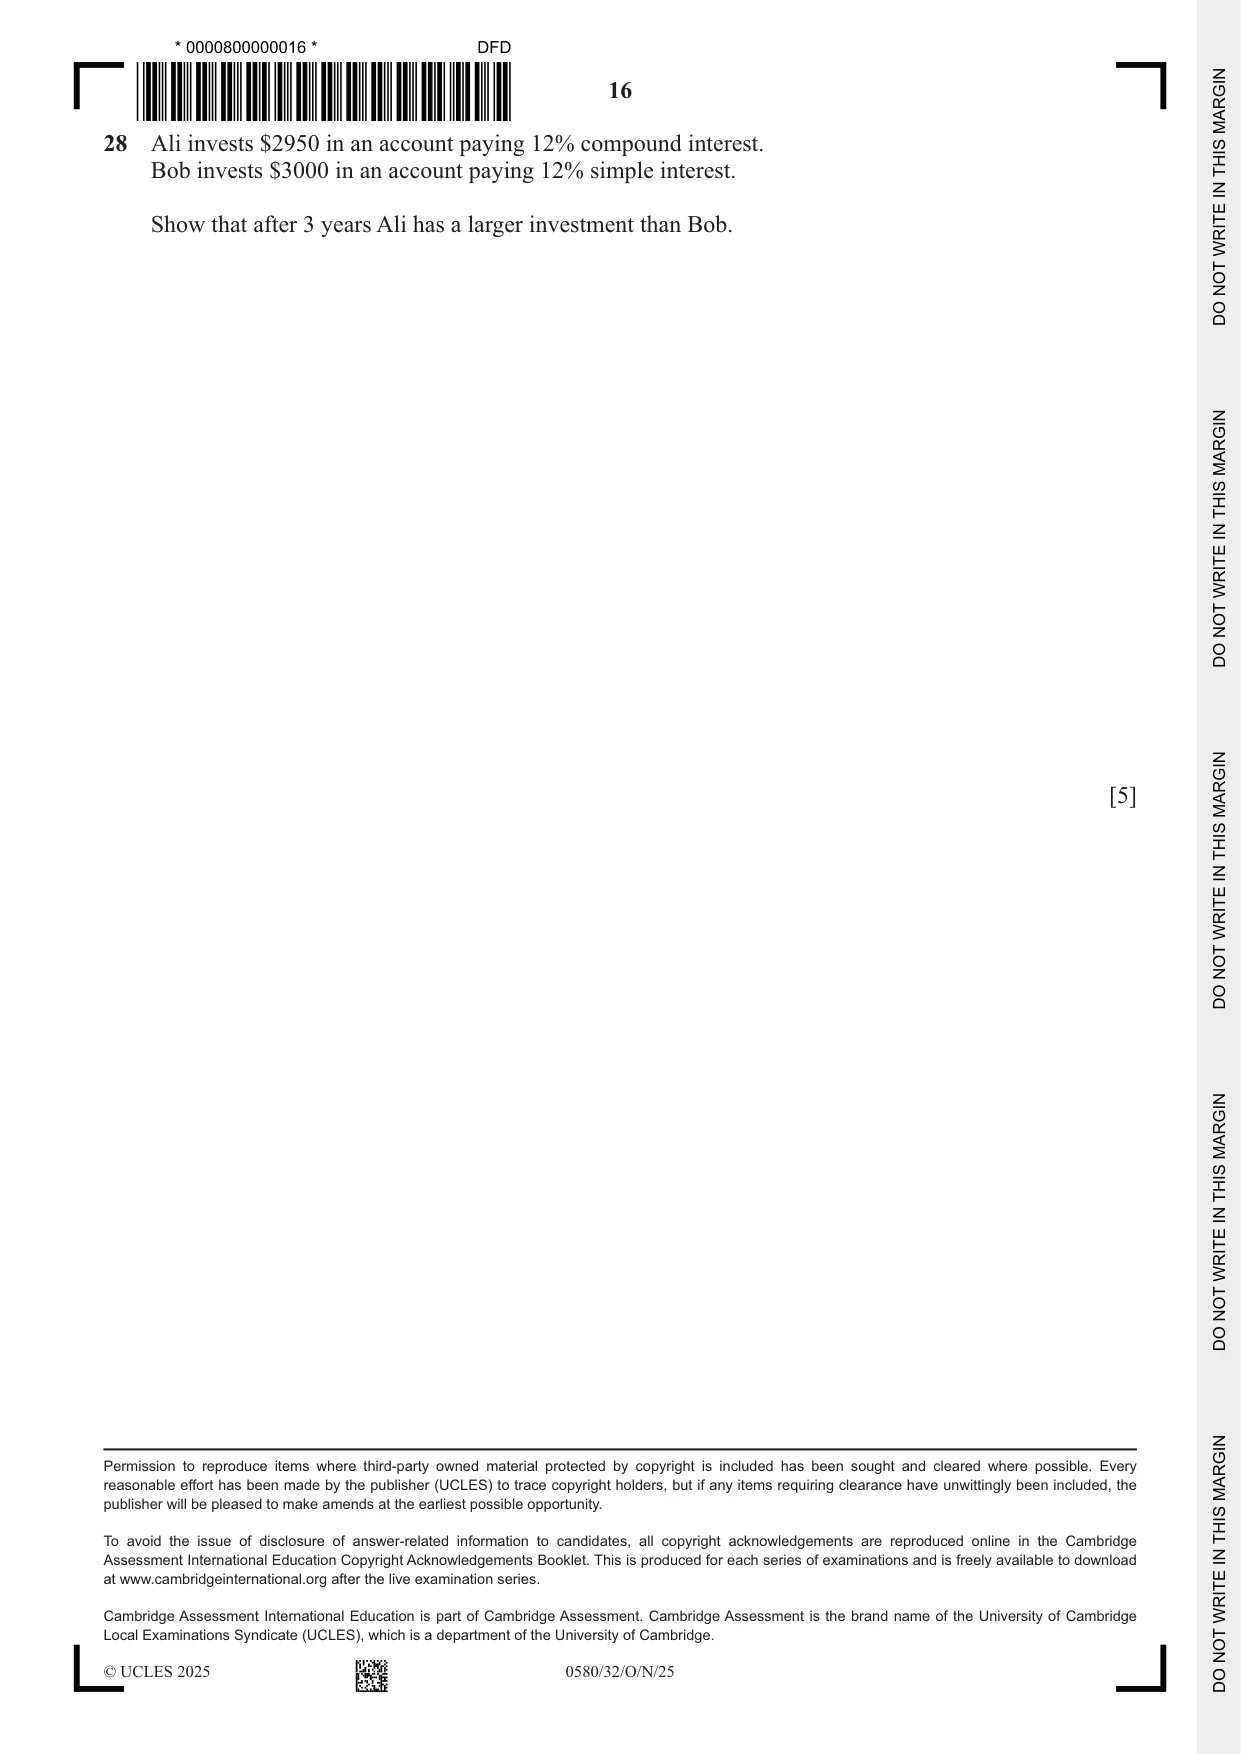
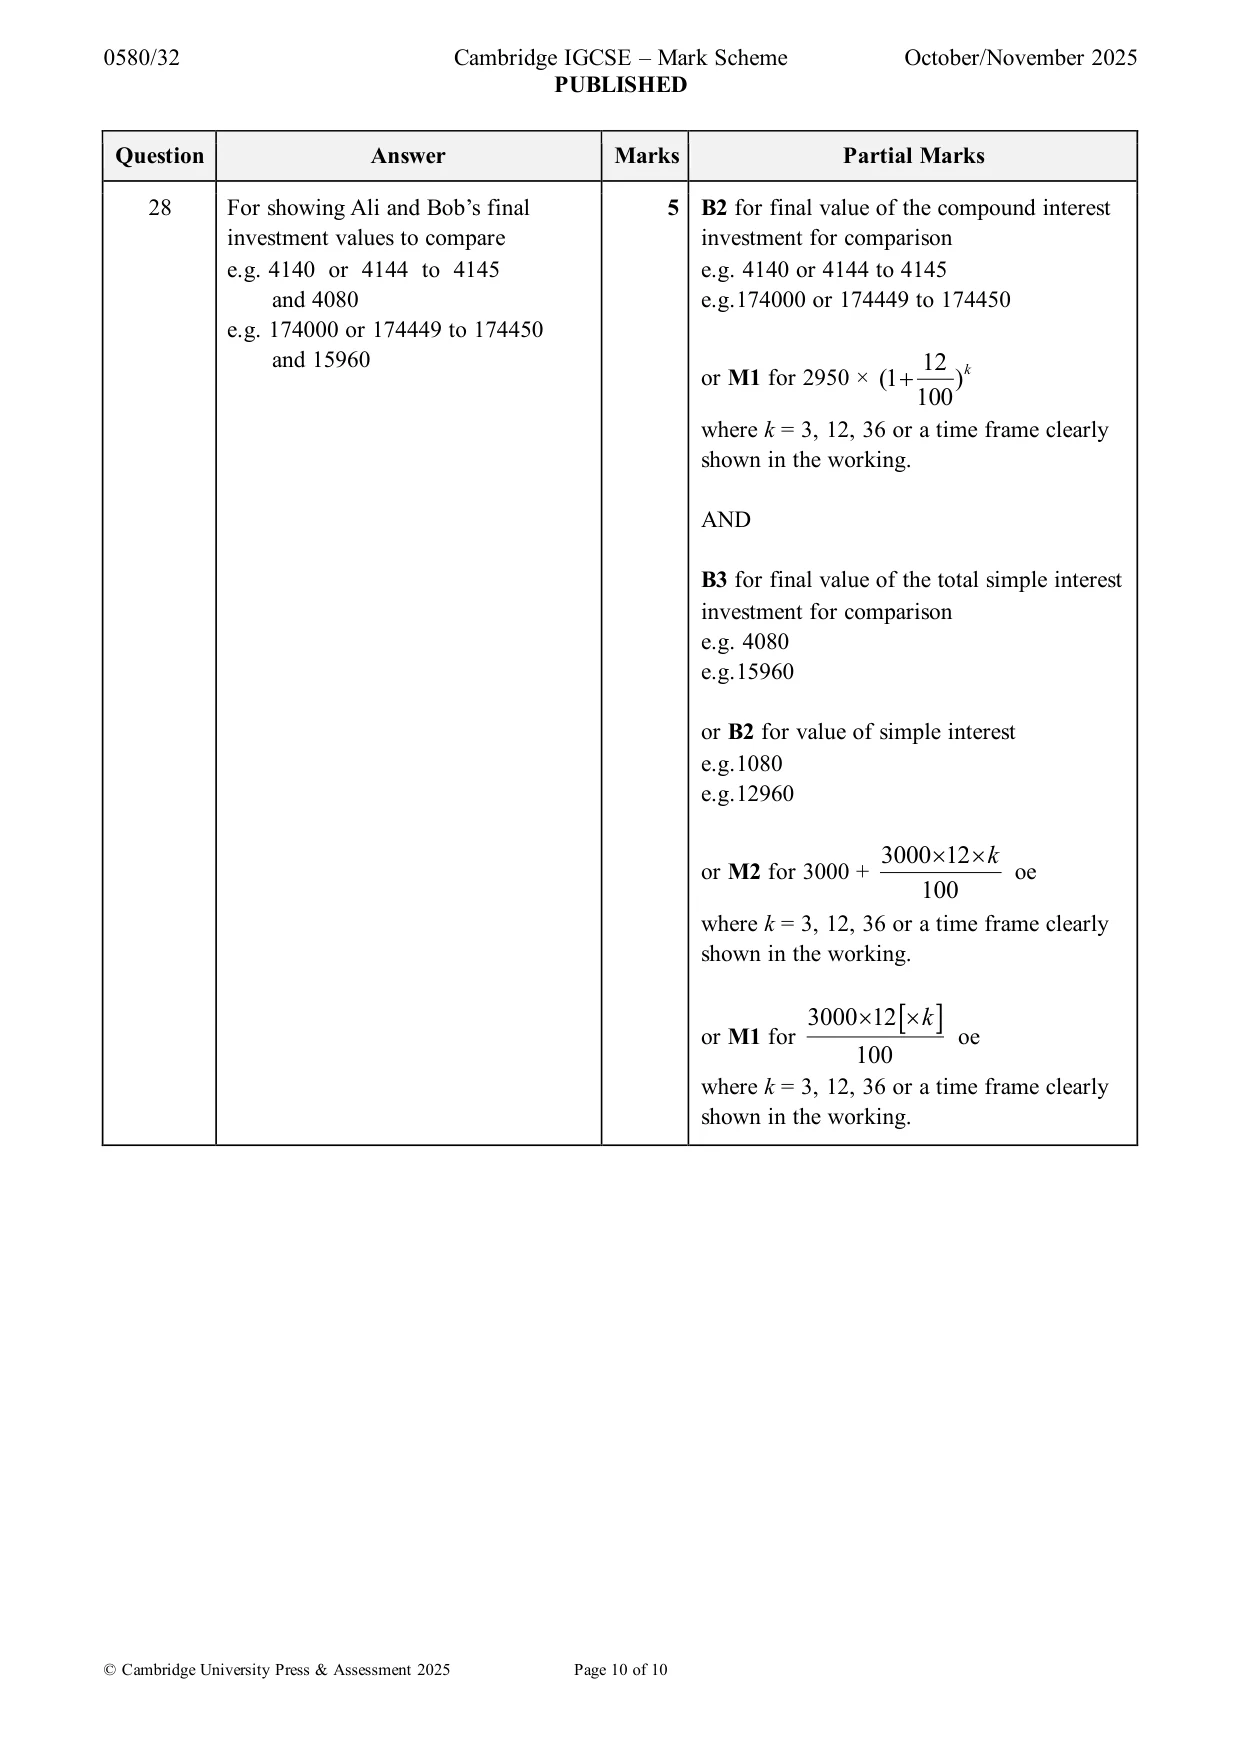
28 Ali invests $2950 in an account paying 12% compound interest. Bob invests $3000 in an account paying 12% simple interest. Show that after 3 years Ali has a larger investment than Bob. [5]
Mark scheme: 28 For showing Ali and Bob’s final 5 B2 for final value of the compound interest investment values to compare investment for comparison e.g. 4140 or 4144 to 4145 e.g. 4140 or 4144 to 4145 and 4080 e.g.174000 or 174449 to 174450 e.g. 174000 or 174449 to 174450 and 15960 12 k or M1 for 2950 × (1 + ) 100 where k = 3, 12, 36 or a time frame clearly shown in the working. AND B3 for final value of the total simple interest investment for comparison e.g. 4080 e.g.15960 or B2 for value of simple interest e.g.1080 e.g.12960 3000 12 k or M2 for 3000 + oe 100 where k = 3, 12, 36 or a time frame clearly shown in the working. 3000 12 k or M1 for oe 100 where k = 3, 12, 36 or a time frame clearly shown in the working.
What was in this paper
The subtopics covered by these 28 questions, and how many questions each got. Open one in a new tab to see every Cambridge question on it.
3Powers and roots3Averages and range2Geometrical terms2Types of number2Area and perimeter1Circles, arcs and sectors1Coordinates1Equations1Equations of linear graphs1Fractions, decimals and percentages1Graphs of functions1Inequalities1Introduction to algebra1Right-angled triangles1Scale drawings1Scatter diagrams1Similarity1Standard form1Surface area and volume1Time1What you needed in this session
Cambridge’s own grade thresholds for 2025 Oct/Nov, Paper 3 · Variant 2. A higher threshold means an easier paper — the bar moves with how the cohort did.