Cambridge IGCSE Geography (9-1) 0976 — 2020 Oct/Nov Paper 1 · Variant 2
0976/12/O/N/20 · 75 marks · ≈84 min
The question paper and its mark scheme, free to read here and free to download. This is Cambridge’s own paper, exactly as it was sat.
Question paper32 pages







Mark scheme23 pages
Answers below. Sit the paper first if you are practising.
Paper as text
Question paper, page 1
Cambridge IGCSE™(9–1) This document has 32 pages. Blank pages are indicated. DC (LK) 202350 © UCLES 2020 [Turn over * 9 1 3 8 5 2 8 5 4 1 * GEOGRAPHY 0976/12 Paper 1 Geographical Themes October/November 2020 1 hour 45 minutes You must answer on the question paper. You will need: Insert (enclosed) Calculator Ruler INSTRUCTIONS ● Answer three questions in total, one from each section. ● Use a black or dark blue pen. You may use an HB pencil for any diagrams or graphs. ● Write your name, centre number and candidate number in the boxes at the top of the page. ● Write your answer to each question in the space provided. ● Do not use an erasable pen or correction fluid. ● Do not write on any bar codes. ● If additional space is needed, you should use the lined pages at the end of this booklet; the question number or numbers must be clearly shown. INFORMATION ● The total mark for this paper is 75. ● The number of marks for each question or part question is shown in brackets [ ]. ● The insert contains additional resources referred to in the questions. Definitions MEDCs – More Economically Developed Countries LEDCs – Less Economically Developed Countries
Question paper, page 2
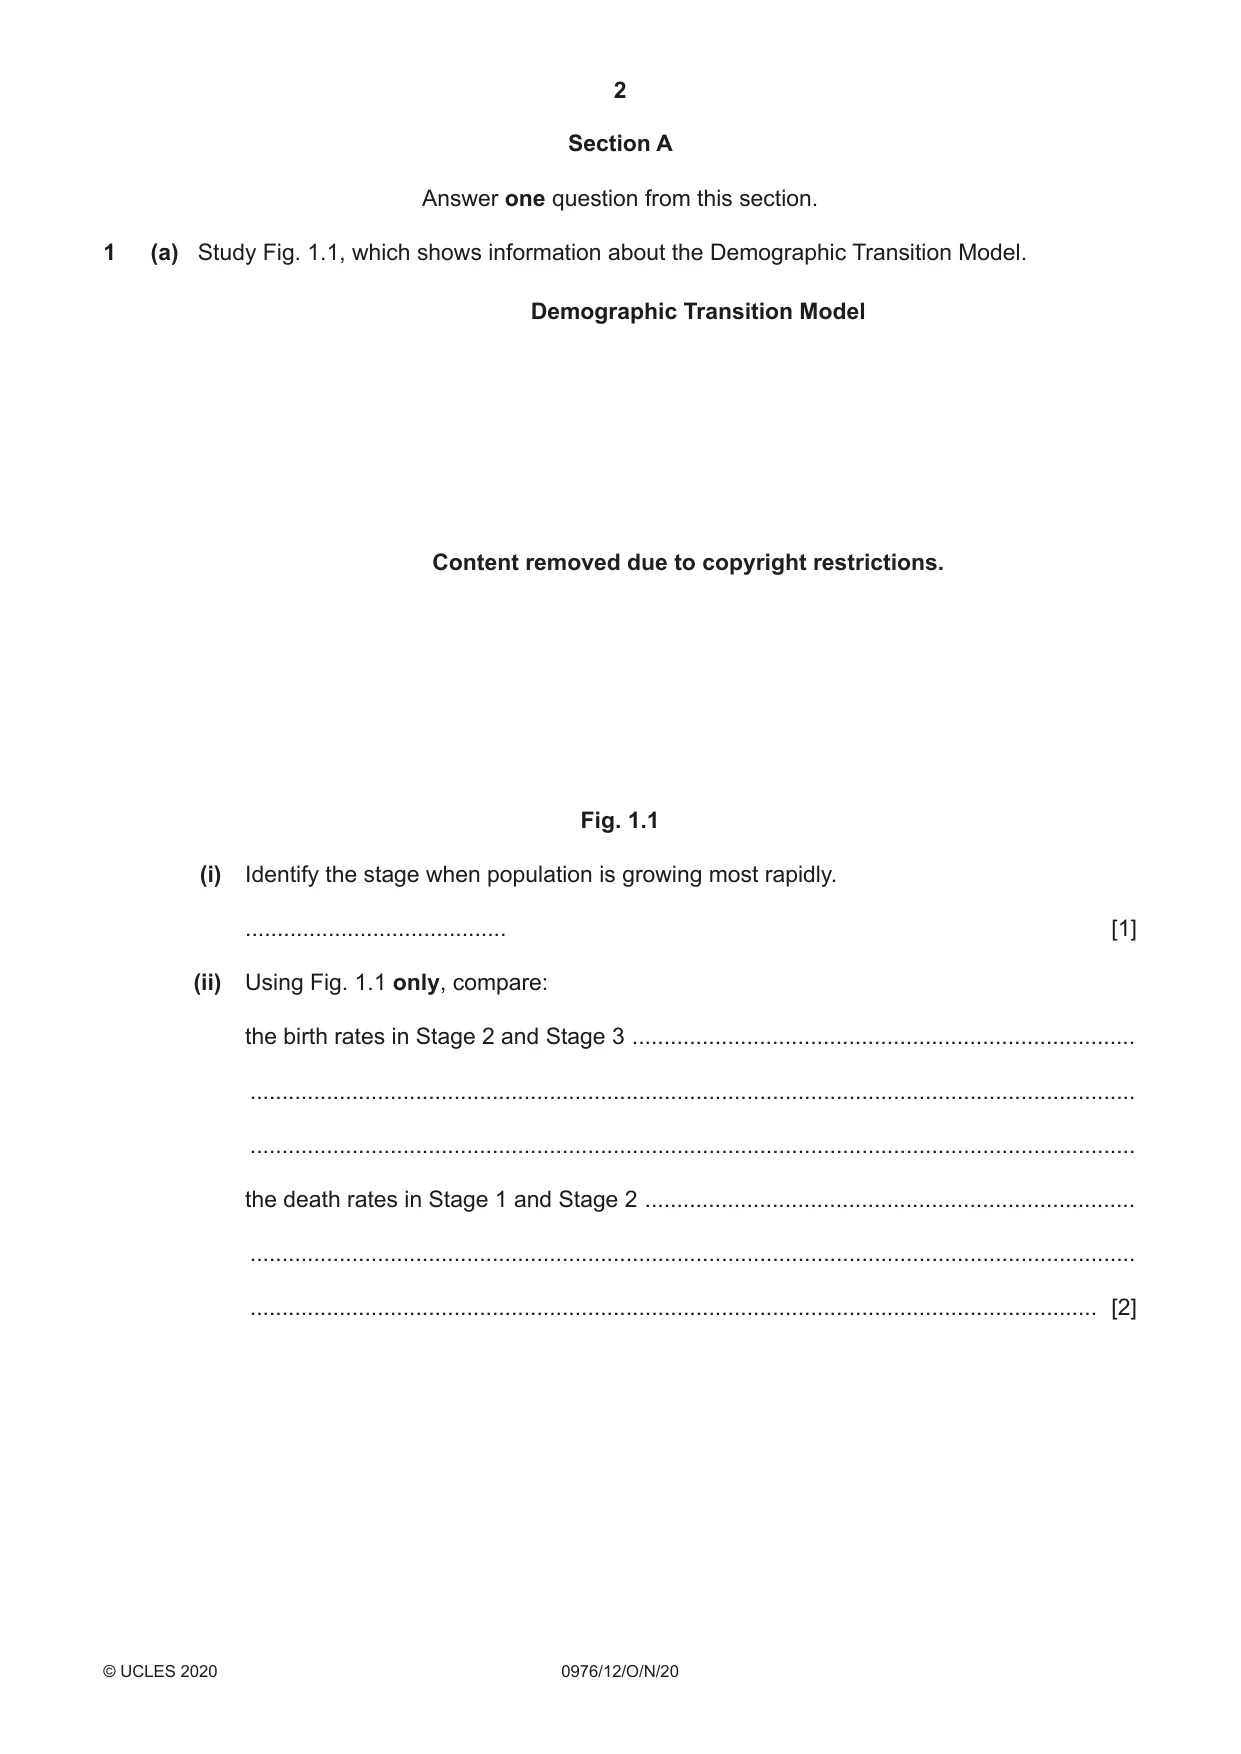
2 0976/12/O/N/20 © UCLES 2020 Section A Answer one question from this section. 1 (a) Study Fig. 1.1, which shows information about the Demographic Transition Model. Demographic Transition Model Fig. 1.1 (i) Identify the stage when population is growing most rapidly. … [1] (ii) Using Fig. 1.1 only, compare: the birth rates in Stage 2 and Stage 3 … … … the death rates in Stage 1 and Stage 2 … … … [2] Content removed due to copyright restrictions.
Question paper, page 3
3 0976/12/O/N/20 © UCLES 2020 [Turn over (iii) Using information from Fig. 1.1 only, explain why the rate of population growth changes as a country moves from Stage 1 to Stage 4. … … … … … … … … [3] (iv) Explain why birth rates are still high in many LEDCs. … … … … … … … … [4]
Question paper, page 4
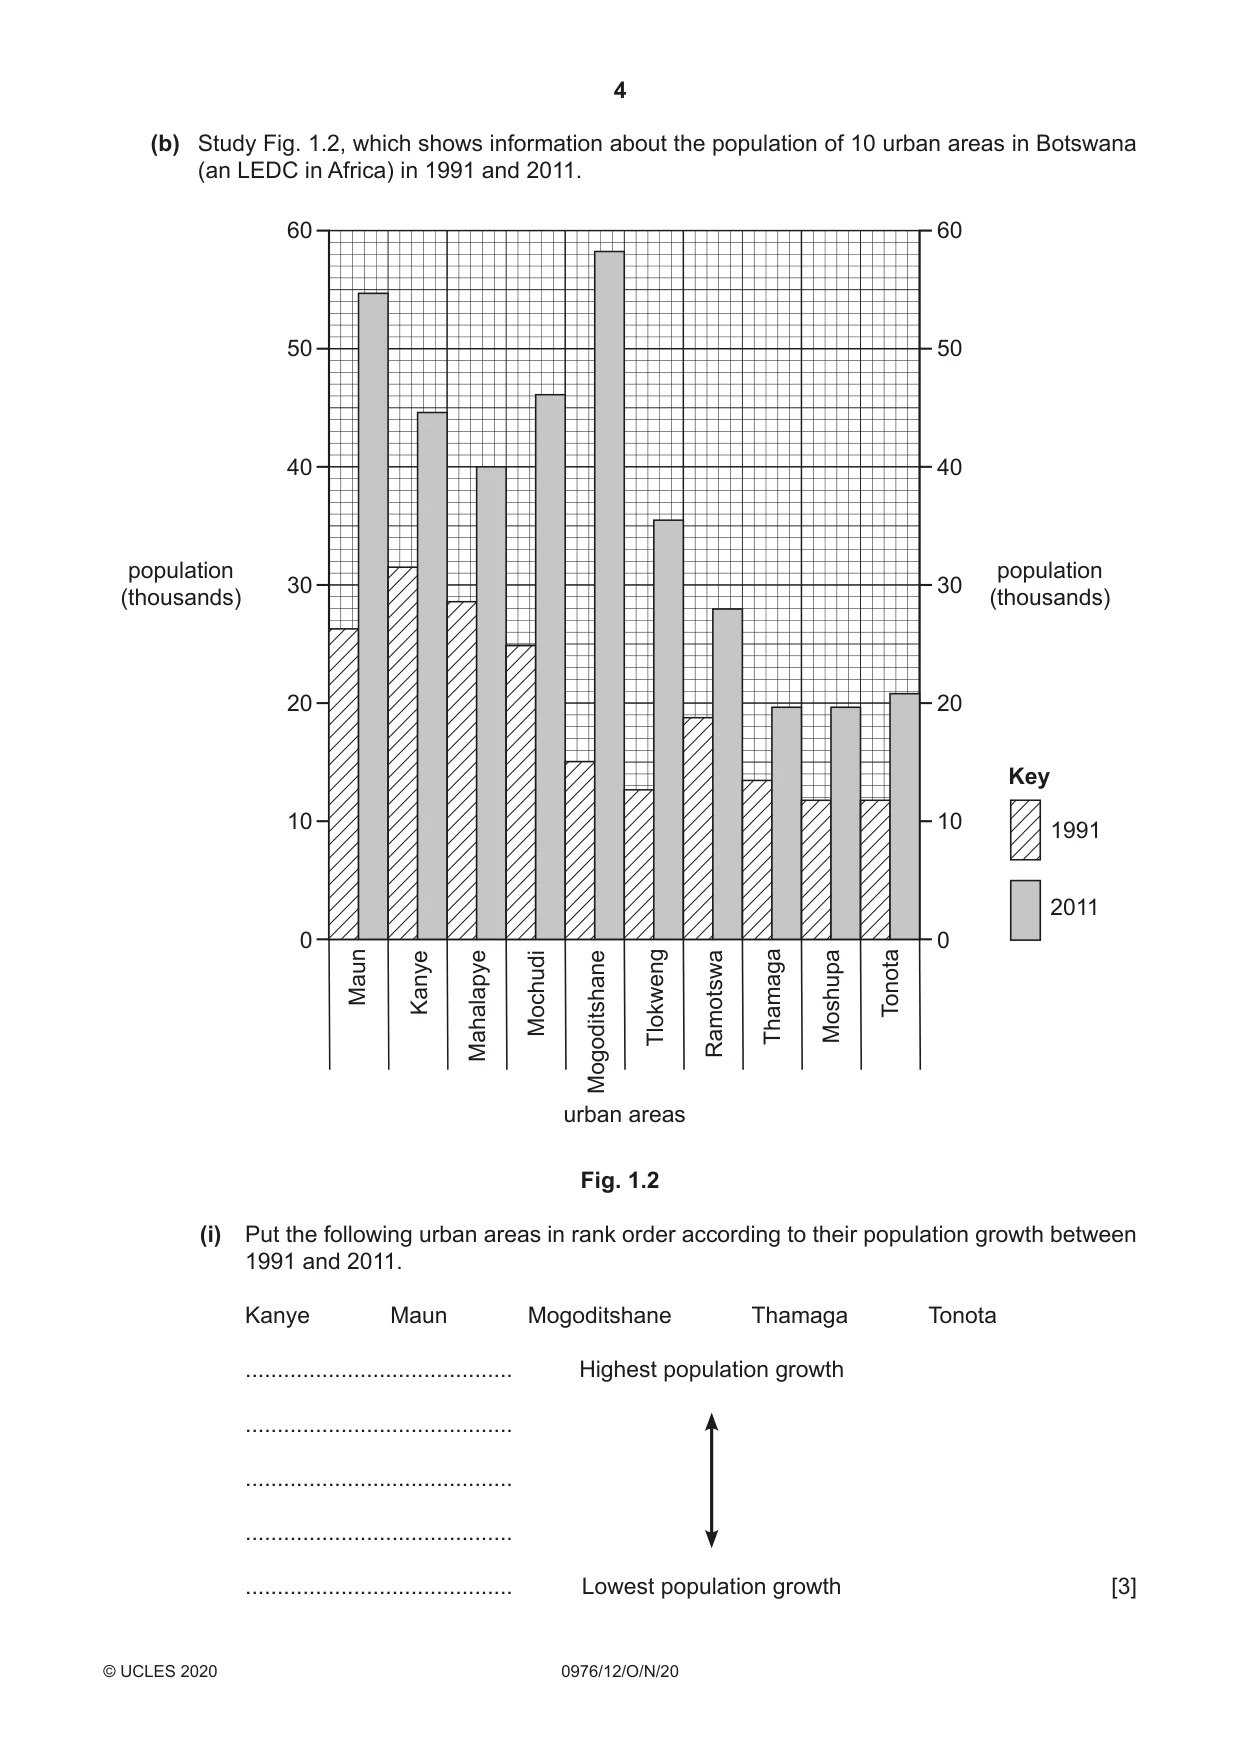
4 0976/12/O/N/20 © UCLES 2020 (b) Study Fig. 1.2, which shows information about the population of 10 urban areas in Botswana (an LEDC in Africa) in 1991 and 2011. 60 50 40 30 population (thousands) population (thousands) Key 20 urban areas Maun Kanye Mahalapye Mochudi Mogoditshane Tlokweng Ramotswa Thamaga Moshupa Tonota 10 0 60 50 40 30 20 10 1991 2011 0 Fig. 1.2 (i) Put the following urban areas in rank order according to their population growth between 1991 and 2011. Kanye Maun Mogoditshane Thamaga Tonota … Highest population growth … … … … Lowest population growth [3]
Question paper, page 5
5 0976/12/O/N/20 © UCLES 2020 [Turn over (ii) Describe the problems caused by rapid population growth in urban areas in LEDCs. … … … … … … … … … … [5]
Question paper, page 6
6 0976/12/O/N/20 © UCLES 2020 (c) For a country or area you have studied which is sparsely populated, explain why there is a low population density. Name of country or area … … … … … … … … … … … … … … … … … … … … … … … … … … [7] [Total: 25]
Question paper, page 7
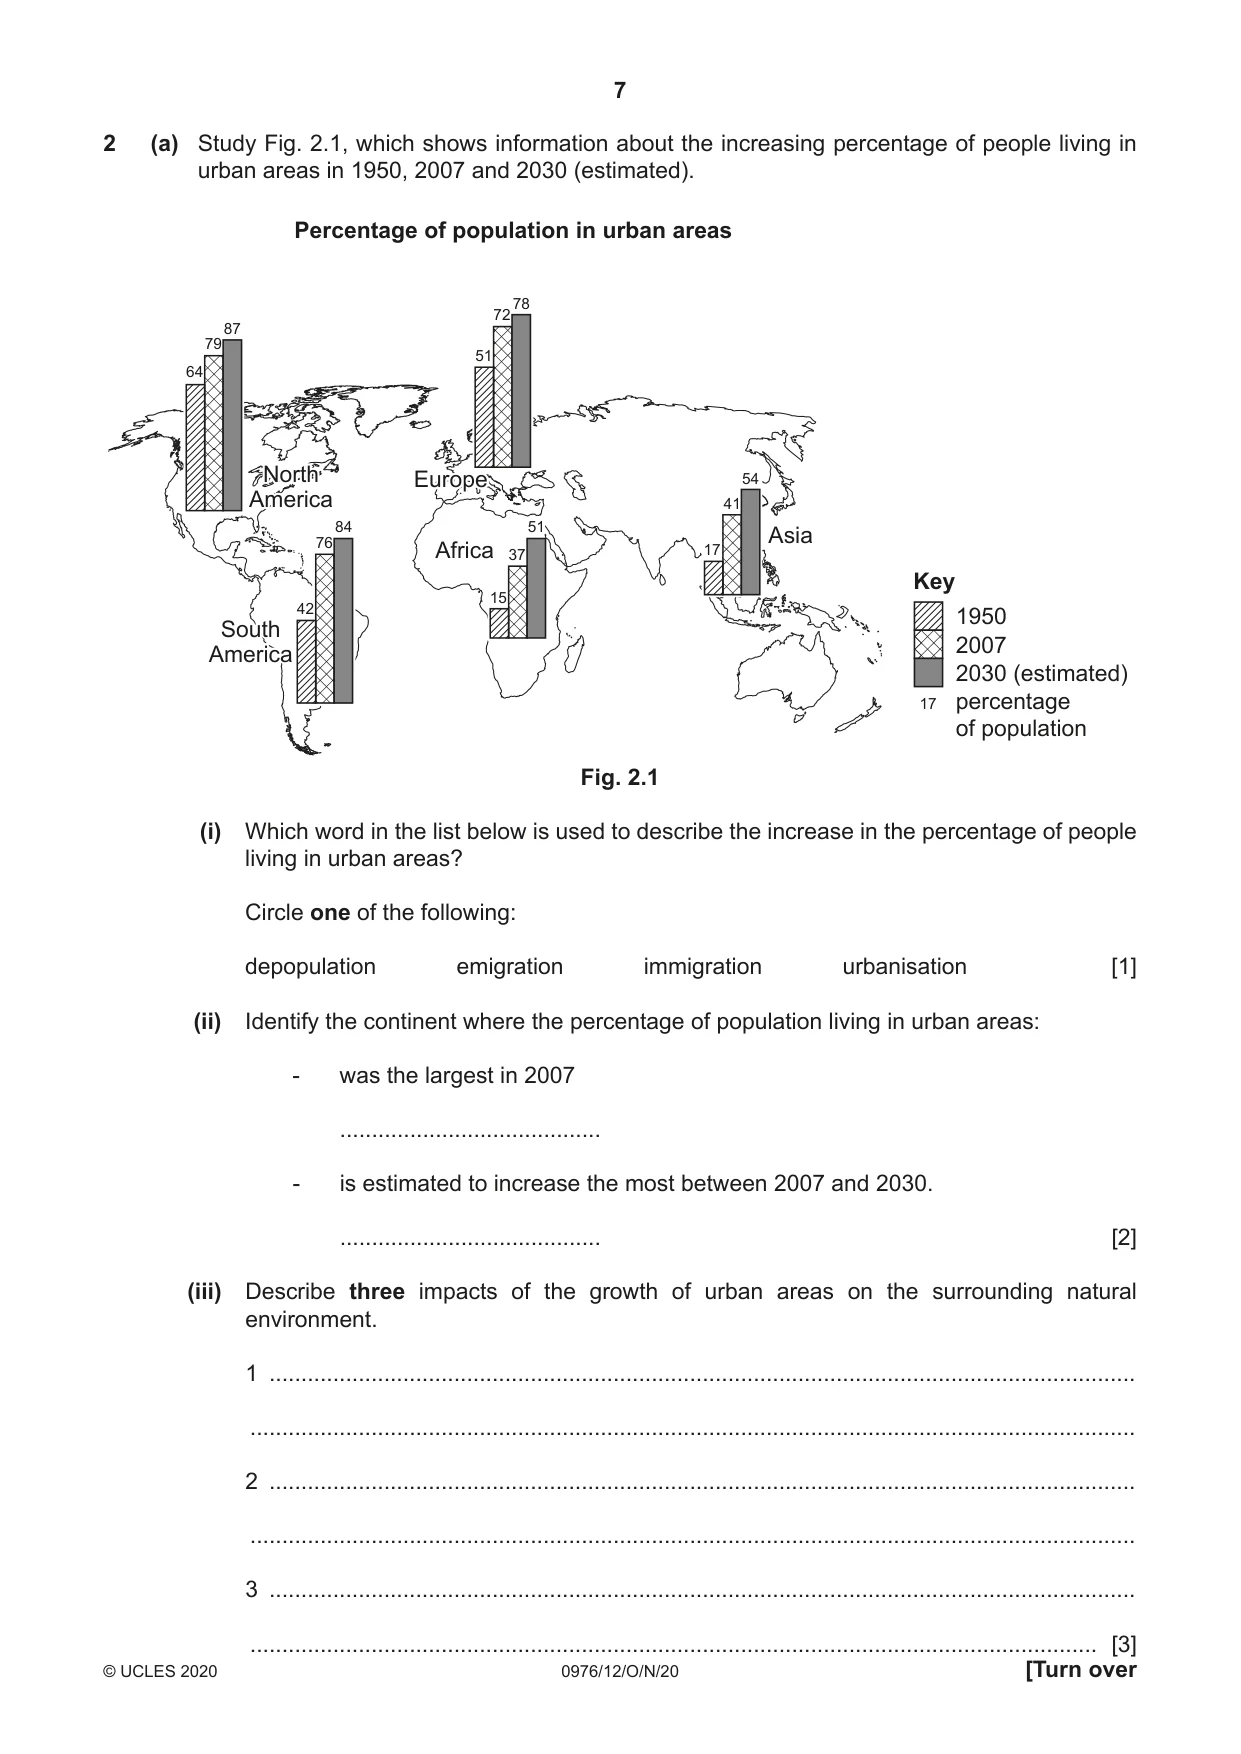
7 0976/12/O/N/20 © UCLES 2020 [Turn over 2 (a) Study Fig. 2.1, which shows information about the increasing percentage of people living in urban areas in 1950, 2007 and 2030 (estimated). 1950 2007 2030 (estimated) percentage of population Percentage of population in urban areas North America South America 51 78 72 Europe Europe Asia Key 17 17 41 54 Africa 37 15 51 North America South America 42 76 84 64 79 87 Fig. 2.1 (i) Which word in the list below is used to describe the increase in the percentage of people living in urban areas? Circle one of the following: depopulation emigration immigration urbanisation [1] (ii) Identify the continent where the percentage of population living in urban areas: - was the largest in 2007 … - is estimated to increase the most between 2007 and 2030. … [2] (iii) Describe three impacts of the growth of urban areas on the surrounding natural environment. 1 … … 2 … … 3 … … [3]
Question paper, page 8
8 0976/12/O/N/20 © UCLES 2020 (iv) Explain why rural areas experience problems when large numbers of people move away from them. … … … … … … … … [4] (b) Study Fig. 2.2 (Insert), which is a photograph showing homes in a squatter settlement in Accra, Ghana (an LEDC in Africa). (i) Describe three features of the buildings shown in Fig. 2.2. 1 … … 2 … … 3 … … [3] (ii) Explain why many people who live in squatter settlements suffer from diseases. … … … … … … … … … … [5]
Question paper, page 9
9 0976/12/O/N/20 © UCLES 2020 [Turn over (c) Explain why people have migrated to a named rapidly growing urban area you have studied. Name of urban area … … … … … … … … … … … … … … … … … … … … … … … … … … [7] [Total: 25]
Question paper, page 10
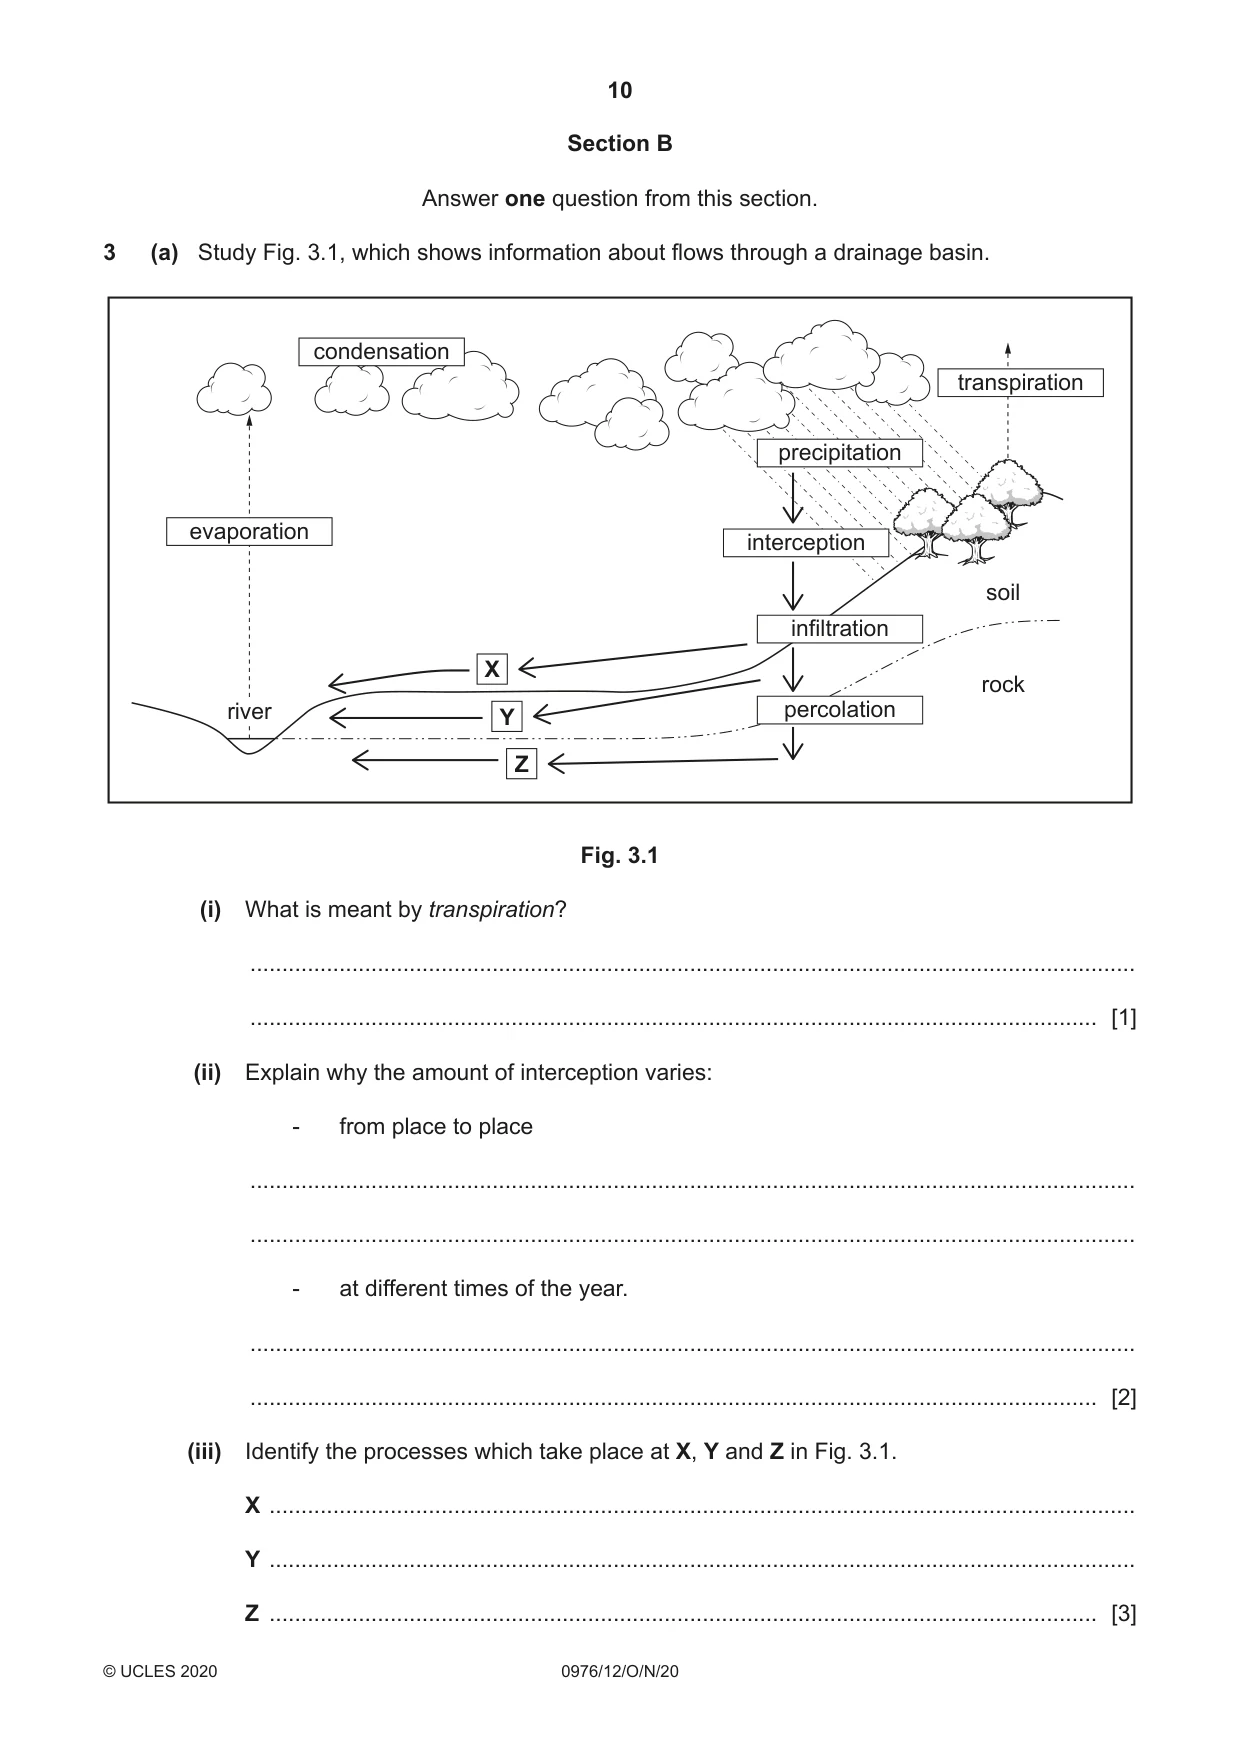
10 0976/12/O/N/20 © UCLES 2020 Section B Answer one question from this section. 3 (a) Study Fig. 3.1, which shows information about flows through a drainage basin. evaporation river condensation transpiration infiltration soil rock percolation precipitation interception X Y Z Fig. 3.1 (i) What is meant by transpiration? … … [1] (ii) Explain why the amount of interception varies: - from place to place … … - at different times of the year. … … [2] (iii) Identify the processes which take place at X, Y and Z in Fig. 3.1. X … Y … Z … [3]
Question paper, page 11
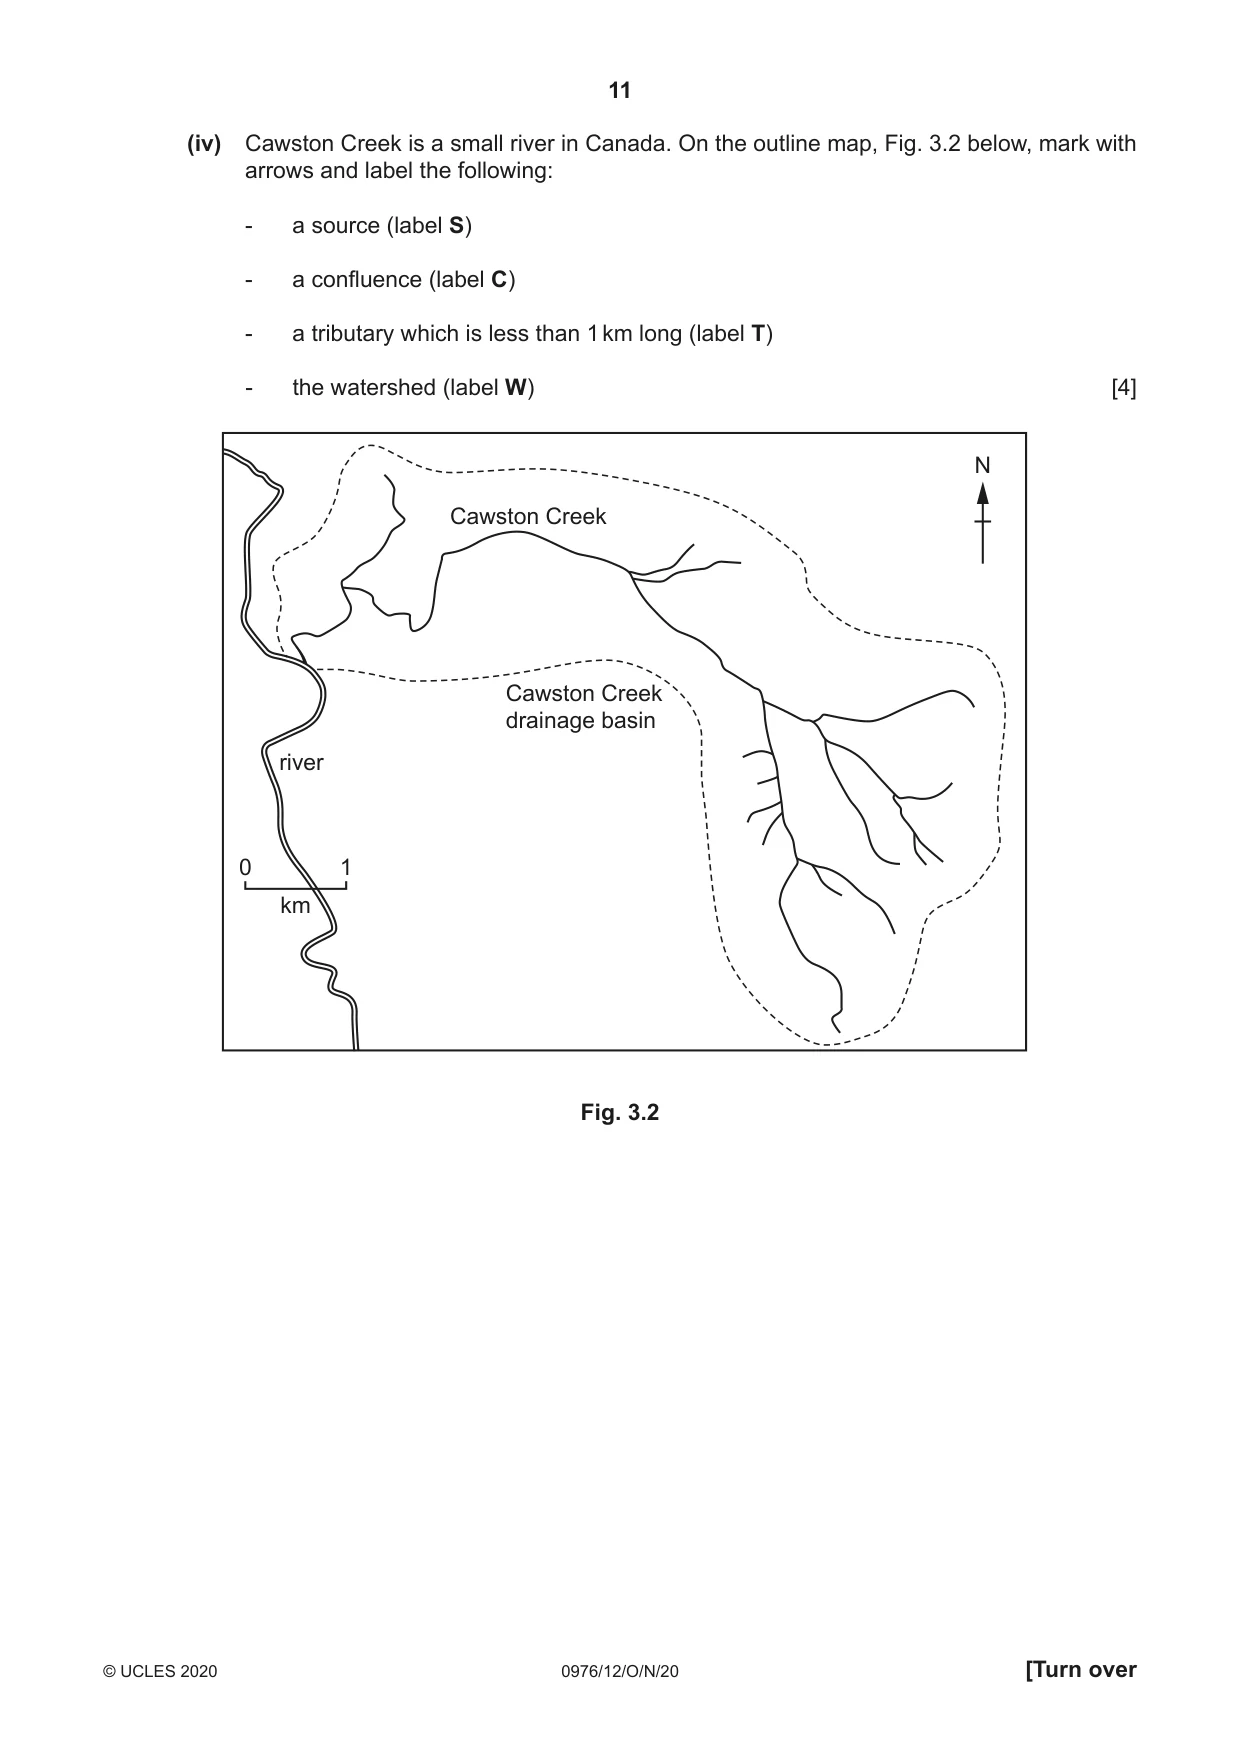
11 0976/12/O/N/20 © UCLES 2020 [Turn over (iv) Cawston Creek is a small river in Canada. On the outline map, Fig. 3.2 below, mark with arrows and label the following: - a source (label S) - a confluence (label C) - a tributary which is less than 1 km long (label T) - the watershed (label W) [4] river Cawston Creek drainage basin 0 km Cawston Creek N 1 Fig. 3.2
Question paper, page 12
12 0976/12/O/N/20 © UCLES 2020 (b) Study Figs. 3.3 and 3.4 (Insert), which are photographs showing two different rivers and their valleys. (i) Describe the similarities and differences between the rivers shown in Figs. 3.3 and 3.4. … … … … … … [3] (ii) Explain how rivers erode their valleys. … … … … … … … … … … [5]
Question paper, page 13
13 0976/12/O/N/20 © UCLES 2020 [Turn over (c) Draw a labelled diagram to show the features of a river delta. Explain how a river delta is formed. … … … … … … … … … … … … … … … … [7] [Total: 25]
Question paper, page 14
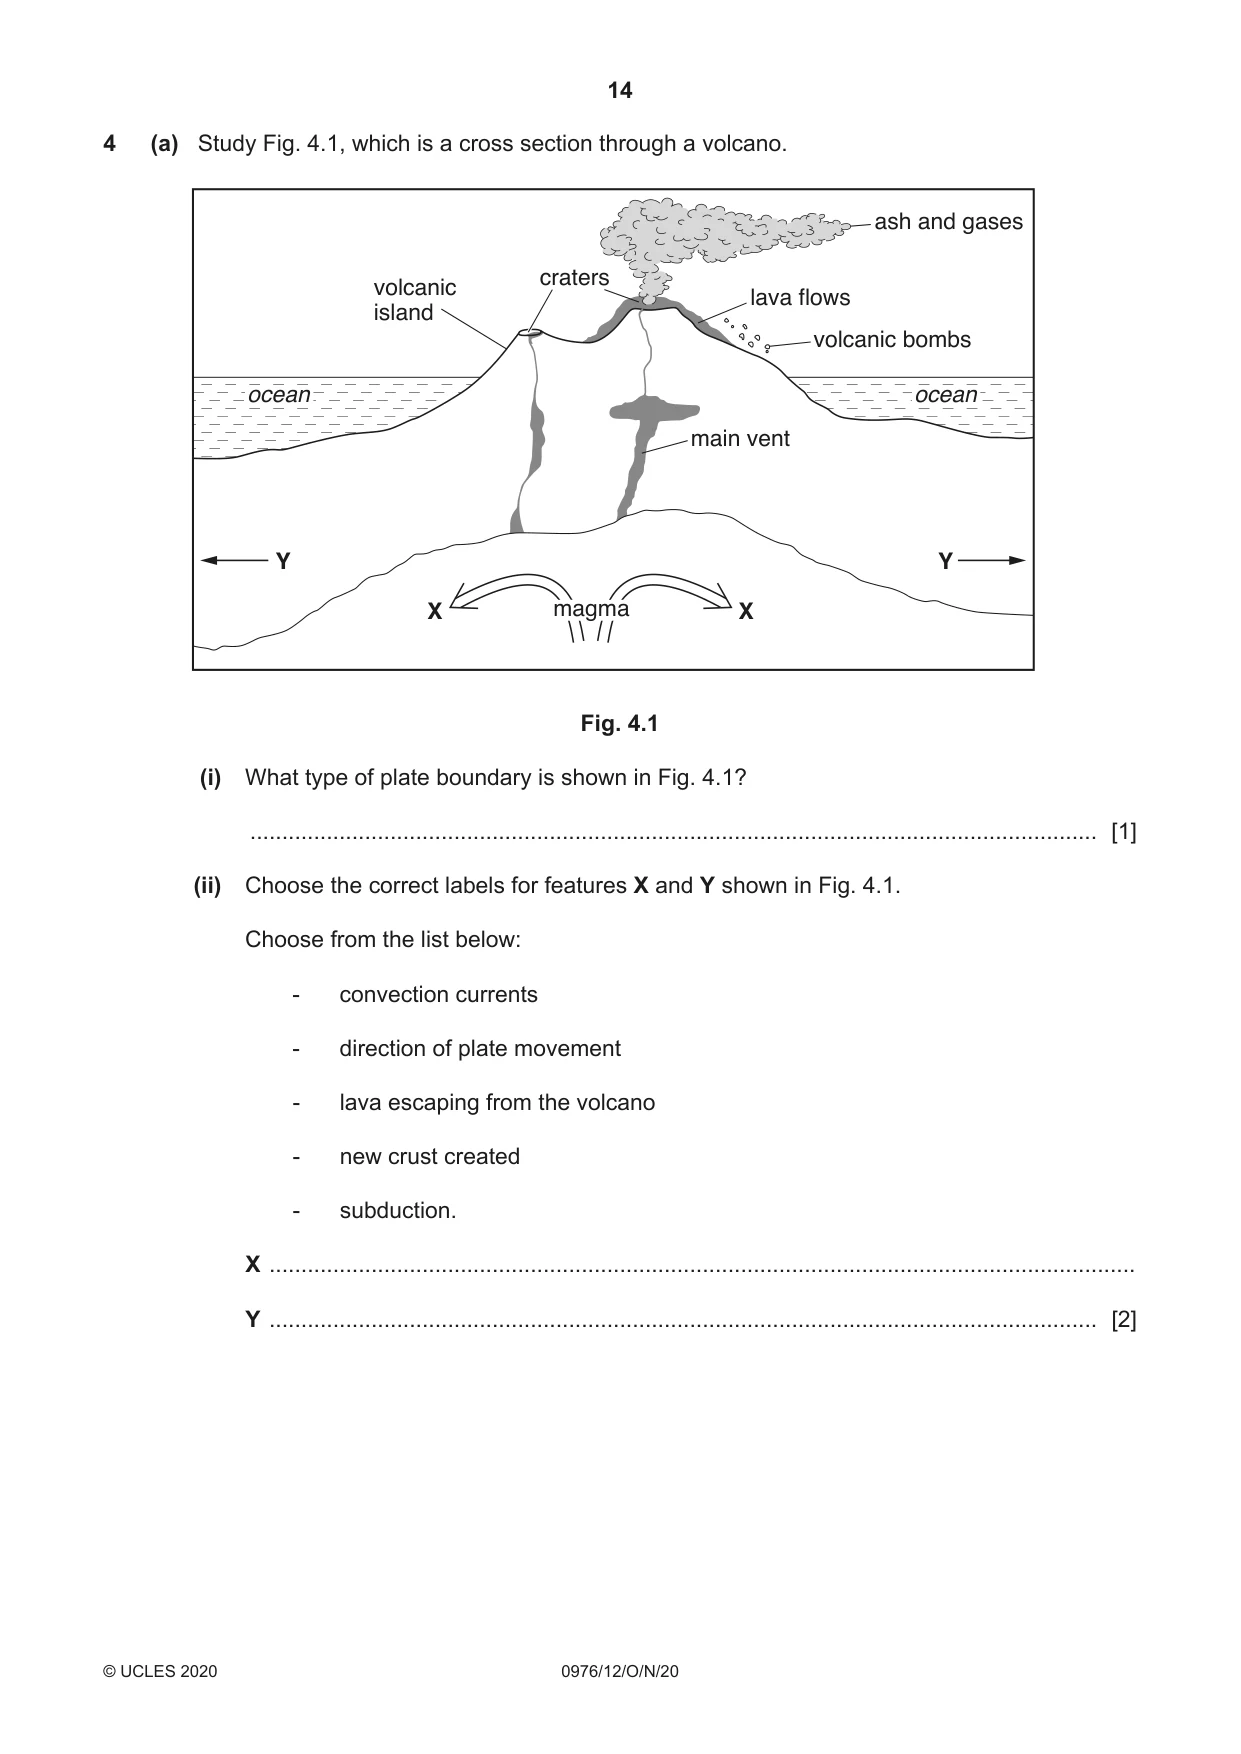
14 0976/12/O/N/20 © UCLES 2020 4 (a) Study Fig. 4.1, which is a cross section through a volcano. ocean ocean main vent magma volcanic island lava flows ash and gases volcanic bombs craters X X Y Y Fig. 4.1 (i) What type of plate boundary is shown in Fig. 4.1? … [1] (ii) Choose the correct labels for features X and Y shown in Fig. 4.1. Choose from the list below: - convection currents - direction of plate movement - lava escaping from the volcano - new crust created - subduction. X … Y … [2]
Question paper, page 15
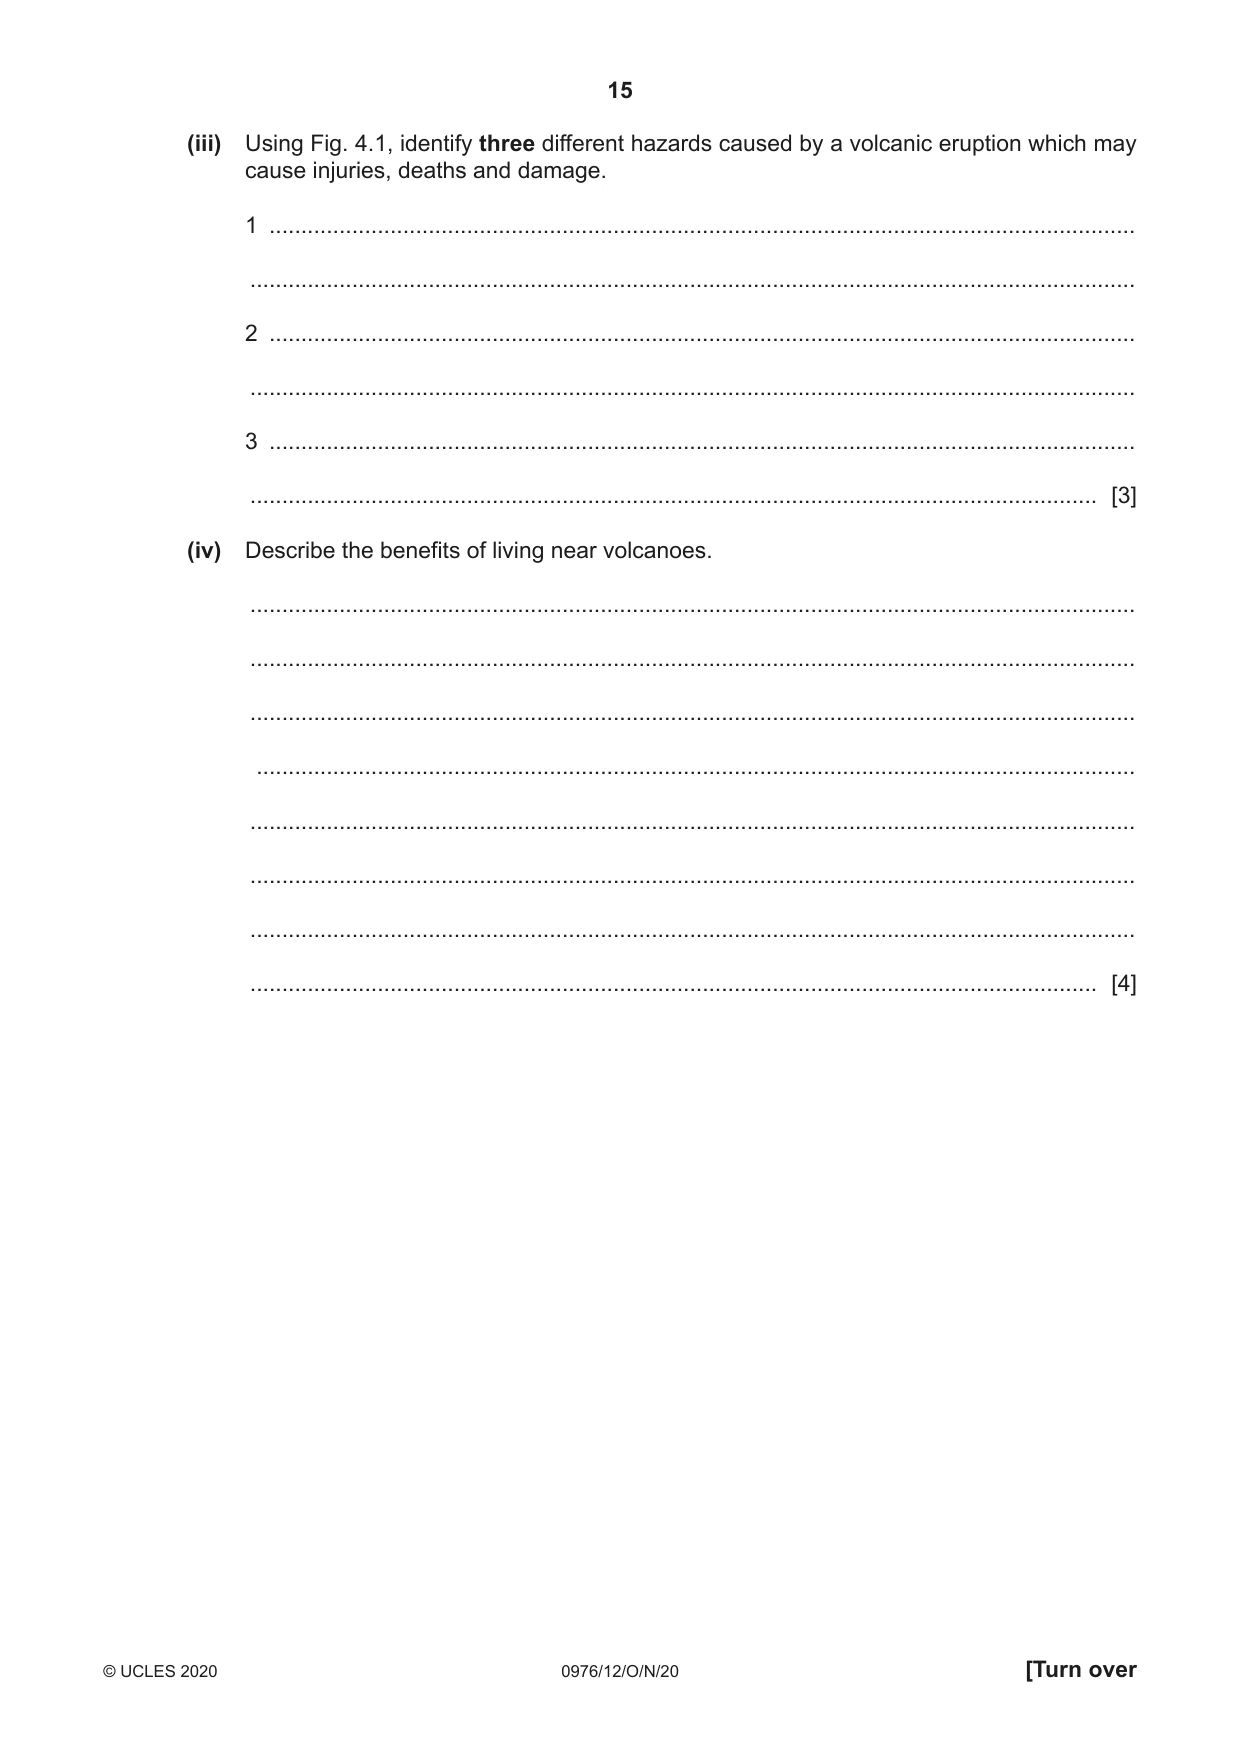
15 0976/12/O/N/20 © UCLES 2020 [Turn over (iii) Using Fig. 4.1, identify three different hazards caused by a volcanic eruption which may cause injuries, deaths and damage. 1 … … 2 … … 3 … … [3] (iv) Describe the benefits of living near volcanoes. … … … … … … … … [4]
Question paper, page 16
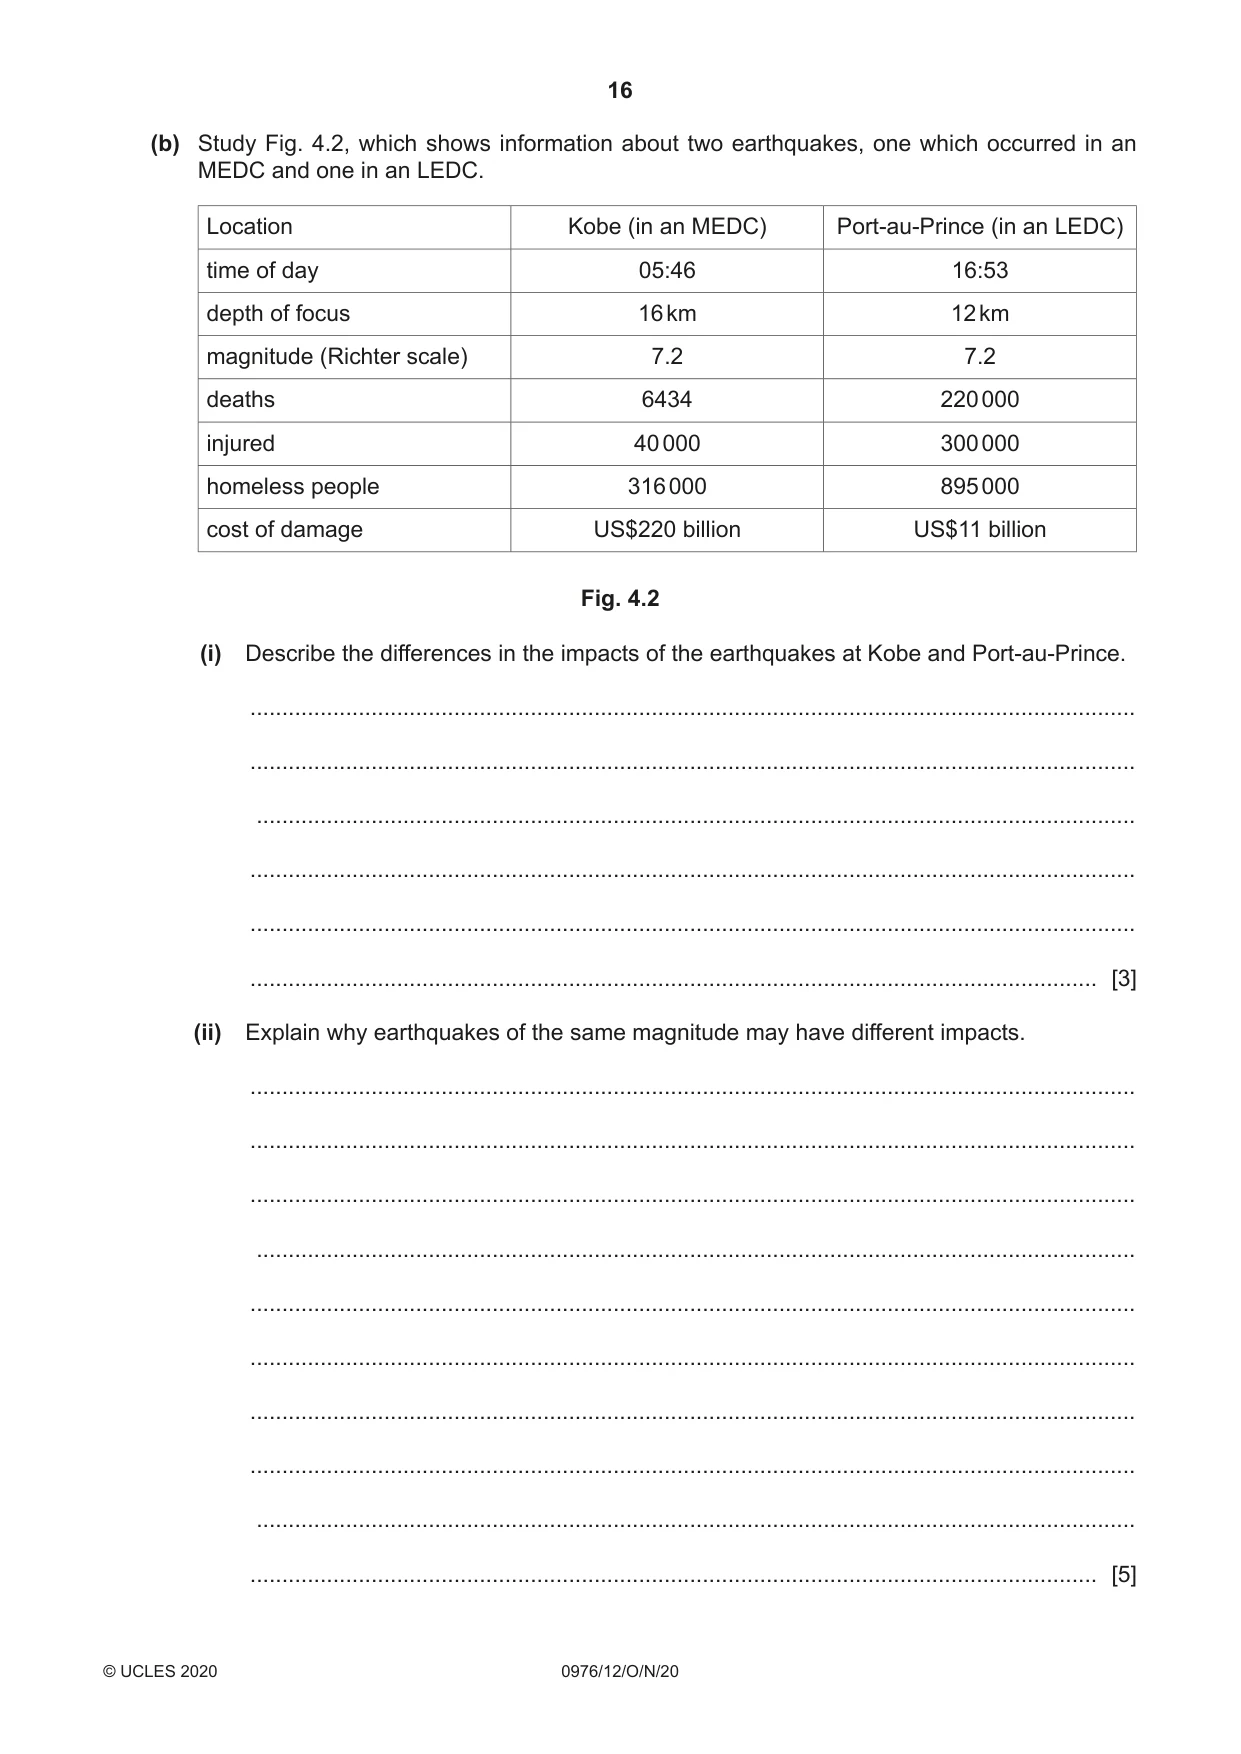
16 0976/12/O/N/20 © UCLES 2020 (b) Study Fig. 4.2, which shows information about two earthquakes, one which occurred in an MEDC and one in an LEDC. Location Kobe (in an MEDC) Port-au-Prince (in an LEDC) time of day 05:46 16:53 depth of focus 16 km 12 km magnitude (Richter scale) 7.2 7.2 deaths 6434 220 000 injured 40 000 300 000 homeless people 316 000 895 000 cost of damage US$220 billion US$11 billion Fig. 4.2 (i) Describe the differences in the impacts of the earthquakes at Kobe and Port-au-Prince. … … … … … … [3] (ii) Explain why earthquakes of the same magnitude may have different impacts. … … … … … … … … … … [5]
Question paper, page 17
17 0976/12/O/N/20 © UCLES 2020 [Turn over (c) For a named example you have studied, explain the causes of an earthquake. Name of example … … … … … … … … … … … … … … … … … … … … … … … … … … [7] [Total: 25]
Question paper, page 18
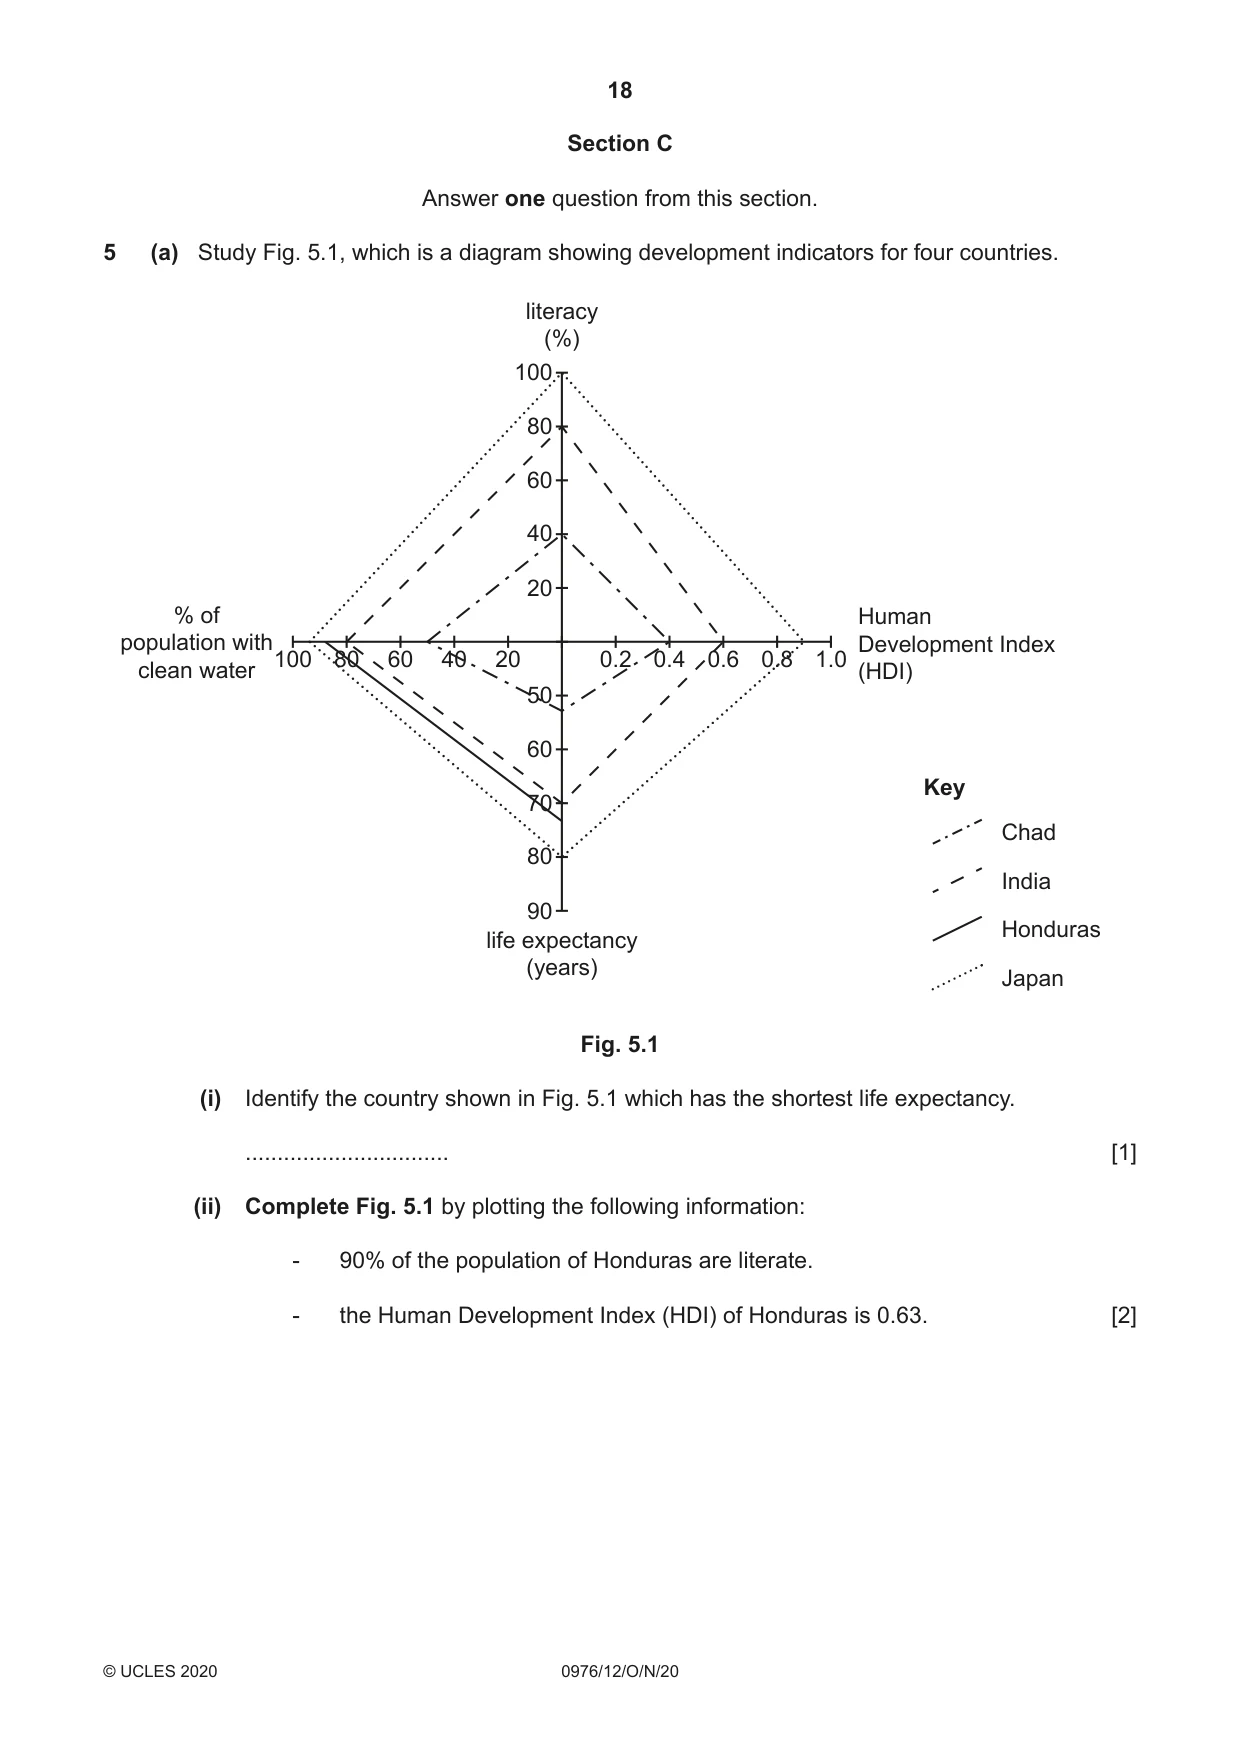
18 0976/12/O/N/20 © UCLES 2020 Section C Answer one question from this section. 5 (a) Study Fig. 5.1, which is a diagram showing development indicators for four countries. 20 20 60 100 40 60 80 100 90 80 70 60 50 40 1.0 Human Development Index (HDI) Key Chad India Honduras Japan % of population with clean water literacy (%) life expectancy (years) 0.6 0.2 0.8 0.4 80 Fig. 5.1 (i) Identify the country shown in Fig. 5.1 which has the shortest life expectancy. … [1] (ii) Complete Fig. 5.1 by plotting the following information: - 90% of the population of Honduras are literate. - the Human Development Index (HDI) of Honduras is 0.63. [2]
Question paper, page 19
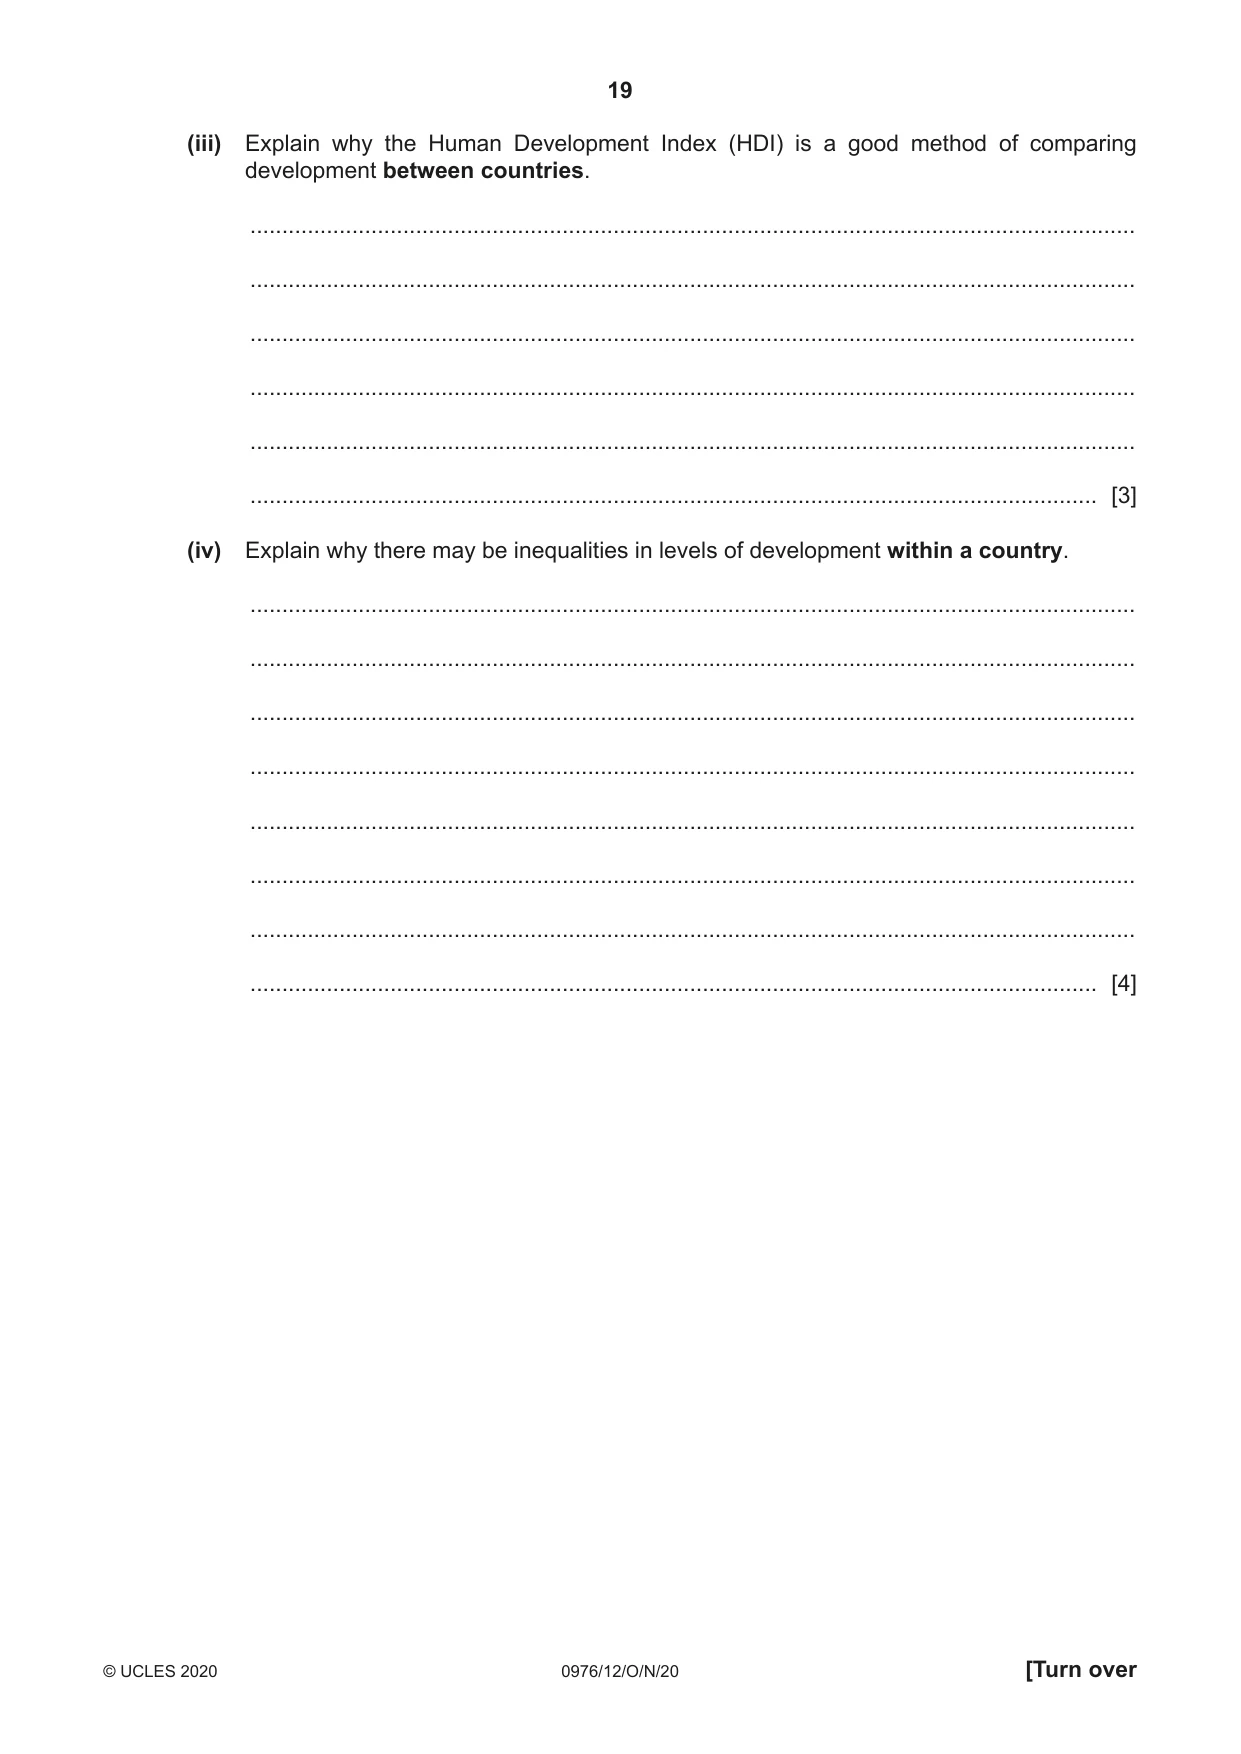
19 0976/12/O/N/20 © UCLES 2020 [Turn over (iii) Explain why the Human Development Index (HDI) is a good method of comparing development between countries. … … … … … … [3] (iv) Explain why there may be inequalities in levels of development within a country. … … … … … … … … [4]
Question paper, page 20
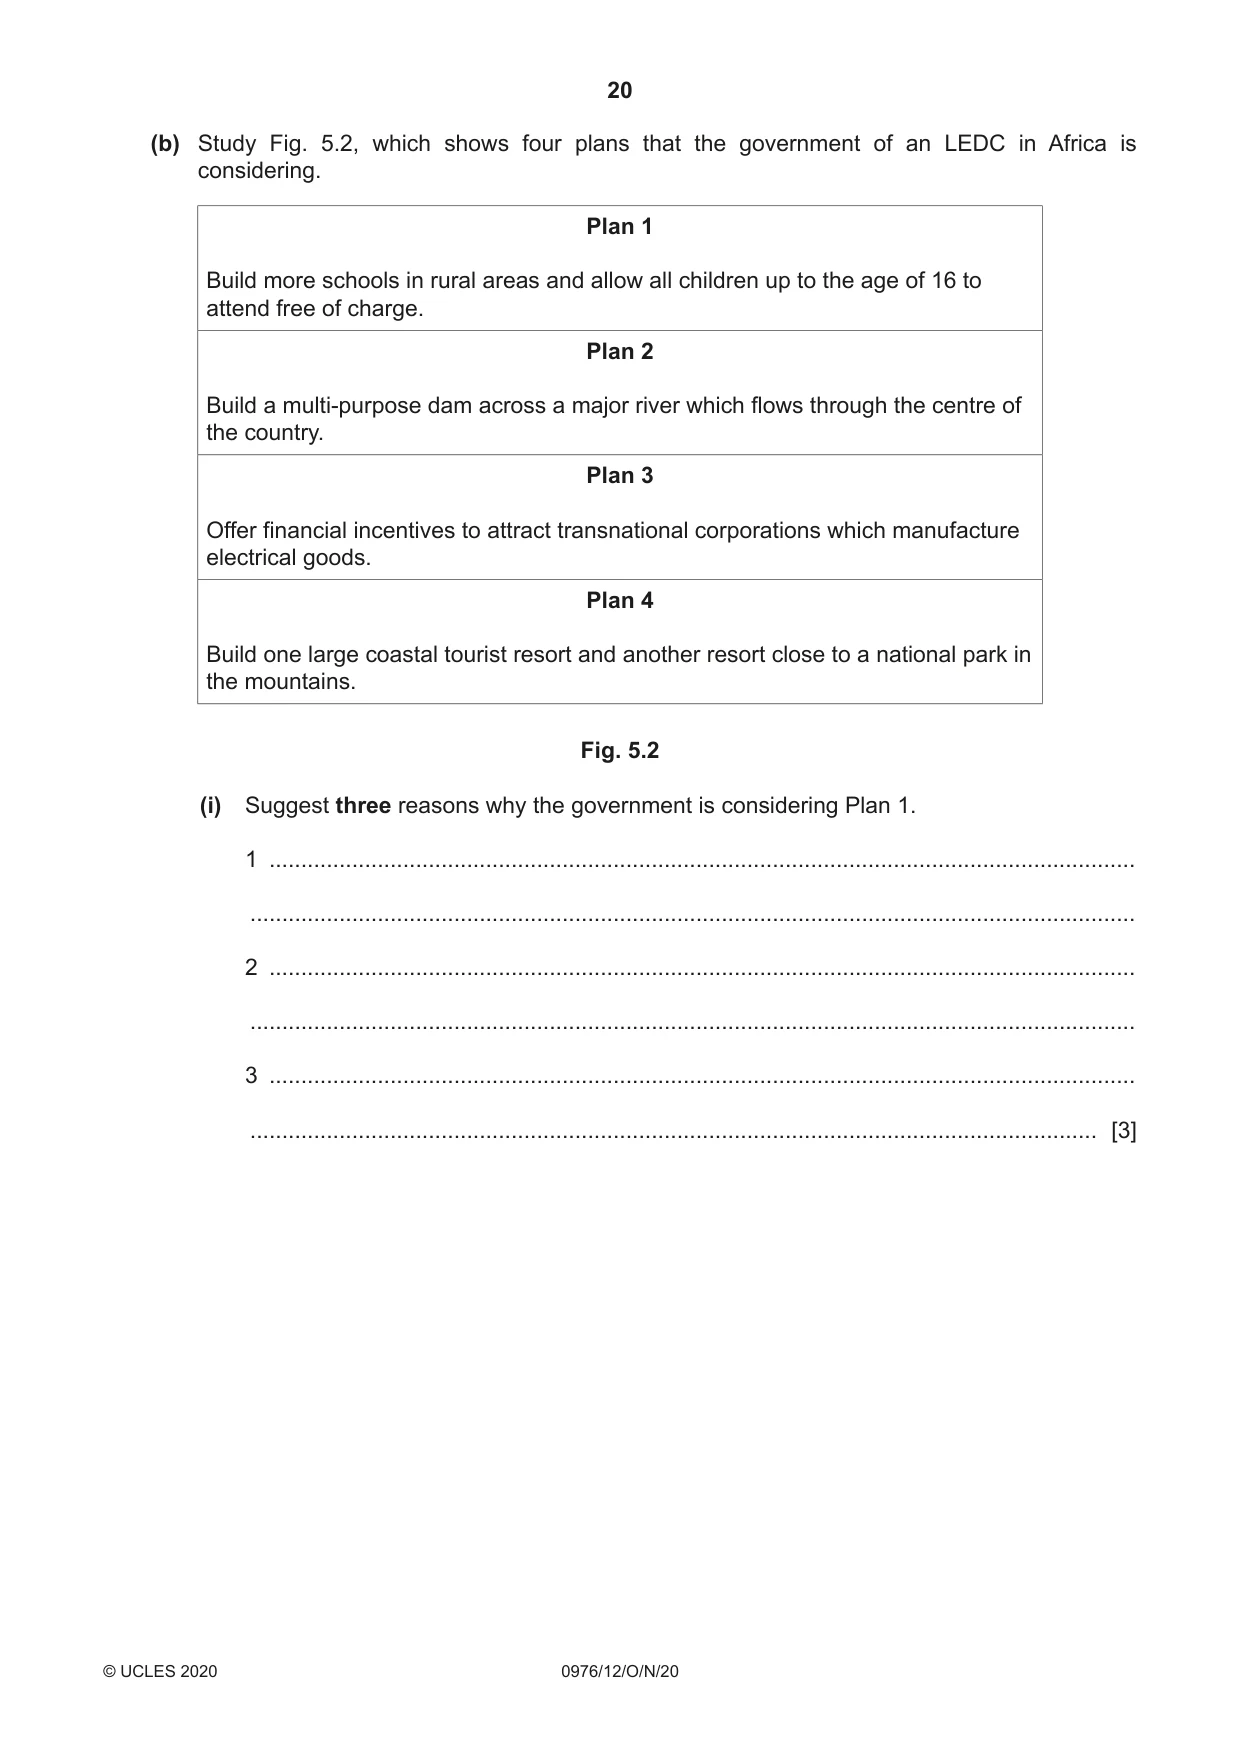
20 0976/12/O/N/20 © UCLES 2020 (b) Study Fig. 5.2, which shows four plans that the government of an LEDC in Africa is considering. Plan 1 Build more schools in rural areas and allow all children up to the age of 16 to attend free of charge. Plan 2 Build a multi-purpose dam across a major river which flows through the centre of the country. Plan 3 Offer financial incentives to attract transnational corporations which manufacture electrical goods. Plan 4 Build one large coastal tourist resort and another resort close to a national park in the mountains. Fig. 5.2 (i) Suggest three reasons why the government is considering Plan 1. 1 … … 2 … … 3 … … [3]
Question paper, page 21
21 0976/12/O/N/20 © UCLES 2020 [Turn over (ii) Choose Plan 2, 3 or 4. Explain why the plan which you have chosen will result in development in the country. Plan chosen … … … … … … … … … … … [5]
Question paper, page 22
22 0976/12/O/N/20 © UCLES 2020 (c) For a named area you have studied, describe how economic development is damaging the natural environment. Name of area … … … … … … … … … … … … … … … … … … … … … … … … … … [7] [Total: 25]
Question paper, page 23
23 0976/12/O/N/20 © UCLES 2020 [Turn over TURN PAGE FOR QUESTION 6
Question paper, page 24
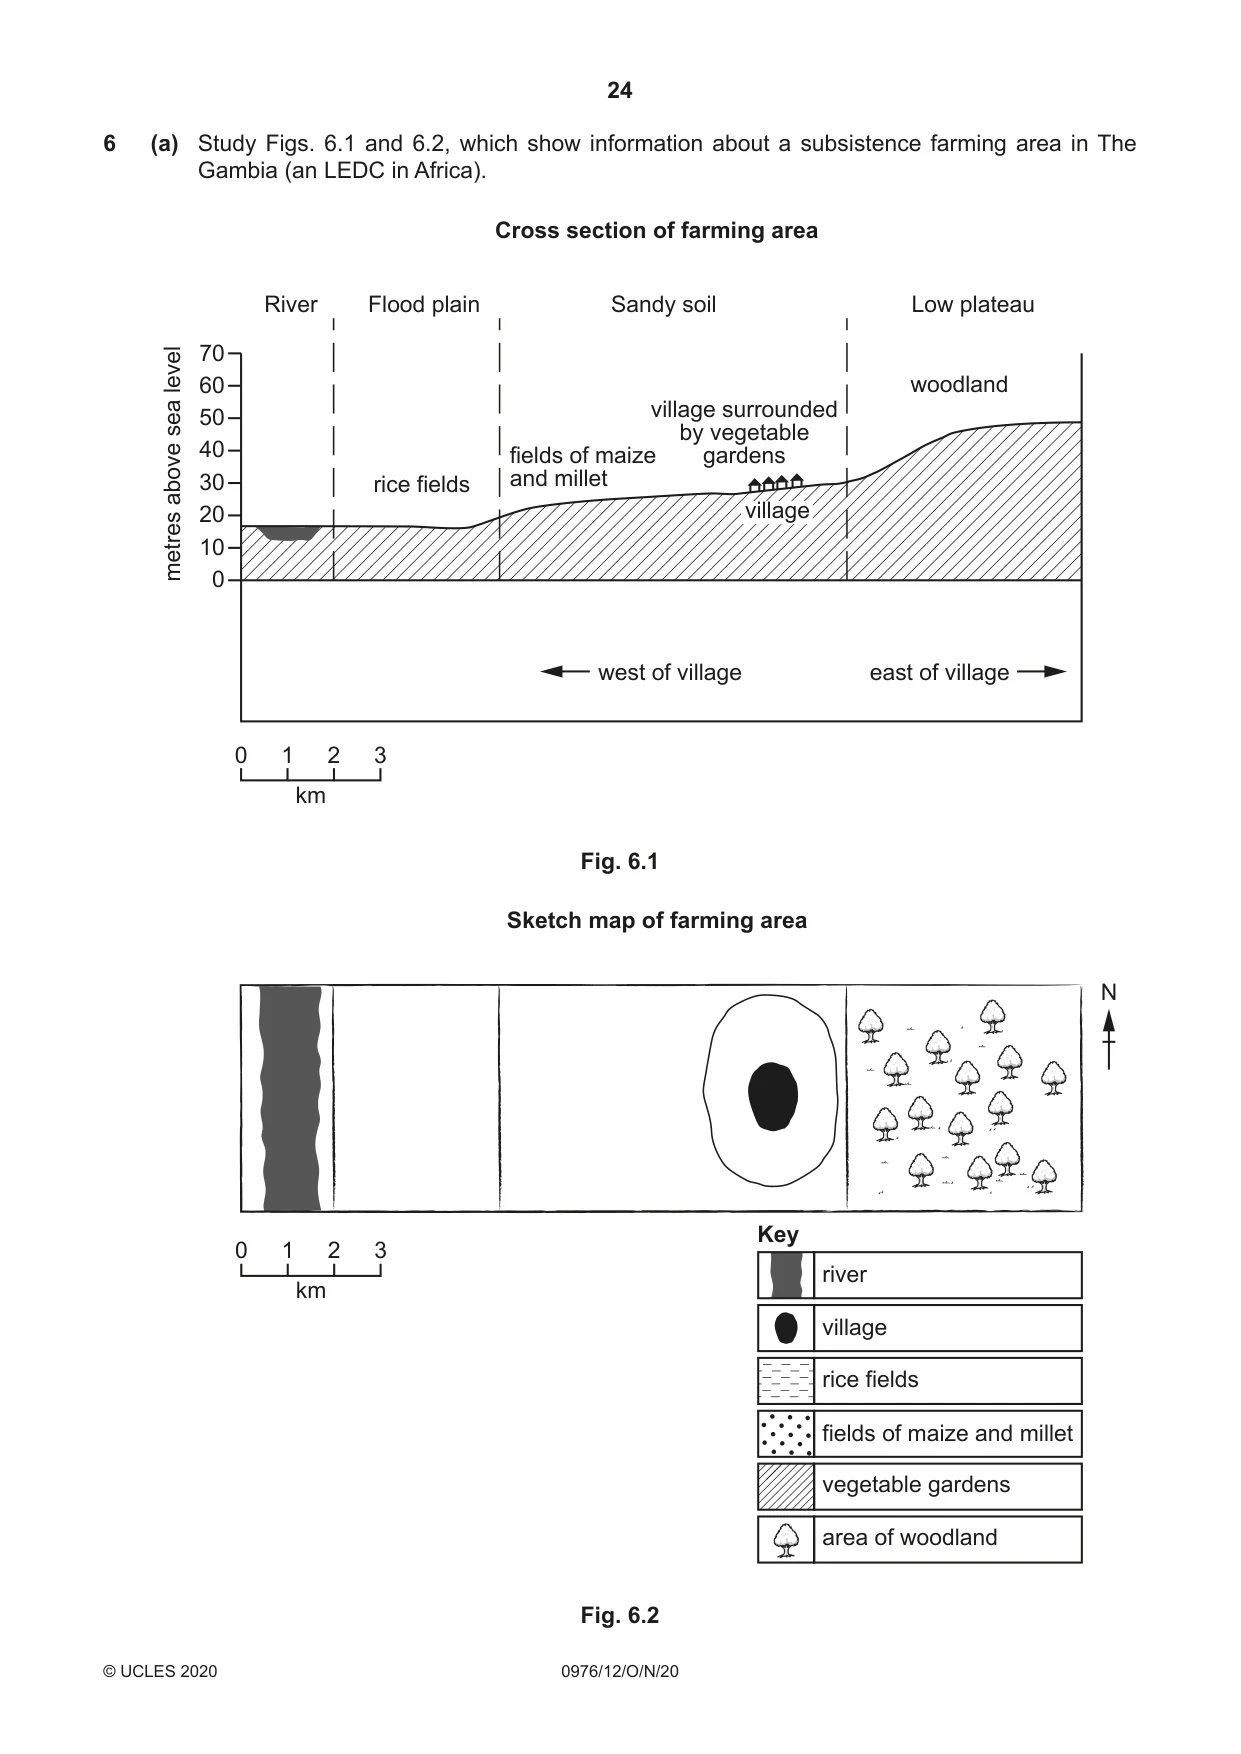
24 0976/12/O/N/20 © UCLES 2020 6 (a) Study Figs. 6.1 and 6.2, which show information about a subsistence farming area in The Gambia (an LEDC in Africa). 70 60 50 40 30 20 metres above sea level 10 0 rice fields woodland fields of maize and millet Flood plain Sandy soil Cross section of farming area Low plateau River village surrounded by vegetable gardens west of village km 0 1 2 3 east of village village Fig. 6.1 km 0 1 2 3 Sketch map of farming area N river village rice fields vegetable gardens area of woodland fields of maize and millet Key Fig. 6.2
Question paper, page 25
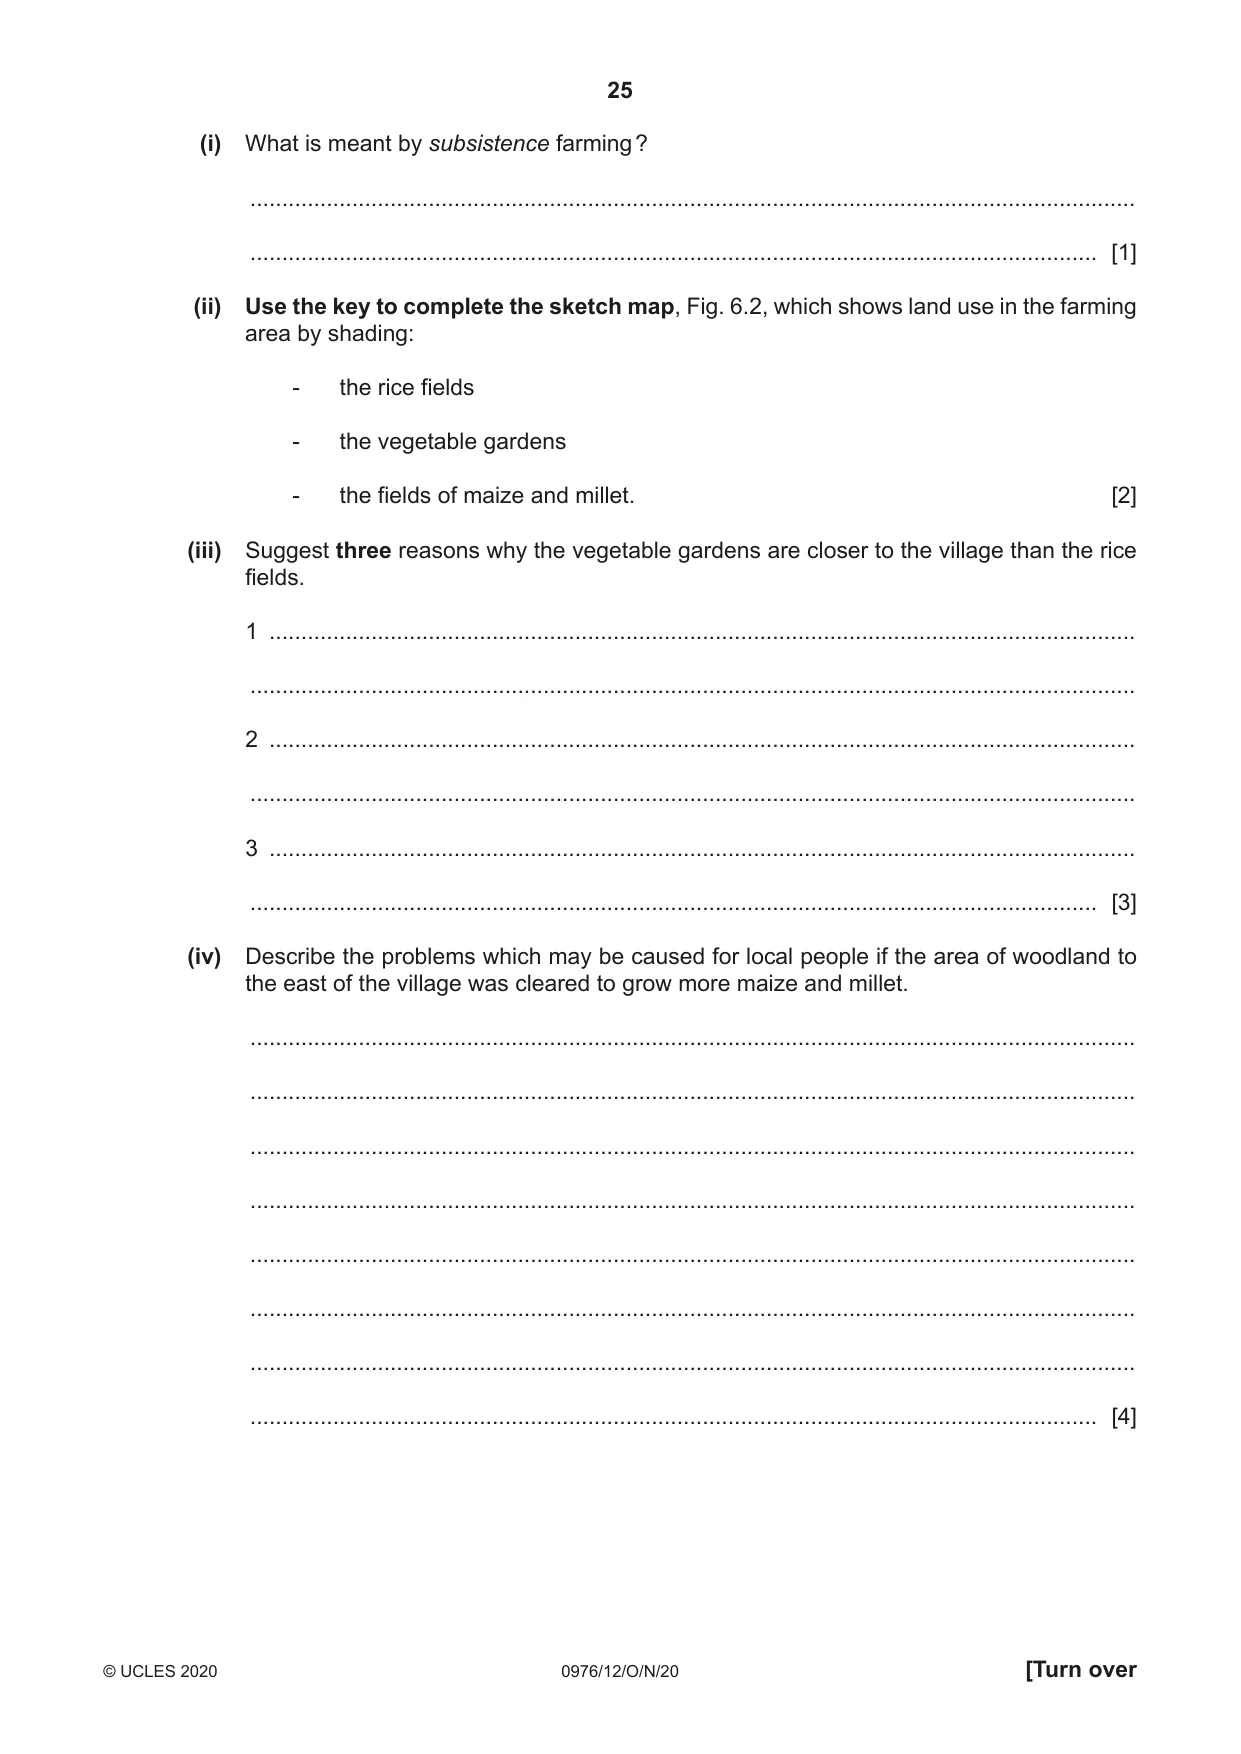
25 0976/12/O/N/20 © UCLES 2020 [Turn over (i) What is meant by subsistence farming ? … … [1] (ii) Use the key to complete the sketch map, Fig. 6.2, which shows land use in the farming area by shading: - the rice fields - the vegetable gardens - the fields of maize and millet. [2] (iii) Suggest three reasons why the vegetable gardens are closer to the village than the rice fields. 1 … … 2 … … 3 … … [3] (iv) Describe the problems which may be caused for local people if the area of woodland to the east of the village was cleared to grow more maize and millet. … … … … … … … … [4]
Question paper, page 26
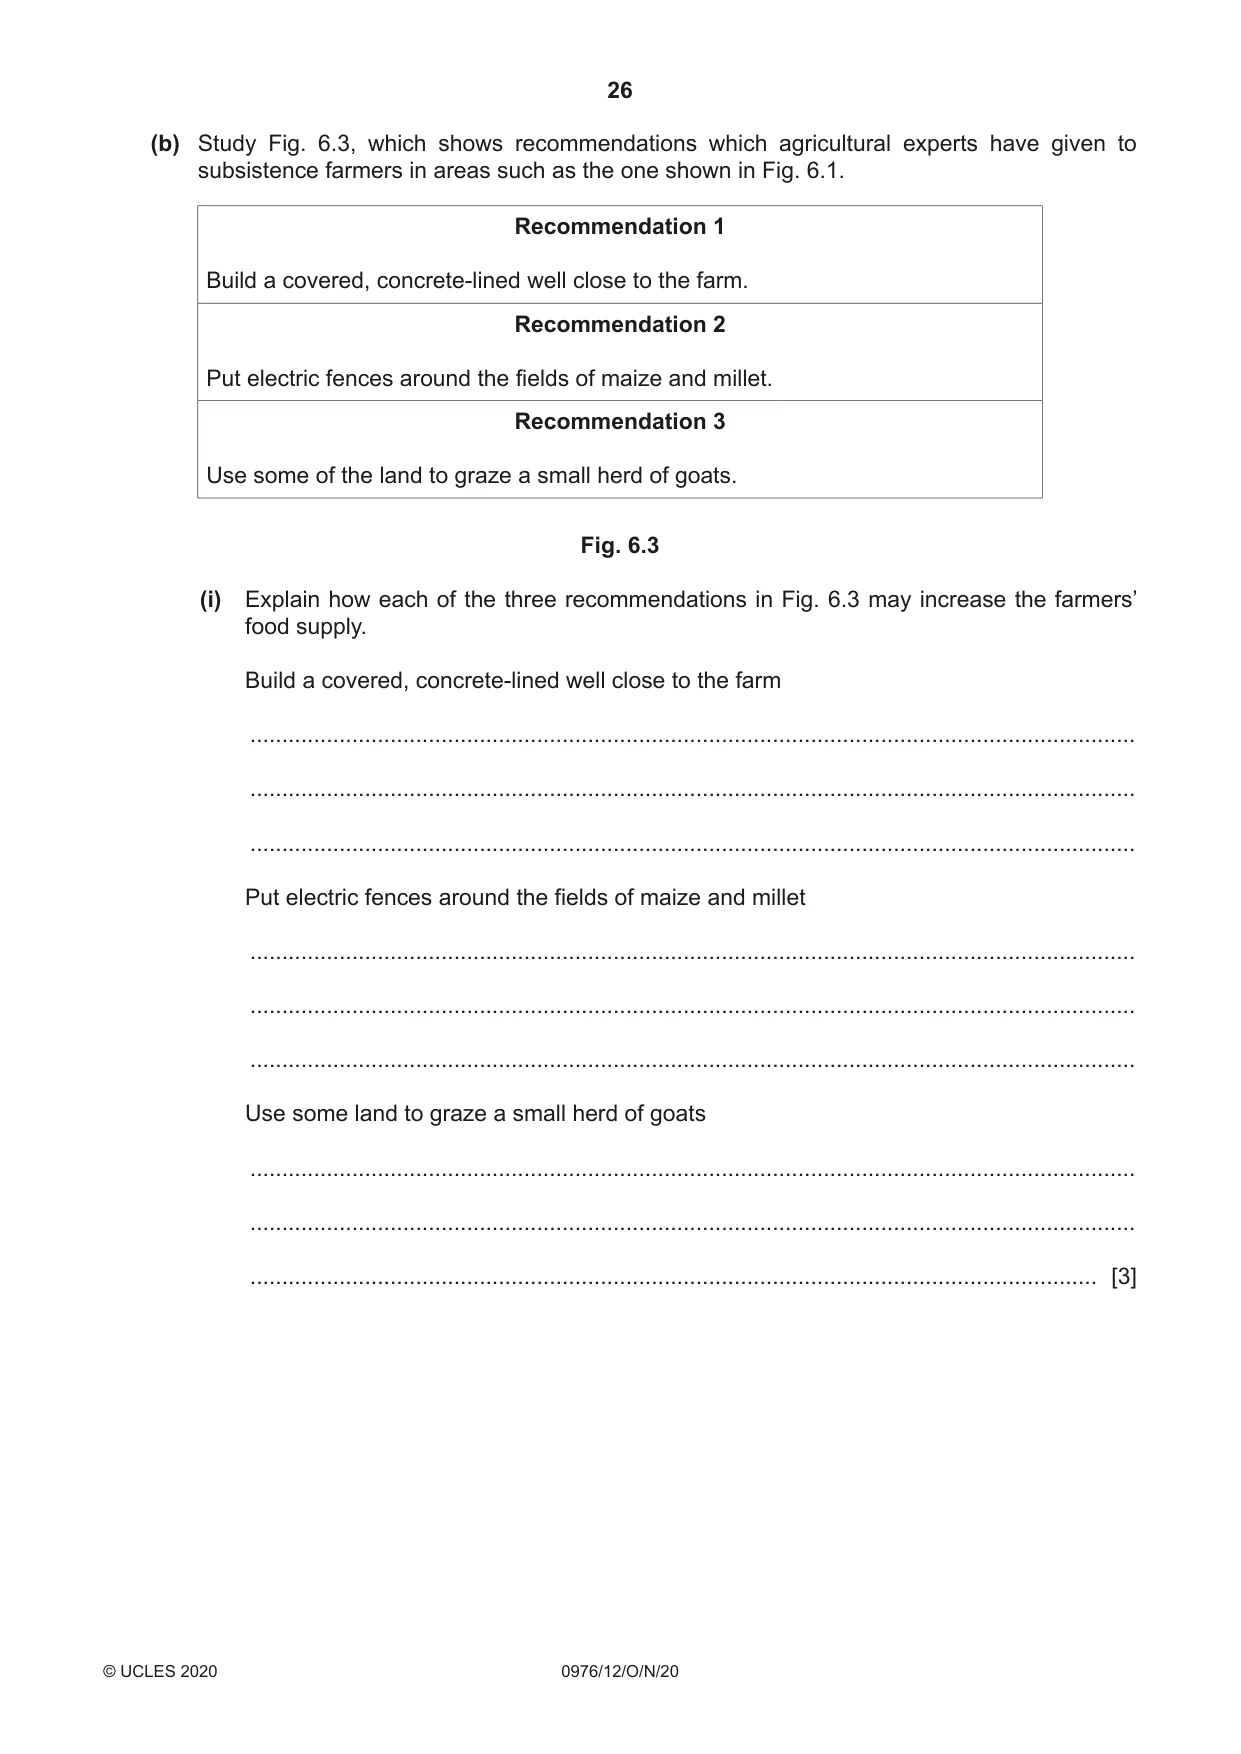
26 0976/12/O/N/20 © UCLES 2020 (b) Study Fig. 6.3, which shows recommendations which agricultural experts have given to subsistence farmers in areas such as the one shown in Fig. 6.1. Recommendation 1 Build a covered, concrete-lined well close to the farm. Recommendation 2 Put electric fences around the fields of maize and millet. Recommendation 3 Use some of the land to graze a small herd of goats. Fig. 6.3 (i) Explain how each of the three recommendations in Fig. 6.3 may increase the farmers’ food supply. Build a covered, concrete-lined well close to the farm … … … Put electric fences around the fields of maize and millet … … … Use some land to graze a small herd of goats … … … [3]
Question paper, page 27
27 0976/12/O/N/20 © UCLES 2020 [Turn over (ii) Describe other methods farmers in LEDCs can use to increase their agricultural output. … … … … … … … … … … [5]
Question paper, page 28
28 0976/12/O/N/20 © UCLES 2020 (c) For a named country or region you have studied, explain how natural factors have caused food shortages. Name of country or region … … … … … … … … … … … … … … … … … … … … … … … … … … [7] [Total: 25]
Question paper, page 29
29 0976/12/O/N/20 © UCLES 2020 Additional Pages If you use the following lined pages to complete the answer(s) to any question(s), the question number(s) must be clearly shown. … … … … … … … … … … … … … … … … … … … … … … … … … …
Question paper, page 30
30 0976/12/O/N/20 © UCLES 2020 … … … … … … … … … … … … … … … … … … … … … … … … … … … …
Question paper, page 31
31 0976/12/O/N/20 © UCLES 2020 BLANK PAGE
Question paper, page 32
32 0976/12/O/N/20 © UCLES 2020 Permission to reproduce items where third-party owned material protected by copyright is included has been sought and cleared where possible. Every reasonable effort has been made by the publisher (UCLES) to trace copyright holders, but if any items requiring clearance have unwittingly been included, the publisher will be pleased to make amends at the earliest possible opportunity. To avoid the issue of disclosure of answer-related information to candidates, all copyright acknowledgements are reproduced online in the Cambridge Assessment International Education Copyright Acknowledgements Booklet. This is produced for each series of examinations and is freely available to download at www.cambridgeinternational.org after the live examination series. Cambridge Assessment International Education is part of the Cambridge Assessment Group. Cambridge Assessment is the brand name of the University of Cambridge Local Examinations Syndicate (UCLES), which itself is a department of the University of Cambridge. BLANK PAGE
Mark scheme, page 1
This document consists of 23 printed pages. © UCLES 2020 [Turn over Cambridge IGCSE™ (9–1) GEOGRAPHY 0976/12 Paper 1 October/November 2020 MARK SCHEME Maximum Mark: 75 Published This mark scheme is published as an aid to teachers and candidates, to indicate the requirements of the examination. It shows the basis on which Examiners were instructed to award marks. It does not indicate the details of the discussions that took place at an Examiners’ meeting before marking began, which would have considered the acceptability of alternative answers. Mark schemes should be read in conjunction with the question paper and the Principal Examiner Report for Teachers. Cambridge International will not enter into discussions about these mark schemes. Cambridge International is publishing the mark schemes for the October/November 2020 series for most Cambridge IGCSE™, Cambridge International A and AS Level and Cambridge Pre-U components, and some Cambridge O Level components.
Mark scheme, page 2
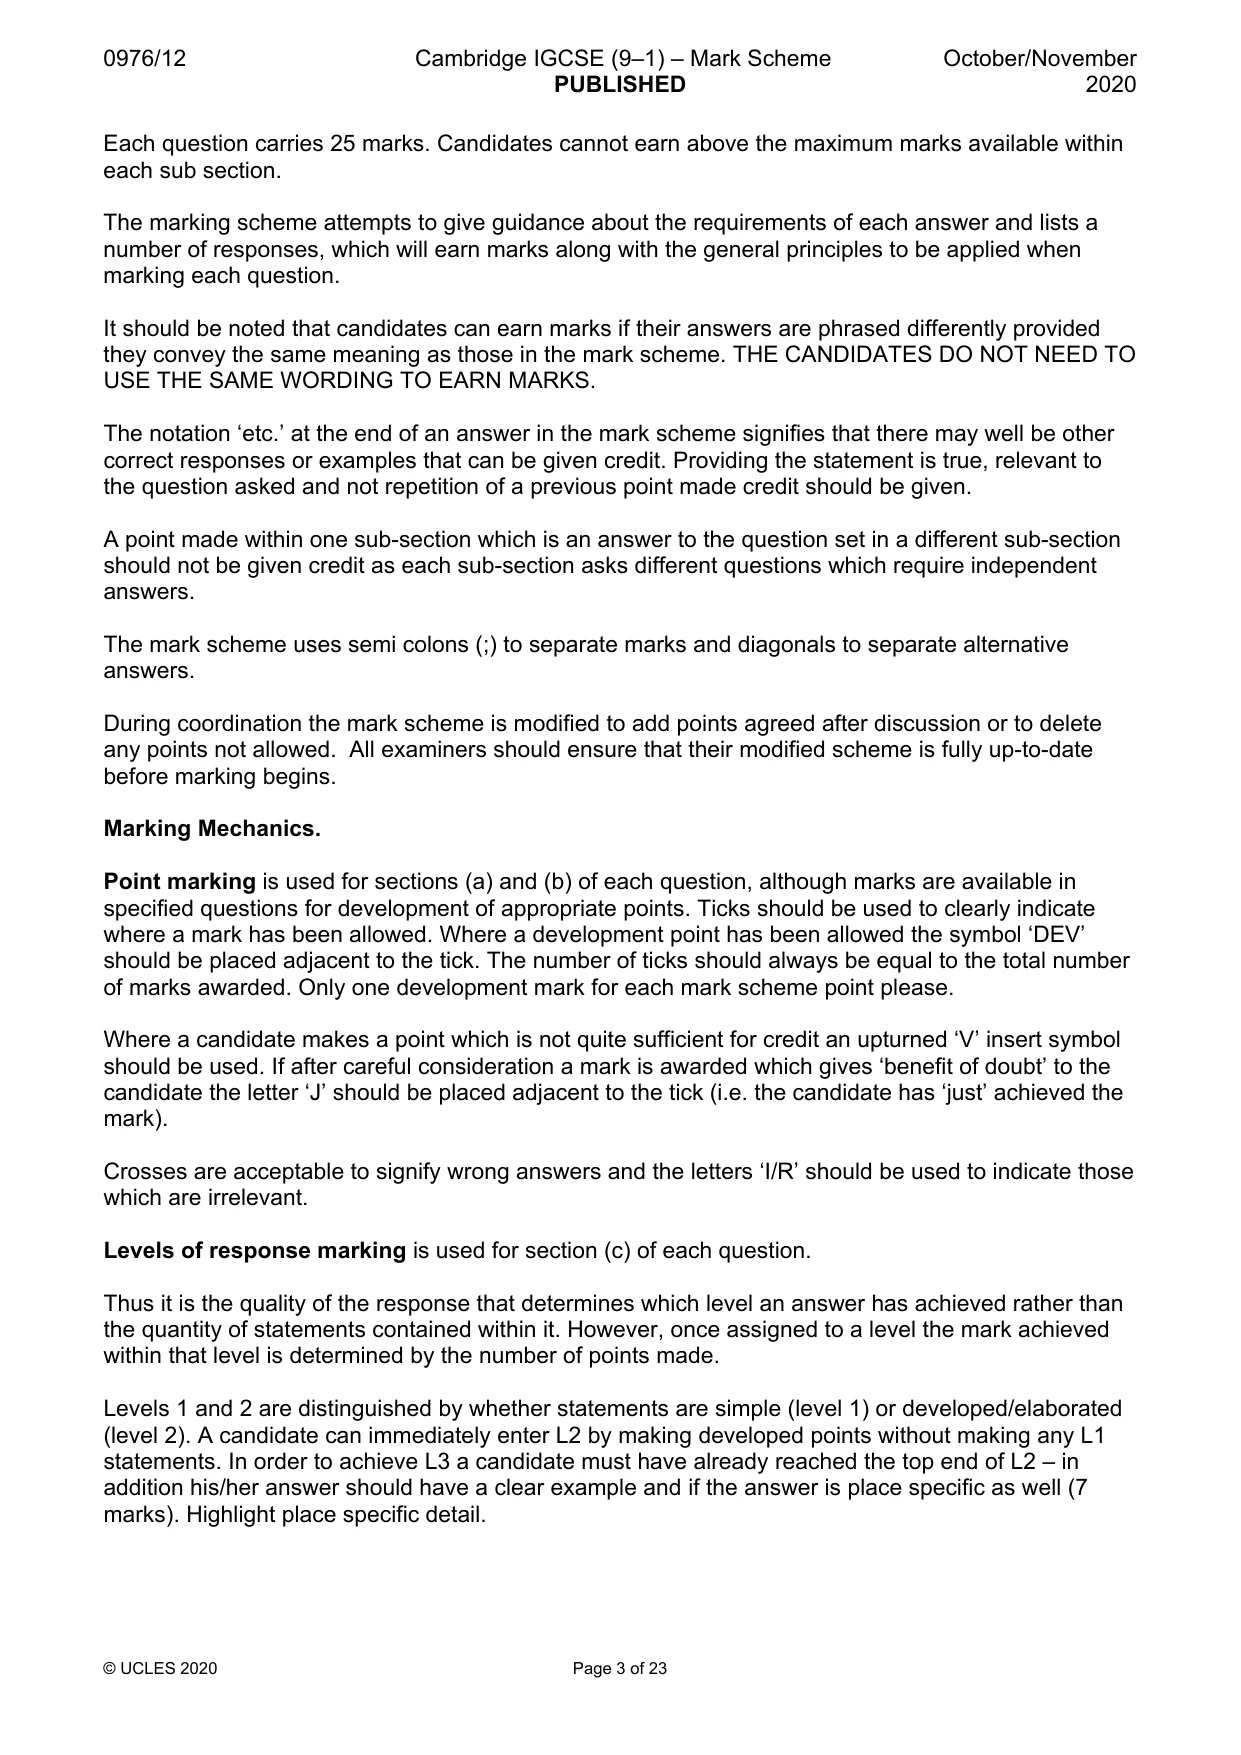
0976/12 Cambridge IGCSE (9–1) – Mark Scheme PUBLISHED October/November 2020 © UCLES 2020 Page 2 of 23 Generic Marking Principles These general marking principles must be applied by all examiners when marking candidate answers. They should be applied alongside the specific content of the mark scheme or generic level descriptors for a question. Each question paper and mark scheme will also comply with these marking principles. GENERIC MARKING PRINCIPLE 1: Marks must be awarded in line with: • the specific content of the mark scheme or the generic level descriptors for the question • the specific skills defined in the mark scheme or in the generic level descriptors for the question • the standard of response required by a candidate as exemplified by the standardisation scripts. GENERIC MARKING PRINCIPLE 2: Marks awarded are always whole marks (not half marks, or other fractions). GENERIC MARKING PRINCIPLE 3: Marks must be awarded positively: • marks are awarded for correct/valid answers, as defined in the mark scheme. However, credit is given for valid answers which go beyond the scope of the syllabus and mark scheme, referring to your Team Leader as appropriate • marks are awarded when candidates clearly demonstrate what they know and can do • marks are not deducted for errors • marks are not deducted for omissions • answers should only be judged on the quality of spelling, punctuation and grammar when these features are specifically assessed by the question as indicated by the mark scheme. The meaning, however, should be unambiguous. GENERIC MARKING PRINCIPLE 4: Rules must be applied consistently, e.g. in situations where candidates have not followed instructions or in the application of generic level descriptors. GENERIC MARKING PRINCIPLE 5: Marks should be awarded using the full range of marks defined in the mark scheme for the question (however; the use of the full mark range may be limited according to the quality of the candidate responses seen). GENERIC MARKING PRINCIPLE 6: Marks awarded are based solely on the requirements as defined in the mark scheme. Marks should not be awarded with grade thresholds or grade descriptors in mind.
Mark scheme, page 3
0976/12 Cambridge IGCSE (9–1) – Mark Scheme PUBLISHED October/November 2020 © UCLES 2020 Page 3 of 23 Each question carries 25 marks. Candidates cannot earn above the maximum marks available within each sub section. The marking scheme attempts to give guidance about the requirements of each answer and lists a number of responses, which will earn marks along with the general principles to be applied when marking each question. It should be noted that candidates can earn marks if their answers are phrased differently provided they convey the same meaning as those in the mark scheme. THE CANDIDATES DO NOT NEED TO USE THE SAME WORDING TO EARN MARKS. The notation ‘etc.’ at the end of an answer in the mark scheme signifies that there may well be other correct responses or examples that can be given credit. Providing the statement is true, relevant to the question asked and not repetition of a previous point made credit should be given. A point made within one sub-section which is an answer to the question set in a different sub-section should not be given credit as each sub-section asks different questions which require independent answers. The mark scheme uses semi colons (;) to separate marks and diagonals to separate alternative answers. During coordination the mark scheme is modified to add points agreed after discussion or to delete any points not allowed. All examiners should ensure that their modified scheme is fully up-to-date before marking begins. Marking Mechanics. Point marking is used for sections (a) and (b) of each question, although marks are available in specified questions for development of appropriate points. Ticks should be used to clearly indicate where a mark has been allowed. Where a development point has been allowed the symbol ‘DEV’ should be placed adjacent to the tick. The number of ticks should always be equal to the total number of marks awarded. Only one development mark for each mark scheme point please. Where a candidate makes a point which is not quite sufficient for credit an upturned ‘V’ insert symbol should be used. If after careful consideration a mark is awarded which gives ‘benefit of doubt’ to the candidate the letter ‘J’ should be placed adjacent to the tick (i.e. the candidate has ‘just’ achieved the mark). Crosses are acceptable to signify wrong answers and the letters ‘I/R’ should be used to indicate those which are irrelevant. Levels of response marking is used for section (c) of each question. Thus it is the quality of the response that determines which level an answer has achieved rather than the quantity of statements contained within it. However, once assigned to a level the mark achieved within that level is determined by the number of points made. Levels 1 and 2 are distinguished by whether statements are simple (level 1) or developed/elaborated (level 2). A candidate can immediately enter L2 by making developed points without making any L1 statements. In order to achieve L3 a candidate must have already reached the top end of L2 – in addition his/her answer should have a clear example and if the answer is place specific as well (7 marks). Highlight place specific detail.
Mark scheme, page 4
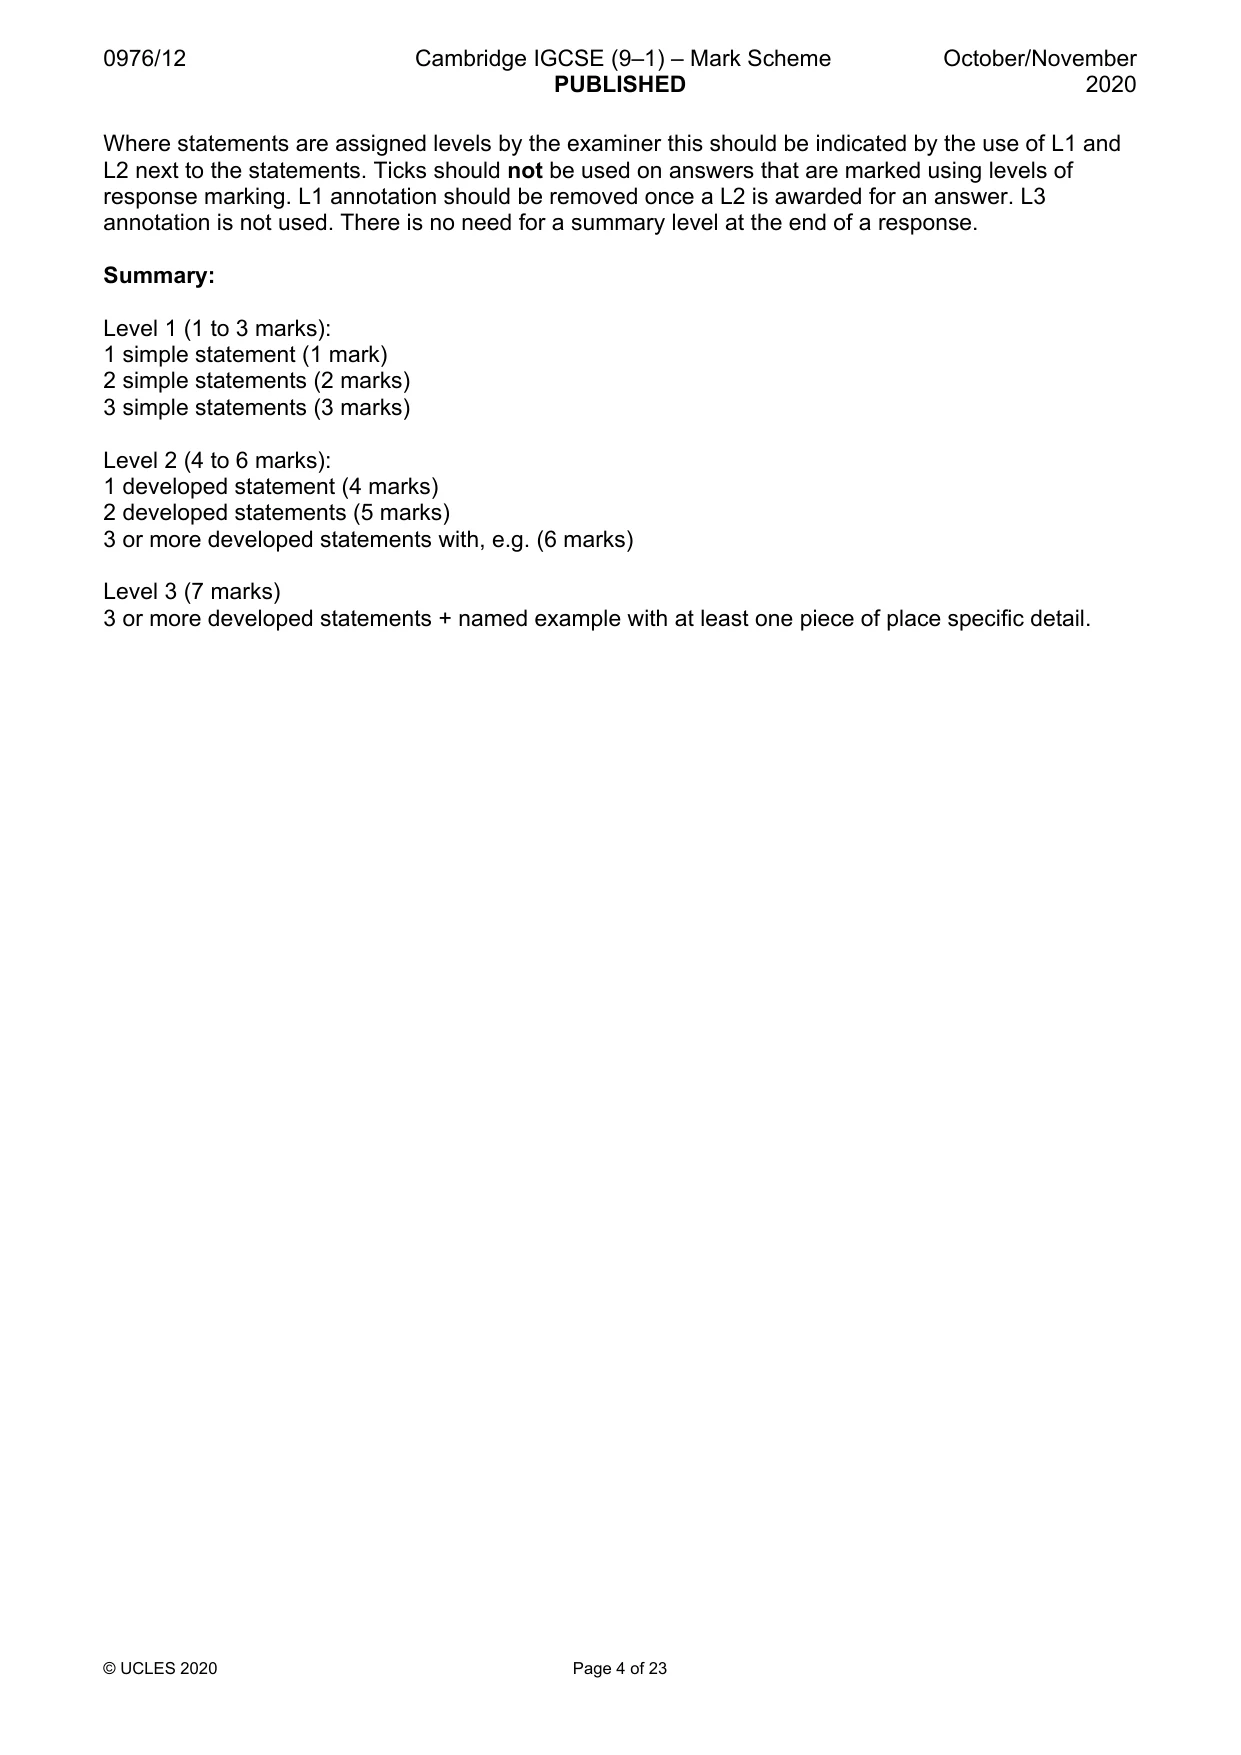
0976/12 Cambridge IGCSE (9–1) – Mark Scheme PUBLISHED October/November 2020 © UCLES 2020 Page 4 of 23 Where statements are assigned levels by the examiner this should be indicated by the use of L1 and L2 next to the statements. Ticks should not be used on answers that are marked using levels of response marking. L1 annotation should be removed once a L2 is awarded for an answer. L3 annotation is not used. There is no need for a summary level at the end of a response. Summary: Level 1 (1 to 3 marks): 1 simple statement (1 mark) 2 simple statements (2 marks) 3 simple statements (3 marks) Level 2 (4 to 6 marks): 1 developed statement (4 marks) 2 developed statements (5 marks) 3 or more developed statements with, e.g. (6 marks) Level 3 (7 marks) 3 or more developed statements + named example with at least one piece of place specific detail.
Mark scheme, page 5
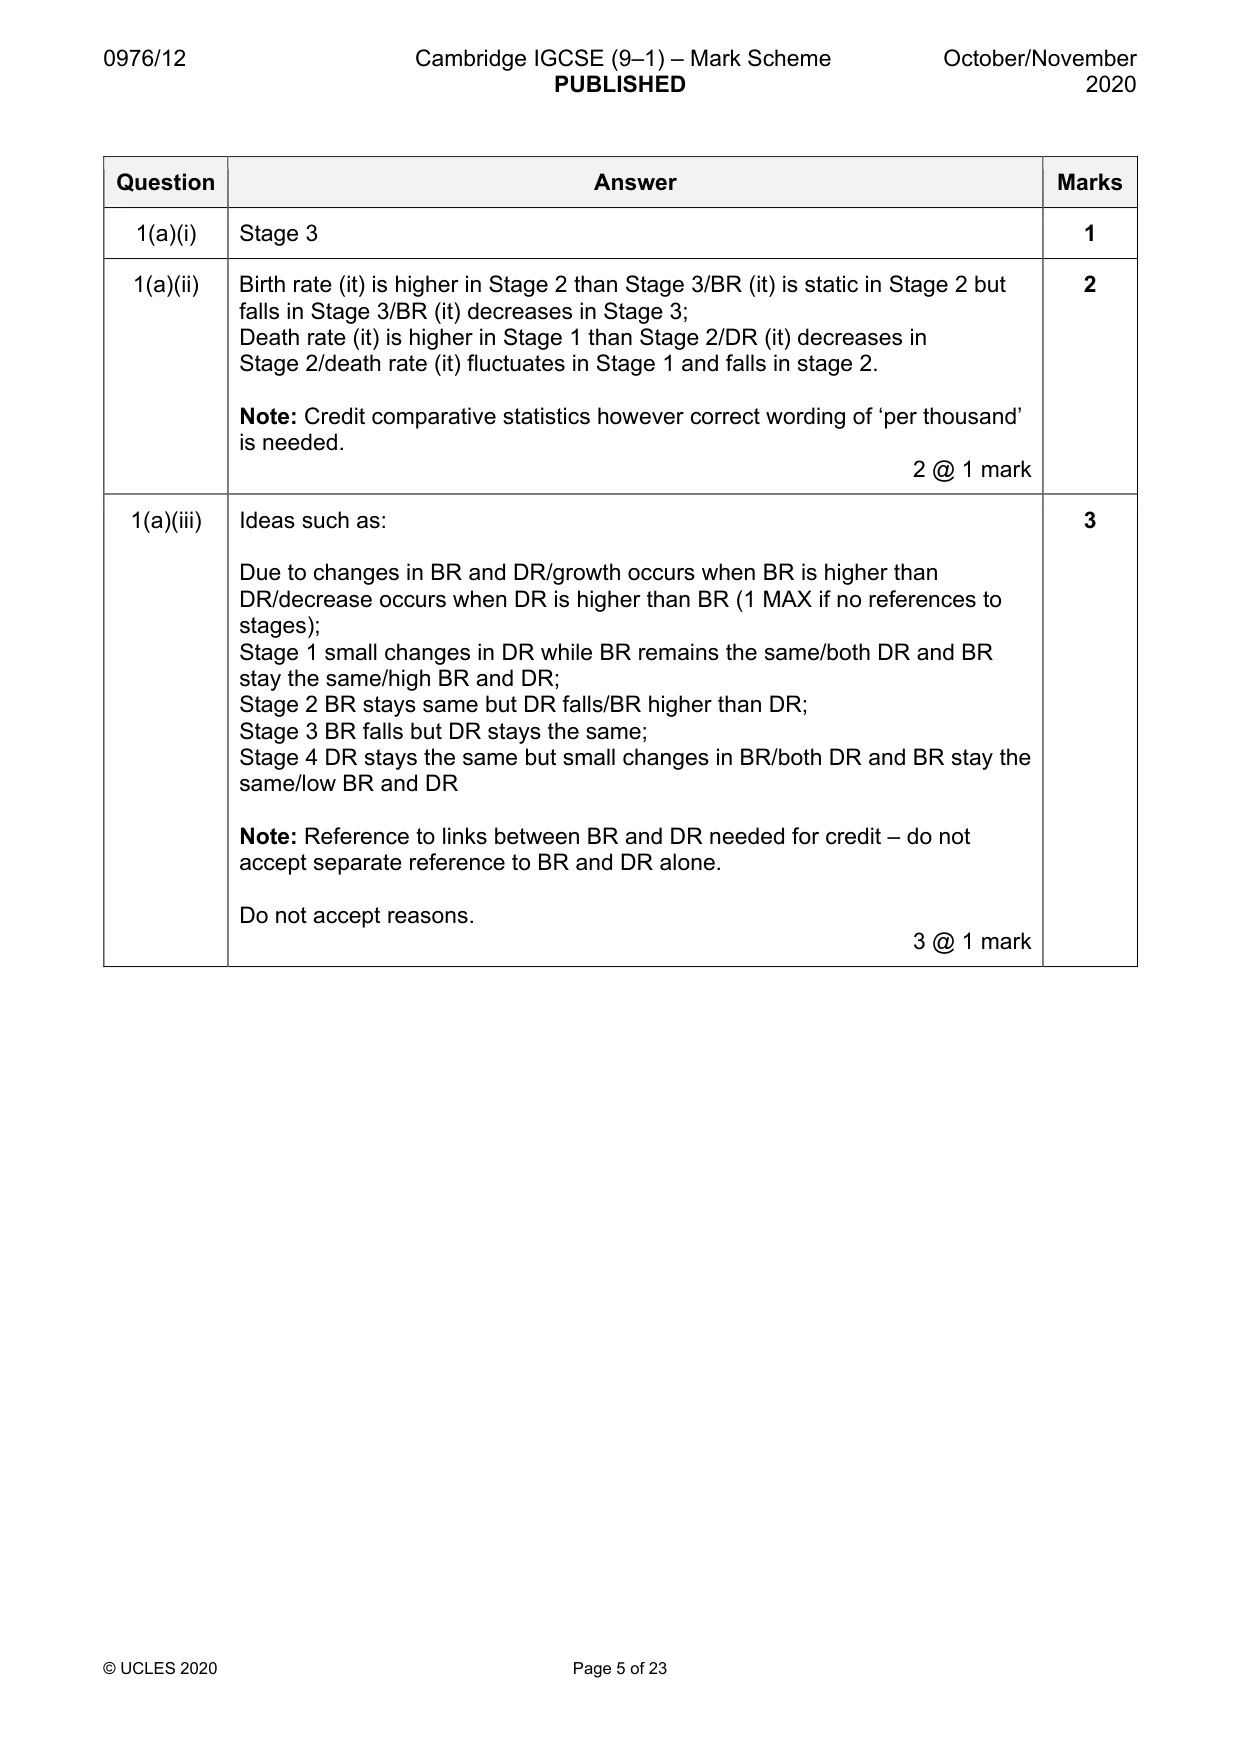
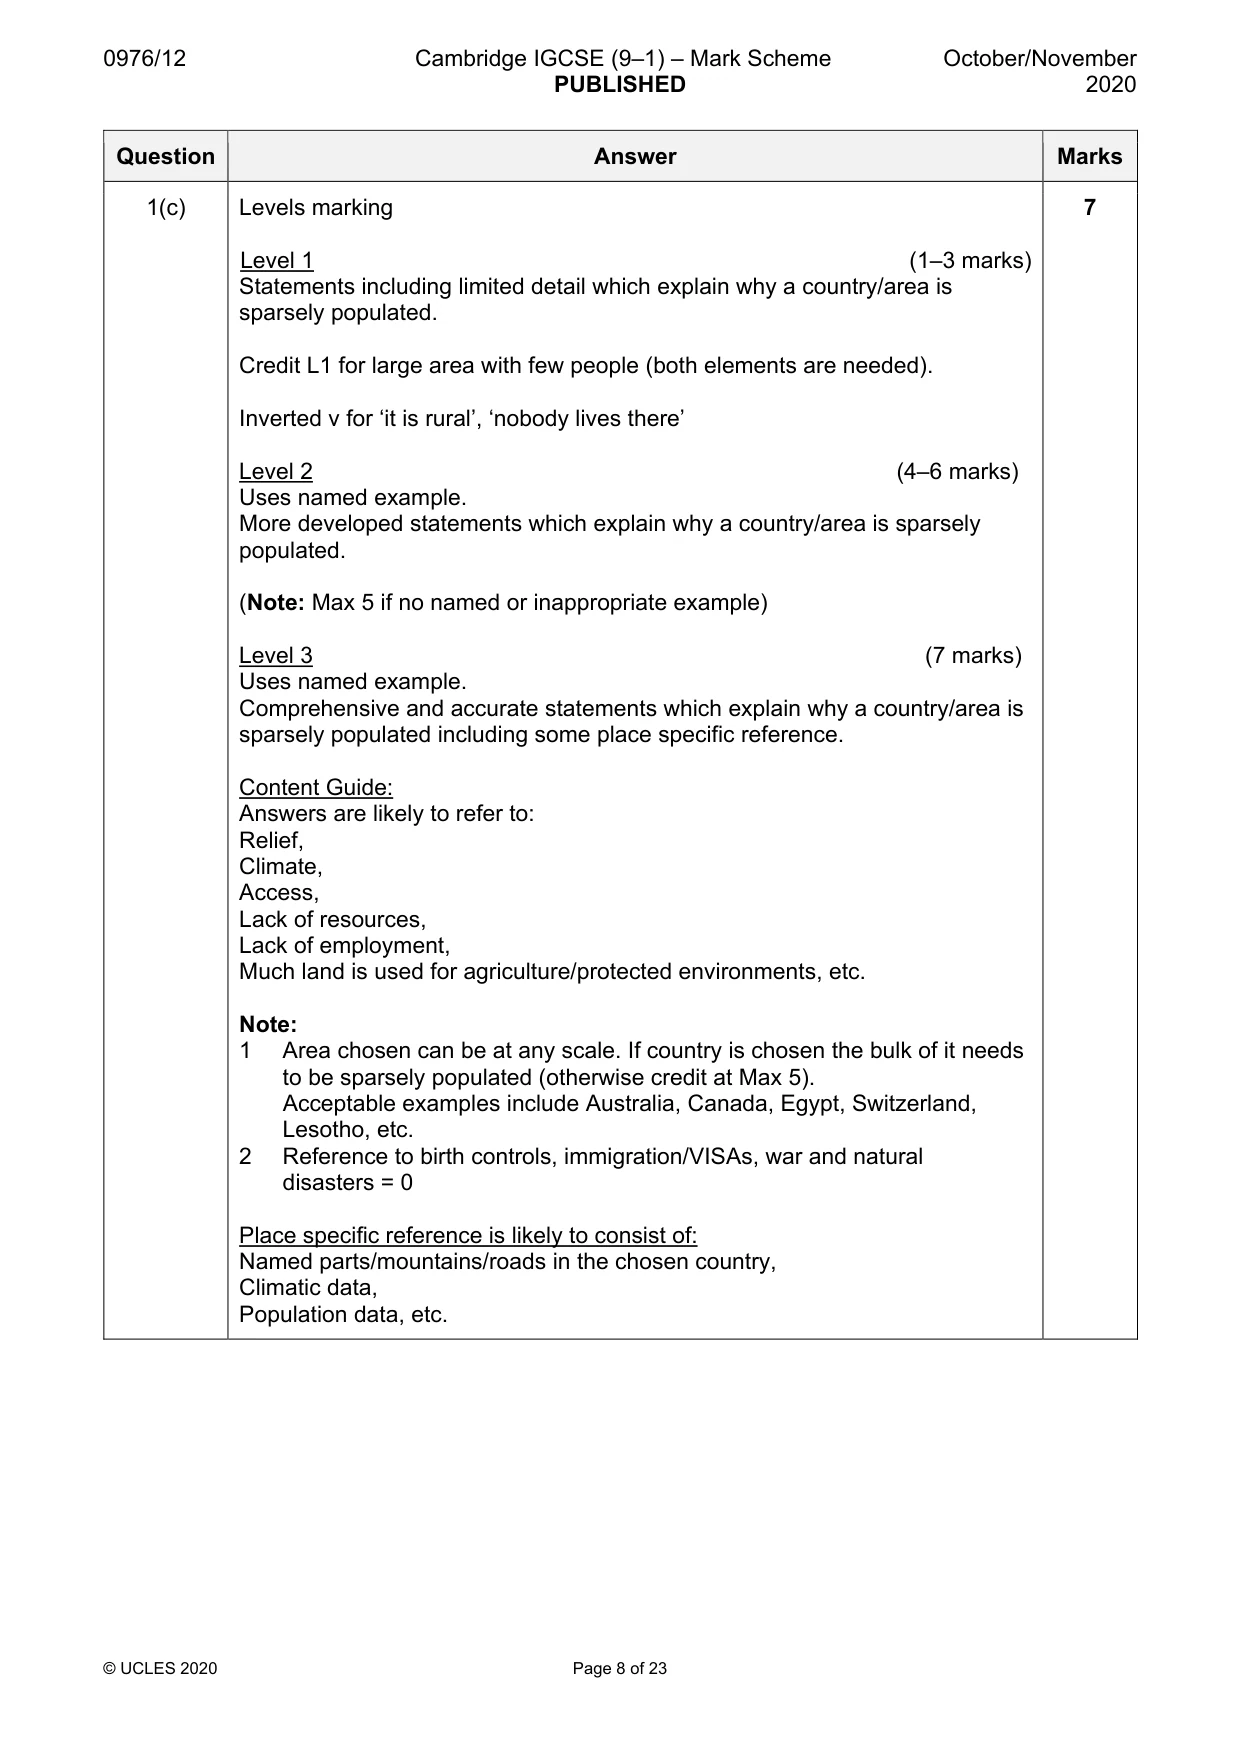
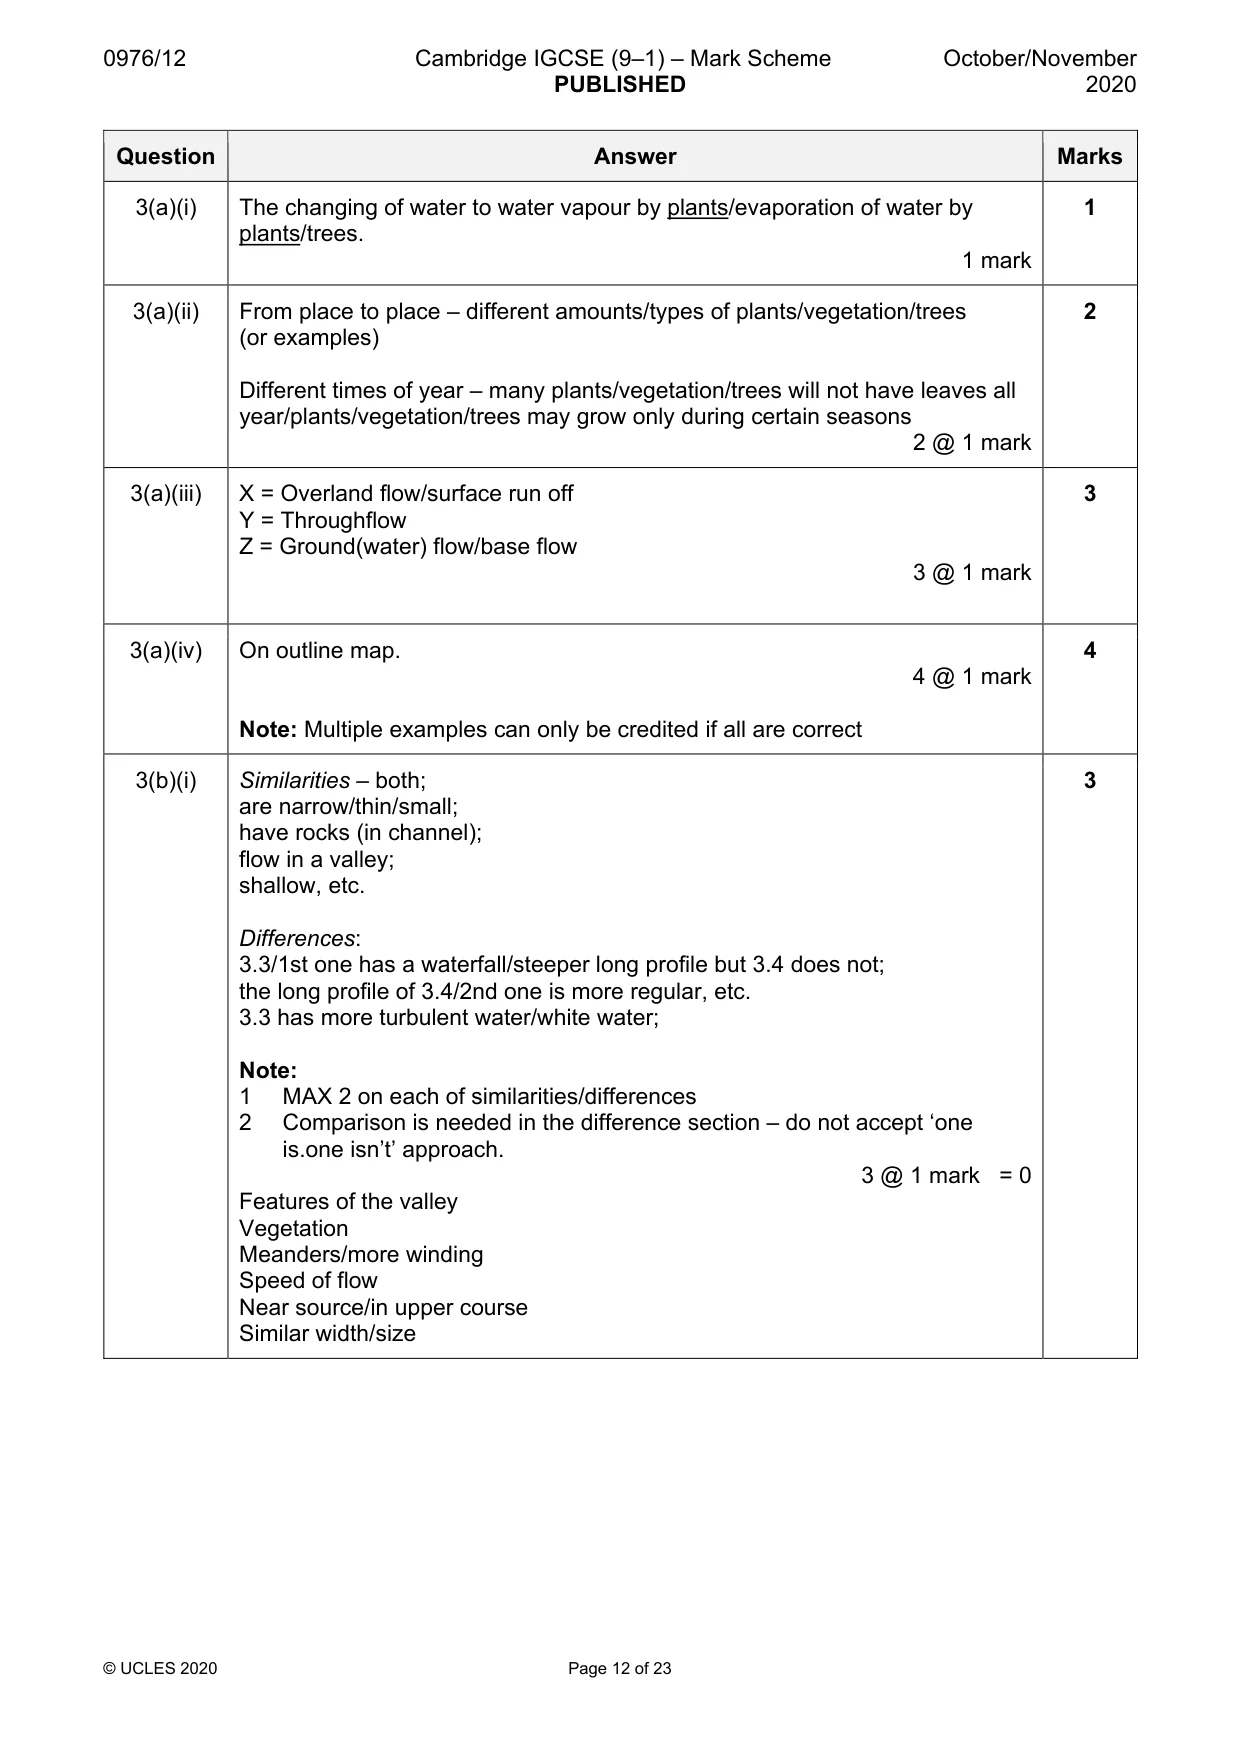
0976/12 Cambridge IGCSE (9–1) – Mark Scheme PUBLISHED October/November 2020 © UCLES 2020 Page 5 of 23 Question Answer Marks 1(a)(i) Stage 3 1 1(a)(ii) Birth rate (it) is higher in Stage 2 than Stage 3/BR (it) is static in Stage 2 but falls in Stage 3/BR (it) decreases in Stage 3; Death rate (it) is higher in Stage 1 than Stage 2/DR (it) decreases in Stage 2/death rate (it) fluctuates in Stage 1 and falls in stage 2. Note: Credit comparative statistics however correct wording of ‘per thousand’ is needed. 2 @ 1 mark 2 1(a)(iii) Ideas such as: Due to changes in BR and DR/growth occurs when BR is higher than DR/decrease occurs when DR is higher than BR (1 MAX if no references to stages); Stage 1 small changes in DR while BR remains the same/both DR and BR stay the same/high BR and DR; Stage 2 BR stays same but DR falls/BR higher than DR; Stage 3 BR falls but DR stays the same; Stage 4 DR stays the same but small changes in BR/both DR and BR stay the same/low BR and DR Note: Reference to links between BR and DR needed for credit – do not accept separate reference to BR and DR alone. Do not accept reasons. 3 @ 1 mark 3
Mark scheme, page 6
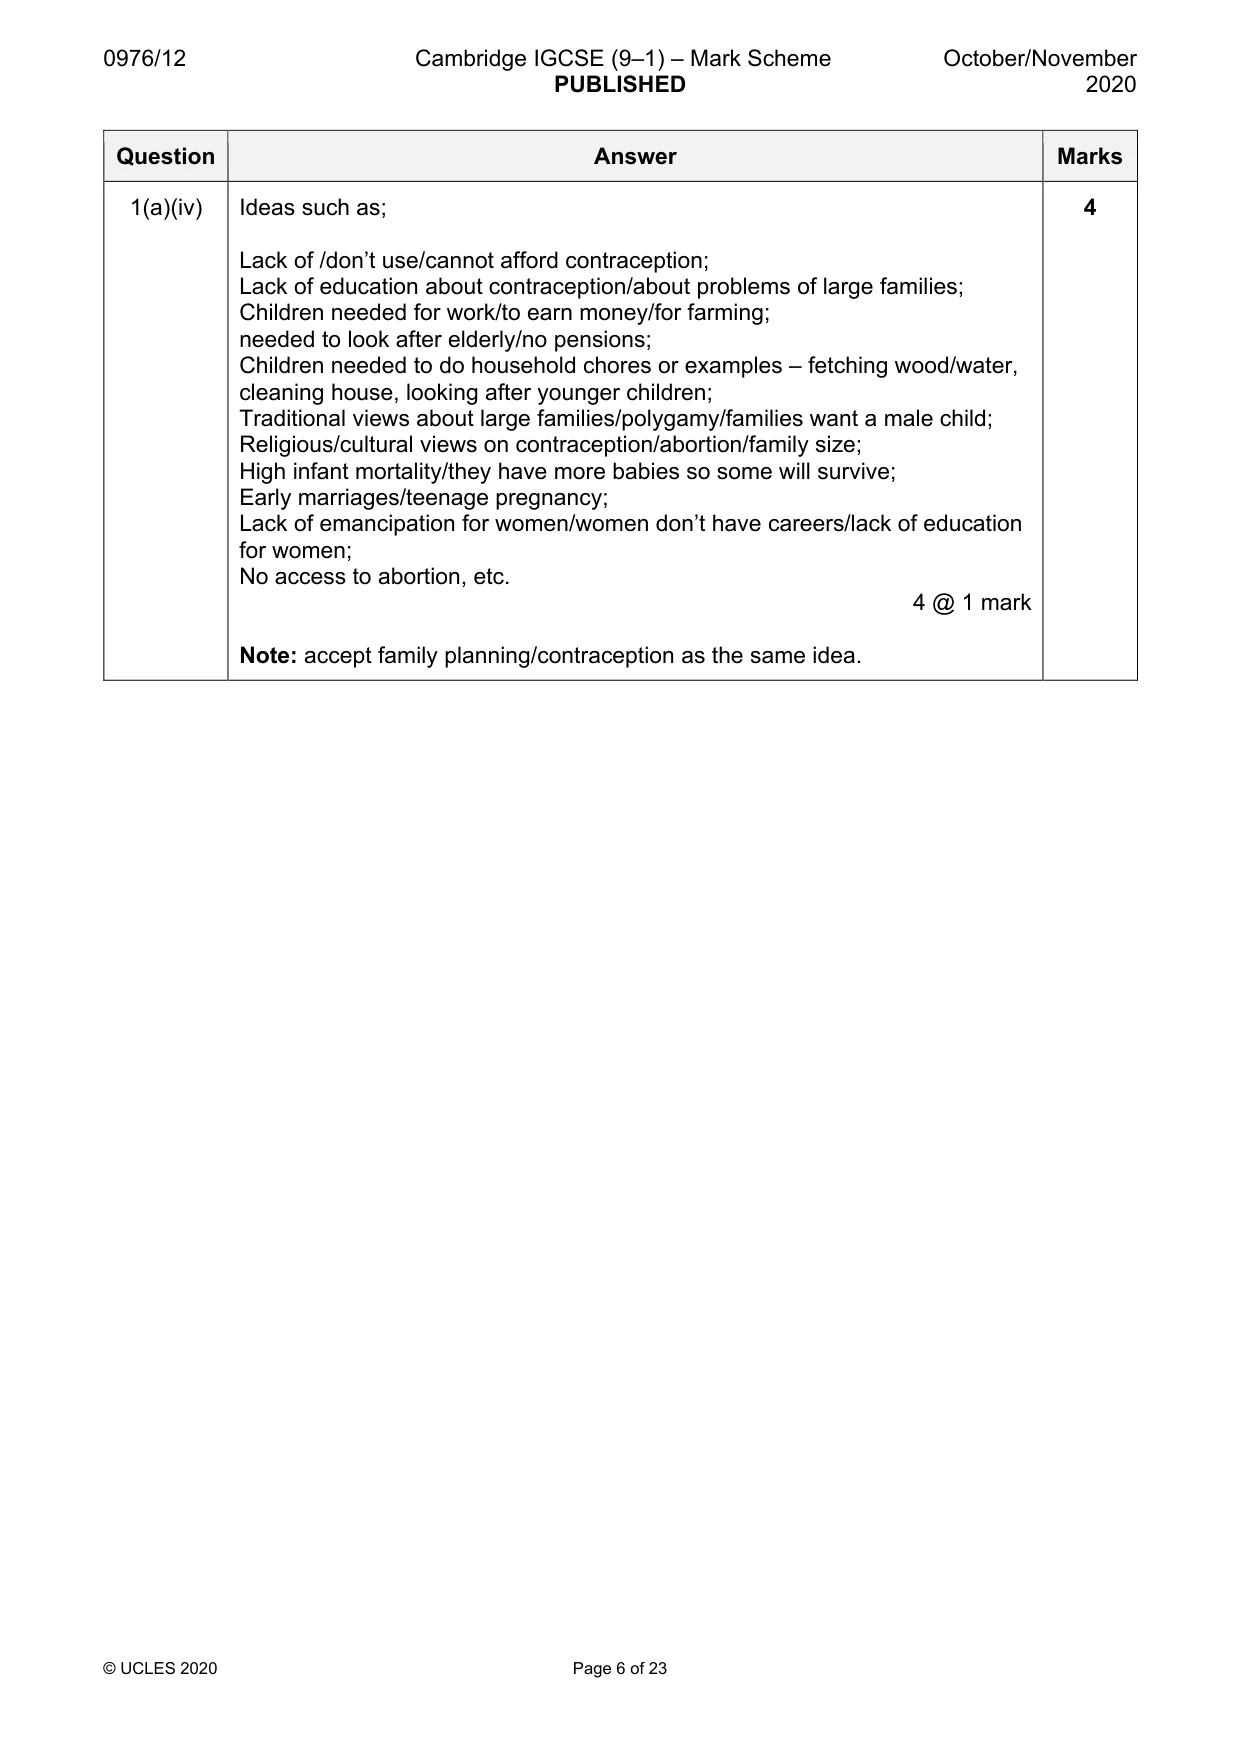
0976/12 Cambridge IGCSE (9–1) – Mark Scheme PUBLISHED October/November 2020 © UCLES 2020 Page 6 of 23 Question Answer Marks 1(a)(iv) Ideas such as; Lack of /don’t use/cannot afford contraception; Lack of education about contraception/about problems of large families; Children needed for work/to earn money/for farming; needed to look after elderly/no pensions; Children needed to do household chores or examples – fetching wood/water, cleaning house, looking after younger children; Traditional views about large families/polygamy/families want a male child; Religious/cultural views on contraception/abortion/family size; High infant mortality/they have more babies so some will survive; Early marriages/teenage pregnancy; Lack of emancipation for women/women don’t have careers/lack of education for women; No access to abortion, etc. 4 @ 1 mark Note: accept family planning/contraception as the same idea. 4
Mark scheme, page 7
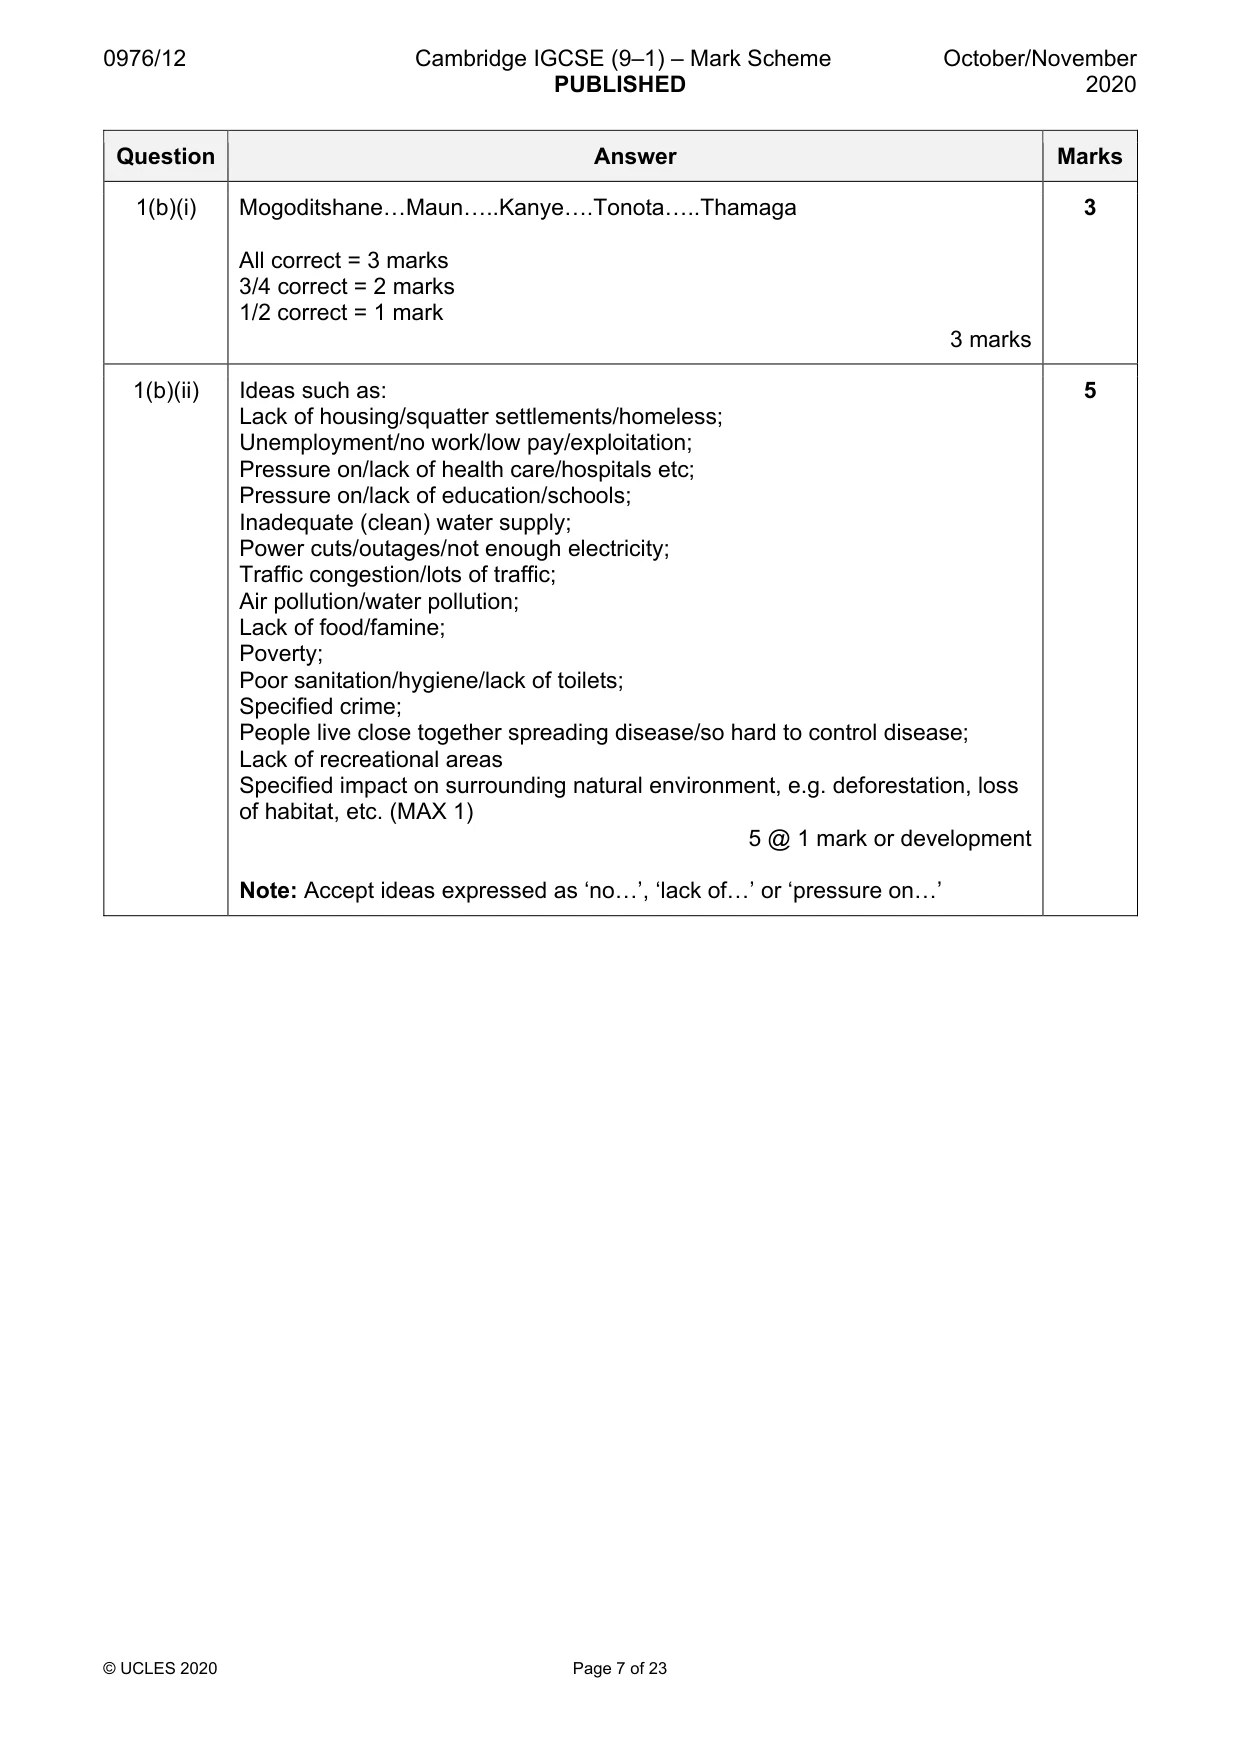
0976/12 Cambridge IGCSE (9–1) – Mark Scheme PUBLISHED October/November 2020 © UCLES 2020 Page 7 of 23 Question Answer Marks 1(b)(i) Mogoditshane…Maun…..Kanye….Tonota…..Thamaga All correct = 3 marks 3/4 correct = 2 marks 1/2 correct = 1 mark 3 marks 3 1(b)(ii) Ideas such as: Lack of housing/squatter settlements/homeless; Unemployment/no work/low pay/exploitation; Pressure on/lack of health care/hospitals etc; Pressure on/lack of education/schools; Inadequate (clean) water supply; Power cuts/outages/not enough electricity; Traffic congestion/lots of traffic; Air pollution/water pollution; Lack of food/famine; Poverty; Poor sanitation/hygiene/lack of toilets; Specified crime; People live close together spreading disease/so hard to control disease; Lack of recreational areas Specified impact on surrounding natural environment, e.g. deforestation, loss of habitat, etc. (MAX 1) 5 @ 1 mark or development Note: Accept ideas expressed as ‘no…’, ‘lack of…’ or ‘pressure on…’ 5
Mark scheme, page 8
0976/12 Cambridge IGCSE (9–1) – Mark Scheme PUBLISHED October/November 2020 © UCLES 2020 Page 8 of 23 Question Answer Marks 1(c) Levels marking Level 1 (1–3 marks) Statements including limited detail which explain why a country/area is sparsely populated. Credit L1 for large area with few people (both elements are needed). Inverted v for ‘it is rural’, ‘nobody lives there’ Level 2 (4–6 marks) Uses named example. More developed statements which explain why a country/area is sparsely populated. (Note: Max 5 if no named or inappropriate example) Level 3 (7 marks) Uses named example. Comprehensive and accurate statements which explain why a country/area is sparsely populated including some place specific reference. Content Guide: Answers are likely to refer to: Relief, Climate, Access, Lack of resources, Lack of employment, Much land is used for agriculture/protected environments, etc. Note: 1 Area chosen can be at any scale. If country is chosen the bulk of it needs to be sparsely populated (otherwise credit at Max 5). Acceptable examples include Australia, Canada, Egypt, Switzerland, Lesotho, etc. 2 Reference to birth controls, immigration/VISAs, war and natural disasters = 0 Place specific reference is likely to consist of: Named parts/mountains/roads in the chosen country, Climatic data, Population data, etc. 7
Mark scheme, page 9
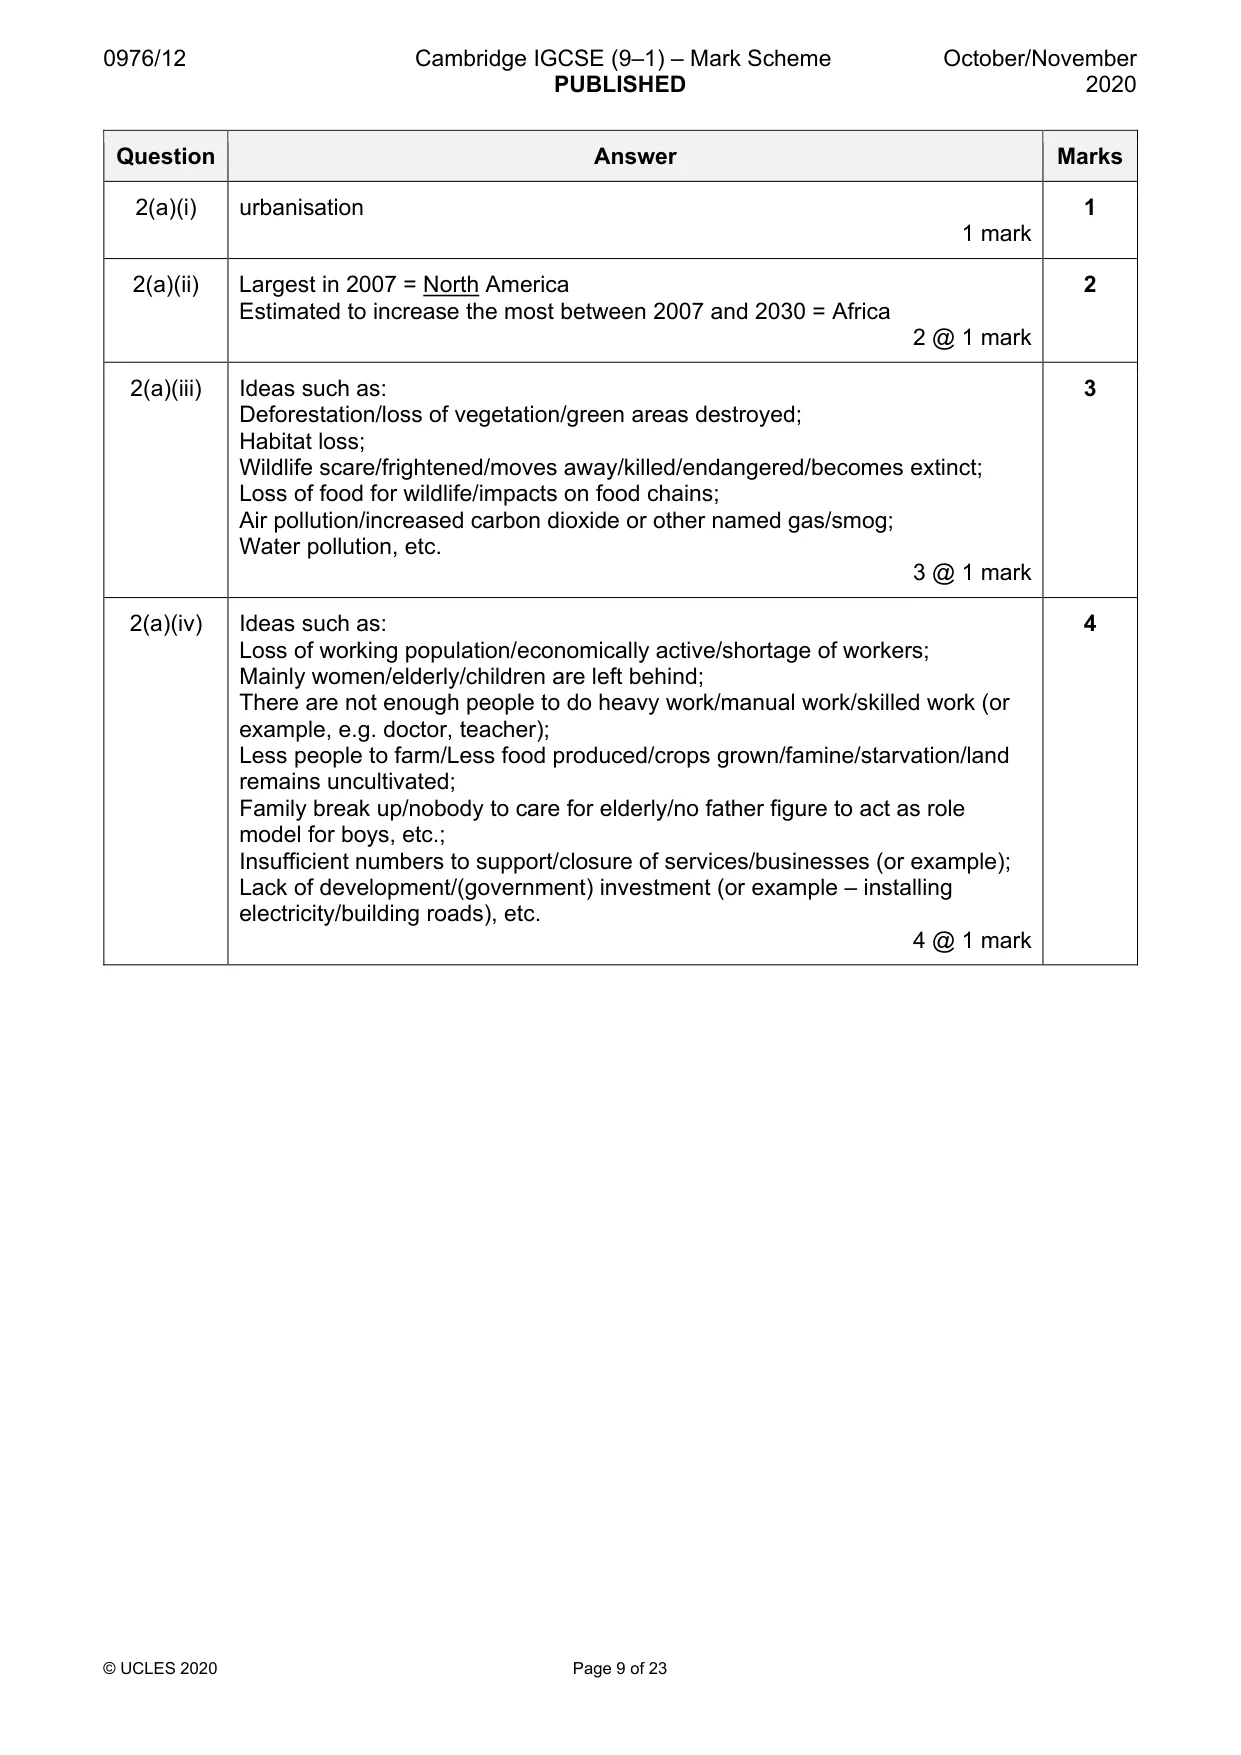
0976/12 Cambridge IGCSE (9–1) – Mark Scheme PUBLISHED October/November 2020 © UCLES 2020 Page 9 of 23 Question Answer Marks 2(a)(i) urbanisation 1 mark 1 2(a)(ii) Largest in 2007 = North America Estimated to increase the most between 2007 and 2030 = Africa 2 @ 1 mark 2 2(a)(iii) Ideas such as: Deforestation/loss of vegetation/green areas destroyed; Habitat loss; Wildlife scare/frightened/moves away/killed/endangered/becomes extinct; Loss of food for wildlife/impacts on food chains; Air pollution/increased carbon dioxide or other named gas/smog; Water pollution, etc. 3 @ 1 mark 3 2(a)(iv) Ideas such as: Loss of working population/economically active/shortage of workers; Mainly women/elderly/children are left behind; There are not enough people to do heavy work/manual work/skilled work (or example, e.g. doctor, teacher); Less people to farm/Less food produced/crops grown/famine/starvation/land remains uncultivated; Family break up/nobody to care for elderly/no father figure to act as role model for boys, etc.; Insufficient numbers to support/closure of services/businesses (or example); Lack of development/(government) investment (or example – installing electricity/building roads), etc. 4 @ 1 mark 4
Mark scheme, page 10
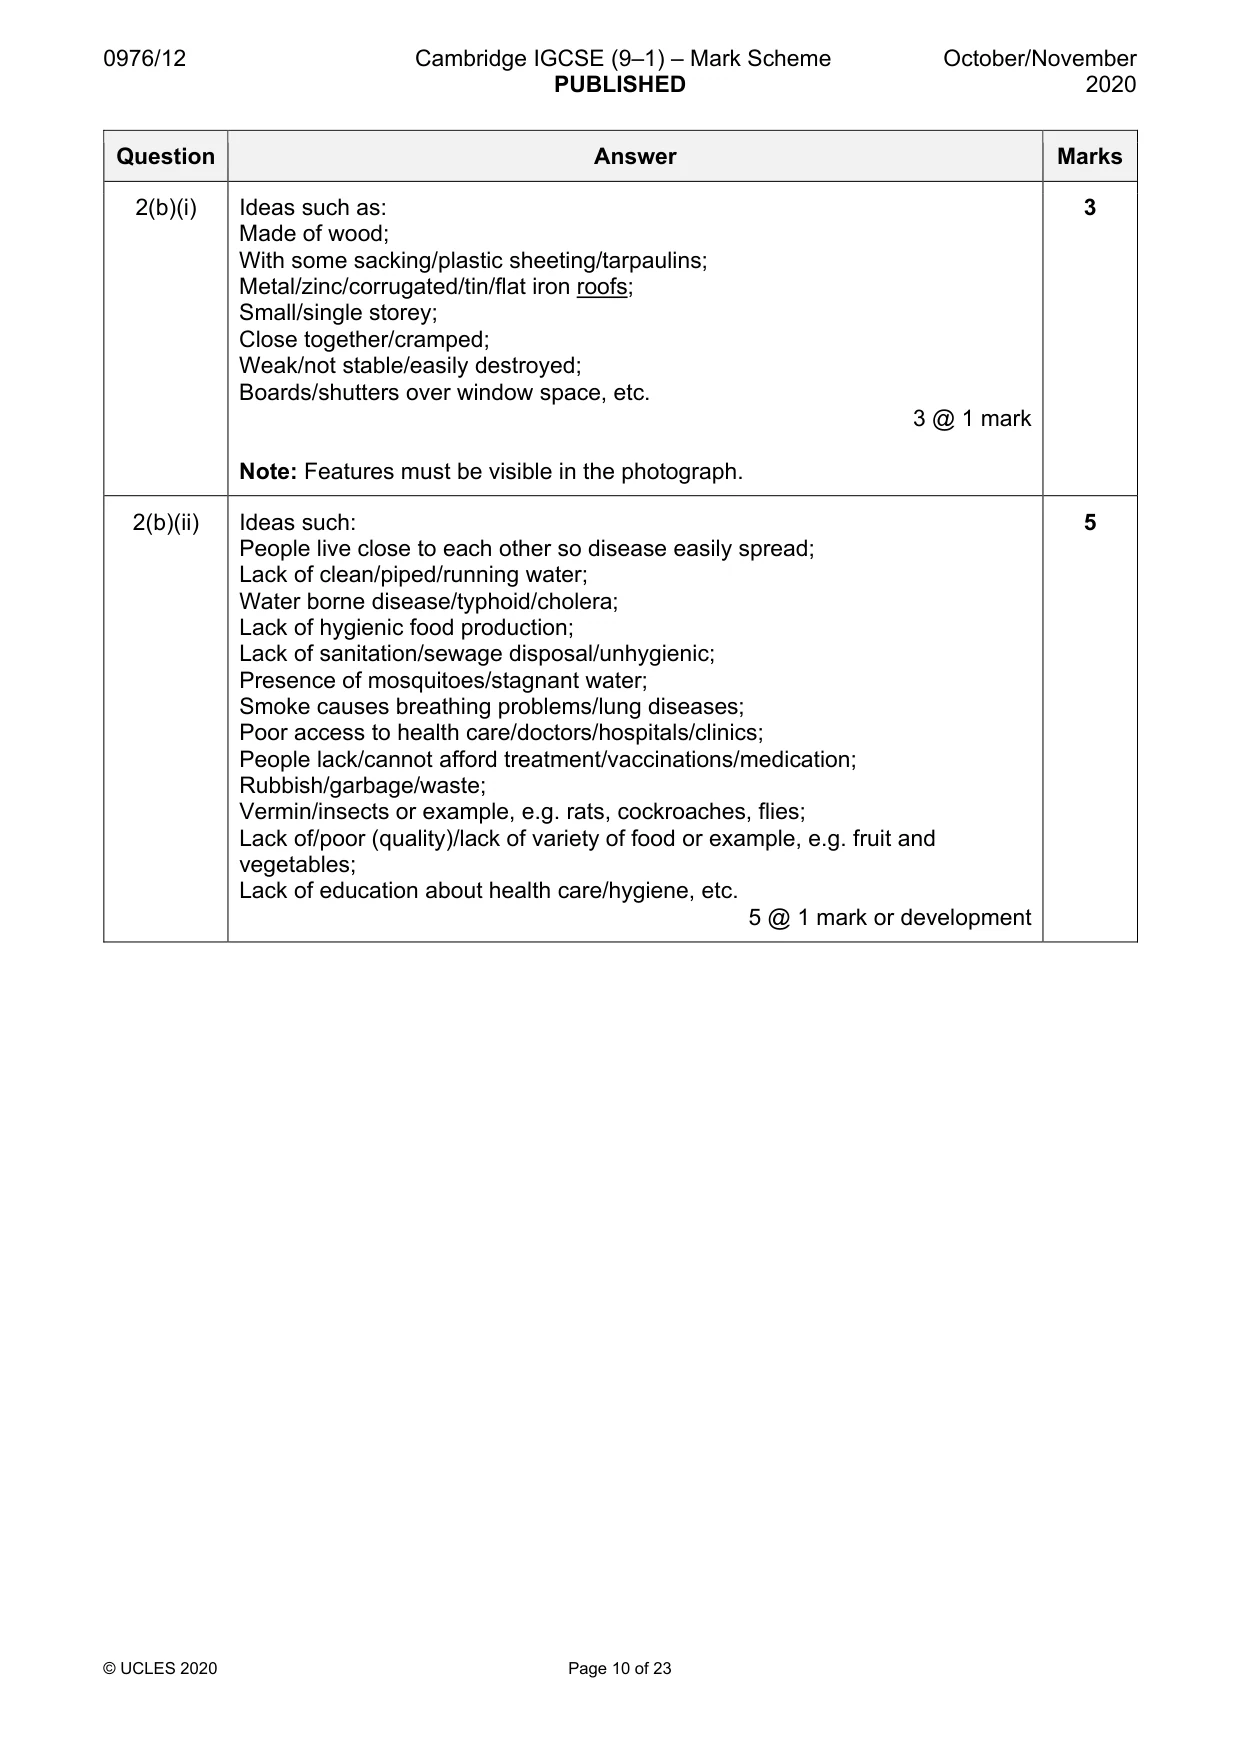
0976/12 Cambridge IGCSE (9–1) – Mark Scheme PUBLISHED October/November 2020 © UCLES 2020 Page 10 of 23 Question Answer Marks 2(b)(i) Ideas such as: Made of wood; With some sacking/plastic sheeting/tarpaulins; Metal/zinc/corrugated/tin/flat iron roofs; Small/single storey; Close together/cramped; Weak/not stable/easily destroyed; Boards/shutters over window space, etc. 3 @ 1 mark Note: Features must be visible in the photograph. 3 2(b)(ii) Ideas such: People live close to each other so disease easily spread; Lack of clean/piped/running water; Water borne disease/typhoid/cholera; Lack of hygienic food production; Lack of sanitation/sewage disposal/unhygienic; Presence of mosquitoes/stagnant water; Smoke causes breathing problems/lung diseases; Poor access to health care/doctors/hospitals/clinics; People lack/cannot afford treatment/vaccinations/medication; Rubbish/garbage/waste; Vermin/insects or example, e.g. rats, cockroaches, flies; Lack of/poor (quality)/lack of variety of food or example, e.g. fruit and vegetables; Lack of education about health care/hygiene, etc. 5 @ 1 mark or development 5
Mark scheme, page 11
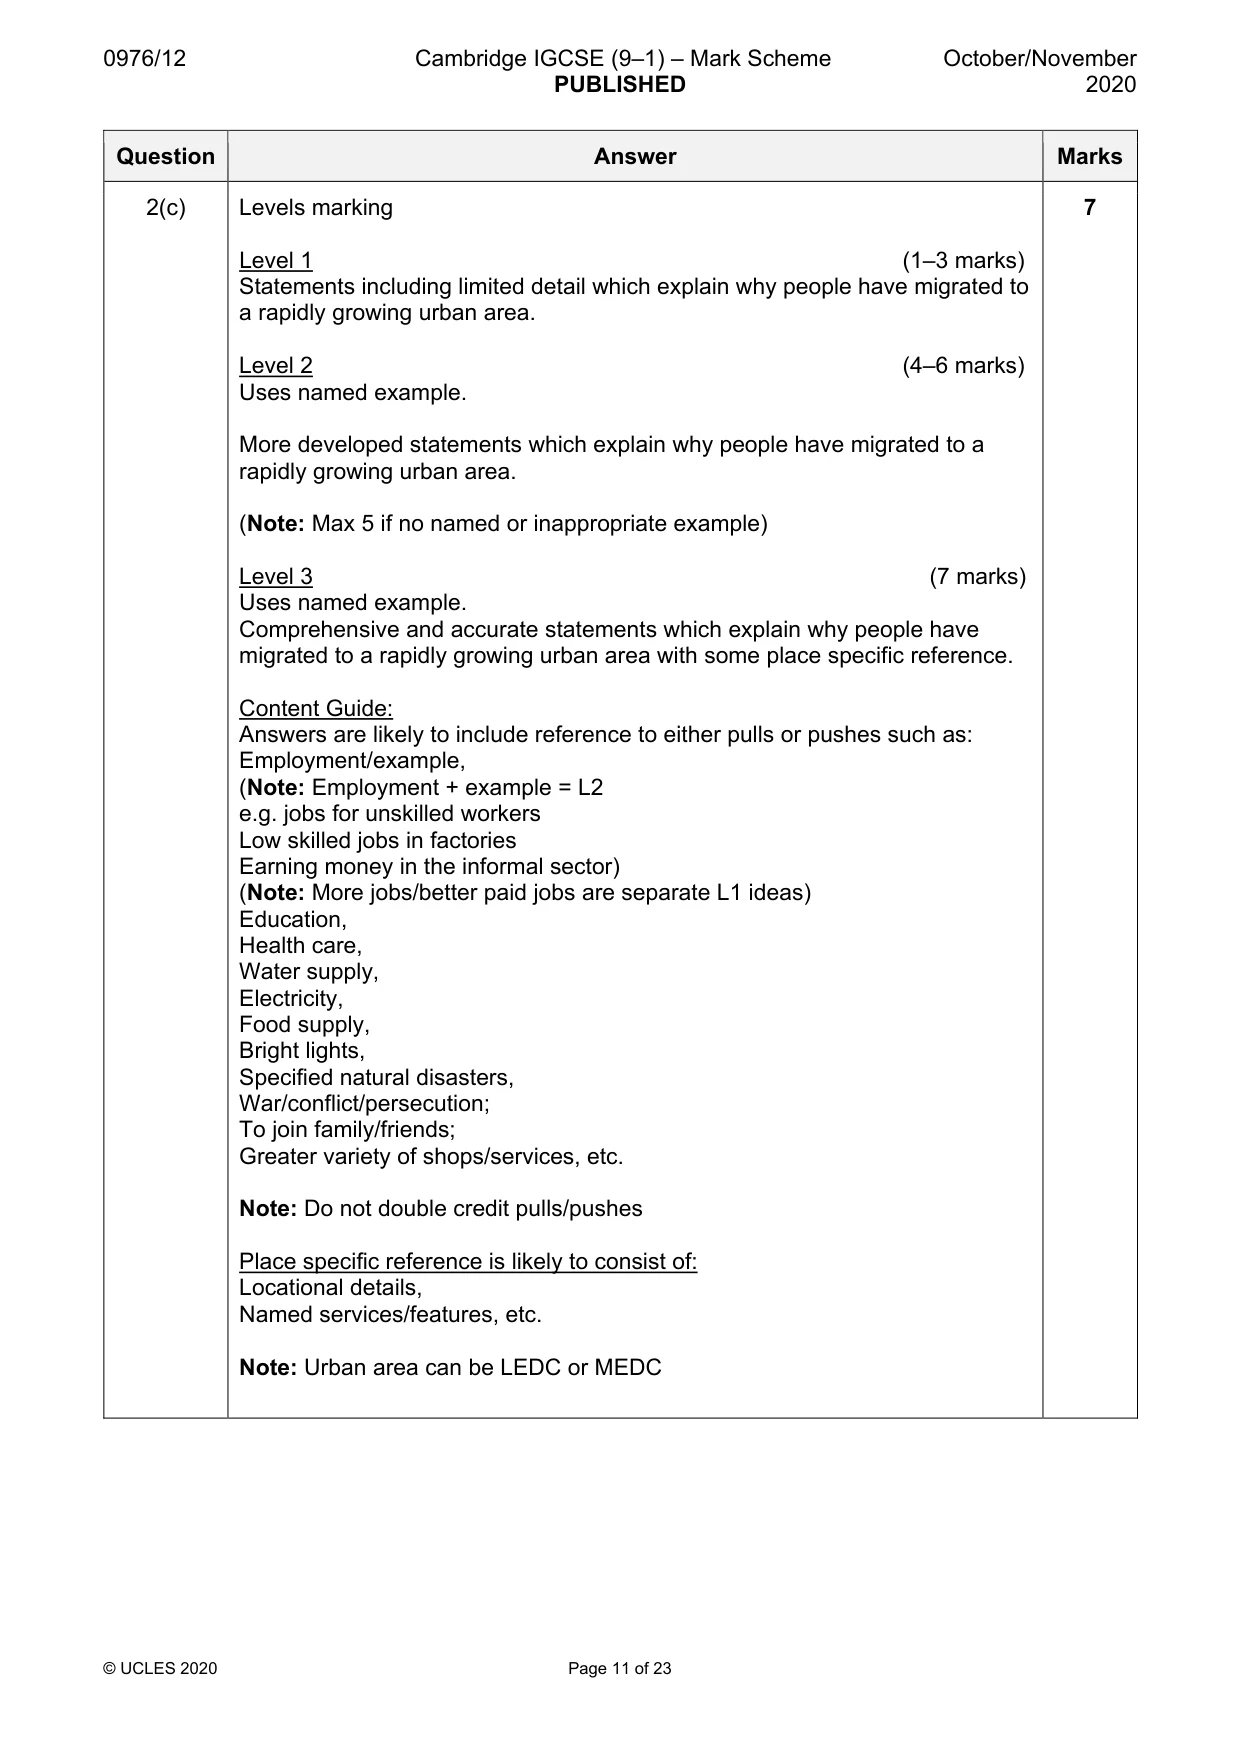
0976/12 Cambridge IGCSE (9–1) – Mark Scheme PUBLISHED October/November 2020 © UCLES 2020 Page 11 of 23 Question Answer Marks 2(c) Levels marking Level 1 (1–3 marks) Statements including limited detail which explain why people have migrated to a rapidly growing urban area. Level 2 (4–6 marks) Uses named example. More developed statements which explain why people have migrated to a rapidly growing urban area. (Note: Max 5 if no named or inappropriate example) Level 3 (7 marks) Uses named example. Comprehensive and accurate statements which explain why people have migrated to a rapidly growing urban area with some place specific reference. Content Guide: Answers are likely to include reference to either pulls or pushes such as: Employment/example, (Note: Employment + example = L2 e.g. jobs for unskilled workers Low skilled jobs in factories Earning money in the informal sector) (Note: More jobs/better paid jobs are separate L1 ideas) Education, Health care, Water supply, Electricity, Food supply, Bright lights, Specified natural disasters, War/conflict/persecution; To join family/friends; Greater variety of shops/services, etc. Note: Do not double credit pulls/pushes Place specific reference is likely to consist of: Locational details, Named services/features, etc. Note: Urban area can be LEDC or MEDC 7
Mark scheme, page 12
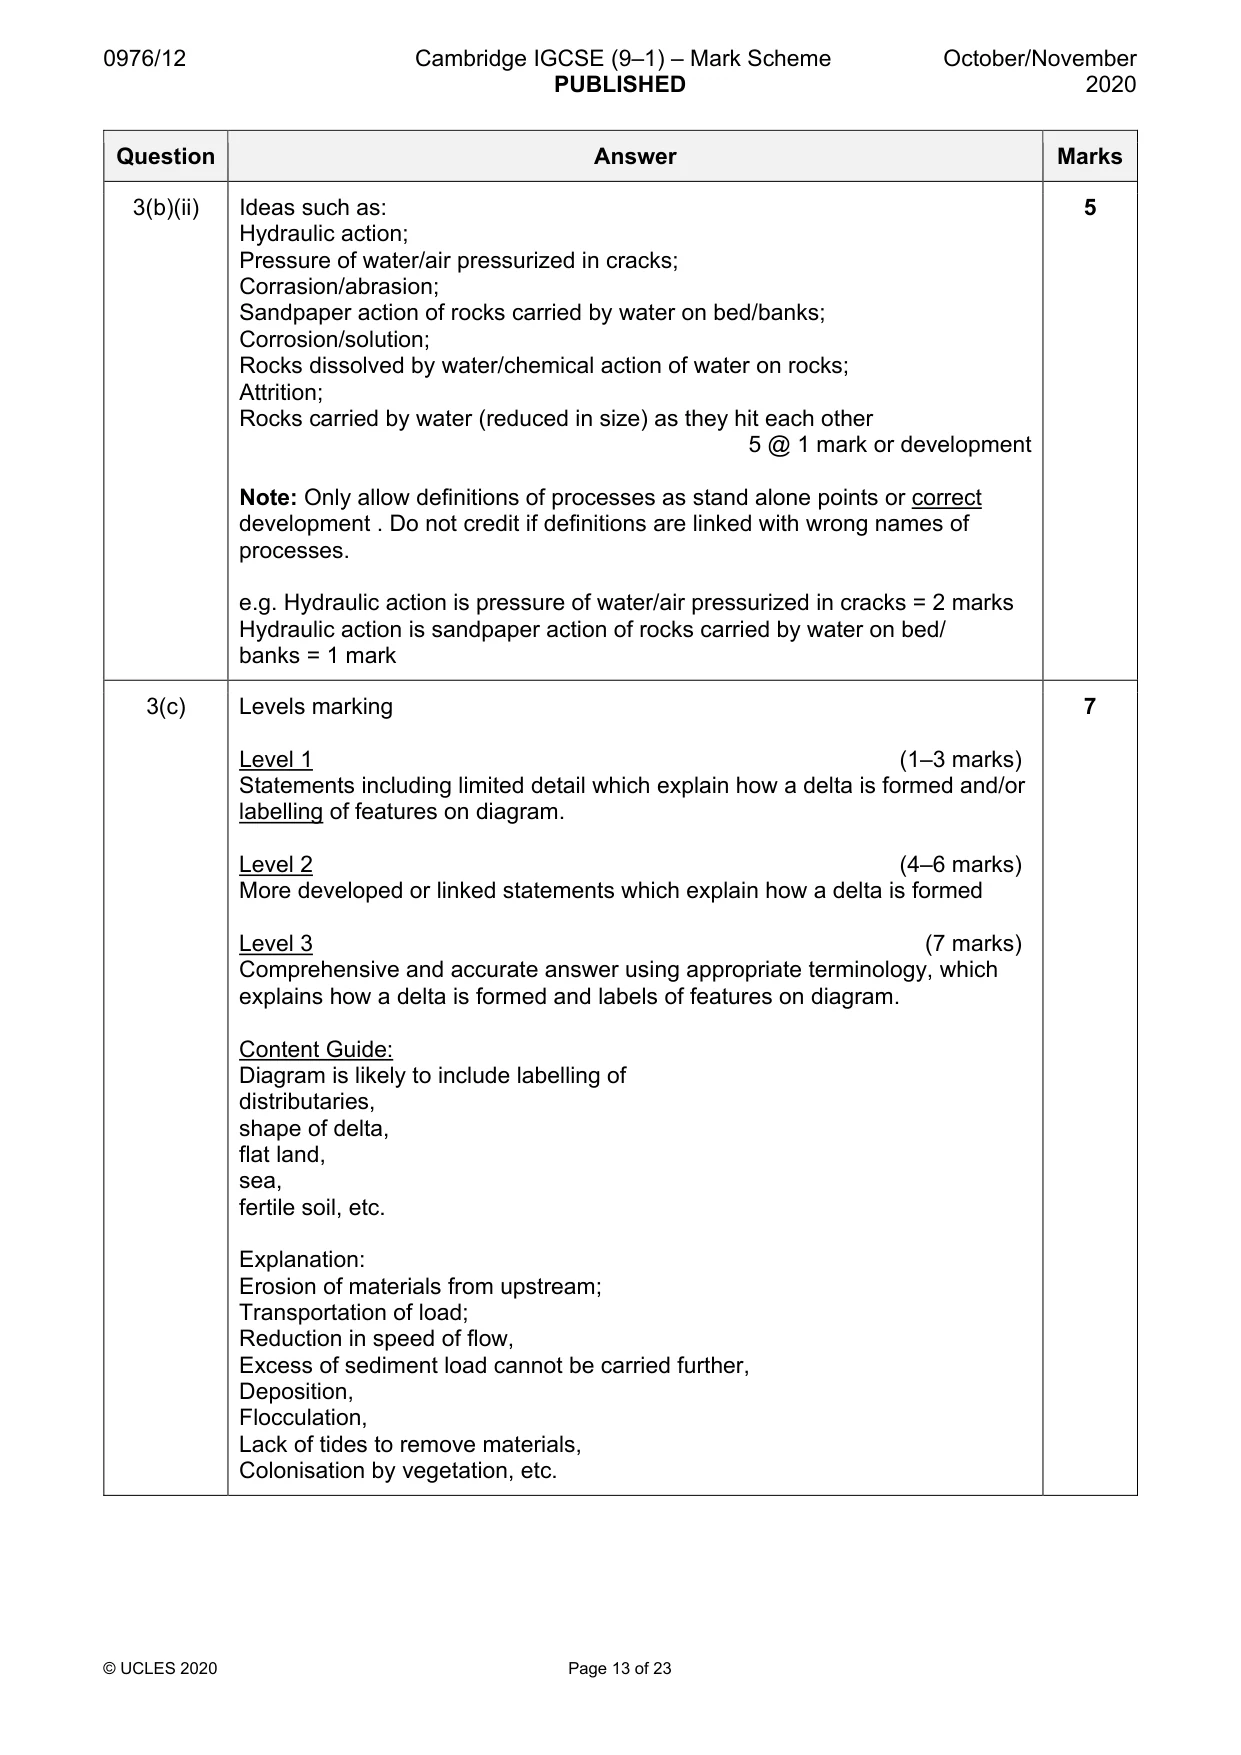
0976/12 Cambridge IGCSE (9–1) – Mark Scheme PUBLISHED October/November 2020 © UCLES 2020 Page 12 of 23 Question Answer Marks 3(a)(i) The changing of water to water vapour by plants/evaporation of water by plants/trees. 1 mark 1 3(a)(ii) From place to place – different amounts/types of plants/vegetation/trees (or examples) Different times of year – many plants/vegetation/trees will not have leaves all year/plants/vegetation/trees may grow only during certain seasons 2 @ 1 mark 2 3(a)(iii) X = Overland flow/surface run off Y = Throughflow Z = Ground(water) flow/base flow 3 @ 1 mark 3 3(a)(iv) On outline map. 4 @ 1 mark Note: Multiple examples can only be credited if all are correct 4 3(b)(i) Similarities – both; are narrow/thin/small; have rocks (in channel); flow in a valley; shallow, etc. Differences: 3.3/1st one has a waterfall/steeper long profile but 3.4 does not; the long profile of 3.4/2nd one is more regular, etc. 3.3 has more turbulent water/white water; Note: 1 MAX 2 on each of similarities/differences 2 Comparison is needed in the difference section – do not accept ‘one is.one isn’t’ approach. 3 @ 1 mark = 0 Features of the valley Vegetation Meanders/more winding Speed of flow Near source/in upper course Similar width/size 3
Mark scheme, page 13
0976/12 Cambridge IGCSE (9–1) – Mark Scheme PUBLISHED October/November 2020 © UCLES 2020 Page 13 of 23 Question Answer Marks 3(b)(ii) Ideas such as: Hydraulic action; Pressure of water/air pressurized in cracks; Corrasion/abrasion; Sandpaper action of rocks carried by water on bed/banks; Corrosion/solution; Rocks dissolved by water/chemical action of water on rocks; Attrition; Rocks carried by water (reduced in size) as they hit each other 5 @ 1 mark or development Note: Only allow definitions of processes as stand alone points or correct development . Do not credit if definitions are linked with wrong names of processes. e.g. Hydraulic action is pressure of water/air pressurized in cracks = 2 marks Hydraulic action is sandpaper action of rocks carried by water on bed/ banks = 1 mark 5 3(c) Levels marking Level 1 (1–3 marks) Statements including limited detail which explain how a delta is formed and/or labelling of features on diagram. Level 2 (4–6 marks) More developed or linked statements which explain how a delta is formed Level 3 (7 marks) Comprehensive and accurate answer using appropriate terminology, which explains how a delta is formed and labels of features on diagram. Content Guide: Diagram is likely to include labelling of distributaries, shape of delta, flat land, sea, fertile soil, etc. Explanation: Erosion of materials from upstream; Transportation of load; Reduction in speed of flow, Excess of sediment load cannot be carried further, Deposition, Flocculation, Lack of tides to remove materials, Colonisation by vegetation, etc. 7
Mark scheme, page 14
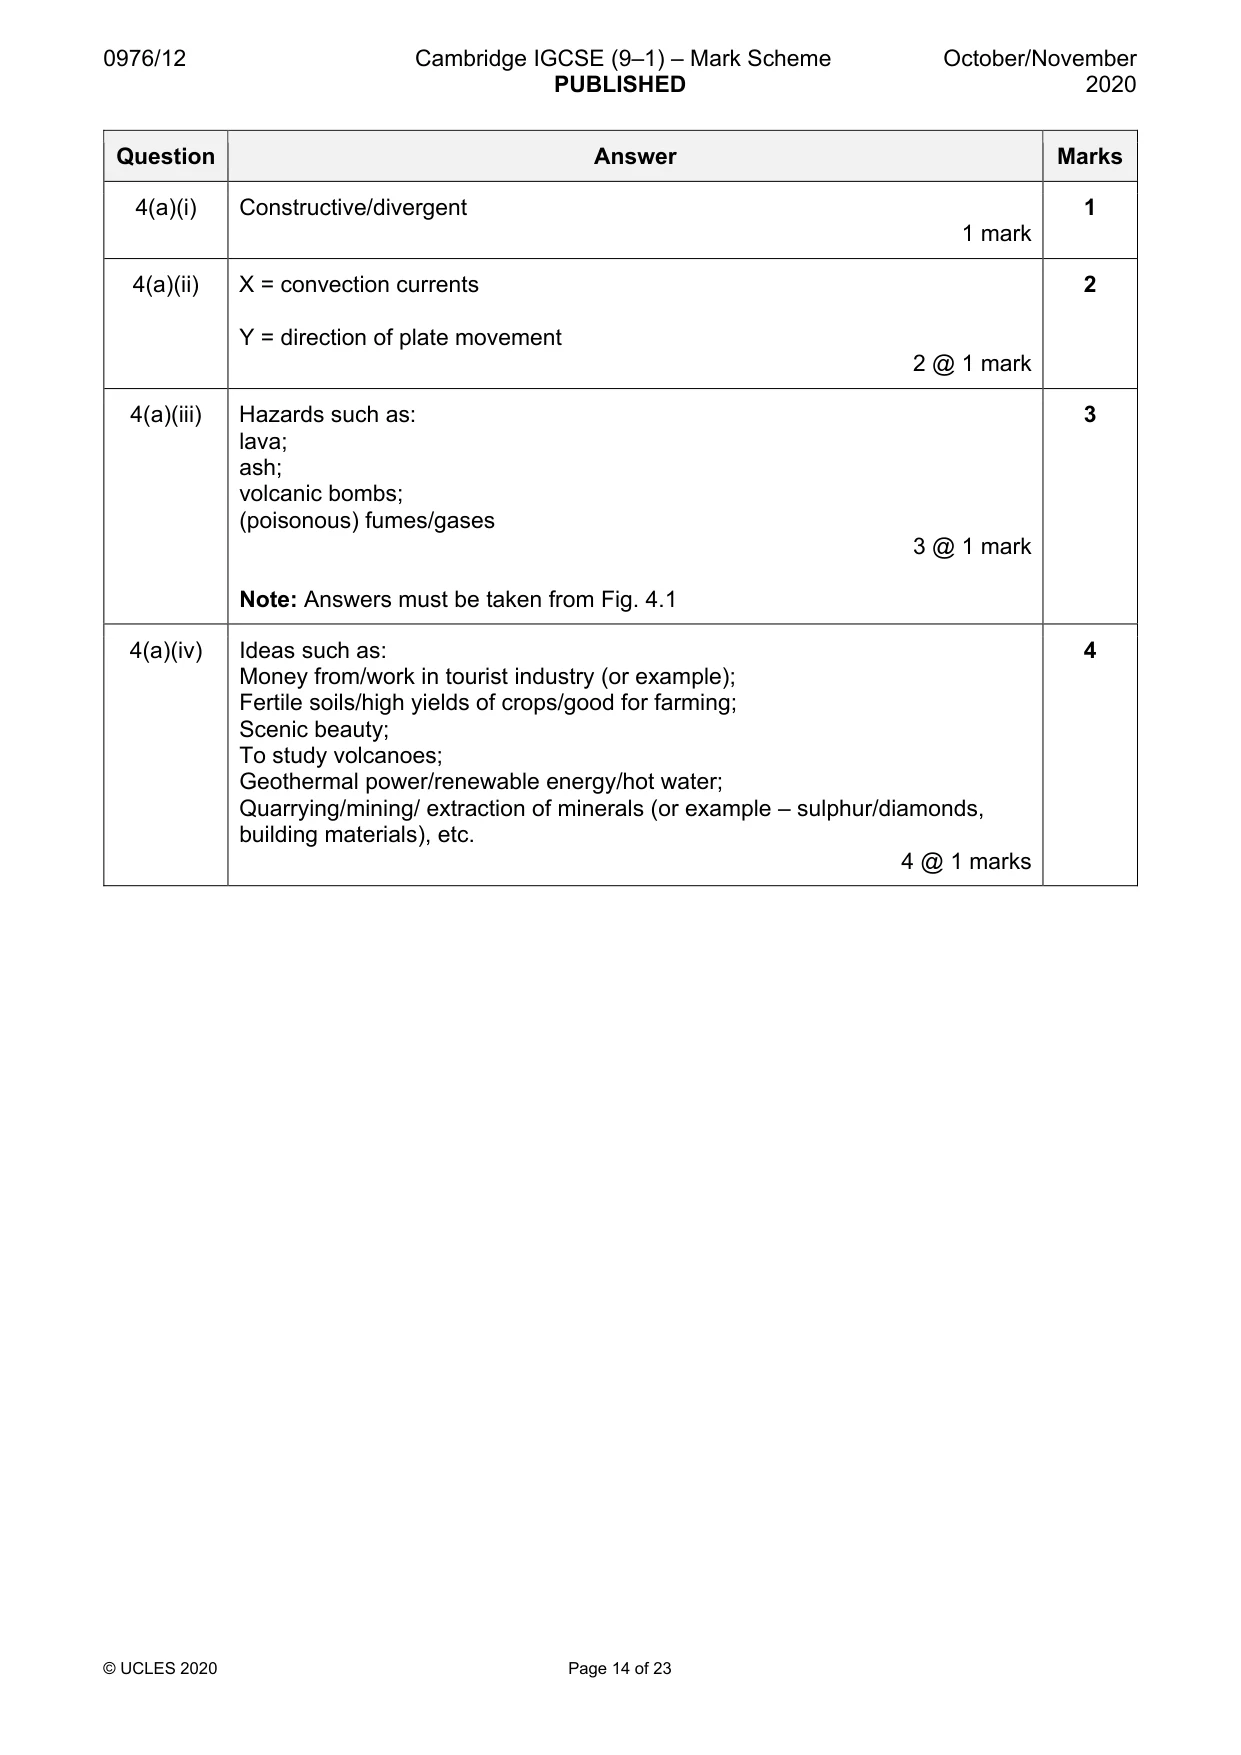
0976/12 Cambridge IGCSE (9–1) – Mark Scheme PUBLISHED October/November 2020 © UCLES 2020 Page 14 of 23 Question Answer Marks 4(a)(i) Constructive/divergent 1 mark 1 4(a)(ii) X = convection currents Y = direction of plate movement 2 @ 1 mark 2 4(a)(iii) Hazards such as: lava; ash; volcanic bombs; (poisonous) fumes/gases 3 @ 1 mark Note: Answers must be taken from Fig. 4.1 3 4(a)(iv) Ideas such as: Money from/work in tourist industry (or example); Fertile soils/high yields of crops/good for farming; Scenic beauty; To study volcanoes; Geothermal power/renewable energy/hot water; Quarrying/mining/ extraction of minerals (or example – sulphur/diamonds, building materials), etc. 4 @ 1 marks 4
Mark scheme, page 15
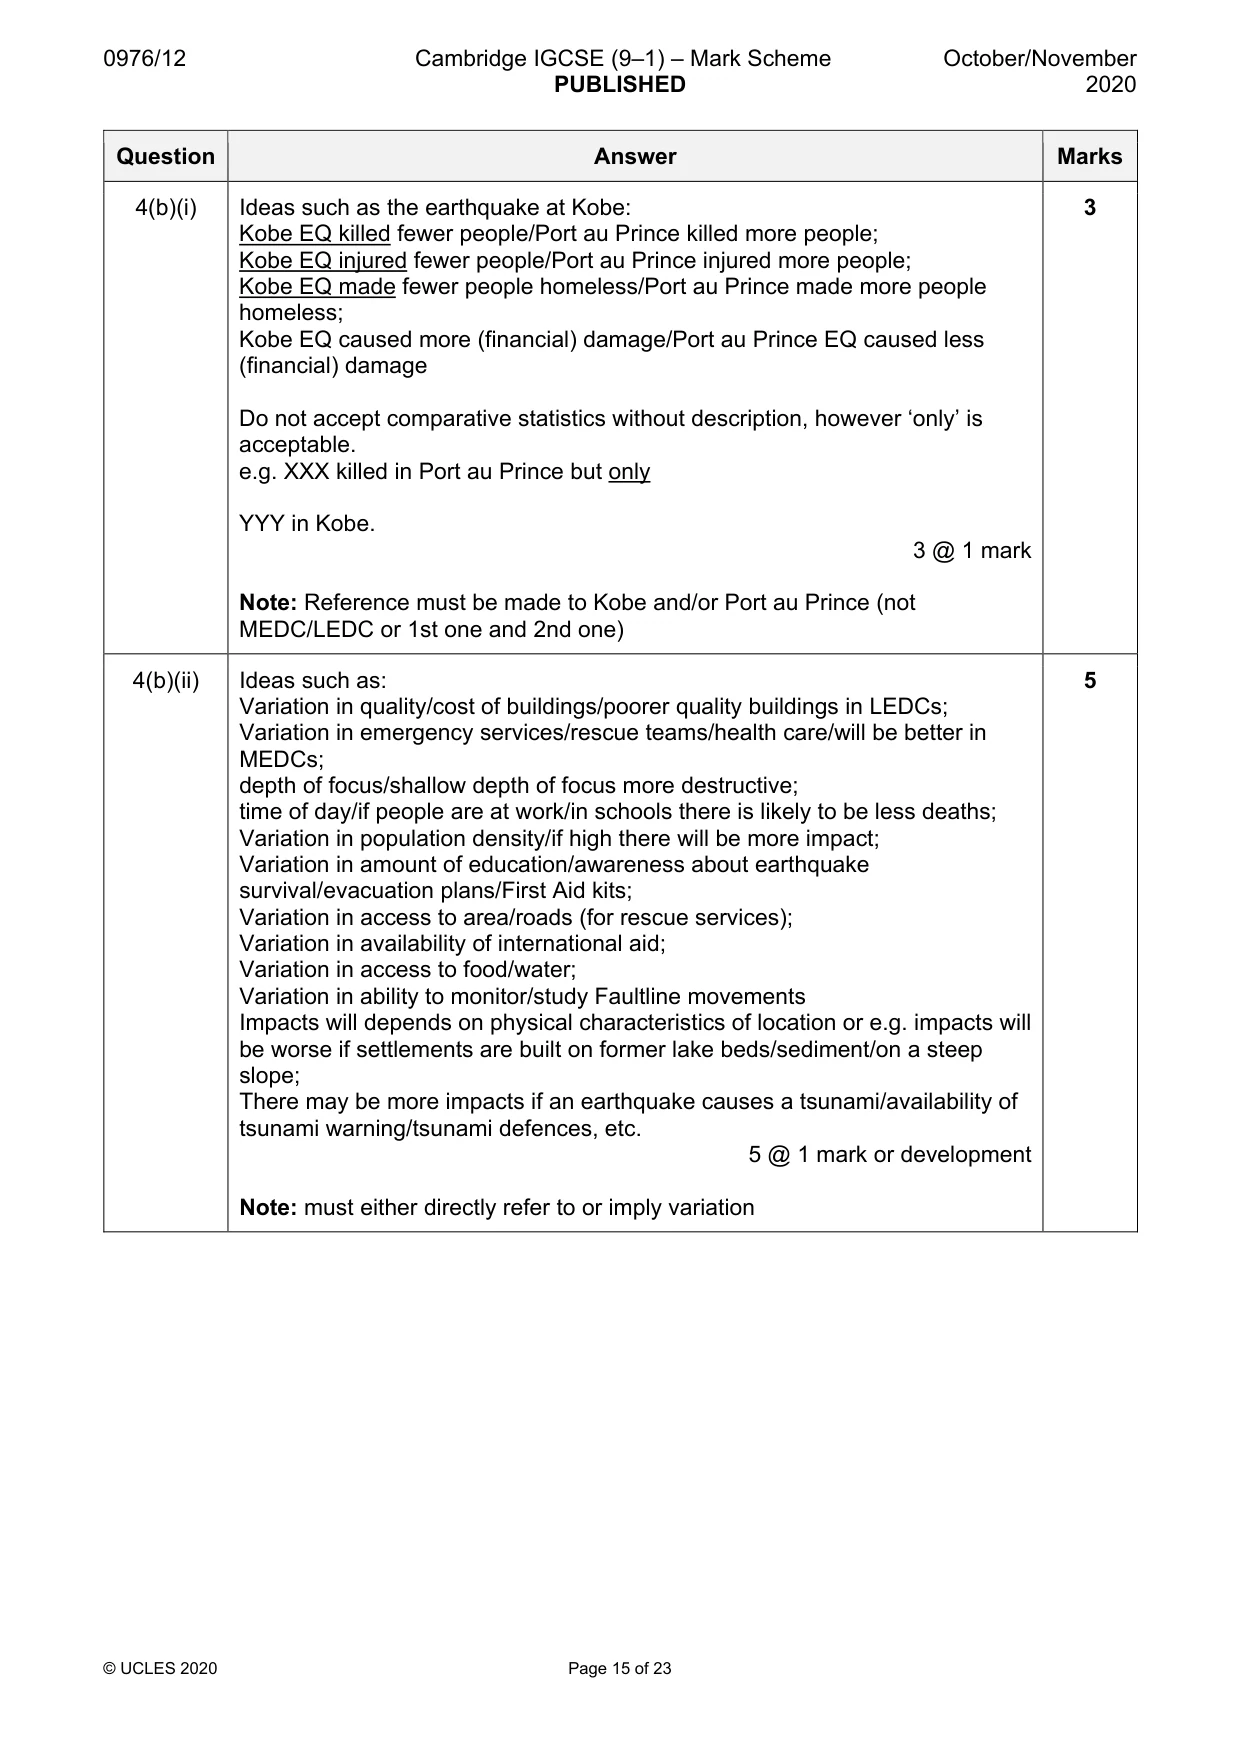
0976/12 Cambridge IGCSE (9–1) – Mark Scheme PUBLISHED October/November 2020 © UCLES 2020 Page 15 of 23 Question Answer Marks 4(b)(i) Ideas such as the earthquake at Kobe: Kobe EQ killed fewer people/Port au Prince killed more people; Kobe EQ injured fewer people/Port au Prince injured more people; Kobe EQ made fewer people homeless/Port au Prince made more people homeless; Kobe EQ caused more (financial) damage/Port au Prince EQ caused less (financial) damage Do not accept comparative statistics without description, however ‘only’ is acceptable. e.g. XXX killed in Port au Prince but only YYY in Kobe. 3 @ 1 mark Note: Reference must be made to Kobe and/or Port au Prince (not MEDC/LEDC or 1st one and 2nd one) 3 4(b)(ii) Ideas such as: Variation in quality/cost of buildings/poorer quality buildings in LEDCs; Variation in emergency services/rescue teams/health care/will be better in MEDCs; depth of focus/shallow depth of focus more destructive; time of day/if people are at work/in schools there is likely to be less deaths; Variation in population density/if high there will be more impact; Variation in amount of education/awareness about earthquake survival/evacuation plans/First Aid kits; Variation in access to area/roads (for rescue services); Variation in availability of international aid; Variation in access to food/water; Variation in ability to monitor/study Faultline movements Impacts will depends on physical characteristics of location or e.g. impacts will be worse if settlements are built on former lake beds/sediment/on a steep slope; There may be more impacts if an earthquake causes a tsunami/availability of tsunami warning/tsunami defences, etc. 5 @ 1 mark or development Note: must either directly refer to or imply variation 5
Mark scheme, page 16
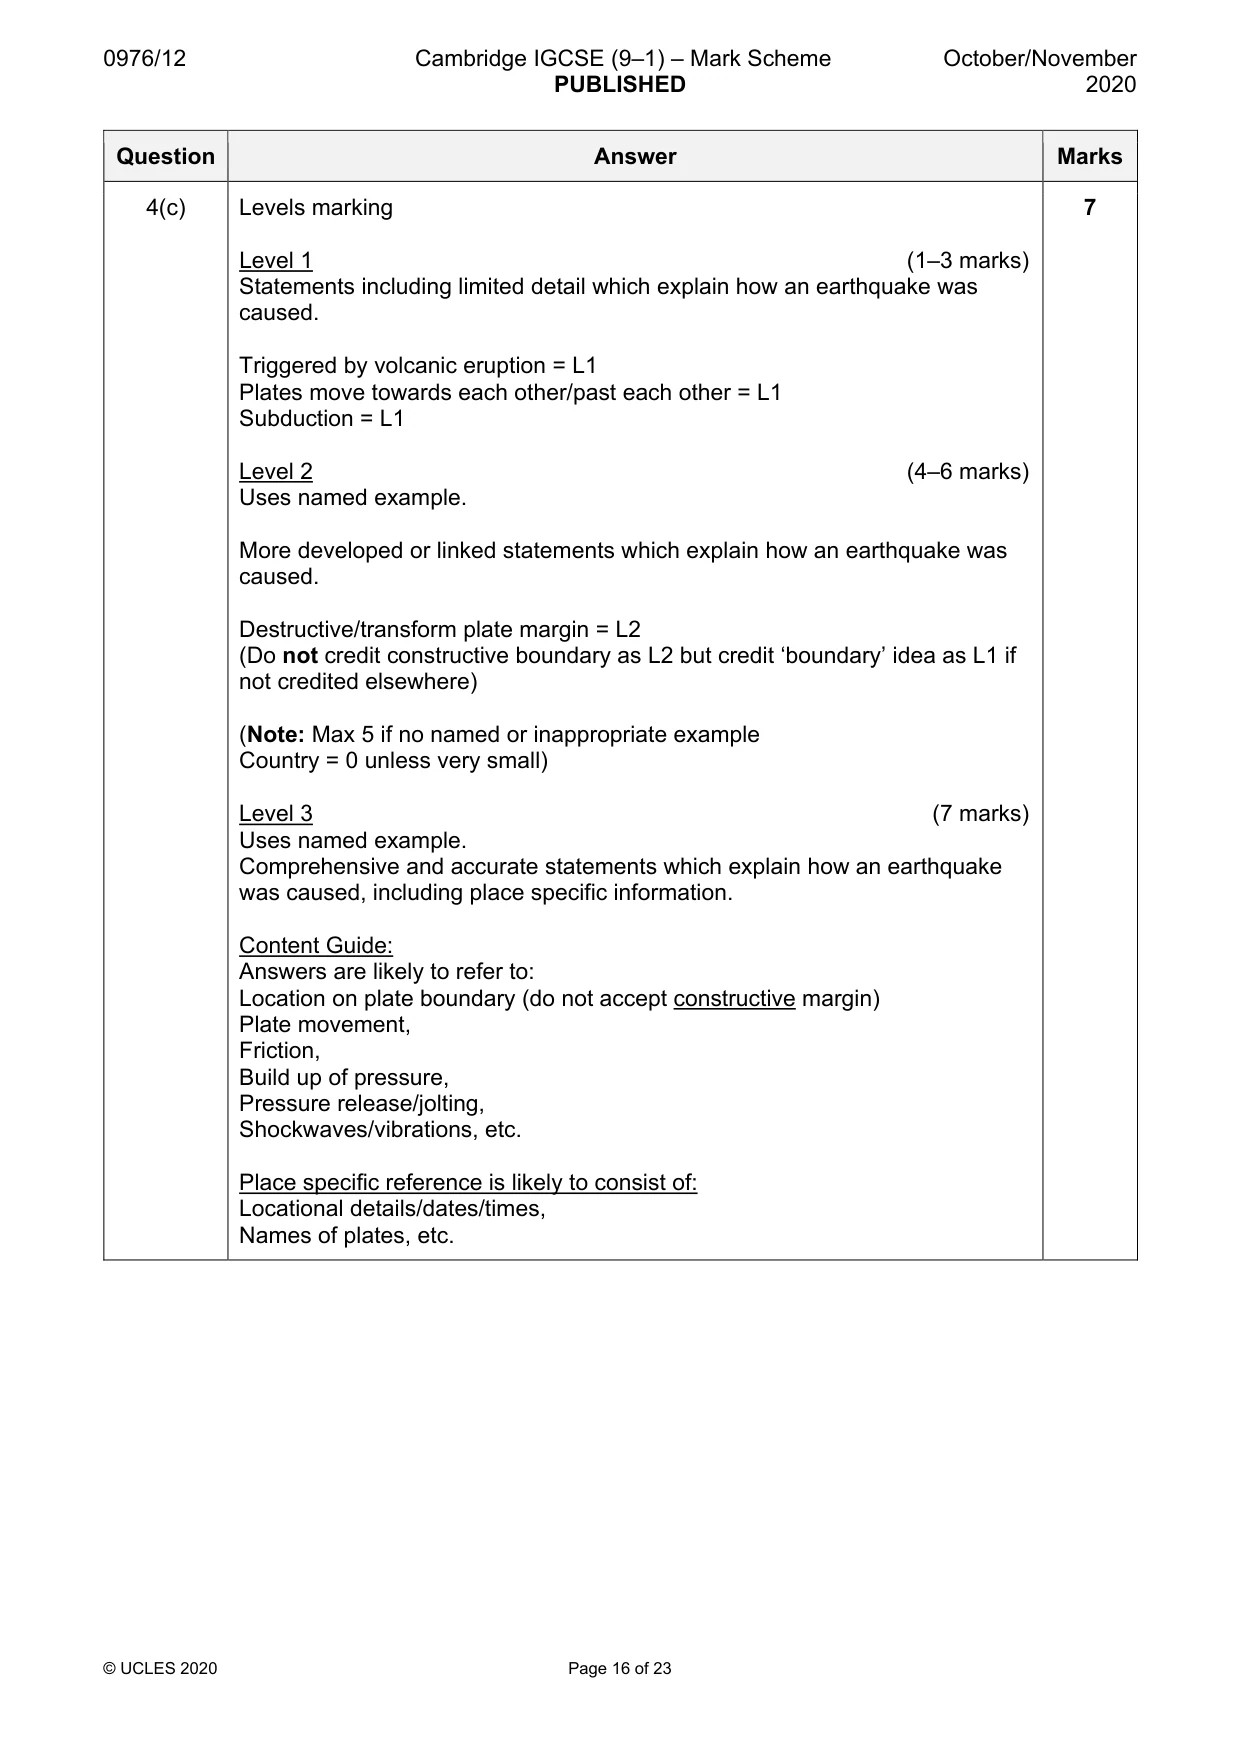
0976/12 Cambridge IGCSE (9–1) – Mark Scheme PUBLISHED October/November 2020 © UCLES 2020 Page 16 of 23 Question Answer Marks 4(c) Levels marking Level 1 (1–3 marks) Statements including limited detail which explain how an earthquake was caused. Triggered by volcanic eruption = L1 Plates move towards each other/past each other = L1 Subduction = L1 Level 2 (4–6 marks) Uses named example. More developed or linked statements which explain how an earthquake was caused. Destructive/transform plate margin = L2 (Do not credit constructive boundary as L2 but credit ‘boundary’ idea as L1 if not credited elsewhere) (Note: Max 5 if no named or inappropriate example Country = 0 unless very small) Level 3 (7 marks) Uses named example. Comprehensive and accurate statements which explain how an earthquake was caused, including place specific information. Content Guide: Answers are likely to refer to: Location on plate boundary (do not accept constructive margin) Plate movement, Friction, Build up of pressure, Pressure release/jolting, Shockwaves/vibrations, etc. Place specific reference is likely to consist of: Locational details/dates/times, Names of plates, etc. 7
Mark scheme, page 17
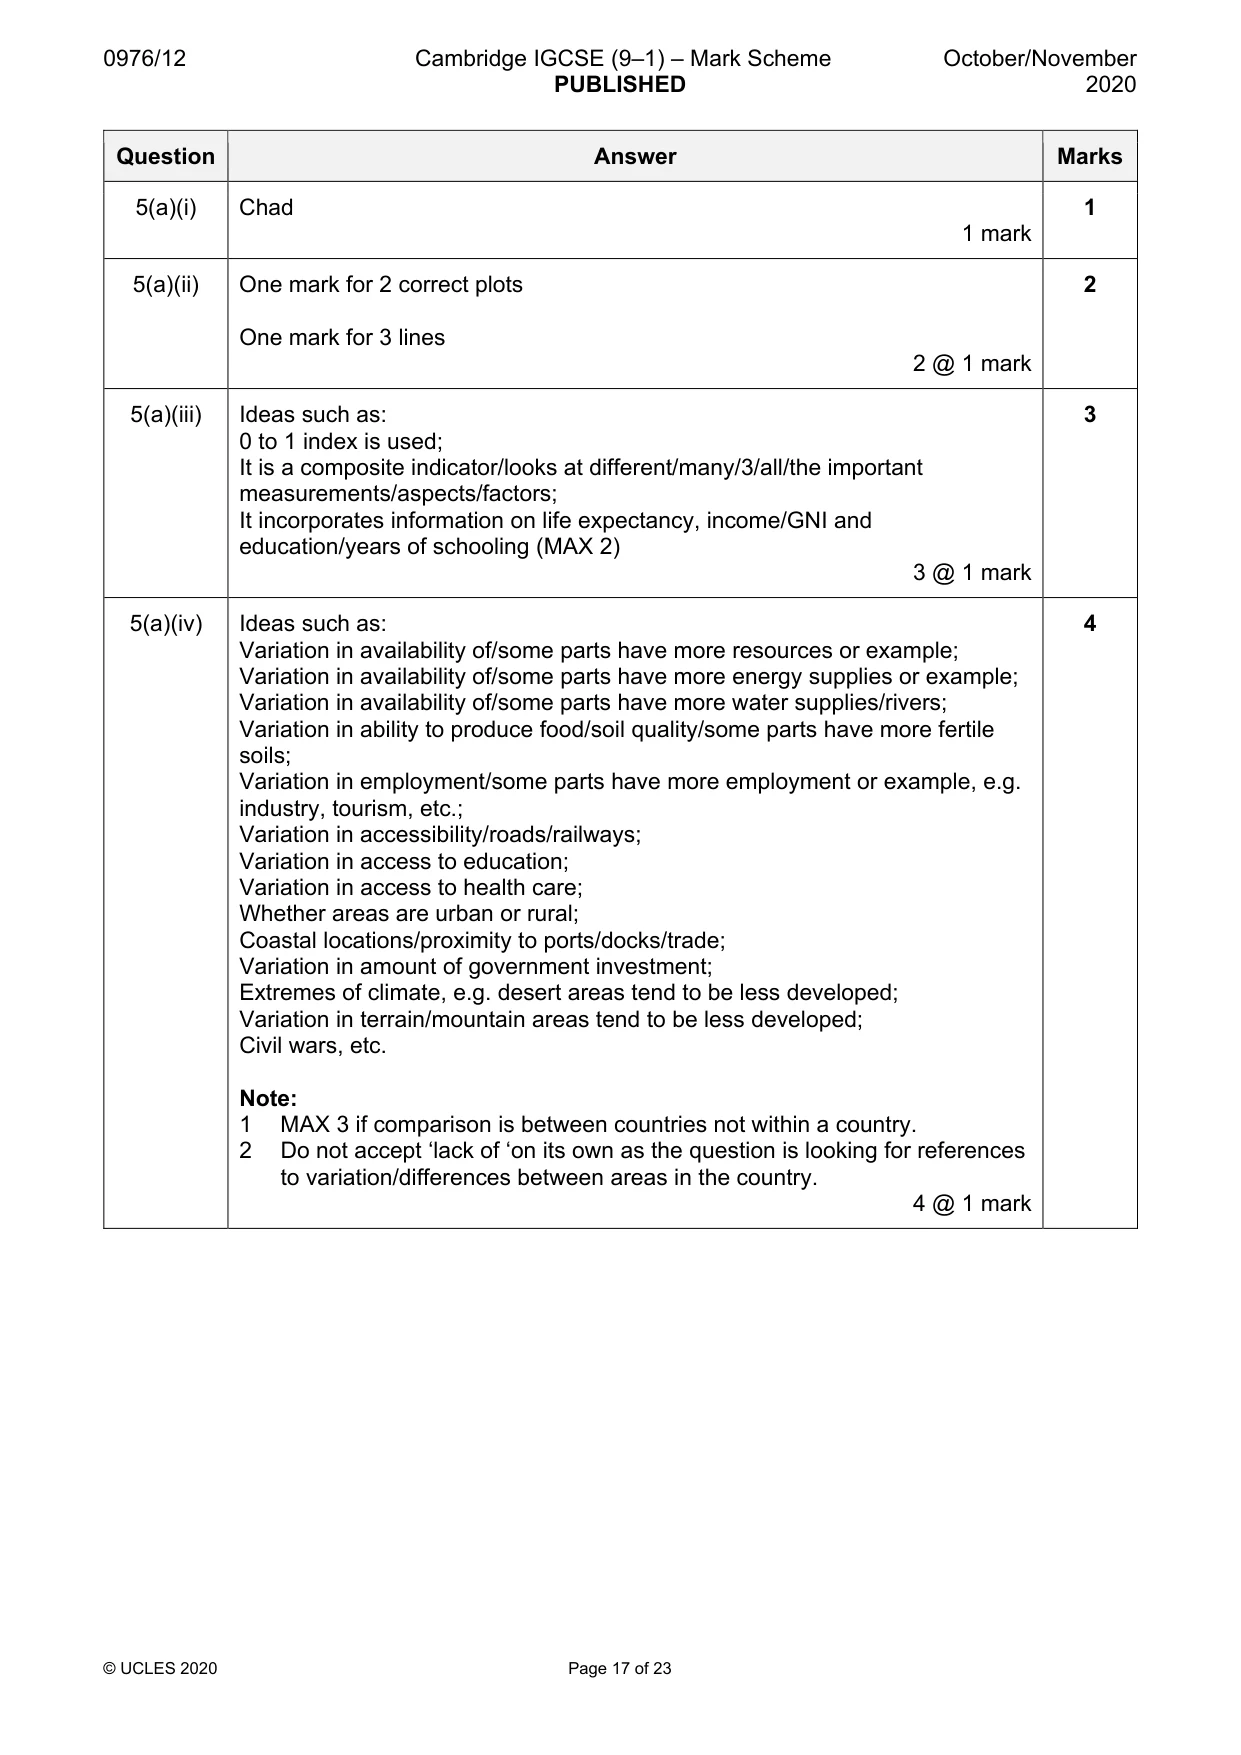
0976/12 Cambridge IGCSE (9–1) – Mark Scheme PUBLISHED October/November 2020 © UCLES 2020 Page 17 of 23 Question Answer Marks 5(a)(i) Chad 1 mark 1 5(a)(ii) One mark for 2 correct plots One mark for 3 lines 2 @ 1 mark 2 5(a)(iii) Ideas such as: 0 to 1 index is used; It is a composite indicator/looks at different/many/3/all/the important measurements/aspects/factors; It incorporates information on life expectancy, income/GNI and education/years of schooling (MAX 2) 3 @ 1 mark 3 5(a)(iv) Ideas such as: Variation in availability of/some parts have more resources or example; Variation in availability of/some parts have more energy supplies or example; Variation in availability of/some parts have more water supplies/rivers; Variation in ability to produce food/soil quality/some parts have more fertile soils; Variation in employment/some parts have more employment or example, e.g. industry, tourism, etc.; Variation in accessibility/roads/railways; Variation in access to education; Variation in access to health care; Whether areas are urban or rural; Coastal locations/proximity to ports/docks/trade; Variation in amount of government investment; Extremes of climate, e.g. desert areas tend to be less developed; Variation in terrain/mountain areas tend to be less developed; Civil wars, etc. Note: 1 MAX 3 if comparison is between countries not within a country. 2 Do not accept ‘lack of ‘on its own as the question is looking for references to variation/differences between areas in the country. 4 @ 1 mark 4
Mark scheme, page 18
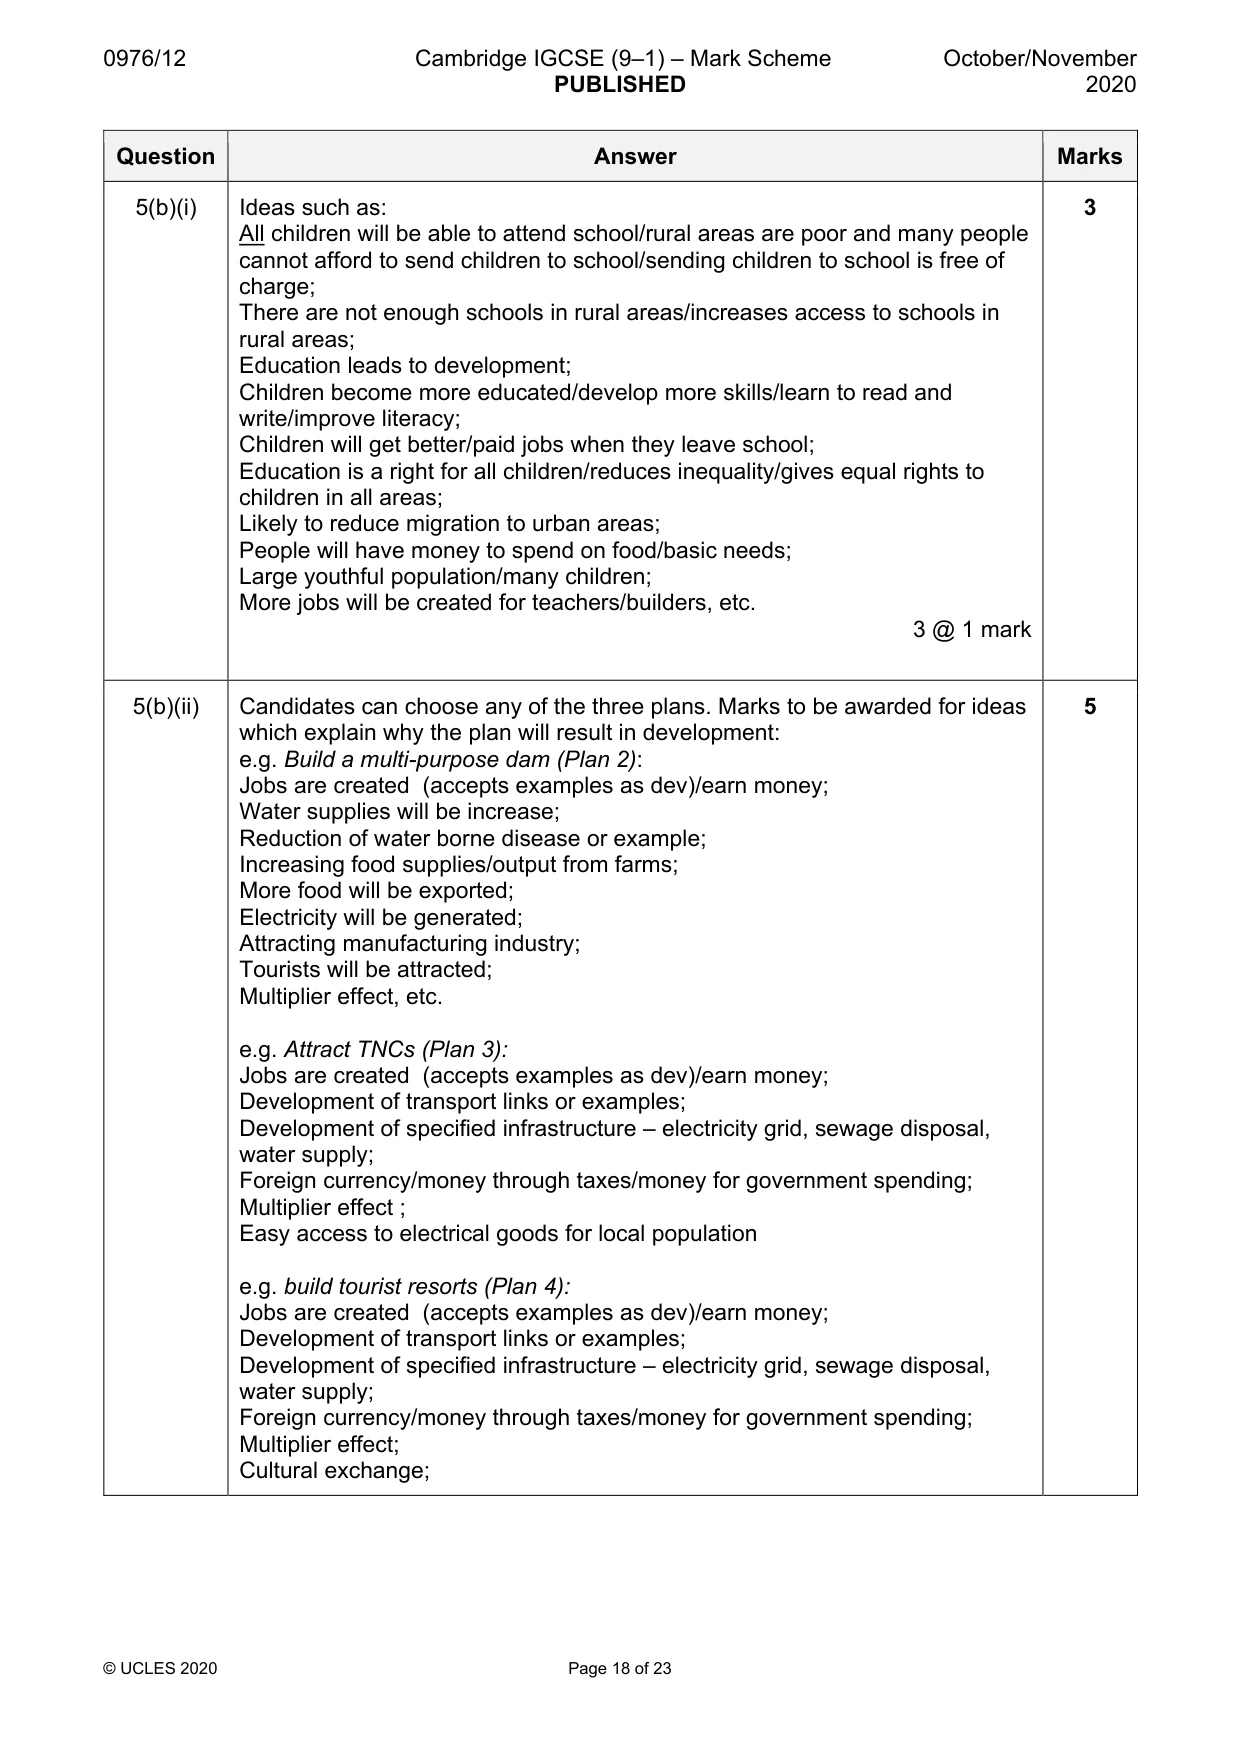
0976/12 Cambridge IGCSE (9–1) – Mark Scheme PUBLISHED October/November 2020 © UCLES 2020 Page 18 of 23 Question Answer Marks 5(b)(i) Ideas such as: All children will be able to attend school/rural areas are poor and many people cannot afford to send children to school/sending children to school is free of charge; There are not enough schools in rural areas/increases access to schools in rural areas; Education leads to development; Children become more educated/develop more skills/learn to read and write/improve literacy; Children will get better/paid jobs when they leave school; Education is a right for all children/reduces inequality/gives equal rights to children in all areas; Likely to reduce migration to urban areas; People will have money to spend on food/basic needs; Large youthful population/many children; More jobs will be created for teachers/builders, etc. 3 @ 1 mark 3 5(b)(ii) Candidates can choose any of the three plans. Marks to be awarded for ideas which explain why the plan will result in development: e.g. Build a multi-purpose dam (Plan 2): Jobs are created (accepts examples as dev)/earn money; Water supplies will be increase; Reduction of water borne disease or example; Increasing food supplies/output from farms; More food will be exported; Electricity will be generated; Attracting manufacturing industry; Tourists will be attracted; Multiplier effect, etc. e.g. Attract TNCs (Plan 3): Jobs are created (accepts examples as dev)/earn money; Development of transport links or examples; Development of specified infrastructure – electricity grid, sewage disposal, water supply; Foreign currency/money through taxes/money for government spending; Multiplier effect ; Easy access to electrical goods for local population e.g. build tourist resorts (Plan 4): Jobs are created (accepts examples as dev)/earn money; Development of transport links or examples; Development of specified infrastructure – electricity grid, sewage disposal, water supply; Foreign currency/money through taxes/money for government spending; Multiplier effect; Cultural exchange; 5
Mark scheme, page 19
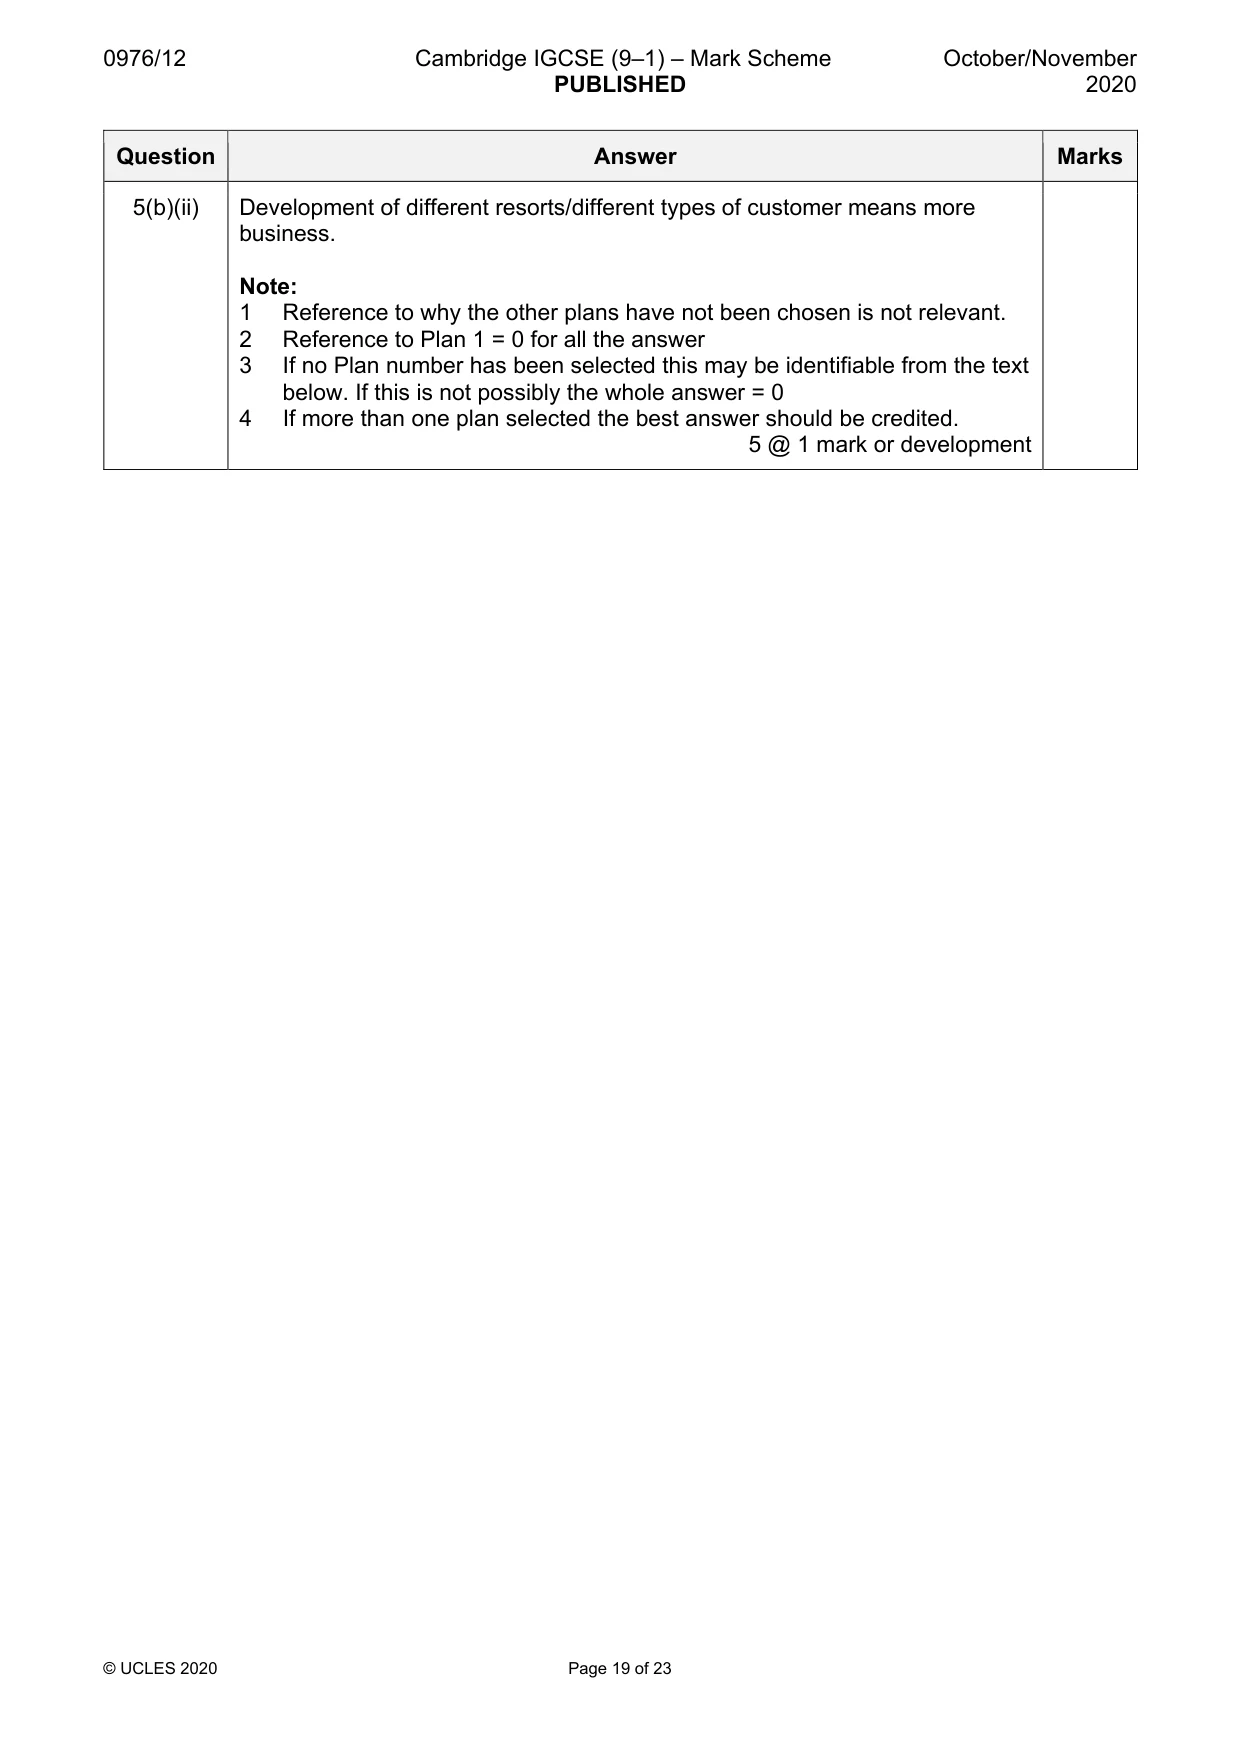
0976/12 Cambridge IGCSE (9–1) – Mark Scheme PUBLISHED October/November 2020 © UCLES 2020 Page 19 of 23 Question Answer Marks 5(b)(ii) Development of different resorts/different types of customer means more business. Note: 1 Reference to why the other plans have not been chosen is not relevant. 2 Reference to Plan 1 = 0 for all the answer 3 If no Plan number has been selected this may be identifiable from the text below. If this is not possibly the whole answer = 0 4 If more than one plan selected the best answer should be credited. 5 @ 1 mark or development
Mark scheme, page 20
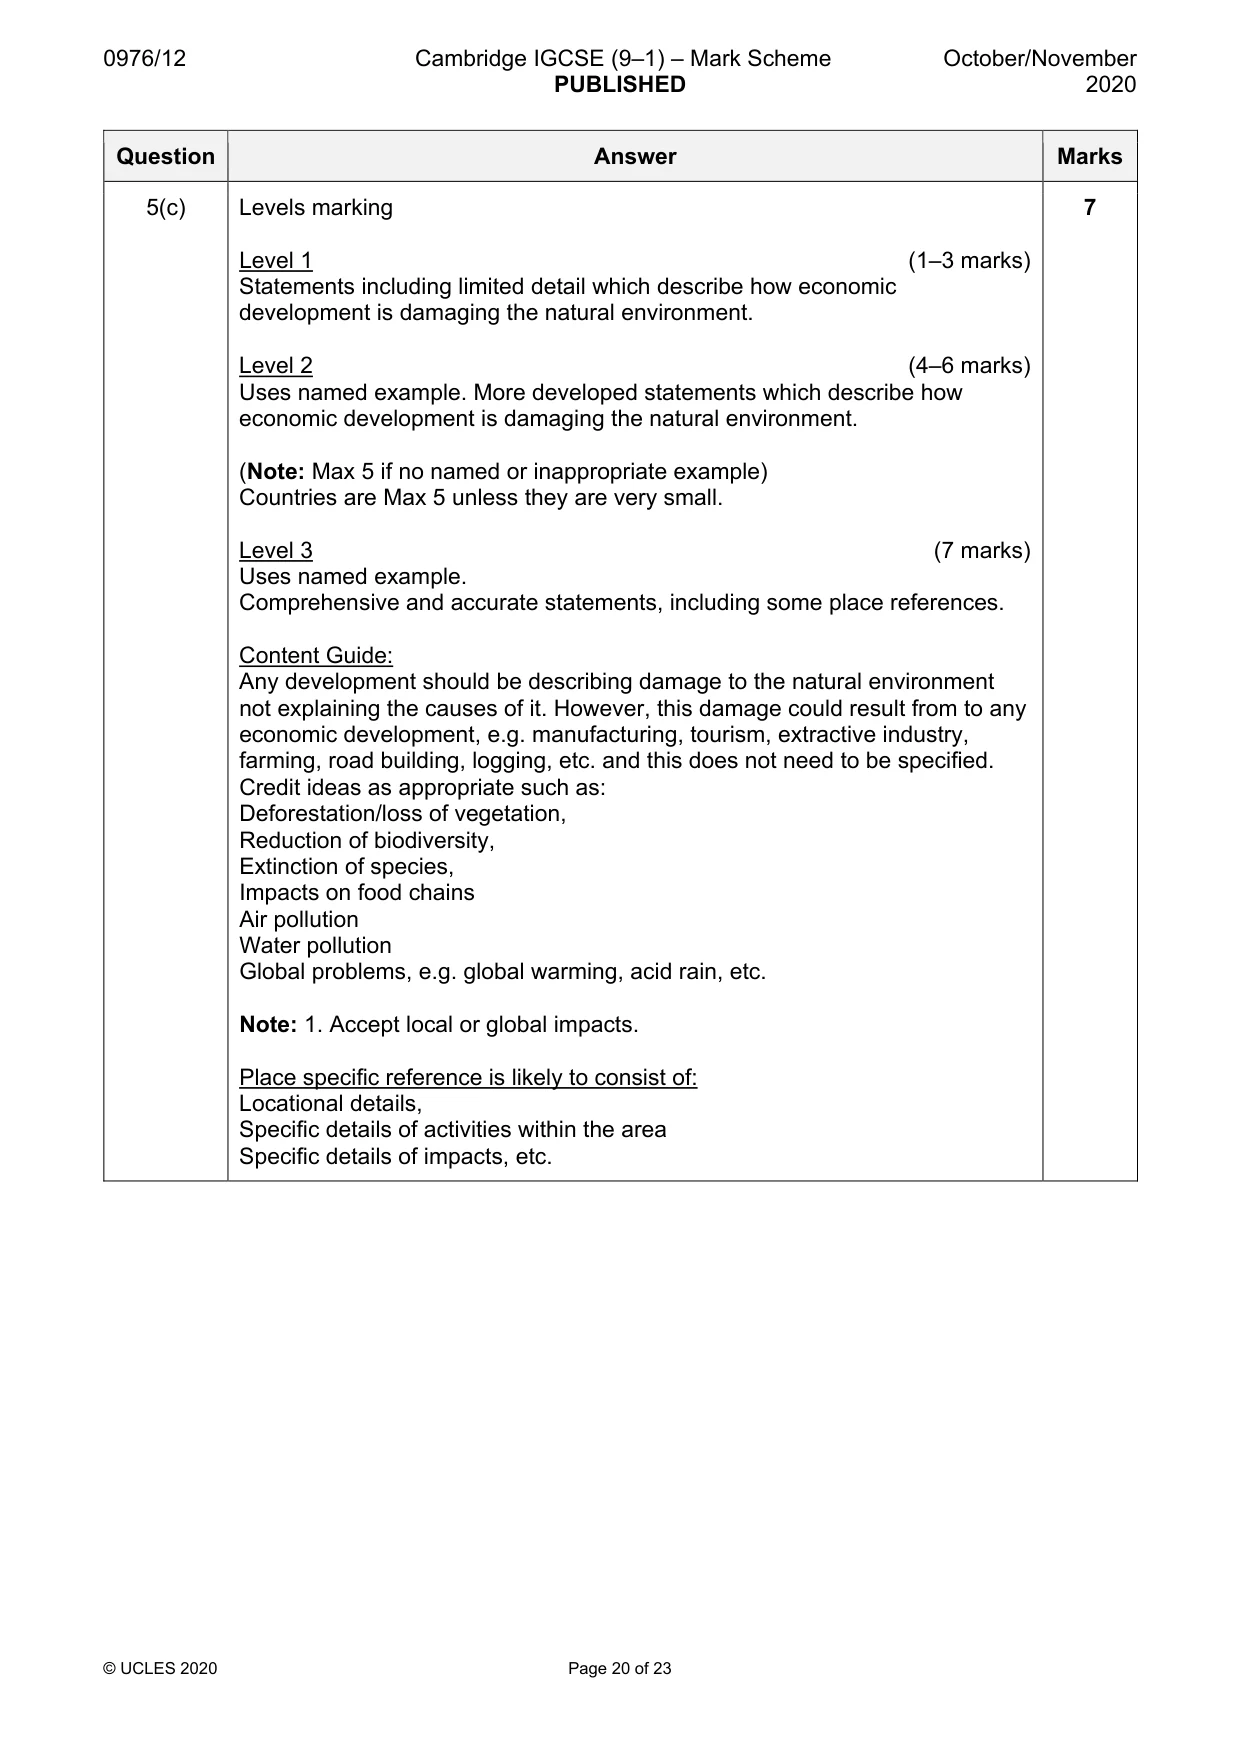
0976/12 Cambridge IGCSE (9–1) – Mark Scheme PUBLISHED October/November 2020 © UCLES 2020 Page 20 of 23 Question Answer Marks 5(c) Levels marking Level 1 (1–3 marks) Statements including limited detail which describe how economic development is damaging the natural environment. Level 2 (4–6 marks) Uses named example. More developed statements which describe how economic development is damaging the natural environment. (Note: Max 5 if no named or inappropriate example) Countries are Max 5 unless they are very small. Level 3 (7 marks) Uses named example. Comprehensive and accurate statements, including some place references. Content Guide: Any development should be describing damage to the natural environment not explaining the causes of it. However, this damage could result from to any economic development, e.g. manufacturing, tourism, extractive industry, farming, road building, logging, etc. and this does not need to be specified. Credit ideas as appropriate such as: Deforestation/loss of vegetation, Reduction of biodiversity, Extinction of species, Impacts on food chains Air pollution Water pollution Global problems, e.g. global warming, acid rain, etc. Note: 1. Accept local or global impacts. Place specific reference is likely to consist of: Locational details, Specific details of activities within the area Specific details of impacts, etc. 7
Mark scheme, page 21
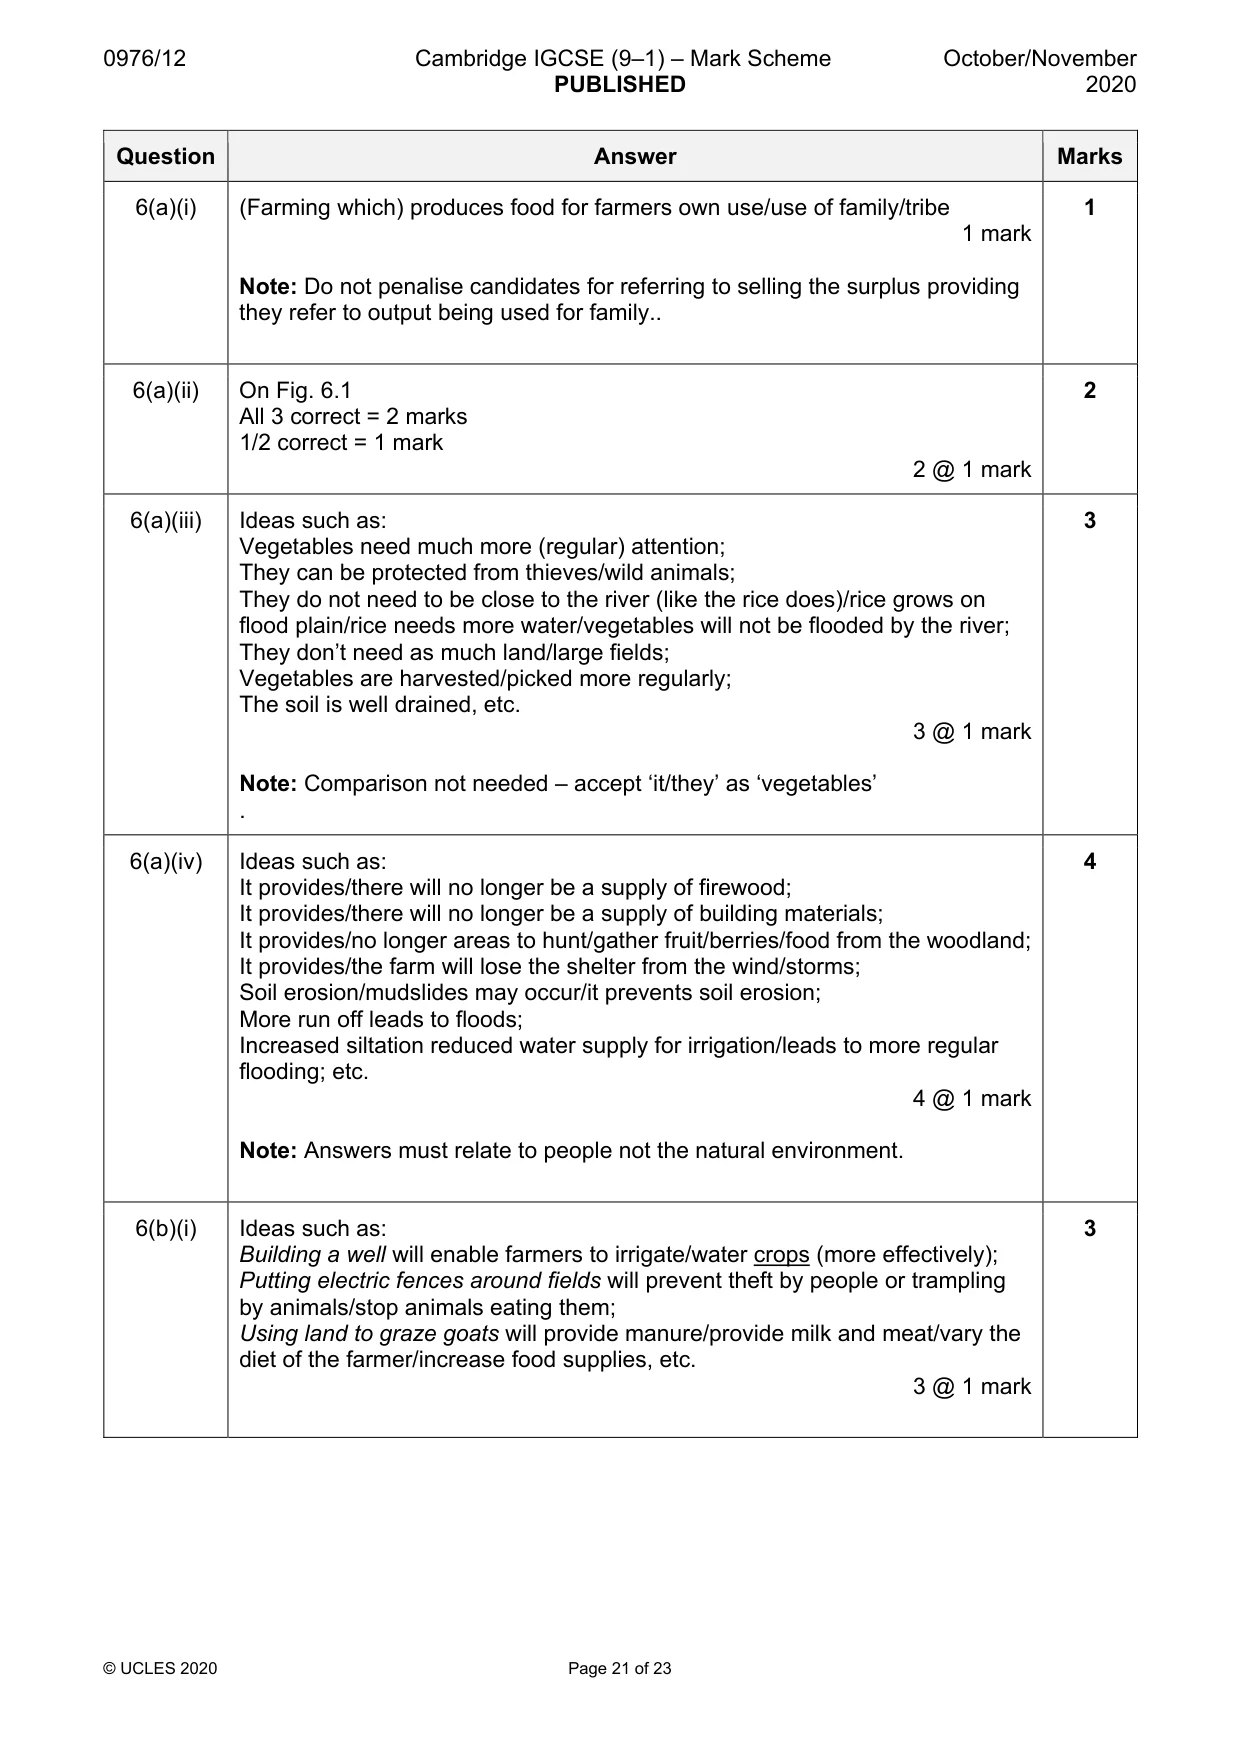
0976/12 Cambridge IGCSE (9–1) – Mark Scheme PUBLISHED October/November 2020 © UCLES 2020 Page 21 of 23 Question Answer Marks 6(a)(i) (Farming which) produces food for farmers own use/use of family/tribe 1 mark Note: Do not penalise candidates for referring to selling the surplus providing they refer to output being used for family.. 1 6(a)(ii) On Fig. 6.1 All 3 correct = 2 marks 1/2 correct = 1 mark 2 @ 1 mark 2 6(a)(iii) Ideas such as: Vegetables need much more (regular) attention; They can be protected from thieves/wild animals; They do not need to be close to the river (like the rice does)/rice grows on flood plain/rice needs more water/vegetables will not be flooded by the river; They don’t need as much land/large fields; Vegetables are harvested/picked more regularly; The soil is well drained, etc. 3 @ 1 mark Note: Comparison not needed – accept ‘it/they’ as ‘vegetables’ . 3 6(a)(iv) Ideas such as: It provides/there will no longer be a supply of firewood; It provides/there will no longer be a supply of building materials; It provides/no longer areas to hunt/gather fruit/berries/food from the woodland; It provides/the farm will lose the shelter from the wind/storms; Soil erosion/mudslides may occur/it prevents soil erosion; More run off leads to floods; Increased siltation reduced water supply for irrigation/leads to more regular flooding; etc. 4 @ 1 mark Note: Answers must relate to people not the natural environment. 4 6(b)(i) Ideas such as: Building a well will enable farmers to irrigate/water crops (more effectively); Putting electric fences around fields will prevent theft by people or trampling by animals/stop animals eating them; Using land to graze goats will provide manure/provide milk and meat/vary the diet of the farmer/increase food supplies, etc. 3 @ 1 mark 3
Mark scheme, page 22
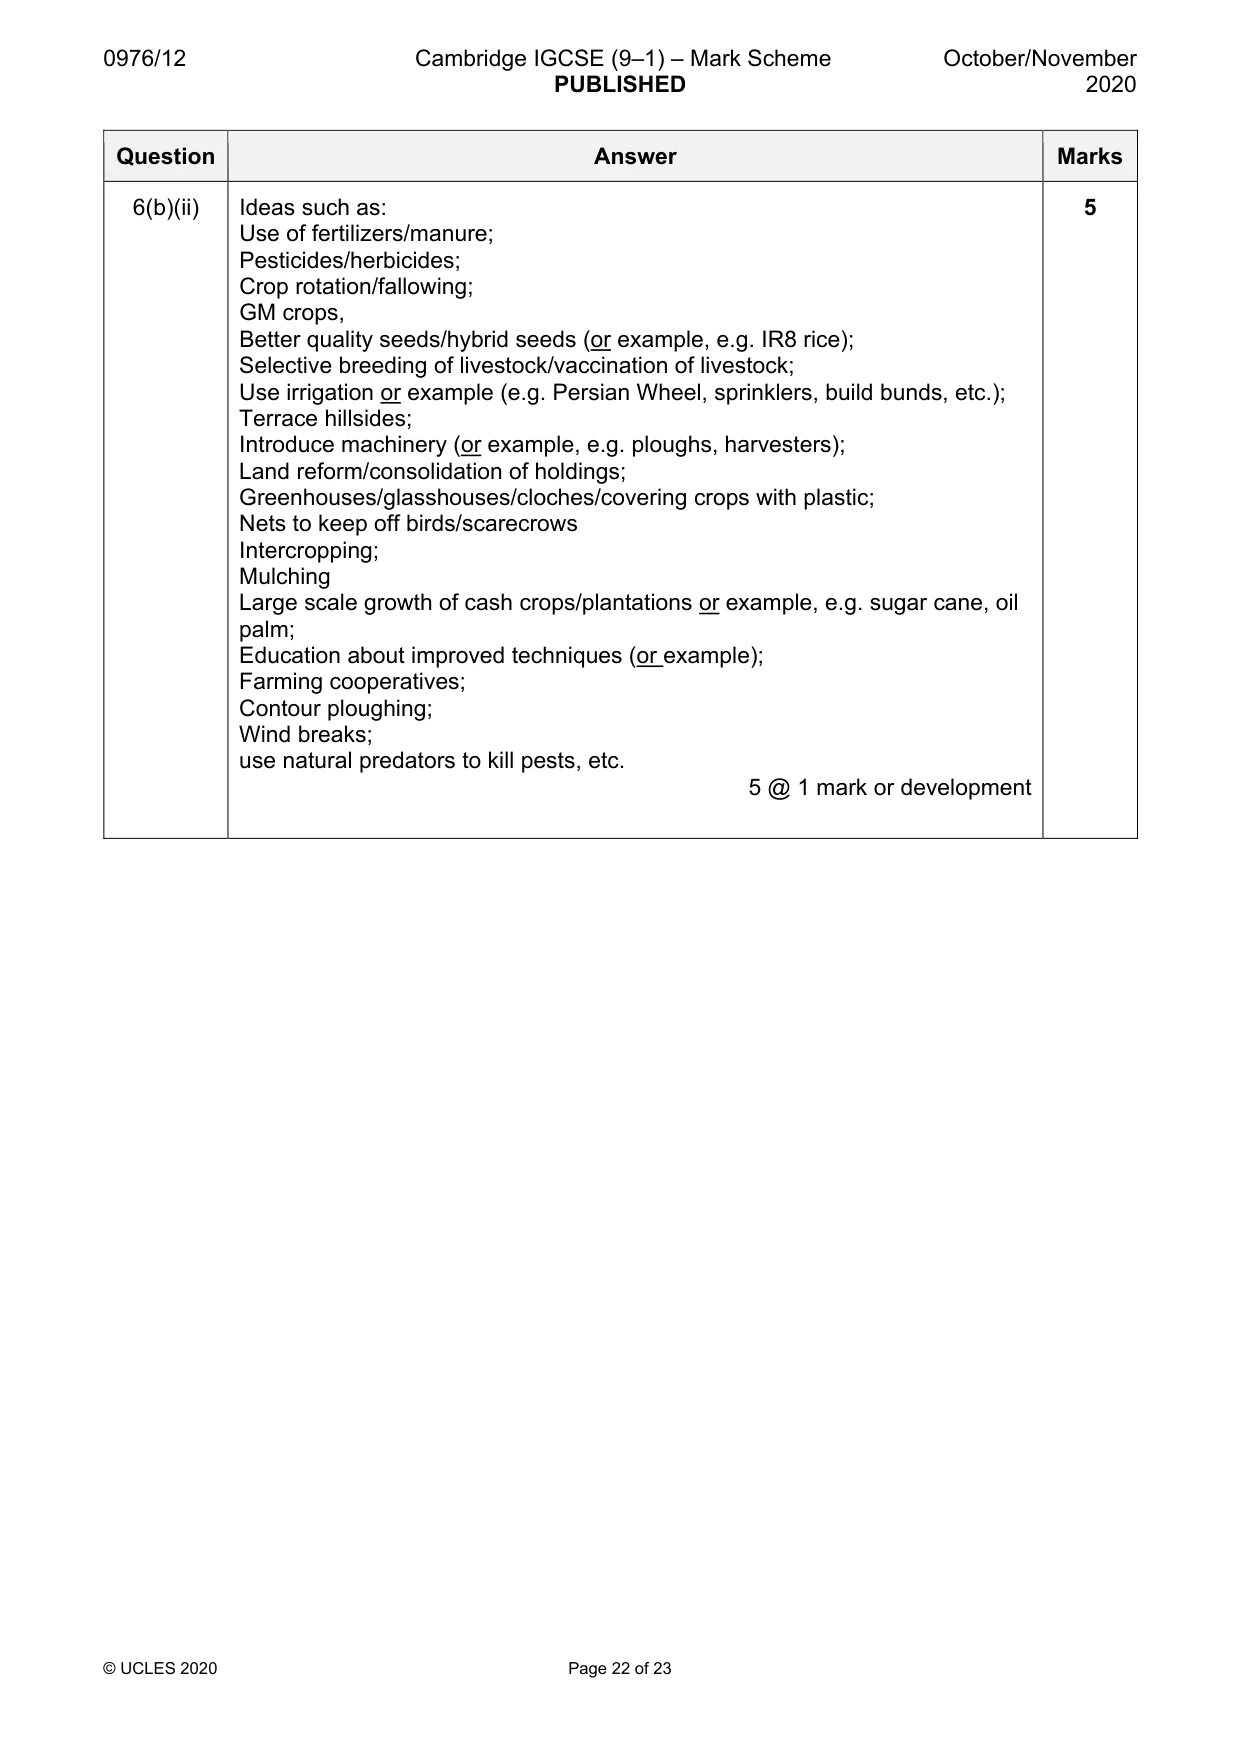
0976/12 Cambridge IGCSE (9–1) – Mark Scheme PUBLISHED October/November 2020 © UCLES 2020 Page 22 of 23 Question Answer Marks 6(b)(ii) Ideas such as: Use of fertilizers/manure; Pesticides/herbicides; Crop rotation/fallowing; GM crops, Better quality seeds/hybrid seeds (or example, e.g. IR8 rice); Selective breeding of livestock/vaccination of livestock; Use irrigation or example (e.g. Persian Wheel, sprinklers, build bunds, etc.); Terrace hillsides; Introduce machinery (or example, e.g. ploughs, harvesters); Land reform/consolidation of holdings; Greenhouses/glasshouses/cloches/covering crops with plastic; Nets to keep off birds/scarecrows Intercropping; Mulching Large scale growth of cash crops/plantations or example, e.g. sugar cane, oil palm; Education about improved techniques (or example); Farming cooperatives; Contour ploughing; Wind breaks; use natural predators to kill pests, etc. 5 @ 1 mark or development 5
Mark scheme, page 23
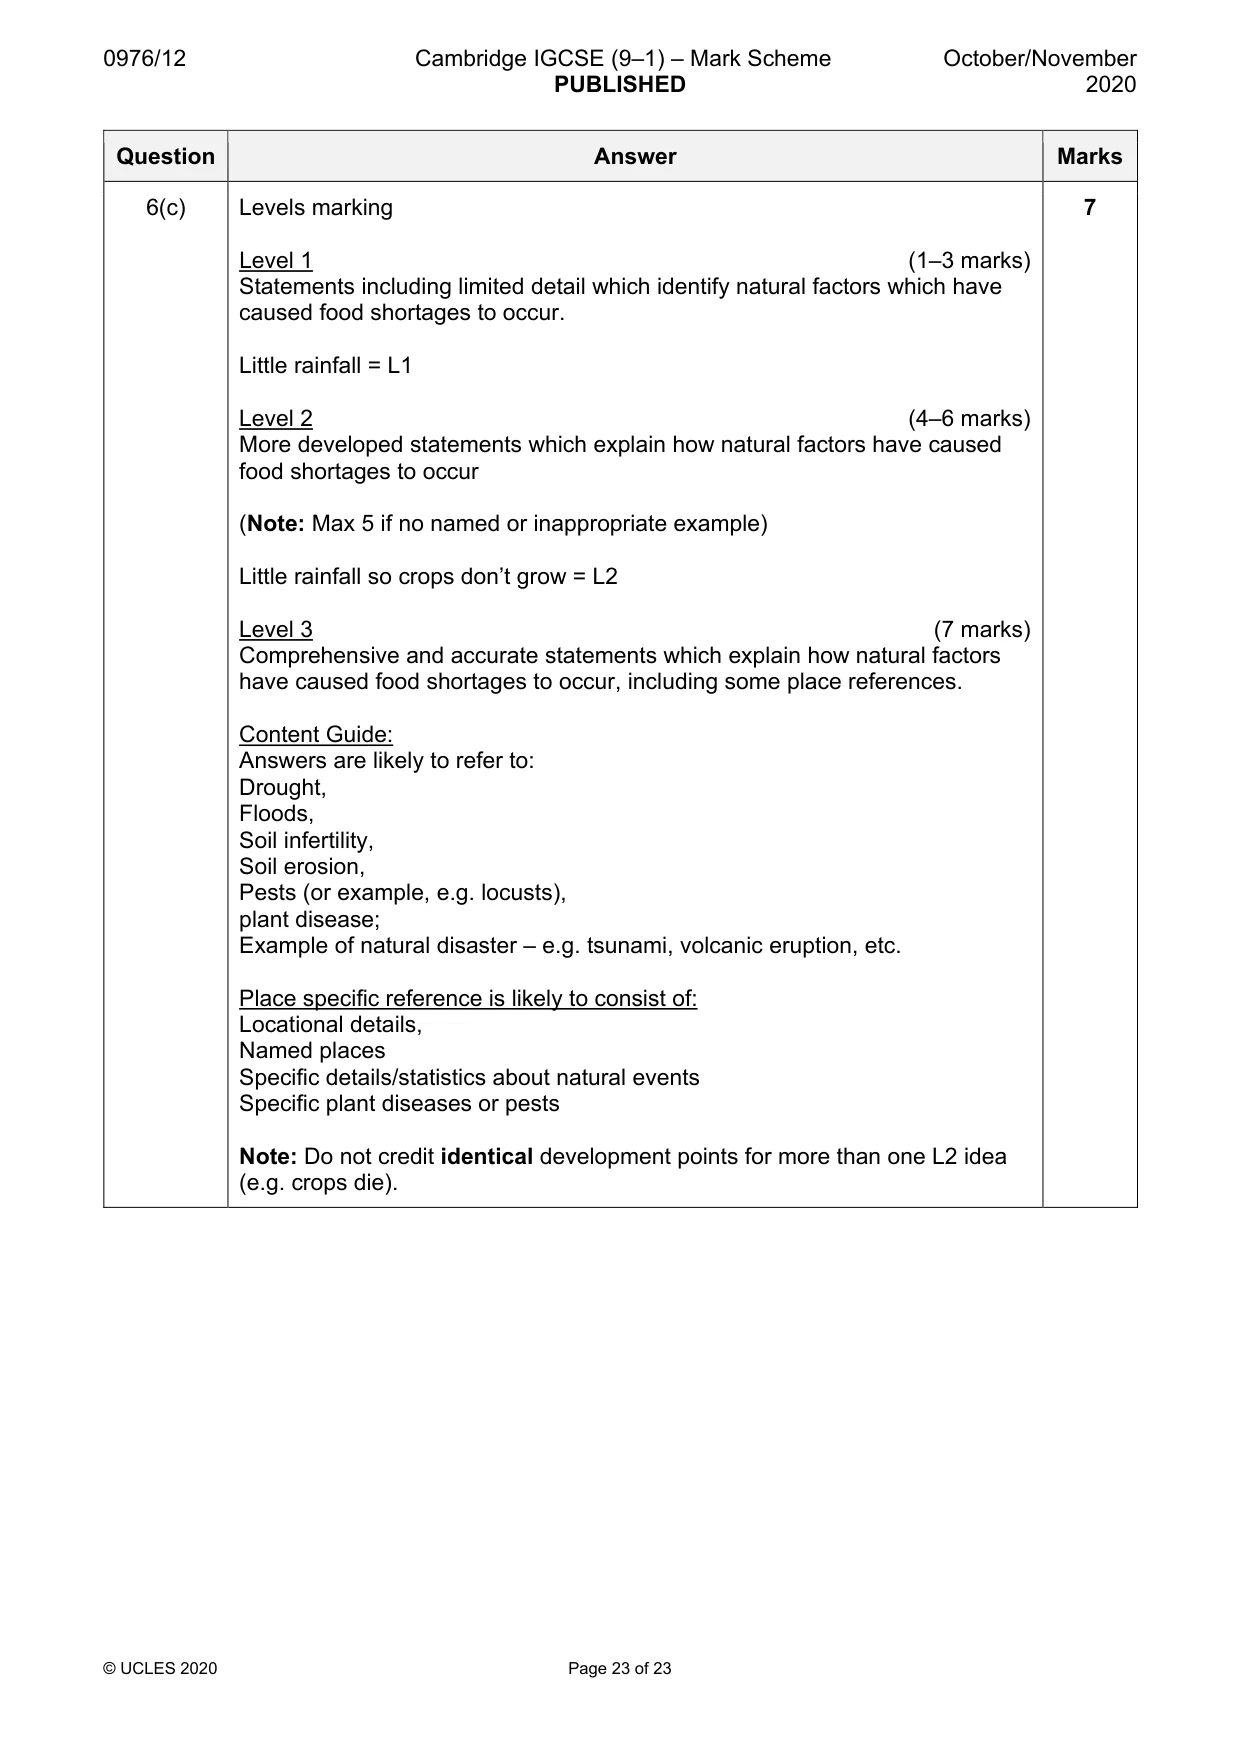
0976/12 Cambridge IGCSE (9–1) – Mark Scheme PUBLISHED October/November 2020 © UCLES 2020 Page 23 of 23 Question Answer Marks 6(c) Levels marking Level 1 (1–3 marks) Statements including limited detail which identify natural factors which have caused food shortages to occur. Little rainfall = L1 Level 2 (4–6 marks) More developed statements which explain how natural factors have caused food shortages to occur (Note: Max 5 if no named or inappropriate example) Little rainfall so crops don’t grow = L2 Level 3 (7 marks) Comprehensive and accurate statements which explain how natural factors have caused food shortages to occur, including some place references. Content Guide: Answers are likely to refer to: Drought, Floods, Soil infertility, Soil erosion, Pests (or example, e.g. locusts), plant disease; Example of natural disaster – e.g. tsunami, volcanic eruption, etc. Place specific reference is likely to consist of: Locational details, Named places Specific details/statistics about natural events Specific plant diseases or pests Note: Do not credit identical development points for more than one L2 idea (e.g. crops die). 7
What you needed in this session
Cambridge’s own grade thresholds for 2020 Oct/Nov, Paper 1 · Variant 2. A higher threshold means an easier paper — the bar moves with how the cohort did.