Cambridge IGCSE Geography 0460 — 2018 Oct/Nov Paper 1 · Variant 3
0460/13/O/N/18 · 75 marks · ≈84 min
The question paper and its mark scheme, free to read here and free to download. This is Cambridge’s own paper, exactly as it was sat.
Question paper28 pages



Mark scheme16 pages
Answers below. Sit the paper first if you are practising.
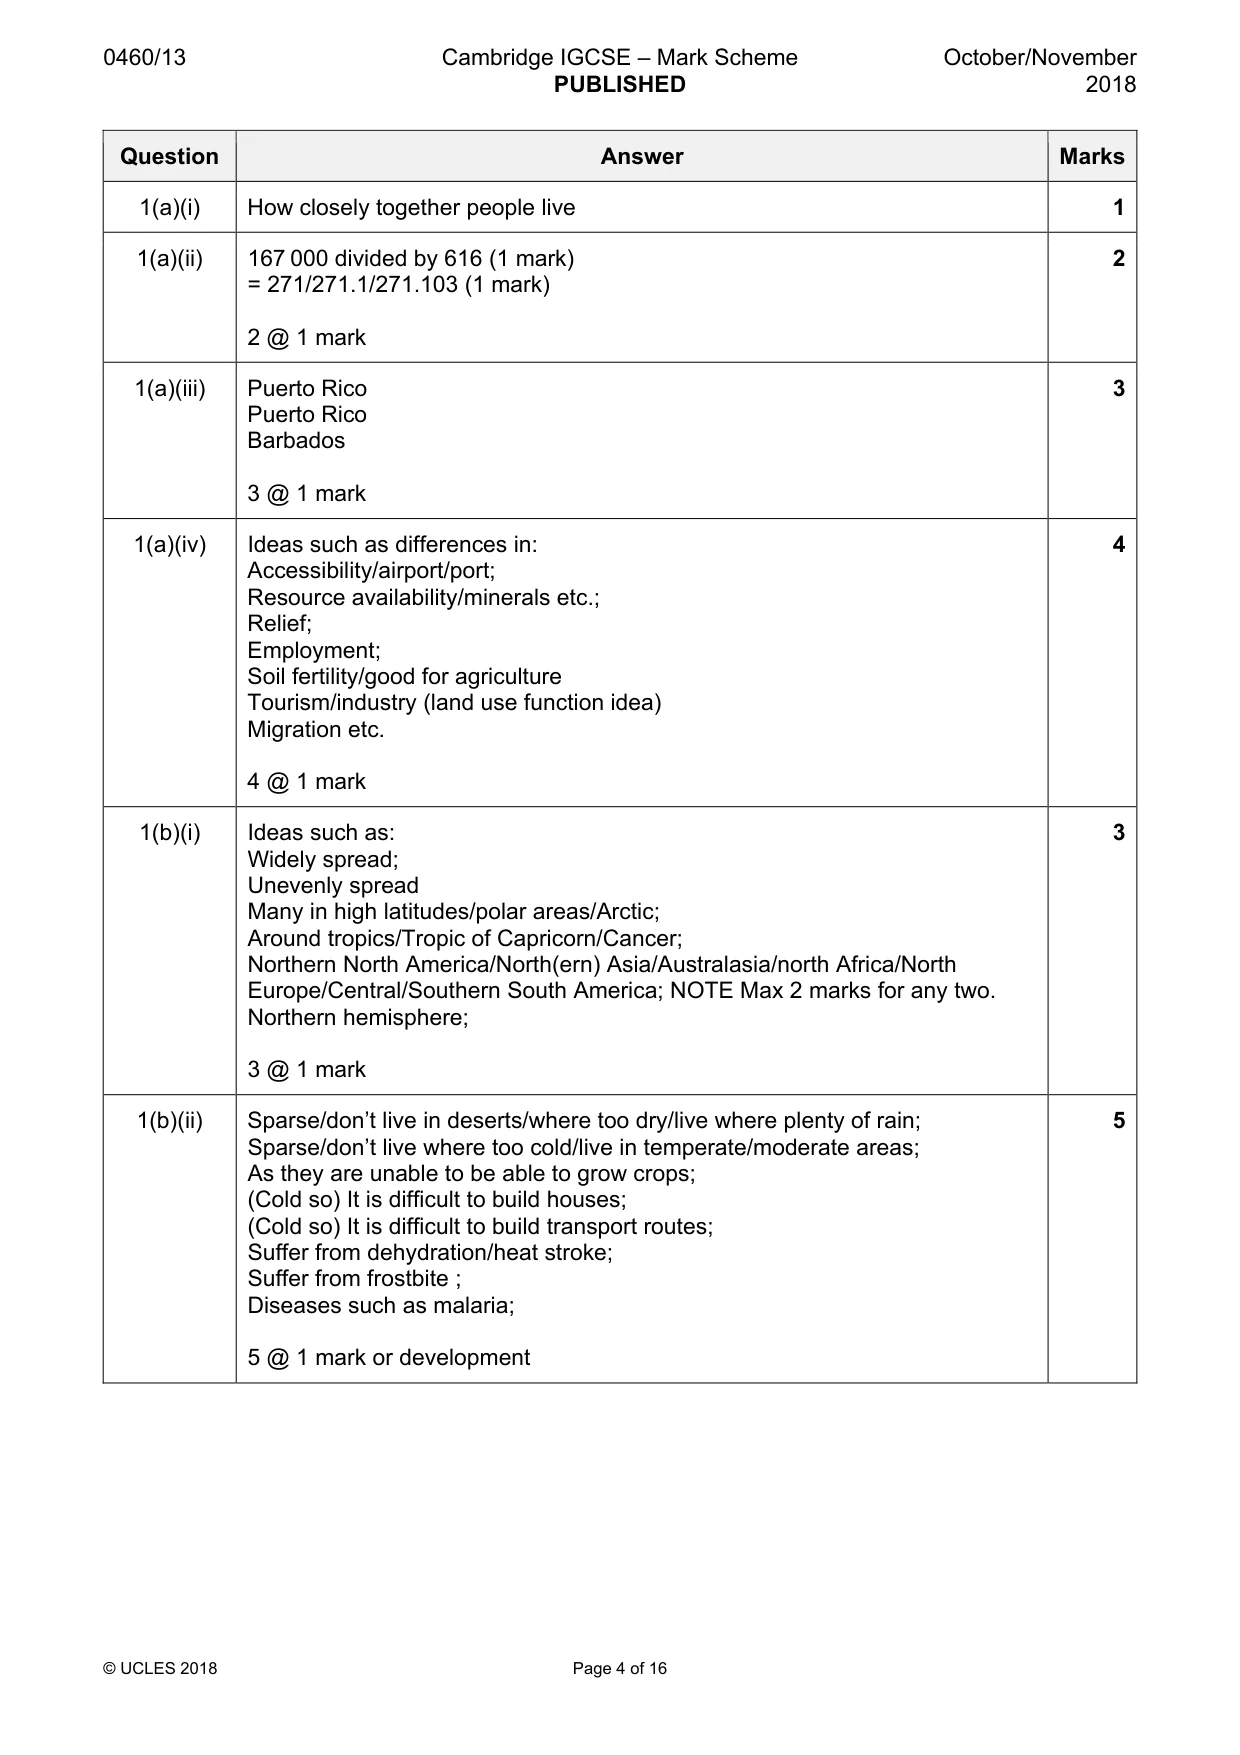
Paper as text
Question paper, page 1
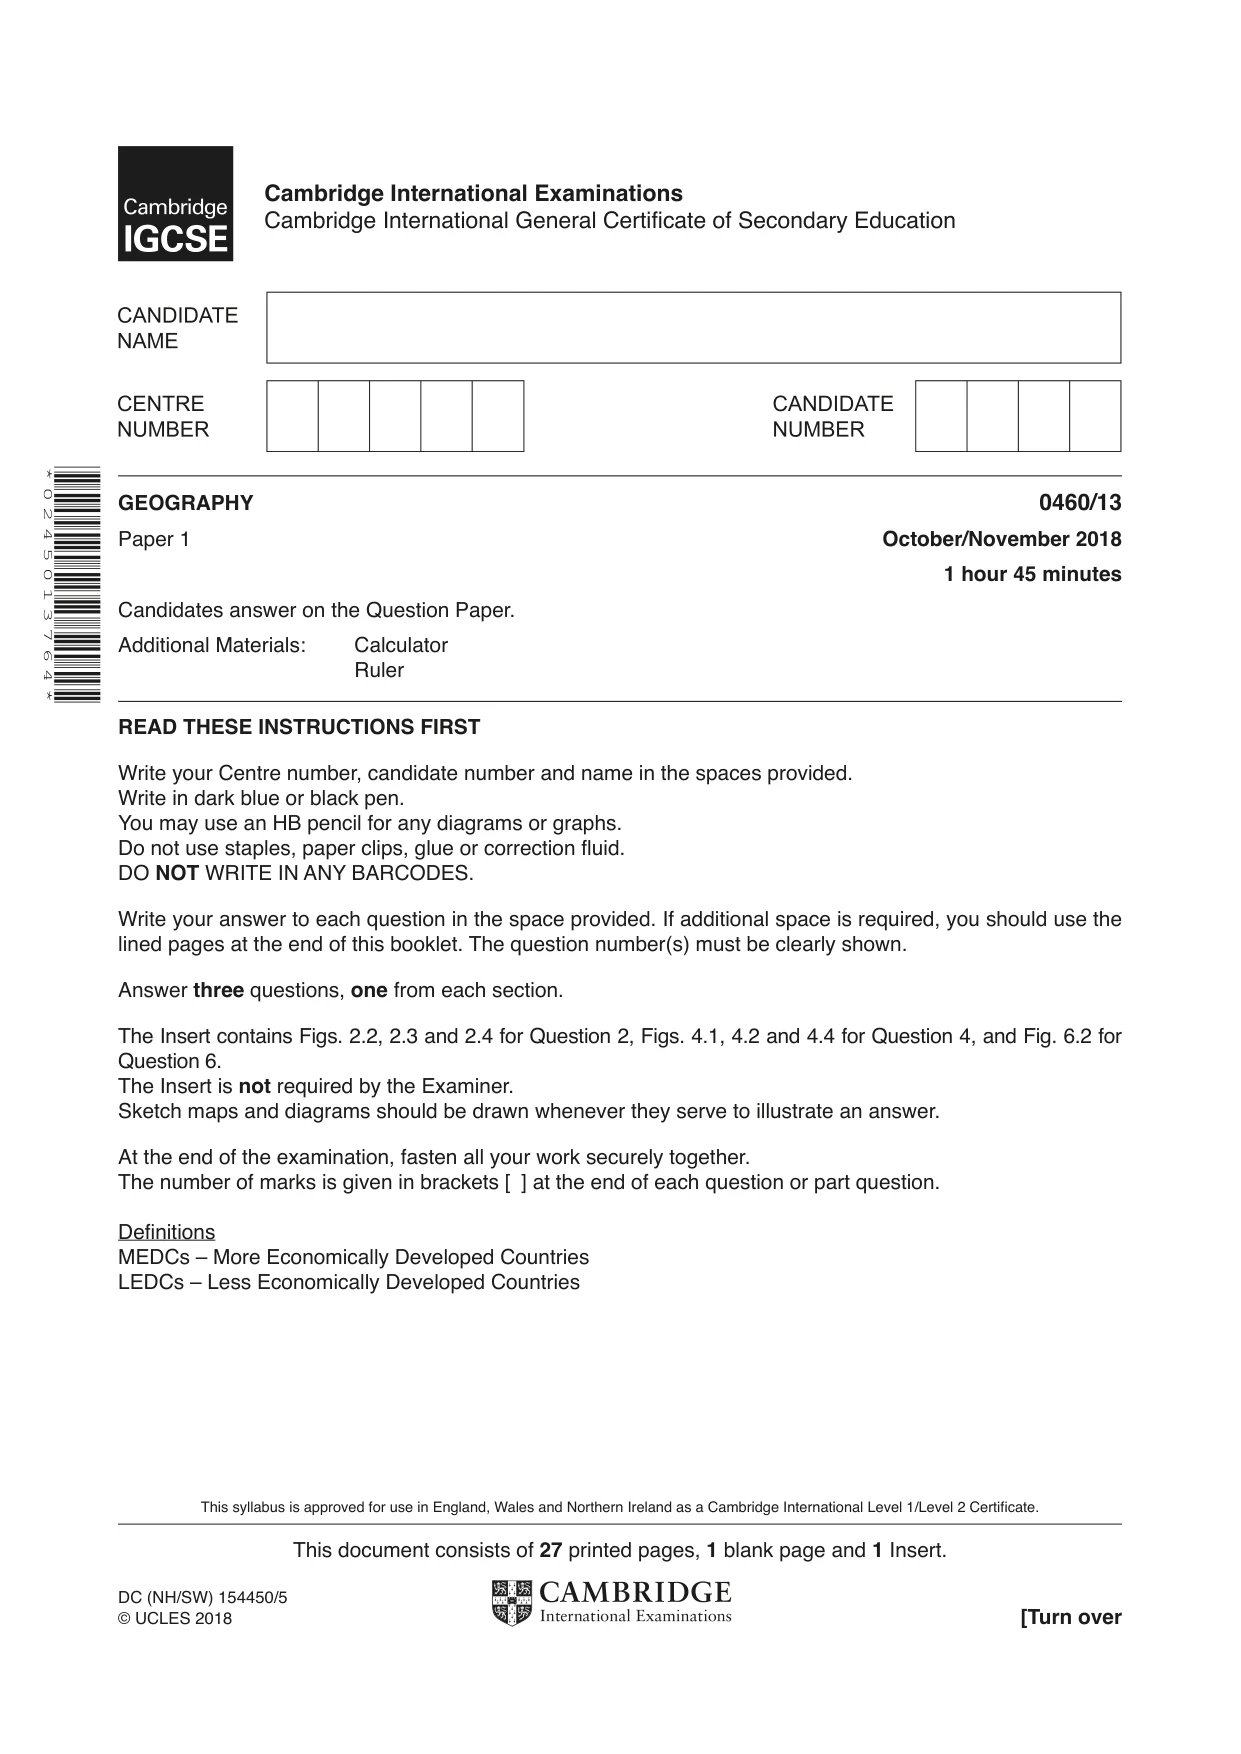
This document consists of 27 printed pages, 1 blank page and 1 Insert. DC (NH/SW) 154450/5 © UCLES 2018 [Turn over * 0 2 4 5 0 1 3 7 6 4 * GEOGRAPHY 0460/13 Paper 1 October/November 2018 1 hour 45 minutes Candidates answer on the Question Paper. Additional Materials: Calculator Ruler READ THESE INSTRUCTIONS FIRST Write your Centre number, candidate number and name in the spaces provided. Write in dark blue or black pen. You may use an HB pencil for any diagrams or graphs. Do not use staples, paper clips, glue or correction fluid. DO NOT WRITE IN ANY BARCODES. Write your answer to each question in the space provided. If additional space is required, you should use the lined pages at the end of this booklet. The question number(s) must be clearly shown. Answer three questions, one from each section. The Insert contains Figs. 2.2, 2.3 and 2.4 for Question 2, Figs. 4.1, 4.2 and 4.4 for Question 4, and Fig. 6.2 for Question 6. The Insert is not required by the Examiner. Sketch maps and diagrams should be drawn whenever they serve to illustrate an answer. At the end of the examination, fasten all your work securely together. The number of marks is given in brackets [ ] at the end of each question or part question. Definitions MEDCs – More Economically Developed Countries LEDCs – Less Economically Developed Countries This syllabus is approved for use in England, Wales and Northern Ireland as a Cambridge International Level 1/Level 2 Certificate. Cambridge International Examinations Cambridge International General Certificate of Secondary Education
Question paper, page 2
2 0460/13/O/N/18 © UCLES 2018 Section A Answer one question from this section. 1 (a) Study Fig. 1.1, which shows information about the population in the Lesser Antilles, a group of islands in the Caribbean. Barbados Trinidad & Tobago 25 000 0 100 km 200 1 000 000 2 500 250 000 2 500 000 Number of inhabitants St.Vincent & the Grenadines St.Lucia Dominica Montserrat Martinique Guadeloupe Antigua & Barbuda Atlantic Ocean Caribbean Sea Lesser Antilles St. Kitts & Nevis Puerto Rico Virgin Islands Anguilla St. Maarten Saba St. Eustatius (US) (GB) St. Martin St. Barthélemy Grenada 1 – 30 31 – 100 101 – 150 151 – 200 201 – 250 Population density per km2 Key 251 – 300 301 – 400 401 – 500 501 + N Fig. 1.1
Question paper, page 3
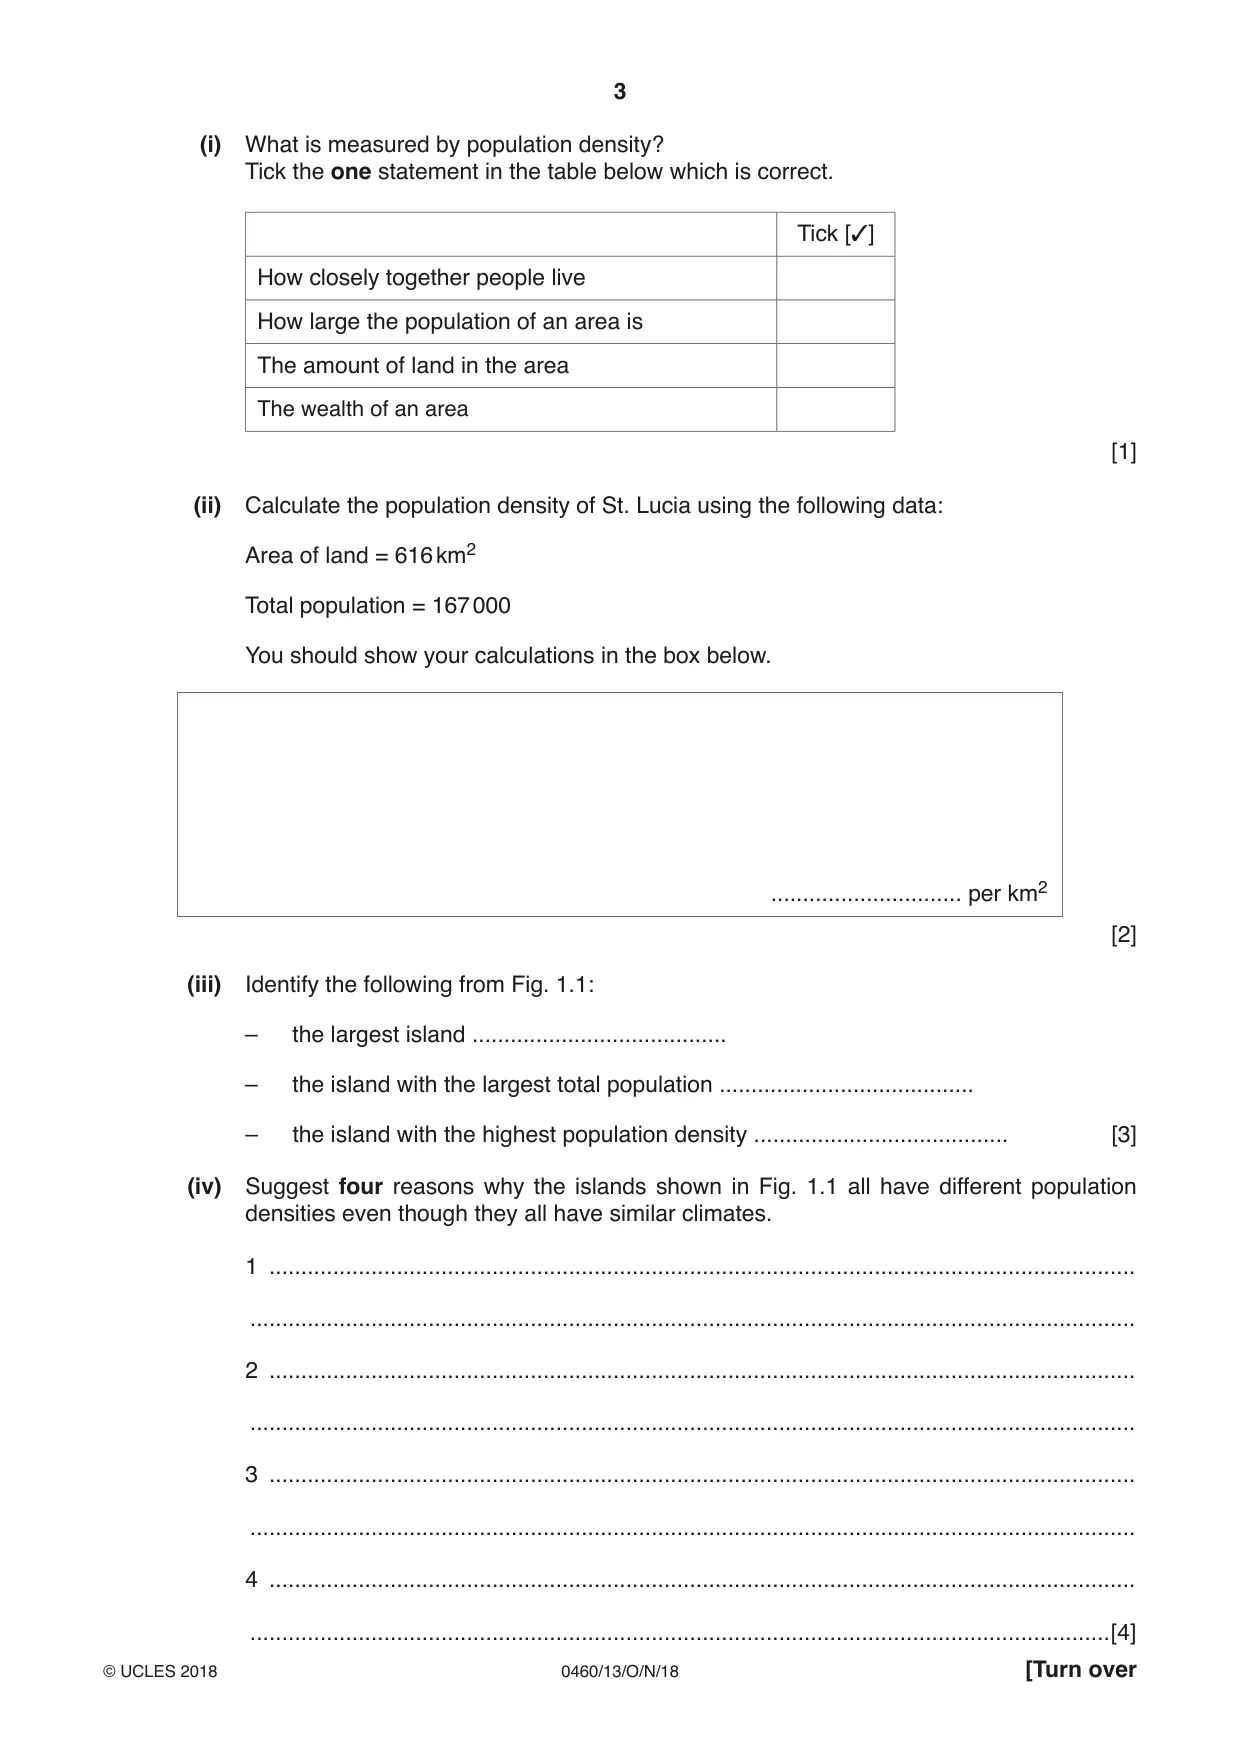
3 0460/13/O/N/18 © UCLES 2018 [Turn over (i) What is measured by population density? Tick the one statement in the table below which is correct. Tick [3] How closely together people live How large the population of an area is The amount of land in the area The wealth of an area [1] (ii) Calculate the population density of St. Lucia using the following data: Area of land = 616 km2 Total population = 167 000 You should show your calculations in the box below. … per km2 [2] (iii) Identify the following from Fig. 1.1: – the largest island … – the island with the largest total population … – the island with the highest population density … [3] (iv) Suggest four reasons why the islands shown in Fig. 1.1 all have different population densities even though they all have similar climates. 1 … … 2 … … 3 … … 4 … …[4]
Question paper, page 4
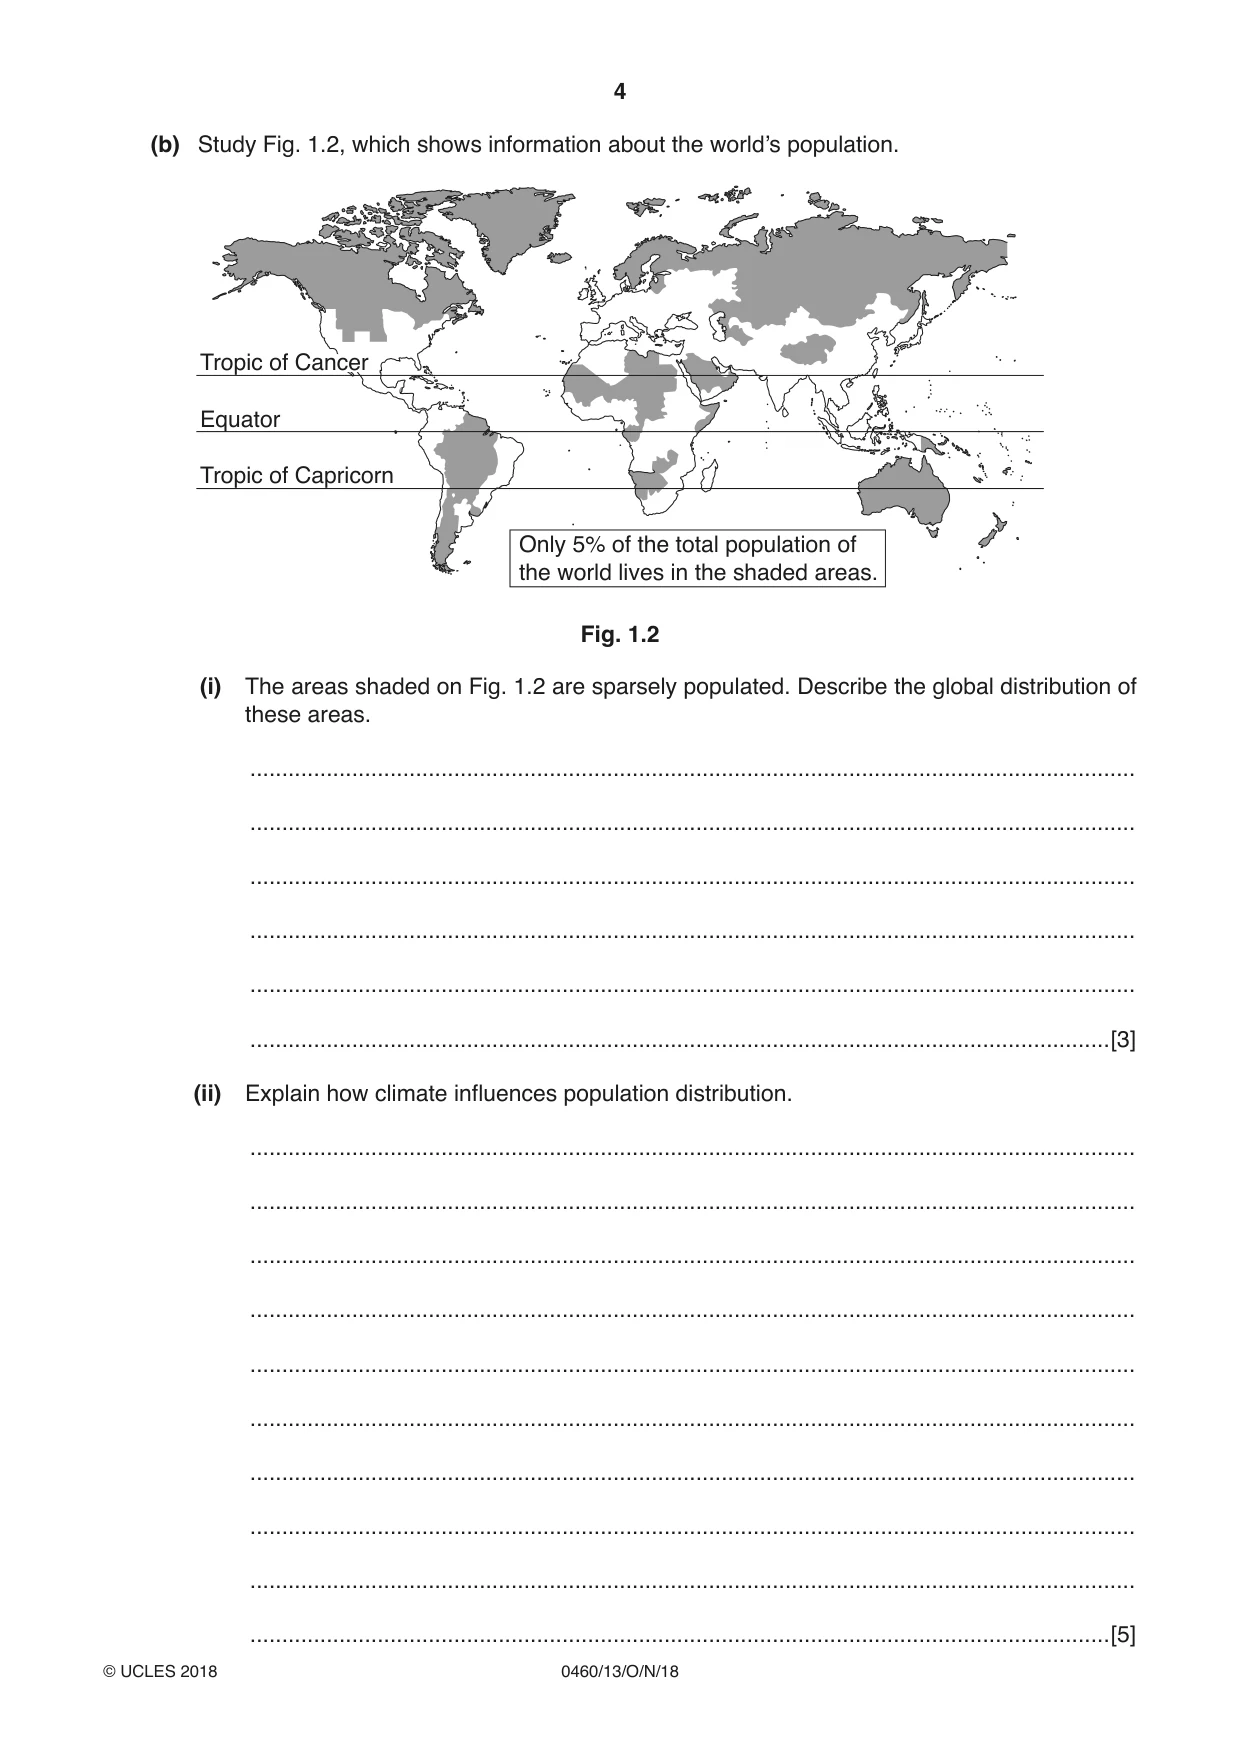
4 0460/13/O/N/18 © UCLES 2018 (b) Study Fig. 1.2, which shows information about the world’s population. Only 5% of the total population of the world lives in the shaded areas. Equator Tropic of Capricorn Tropic of Cancer Fig. 1.2 (i) The areas shaded on Fig. 1.2 are sparsely populated. Describe the global distribution of these areas. … … … … … …[3] (ii) Explain how climate influences population distribution. … … … … … … … … … …[5]
Question paper, page 5
5 0460/13/O/N/18 © UCLES 2018 [Turn over (c) For a named country you have studied, explain why it has a high natural population growth rate. Name of country … … … … … … … … … … … … … … … … … … … … … … … … …[7] [Total: 25]
Question paper, page 6
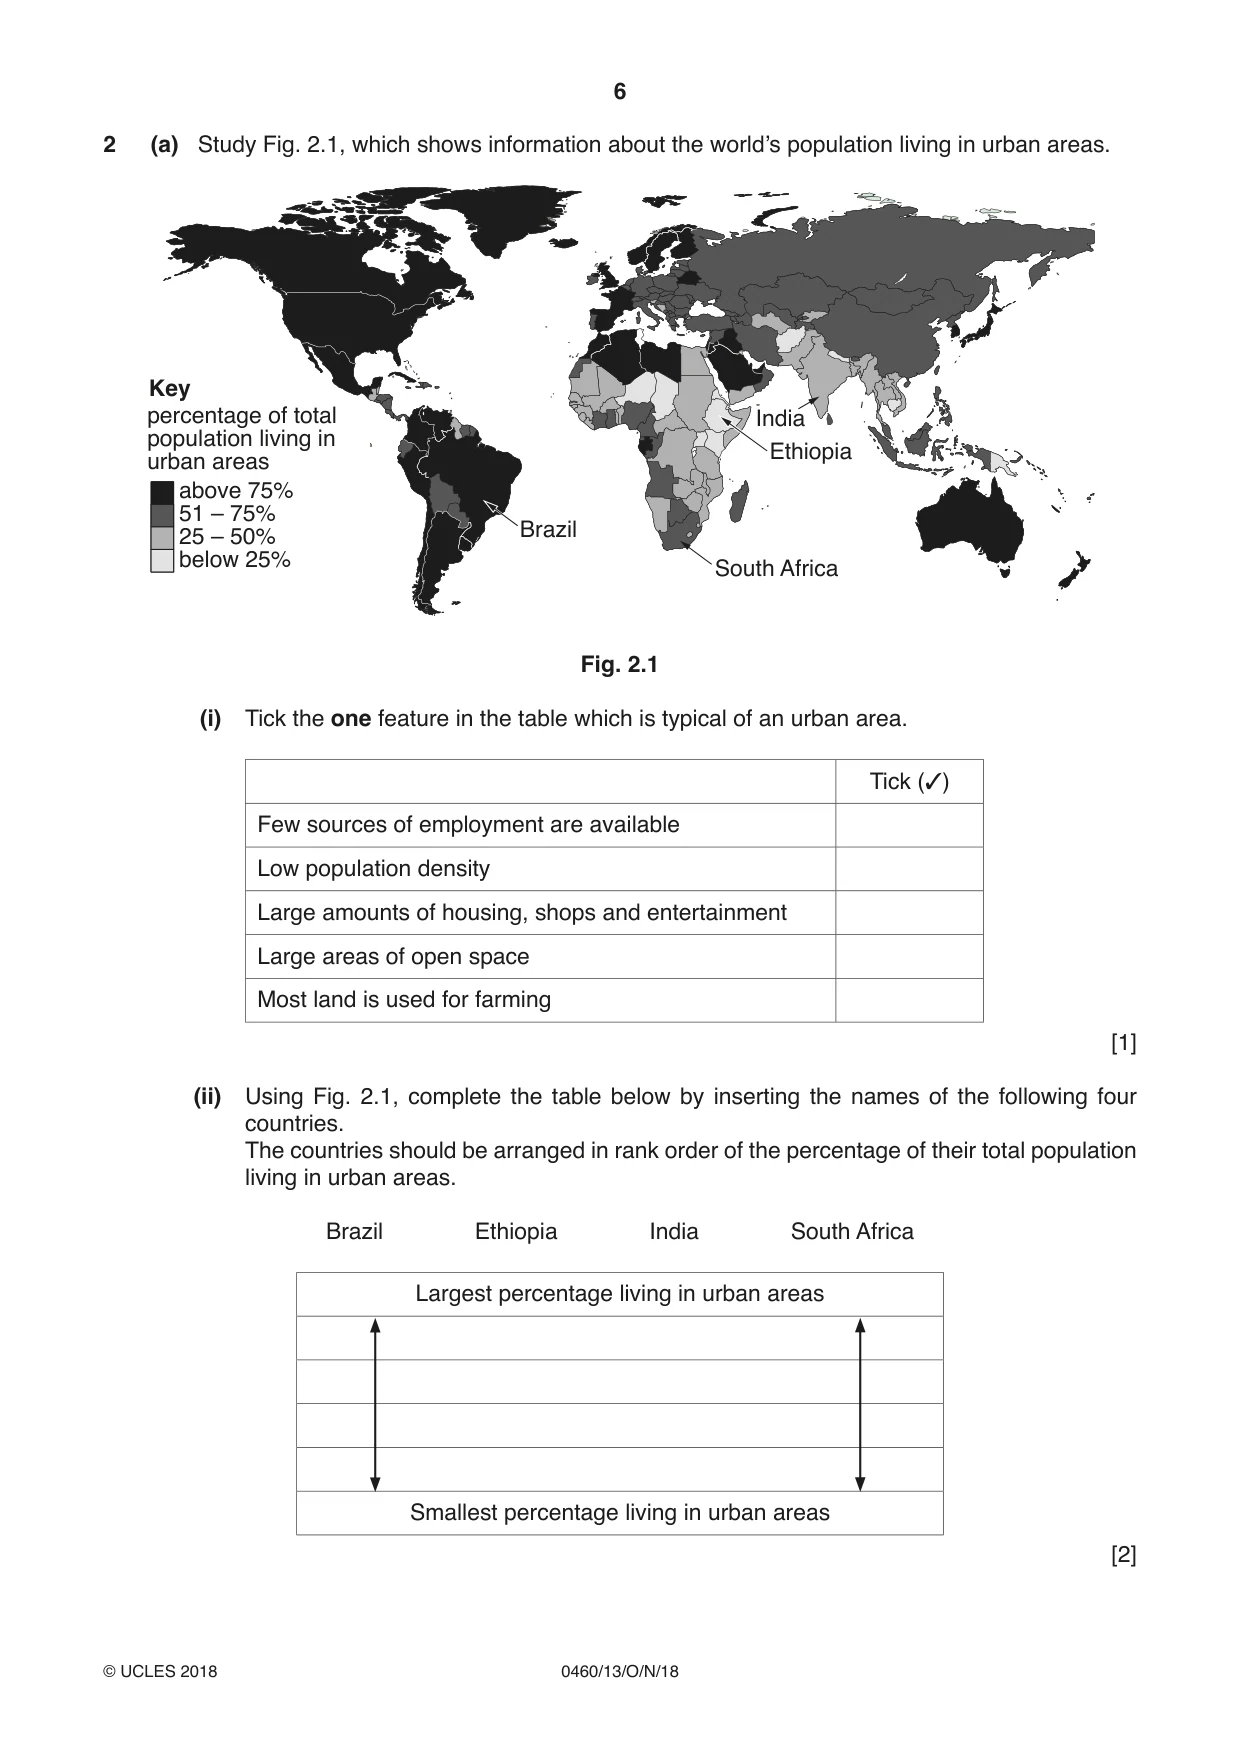
6 0460/13/O/N/18 © UCLES 2018 2 (a) Study Fig. 2.1, which shows information about the world’s population living in urban areas. above 75% 51 – 75% 25 – 50% below 25% percentage of total population living in urban areas Key Ethiopia India Brazil South Africa Fig. 2.1 (i) Tick the one feature in the table which is typical of an urban area. Tick (3) Few sources of employment are available Low population density Large amounts of housing, shops and entertainment Large areas of open space Most land is used for farming [1] (ii) Using Fig. 2.1, complete the table below by inserting the names of the following four countries. The countries should be arranged in rank order of the percentage of their total population living in urban areas. Brazil Ethiopia India South Africa Largest percentage living in urban areas Smallest percentage living in urban areas [2]
Question paper, page 7
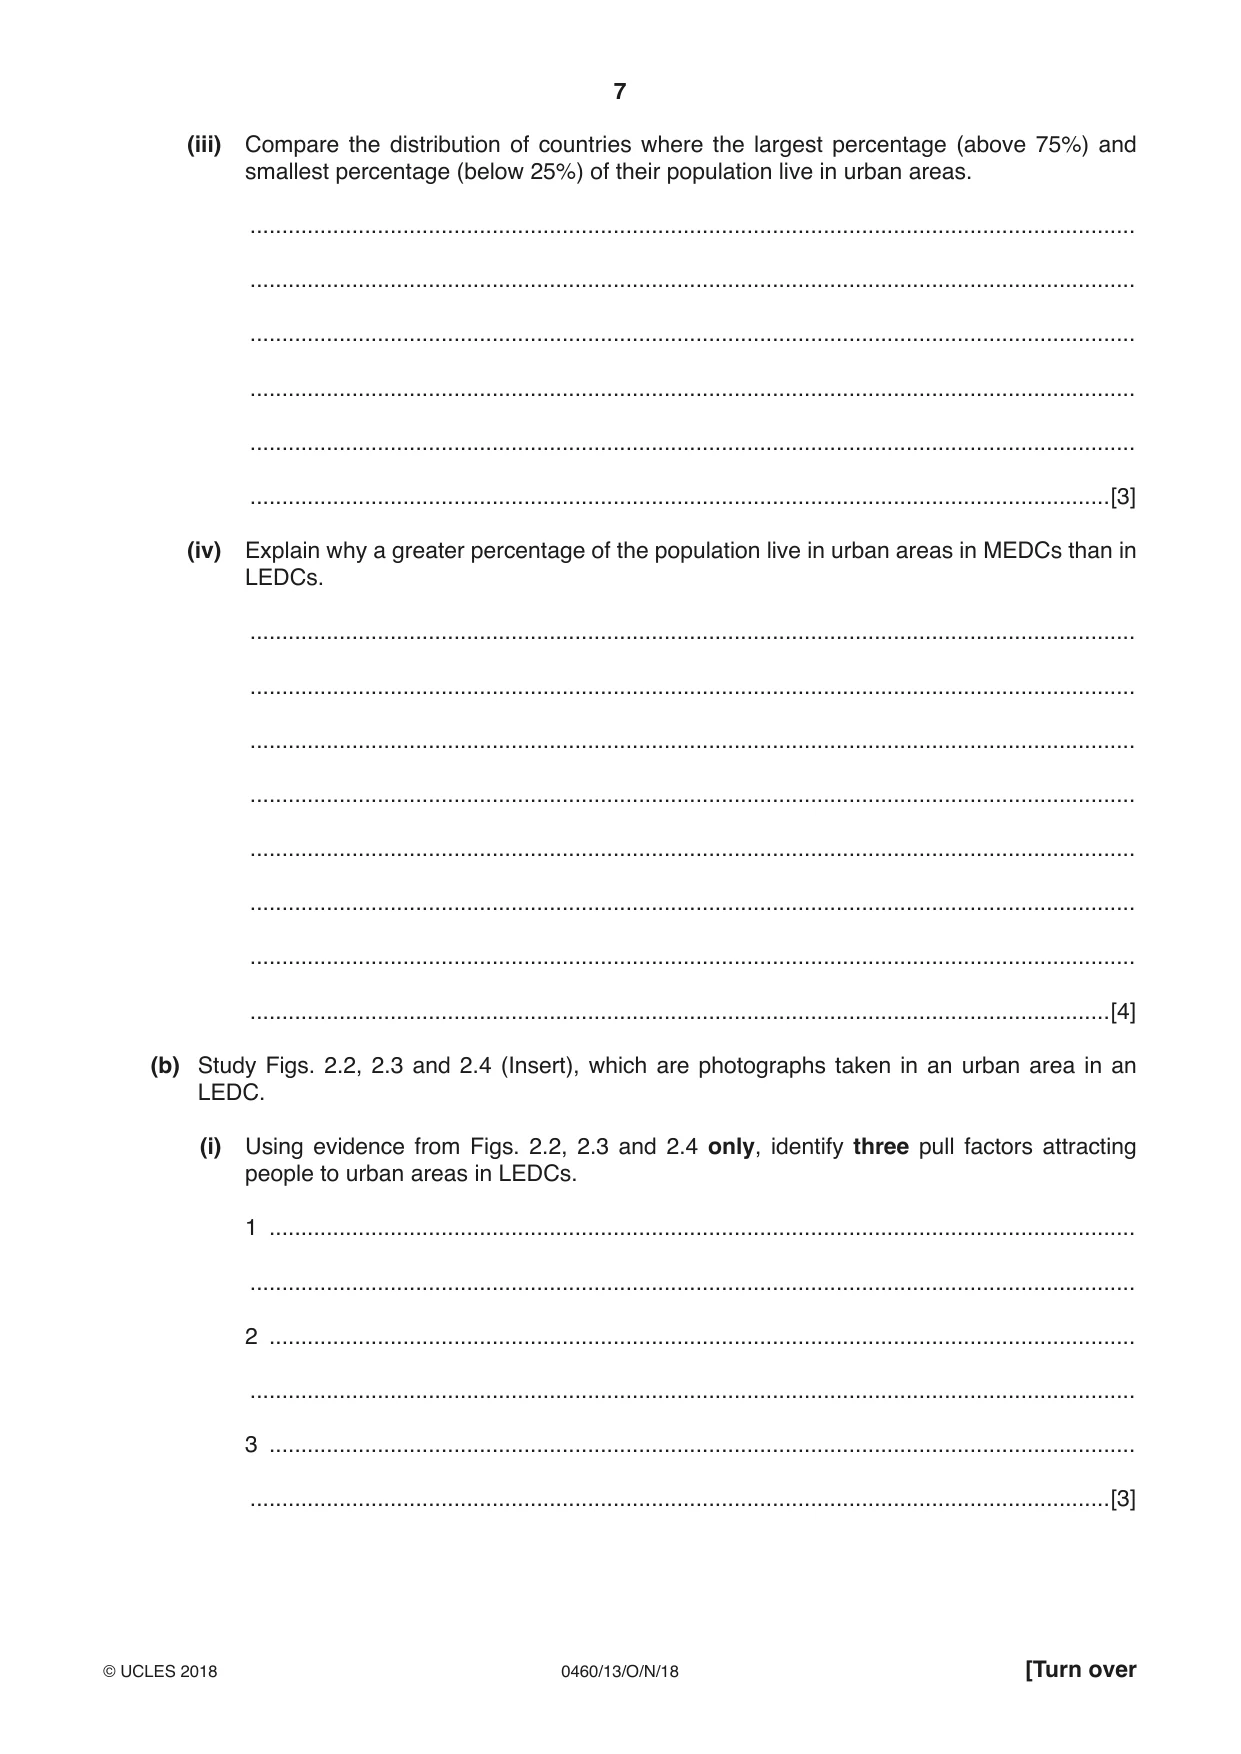
7 0460/13/O/N/18 © UCLES 2018 [Turn over (iii) Compare the distribution of countries where the largest percentage (above 75%) and smallest percentage (below 25%) of their population live in urban areas. … … … … … …[3] (iv) Explain why a greater percentage of the population live in urban areas in MEDCs than in LEDCs. … … … … … … … …[4] (b) Study Figs. 2.2, 2.3 and 2.4 (Insert), which are photographs taken in an urban area in an LEDC. (i) Using evidence from Figs. 2.2, 2.3 and 2.4 only, identify three pull factors attracting people to urban areas in LEDCs. 1 … … 2 … … 3 … …[3]
Question paper, page 8
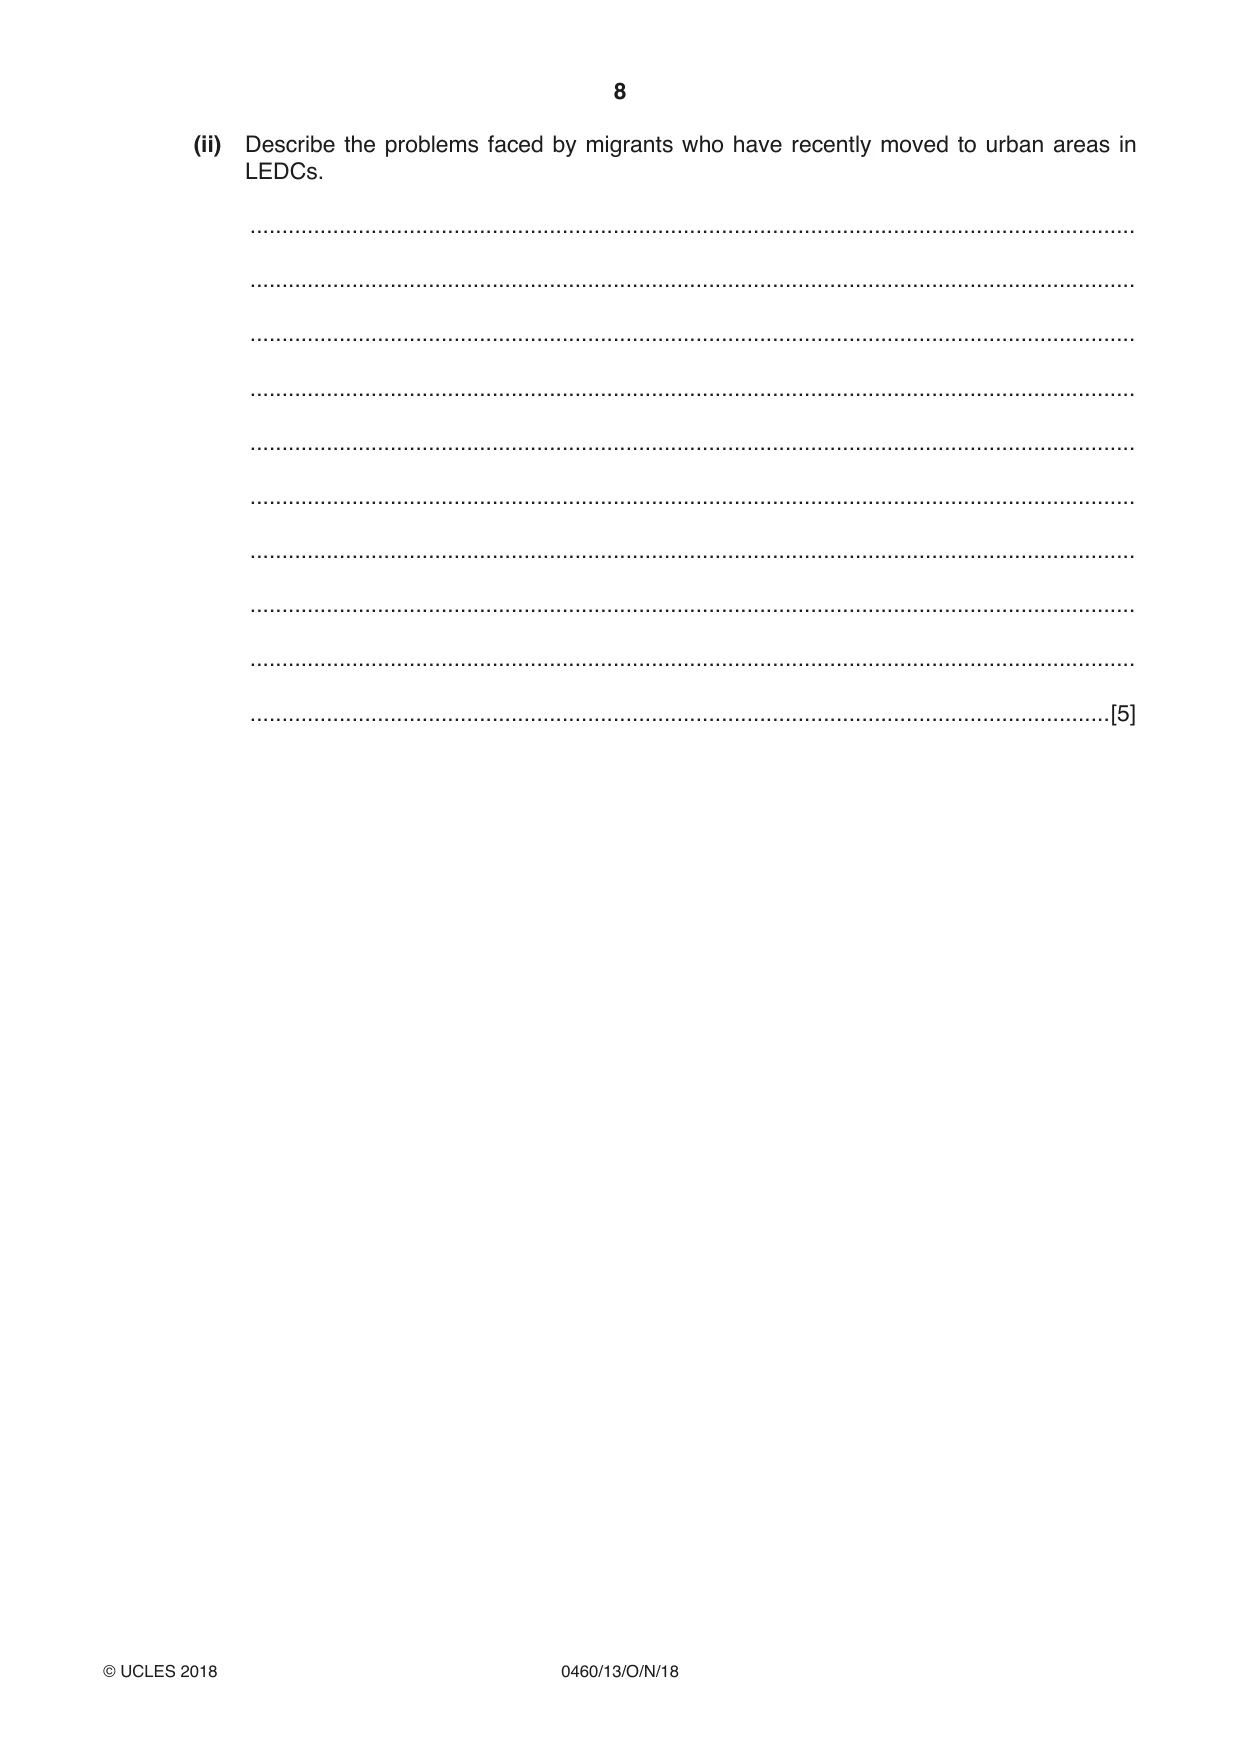
8 0460/13/O/N/18 © UCLES 2018 (ii) Describe the problems faced by migrants who have recently moved to urban areas in LEDCs. … … … … … … … … … …[5]
Question paper, page 9
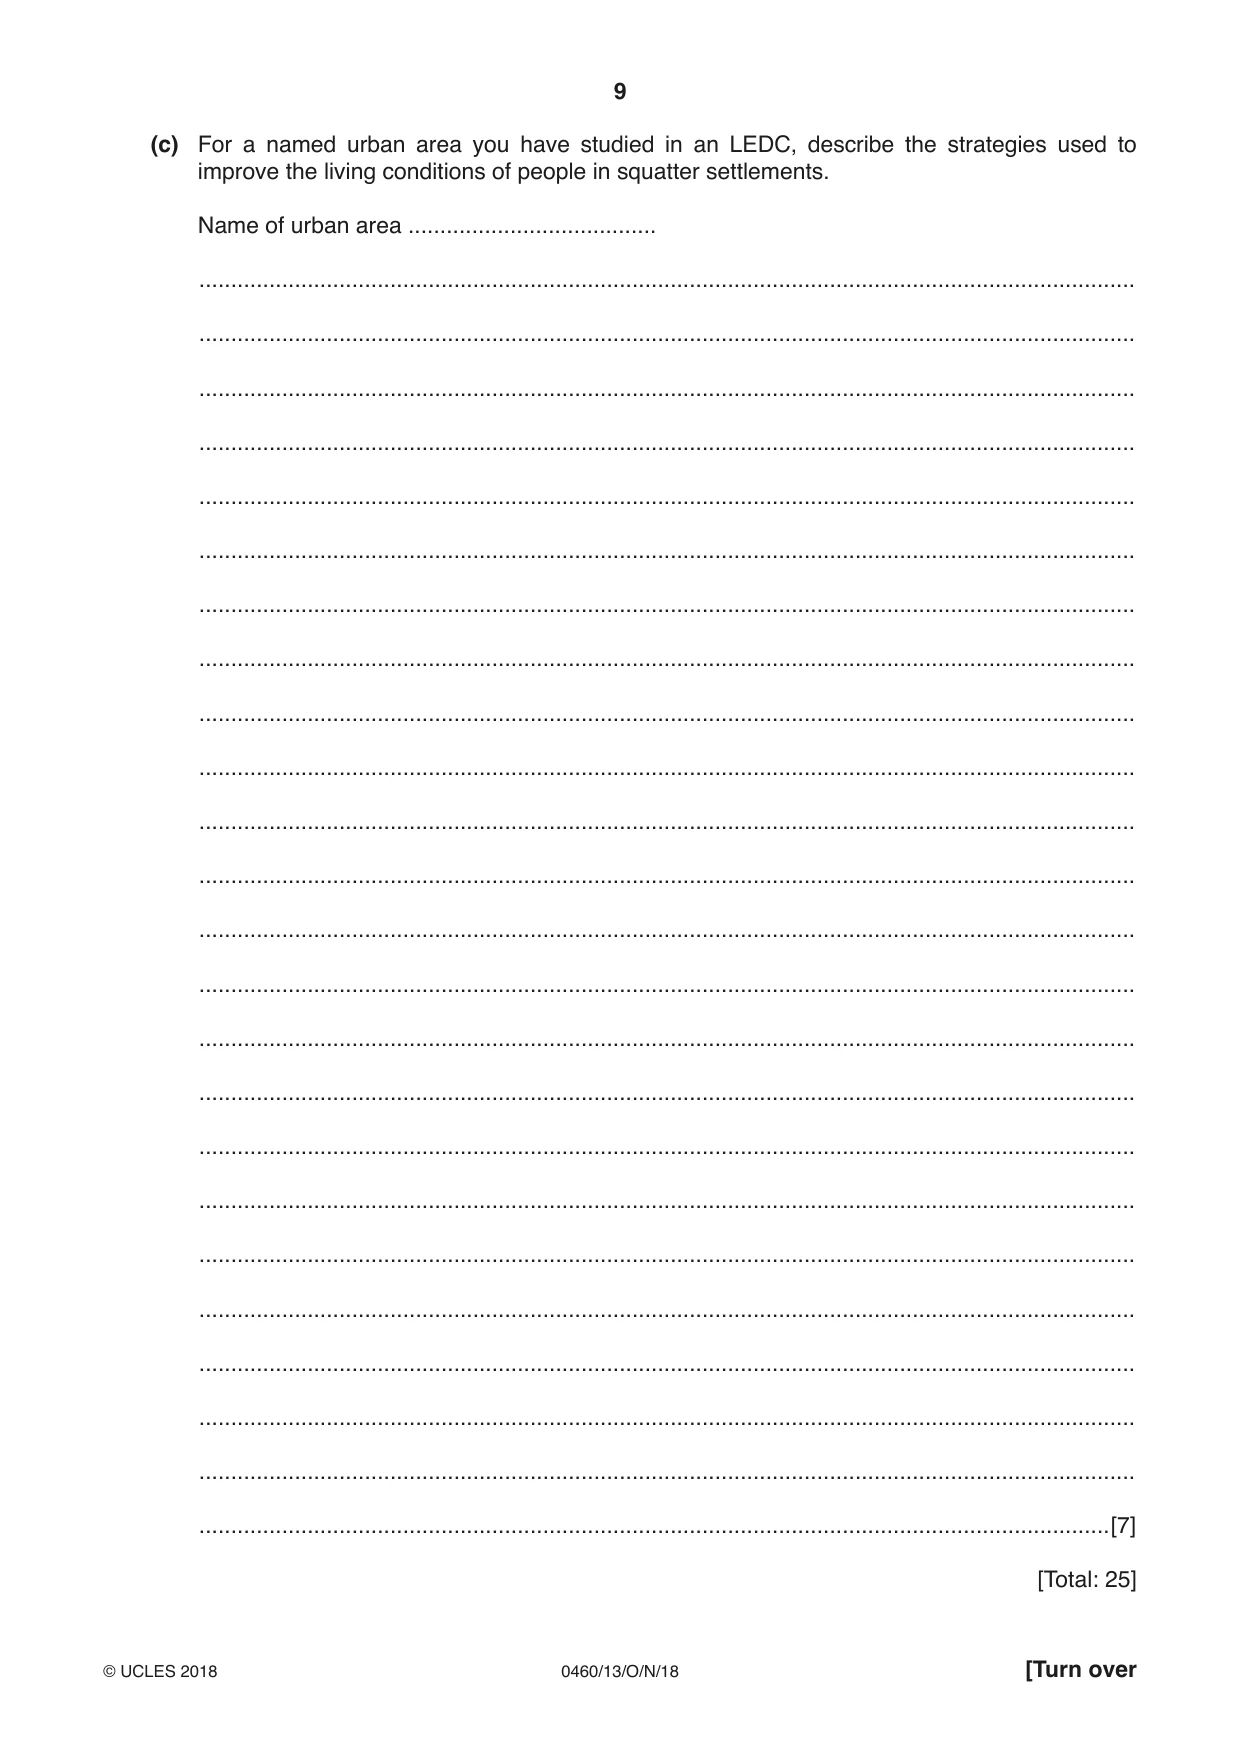
9 0460/13/O/N/18 © UCLES 2018 [Turn over (c) For a named urban area you have studied in an LEDC, describe the strategies used to improve the living conditions of people in squatter settlements. Name of urban area … … … … … … … … … … … … … … … … … … … … … … … … …[7] [Total: 25]
Question paper, page 10
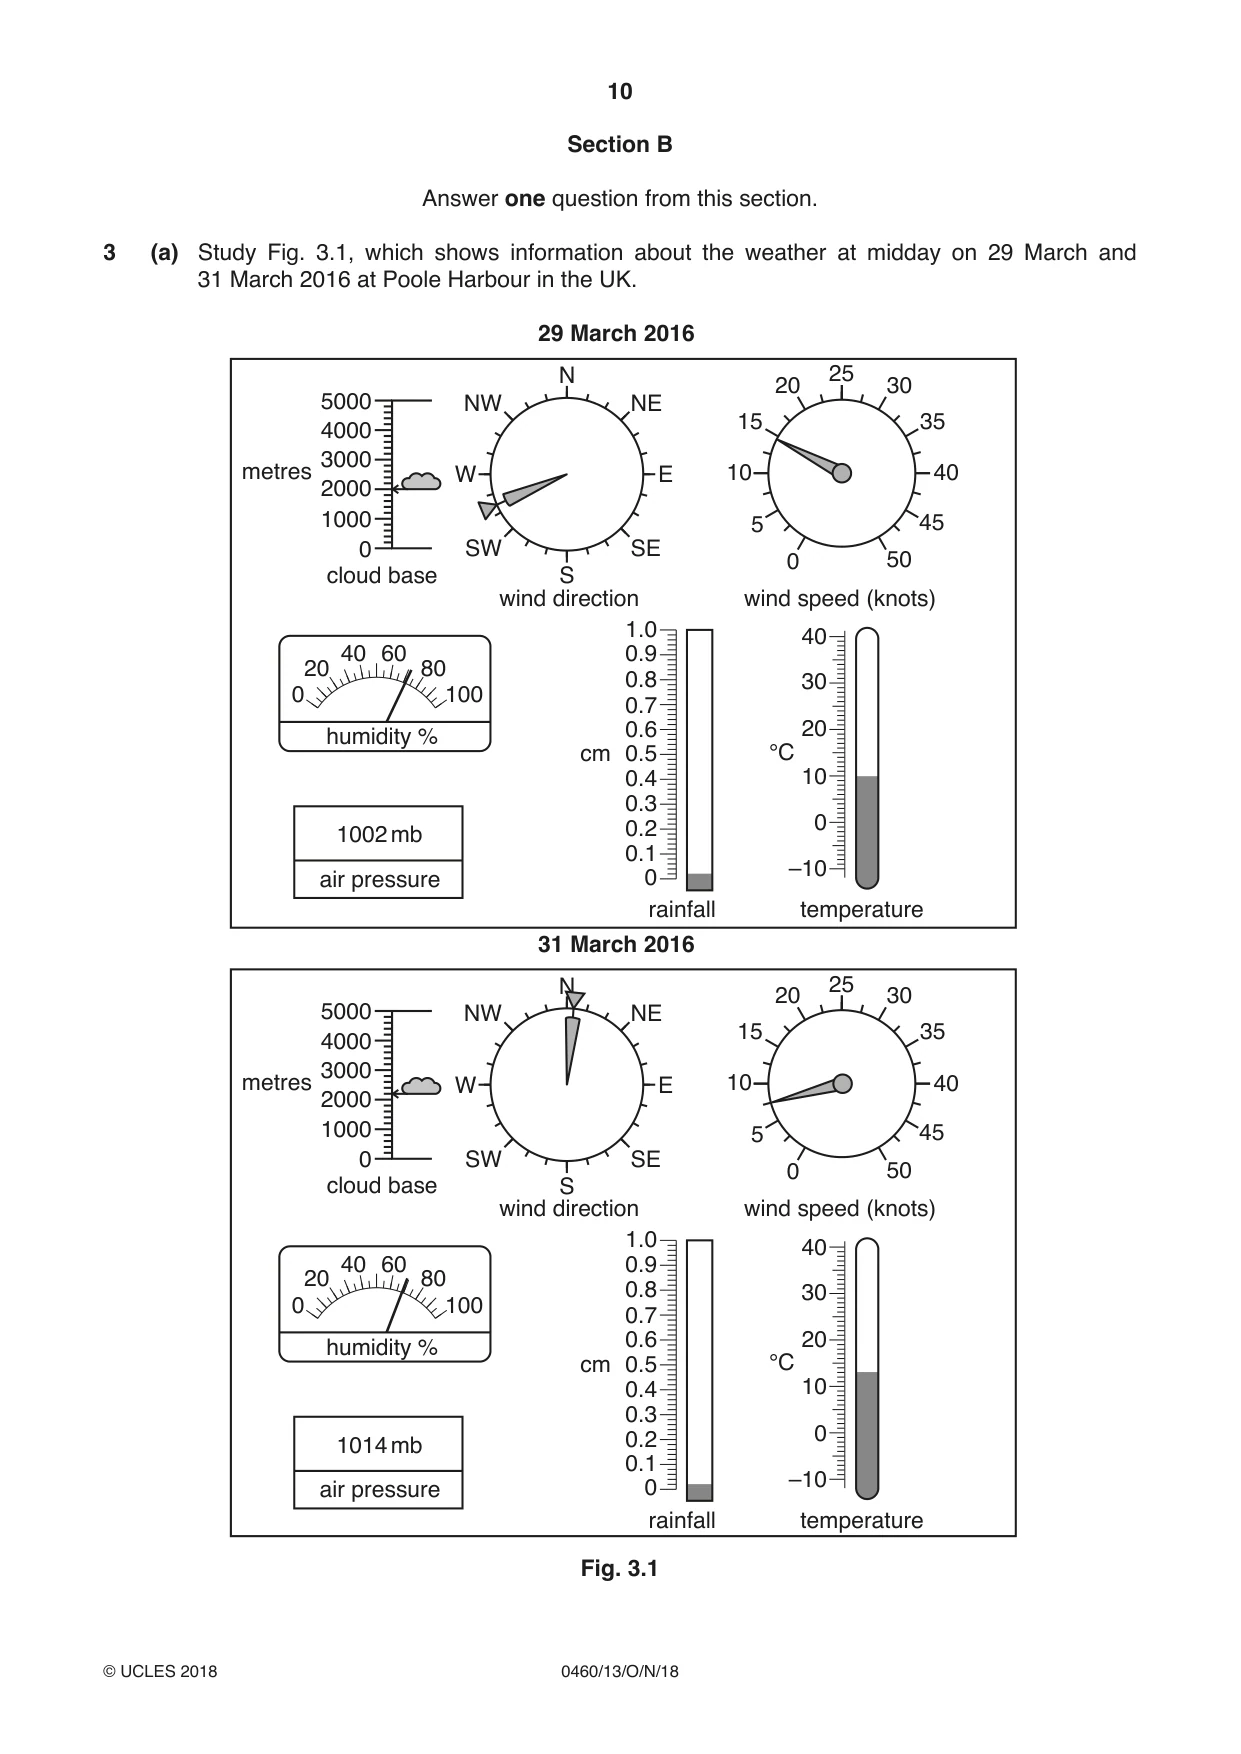
10 0460/13/O/N/18 © UCLES 2018 Section B Answer one question from this section. 3 (a) Study Fig. 3.1, which shows information about the weather at midday on 29 March and 31 March 2016 at Poole Harbour in the UK. 0 0 100 20 80 40 60 humidity % cloud base 1000 2000 metres 3000 4000 5000 NW N S SW NE 25 20 30 15 10 40 5 35 45 50 0 SE W E 1002 mb air pressure 29 March 2016 40 1.0 0.9 0.8 0.7 0.6 0.5 cm wind direction wind speed (knots) 0.4 0.3 0.2 0.1 0 rainfall temperature 30 20 °C 10 0 –10 0 0 100 20 80 40 60 humidity % cloud base 1000 2000 metres 3000 4000 5000 NW N S SW NE 25 20 30 15 10 40 5 35 45 50 0 SE W E 1014 mb air pressure 31 March 2016 40 1.0 0.9 0.8 0.7 0.6 0.5 cm wind direction wind speed (knots) 0.4 0.3 0.2 0.1 0 rainfall temperature 30 20 °C 10 0 –10 Fig. 3.1
Question paper, page 11
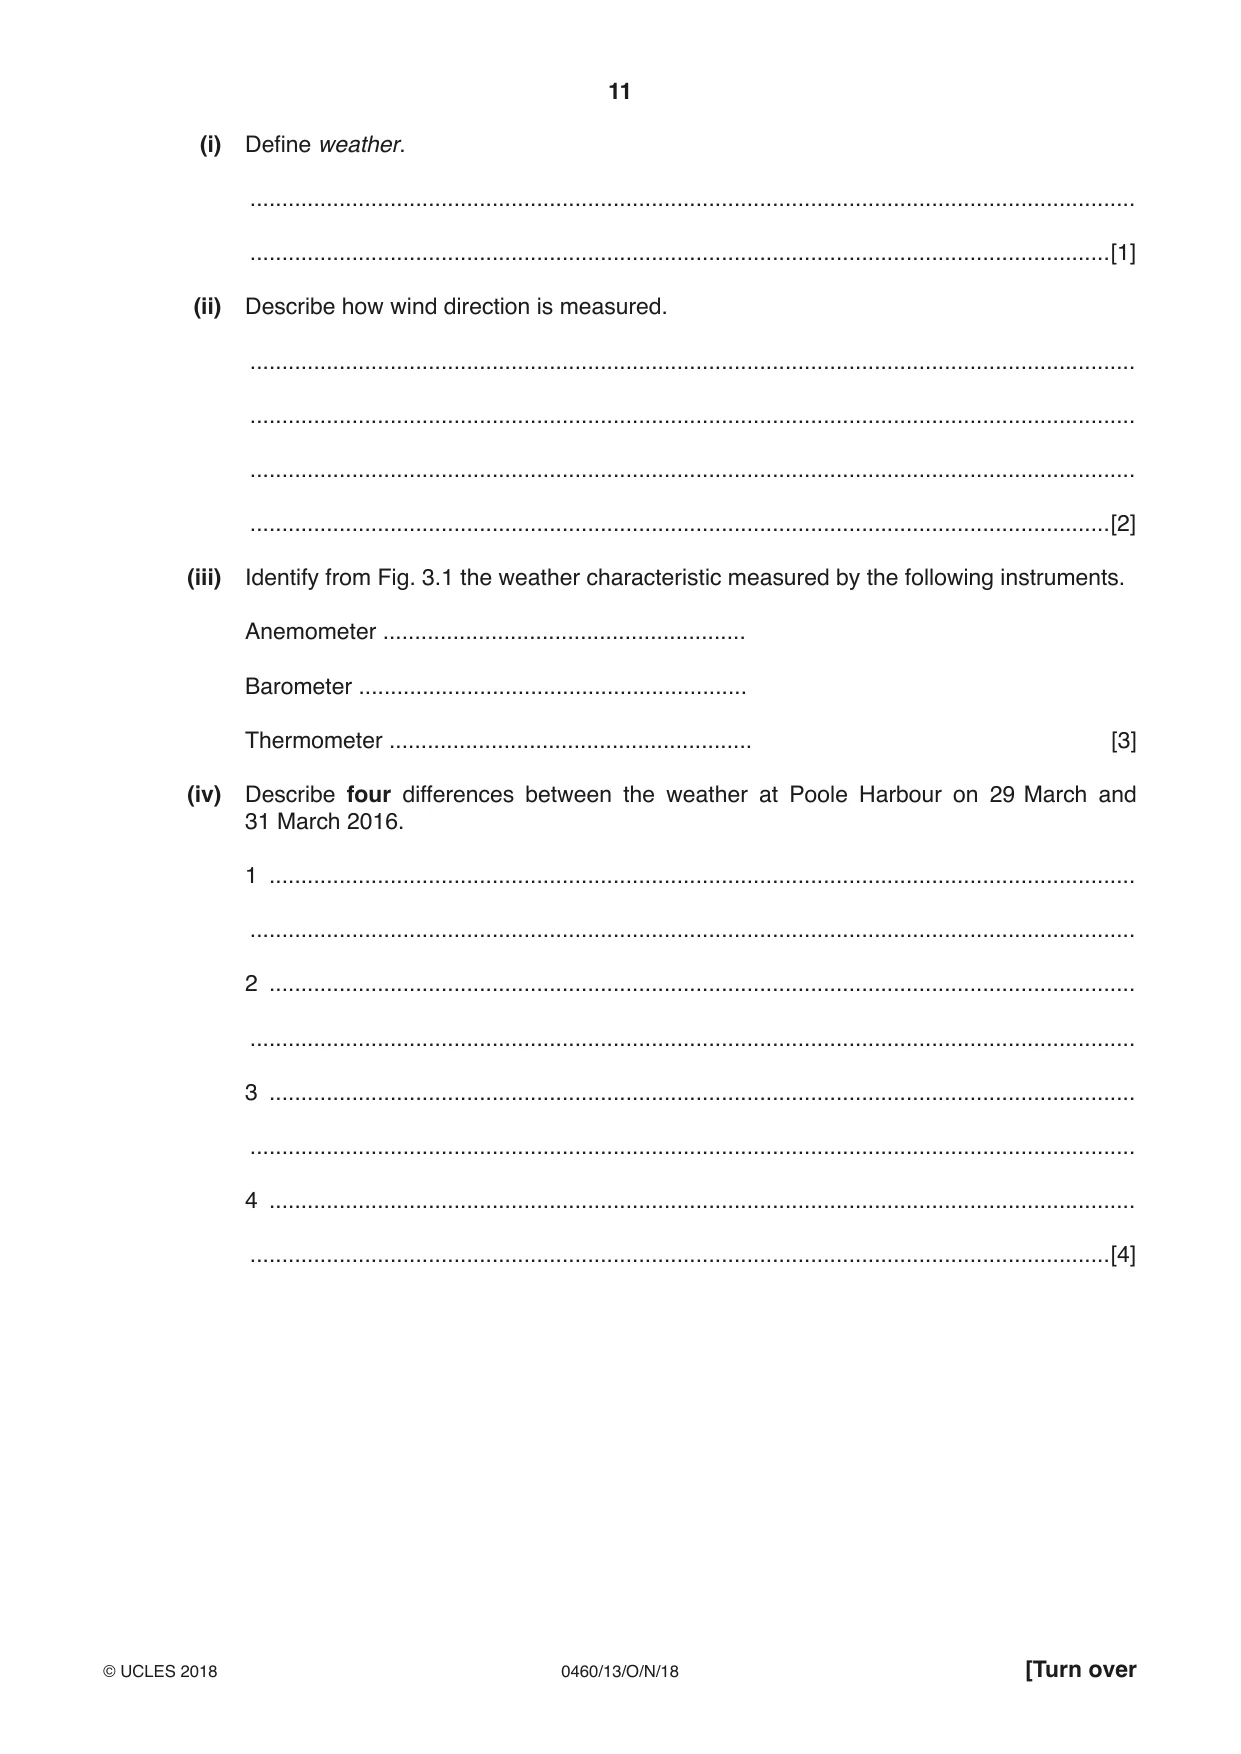
11 0460/13/O/N/18 © UCLES 2018 [Turn over (i) Define weather. … …[1] (ii) Describe how wind direction is measured. … … … …[2] (iii) Identify from Fig. 3.1 the weather characteristic measured by the following instruments. Anemometer … Barometer … Thermometer … [3] (iv) Describe four differences between the weather at Poole Harbour on 29 March and 31 March 2016. 1 … … 2 … … 3 … … 4 … …[4]
Question paper, page 12
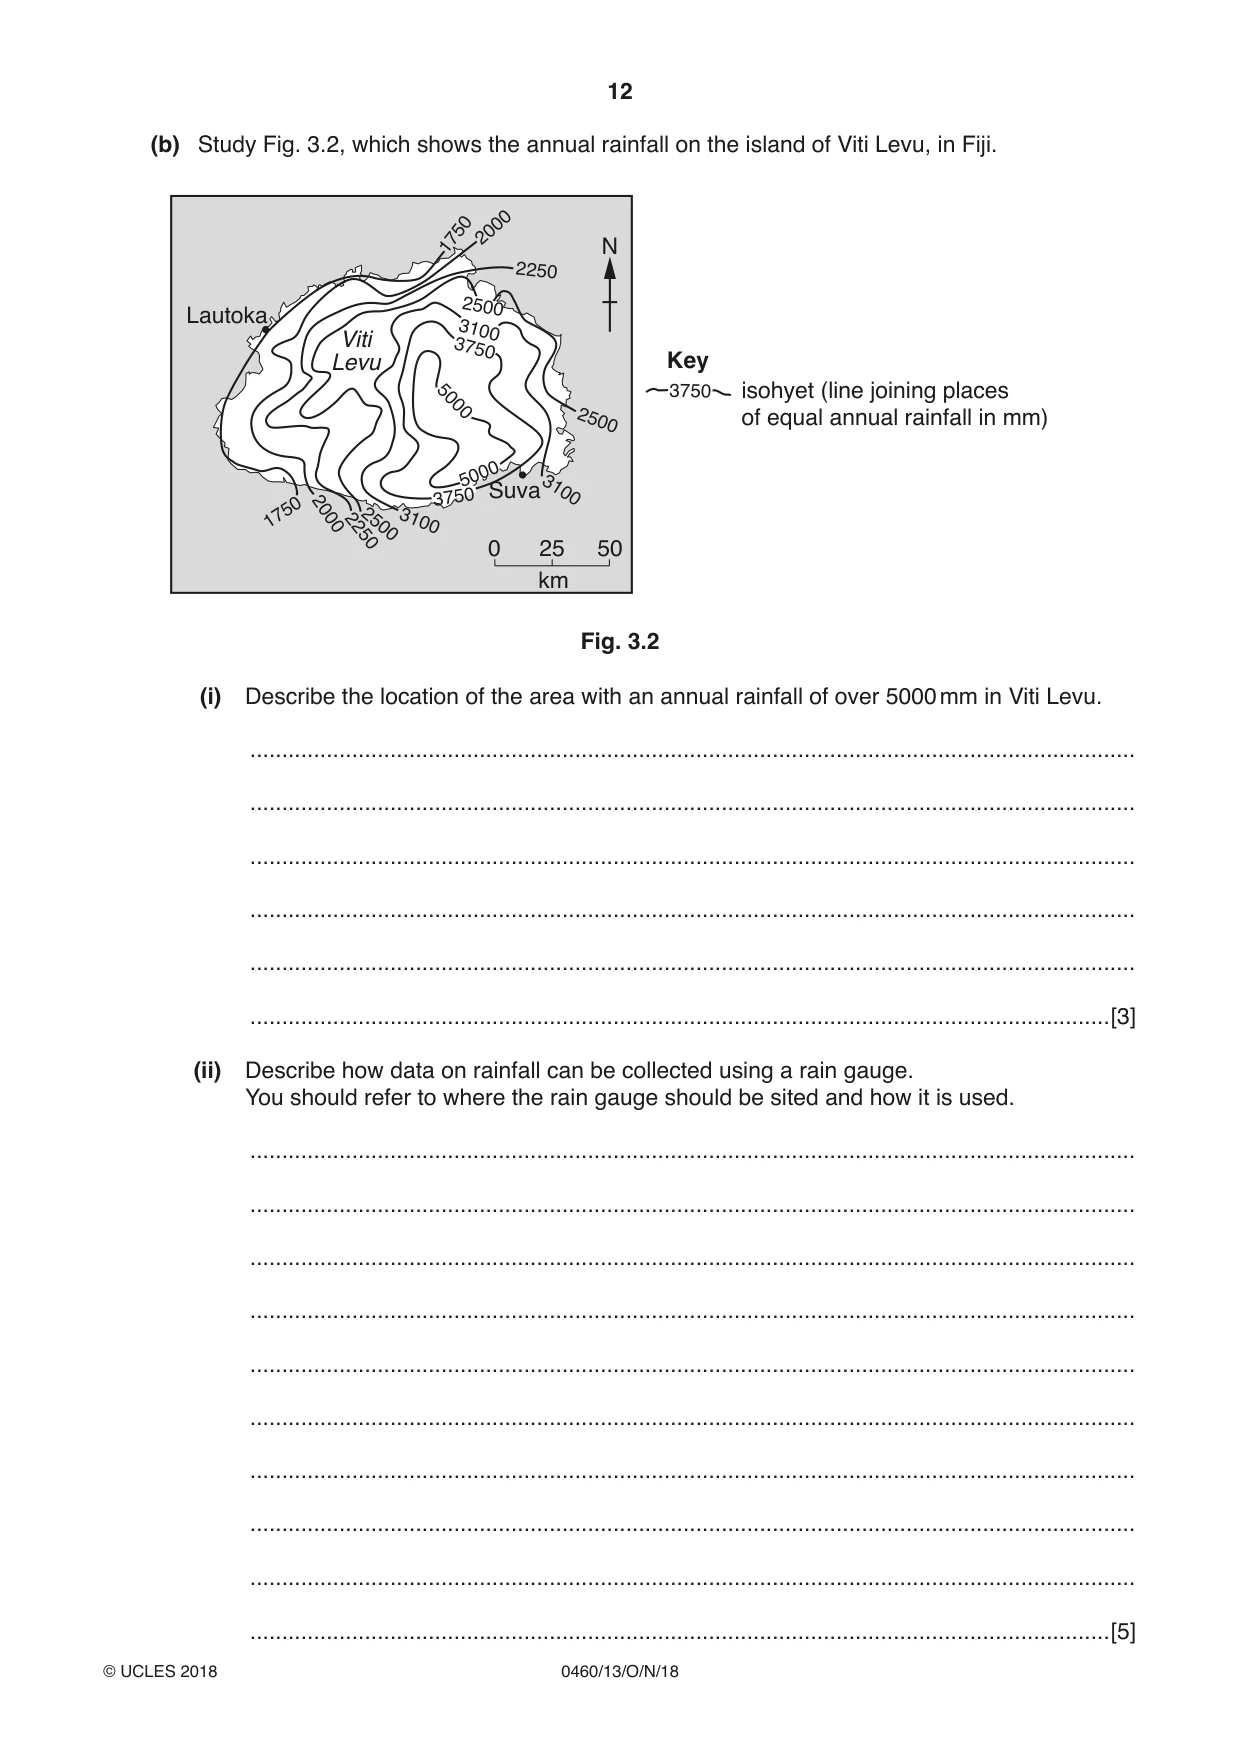
12 0460/13/O/N/18 © UCLES 2018 (b) Study Fig. 3.2, which shows the annual rainfall on the island of Viti Levu, in Fiji. 0 25 50 km N isohyet (line joining places of equal annual rainfall in mm) Key 3100 3750 3750 3750 3100 5000 3100 1750 1750 2000 2500 2500 2250 2000 2250 Suva Lautoka Viti Levu 5000 2500 Fig. 3.2 (i) Describe the location of the area with an annual rainfall of over 5000 mm in Viti Levu. … … … … … …[3] (ii) Describe how data on rainfall can be collected using a rain gauge. You should refer to where the rain gauge should be sited and how it is used. … … … … … … … … … …[5]
Question paper, page 13
13 0460/13/O/N/18 © UCLES 2018 [Turn over (c) For a named river you have studied, describe the hazards for people caused by flooding. Name of river … … … … … … … … … … … … … … … … … … … … … … … … …[7] [Total: 25]
Question paper, page 14
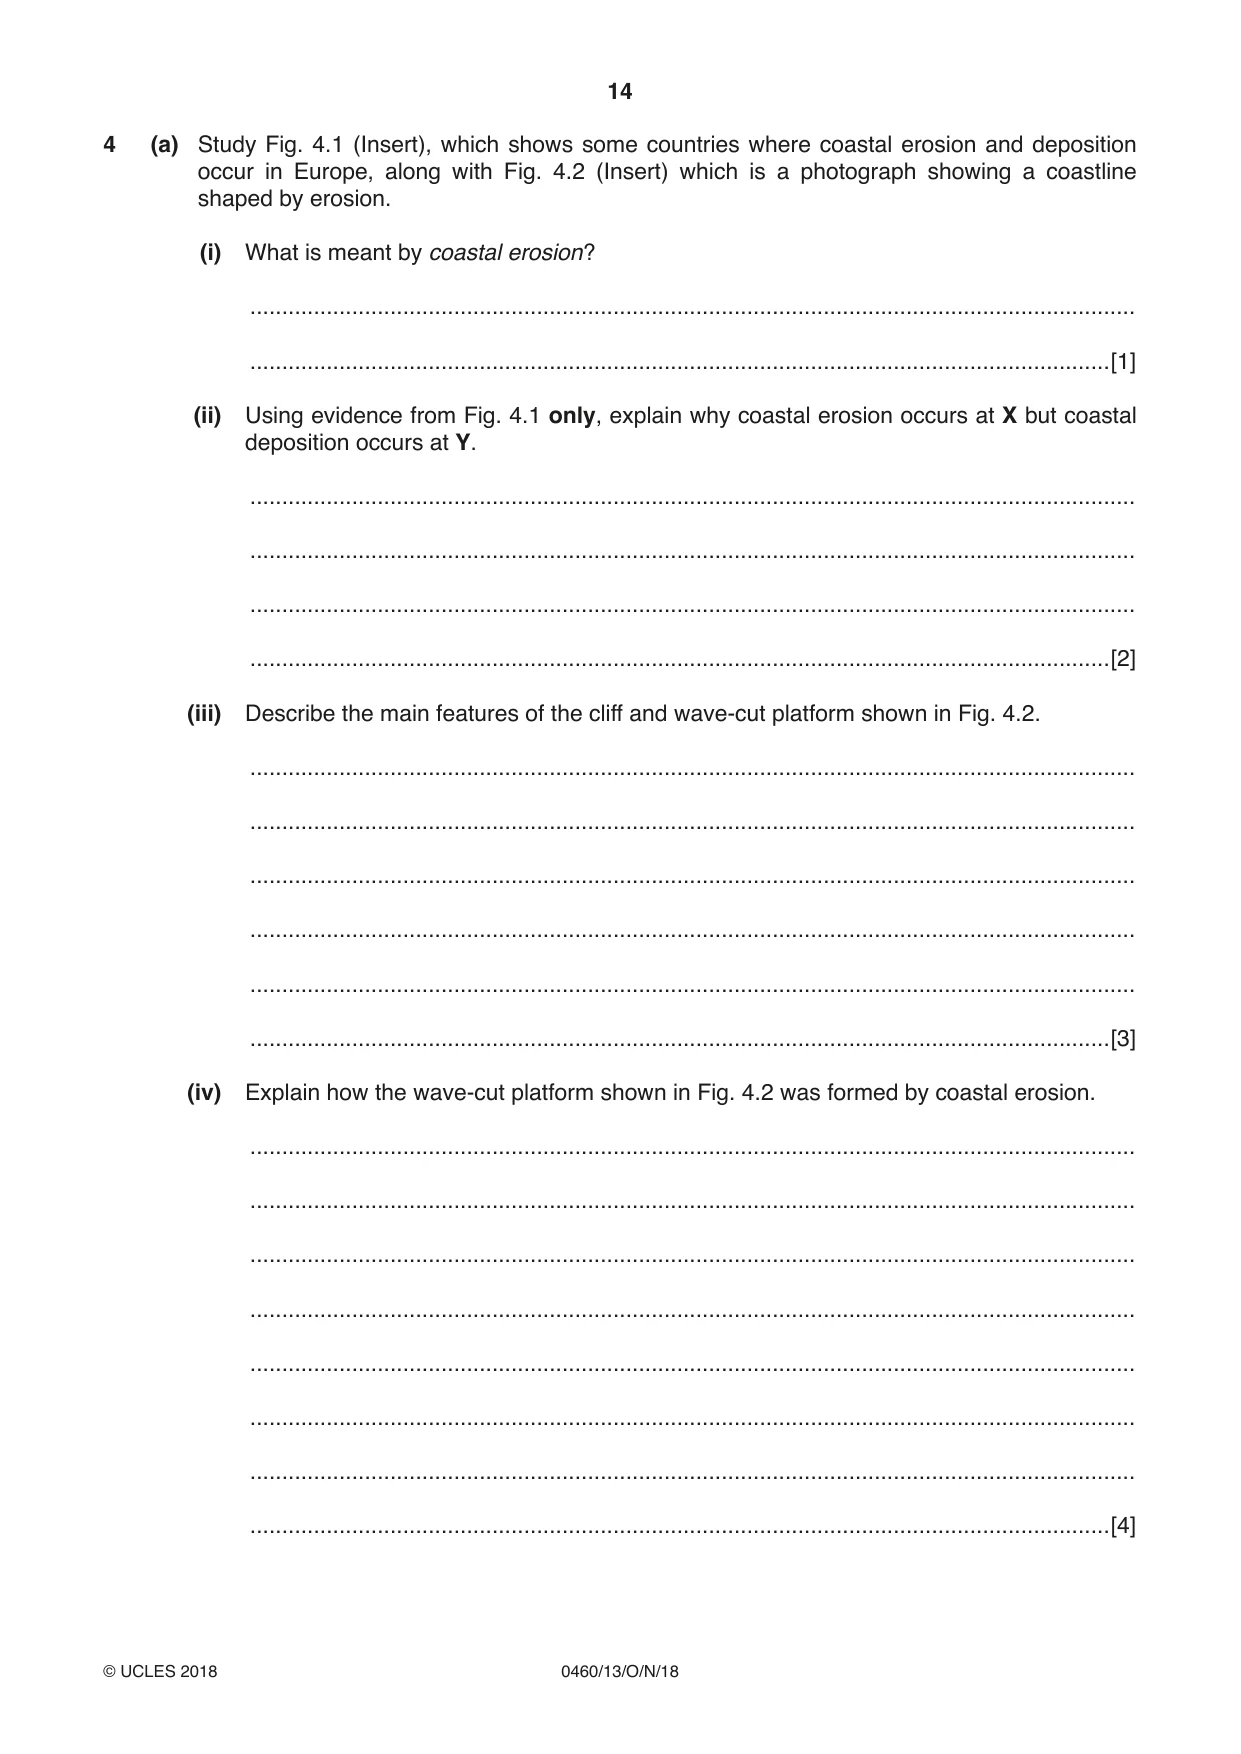
14 0460/13/O/N/18 © UCLES 2018 4 (a) Study Fig. 4.1 (Insert), which shows some countries where coastal erosion and deposition occur in Europe, along with Fig. 4.2 (Insert) which is a photograph showing a coastline shaped by erosion. (i) What is meant by coastal erosion? … …[1] (ii) Using evidence from Fig. 4.1 only, explain why coastal erosion occurs at X but coastal deposition occurs at Y. … … … …[2] (iii) Describe the main features of the cliff and wave-cut platform shown in Fig. 4.2. … … … … … …[3] (iv) Explain how the wave-cut platform shown in Fig. 4.2 was formed by coastal erosion. … … … … … … … …[4]
Question paper, page 15
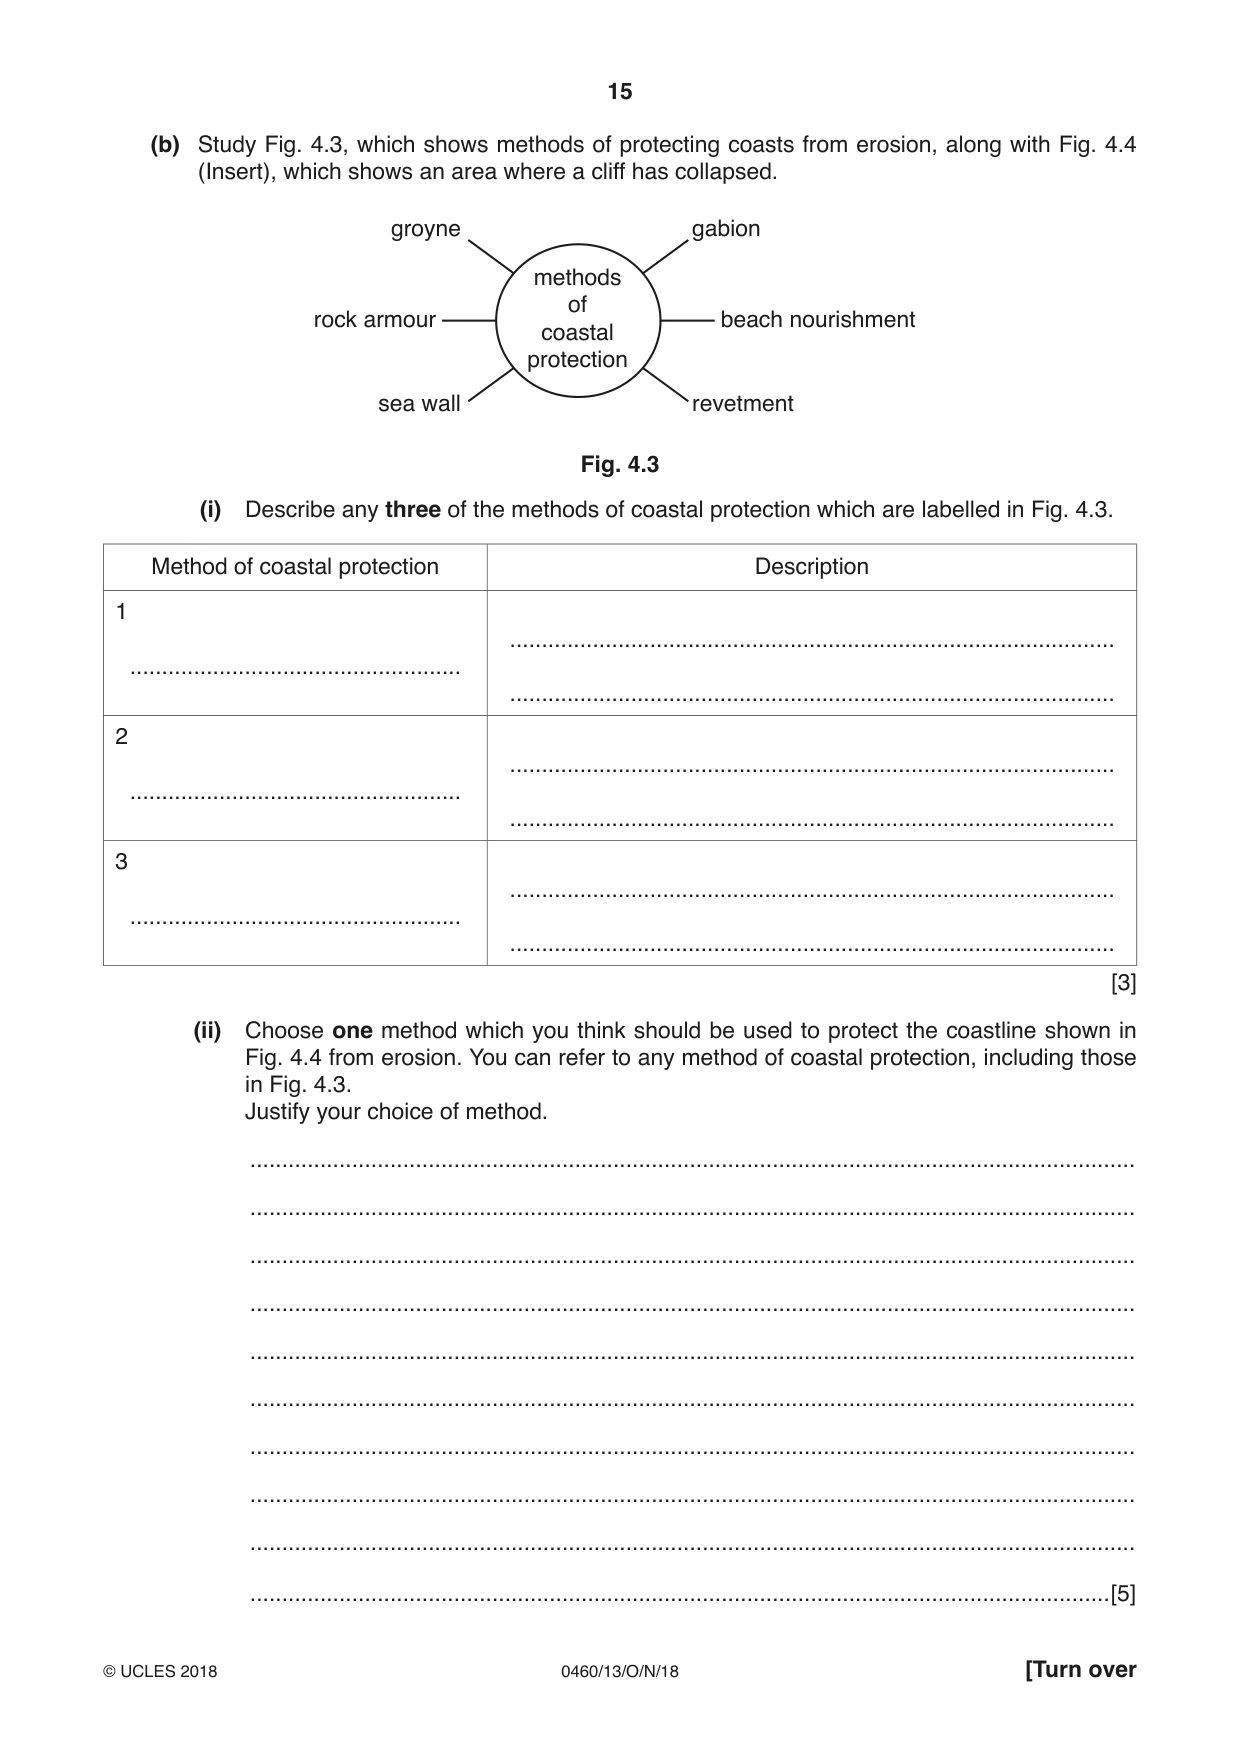
15 0460/13/O/N/18 © UCLES 2018 [Turn over (b) Study Fig. 4.3, which shows methods of protecting coasts from erosion, along with Fig. 4.4 (Insert), which shows an area where a cliff has collapsed. methods of coastal protection gabion revetment groyne sea wall beach nourishment rock armour Fig. 4.3 (i) Describe any three of the methods of coastal protection which are labelled in Fig. 4.3. Method of coastal protection Description 1 … … … 2 … … … 3 … … … [3] (ii) Choose one method which you think should be used to protect the coastline shown in Fig. 4.4 from erosion. You can refer to any method of coastal protection, including those in Fig. 4.3. Justify your choice of method. … … … … … … … … … …[5]
Question paper, page 16
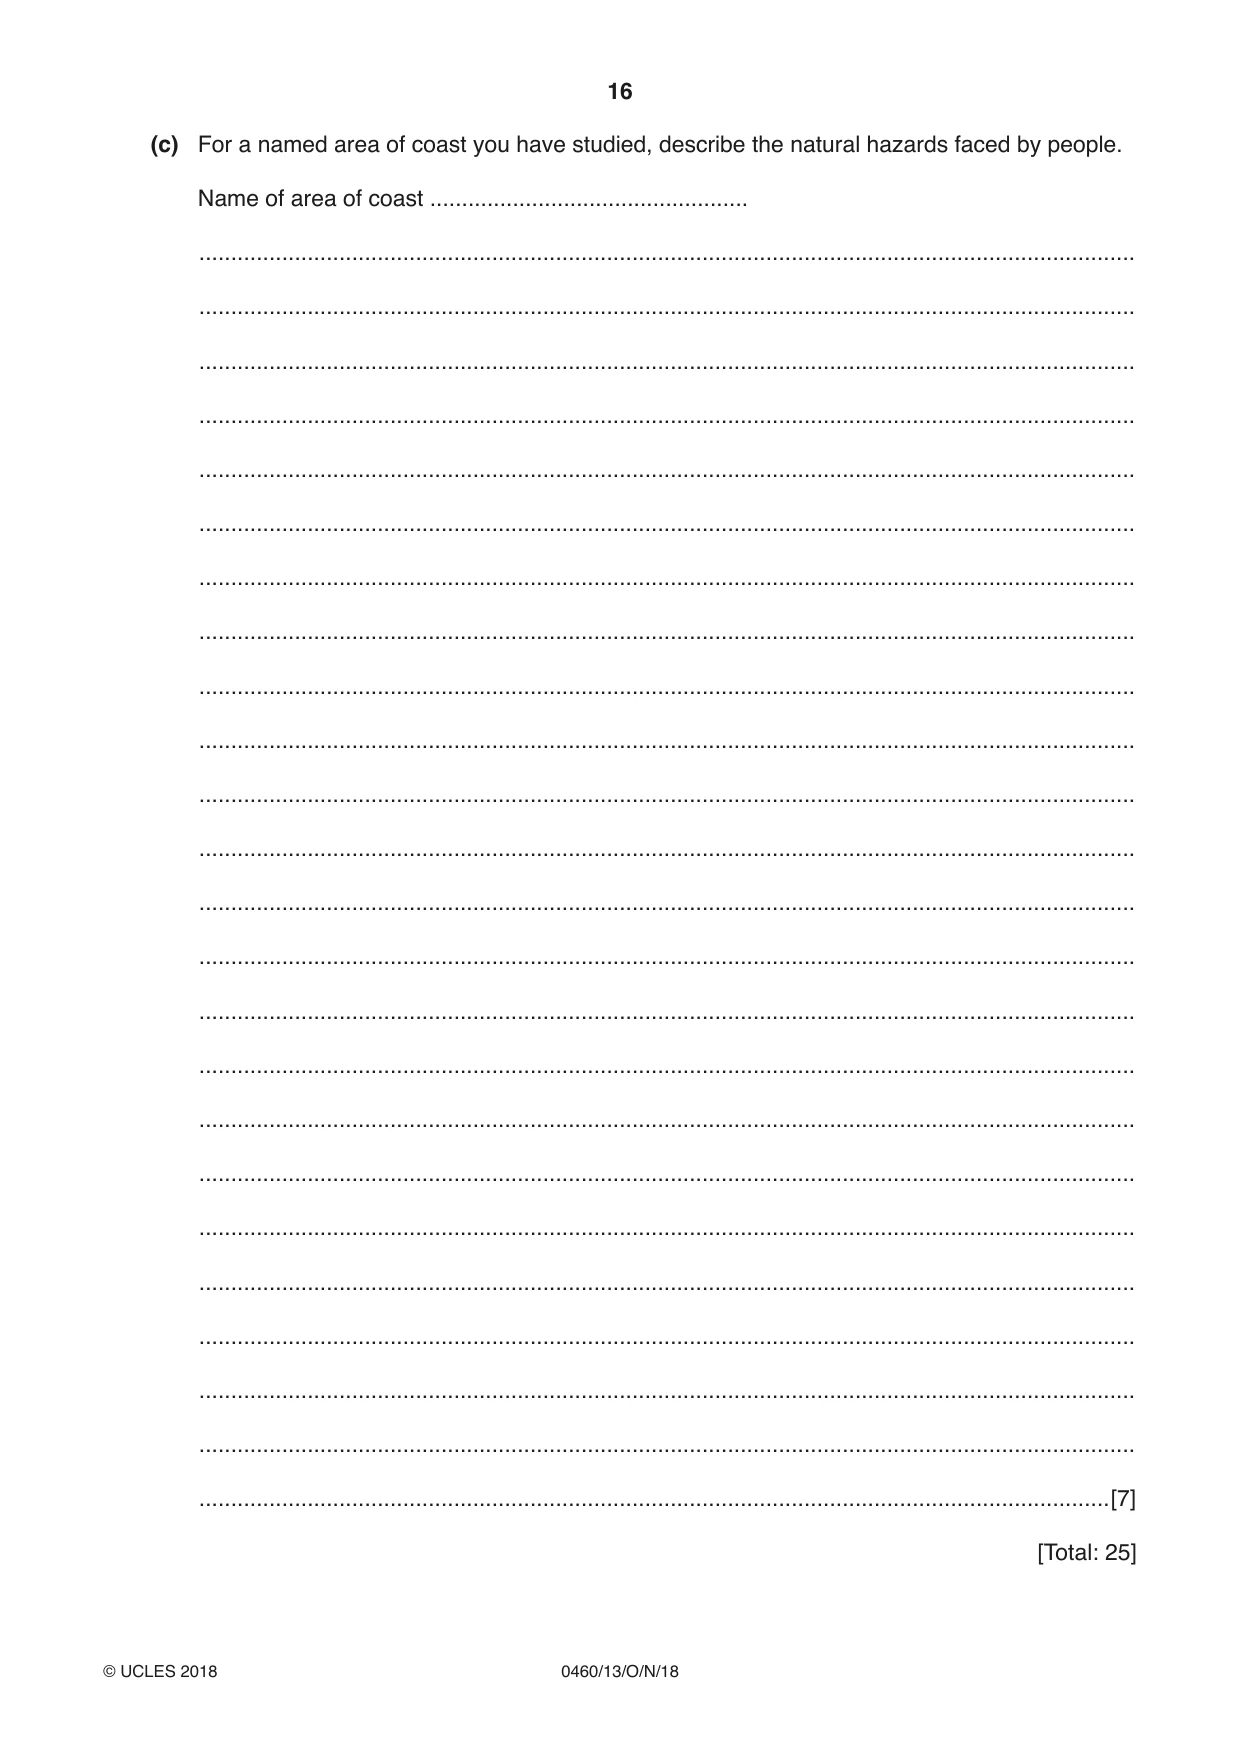
16 0460/13/O/N/18 © UCLES 2018 (c) For a named area of coast you have studied, describe the natural hazards faced by people. Name of area of coast … … … … … … … … … … … … … … … … … … … … … … … … …[7] [Total: 25]
Question paper, page 17
17 0460/13/O/N/18 © UCLES 2018 [Turn over TURN PAGE FOR QUESTION 5
Question paper, page 18
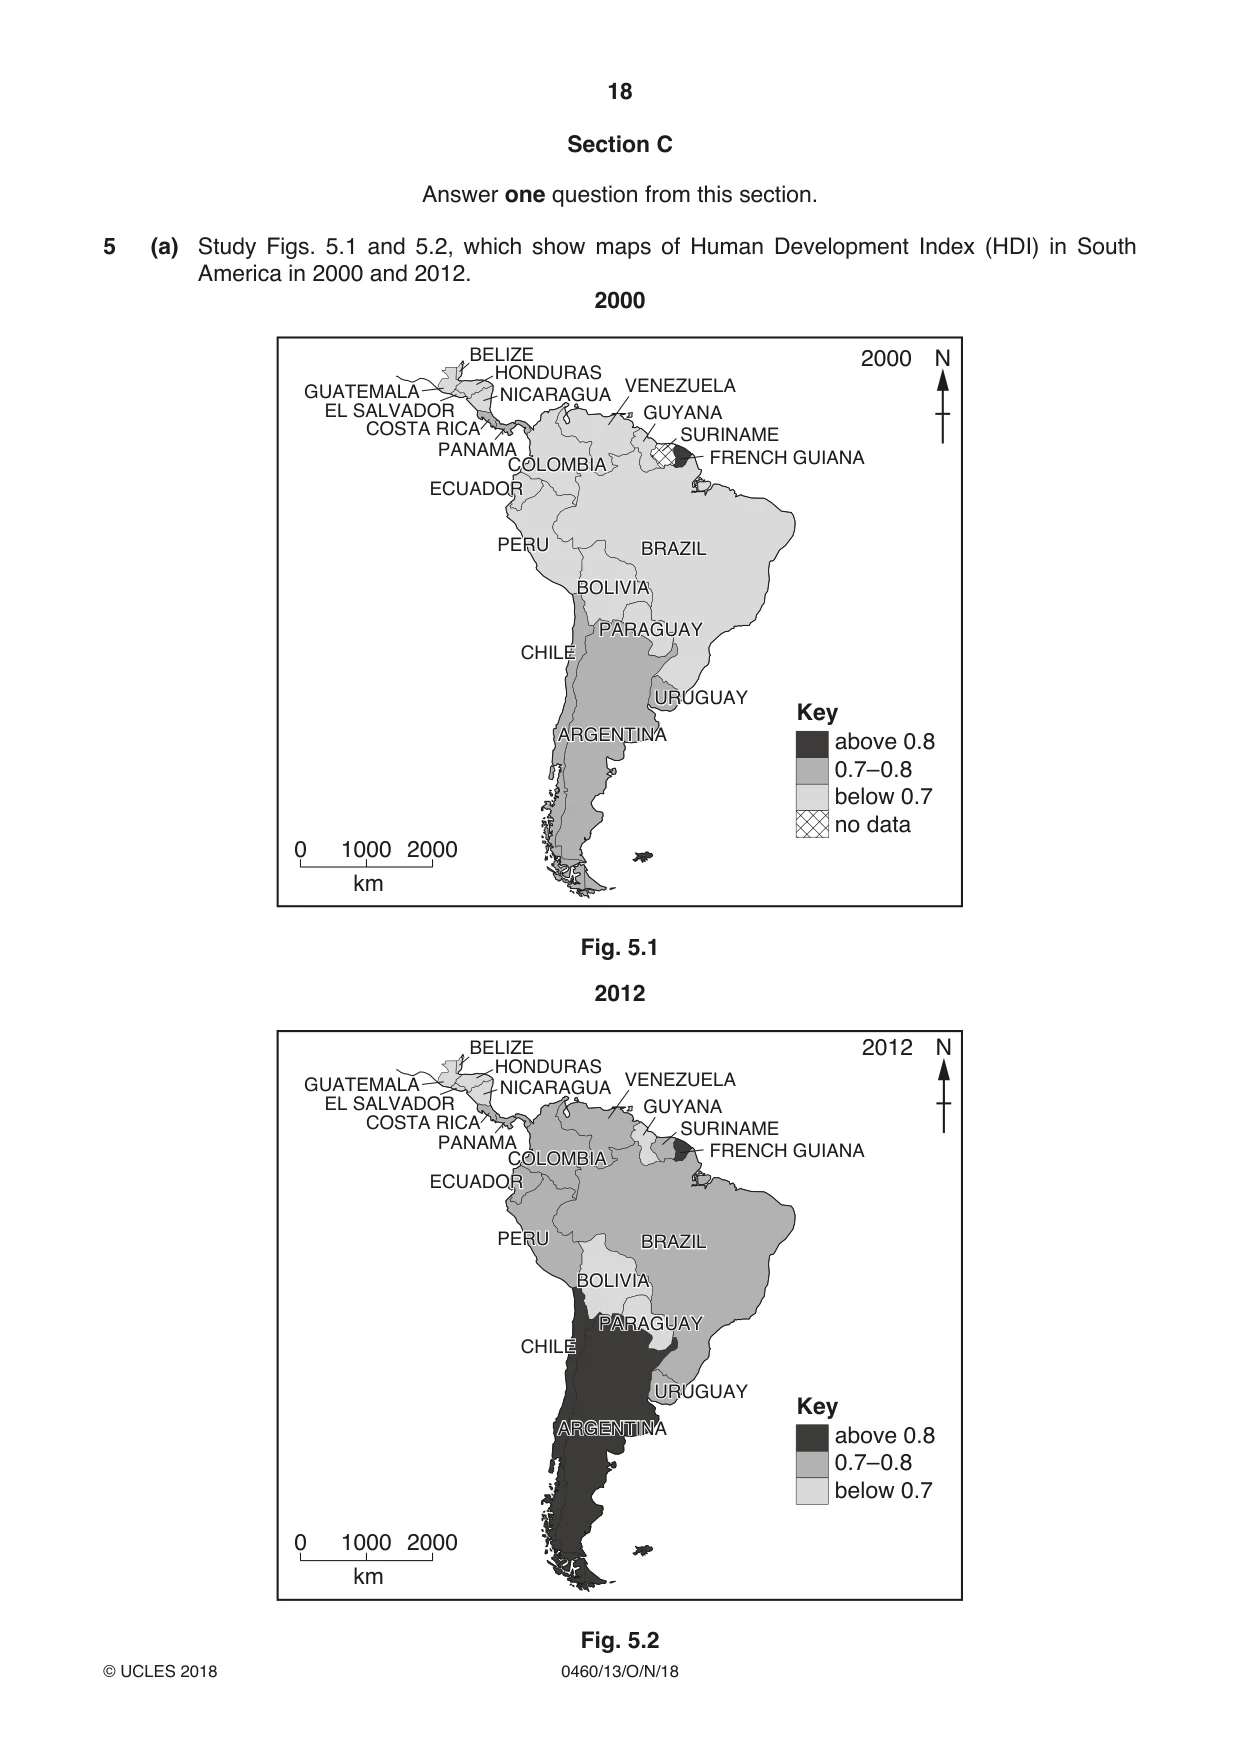
18 0460/13/O/N/18 © UCLES 2018 Section C Answer one question from this section. 5 (a) Study Figs. 5.1 and 5.2, which show maps of Human Development Index (HDI) in South America in 2000 and 2012. 2000 PANAMA EL SALVADOR GUATEMALA BELIZE HONDURAS NICARAGUA COSTA RICA VENEZUELA FRENCH GUIANA SURINAME GUYANA CHILE ECUADOR ARGENTINA BOLIVIA COLOMBIA PERU BRAZIL PARAGUAY URUGUAY above 0.8 0.7–0.8 below 0.7 no data Key 0 1000 2000 km 2000 N Fig. 5.1 2012 PANAMA EL SALVADOR GUATEMALA BELIZE HONDURAS NICARAGUA COSTA RICA VENEZUELA FRENCH GUIANA SURINAME GUYANA CHILE ECUADOR ARGENTINA BOLIVIA COLOMBIA PERU BRAZIL PARAGUAY URUGUAY above 0.8 0.7–0.8 below 0.7 2012 Key 0 1000 2000 km N Fig. 5.2
Question paper, page 19
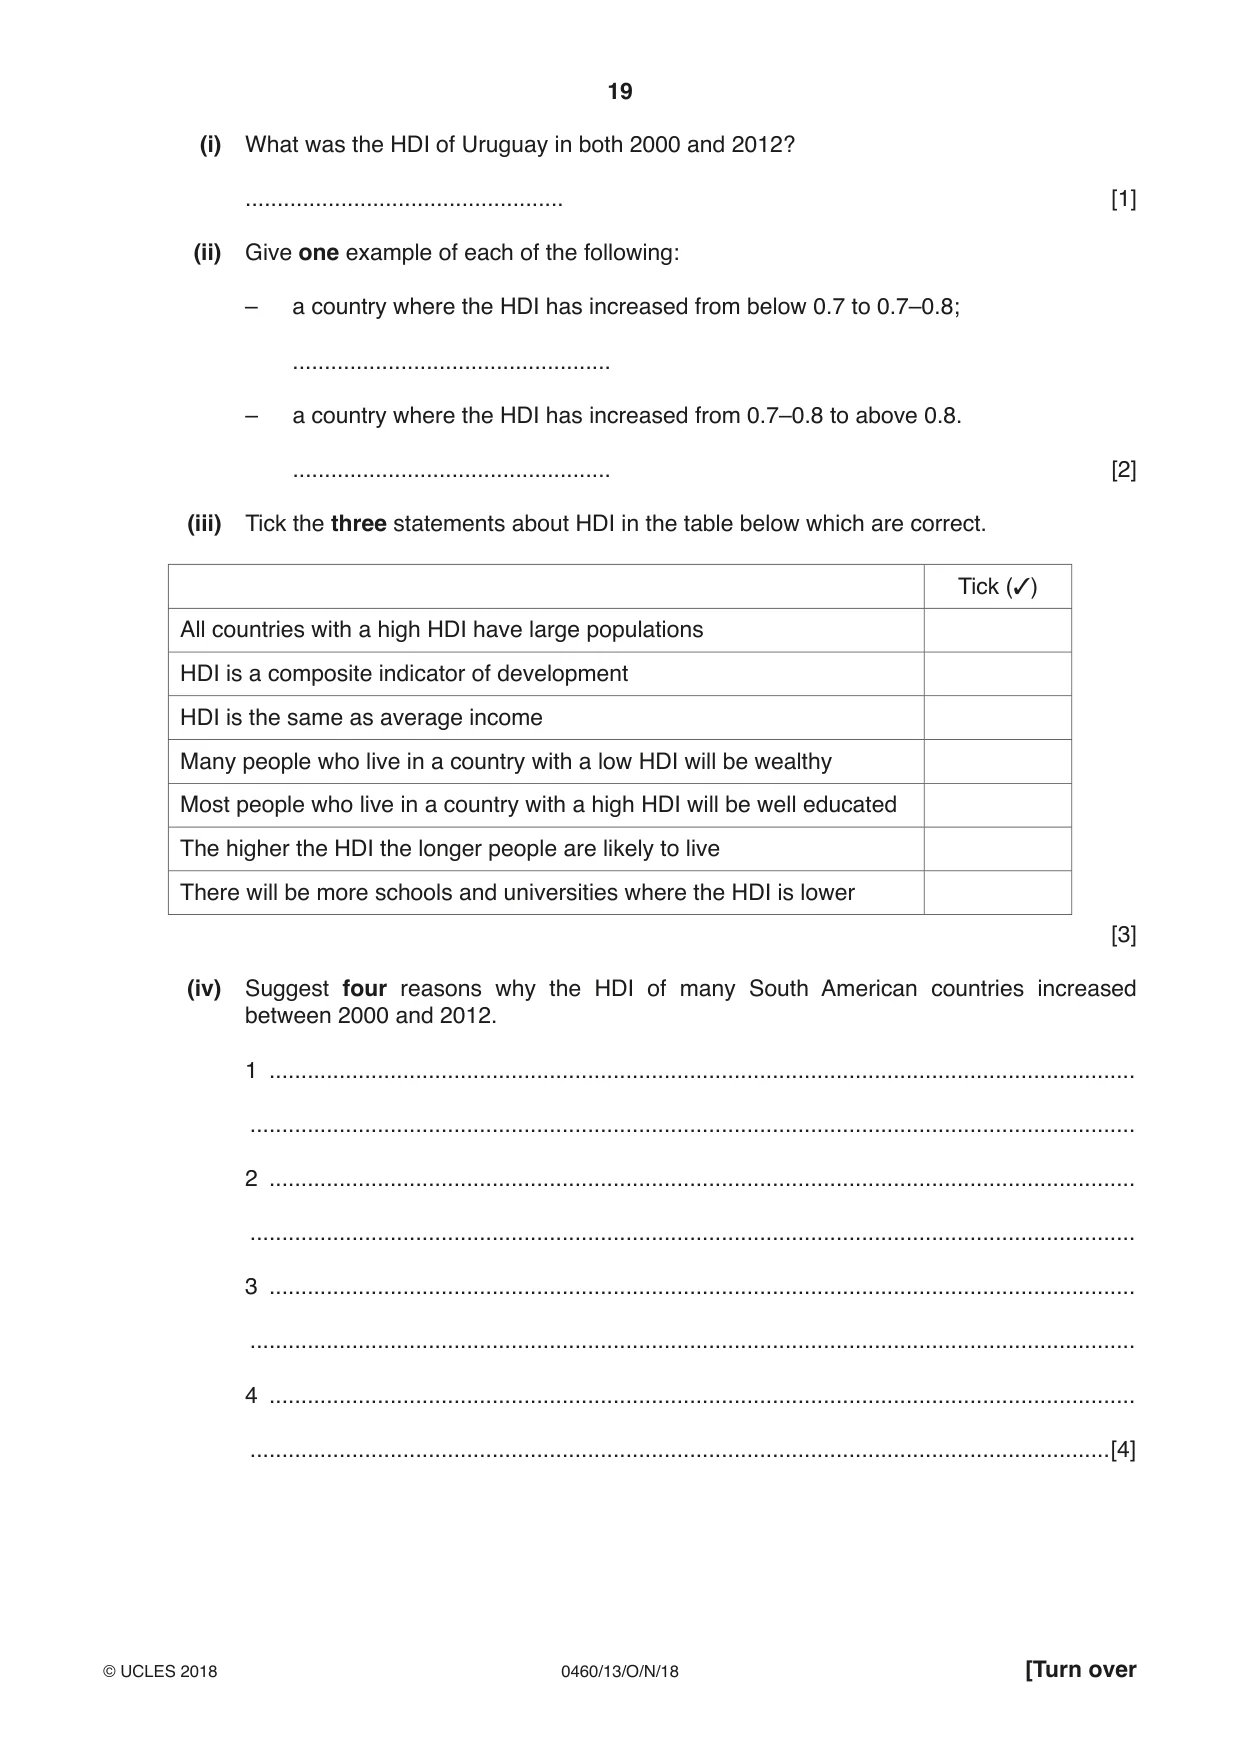
19 0460/13/O/N/18 © UCLES 2018 [Turn over (i) What was the HDI of Uruguay in both 2000 and 2012? … [1] (ii) Give one example of each of the following: – a country where the HDI has increased from below 0.7 to 0.7–0.8; … – a country where the HDI has increased from 0.7–0.8 to above 0.8. … [2] (iii) Tick the three statements about HDI in the table below which are correct. Tick (3) All countries with a high HDI have large populations HDI is a composite indicator of development HDI is the same as average income Many people who live in a country with a low HDI will be wealthy Most people who live in a country with a high HDI will be well educated The higher the HDI the longer people are likely to live There will be more schools and universities where the HDI is lower [3] (iv) Suggest four reasons why the HDI of many South American countries increased between 2000 and 2012. 1 … … 2 … … 3 … … 4 … …[4]
Question paper, page 20
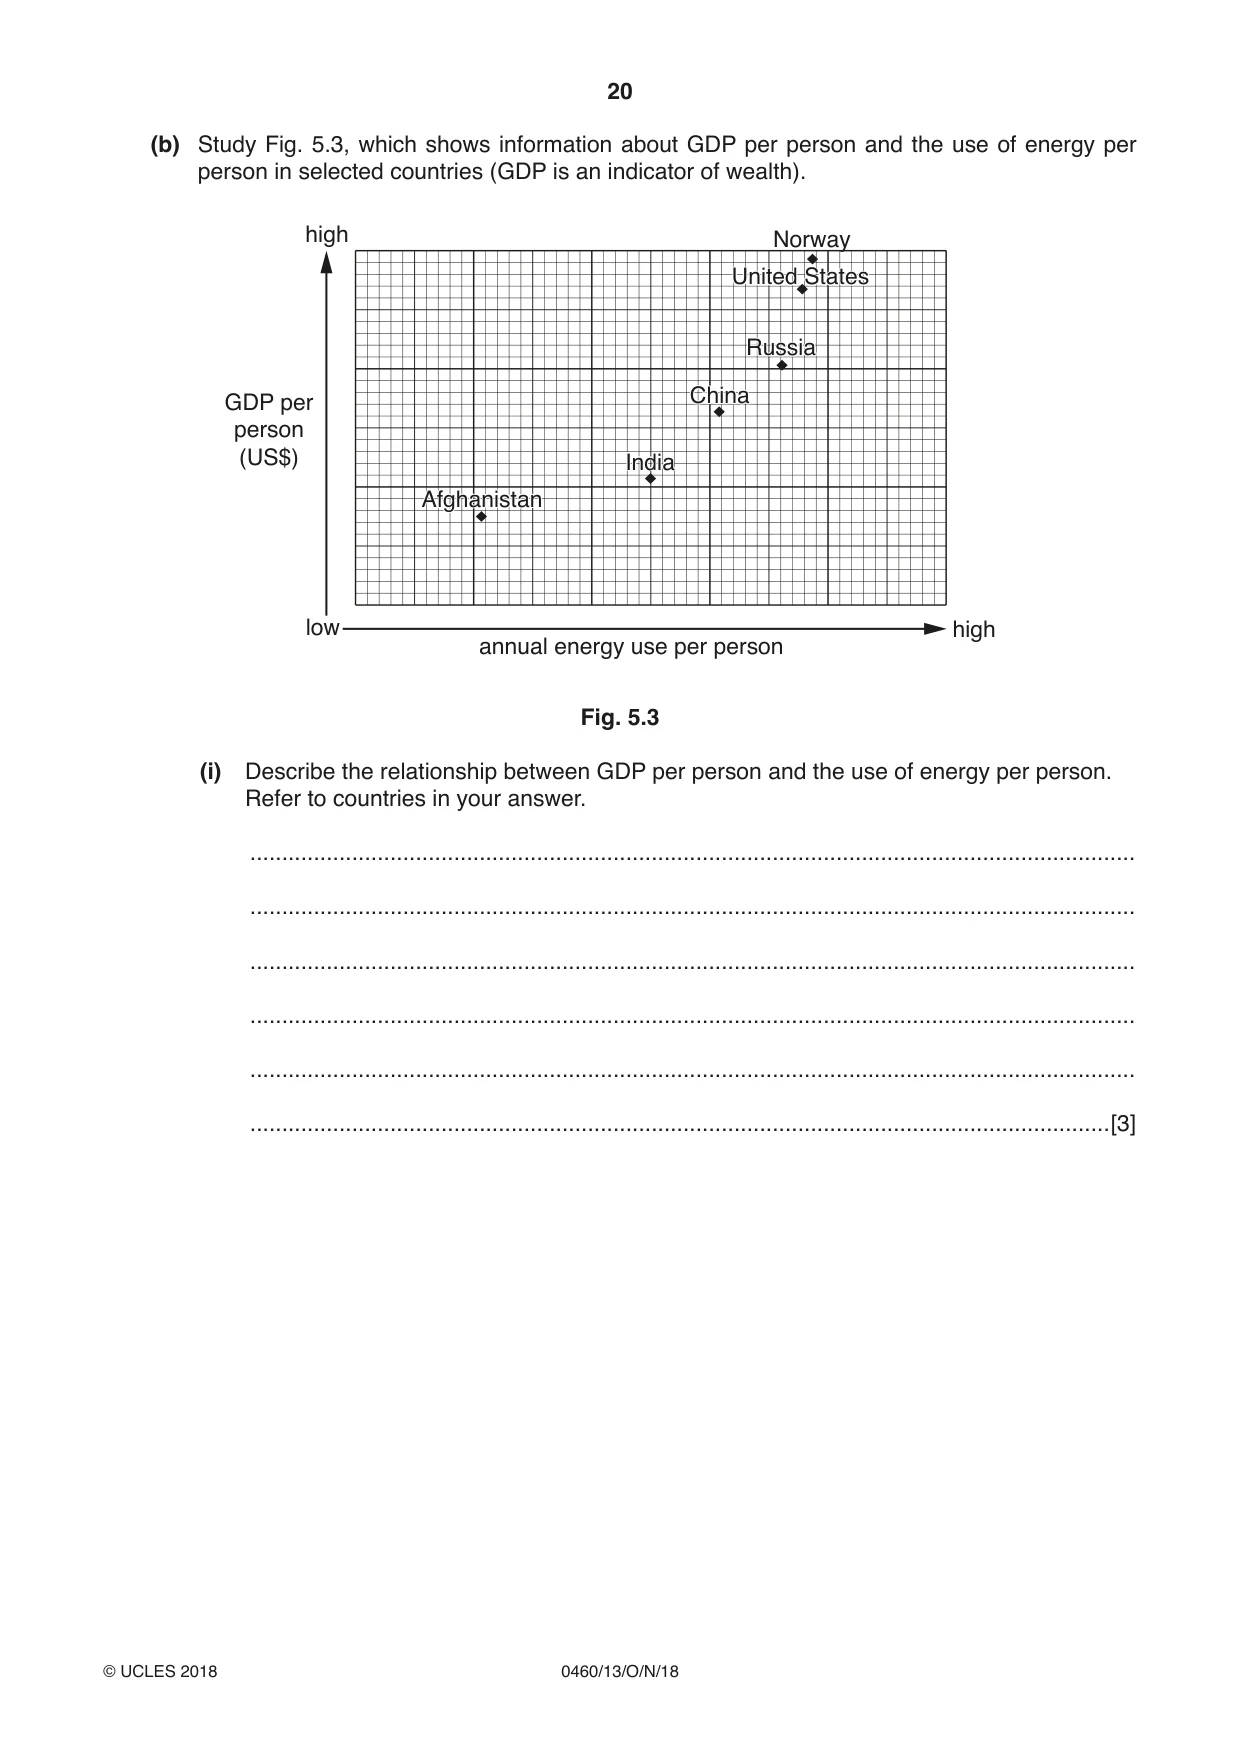
20 0460/13/O/N/18 © UCLES 2018 (b) Study Fig. 5.3, which shows information about GDP per person and the use of energy per person in selected countries (GDP is an indicator of wealth). high high low annual energy use per person GDP per person (US$) Norway Russia India United States China Afghanistan Fig. 5.3 (i) Describe the relationship between GDP per person and the use of energy per person. Refer to countries in your answer. … … … … … …[3]
Question paper, page 21
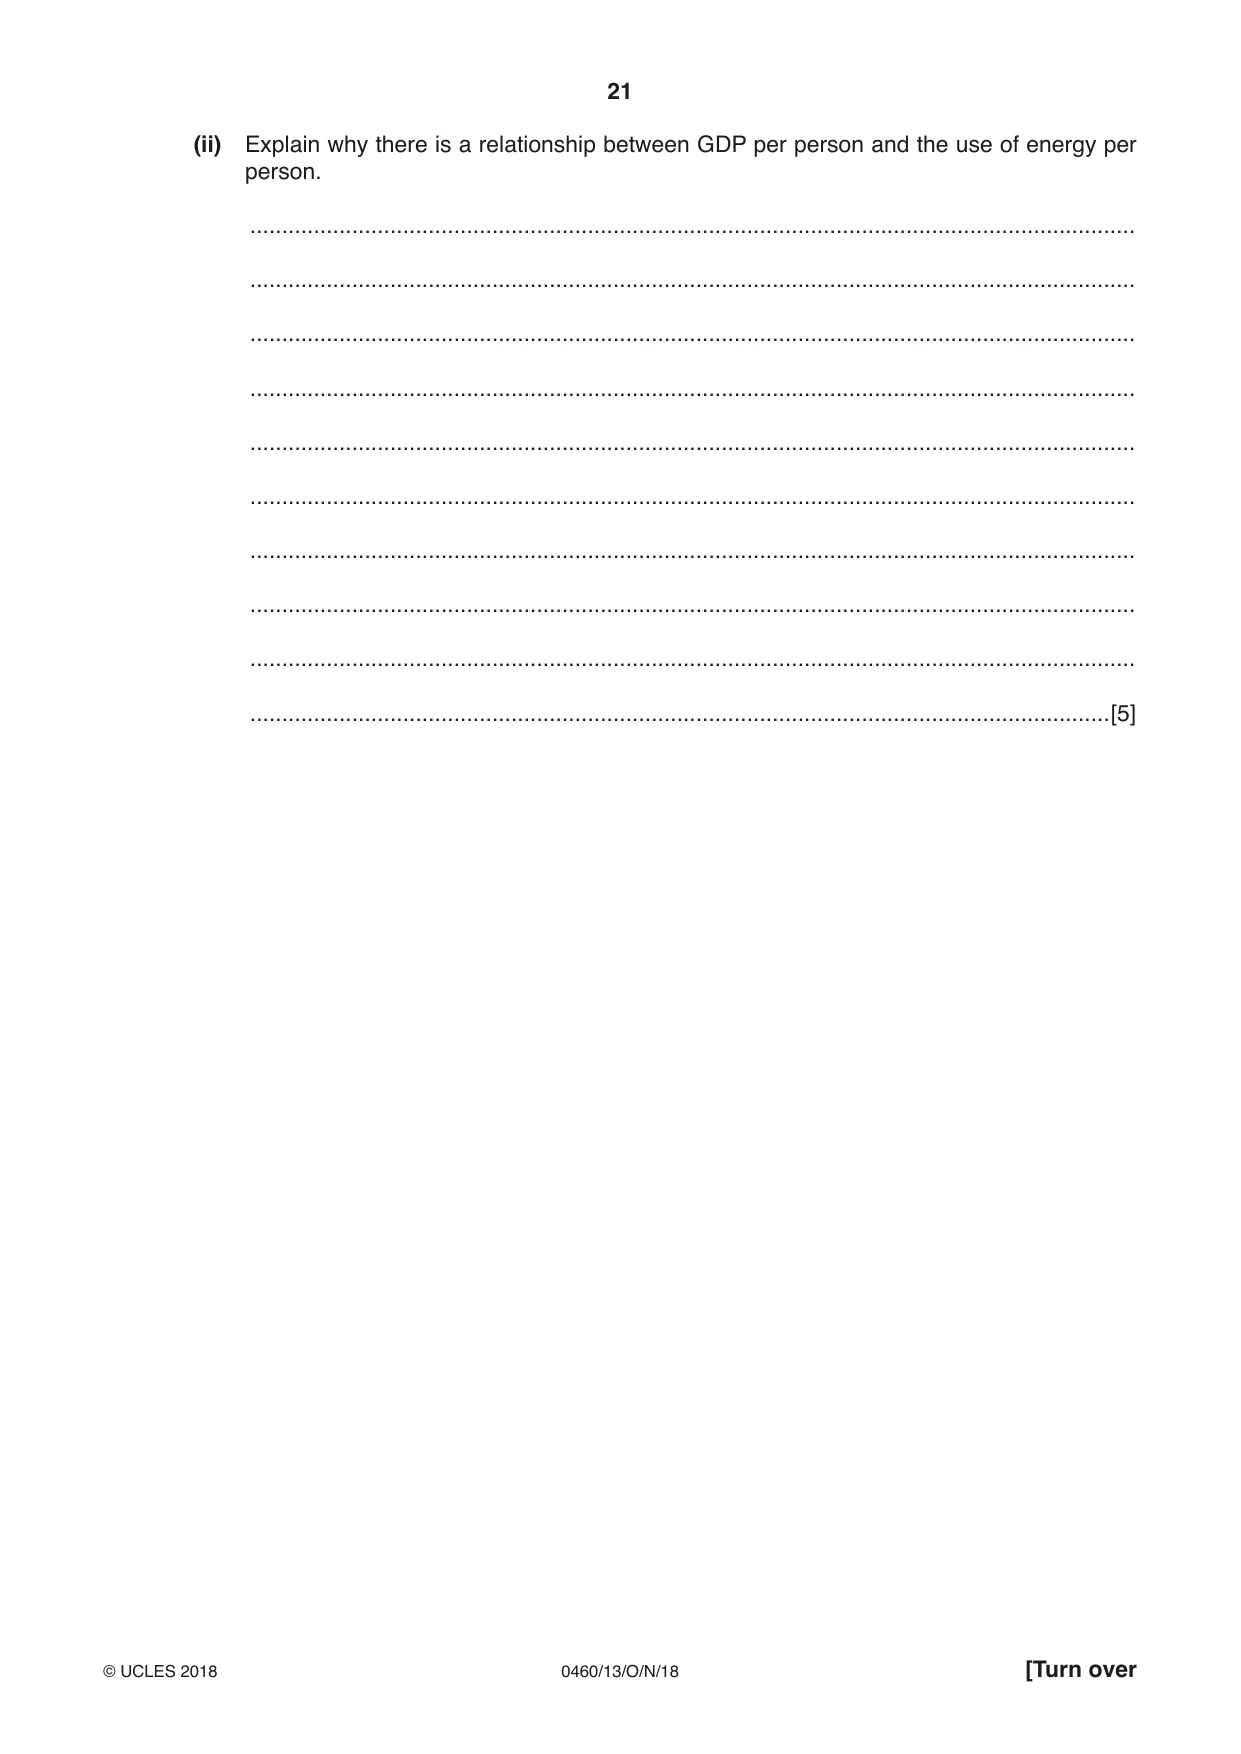
21 0460/13/O/N/18 © UCLES 2018 [Turn over (ii) Explain why there is a relationship between GDP per person and the use of energy per person. … … … … … … … … … …[5]
Question paper, page 22
22 0460/13/O/N/18 © UCLES 2018 (c) For a country you have studied, describe the advantages and disadvantages of a transnational corporation (TNC) locating there. Name of country … Name of transnational corporation (TNC) … … … … … … … … … … … … … … … … … … … … … … …[7] [Total: 25]
Question paper, page 23
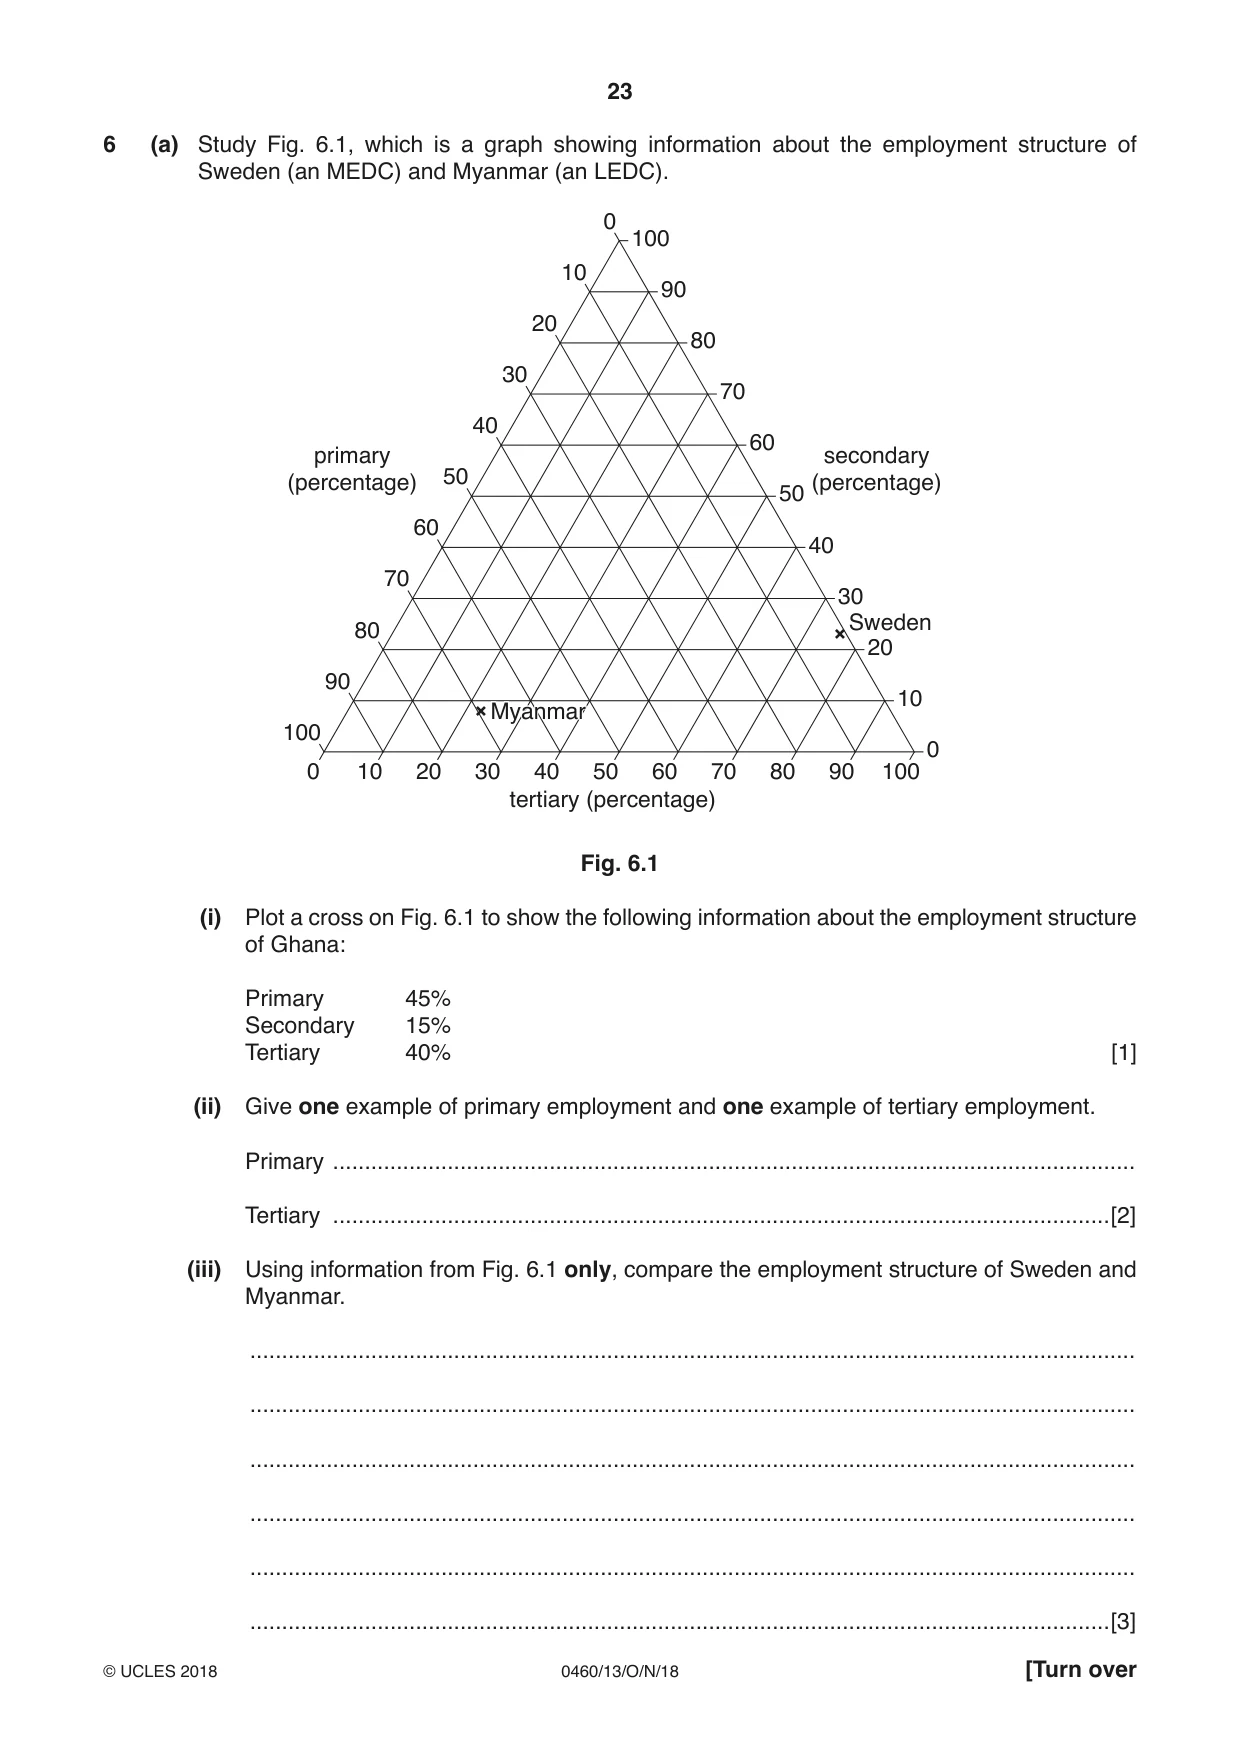
23 0460/13/O/N/18 © UCLES 2018 [Turn over 6 (a) Study Fig. 6.1, which is a graph showing information about the employment structure of Sweden (an MEDC) and Myanmar (an LEDC). 0 10 20 30 40 50 60 70 80 90 100 100 0 10 20 30 40 50 tertiary (percentage) primary (percentage) secondary (percentage) 60 70 80 90 100 90 80 70 60 50 40 30 20 10 0 Myanmar Sweden Fig. 6.1 (i) Plot a cross on Fig. 6.1 to show the following information about the employment structure of Ghana: Primary 45% Secondary 15% Tertiary 40% [1] (ii) Give one example of primary employment and one example of tertiary employment. Primary … Tertiary …[2] (iii) Using information from Fig. 6.1 only, compare the employment structure of Sweden and Myanmar. … … … … … …[3]
Question paper, page 24
24 0460/13/O/N/18 © UCLES 2018 (iv) Suggest reasons for the difference in employment structure between Sweden and Myanmar. … … … … … … … …[4] (b) Study Fig. 6.2 (Insert), which shows information about the car assembly industry. (i) Use Fig. 6.2 to explain what is meant by assembly industry. … … … … … …[3] (ii) Explain how the location of industry can be influenced by transport. … … … … … … … … … …[5]
Question paper, page 25
25 0460/13/O/N/18 © UCLES 2018 (c) Describe the local and global environmental risks of an economic activity which takes place in a named area you have studied. Name of area … Economic activity … … … … … … … … … … … … … … … … … … … … … … …[7] [Total: 25]
Question paper, page 26
26 0460/13/O/N/18 © UCLES 2018 Additional Pages If you use the following lined pages to complete the answer(s) to any question(s), the question number(s) must be clearly shown. … … … … … … … … … … … … … … … … … … … … … … … … … …
Question paper, page 27
27 0460/13/O/N/18 © UCLES 2018 … … … … … … … … … … … … … … … … … … … … … … … … … … … …
Question paper, page 28
28 0460/13/O/N/18 © UCLES 2018 BLANK PAGE Permission to reproduce items where third-party owned material protected by copyright is included has been sought and cleared where possible. Every reasonable effort has been made by the publisher (UCLES) to trace copyright holders, but if any items requiring clearance have unwittingly been included, the publisher will be pleased to make amends at the earliest possible opportunity. To avoid the issue of disclosure of answer-related information to candidates, all copyright acknowledgements are reproduced online in the Cambridge International Examinations Copyright Acknowledgements Booklet. This is produced for each series of examinations and is freely available to download at www.cie.org.uk after the live examination series. Cambridge International Examinations is part of the Cambridge Assessment Group. Cambridge Assessment is the brand name of University of Cambridge Local Examinations Syndicate (UCLES), which is itself a department of the University of Cambridge.
Mark scheme, page 1
This syllabus is approved for use in England, Wales and Northern Ireland as a Cambridge International Level 1/Level 2 Certificate. This document consists of 16 printed pages. © UCLES 2018 [Turn over Cambridge Assessment International Education Cambridge International General Certificate of Secondary Education GEOGRAPHY 0460/13 Paper 1 October/November 2018 MARK SCHEME Maximum Mark: 75 Published This mark scheme is published as an aid to teachers and candidates, to indicate the requirements of the examination. It shows the basis on which Examiners were instructed to award marks. It does not indicate the details of the discussions that took place at an Examiners’ meeting before marking began, which would have considered the acceptability of alternative answers. Mark schemes should be read in conjunction with the question paper and the Principal Examiner Report for Teachers. Cambridge International will not enter into discussions about these mark schemes. Cambridge International is publishing the mark schemes for the October/November 2018 series for most Cambridge IGCSE™, Cambridge International A and AS Level components and some Cambridge O Level components.
Mark scheme, page 2
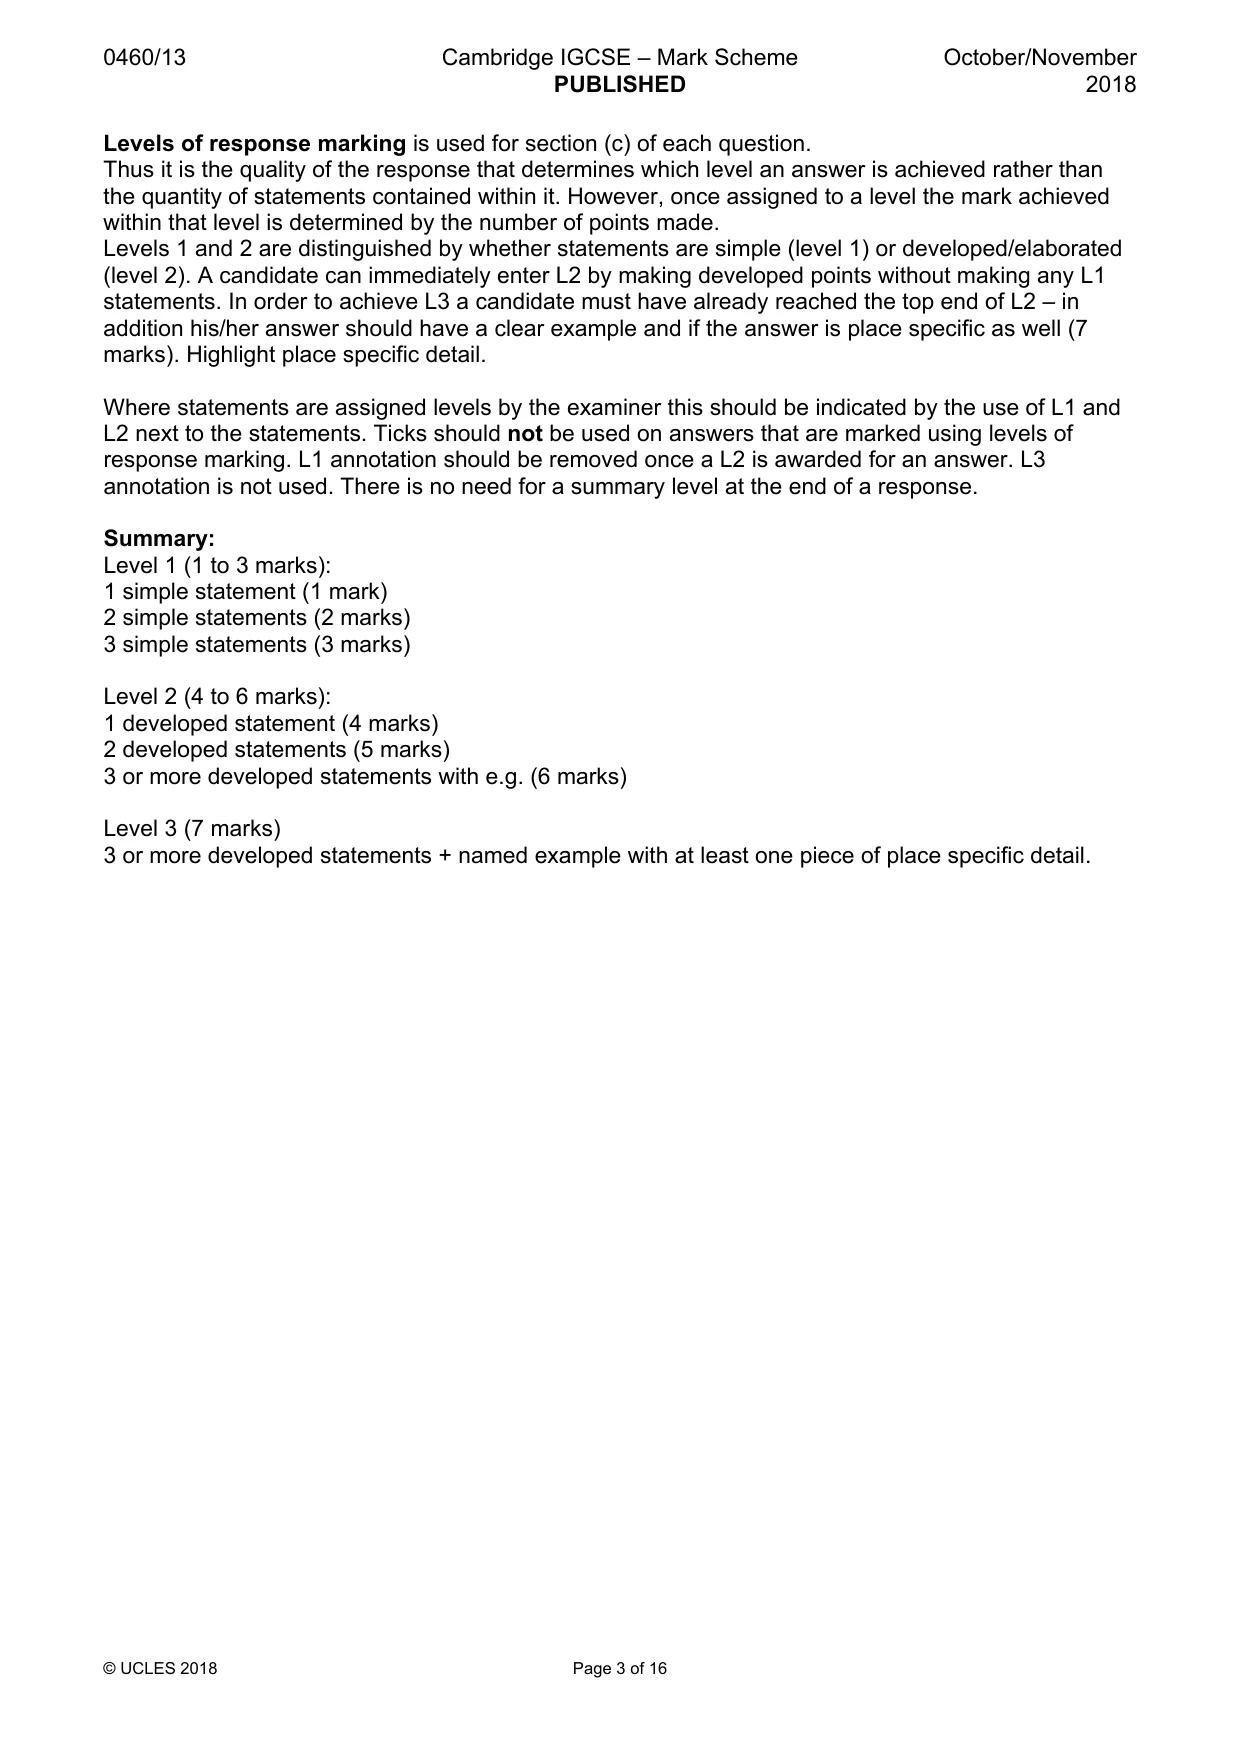
0460/13 Cambridge IGCSE – Mark Scheme PUBLISHED October/November 2018 © UCLES 2018 Page 2 of 16 Generic Marking Principles These general marking principles must be applied by all examiners when marking candidate answers. They should be applied alongside the specific content of the mark scheme or generic level descriptors for a question. Each question paper and mark scheme will also comply with these marking principles. GENERIC MARKING PRINCIPLE 1: Marks must be awarded in line with: • the specific content of the mark scheme or the generic level descriptors for the question • the specific skills defined in the mark scheme or in the generic level descriptors for the question • the standard of response required by a candidate as exemplified by the standardisation scripts. GENERIC MARKING PRINCIPLE 2: Marks awarded are always whole marks (not half marks, or other fractions). GENERIC MARKING PRINCIPLE 3: Marks must be awarded positively: • marks are awarded for correct/valid answers, as defined in the mark scheme. However, credit is given for valid answers which go beyond the scope of the syllabus and mark scheme, referring to your Team Leader as appropriate • marks are awarded when candidates clearly demonstrate what they know and can do • marks are not deducted for errors • marks are not deducted for omissions • answers should only be judged on the quality of spelling, punctuation and grammar when these features are specifically assessed by the question as indicated by the mark scheme. The meaning, however, should be unambiguous. GENERIC MARKING PRINCIPLE 4: Rules must be applied consistently e.g. in situations where candidates have not followed instructions or in the application of generic level descriptors. GENERIC MARKING PRINCIPLE 5: Marks should be awarded using the full range of marks defined in the mark scheme for the question (however; the use of the full mark range may be limited according to the quality of the candidate responses seen). GENERIC MARKING PRINCIPLE 6: Marks awarded are based solely on the requirements as defined in the mark scheme. Marks should not be awarded with grade thresholds or grade descriptors in mind.
Mark scheme, page 3
0460/13 Cambridge IGCSE – Mark Scheme PUBLISHED October/November 2018 © UCLES 2018 Page 3 of 16 Levels of response marking is used for section (c) of each question. Thus it is the quality of the response that determines which level an answer is achieved rather than the quantity of statements contained within it. However, once assigned to a level the mark achieved within that level is determined by the number of points made. Levels 1 and 2 are distinguished by whether statements are simple (level 1) or developed/elaborated (level 2). A candidate can immediately enter L2 by making developed points without making any L1 statements. In order to achieve L3 a candidate must have already reached the top end of L2 – in addition his/her answer should have a clear example and if the answer is place specific as well (7 marks). Highlight place specific detail. Where statements are assigned levels by the examiner this should be indicated by the use of L1 and L2 next to the statements. Ticks should not be used on answers that are marked using levels of response marking. L1 annotation should be removed once a L2 is awarded for an answer. L3 annotation is not used. There is no need for a summary level at the end of a response. Summary: Level 1 (1 to 3 marks): 1 simple statement (1 mark) 2 simple statements (2 marks) 3 simple statements (3 marks) Level 2 (4 to 6 marks): 1 developed statement (4 marks) 2 developed statements (5 marks) 3 or more developed statements with e.g. (6 marks) Level 3 (7 marks) 3 or more developed statements + named example with at least one piece of place specific detail.
Mark scheme, page 4
0460/13 Cambridge IGCSE – Mark Scheme PUBLISHED October/November 2018 © UCLES 2018 Page 4 of 16 Question Answer Marks 1(a)(i) How closely together people live 1 1(a)(ii) 167 000 divided by 616 (1 mark) = 271/271.1/271.103 (1 mark) 2 @ 1 mark 2 1(a)(iii) Puerto Rico Puerto Rico Barbados 3 @ 1 mark 3 1(a)(iv) Ideas such as differences in: Accessibility/airport/port; Resource availability/minerals etc.; Relief; Employment; Soil fertility/good for agriculture Tourism/industry (land use function idea) Migration etc. 4 @ 1 mark 4 1(b)(i) Ideas such as: Widely spread; Unevenly spread Many in high latitudes/polar areas/Arctic; Around tropics/Tropic of Capricorn/Cancer; Northern North America/North(ern) Asia/Australasia/north Africa/North Europe/Central/Southern South America; NOTE Max 2 marks for any two. Northern hemisphere; 3 @ 1 mark 3 1(b)(ii) Sparse/don’t live in deserts/where too dry/live where plenty of rain; Sparse/don’t live where too cold/live in temperate/moderate areas; As they are unable to be able to grow crops; (Cold so) It is difficult to build houses; (Cold so) It is difficult to build transport routes; Suffer from dehydration/heat stroke; Suffer from frostbite ; Diseases such as malaria; 5 @ 1 mark or development 5
Mark scheme, page 5
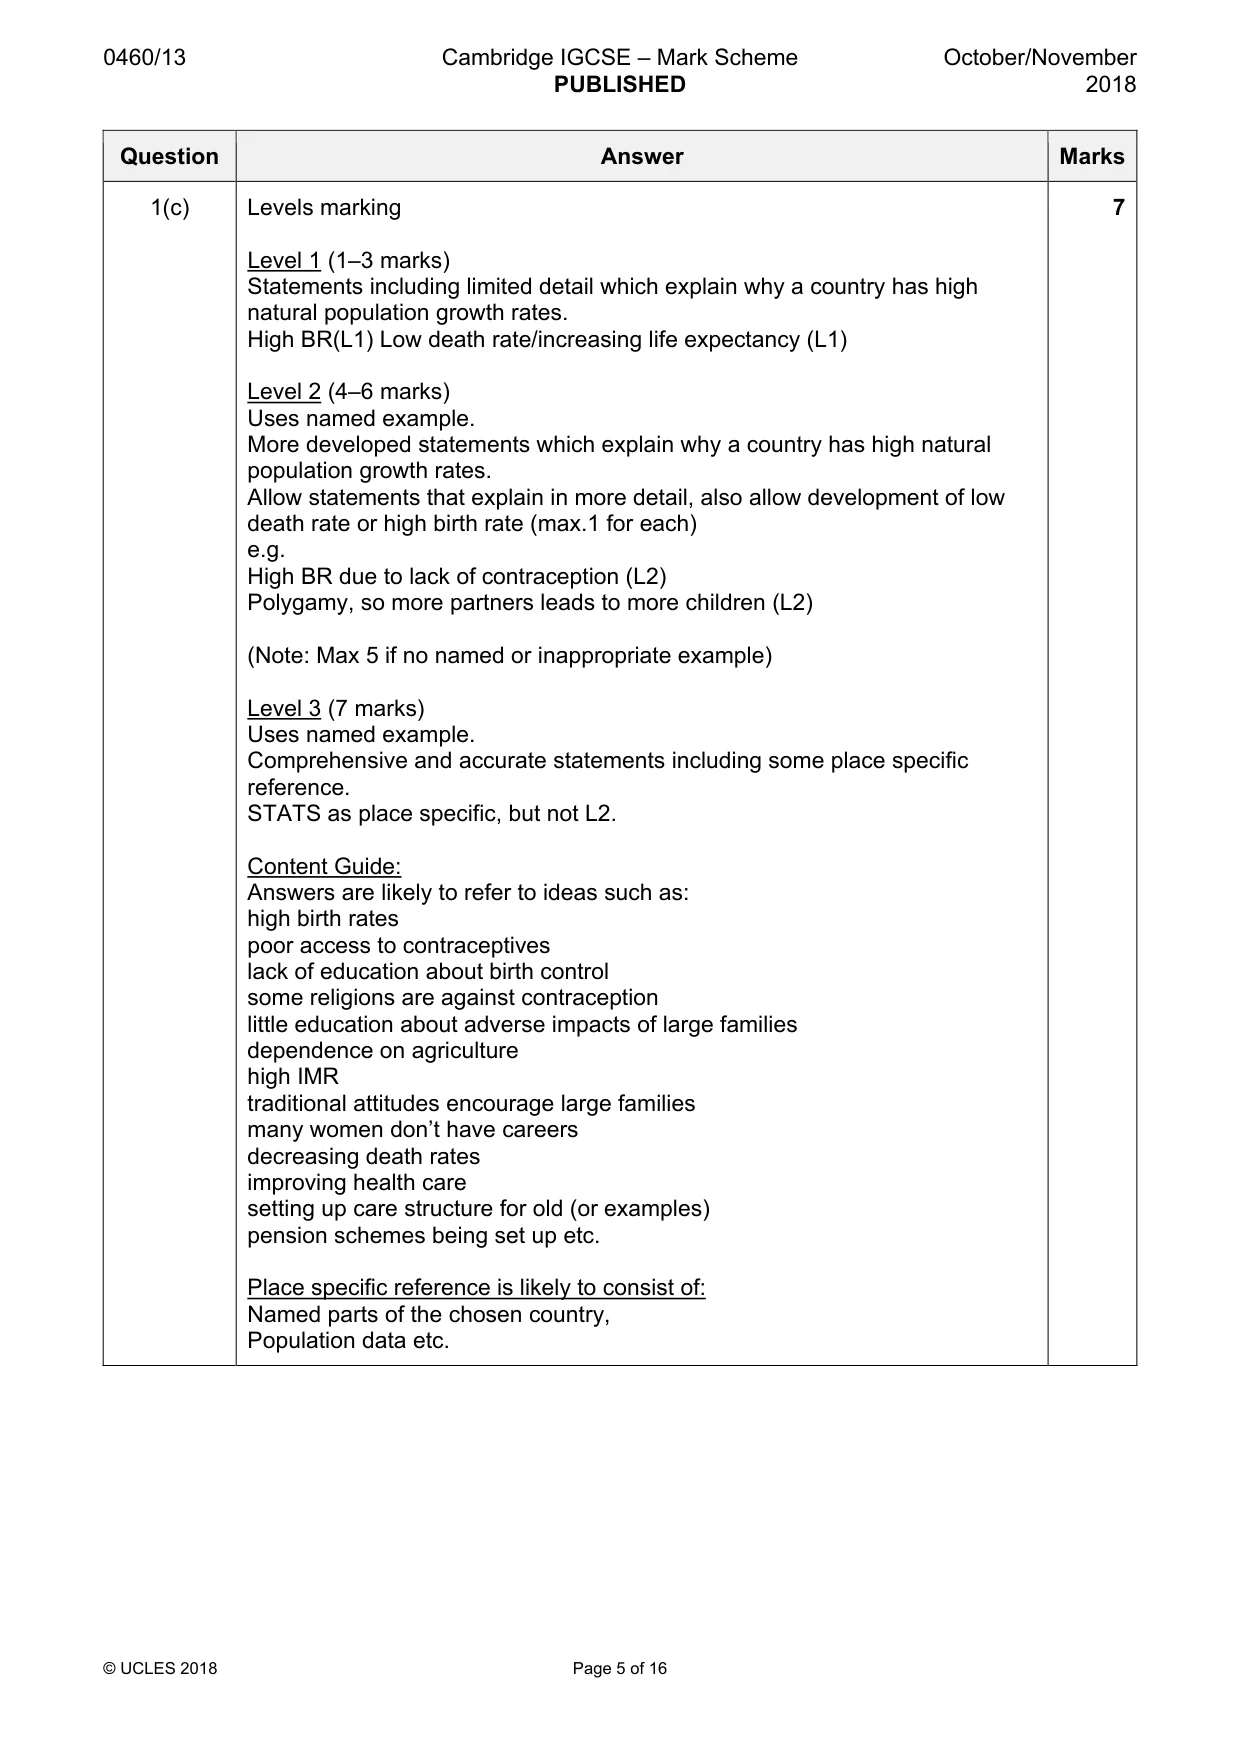
0460/13 Cambridge IGCSE – Mark Scheme PUBLISHED October/November 2018 © UCLES 2018 Page 5 of 16 Question Answer Marks 1(c) Levels marking Level 1 (1–3 marks) Statements including limited detail which explain why a country has high natural population growth rates. High BR(L1) Low death rate/increasing life expectancy (L1) Level 2 (4–6 marks) Uses named example. More developed statements which explain why a country has high natural population growth rates. Allow statements that explain in more detail, also allow development of low death rate or high birth rate (max.1 for each) e.g. High BR due to lack of contraception (L2) Polygamy, so more partners leads to more children (L2) (Note: Max 5 if no named or inappropriate example) Level 3 (7 marks) Uses named example. Comprehensive and accurate statements including some place specific reference. STATS as place specific, but not L2. Content Guide: Answers are likely to refer to ideas such as: high birth rates poor access to contraceptives lack of education about birth control some religions are against contraception little education about adverse impacts of large families dependence on agriculture high IMR traditional attitudes encourage large families many women don’t have careers decreasing death rates improving health care setting up care structure for old (or examples) pension schemes being set up etc. Place specific reference is likely to consist of: Named parts of the chosen country, Population data etc. 7
Mark scheme, page 6
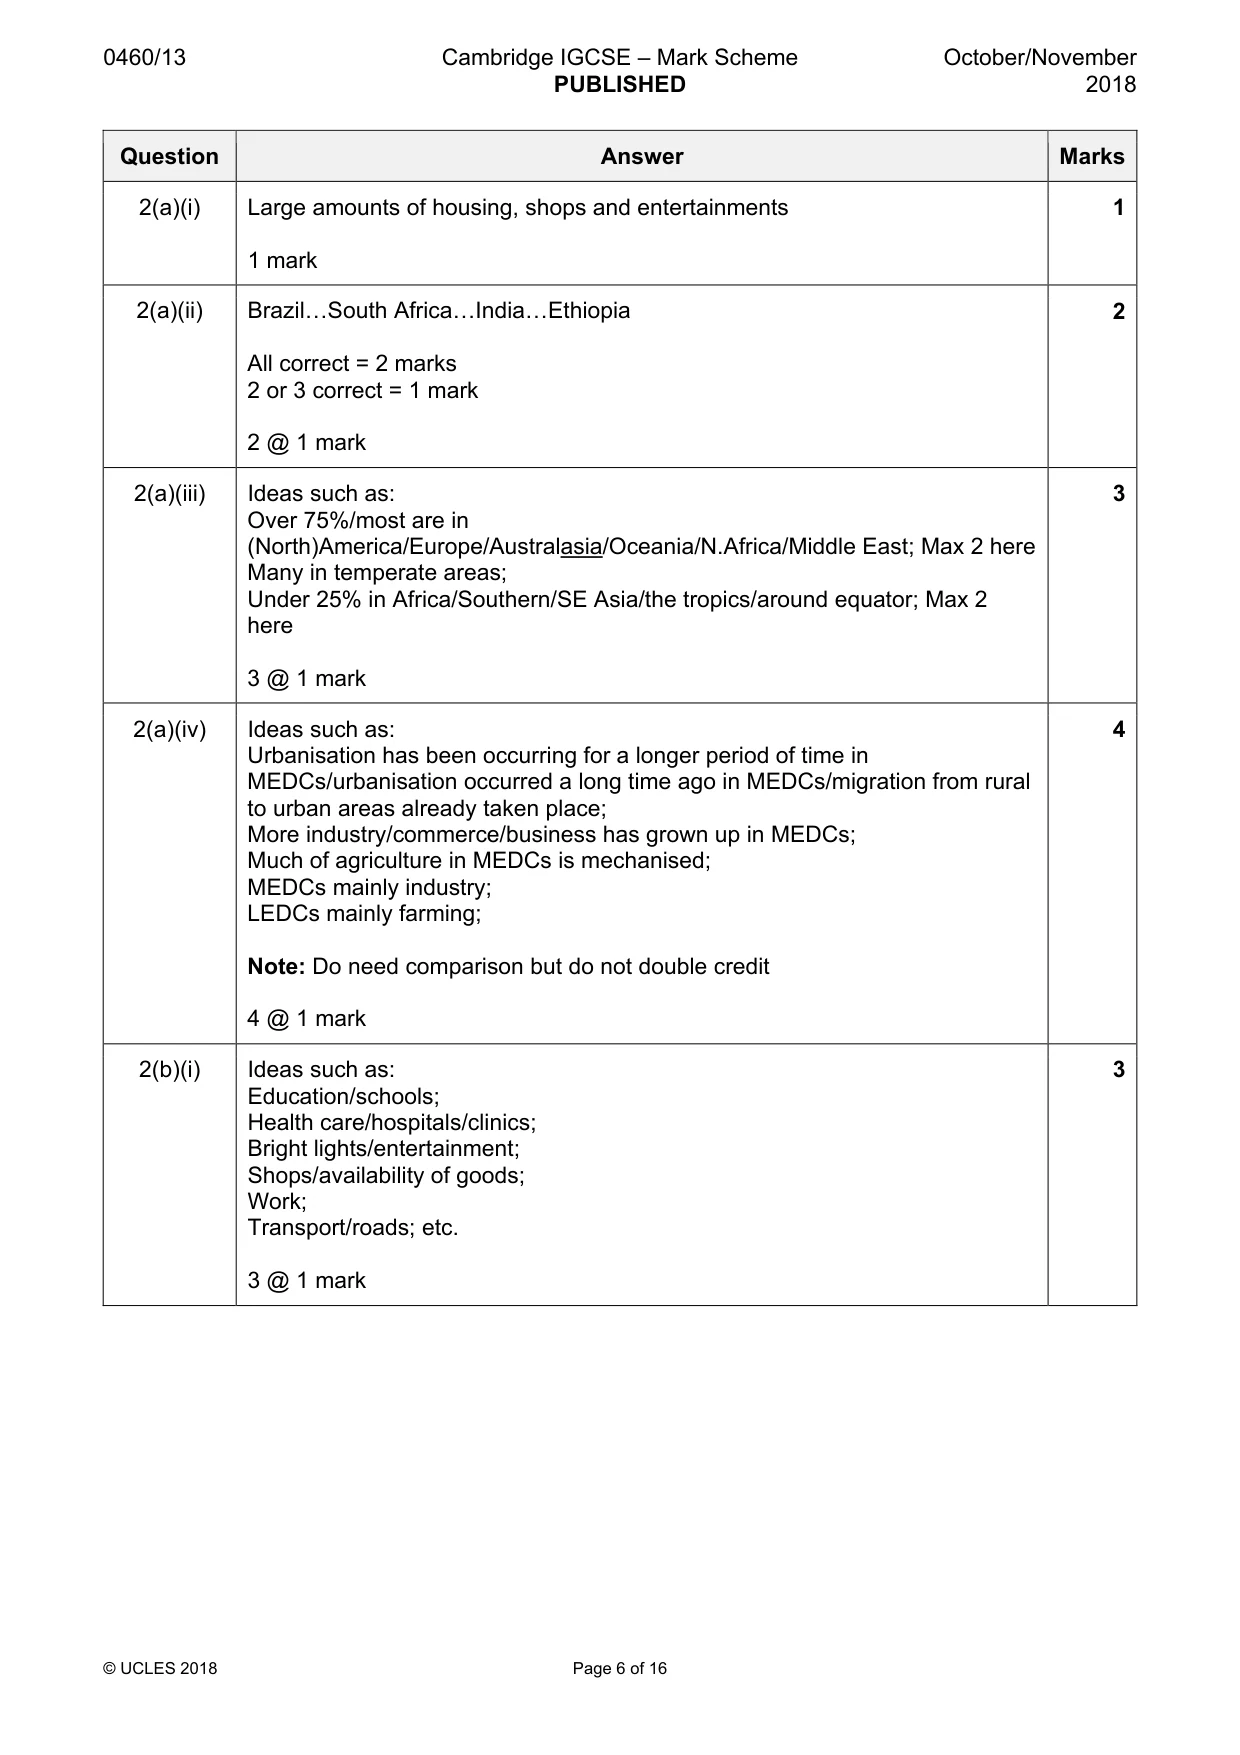
0460/13 Cambridge IGCSE – Mark Scheme PUBLISHED October/November 2018 © UCLES 2018 Page 6 of 16 Question Answer Marks 2(a)(i) Large amounts of housing, shops and entertainments 1 mark 1 2(a)(ii) Brazil«South Africa«India«Ethiopia All correct = 2 marks 2 or 3 correct = 1 mark 2 @ 1 mark 2 2(a)(iii) Ideas such as: Over 75%/most are in (North)America/Europe/Australasia/Oceania/N.Africa/Middle East; Max 2 here Many in temperate areas; Under 25% in Africa/Southern/SE Asia/the tropics/around equator; Max 2 here 3 @ 1 mark 3 2(a)(iv) Ideas such as: Urbanisation has been occurring for a longer period of time in MEDCs/urbanisation occurred a long time ago in MEDCs/migration from rural to urban areas already taken place; More industry/commerce/business has grown up in MEDCs; Much of agriculture in MEDCs is mechanised; MEDCs mainly industry; LEDCs mainly farming; Note: Do need comparison but do not double credit 4 @ 1 mark 4 2(b)(i) Ideas such as: Education/schools; Health care/hospitals/clinics; Bright lights/entertainment; Shops/availability of goods; Work; Transport/roads; etc. 3 @ 1 mark 3
Mark scheme, page 7
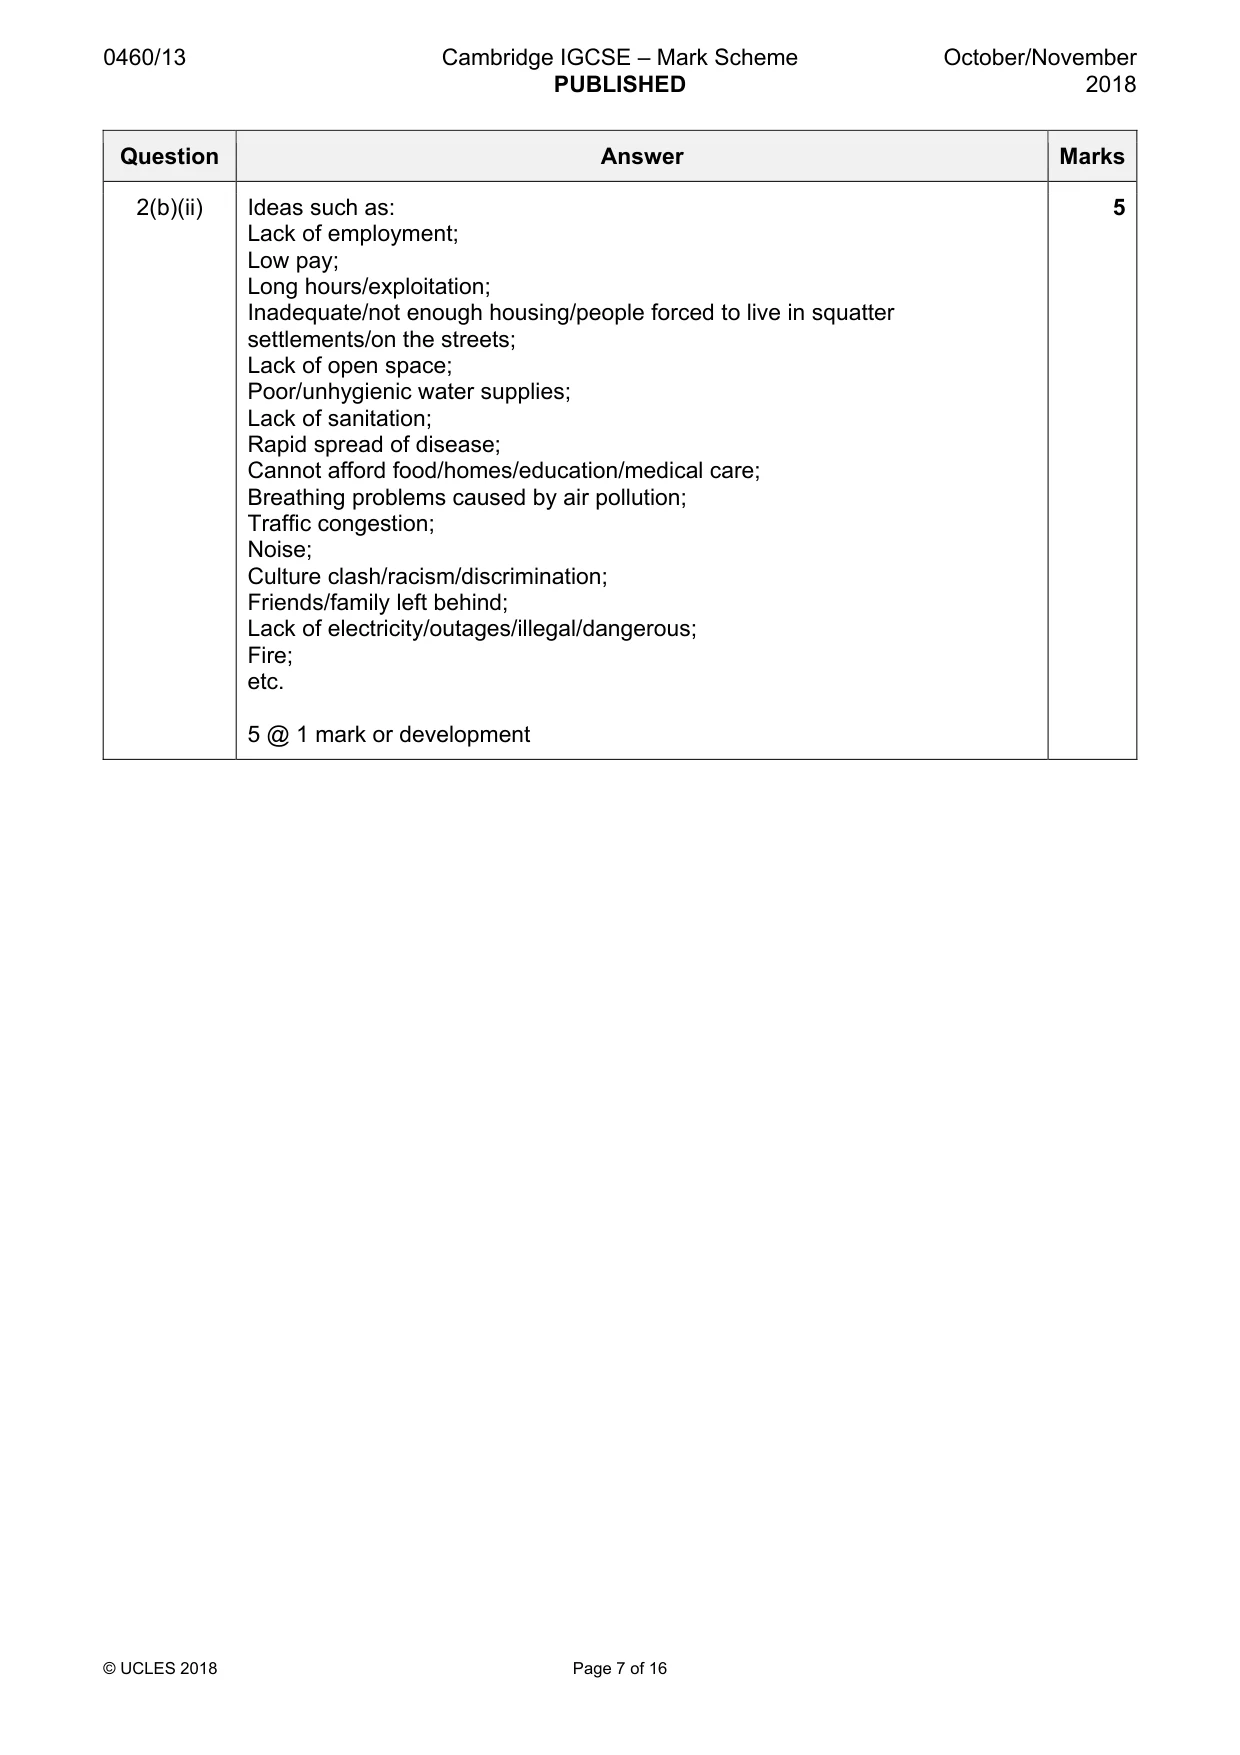
0460/13 Cambridge IGCSE – Mark Scheme PUBLISHED October/November 2018 © UCLES 2018 Page 7 of 16 Question Answer Marks 2(b)(ii) Ideas such as: Lack of employment; Low pay; Long hours/exploitation; Inadequate/not enough housing/people forced to live in squatter settlements/on the streets; Lack of open space; Poor/unhygienic water supplies; Lack of sanitation; Rapid spread of disease; Cannot afford food/homes/education/medical care; Breathing problems caused by air pollution; Traffic congestion; Noise; Culture clash/racism/discrimination; Friends/family left behind; Lack of electricity/outages/illegal/dangerous; Fire; etc. 5 @ 1 mark or development 5
Mark scheme, page 8
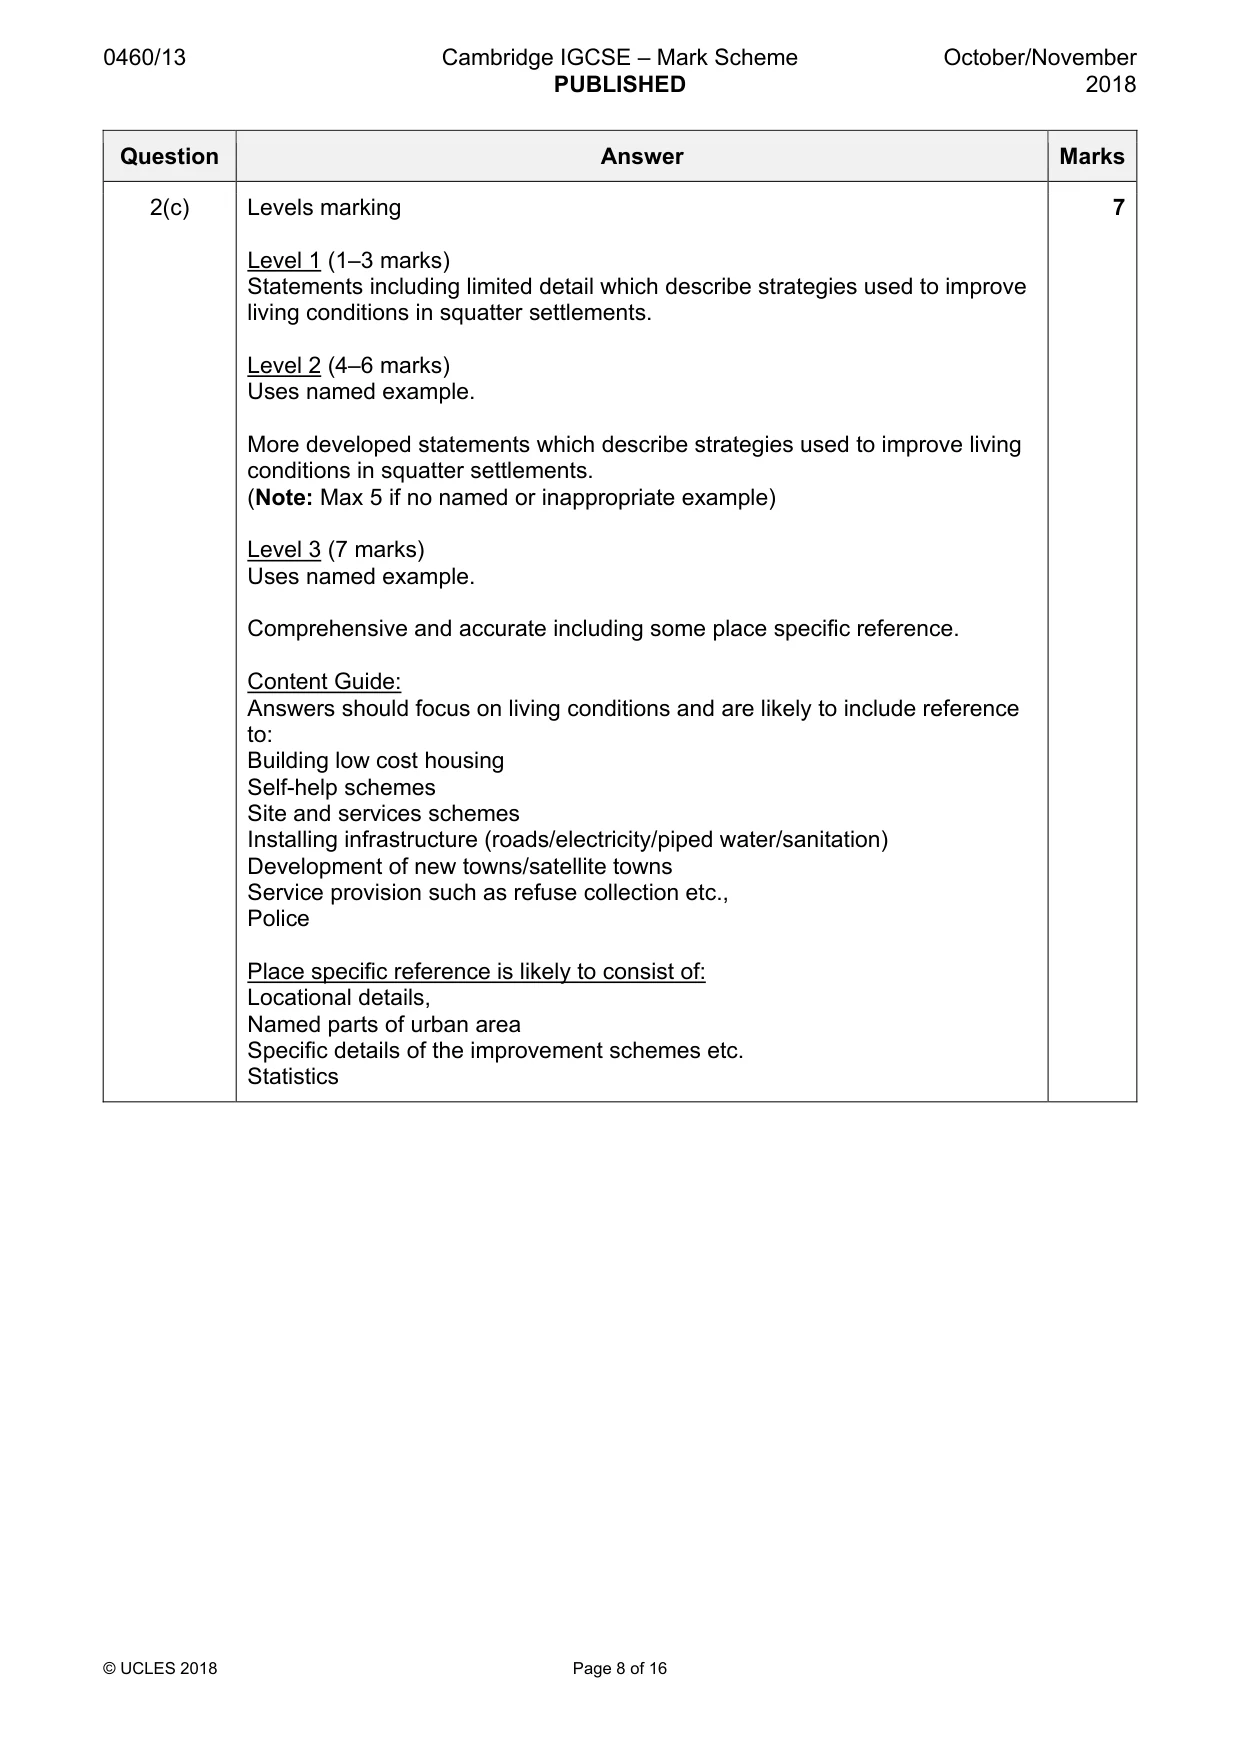
0460/13 Cambridge IGCSE – Mark Scheme PUBLISHED October/November 2018 © UCLES 2018 Page 8 of 16 Question Answer Marks 2(c) Levels marking Level 1 (1–3 marks) Statements including limited detail which describe strategies used to improve living conditions in squatter settlements. Level 2 (4–6 marks) Uses named example. More developed statements which describe strategies used to improve living conditions in squatter settlements. (Note: Max 5 if no named or inappropriate example) Level 3 (7 marks) Uses named example. Comprehensive and accurate including some place specific reference. Content Guide: Answers should focus on living conditions and are likely to include reference to: Building low cost housing Self-help schemes Site and services schemes Installing infrastructure (roads/electricity/piped water/sanitation) Development of new towns/satellite towns Service provision such as refuse collection etc., Police Place specific reference is likely to consist of: Locational details, Named parts of urban area Specific details of the improvement schemes etc. Statistics 7
Mark scheme, page 9
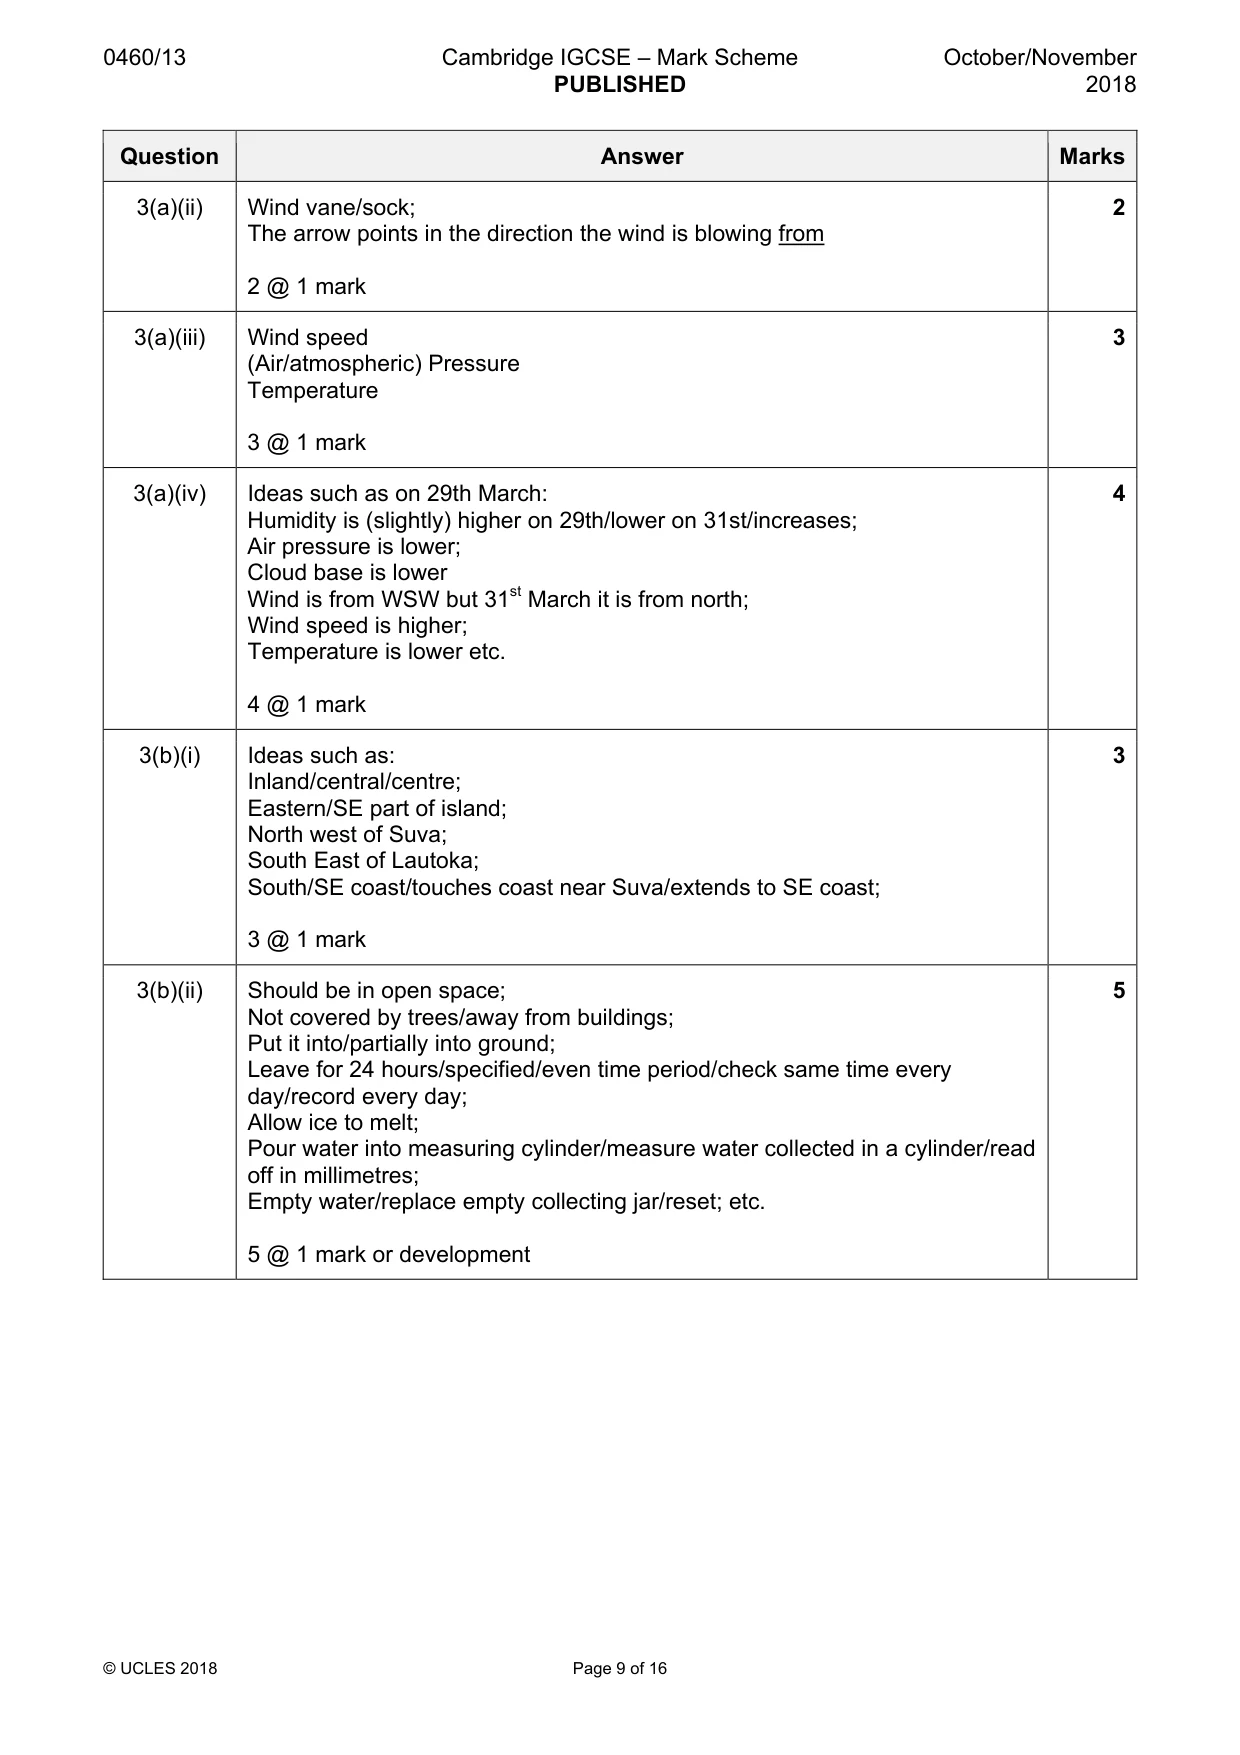
0460/13 Cambridge IGCSE – Mark Scheme PUBLISHED October/November 2018 © UCLES 2018 Page 9 of 16 Question Answer Marks 3(a)(ii) Wind vane/sock; The arrow points in the direction the wind is blowing from 2 @ 1 mark 2 3(a)(iii) Wind speed (Air/atmospheric) Pressure Temperature 3 @ 1 mark 3 3(a)(iv) Ideas such as on 29th March: Humidity is (slightly) higher on 29th/lower on 31st/increases; Air pressure is lower; Cloud base is lower Wind is from WSW but 31st March it is from north; Wind speed is higher; Temperature is lower etc. 4 @ 1 mark 4 3(b)(i) Ideas such as: Inland/central/centre; Eastern/SE part of island; North west of Suva; South East of Lautoka; South/SE coast/touches coast near Suva/extends to SE coast; 3 @ 1 mark 3 3(b)(ii) Should be in open space; Not covered by trees/away from buildings; Put it into/partially into ground; Leave for 24 hours/specified/even time period/check same time every day/record every day; Allow ice to melt; Pour water into measuring cylinder/measure water collected in a cylinder/read off in millimetres; Empty water/replace empty collecting jar/reset; etc. 5 @ 1 mark or development 5
Mark scheme, page 10
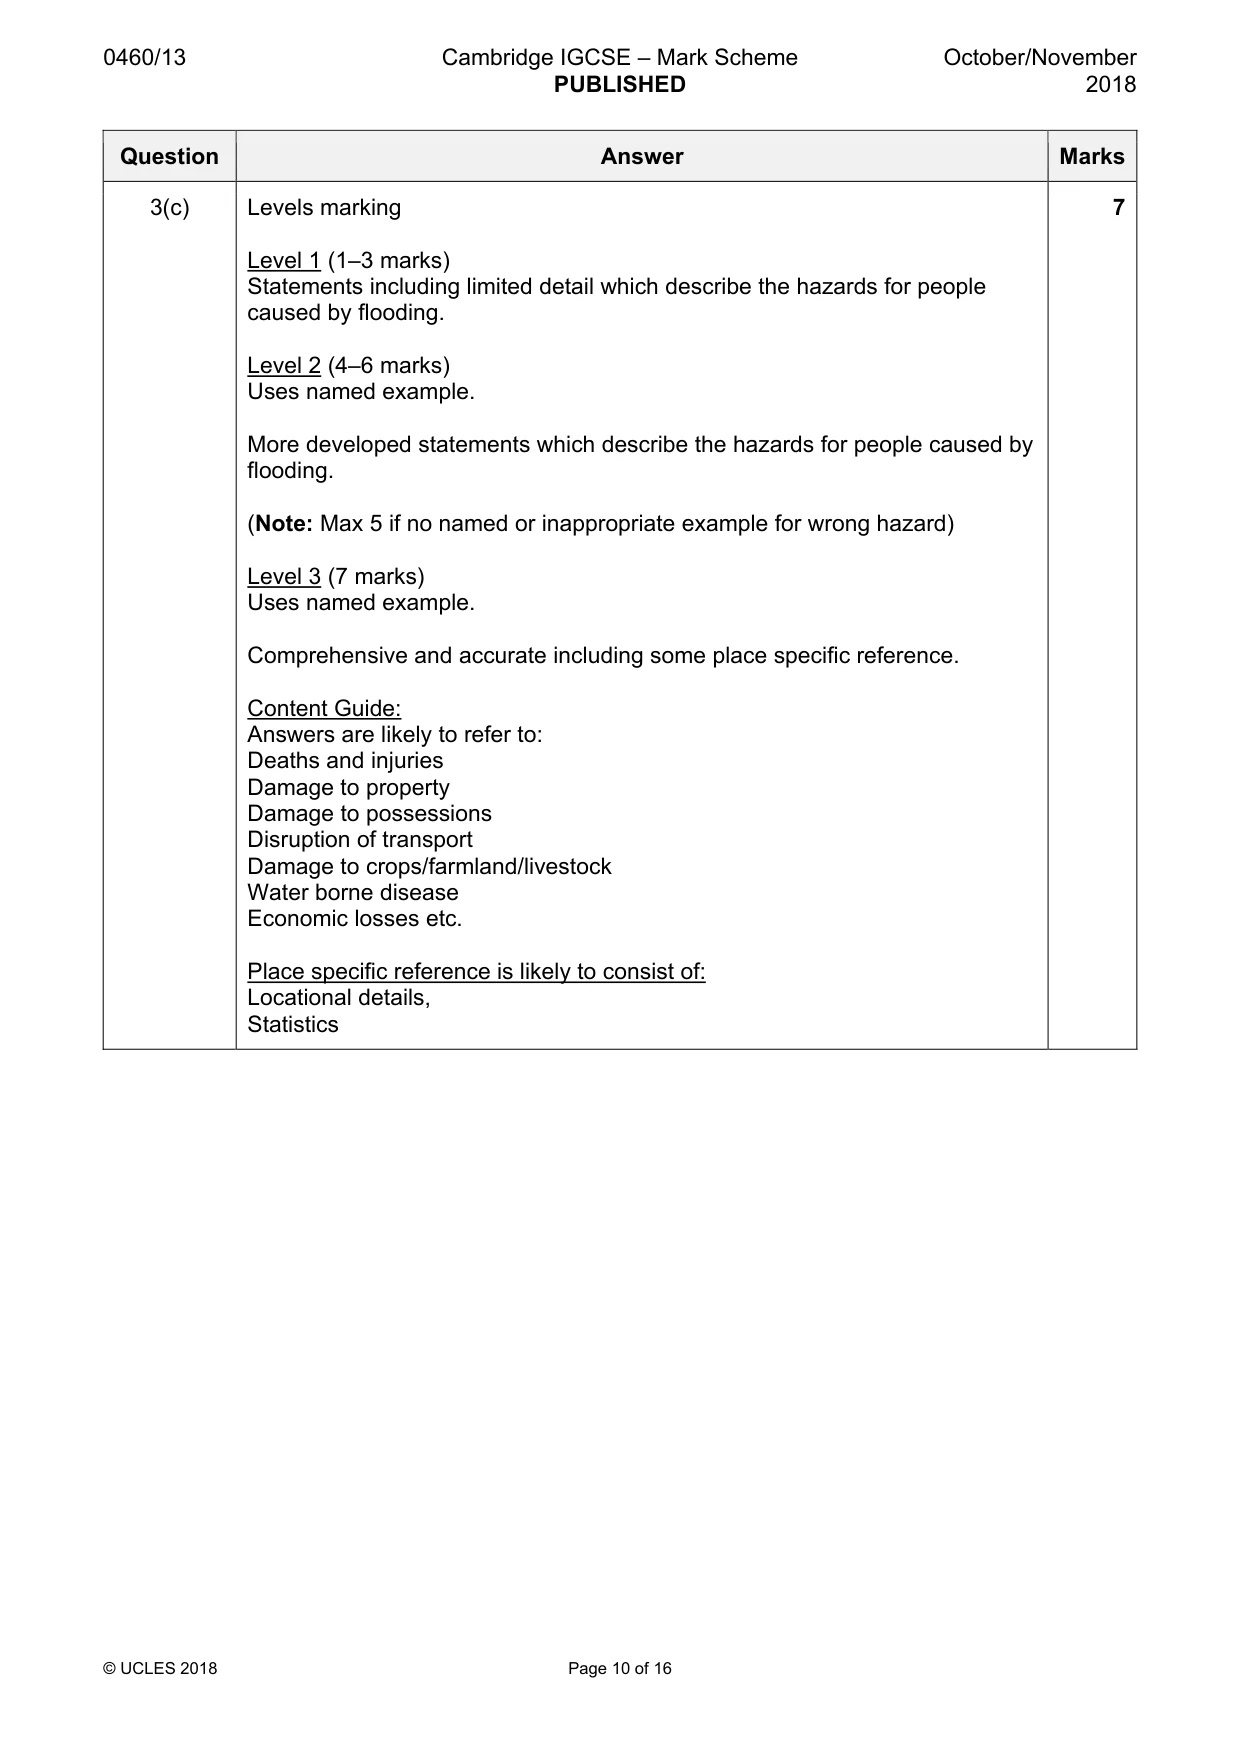
0460/13 Cambridge IGCSE – Mark Scheme PUBLISHED October/November 2018 © UCLES 2018 Page 10 of 16 Question Answer Marks 3(c) Levels marking Level 1 (1–3 marks) Statements including limited detail which describe the hazards for people caused by flooding. Level 2 (4–6 marks) Uses named example. More developed statements which describe the hazards for people caused by flooding. (Note: Max 5 if no named or inappropriate example for wrong hazard) Level 3 (7 marks) Uses named example. Comprehensive and accurate including some place specific reference. Content Guide: Answers are likely to refer to: Deaths and injuries Damage to property Damage to possessions Disruption of transport Damage to crops/farmland/livestock Water borne disease Economic losses etc. Place specific reference is likely to consist of: Locational details, Statistics 7
Mark scheme, page 11
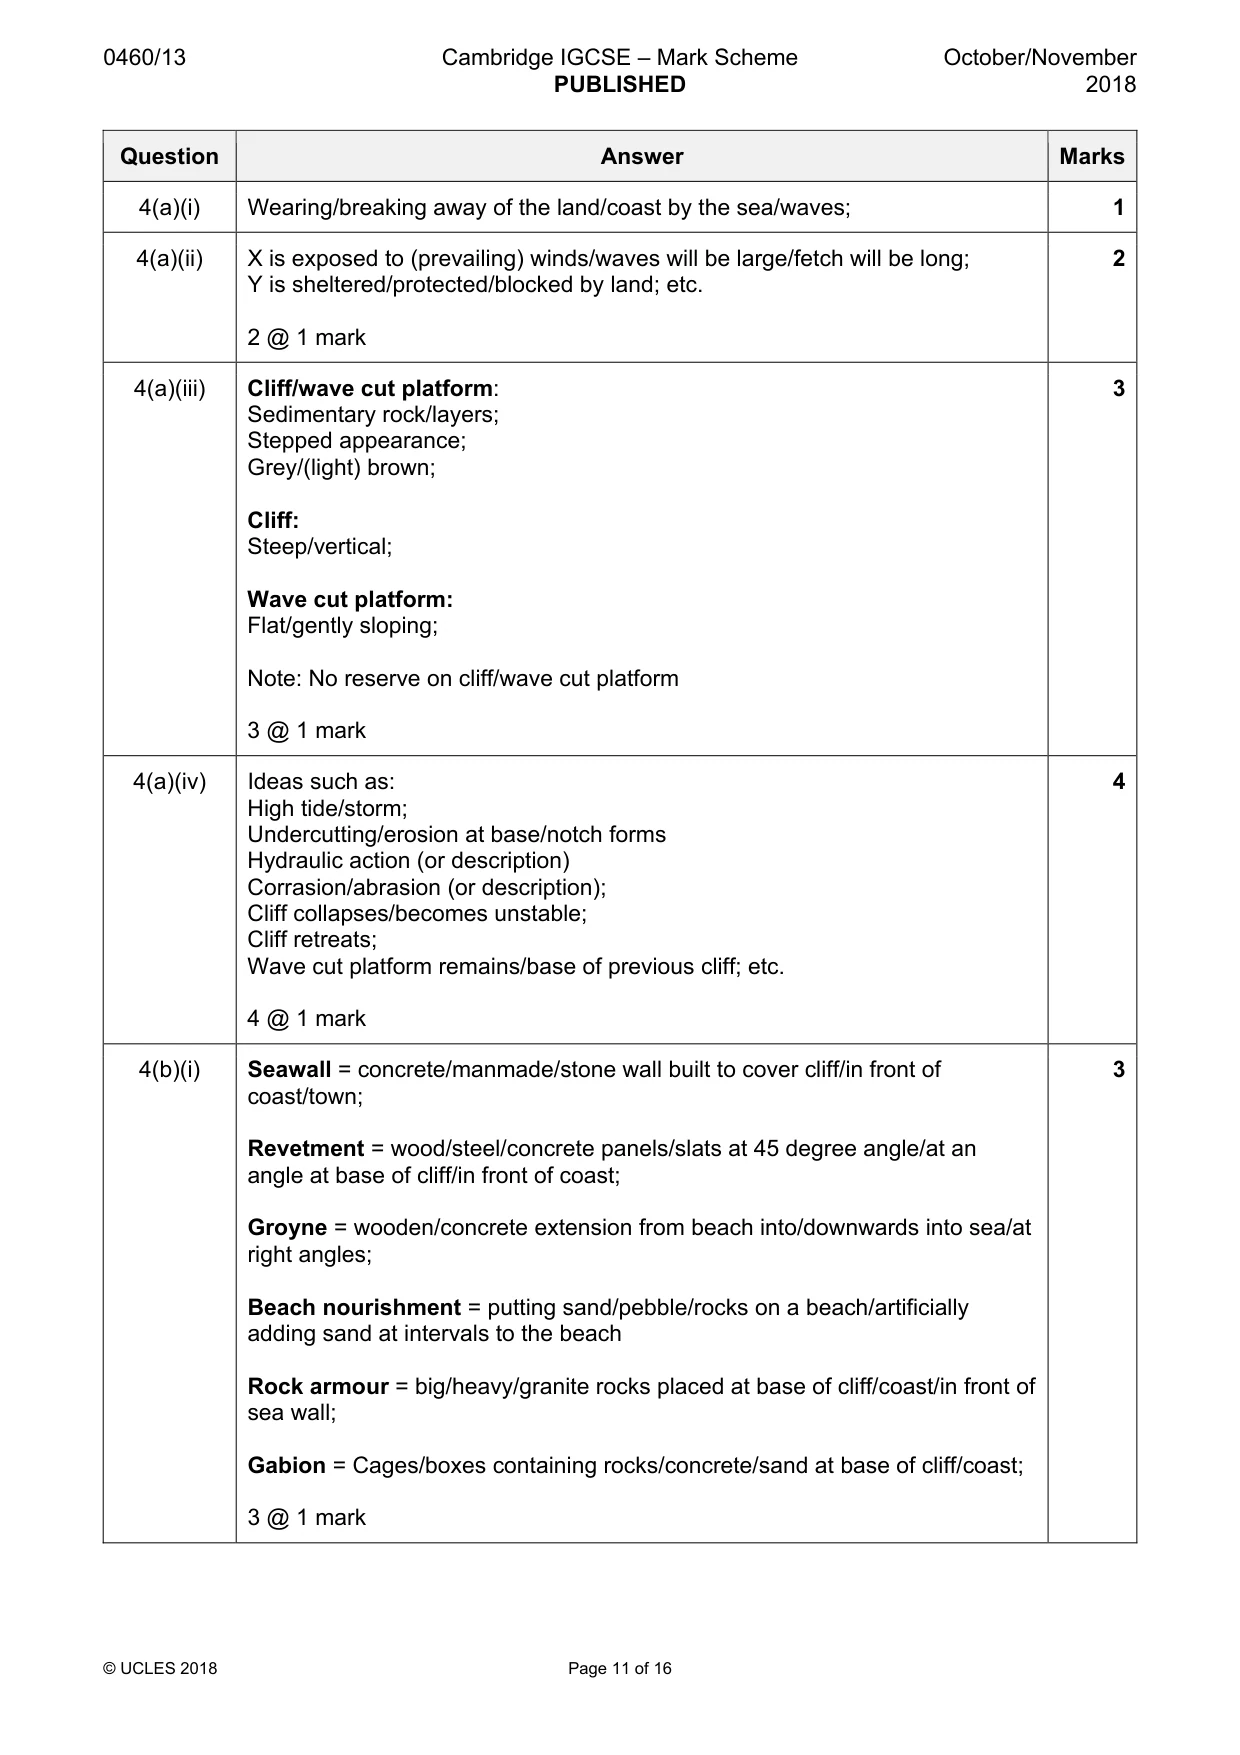
0460/13 Cambridge IGCSE – Mark Scheme PUBLISHED October/November 2018 © UCLES 2018 Page 11 of 16 Question Answer Marks 4(a)(i) Wearing/breaking away of the land/coast by the sea/waves; 1 4(a)(ii) X is exposed to (prevailing) winds/waves will be large/fetch will be long; Y is sheltered/protected/blocked by land; etc. 2 @ 1 mark 2 4(a)(iii) Cliff/wave cut platform: Sedimentary rock/layers; Stepped appearance; Grey/(light) brown; Cliff: Steep/vertical; Wave cut platform: Flat/gently sloping; Note: No reserve on cliff/wave cut platform 3 @ 1 mark 3 4(a)(iv) Ideas such as: High tide/storm; Undercutting/erosion at base/notch forms Hydraulic action (or description) Corrasion/abrasion (or description); Cliff collapses/becomes unstable; Cliff retreats; Wave cut platform remains/base of previous cliff; etc. 4 @ 1 mark 4 4(b)(i) Seawall = concrete/manmade/stone wall built to cover cliff/in front of coast/town; Revetment = wood/steel/concrete panels/slats at 45 degree angle/at an angle at base of cliff/in front of coast; Groyne = wooden/concrete extension from beach into/downwards into sea/at right angles; Beach nourishment = putting sand/pebble/rocks on a beach/artificially adding sand at intervals to the beach Rock armour = big/heavy/granite rocks placed at base of cliff/coast/in front of sea wall; Gabion = Cages/boxes containing rocks/concrete/sand at base of cliff/coast; 3 @ 1 mark 3
Mark scheme, page 12
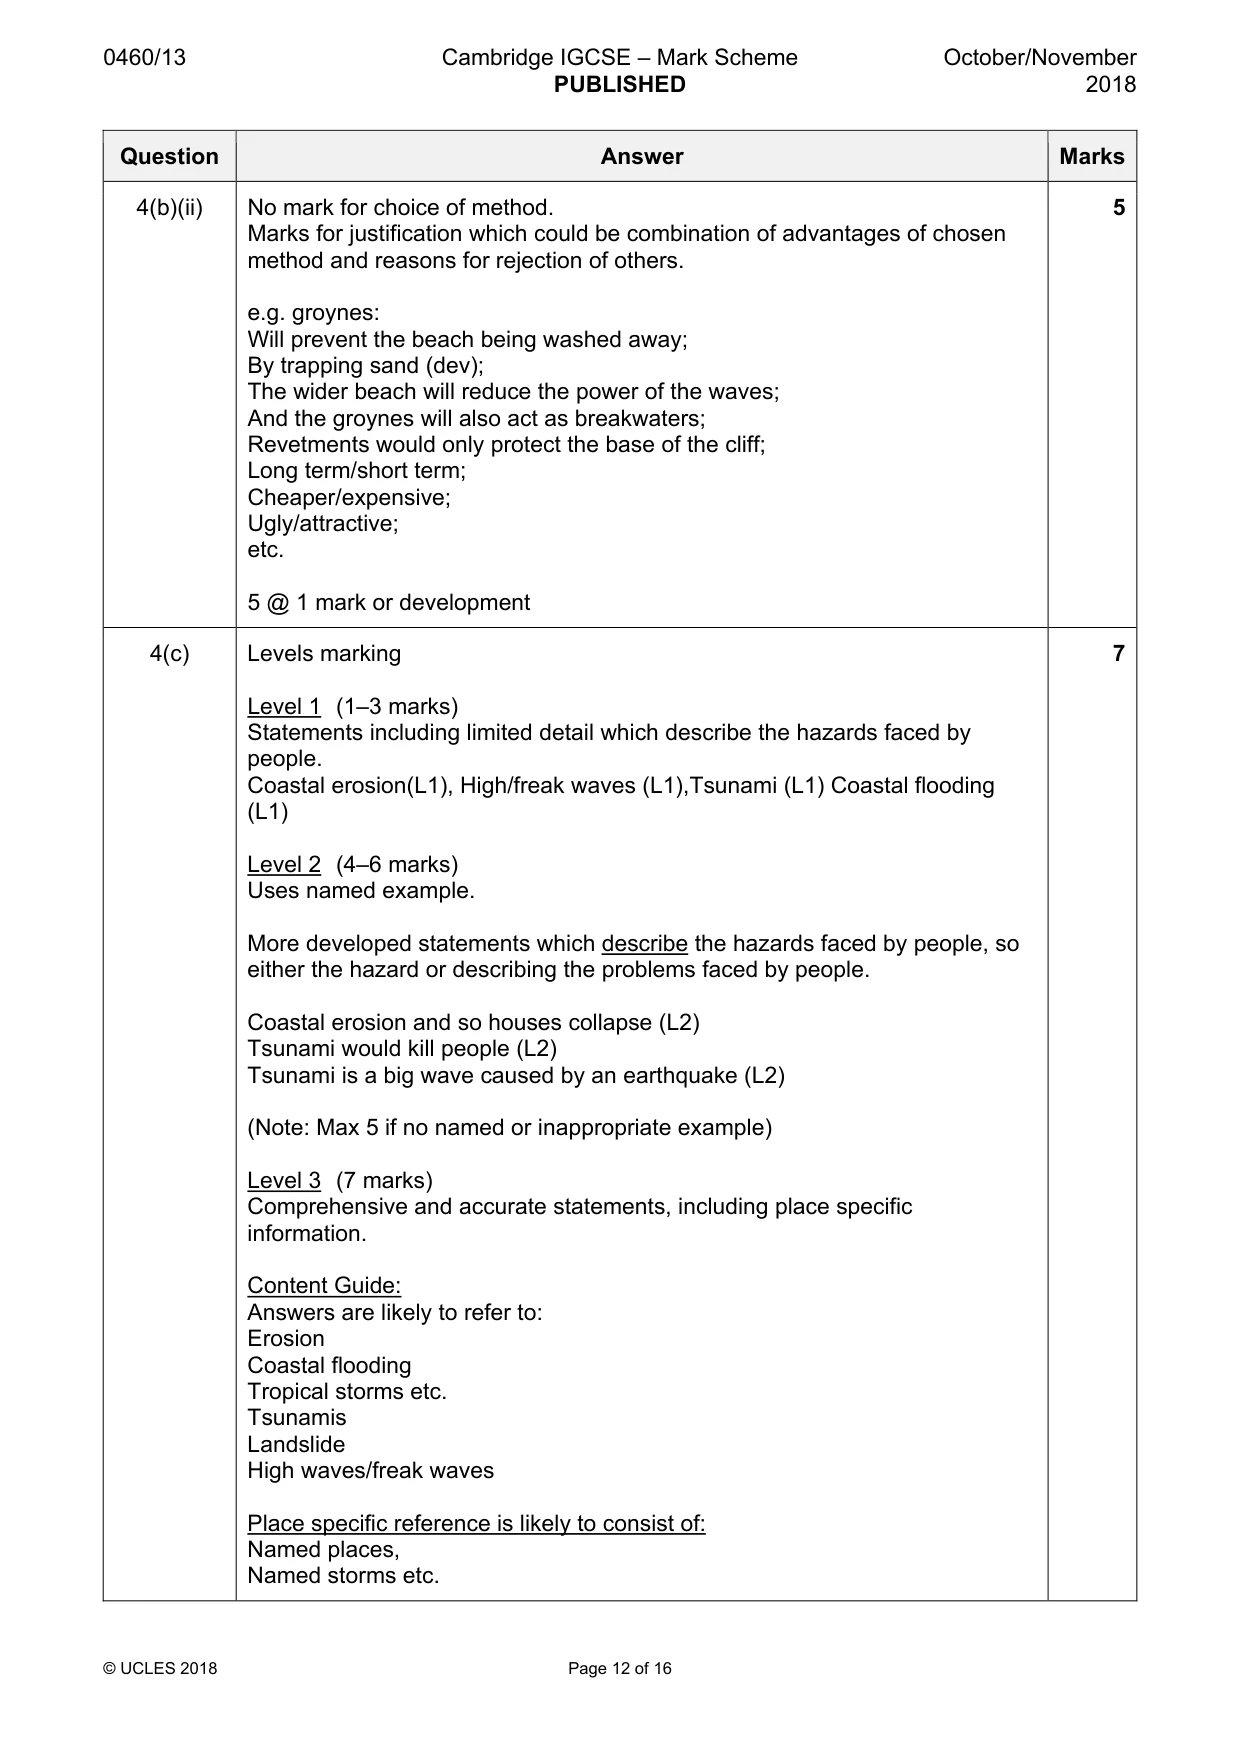
0460/13 Cambridge IGCSE – Mark Scheme PUBLISHED October/November 2018 © UCLES 2018 Page 12 of 16 Question Answer Marks 4(b)(ii) No mark for choice of method. Marks for justification which could be combination of advantages of chosen method and reasons for rejection of others. e.g. groynes: Will prevent the beach being washed away; By trapping sand (dev); The wider beach will reduce the power of the waves; And the groynes will also act as breakwaters; Revetments would only protect the base of the cliff; Long term/short term; Cheaper/expensive; Ugly/attractive; etc. 5 @ 1 mark or development 5 4(c) Levels marking Level 1 (1–3 marks) Statements including limited detail which describe the hazards faced by people. Coastal erosion(L1), High/freak waves (L1),Tsunami (L1) Coastal flooding (L1) Level 2 (4–6 marks) Uses named example. More developed statements which describe the hazards faced by people, so either the hazard or describing the problems faced by people. Coastal erosion and so houses collapse (L2) Tsunami would kill people (L2) Tsunami is a big wave caused by an earthquake (L2) (Note: Max 5 if no named or inappropriate example) Level 3 (7 marks) Comprehensive and accurate statements, including place specific information. Content Guide: Answers are likely to refer to: Erosion Coastal flooding Tropical storms etc. Tsunamis Landslide High waves/freak waves Place specific reference is likely to consist of: Named places, Named storms etc. 7
Mark scheme, page 13
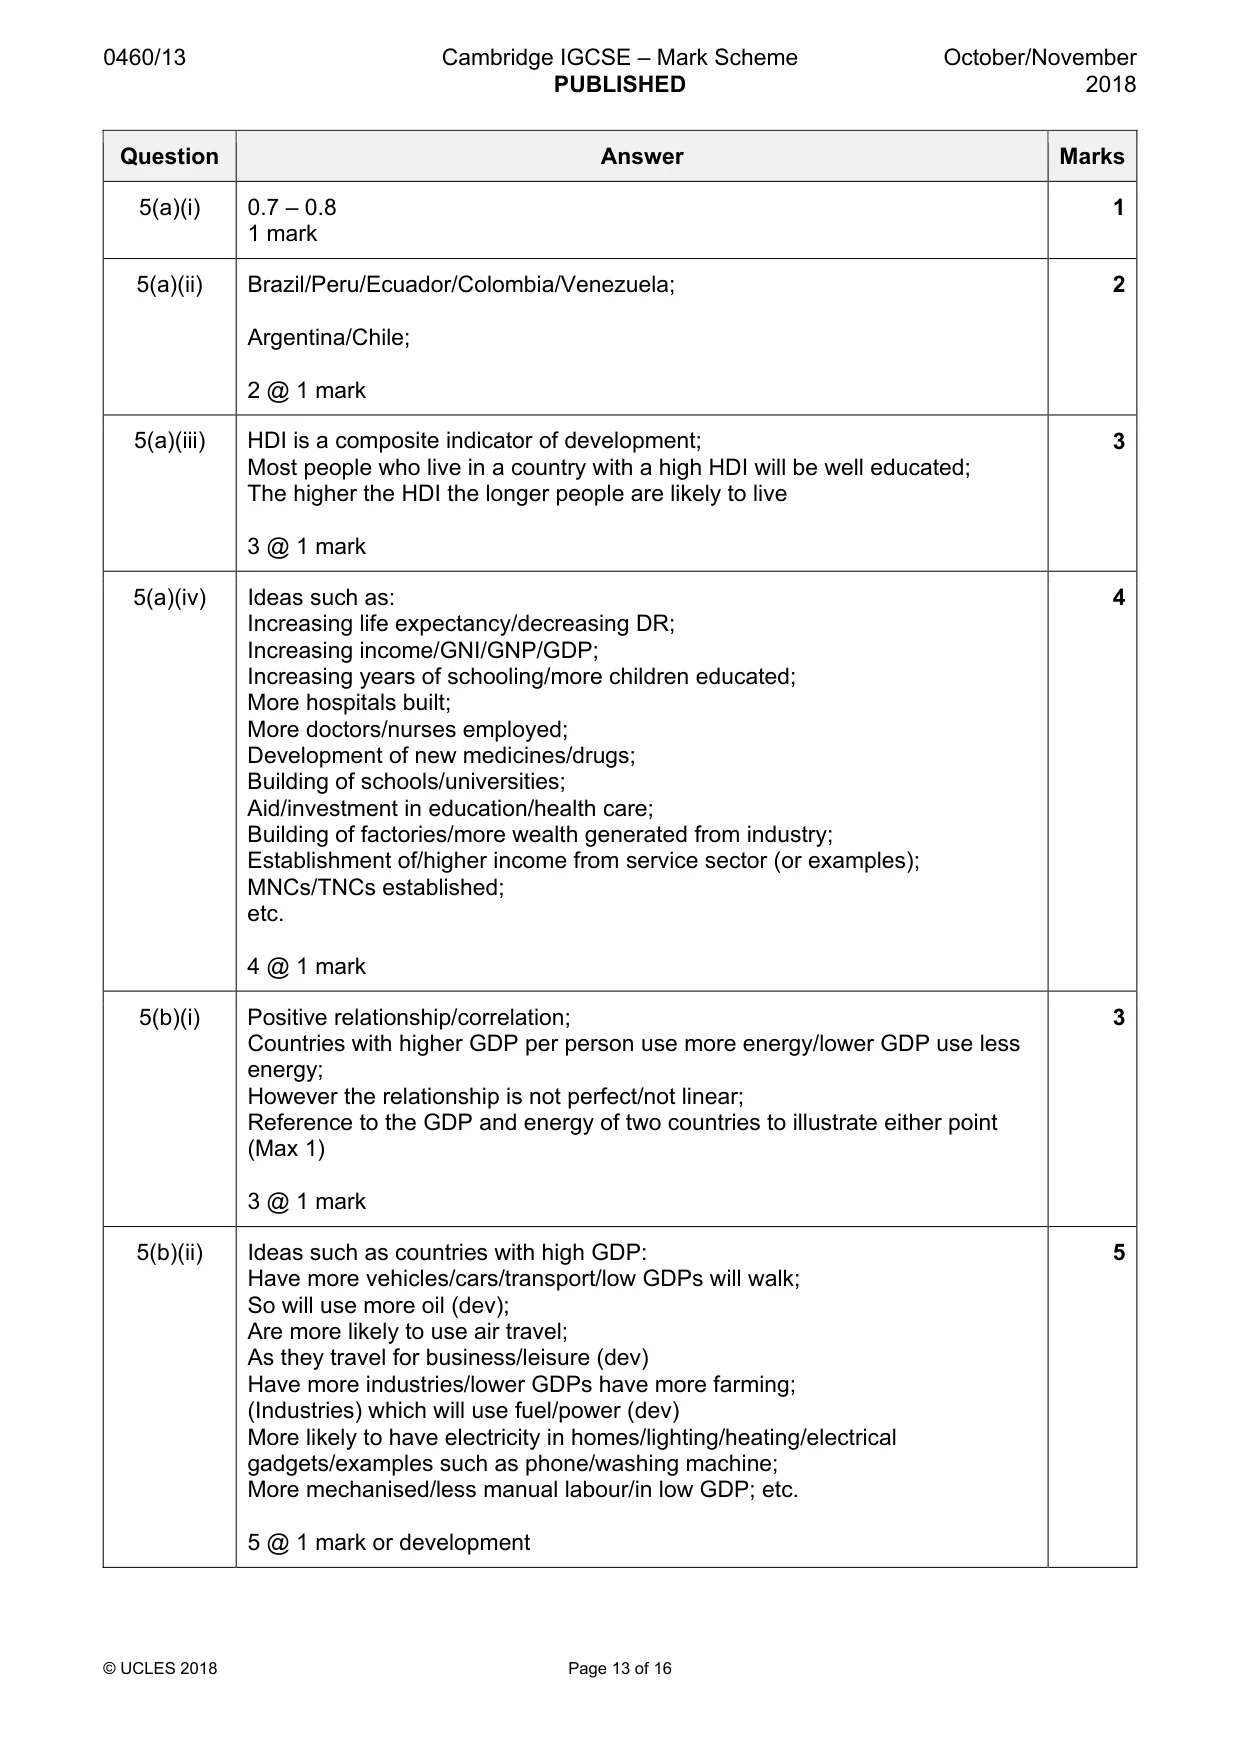
0460/13 Cambridge IGCSE – Mark Scheme PUBLISHED October/November 2018 © UCLES 2018 Page 13 of 16 Question Answer Marks 5(a)(i) 0.7 – 0.8 1 mark 1 5(a)(ii) Brazil/Peru/Ecuador/Colombia/Venezuela; Argentina/Chile; 2 @ 1 mark 2 5(a)(iii) HDI is a composite indicator of development; Most people who live in a country with a high HDI will be well educated; The higher the HDI the longer people are likely to live 3 @ 1 mark 3 5(a)(iv) Ideas such as: Increasing life expectancy/decreasing DR; Increasing income/GNI/GNP/GDP; Increasing years of schooling/more children educated; More hospitals built; More doctors/nurses employed; Development of new medicines/drugs; Building of schools/universities; Aid/investment in education/health care; Building of factories/more wealth generated from industry; Establishment of/higher income from service sector (or examples); MNCs/TNCs established; etc. 4 @ 1 mark 4 5(b)(i) Positive relationship/correlation; Countries with higher GDP per person use more energy/lower GDP use less energy; However the relationship is not perfect/not linear; Reference to the GDP and energy of two countries to illustrate either point (Max 1) 3 @ 1 mark 3 5(b)(ii) Ideas such as countries with high GDP: Have more vehicles/cars/transport/low GDPs will walk; So will use more oil (dev); Are more likely to use air travel; As they travel for business/leisure (dev) Have more industries/lower GDPs have more farming; (Industries) which will use fuel/power (dev) More likely to have electricity in homes/lighting/heating/electrical gadgets/examples such as phone/washing machine; More mechanised/less manual labour/in low GDP; etc. 5 @ 1 mark or development 5
Mark scheme, page 14
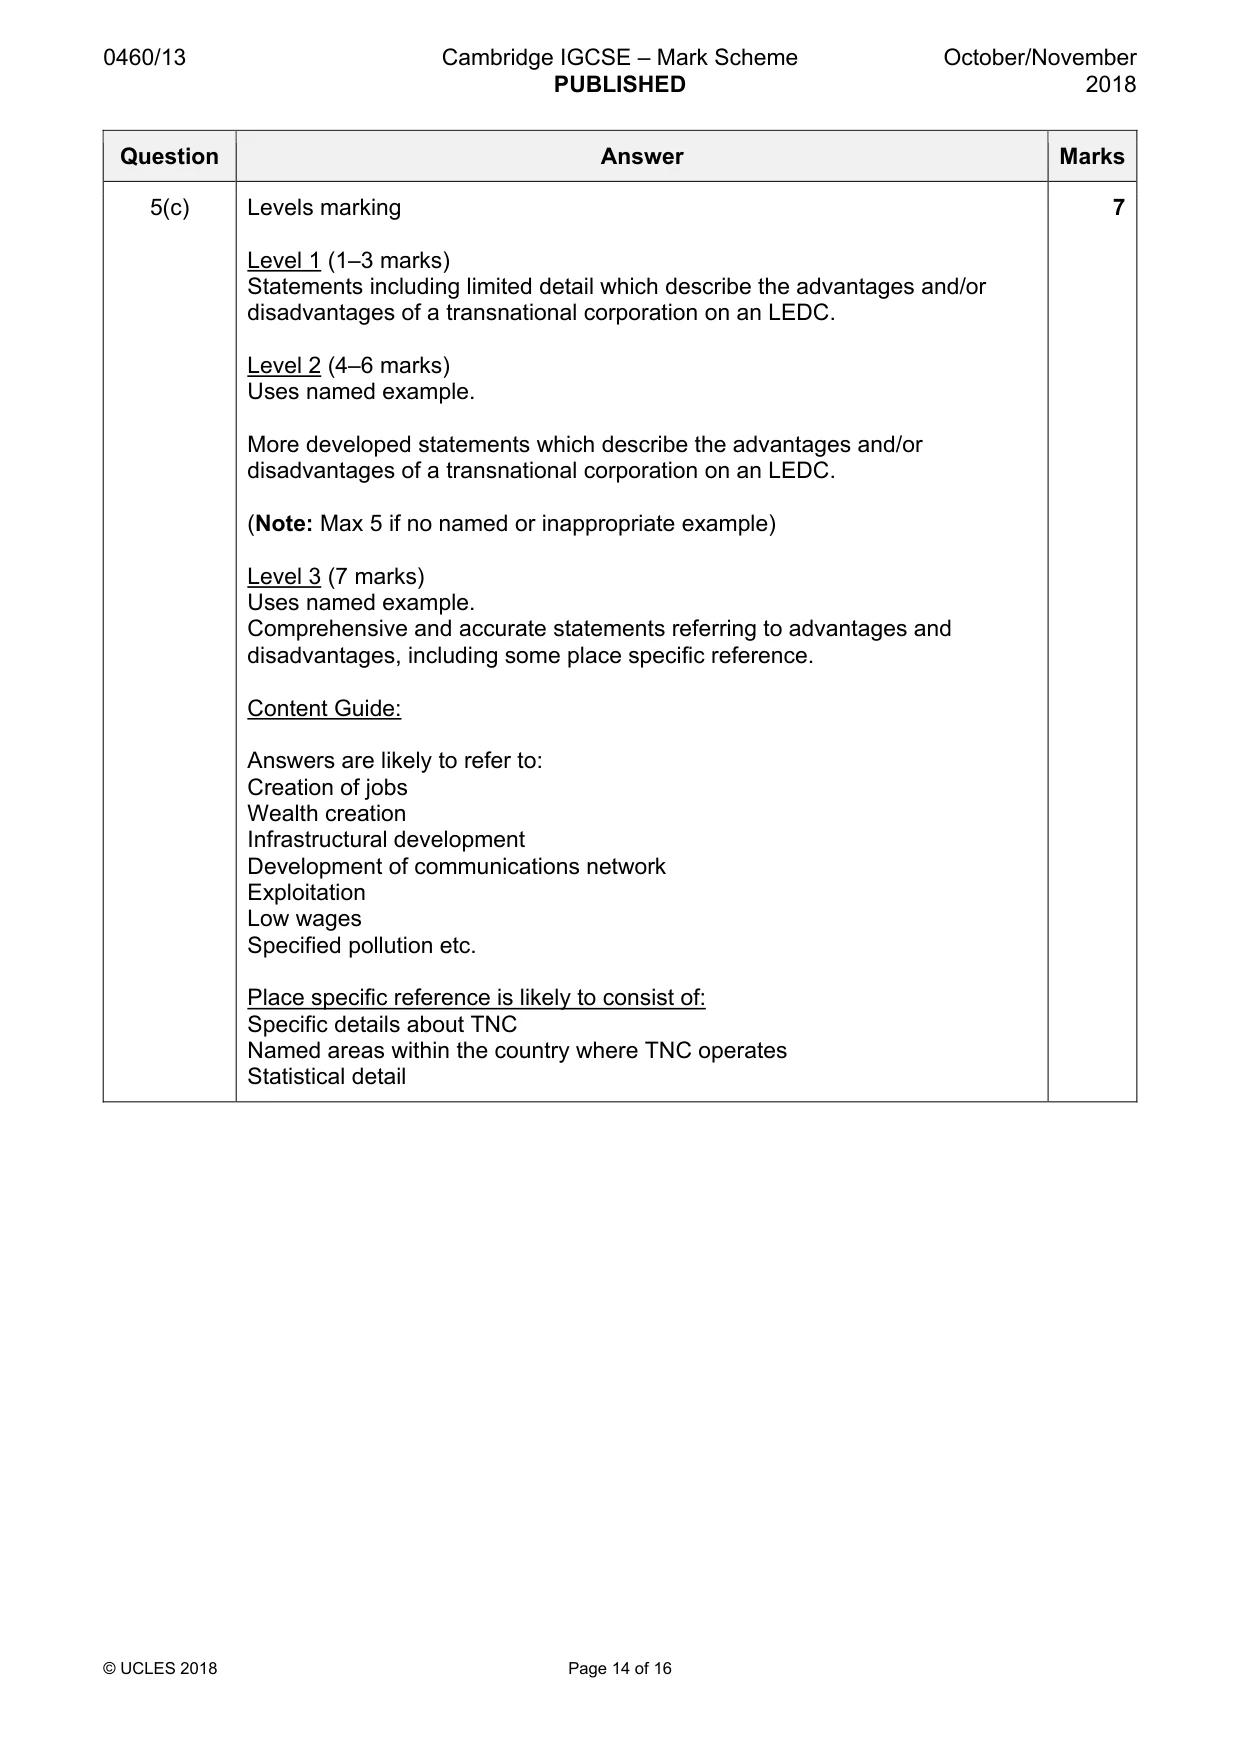
0460/13 Cambridge IGCSE – Mark Scheme PUBLISHED October/November 2018 © UCLES 2018 Page 14 of 16 Question Answer Marks 5(c) Levels marking Level 1 (1–3 marks) Statements including limited detail which describe the advantages and/or disadvantages of a transnational corporation on an LEDC. Level 2 (4–6 marks) Uses named example. More developed statements which describe the advantages and/or disadvantages of a transnational corporation on an LEDC. (Note: Max 5 if no named or inappropriate example) Level 3 (7 marks) Uses named example. Comprehensive and accurate statements referring to advantages and disadvantages, including some place specific reference. Content Guide: Answers are likely to refer to: Creation of jobs Wealth creation Infrastructural development Development of communications network Exploitation Low wages Specified pollution etc. Place specific reference is likely to consist of: Specific details about TNC Named areas within the country where TNC operates Statistical detail 7
Mark scheme, page 15
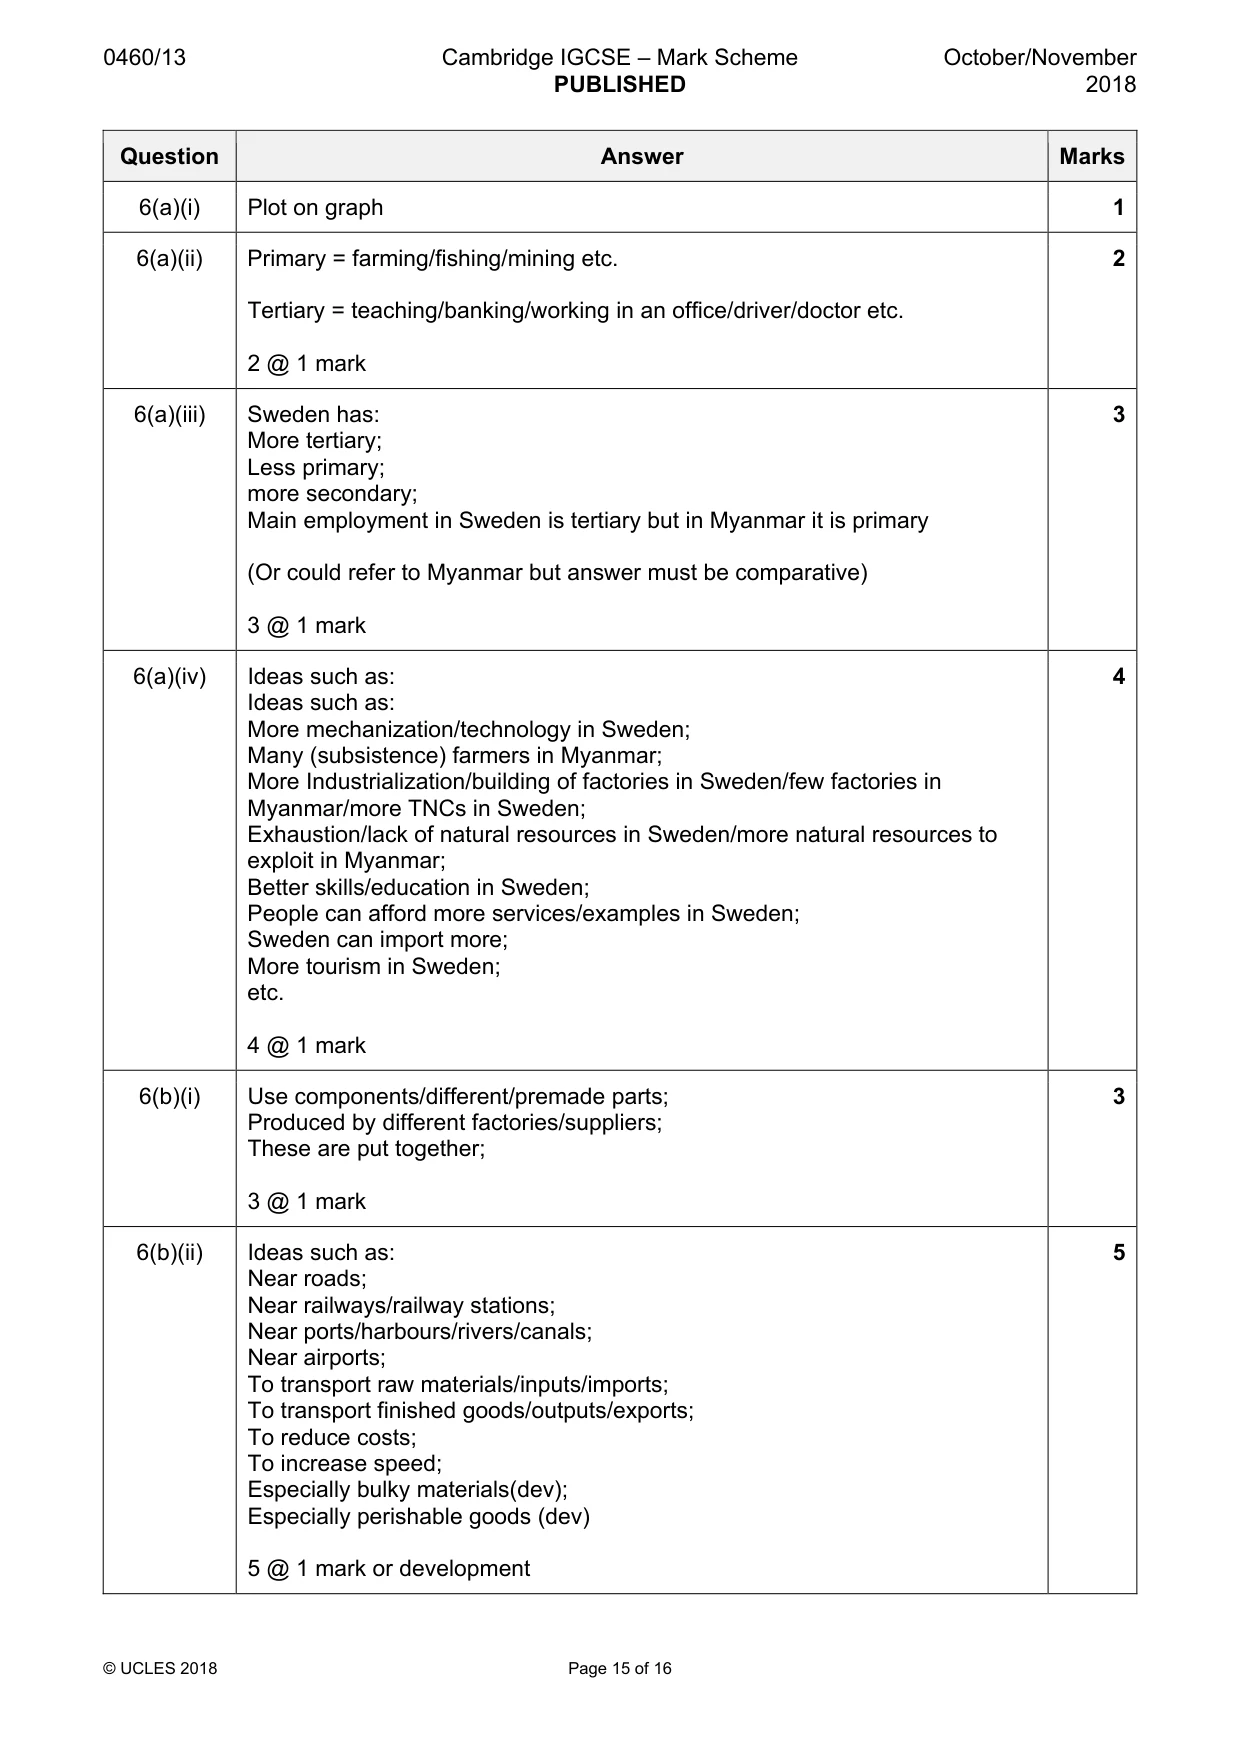
0460/13 Cambridge IGCSE – Mark Scheme PUBLISHED October/November 2018 © UCLES 2018 Page 15 of 16 Question Answer Marks 6(a)(i) Plot on graph 1 6(a)(ii) Primary = farming/fishing/mining etc. Tertiary = teaching/banking/working in an office/driver/doctor etc. 2 @ 1 mark 2 6(a)(iii) Sweden has: More tertiary; Less primary; more secondary; Main employment in Sweden is tertiary but in Myanmar it is primary (Or could refer to Myanmar but answer must be comparative) 3 @ 1 mark 3 6(a)(iv) Ideas such as: Ideas such as: More mechanization/technology in Sweden; Many (subsistence) farmers in Myanmar; More Industrialization/building of factories in Sweden/few factories in Myanmar/more TNCs in Sweden; Exhaustion/lack of natural resources in Sweden/more natural resources to exploit in Myanmar; Better skills/education in Sweden; People can afford more services/examples in Sweden; Sweden can import more; More tourism in Sweden; etc. 4 @ 1 mark 4 6(b)(i) Use components/different/premade parts; Produced by different factories/suppliers; These are put together; 3 @ 1 mark 3 6(b)(ii) Ideas such as: Near roads; Near railways/railway stations; Near ports/harbours/rivers/canals; Near airports; To transport raw materials/inputs/imports; To transport finished goods/outputs/exports; To reduce costs; To increase speed; Especially bulky materials(dev); Especially perishable goods (dev) 5 @ 1 mark or development 5
Mark scheme, page 16
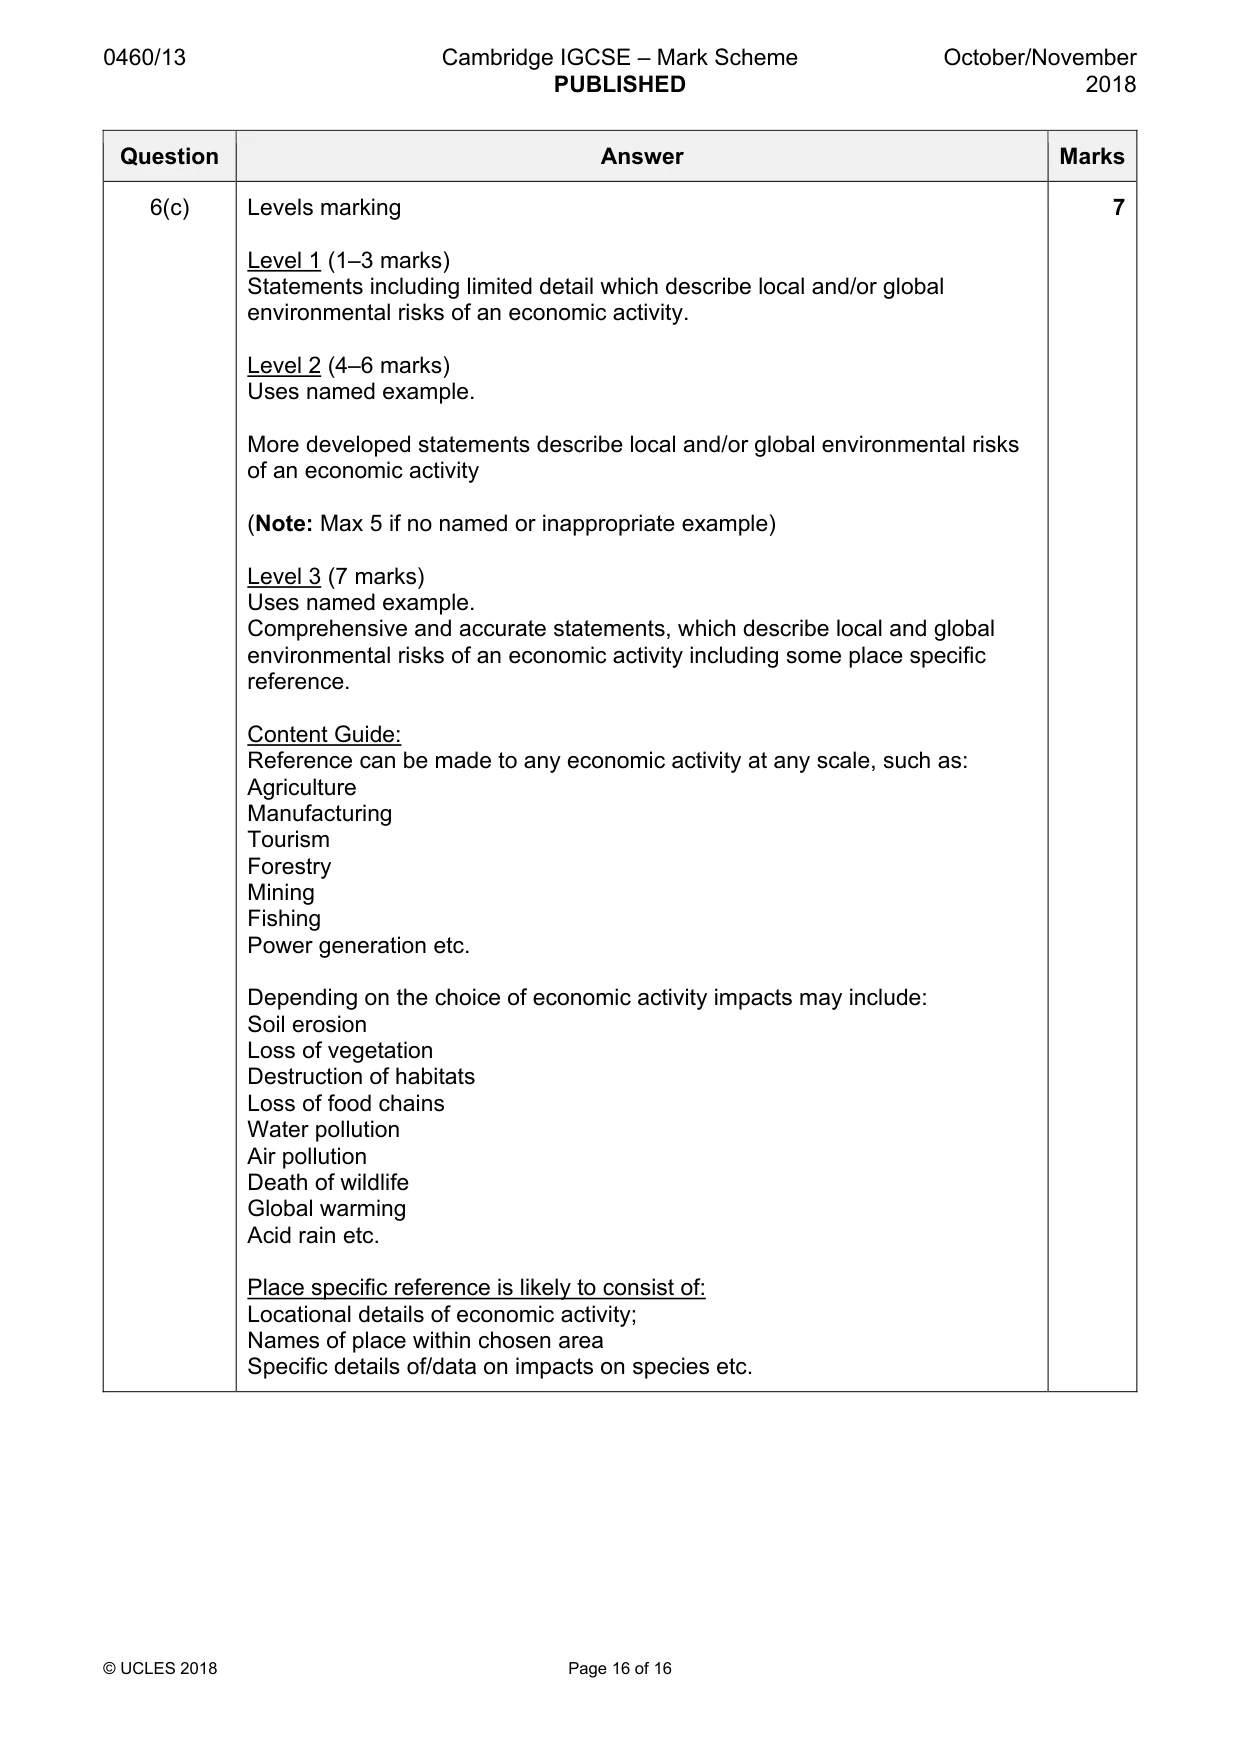
0460/13 Cambridge IGCSE – Mark Scheme PUBLISHED October/November 2018 © UCLES 2018 Page 16 of 16 Question Answer Marks 6(c) Levels marking Level 1 (1–3 marks) Statements including limited detail which describe local and/or global environmental risks of an economic activity. Level 2 (4–6 marks) Uses named example. More developed statements describe local and/or global environmental risks of an economic activity (Note: Max 5 if no named or inappropriate example) Level 3 (7 marks) Uses named example. Comprehensive and accurate statements, which describe local and global environmental risks of an economic activity including some place specific reference. Content Guide: Reference can be made to any economic activity at any scale, such as: Agriculture Manufacturing Tourism Forestry Mining Fishing Power generation etc. Depending on the choice of economic activity impacts may include: Soil erosion Loss of vegetation Destruction of habitats Loss of food chains Water pollution Air pollution Death of wildlife Global warming Acid rain etc. Place specific reference is likely to consist of: Locational details of economic activity; Names of place within chosen area Specific details of/data on impacts on species etc. 7
What you needed in this session
Cambridge’s own grade thresholds for 2018 Oct/Nov, Paper 1 · Variant 3. A higher threshold means an easier paper — the bar moves with how the cohort did.