Cambridge IGCSE Geography 0460 — 2018 May/June Paper 1 · Variant 3
0460/13/M/J/18 · 75 marks · ≈84 min
The question paper and its mark scheme, free to read here and free to download. This is Cambridge’s own paper, exactly as it was sat.
Question paper28 pages



Mark scheme15 pages
Answers below. Sit the paper first if you are practising.
Paper as text
Question paper, page 1
* 2 3 2 6 3 8 2 0 0 7 * This document consists of 25 printed pages, 3 blank pages and 1 Insert. DC (KN/FC) 145571/5 © UCLES 2018 [Turn over Cambridge International Examinations Cambridge International General Certificate of Secondary Education GEOGRAPHY 0460/13 Paper 1 May/June 2018 1 hour 45 minutes Candidates answer on the Question Paper. Additional Materials: Calculator Ruler READ THESE INSTRUCTIONS FIRST Write your Centre number, candidate number and name in the spaces provided. Write in dark blue or black pen. You may use an HB pencil for any diagrams or graphs. Do not use staples, paper clips, glue or correction fluid. DO NOT WRITE IN ANY BARCODES. Write your answer to each question in the space provided. If additional space is required, you should use the lined pages at the end of this booklet. The question number(s) must be clearly shown. Answer three questions, one from each section. The Insert contains Figs. 2.1 and 2.2 for Question 2, Figs. 3.2 and 3.3 for Question 3, Figs. 4.1 and 4.2 for Question 4 and Figs. 5.1 and 5.2 for Question 5. The Insert is not required by the Examiner. Sketch maps and diagrams should be drawn whenever they serve to illustrate an answer. At the end of the examination, fasten all your work securely together. The number of marks is given in brackets [ ] at the end of each question or part question. Definitions: MEDCs – More Economically Developed Countries LEDCs – Less Economically Developed Countries The syllabus is approved for use in England, Wales and Northern Ireland as a Cambridge International Level 1/Level 2 Certificate.
Question paper, page 2
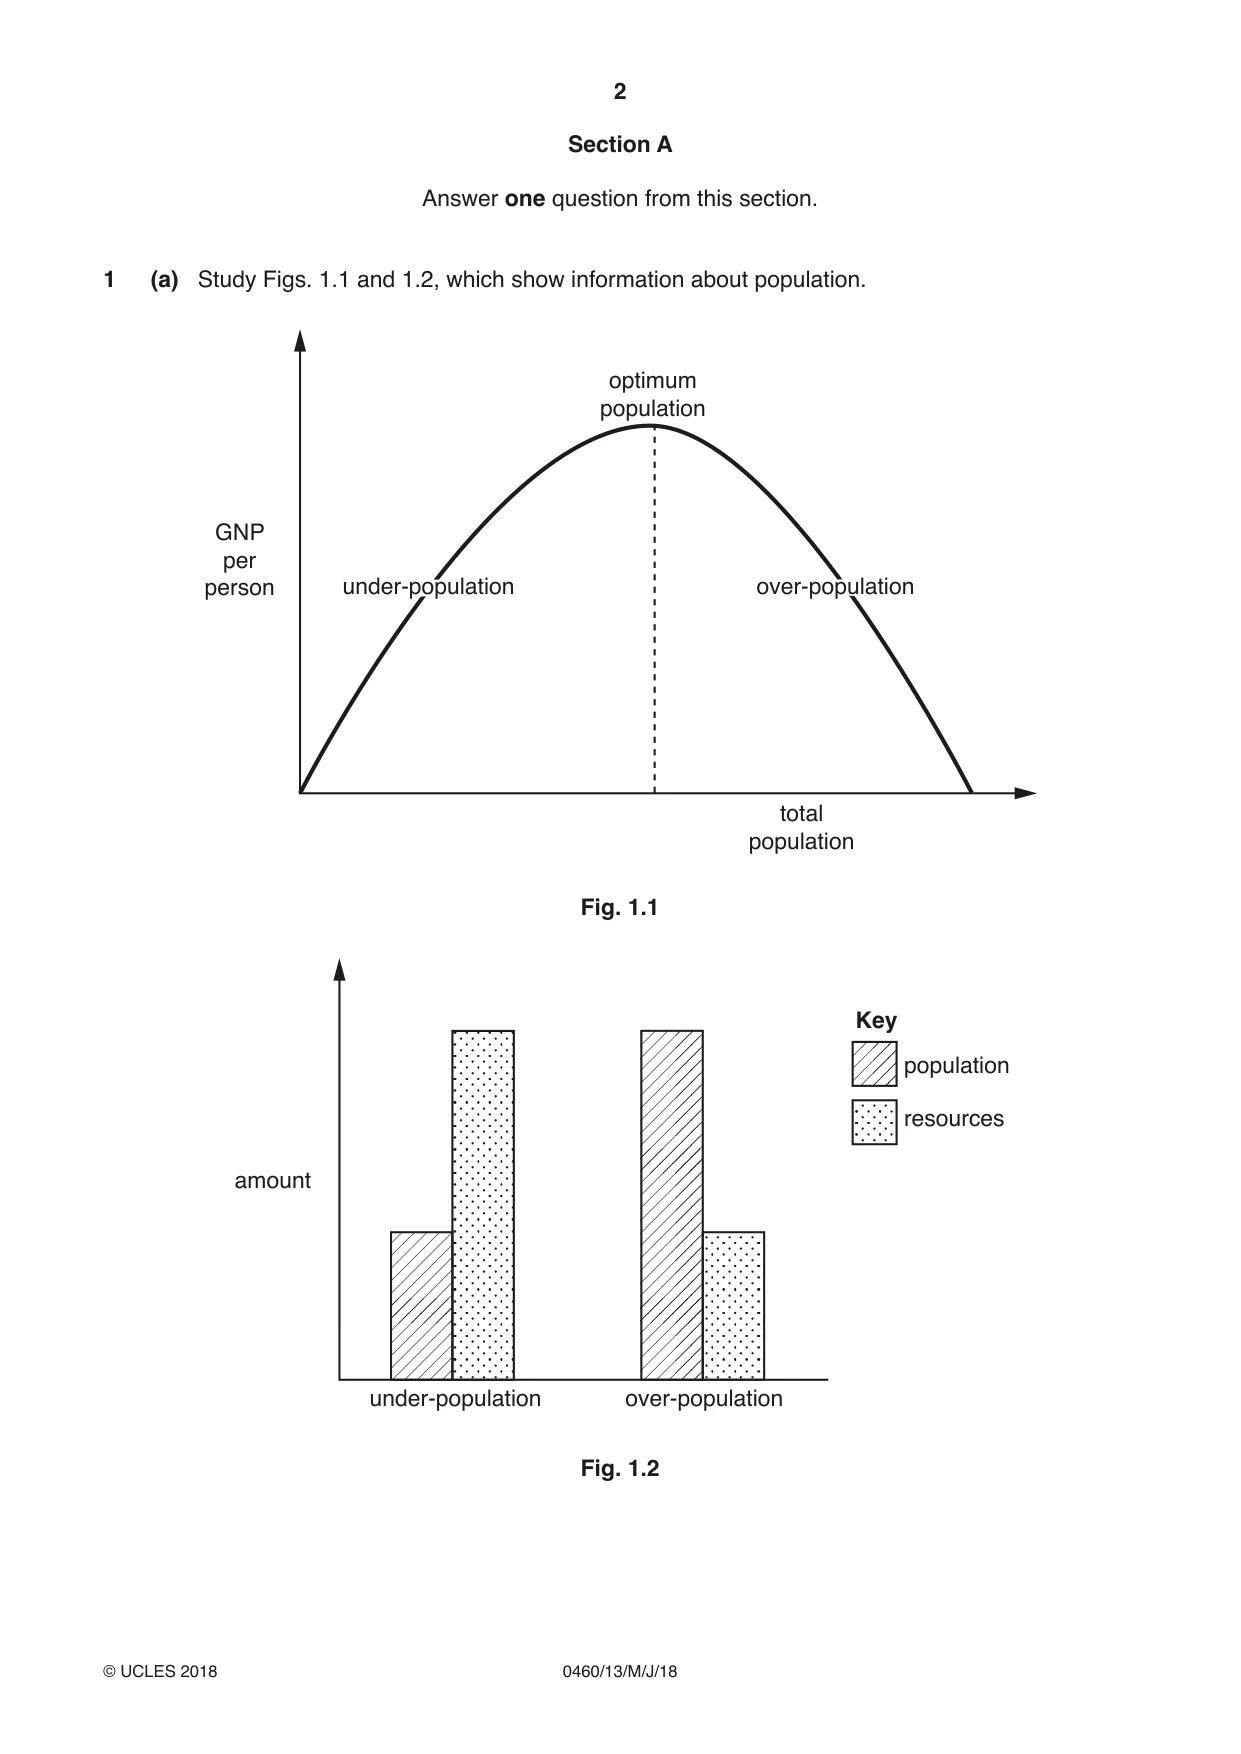
2 0460/13/M/J/18 © UCLES 2018 Section A Answer one question from this section. 1 (a) Study Figs. 1.1 and 1.2, which show information about population. GNP per person over-population over-population optimum population total population under-population under-population Fig. 1.1 amount Key population resources over-population under-population Fig. 1.2
Question paper, page 3
3 0460/13/M/J/18 © UCLES 2018 [Turn over (i) Using Fig. 1.1 only, define optimum population. … …[1] (ii) Using Fig. 1.2 only, define: under-population … … over-population … …[2] (iii) Explain why some countries become over-populated. … … … … … …[3] (iv) Describe four problems which are caused by over-population. 1 … … 2 … … 3 … … 4 … …[4]
Question paper, page 4
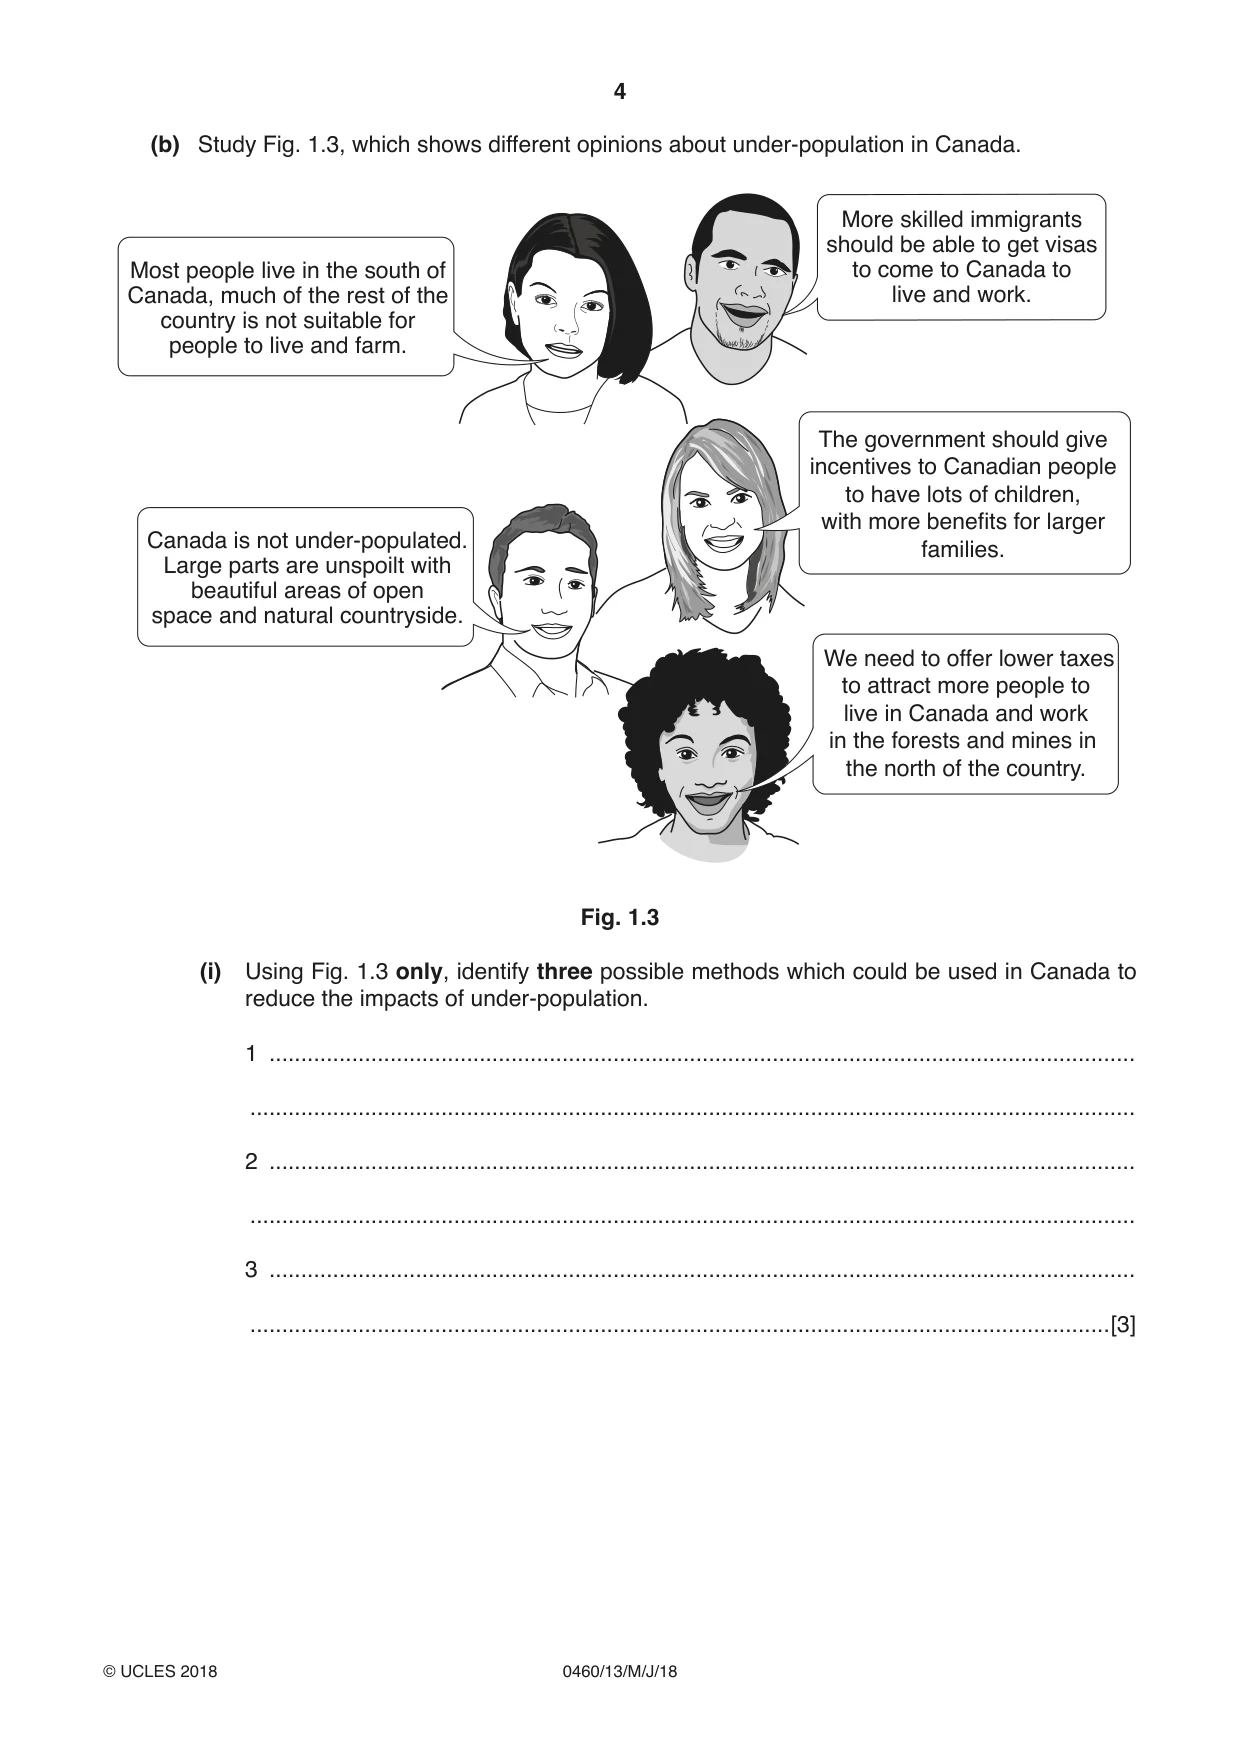
4 0460/13/M/J/18 © UCLES 2018 (b) Study Fig. 1.3, which shows different opinions about under-population in Canada. More skilled immigrants should be able to get visas to come to Canada to live and work. Most people live in the south of Canada, much of the rest of the country is not suitable for people to live and farm. The government should give incentives to Canadian people to have lots of children, with more benefits for larger families. Canada is not under-populated. Large parts are unspoilt with beautiful areas of open space and natural countryside. We need to offer lower taxes to attract more people to live in Canada and work in the forests and mines in the north of the country. Fig. 1.3 (i) Using Fig. 1.3 only, identify three possible methods which could be used in Canada to reduce the impacts of under-population. 1 … … 2 … … 3 … …[3]
Question paper, page 5
5 0460/13/M/J/18 © UCLES 2018 [Turn over (ii) Explain why countries with large areas of land may not be under-populated. … … … … … … … … … …[5]
Question paper, page 6
6 0460/13/M/J/18 © UCLES 2018 (c) For a named country you have studied, describe the problems caused by a large percentage of dependent population. Name of country … … … … … … … … … … … … … … … … … … … … … … … … …[7] [Total: 25]
Question paper, page 7
7 0460/13/M/J/18 © UCLES 2018 [Turn over 2 (a) Study Fig. 2.1 (Insert), which shows information about urbanisation. (i) What is meant by urbanisation? … …[1] (ii) Using Fig. 2.1 only: – name the continent with the lowest percentage of people living in urban areas … – state the percentage of the population living in urban areas in most countries in Australasia and North America … % [2] (iii) Using Fig. 2.1 only, describe the distribution of cities with over 10 million inhabitants in 2000. … … … … … …[3] (iv) Explain why the population of many cities has grown rapidly since 2000. … … … … … … … …[4]
Question paper, page 8
8 0460/13/M/J/18 © UCLES 2018 (b) Study Fig. 2.2 (Insert), which is a photograph of part of the urban area of Mumbai, India (an LEDC). (i) Compare the location of the squatter settlements labelled X and Y. … … … … … …[3] (ii) Describe the problems faced by people living in squatter settlements, such as those shown in Fig. 2.2. … … … … … … … … … …[5]
Question paper, page 9
9 0460/13/M/J/18 © UCLES 2018 [Turn over (c) For a named urban area you have studied, describe what has been done to reduce the negative impacts of urbanisation. Name of urban area … … … … … … … … … … … … … … … … … … … … … … …[7] [Total: 25]
Question paper, page 10
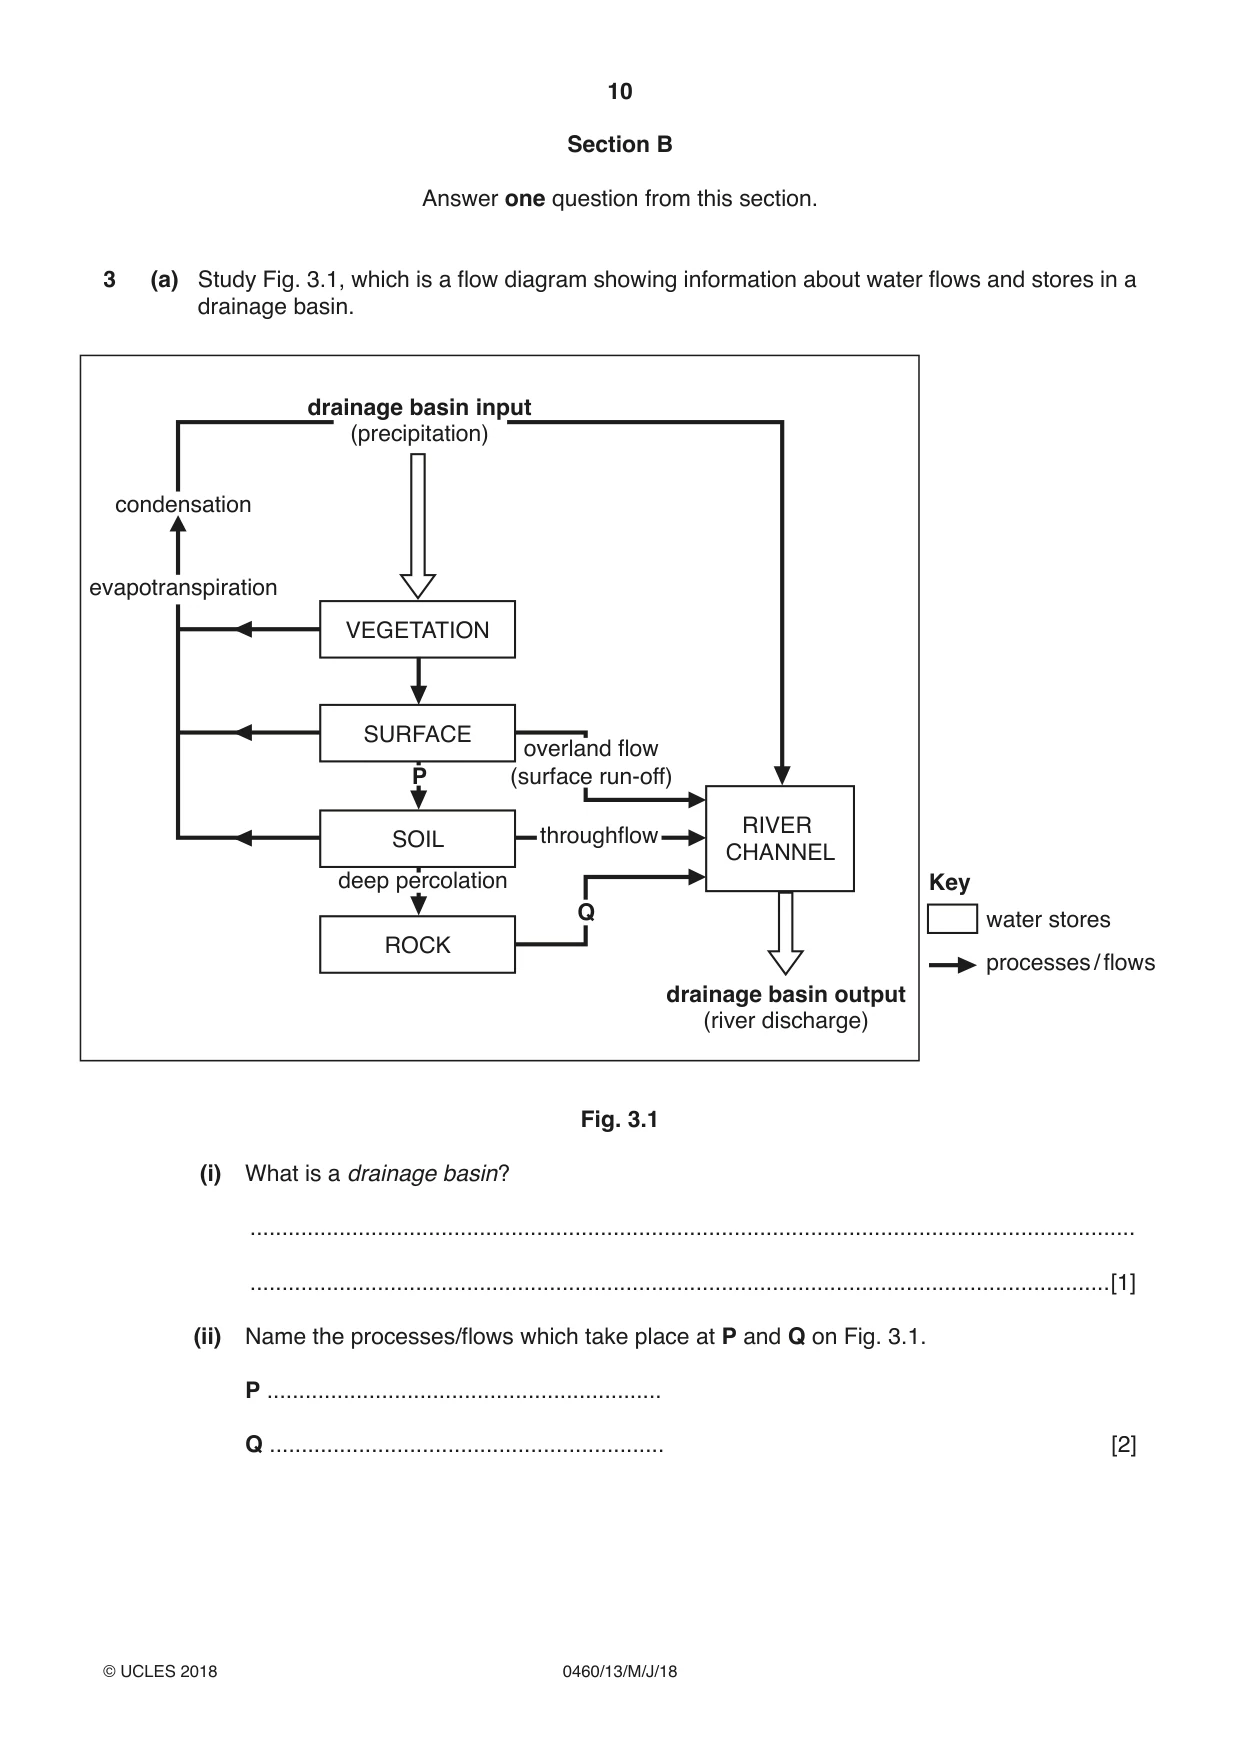
10 0460/13/M/J/18 © UCLES 2018 Section B Answer one question from this section. 3 (a) Study Fig. 3.1, which is a flow diagram showing information about water flows and stores in a drainage basin. drainage basin input (precipitation) drainage basin output Key water stores processes / flows (river discharge) condensation throughflow evapotranspiration VEGETATION RIVER CHANNEL SURFACE SOIL ROCK deep percolation overland flow (surface run-off) Q P Fig. 3.1 (i) What is a drainage basin? … …[1] (ii) Name the processes/flows which take place at P and Q on Fig. 3.1. P … Q … [2]
Question paper, page 11
11 0460/13/M/J/18 © UCLES 2018 [Turn over (iii) Give different reasons to explain why the amount of overland flow varies in a drainage basin: A from season to season … … … … … …[3] B from place to place … … … … … … … …[4]
Question paper, page 12
12 0460/13/M/J/18 © UCLES 2018 (b) Study Figs. 3.2 and 3.3 (Insert), which are photographs showing two rivers in an upland area in the UK. (i) Describe three differences between the river and valley in Fig. 3.2 compared with the river and valley in Fig. 3.3. 1 … … 2 … … 3 … …[3] (ii) Suggest how rivers such as those shown in Figs. 3.2 and 3.3 transport their load. … … … … … … … … … …[5]
Question paper, page 13
13 0460/13/M/J/18 © UCLES 2018 [Turn over (c) Explain how an oxbow lake is formed. Include a diagram or series of diagrams. … … … … … … … … … … … [7] [Total: 25]
Question paper, page 14
14 0460/13/M/J/18 © UCLES 2018 4 (a) Study Fig. 4.1 (Insert), which is a cross section of the atmosphere between the Equator and the Tropics. (i) Which letter, X, Y or Z, shows the position of the hot deserts? … [1] (ii) Describe how the following are different in equatorial and hot desert climates. Rainfall … … Temperature range … …[2] (iii) Explain how latitude and atmospheric pressure influence the characteristics of equatorial and hot desert climates. … … … … … …[3] (iv) Explain why wind direction and distance from the sea are important influences on hot desert climates. … … … … … … … …[4]
Question paper, page 15
15 0460/13/M/J/18 © UCLES 2018 [Turn over (b) Study Fig. 4.2 (Insert), which is a photograph taken in an area of hot desert. (i) Describe three characteristics of the vegetation shown in Fig. 4.2. 1 … … 2 … … 3 … …[3] (ii) Explain how vegetation is able to survive in a hot desert environment. … … … … … … … … … …[5]
Question paper, page 16
16 0460/13/M/J/18 © UCLES 2018 (c) For a named area of tropical rainforest you have studied, explain why deforestation has taken place. Name of area … … … … … … … … … … … … … … … … … … … … …[7] [Total: 25]
Question paper, page 17
17 0460/13/M/J/18 © UCLES 2018 [Turn over Section C Answer one question from this section. 5 (a) Study Fig. 5.1 (Insert), which shows agricultural land use in Iraq. (i) Identify the agricultural land use in north east Iraq. … [1] (ii) Using evidence from Fig. 5.1 only, give different reasons why cultivation can take place in areas A and B. Area A … … Area B … …[2] (iii) Iraq has recently been at war. Explain why war may cause food shortages. … … … … … …[3] (iv) Explain how other economic and political factors may cause food shortages in a country. … … … … … … … …[4]
Question paper, page 18
18 0460/13/M/J/18 © UCLES 2018 (b) Study Fig. 5.2 (Insert), which is a photograph showing an area used for agriculture in Indonesia (an LEDC in South east Asia). (i) Describe the agricultural land use in Fig. 5.2. … … … … … …[3] (ii) Describe methods which could be used to increase the output of the land shown in Fig. 5.2. … … … … … … … … … …[5]
Question paper, page 19
19 0460/13/M/J/18 © UCLES 2018 [Turn over (c) Describe and explain the land use of a farm or agricultural system in a named area you have studied. Type of farm or agricultural system … Name of area … … … … … … … … … … … … … … … … … … … … … … …[7] [Total: 25]
Question paper, page 20
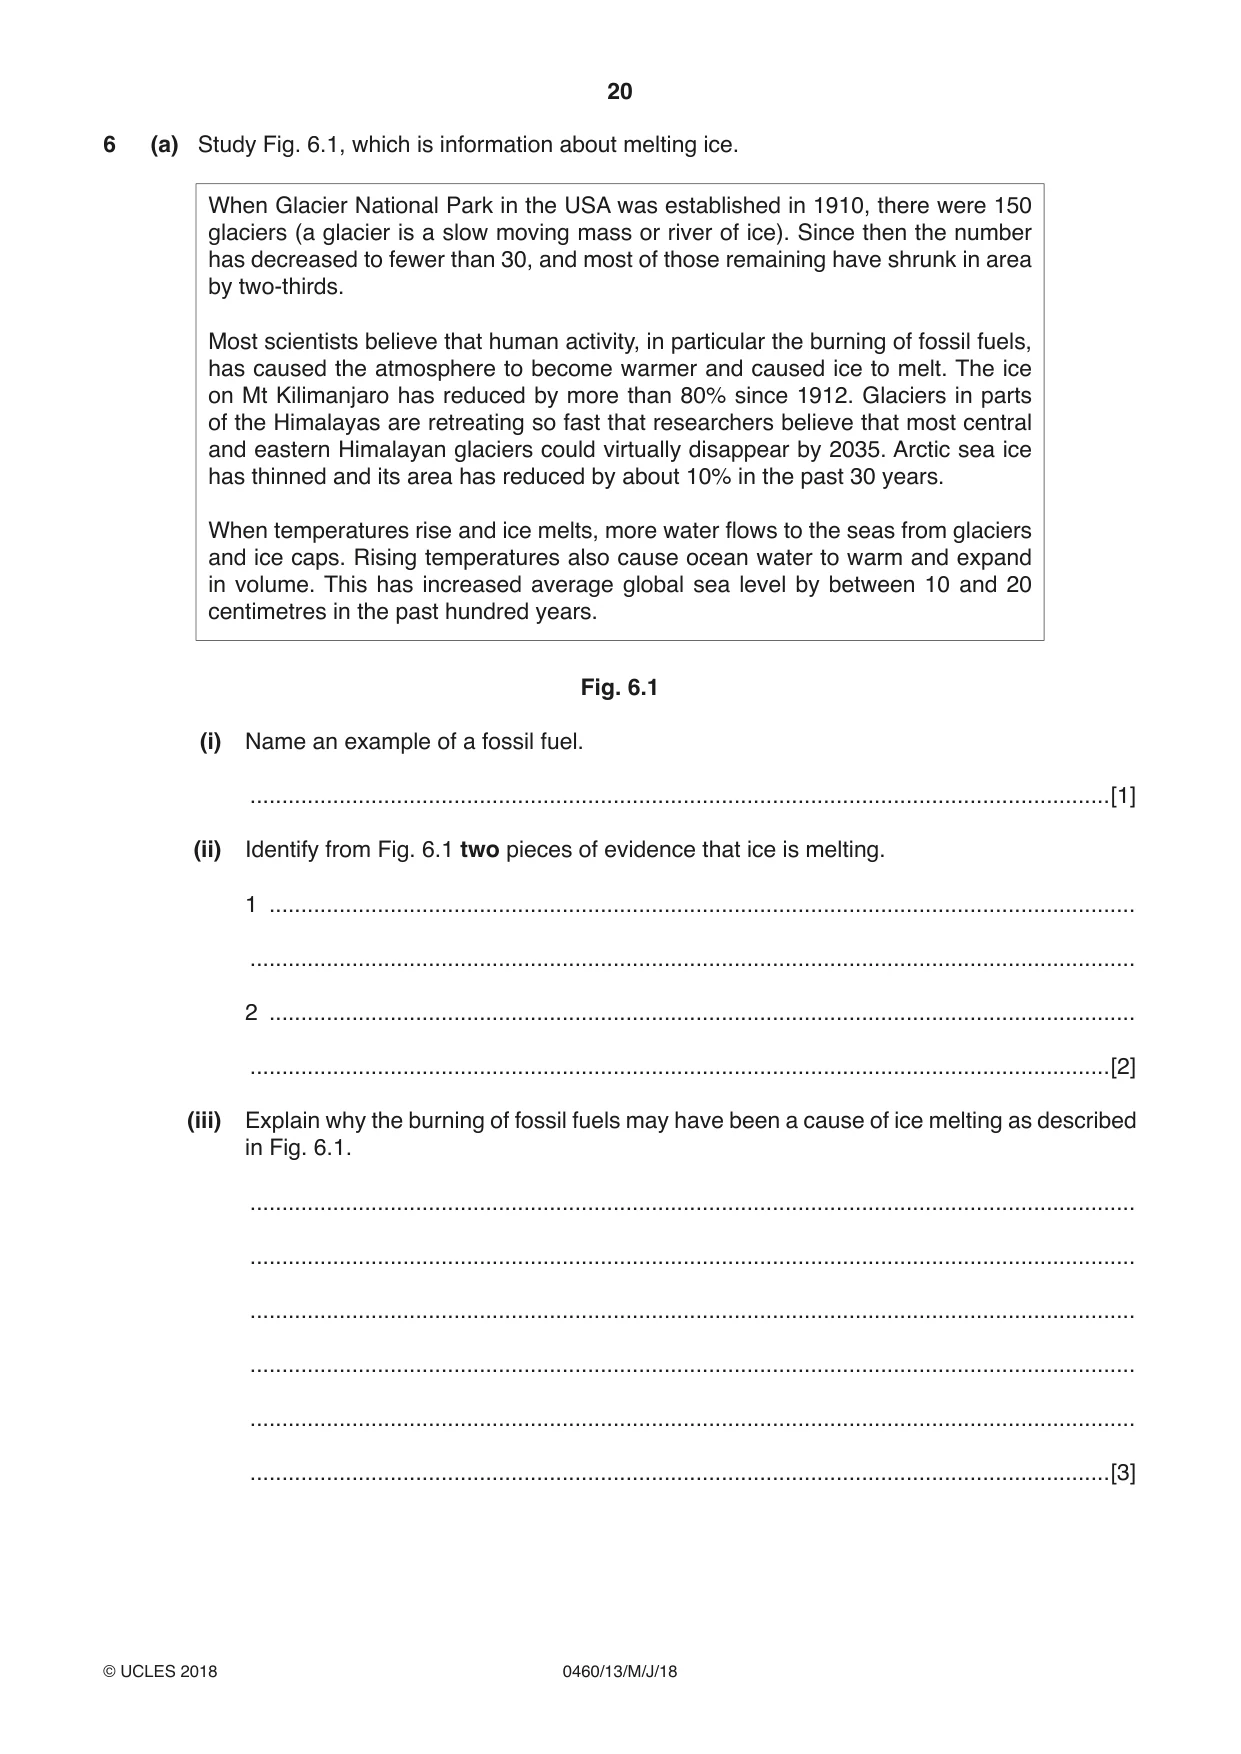
20 0460/13/M/J/18 © UCLES 2018 6 (a) Study Fig. 6.1, which is information about melting ice. When Glacier National Park in the USA was established in 1910, there were 150 glaciers (a glacier is a slow moving mass or river of ice). Since then the number has decreased to fewer than 30, and most of those remaining have shrunk in area by two-thirds. Most scientists believe that human activity, in particular the burning of fossil fuels, has caused the atmosphere to become warmer and caused ice to melt. The ice on Mt Kilimanjaro has reduced by more than 80% since 1912. Glaciers in parts of the Himalayas are retreating so fast that researchers believe that most central and eastern Himalayan glaciers could virtually disappear by 2035. Arctic sea ice has thinned and its area has reduced by about 10% in the past 30 years. When temperatures rise and ice melts, more water flows to the seas from glaciers and ice caps. Rising temperatures also cause ocean water to warm and expand in volume. This has increased average global sea level by between 10 and 20 centimetres in the past hundred years. Fig. 6.1 (i) Name an example of a fossil fuel. …[1] (ii) Identify from Fig. 6.1 two pieces of evidence that ice is melting. 1 … … 2 … …[2] (iii) Explain why the burning of fossil fuels may have been a cause of ice melting as described in Fig. 6.1. … … … … … …[3]
Question paper, page 21
21 0460/13/M/J/18 © UCLES 2018 [Turn over (iv) Explain how the melting of ice may cause problems for people and the natural environment. … … … … … … … …[4]
Question paper, page 22
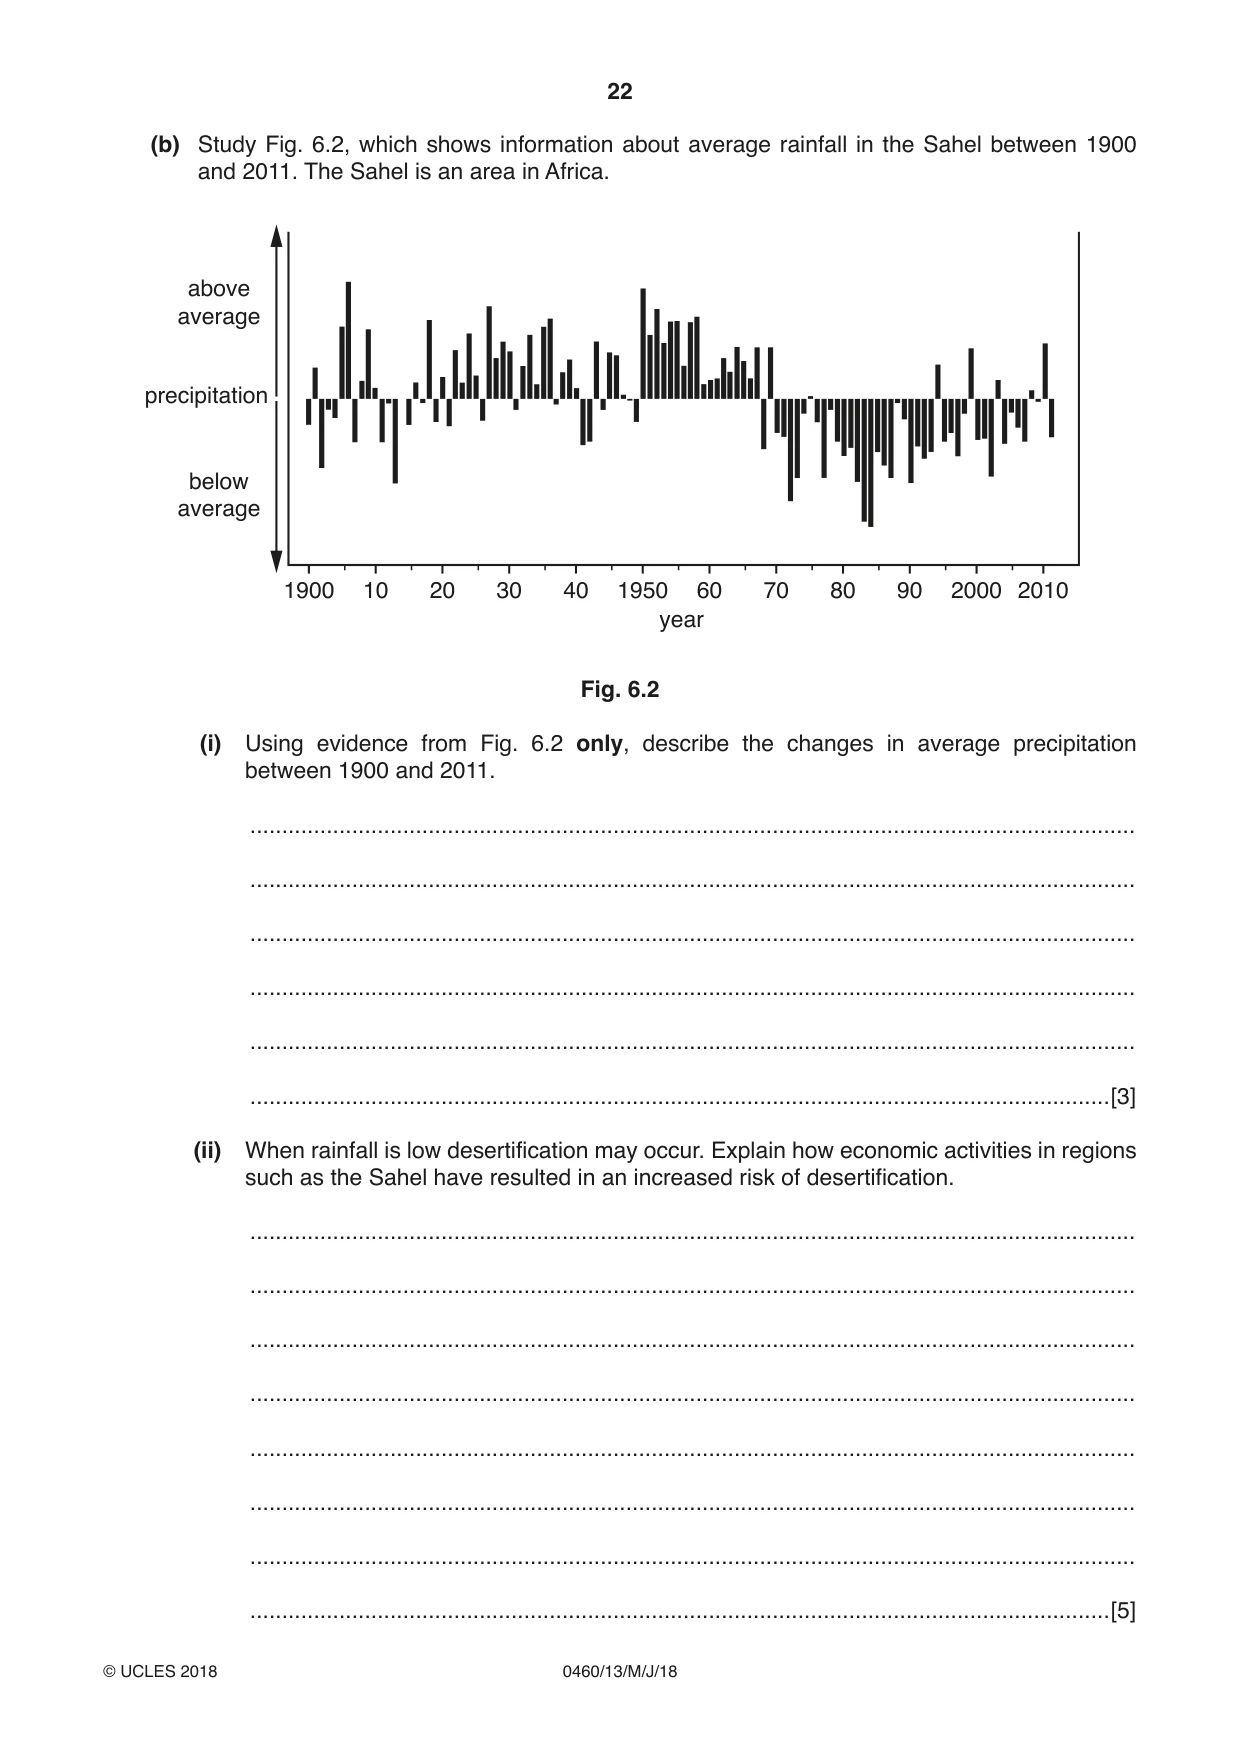
22 0460/13/M/J/18 © UCLES 2018 (b) Study Fig. 6.2, which shows information about average rainfall in the Sahel between 1900 and 2011. The Sahel is an area in Africa. 1900 10 20 30 40 1950 year 60 70 80 90 2000 2010 precipitation below average above average Fig. 6.2 (i) Using evidence from Fig. 6.2 only, describe the changes in average precipitation between 1900 and 2011. … … … … … …[3] (ii) When rainfall is low desertification may occur. Explain how economic activities in regions such as the Sahel have resulted in an increased risk of desertification. … … … … … … … …[5]
Question paper, page 23
23 0460/13/M/J/18 © UCLES 2018 (c) For an economic activity in a named area you have studied, describe how the environmental risks are being managed. Name of area … Economic activity … … … … … … … … … … … … … … … … … … … … … …[7] [Total: 25]
Question paper, page 24
24 0460/13/M/J/18 © UCLES 2018 Additional Pages If you use the following lined page to complete the answer(s) to any question(s), the question number(s) must be clearly shown. … … … … … … … … … … … … … … … … … … … … … … … … … …
Question paper, page 25
25 0460/13/M/J/18 © UCLES 2018 … … … … … … … … … … … … … … … … … … … … … … … … … … … …
Question paper, page 26
26 0460/13/M/J/18 © UCLES 2018 BLANK PAGE
Question paper, page 27
27 0460/13/M/J/18 © UCLES 2018 BLANK PAGE
Question paper, page 28
28 0460/13/M/J/18 © UCLES 2018 Permission to reproduce items where third-party owned material protected by copyright is included has been sought and cleared where possible. Every reasonable effort has been made by the publisher (UCLES) to trace copyright holders, but if any items requiring clearance have unwittingly been included, the publisher will be pleased to make amends at the earliest possible opportunity. To avoid the issue of disclosure of answer-related information to candidates, all copyright acknowledgements are reproduced online in the Cambridge International Examinations Copyright Acknowledgements Booklet. This is produced for each series of examinations and is freely available to download at www.cie.org.uk after the live examination series. Cambridge International Examinations is part of the Cambridge Assessment Group. Cambridge Assessment is the brand name of University of Cambridge Local Examinations Syndicate (UCLES), which is itself a department of the University of Cambridge. BLANK PAGE
Mark scheme, page 1
IGCSE™ is a registered trademark. This syllabus is approved for use in England, Wales and Northern Ireland as a Cambridge International Level 1/Level 2 Certificate. This document consists of 15 printed pages. © UCLES 2018 [Turn over Cambridge Assessment International Education Cambridge International General Certificate of Secondary Education GEOGRAPHY 0460/13 Paper 1 May/June 2018 MARK SCHEME Maximum Mark: 75 Published This mark scheme is published as an aid to teachers and candidates, to indicate the requirements of the examination. It shows the basis on which Examiners were instructed to award marks. It does not indicate the details of the discussions that took place at an Examiners’ meeting before marking began, which would have considered the acceptability of alternative answers. Mark schemes should be read in conjunction with the question paper and the Principal Examiner Report for Teachers. Cambridge International will not enter into discussions about these mark schemes. Cambridge International is publishing the mark schemes for the May/June 2018 series for most Cambridge IGCSE™, Cambridge International A and AS Level and Cambridge Pre-U components, and some Cambridge O Level components.
Mark scheme, page 2
0460/13 Cambridge IGCSE – Mark Scheme PUBLISHED May/June 2018 © UCLES 2018 Page 2 of 15 Generic Marking Principles These general marking principles must be applied by all examiners when marking candidate answers. They should be applied alongside the specific content of the mark scheme or generic level descriptors for a question. Each question paper and mark scheme will also comply with these marking principles. GENERIC MARKING PRINCIPLE 1: Marks must be awarded in line with: • the specific content of the mark scheme or the generic level descriptors for the question • the specific skills defined in the mark scheme or in the generic level descriptors for the question • the standard of response required by a candidate as exemplified by the standardisation scripts. GENERIC MARKING PRINCIPLE 2: Marks awarded are always whole marks (not half marks, or other fractions). GENERIC MARKING PRINCIPLE 3: Marks must be awarded positively: • marks are awarded for correct/valid answers, as defined in the mark scheme. However, credit is given for valid answers which go beyond the scope of the syllabus and mark scheme, referring to your Team Leader as appropriate • marks are awarded when candidates clearly demonstrate what they know and can do • marks are not deducted for errors • marks are not deducted for omissions • answers should only be judged on the quality of spelling, punctuation and grammar when these features are specifically assessed by the question as indicated by the mark scheme. The meaning, however, should be unambiguous. GENERIC MARKING PRINCIPLE 4: Rules must be applied consistently e.g. in situations where candidates have not followed instructions or in the application of generic level descriptors. GENERIC MARKING PRINCIPLE 5: Marks should be awarded using the full range of marks defined in the mark scheme for the question (however; the use of the full mark range may be limited according to the quality of the candidate responses seen). GENERIC MARKING PRINCIPLE 6: Marks awarded are based solely on the requirements as defined in the mark scheme. Marks should not be awarded with grade thresholds or grade descriptors in mind.
Mark scheme, page 3
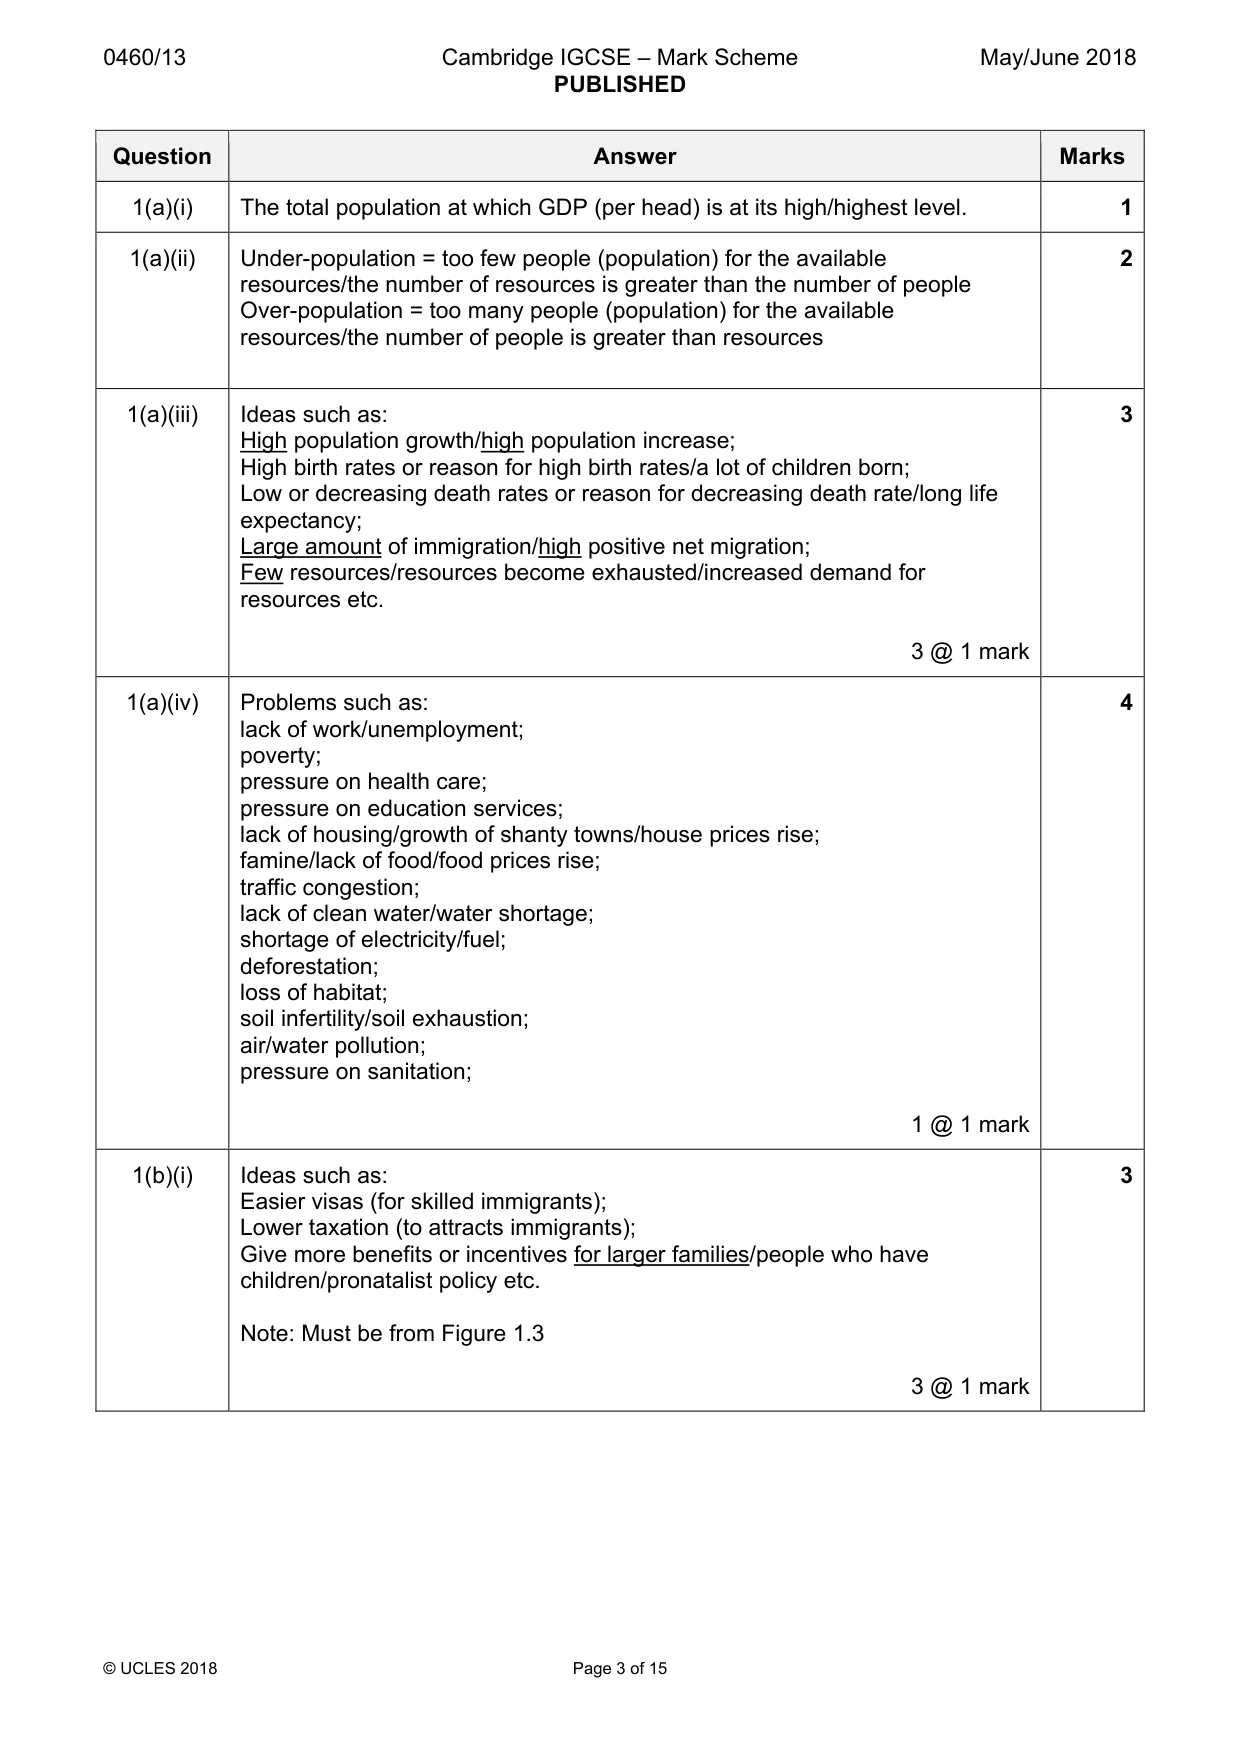
0460/13 Cambridge IGCSE – Mark Scheme PUBLISHED May/June 2018 © UCLES 2018 Page 3 of 15 Question Answer Marks 1(a)(i) The total population at which GDP (per head) is at its high/highest level. 1 1(a)(ii) Under-population = too few people (population) for the available resources/the number of resources is greater than the number of people Over-population = too many people (population) for the available resources/the number of people is greater than resources 2 1(a)(iii) Ideas such as: High population growth/high population increase; High birth rates or reason for high birth rates/a lot of children born; Low or decreasing death rates or reason for decreasing death rate/long life expectancy; Large amount of immigration/high positive net migration; Few resources/resources become exhausted/increased demand for resources etc. 3 @ 1 mark 3 1(a)(iv) Problems such as: lack of work/unemployment; poverty; pressure on health care; pressure on education services; lack of housing/growth of shanty towns/house prices rise; famine/lack of food/food prices rise; traffic congestion; lack of clean water/water shortage; shortage of electricity/fuel; deforestation; loss of habitat; soil infertility/soil exhaustion; air/water pollution; pressure on sanitation; 1 @ 1 mark 4 1(b)(i) Ideas such as: Easier visas (for skilled immigrants); Lower taxation (to attracts immigrants); Give more benefits or incentives for larger families/people who have children/pronatalist policy etc. Note: Must be from Figure 1.3 3 @ 1 mark 3
Mark scheme, page 4
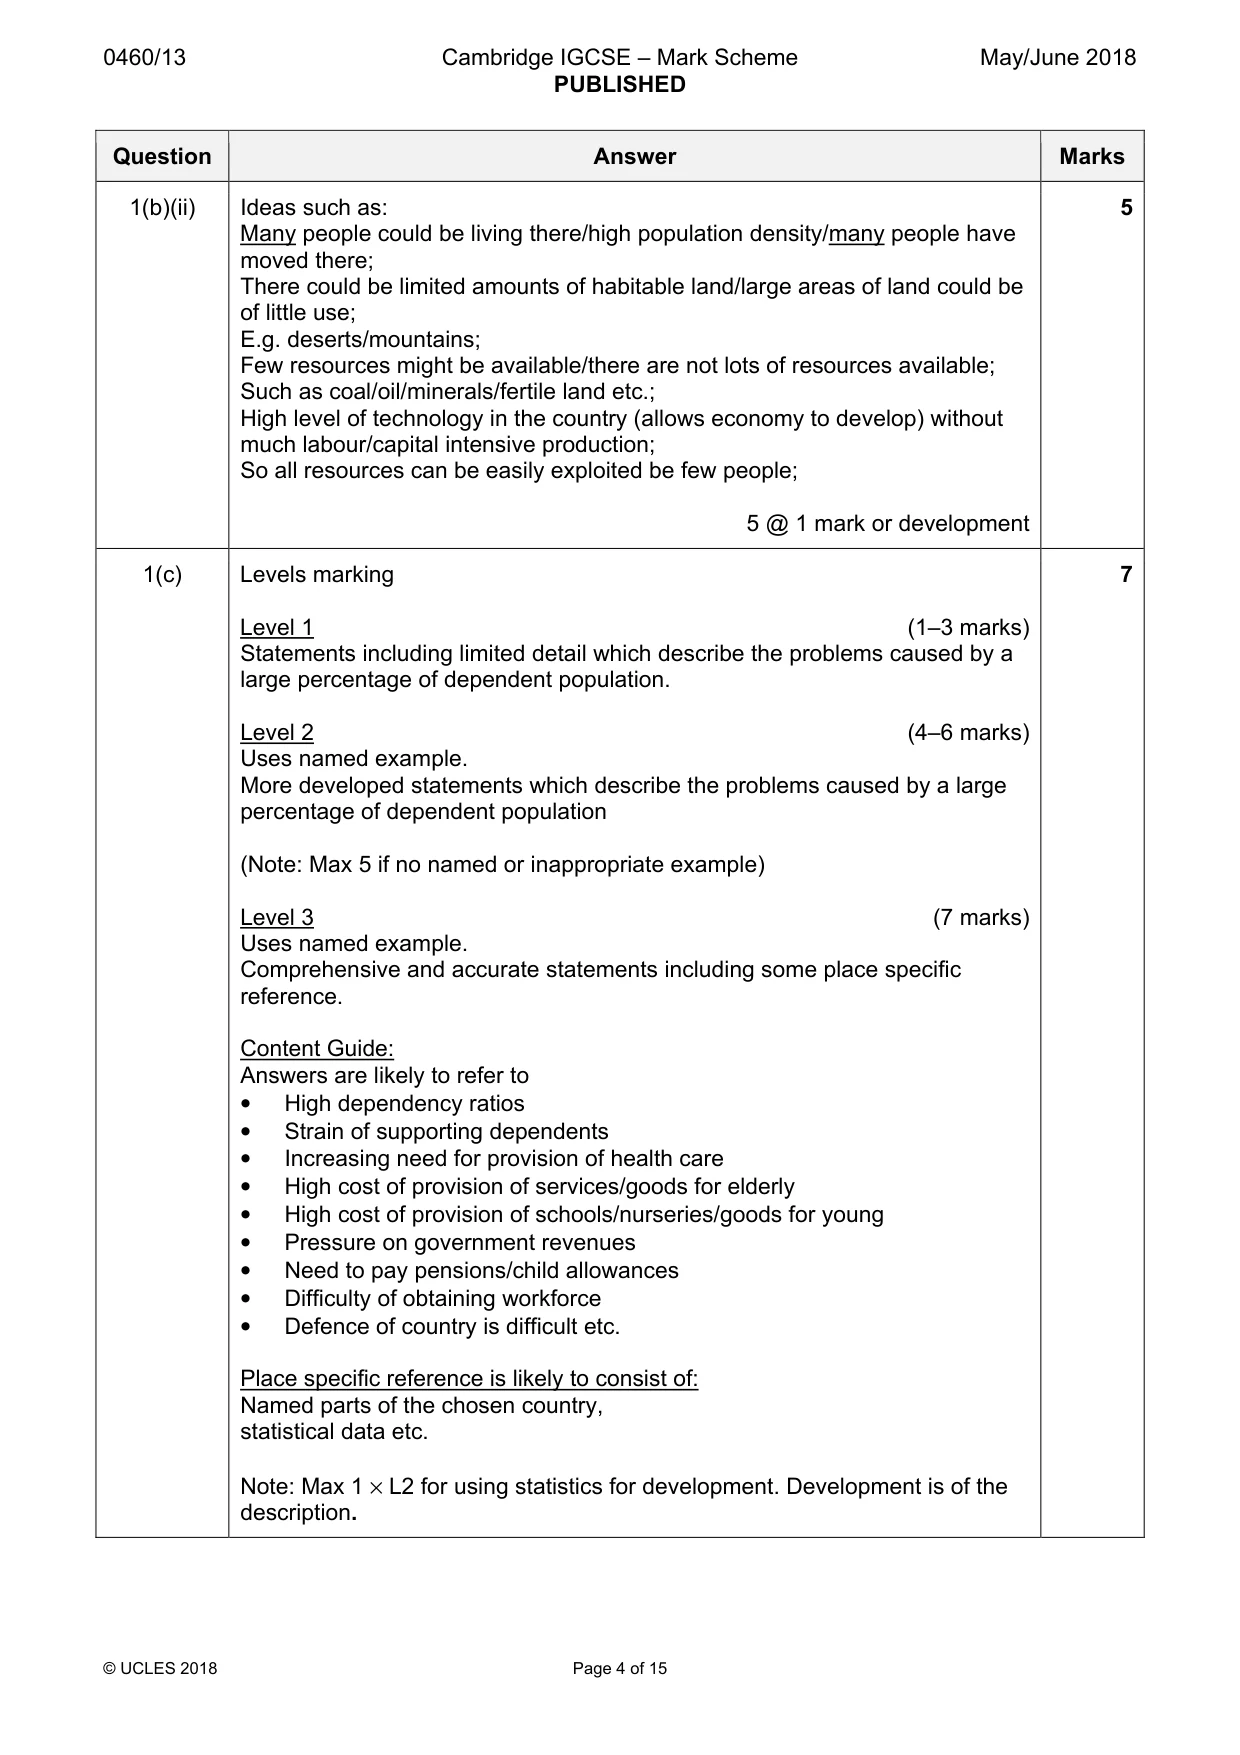
0460/13 Cambridge IGCSE – Mark Scheme PUBLISHED May/June 2018 © UCLES 2018 Page 4 of 15 Question Answer Marks 1(b)(ii) Ideas such as: Many people could be living there/high population density/many people have moved there; There could be limited amounts of habitable land/large areas of land could be of little use; E.g. deserts/mountains; Few resources might be available/there are not lots of resources available; Such as coal/oil/minerals/fertile land etc.; High level of technology in the country (allows economy to develop) without much labour/capital intensive production; So all resources can be easily exploited be few people; 5 @ 1 mark or development 5 1(c) Levels marking Level 1 (1–3 marks) Statements including limited detail which describe the problems caused by a large percentage of dependent population. Level 2 (4–6 marks) Uses named example. More developed statements which describe the problems caused by a large percentage of dependent population (Note: Max 5 if no named or inappropriate example) Level 3 (7 marks) Uses named example. Comprehensive and accurate statements including some place specific reference. Content Guide: Answers are likely to refer to • High dependency ratios • Strain of supporting dependents • Increasing need for provision of health care • High cost of provision of services/goods for elderly • High cost of provision of schools/nurseries/goods for young • Pressure on government revenues • Need to pay pensions/child allowances • Difficulty of obtaining workforce • Defence of country is difficult etc. Place specific reference is likely to consist of: Named parts of the chosen country, statistical data etc. Note: Max 1 × L2 for using statistics for development. Development is of the description. 7
Mark scheme, page 5
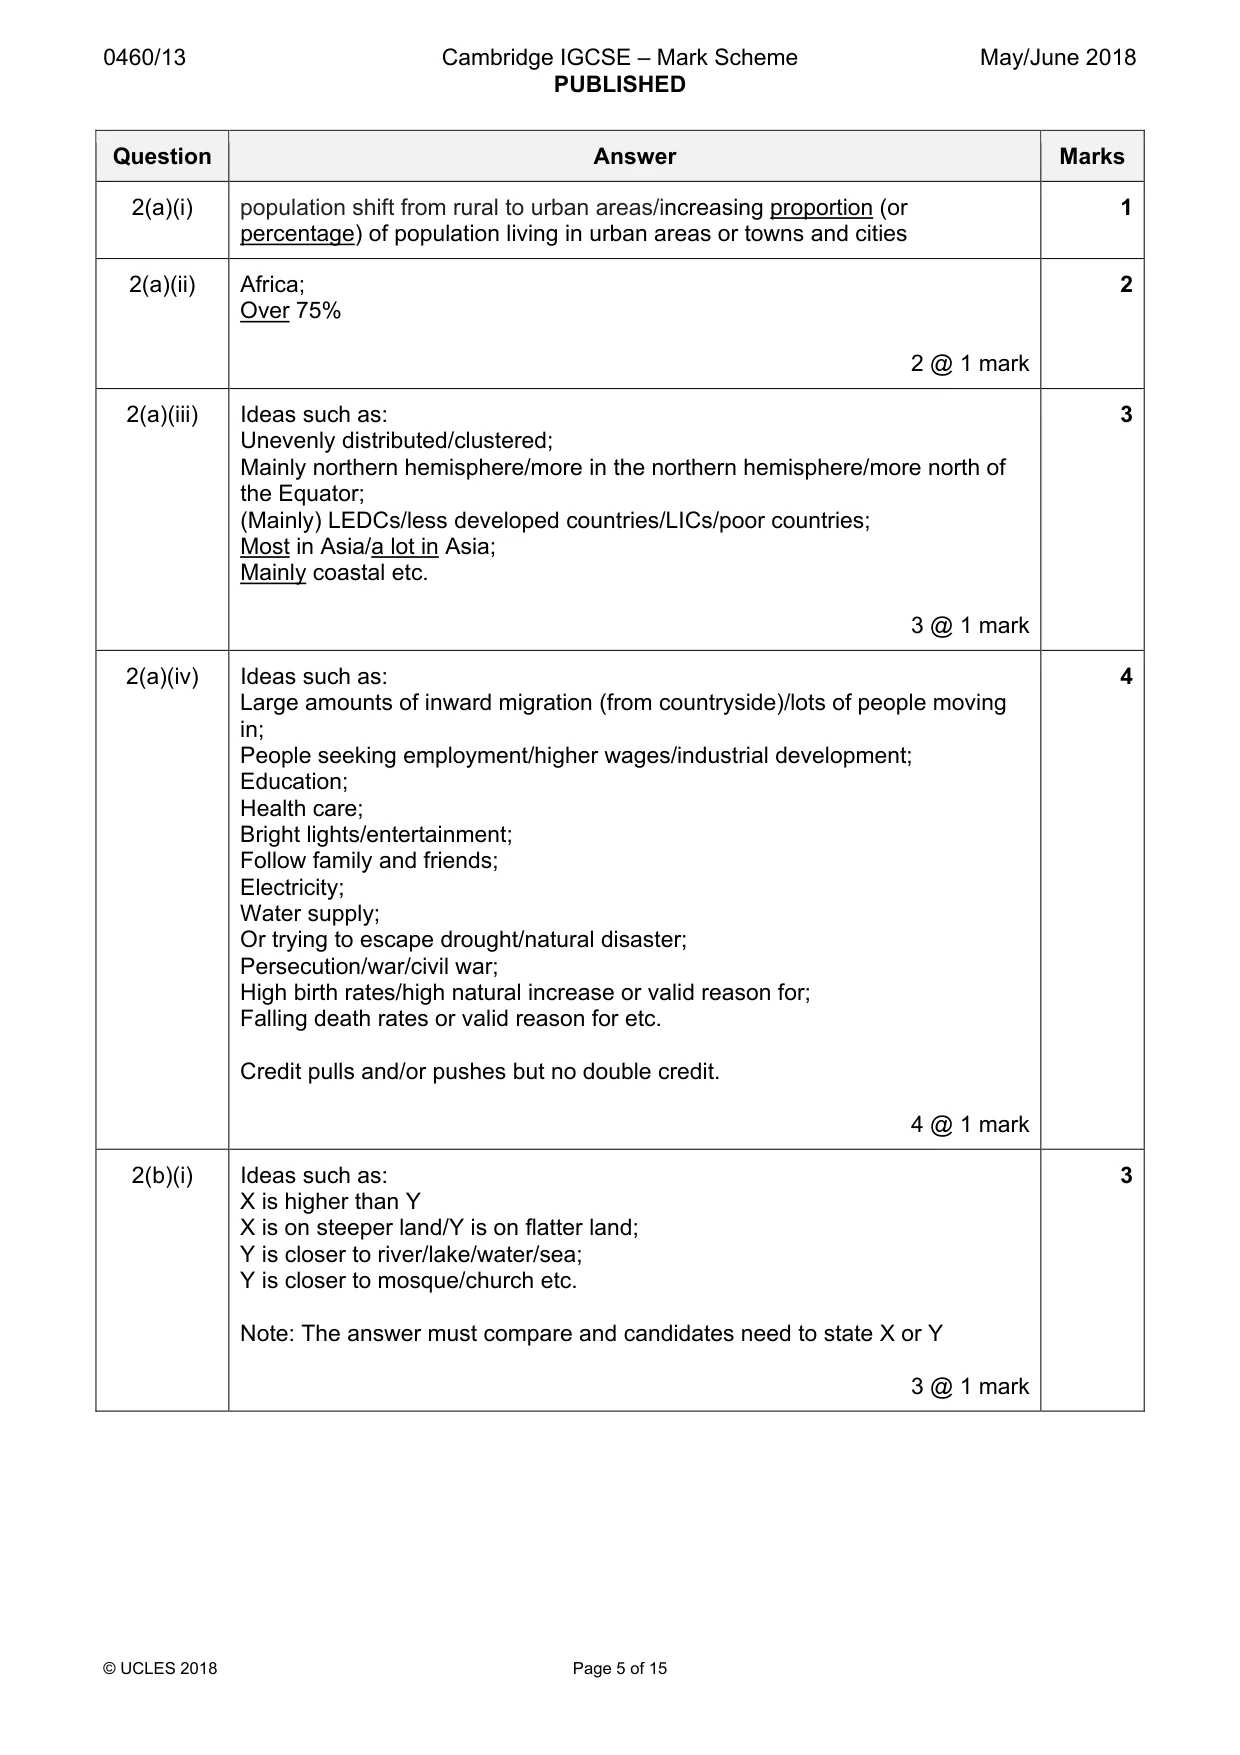
0460/13 Cambridge IGCSE – Mark Scheme PUBLISHED May/June 2018 © UCLES 2018 Page 5 of 15 Question Answer Marks 2(a)(i) population shift from rural to urban areas/increasing proportion (or percentage) of population living in urban areas or towns and cities 1 2(a)(ii) Africa; Over 75% 2 @ 1 mark 2 2(a)(iii) Ideas such as: Unevenly distributed/clustered; Mainly northern hemisphere/more in the northern hemisphere/more north of the Equator; (Mainly) LEDCs/less developed countries/LICs/poor countries; Most in Asia/a lot in Asia; Mainly coastal etc. 3 @ 1 mark 3 2(a)(iv) Ideas such as: Large amounts of inward migration (from countryside)/lots of people moving in; People seeking employment/higher wages/industrial development; Education; Health care; Bright lights/entertainment; Follow family and friends; Electricity; Water supply; Or trying to escape drought/natural disaster; Persecution/war/civil war; High birth rates/high natural increase or valid reason for; Falling death rates or valid reason for etc. Credit pulls and/or pushes but no double credit. 4 @ 1 mark 4 2(b)(i) Ideas such as: X is higher than Y X is on steeper land/Y is on flatter land; Y is closer to river/lake/water/sea; Y is closer to mosque/church etc. Note: The answer must compare and candidates need to state X or Y 3 @ 1 mark 3
Mark scheme, page 6
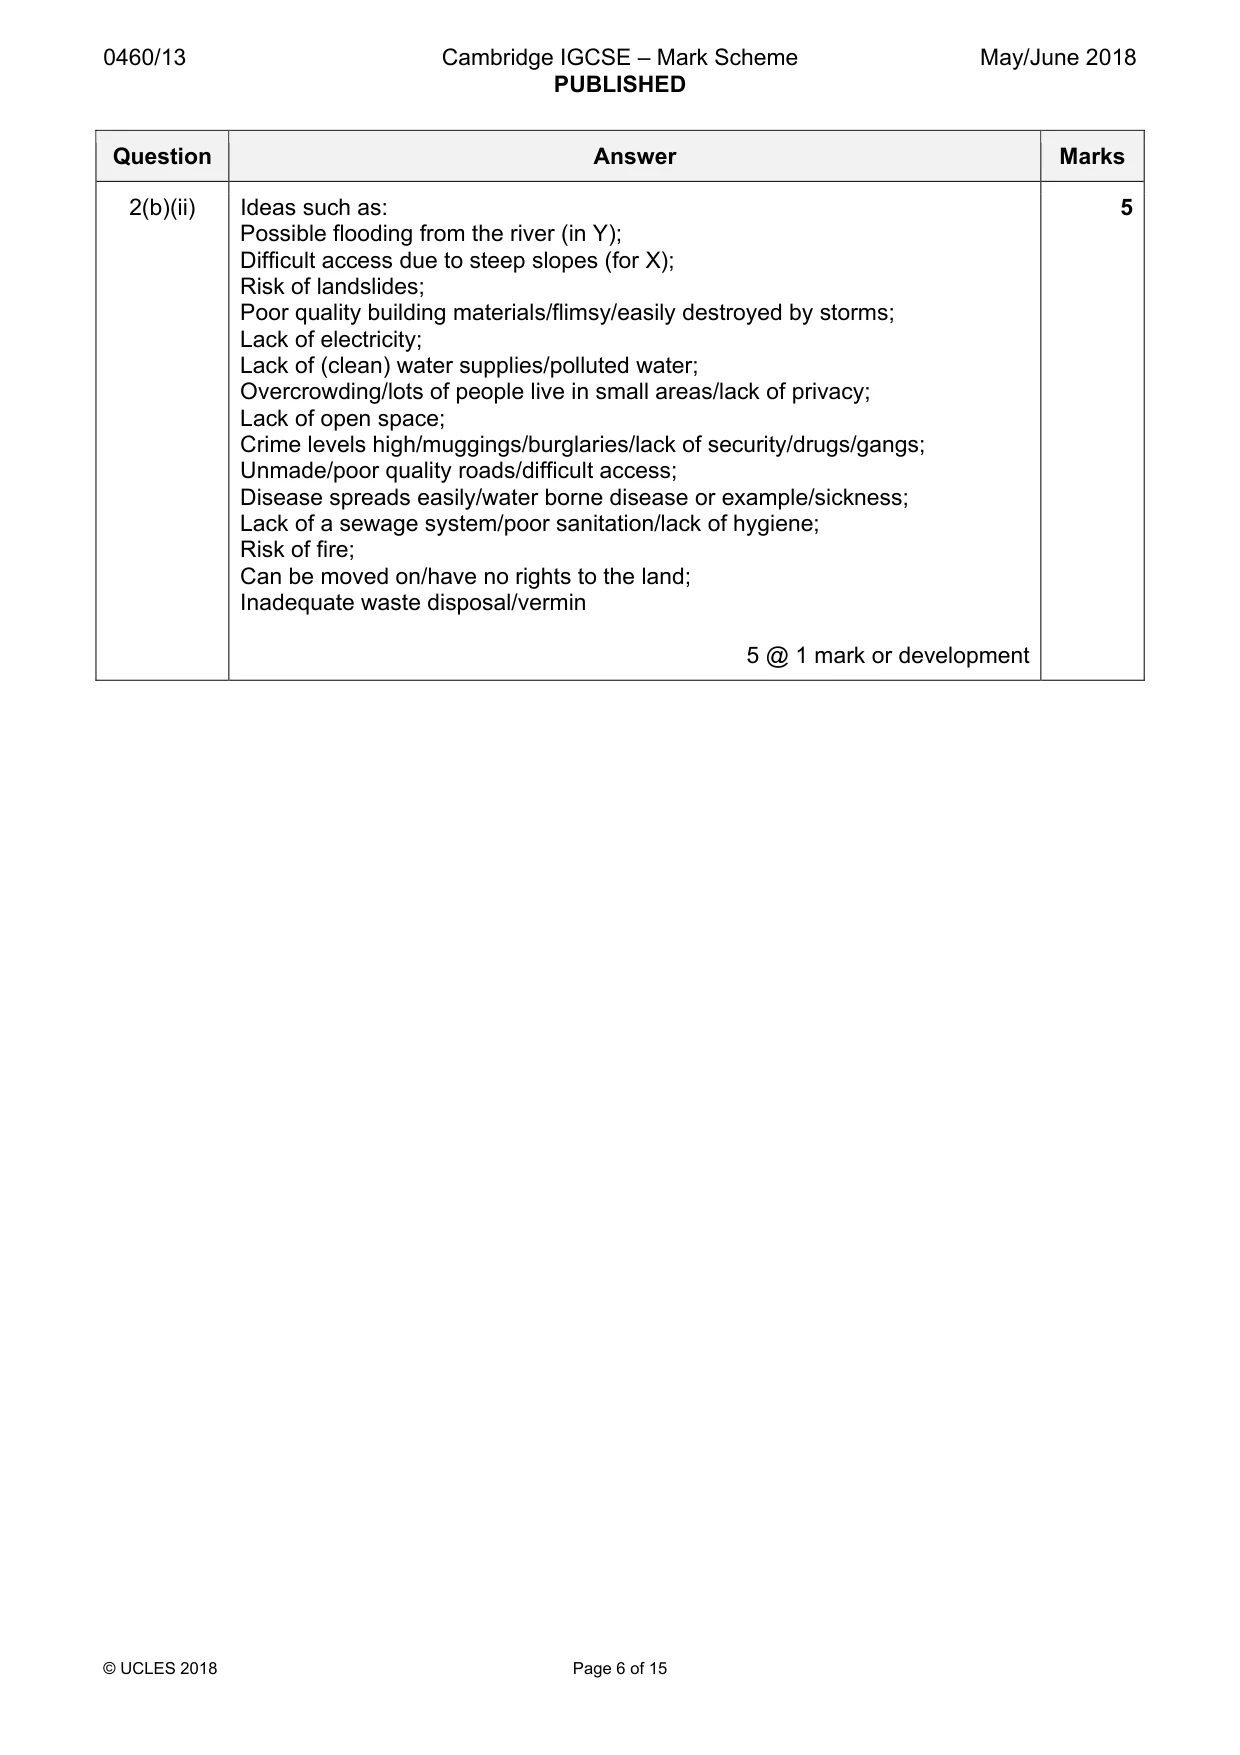
0460/13 Cambridge IGCSE – Mark Scheme PUBLISHED May/June 2018 © UCLES 2018 Page 6 of 15 Question Answer Marks 2(b)(ii) Ideas such as: Possible flooding from the river (in Y); Difficult access due to steep slopes (for X); Risk of landslides; Poor quality building materials/flimsy/easily destroyed by storms; Lack of electricity; Lack of (clean) water supplies/polluted water; Overcrowding/lots of people live in small areas/lack of privacy; Lack of open space; Crime levels high/muggings/burglaries/lack of security/drugs/gangs; Unmade/poor quality roads/difficult access; Disease spreads easily/water borne disease or example/sickness; Lack of a sewage system/poor sanitation/lack of hygiene; Risk of fire; Can be moved on/have no rights to the land; Inadequate waste disposal/vermin 5 @ 1 mark or development 5
Mark scheme, page 7
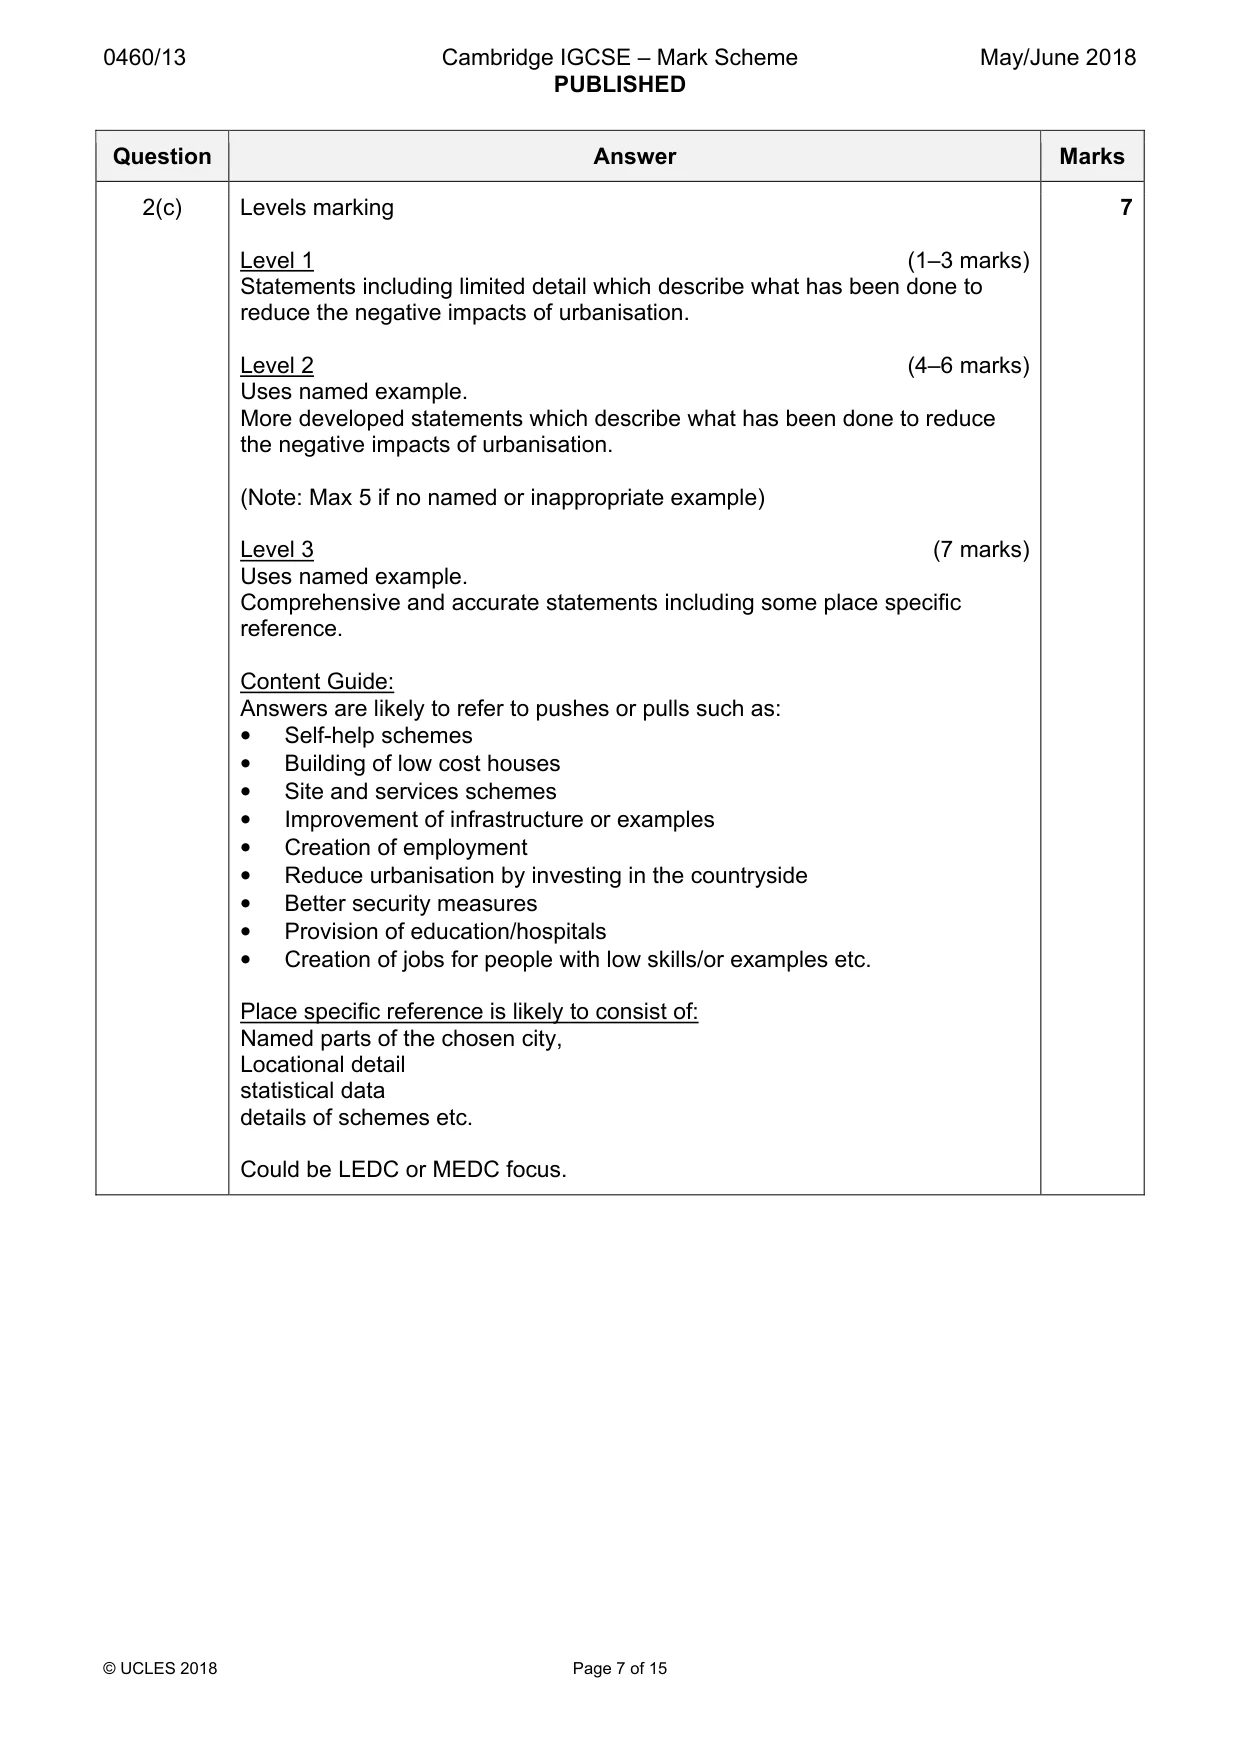
0460/13 Cambridge IGCSE – Mark Scheme PUBLISHED May/June 2018 © UCLES 2018 Page 7 of 15 Question Answer Marks 2(c) Levels marking Level 1 (1–3 marks) Statements including limited detail which describe what has been done to reduce the negative impacts of urbanisation. Level 2 (4–6 marks) Uses named example. More developed statements which describe what has been done to reduce the negative impacts of urbanisation. (Note: Max 5 if no named or inappropriate example) Level 3 (7 marks) Uses named example. Comprehensive and accurate statements including some place specific reference. Content Guide: Answers are likely to refer to pushes or pulls such as: • Self-help schemes • Building of low cost houses • Site and services schemes • Improvement of infrastructure or examples • Creation of employment • Reduce urbanisation by investing in the countryside • Better security measures • Provision of education/hospitals • Creation of jobs for people with low skills/or examples etc. Place specific reference is likely to consist of: Named parts of the chosen city, Locational detail statistical data details of schemes etc. Could be LEDC or MEDC focus. 7
Mark scheme, page 8
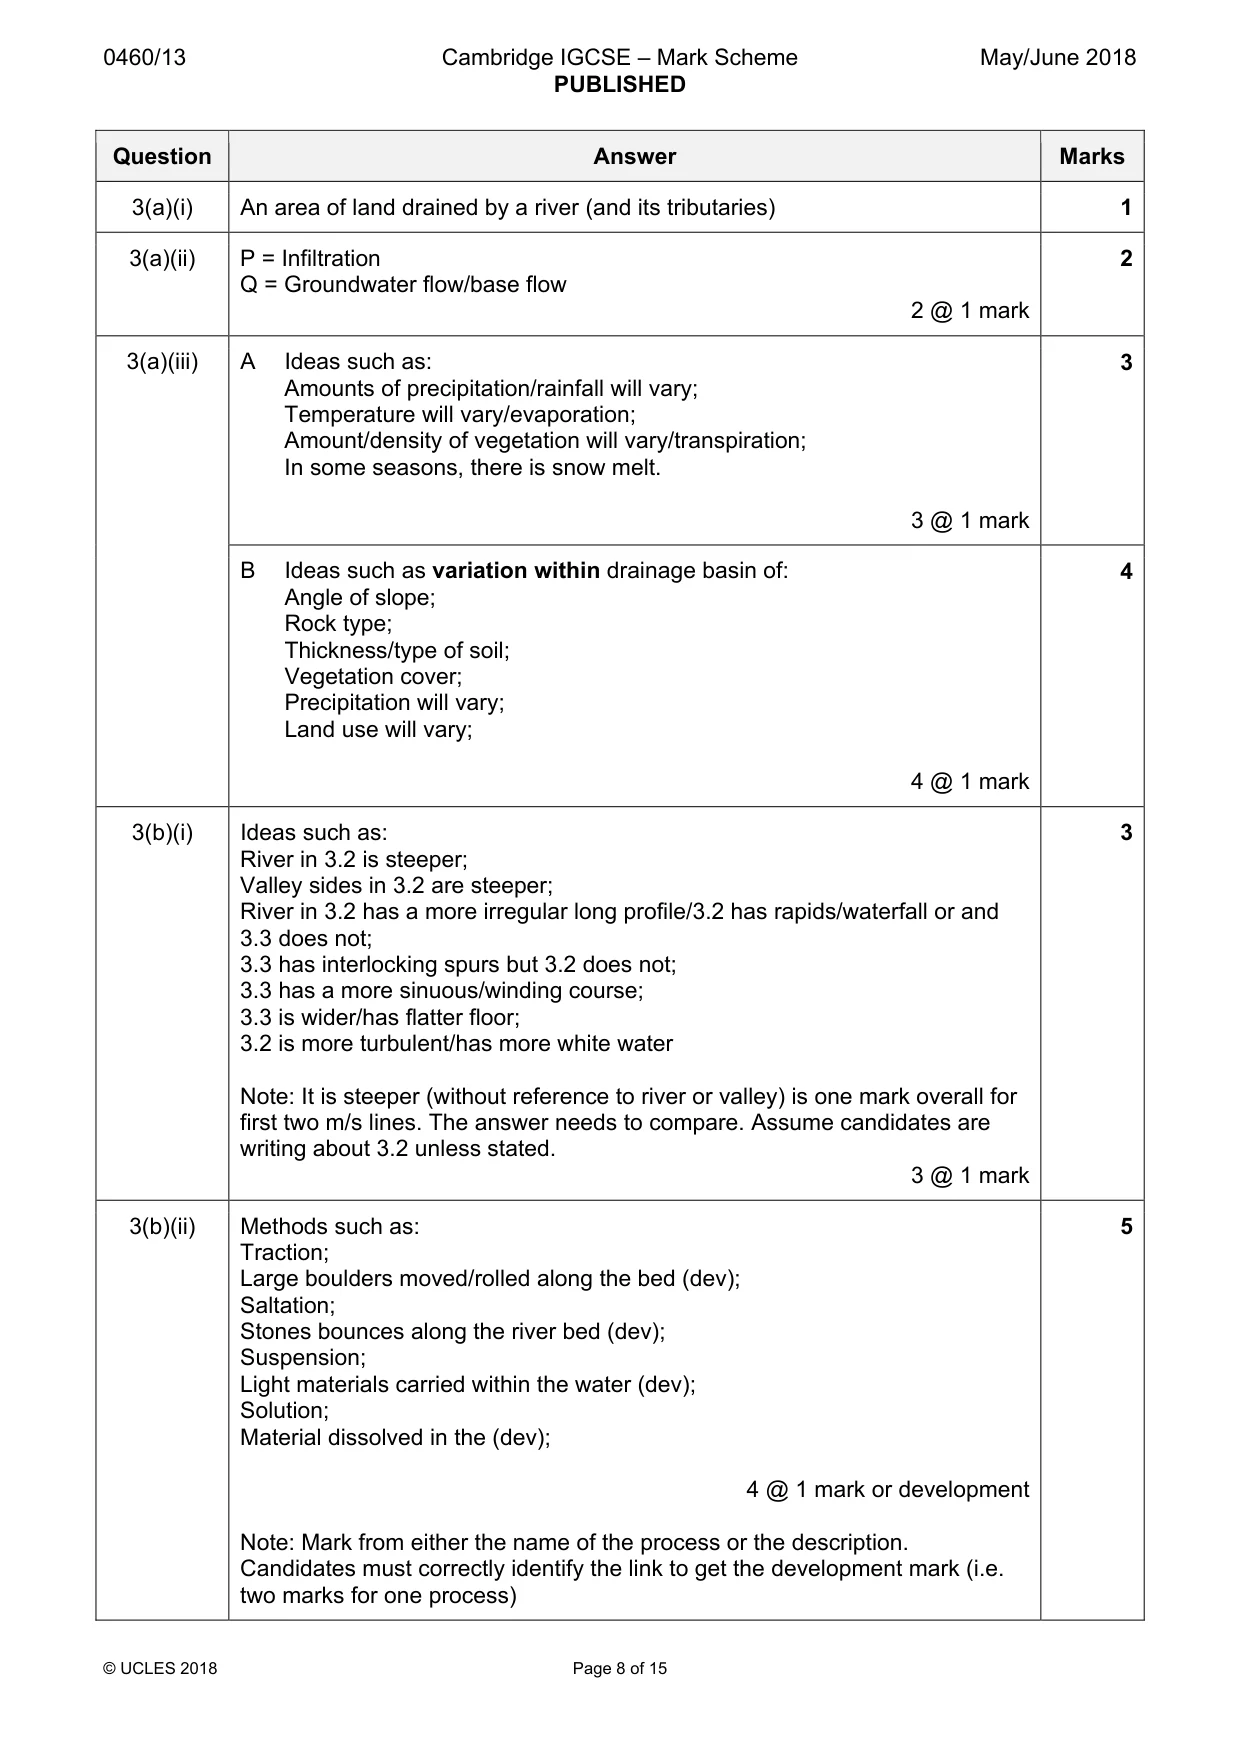
0460/13 Cambridge IGCSE – Mark Scheme PUBLISHED May/June 2018 © UCLES 2018 Page 8 of 15 Question Answer Marks 3(a)(i) An area of land drained by a river (and its tributaries) 1 3(a)(ii) P = Infiltration Q = Groundwater flow/base flow 2 @ 1 mark 2 3(a)(iii) A Ideas such as: Amounts of precipitation/rainfall will vary; Temperature will vary/evaporation; Amount/density of vegetation will vary/transpiration; In some seasons, there is snow melt. 3 @ 1 mark 3 B Ideas such as variation within drainage basin of: Angle of slope; Rock type; Thickness/type of soil; Vegetation cover; Precipitation will vary; Land use will vary; 4 @ 1 mark 4 3(b)(i) Ideas such as: River in 3.2 is steeper; Valley sides in 3.2 are steeper; River in 3.2 has a more irregular long profile/3.2 has rapids/waterfall or and 3.3 does not; 3.3 has interlocking spurs but 3.2 does not; 3.3 has a more sinuous/winding course; 3.3 is wider/has flatter floor; 3.2 is more turbulent/has more white water Note: It is steeper (without reference to river or valley) is one mark overall for first two m/s lines. The answer needs to compare. Assume candidates are writing about 3.2 unless stated. 3 @ 1 mark 3 3(b)(ii) Methods such as: Traction; Large boulders moved/rolled along the bed (dev); Saltation; Stones bounces along the river bed (dev); Suspension; Light materials carried within the water (dev); Solution; Material dissolved in the (dev); 4 @ 1 mark or development Note: Mark from either the name of the process or the description. Candidates must correctly identify the link to get the development mark (i.e. two marks for one process) 5
Mark scheme, page 9
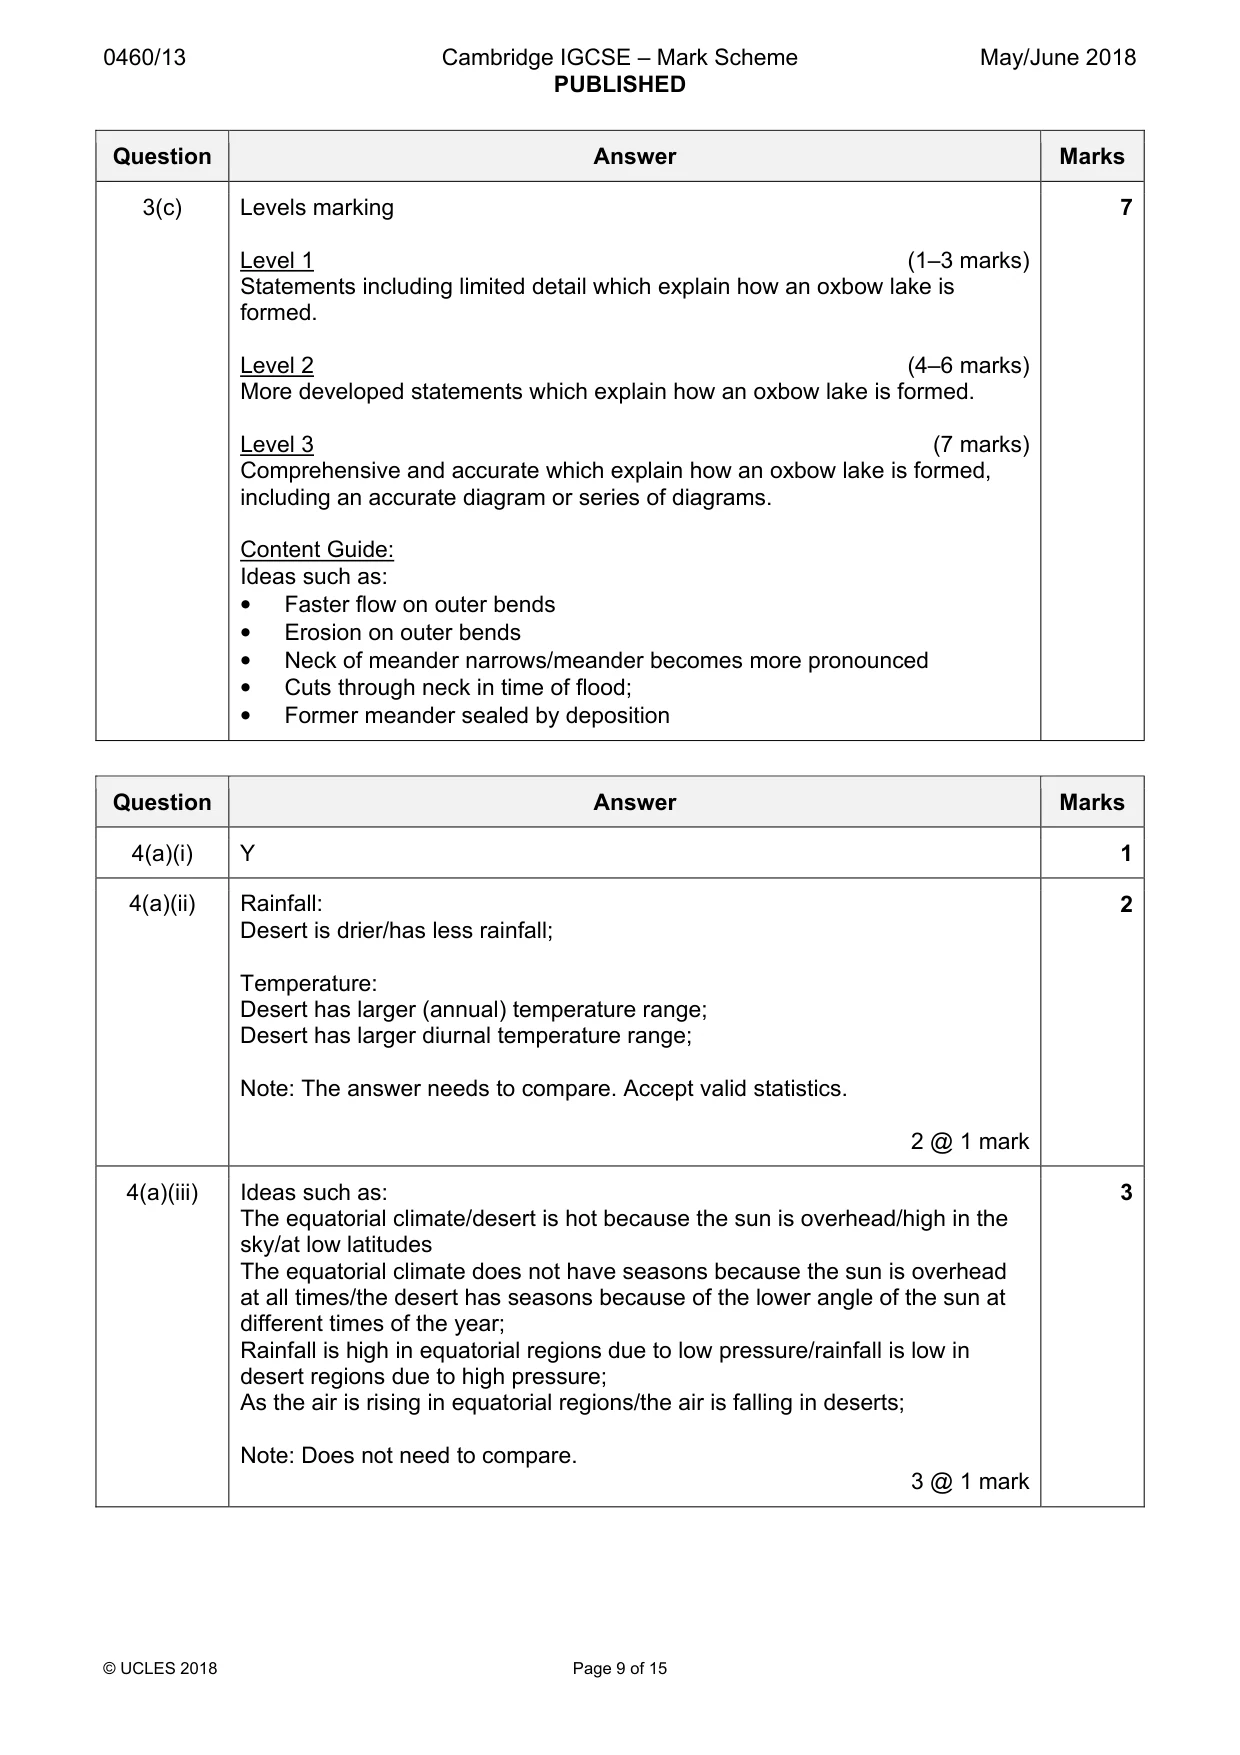
0460/13 Cambridge IGCSE – Mark Scheme PUBLISHED May/June 2018 © UCLES 2018 Page 9 of 15 Question Answer Marks 3(c) Levels marking Level 1 (1–3 marks) Statements including limited detail which explain how an oxbow lake is formed. Level 2 (4–6 marks) More developed statements which explain how an oxbow lake is formed. Level 3 (7 marks) Comprehensive and accurate which explain how an oxbow lake is formed, including an accurate diagram or series of diagrams. Content Guide: Ideas such as: • Faster flow on outer bends • Erosion on outer bends • Neck of meander narrows/meander becomes more pronounced • Cuts through neck in time of flood; • Former meander sealed by deposition 7 Question Answer Marks 4(a)(i) Y 1 4(a)(ii) Rainfall: Desert is drier/has less rainfall; Temperature: Desert has larger (annual) temperature range; Desert has larger diurnal temperature range; Note: The answer needs to compare. Accept valid statistics. 2 @ 1 mark 2 4(a)(iii) Ideas such as: The equatorial climate/desert is hot because the sun is overhead/high in the sky/at low latitudes The equatorial climate does not have seasons because the sun is overhead at all times/the desert has seasons because of the lower angle of the sun at different times of the year; Rainfall is high in equatorial regions due to low pressure/rainfall is low in desert regions due to high pressure; As the air is rising in equatorial regions/the air is falling in deserts; Note: Does not need to compare. 3 @ 1 mark 3
Mark scheme, page 10
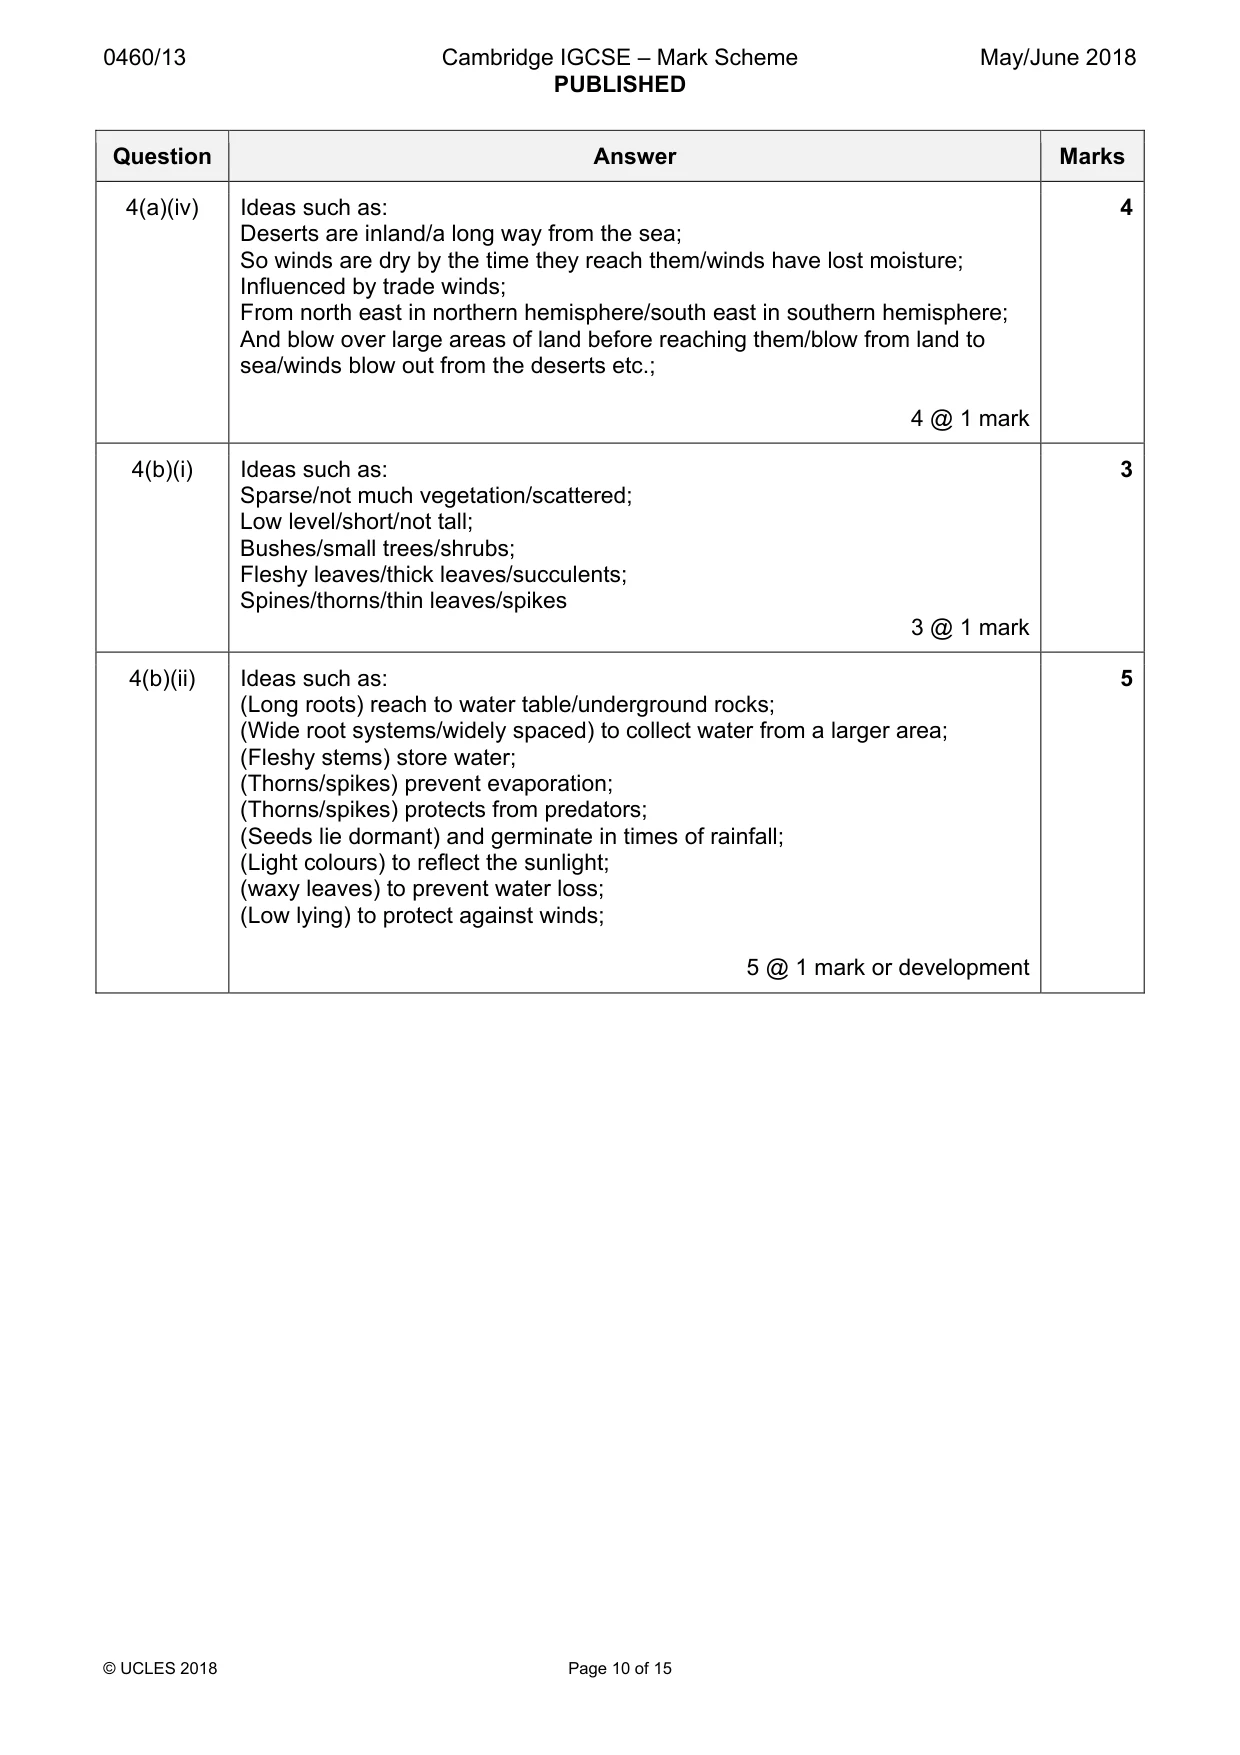
0460/13 Cambridge IGCSE – Mark Scheme PUBLISHED May/June 2018 © UCLES 2018 Page 10 of 15 Question Answer Marks 4(a)(iv) Ideas such as: Deserts are inland/a long way from the sea; So winds are dry by the time they reach them/winds have lost moisture; Influenced by trade winds; From north east in northern hemisphere/south east in southern hemisphere; And blow over large areas of land before reaching them/blow from land to sea/winds blow out from the deserts etc.; 4 @ 1 mark 4 4(b)(i) Ideas such as: Sparse/not much vegetation/scattered; Low level/short/not tall; Bushes/small trees/shrubs; Fleshy leaves/thick leaves/succulents; Spines/thorns/thin leaves/spikes 3 @ 1 mark 3 4(b)(ii) Ideas such as: (Long roots) reach to water table/underground rocks; (Wide root systems/widely spaced) to collect water from a larger area; (Fleshy stems) store water; (Thorns/spikes) prevent evaporation; (Thorns/spikes) protects from predators; (Seeds lie dormant) and germinate in times of rainfall; (Light colours) to reflect the sunlight; (waxy leaves) to prevent water loss; (Low lying) to protect against winds; 5 @ 1 mark or development 5
Mark scheme, page 11
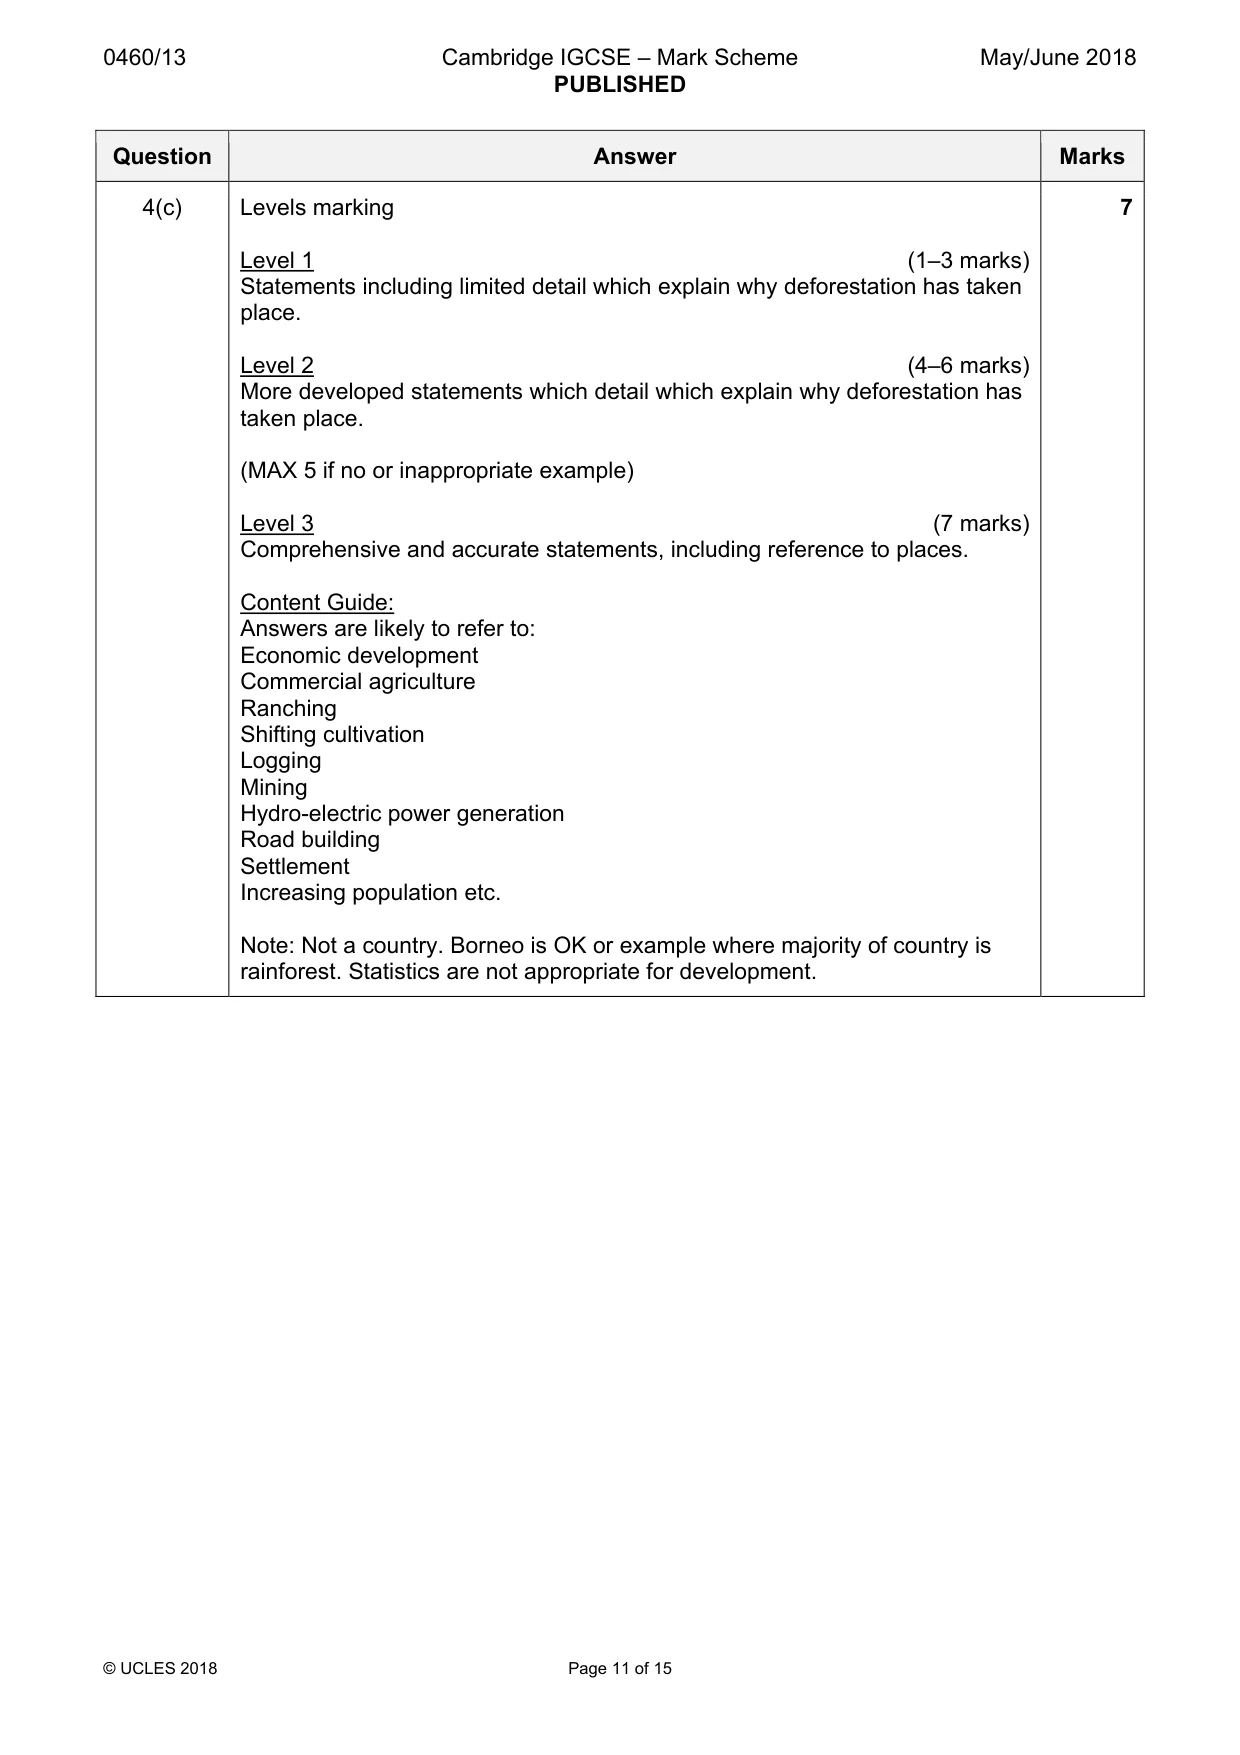
0460/13 Cambridge IGCSE – Mark Scheme PUBLISHED May/June 2018 © UCLES 2018 Page 11 of 15 Question Answer Marks 4(c) Levels marking Level 1 (1–3 marks) Statements including limited detail which explain why deforestation has taken place. Level 2 (4–6 marks) More developed statements which detail which explain why deforestation has taken place. (MAX 5 if no or inappropriate example) Level 3 (7 marks) Comprehensive and accurate statements, including reference to places. Content Guide: Answers are likely to refer to: Economic development Commercial agriculture Ranching Shifting cultivation Logging Mining Hydro-electric power generation Road building Settlement Increasing population etc. Note: Not a country. Borneo is OK or example where majority of country is rainforest. Statistics are not appropriate for development. 7
Mark scheme, page 12
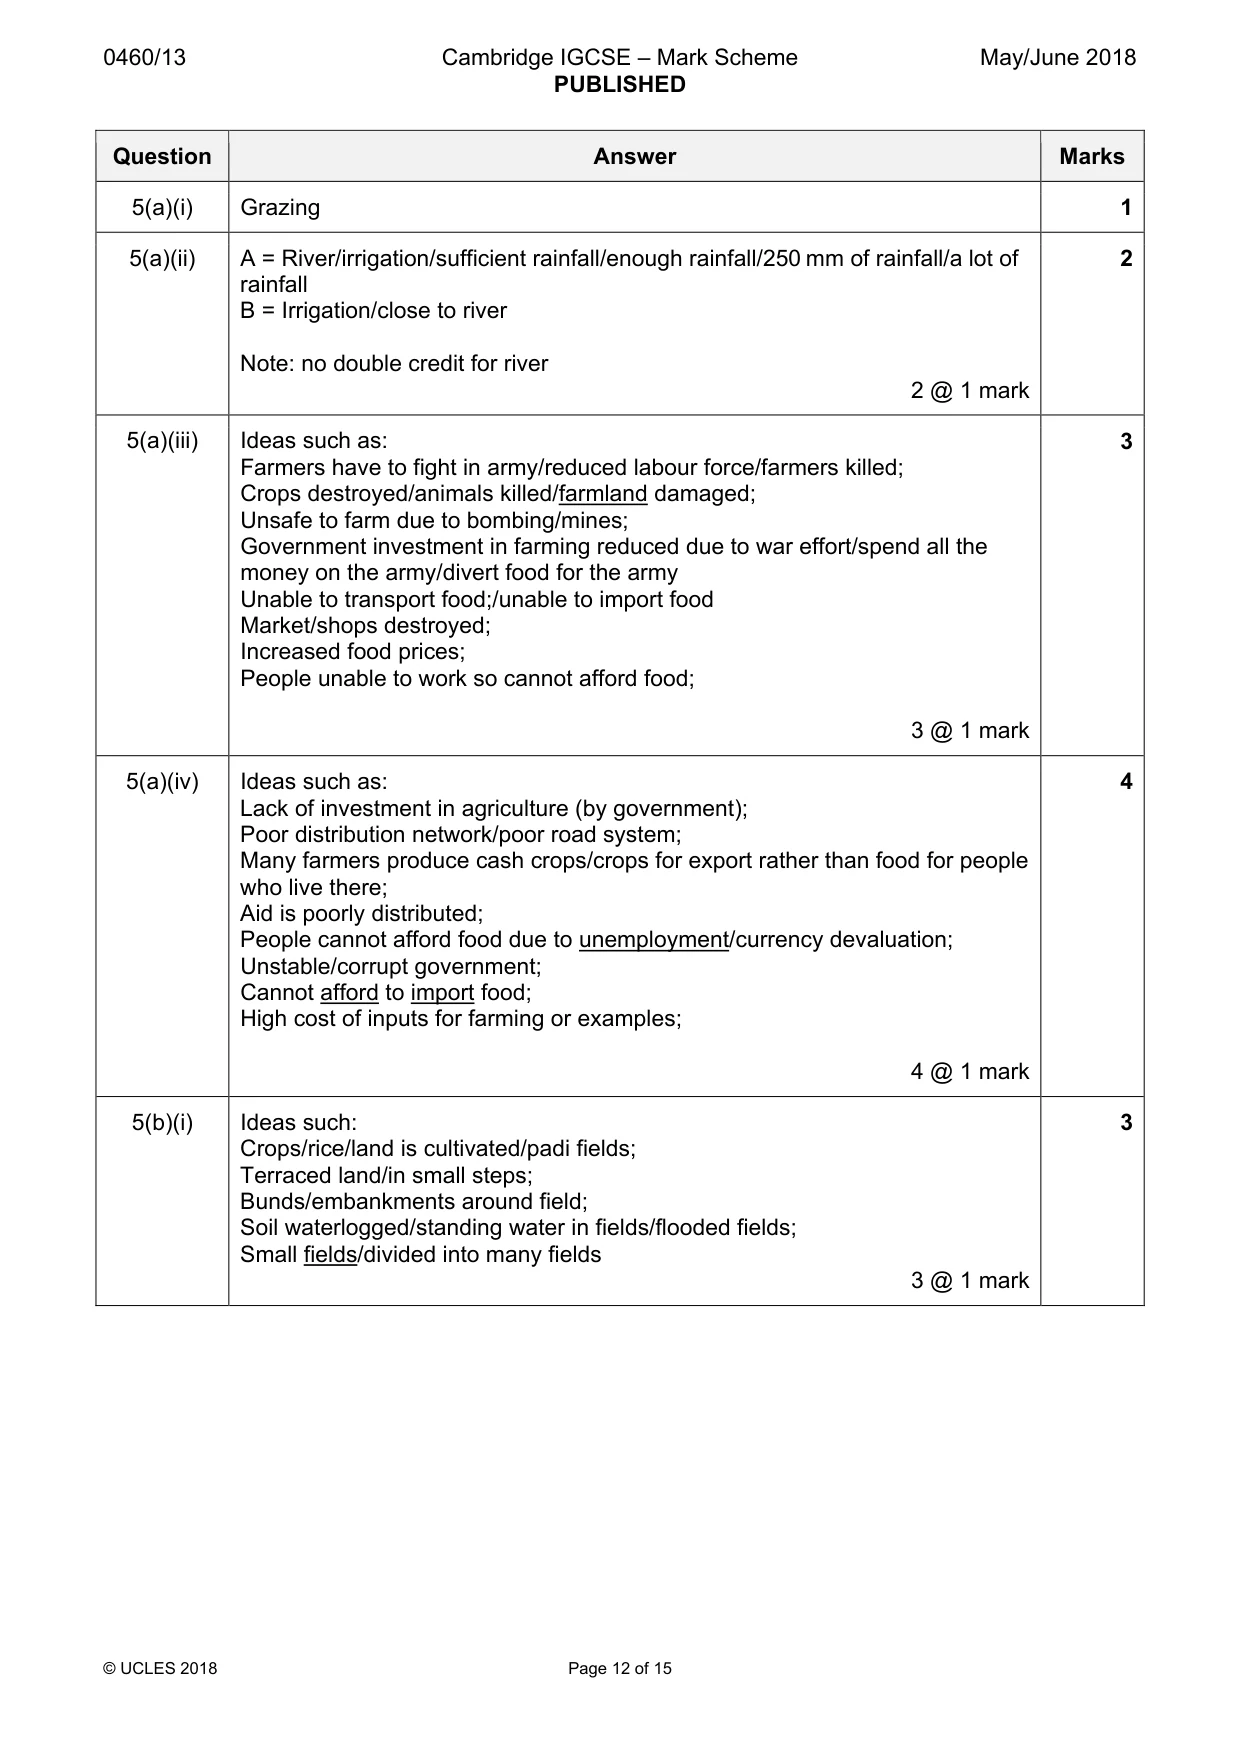
0460/13 Cambridge IGCSE – Mark Scheme PUBLISHED May/June 2018 © UCLES 2018 Page 12 of 15 Question Answer Marks 5(a)(i) Grazing 1 5(a)(ii) A = River/irrigation/sufficient rainfall/enough rainfall/250 mm of rainfall/a lot of rainfall B = Irrigation/close to river Note: no double credit for river 2 @ 1 mark 2 5(a)(iii) Ideas such as: Farmers have to fight in army/reduced labour force/farmers killed; Crops destroyed/animals killed/farmland damaged; Unsafe to farm due to bombing/mines; Government investment in farming reduced due to war effort/spend all the money on the army/divert food for the army Unable to transport food;/unable to import food Market/shops destroyed; Increased food prices; People unable to work so cannot afford food; 3 @ 1 mark 3 5(a)(iv) Ideas such as: Lack of investment in agriculture (by government); Poor distribution network/poor road system; Many farmers produce cash crops/crops for export rather than food for people who live there; Aid is poorly distributed; People cannot afford food due to unemployment/currency devaluation; Unstable/corrupt government; Cannot afford to import food; High cost of inputs for farming or examples; 4 @ 1 mark 4 5(b)(i) Ideas such: Crops/rice/land is cultivated/padi fields; Terraced land/in small steps; Bunds/embankments around field; Soil waterlogged/standing water in fields/flooded fields; Small fields/divided into many fields 3 @ 1 mark 3
Mark scheme, page 13
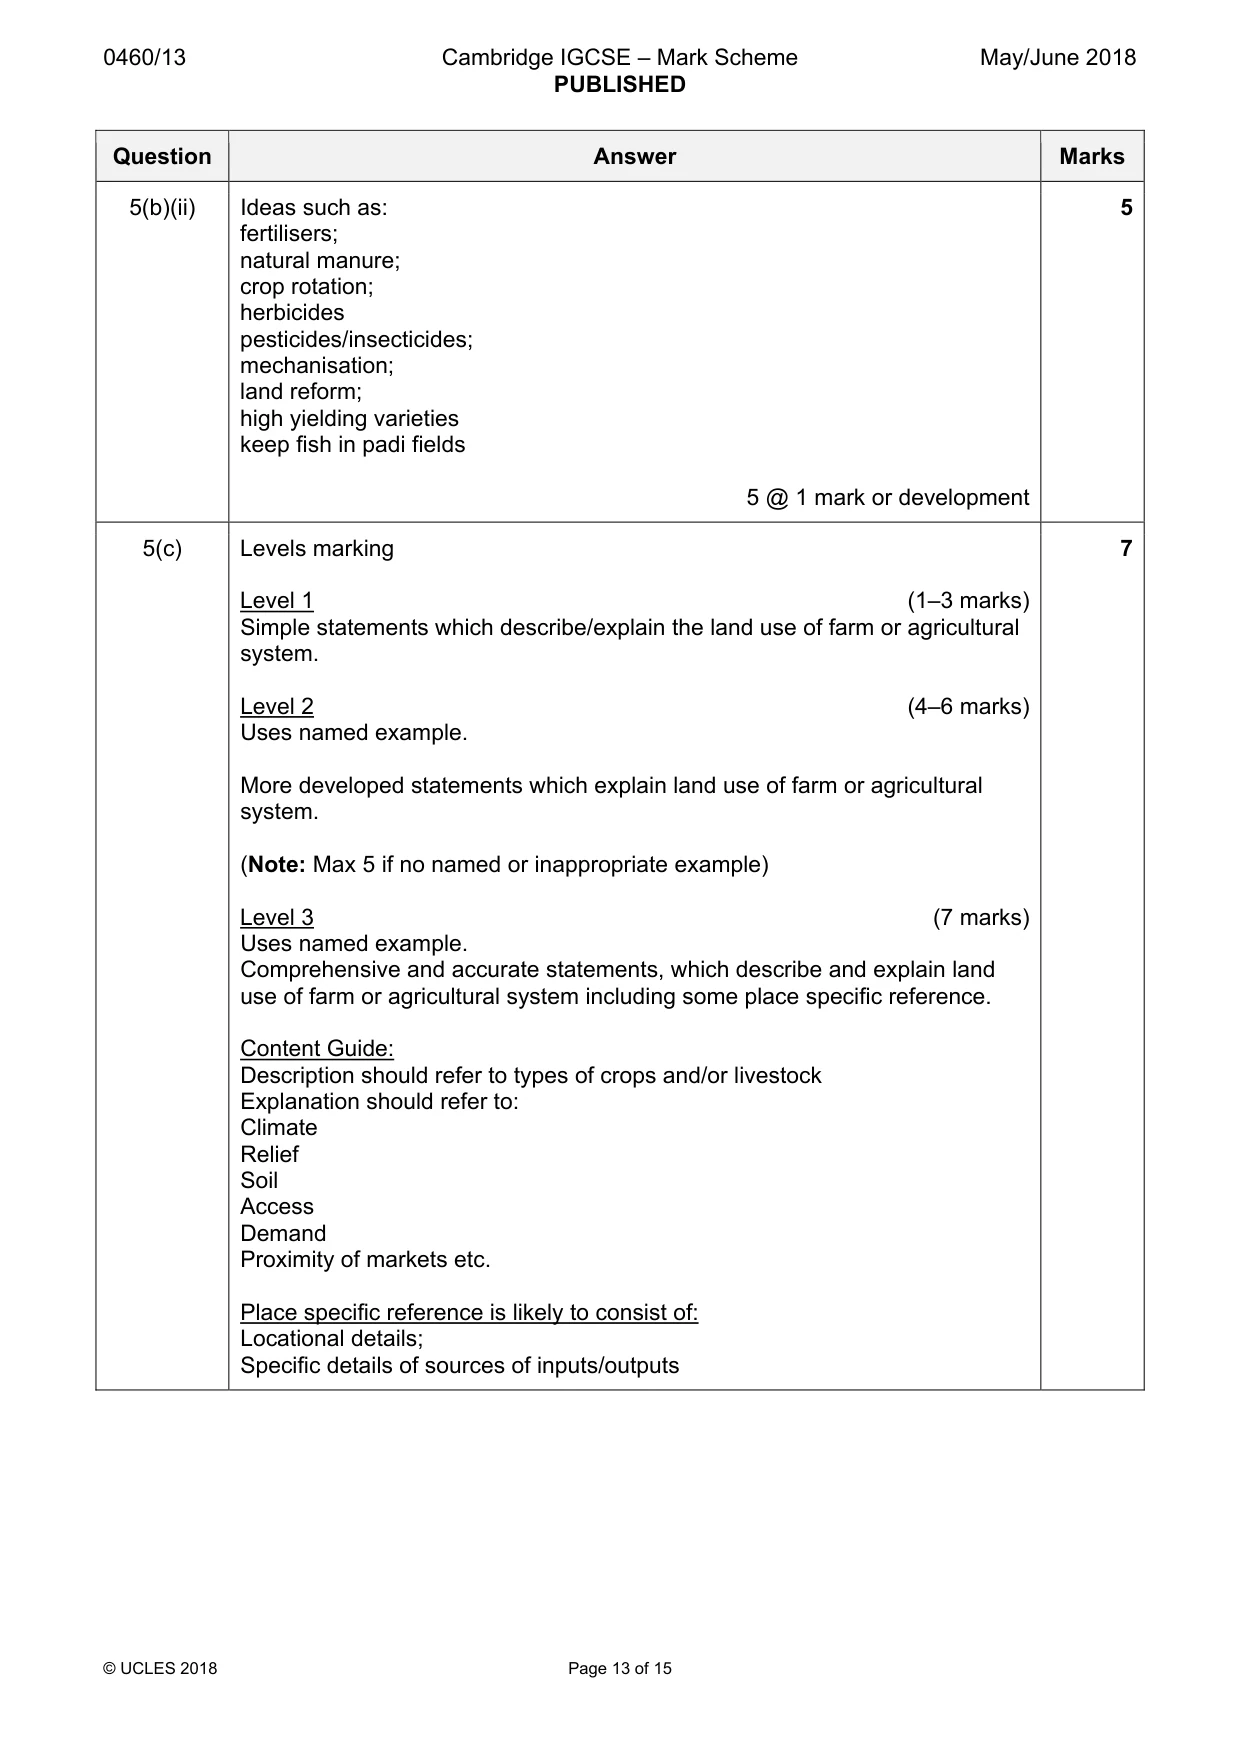
0460/13 Cambridge IGCSE – Mark Scheme PUBLISHED May/June 2018 © UCLES 2018 Page 13 of 15 Question Answer Marks 5(b)(ii) Ideas such as: fertilisers; natural manure; crop rotation; herbicides pesticides/insecticides; mechanisation; land reform; high yielding varieties keep fish in padi fields 5 @ 1 mark or development 5 5(c) Levels marking Level 1 (1–3 marks) Simple statements which describe/explain the land use of farm or agricultural system. Level 2 (4–6 marks) Uses named example. More developed statements which explain land use of farm or agricultural system. (Note: Max 5 if no named or inappropriate example) Level 3 (7 marks) Uses named example. Comprehensive and accurate statements, which describe and explain land use of farm or agricultural system including some place specific reference. Content Guide: Description should refer to types of crops and/or livestock Explanation should refer to: Climate Relief Soil Access Demand Proximity of markets etc. Place specific reference is likely to consist of: Locational details; Specific details of sources of inputs/outputs 7
Mark scheme, page 14
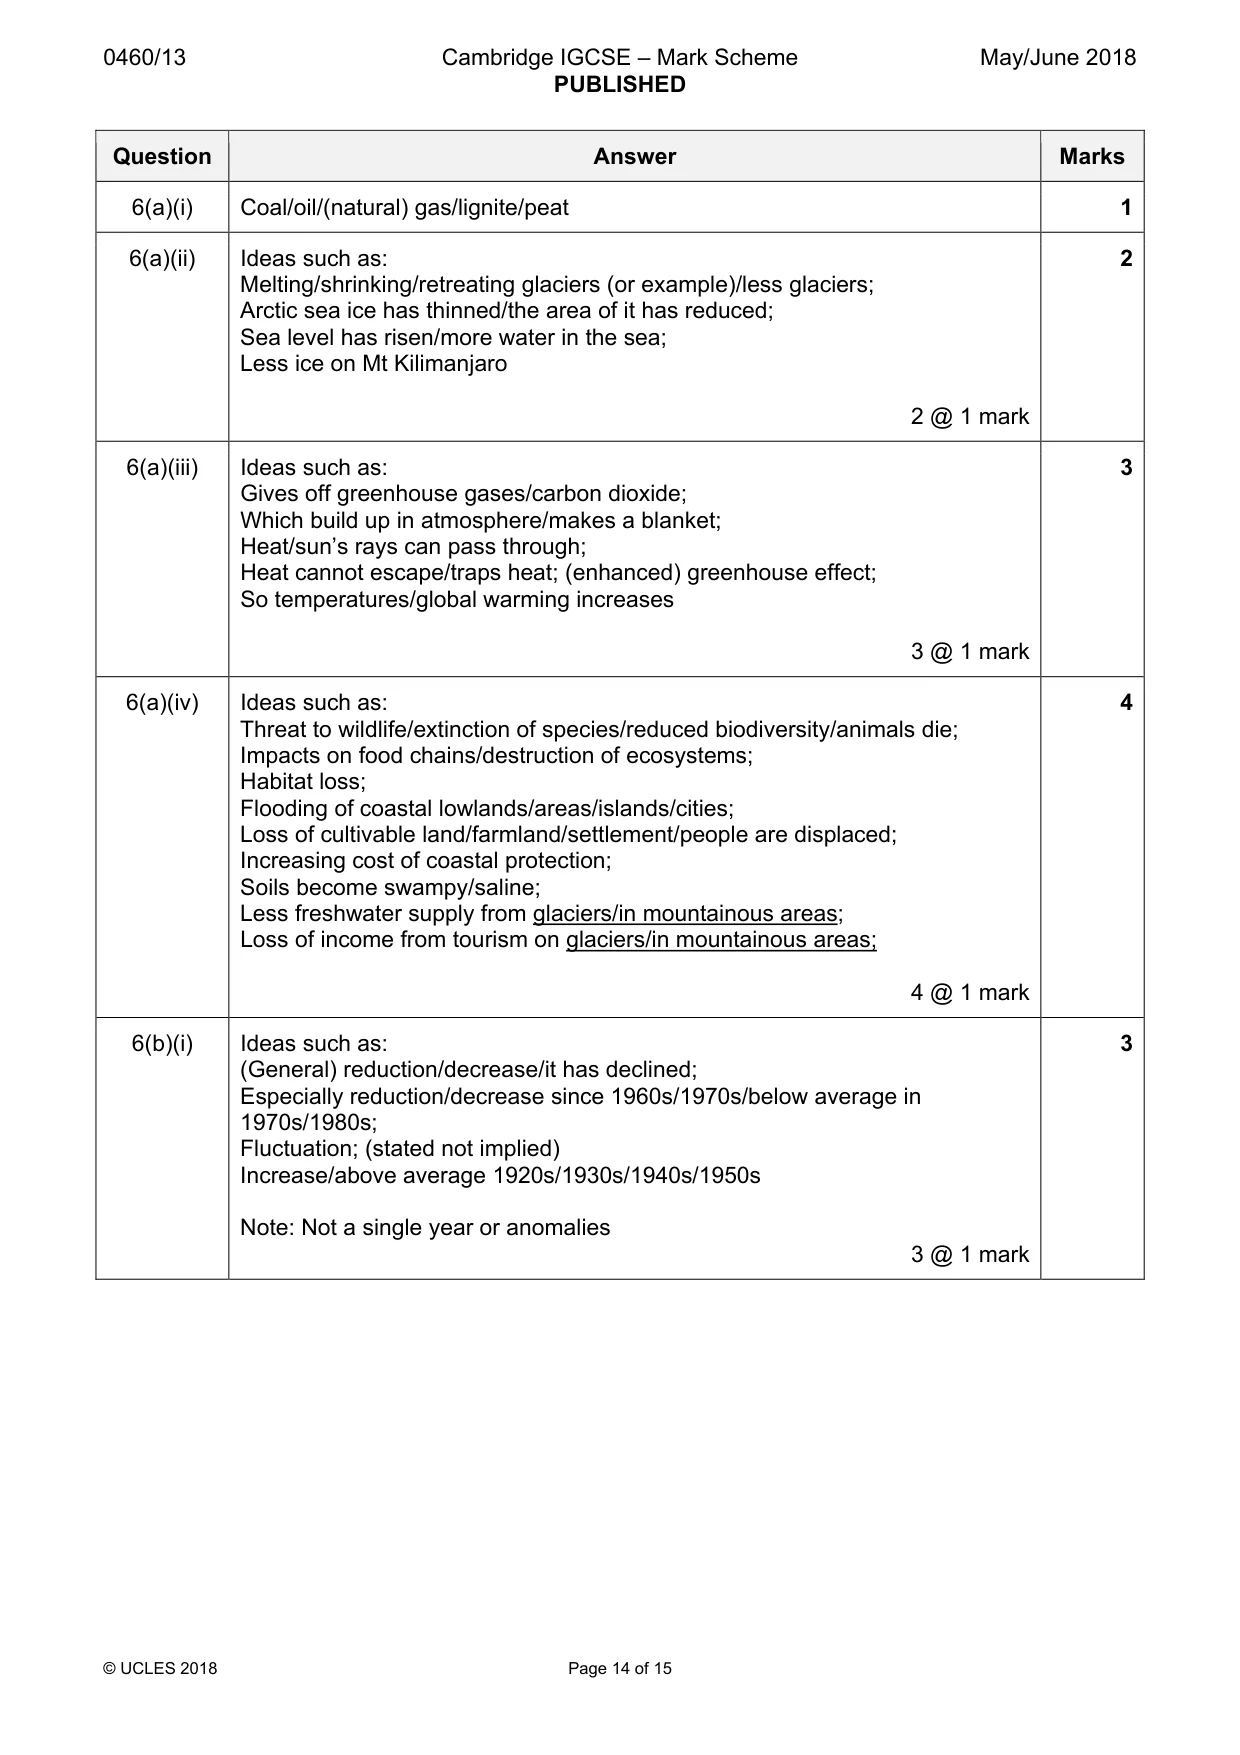
0460/13 Cambridge IGCSE – Mark Scheme PUBLISHED May/June 2018 © UCLES 2018 Page 14 of 15 Question Answer Marks 6(a)(i) Coal/oil/(natural) gas/lignite/peat 1 6(a)(ii) Ideas such as: Melting/shrinking/retreating glaciers (or example)/less glaciers; Arctic sea ice has thinned/the area of it has reduced; Sea level has risen/more water in the sea; Less ice on Mt Kilimanjaro 2 @ 1 mark 2 6(a)(iii) Ideas such as: Gives off greenhouse gases/carbon dioxide; Which build up in atmosphere/makes a blanket; Heat/sun’s rays can pass through; Heat cannot escape/traps heat; (enhanced) greenhouse effect; So temperatures/global warming increases 3 @ 1 mark 3 6(a)(iv) Ideas such as: Threat to wildlife/extinction of species/reduced biodiversity/animals die; Impacts on food chains/destruction of ecosystems; Habitat loss; Flooding of coastal lowlands/areas/islands/cities; Loss of cultivable land/farmland/settlement/people are displaced; Increasing cost of coastal protection; Soils become swampy/saline; Less freshwater supply from glaciers/in mountainous areas; Loss of income from tourism on glaciers/in mountainous areas; 4 @ 1 mark 4 6(b)(i) Ideas such as: (General) reduction/decrease/it has declined; Especially reduction/decrease since 1960s/1970s/below average in 1970s/1980s; Fluctuation; (stated not implied) Increase/above average 1920s/1930s/1940s/1950s Note: Not a single year or anomalies 3 @ 1 mark 3
Mark scheme, page 15
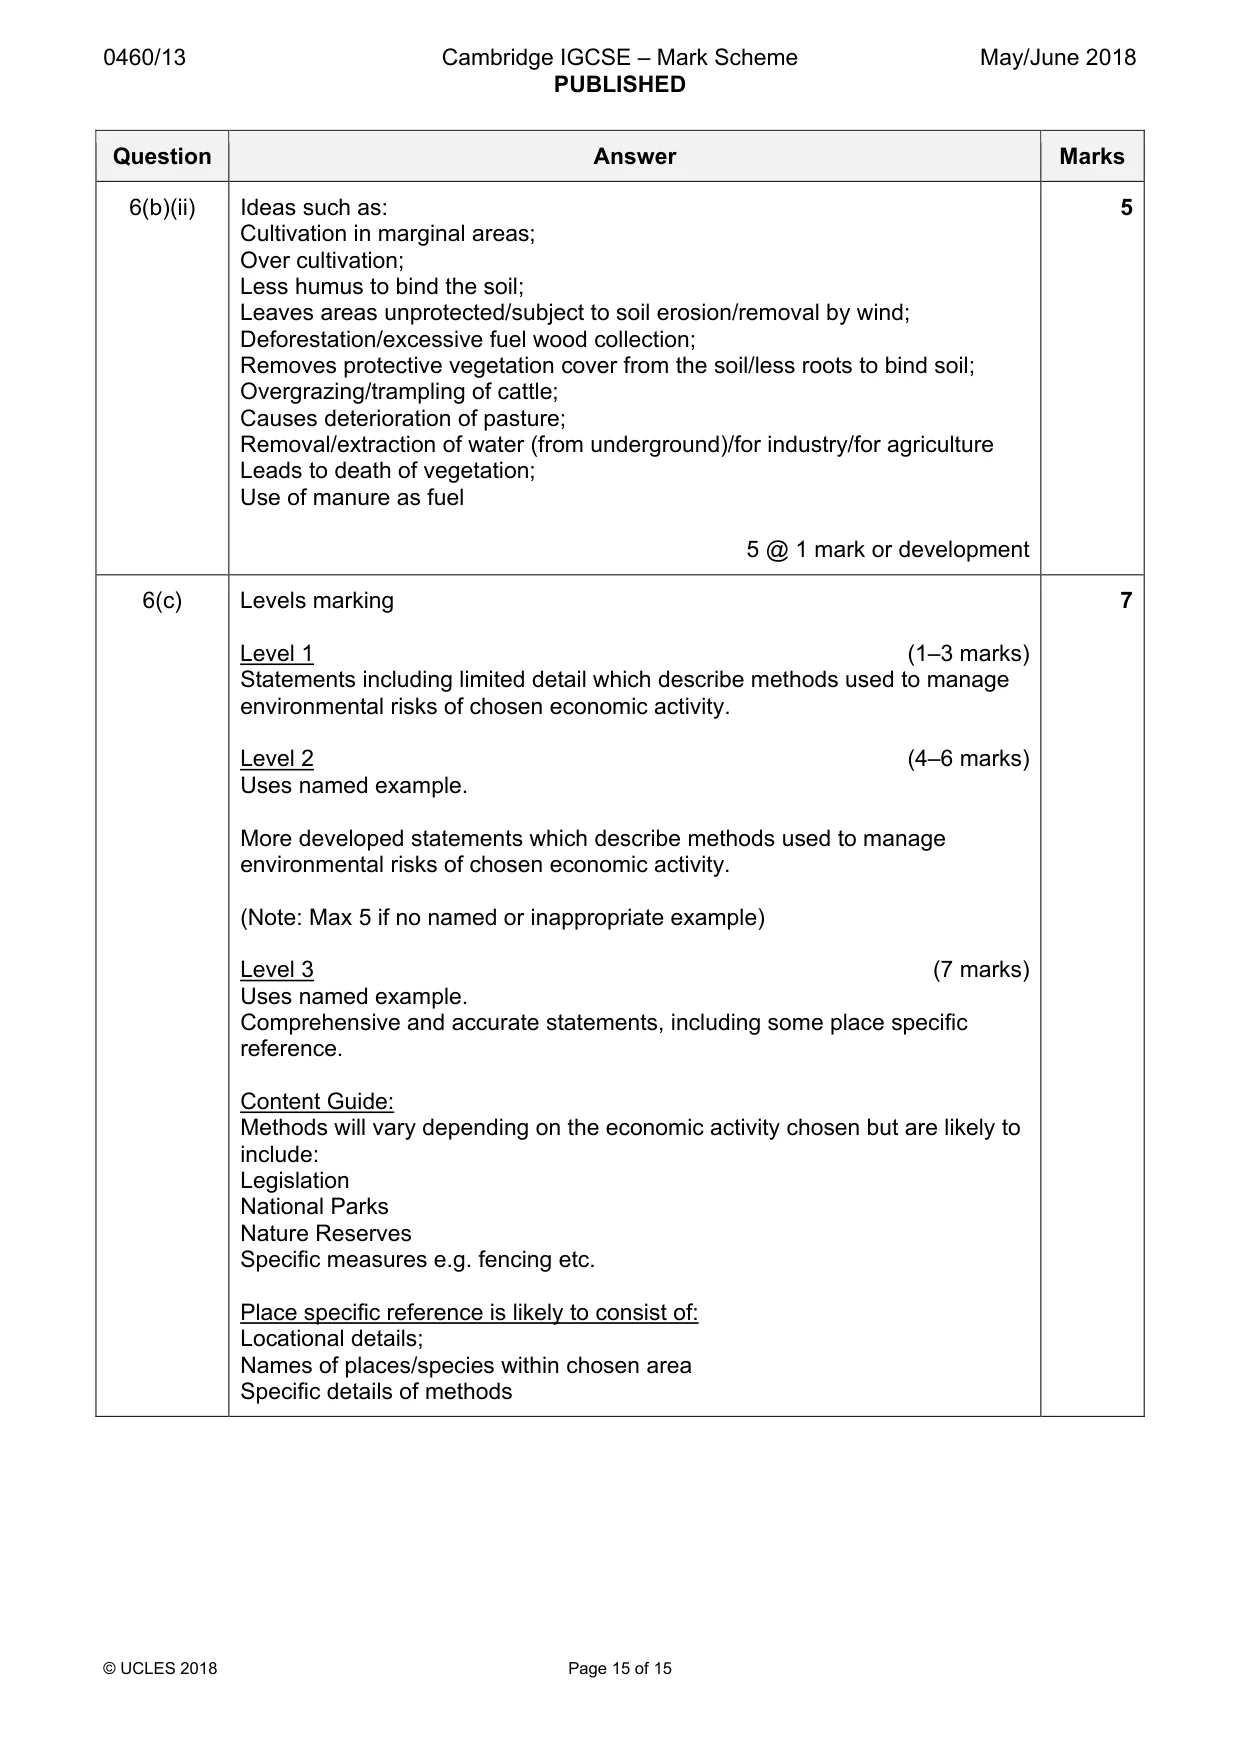
0460/13 Cambridge IGCSE – Mark Scheme PUBLISHED May/June 2018 © UCLES 2018 Page 15 of 15 Question Answer Marks 6(b)(ii) Ideas such as: Cultivation in marginal areas; Over cultivation; Less humus to bind the soil; Leaves areas unprotected/subject to soil erosion/removal by wind; Deforestation/excessive fuel wood collection; Removes protective vegetation cover from the soil/less roots to bind soil; Overgrazing/trampling of cattle; Causes deterioration of pasture; Removal/extraction of water (from underground)/for industry/for agriculture Leads to death of vegetation; Use of manure as fuel 5 @ 1 mark or development 5 6(c) Levels marking Level 1 (1–3 marks) Statements including limited detail which describe methods used to manage environmental risks of chosen economic activity. Level 2 (4–6 marks) Uses named example. More developed statements which describe methods used to manage environmental risks of chosen economic activity. (Note: Max 5 if no named or inappropriate example) Level 3 (7 marks) Uses named example. Comprehensive and accurate statements, including some place specific reference. Content Guide: Methods will vary depending on the economic activity chosen but are likely to include: Legislation National Parks Nature Reserves Specific measures e.g. fencing etc. Place specific reference is likely to consist of: Locational details; Names of places/species within chosen area Specific details of methods 7
What you needed in this session
Cambridge’s own grade thresholds for 2018 May/June, Paper 1 · Variant 3. A higher threshold means an easier paper — the bar moves with how the cohort did.