Cambridge IGCSE Geography 0460 — 2018 May/June Paper 1 · Variant 2
0460/12/M/J/18 · 75 marks · ≈84 min
The question paper and its mark scheme, free to read here and free to download. This is Cambridge’s own paper, exactly as it was sat.
Question paper32 pages




Mark scheme15 pages
Answers below. Sit the paper first if you are practising.
Paper as text
Question paper, page 1
* 2 6 6 0 7 5 5 2 1 1 * This syllabus is approved for use in England, Wales and Northern Ireland as a Cambridge International Level 1/Level 2 Certificate. This document consists of 29 printed pages, 3 blank pages and 1 Insert. DC (SC/FC) 145682/5 © UCLES 2018 [Turn over Cambridge International Examinations Cambridge International General Certificate of Secondary Education GEOGRAPHY 0460/12 Paper 1 May/June 2018 1 hour 45 minutes Candidates answer on the Question Paper. Additional Materials: Ruler Calculator READ THESE INSTRUCTIONS FIRST Write your Centre number, candidate number and name in the spaces provided. Write in dark blue or black pen. You may use an HB pencil for any diagrams or graphs. Do not use staples, paper clips, glue or correction fluid. DO NOT WRITE IN ANY BARCODES. Write your answer to each question in the space provided. If additional space is required, you should use the lined pages at the end of this booklet. The question number(s) must be clearly shown. Answer three questions, one from each section. The Insert contains Figs. 1.1, 1.2 and 1.3 for Question 1, Fig. 4.2 for Question 4, and Figs. 6.1 and 6.2 for Question 6. The Insert is not required by the Examiner. Sketch maps and diagrams should be drawn whenever they serve to illustrate an answer. At the end of the examination, fasten all your work securely together. The number of marks is given in brackets [ ] at the end of each question or part question. Definitions MEDCs – More Economically Developed Countries LEDCs – Less Economically Developed Countries
Question paper, page 2
2 0460/12/M/J/18 © UCLES 2018 Section A Answer one question from this section. 1 (a) Study Fig. 1.1 (Insert), which shows information about population density. (i) What is meant by densely populated? … …[1] (ii) The continent of Africa had a population of 1166 million in 2015. The land area is 30.22 million square kilometres. Calculate the population density of Africa. You should show your calculations in the box below. Give your answer to 2 decimal places. … per sq km [2] (iii) Describe the distribution of population in Africa. … … … … … …[3]
Question paper, page 3
3 0460/12/M/J/18 © UCLES 2018 [Turn over (iv) Explain how different physical factors influence population density. … … … … … … … …[4] (b) Study Figs. 1.2 and 1.3 (Insert), which are photographs showing areas of two different islands in the Maldives. Fig. 1.2 shows the island of Male. Fig. 1.3 shows the island of Maamendhoo. (i) Give three pieces of evidence from Figs. 1.2 and 1.3 which suggest that Male is more densely populated than Maamendhoo. 1 … … 2 … … 3 … …[3]
Question paper, page 4
4 0460/12/M/J/18 © UCLES 2018 (ii) Some densely populated areas may become overpopulated. Suggest likely problems which may be faced by people living in Male if it became overpopulated. … … … … … … … … … …[5]
Question paper, page 5
5 0460/12/M/J/18 © UCLES 2018 [Turn over (c) For a named country you have studied, explain why people migrate from it to other countries. Name of country … … … … … … … … … … … … … … … … … … … … … … … … …[7] [Total: 25]
Question paper, page 6
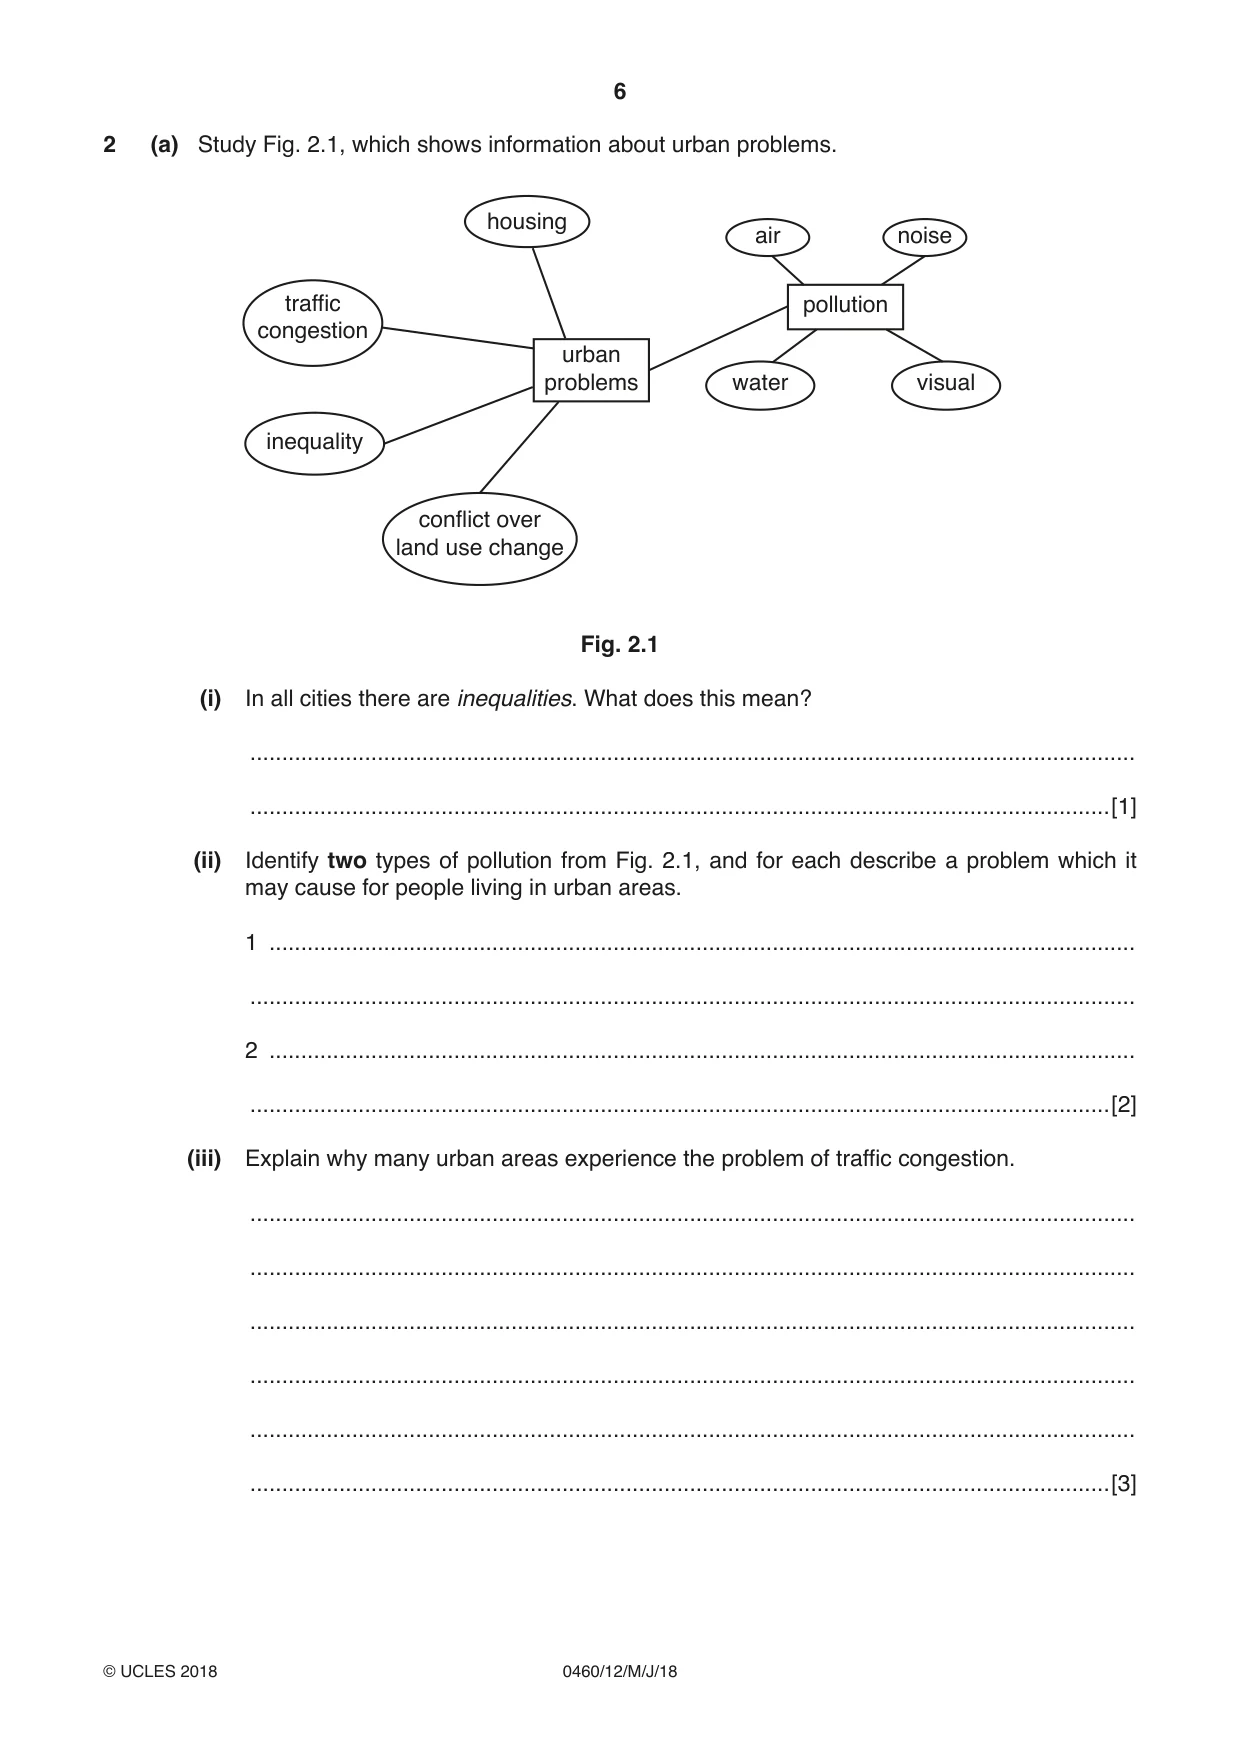
6 0460/12/M/J/18 © UCLES 2018 2 (a) Study Fig. 2.1, which shows information about urban problems. urban problems housing traffic congestion inequality conflict over land use change pollution air noise visual water Fig. 2.1 (i) In all cities there are inequalities. What does this mean? … …[1] (ii) Identify two types of pollution from Fig. 2.1, and for each describe a problem which it may cause for people living in urban areas. 1 … … 2 … …[2] (iii) Explain why many urban areas experience the problem of traffic congestion. … … … … … …[3]
Question paper, page 7
7 0460/12/M/J/18 © UCLES 2018 [Turn over (iv) Explain why many people who live in urban areas live in poor quality housing. … … … … … … … …[4]
Question paper, page 8
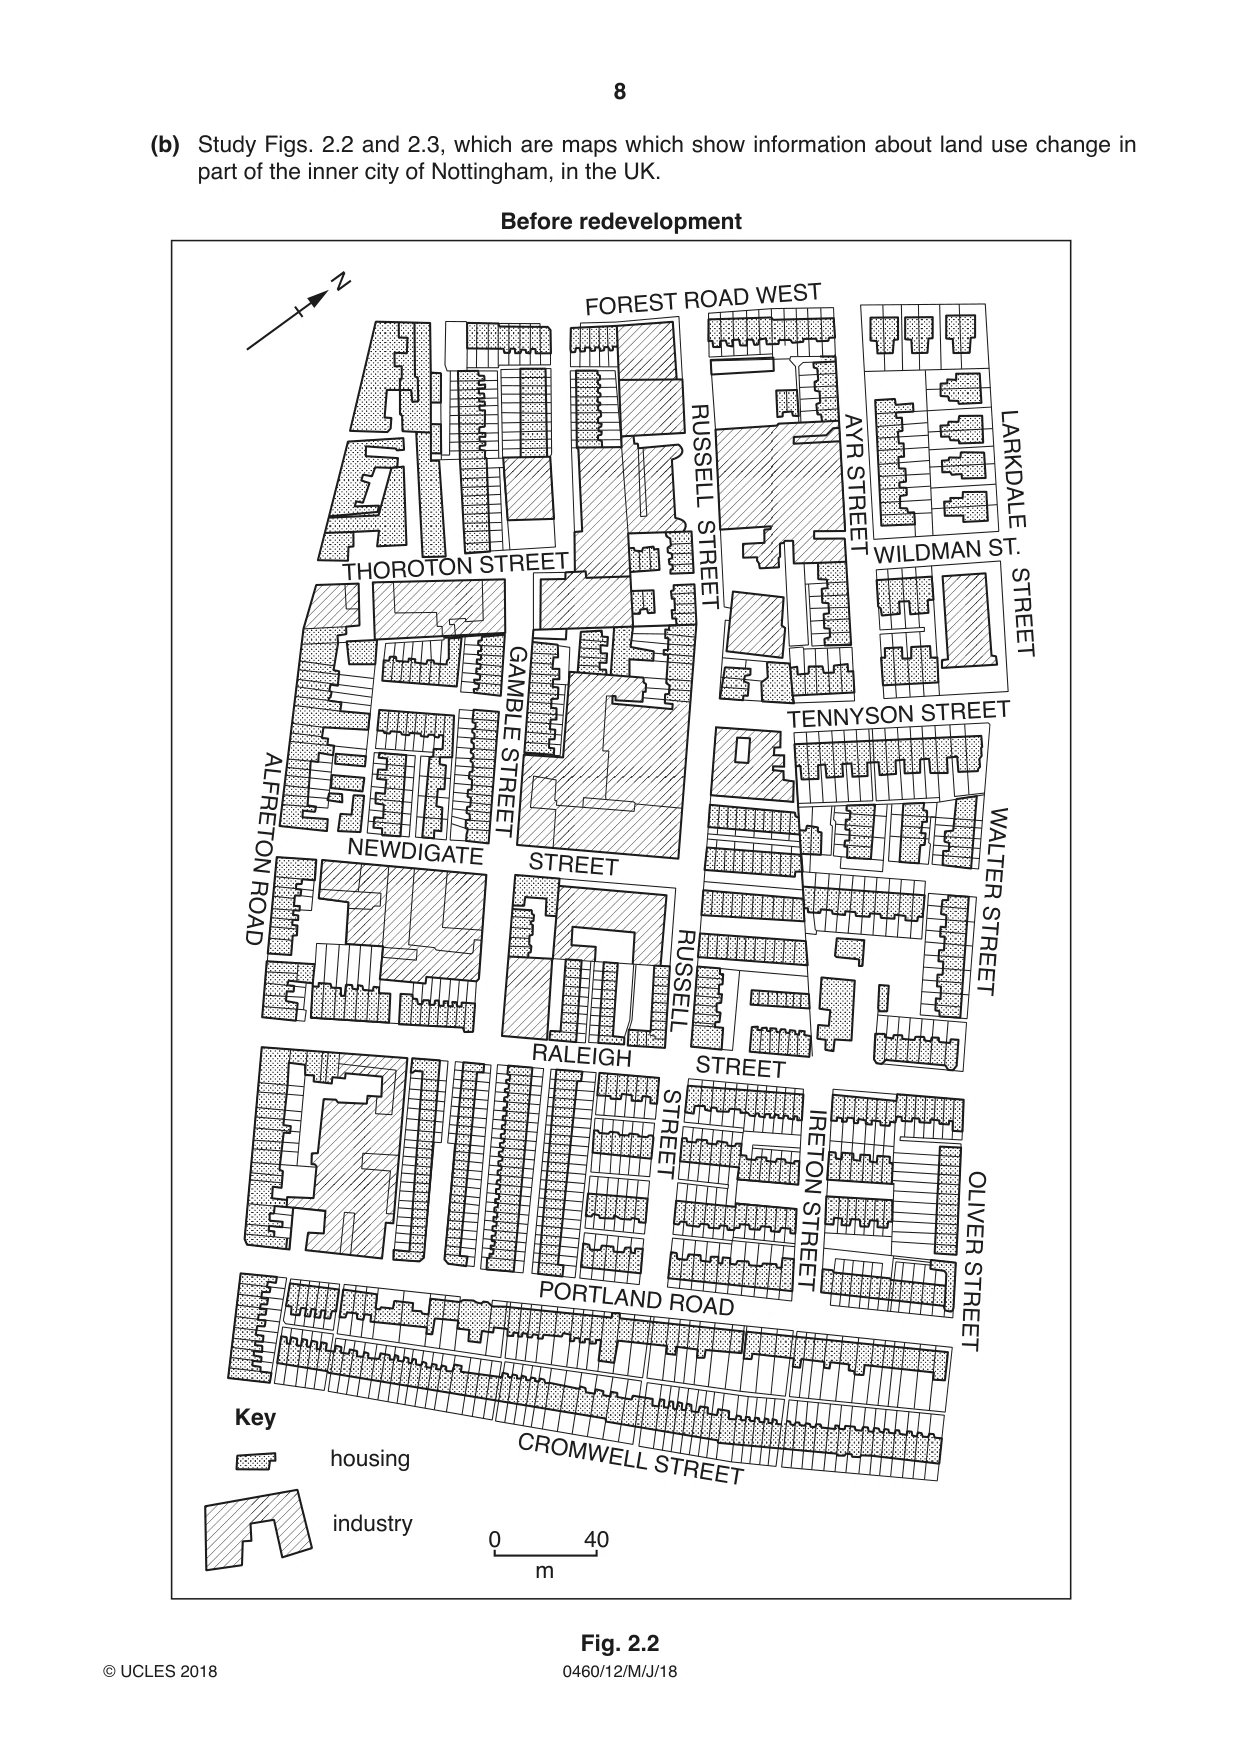
8 0460/12/M/J/18 © UCLES 2018 (b) Study Figs. 2.2 and 2.3, which are maps which show information about land use change in part of the inner city of Nottingham, in the UK. 0 40 Key housing industry m CROMWELL STREET PORTLAND ROAD OLIVER STREET IRETON STREET RUSSELL STREET RUSSELL STREET RALEIGH STREET NEWDIGATE STREET WALTER STREET TENNYSON STREET GAMBLE STREET ALFRETON ROAD THOROTON STREET FOREST ROAD WEST LARKDALE STREET WILDMAN ST. AYR STREET N Before redevelopment Fig. 2.2
Question paper, page 9
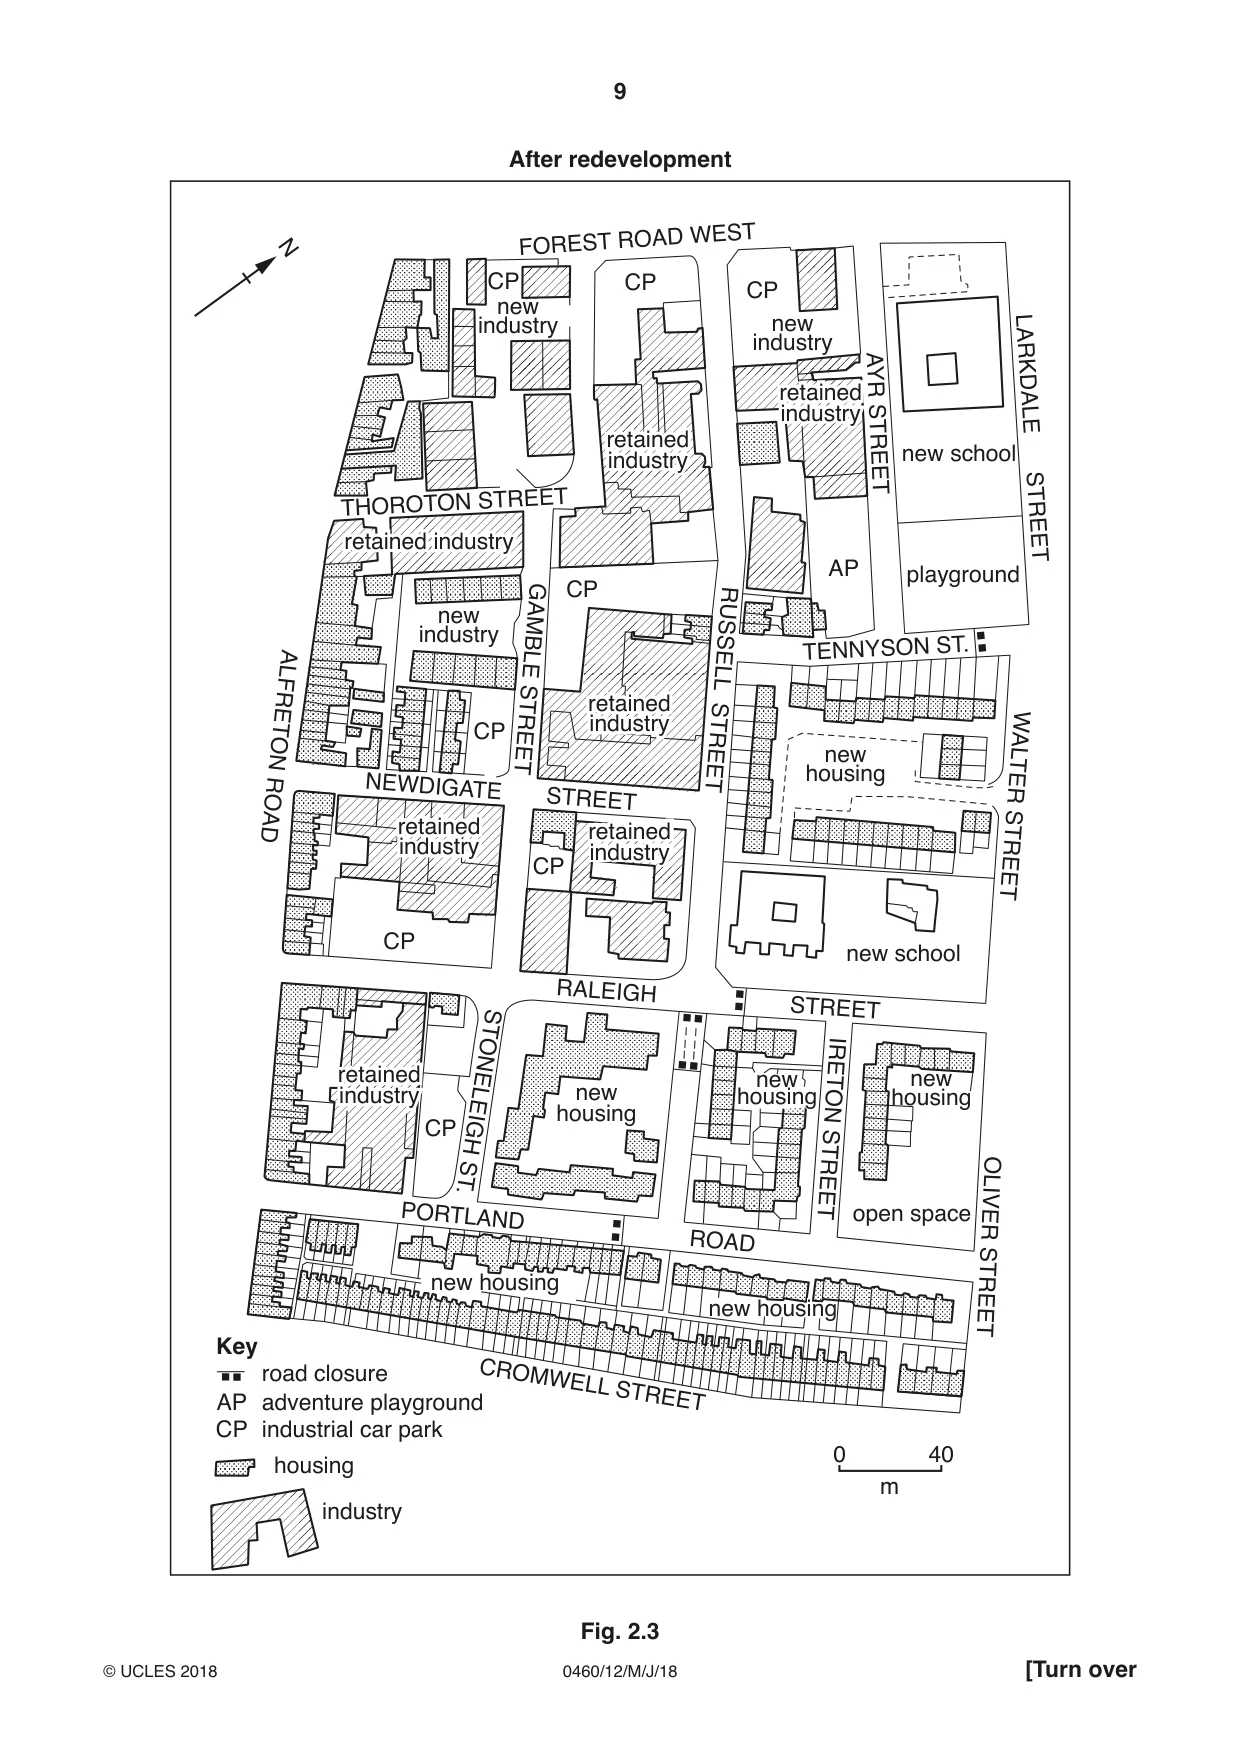
9 0460/12/M/J/18 © UCLES 2018 [Turn over N new housing new housing new housing new housing retained industry retained industry retained industry retained industry retained industry retained industry retained industry retained industry retained industry retained industry retained industry retained industry new housing new housing new school playground new industry new industry new industry new school open space new housing new housing CROMWELL STREET STONELEIGH ST. PORTLAND ROAD OLIVER STREET IRETON STREET RUSSELL STREET RALEIGH STREET NEWDIGATE STREET WALTER STREET TENNYSON ST. GAMBLE STREET ALFRETON ROAD THOROTON STREET FOREST ROAD WEST LARKDALE STREET AYR STREET CP CP CP CP CP CP CP CP CP AP AP 0 40 m Key road closure adventure playground industrial car park After redevelopment retained industry retained industry housing industry Fig. 2.3
Question paper, page 10
10 0460/12/M/J/18 © UCLES 2018 (i) Using evidence from Figs. 2.2 and 2.3 only, describe three changes which took place in the land use in the area shown. 1 … … 2 … … 3 … …[3] (ii) Suggest why these land use changes are likely to cause conflict. … … … … … … … … … …[5]
Question paper, page 11
11 0460/12/M/J/18 © UCLES 2018 [Turn over (c) For a named country you have studied, explain why internal migration takes place from rural areas to rapidly growing urban areas. Name of country … … … … … … … … … … … … … … … … … … … … … … … … …[7] [Total: 25]
Question paper, page 12
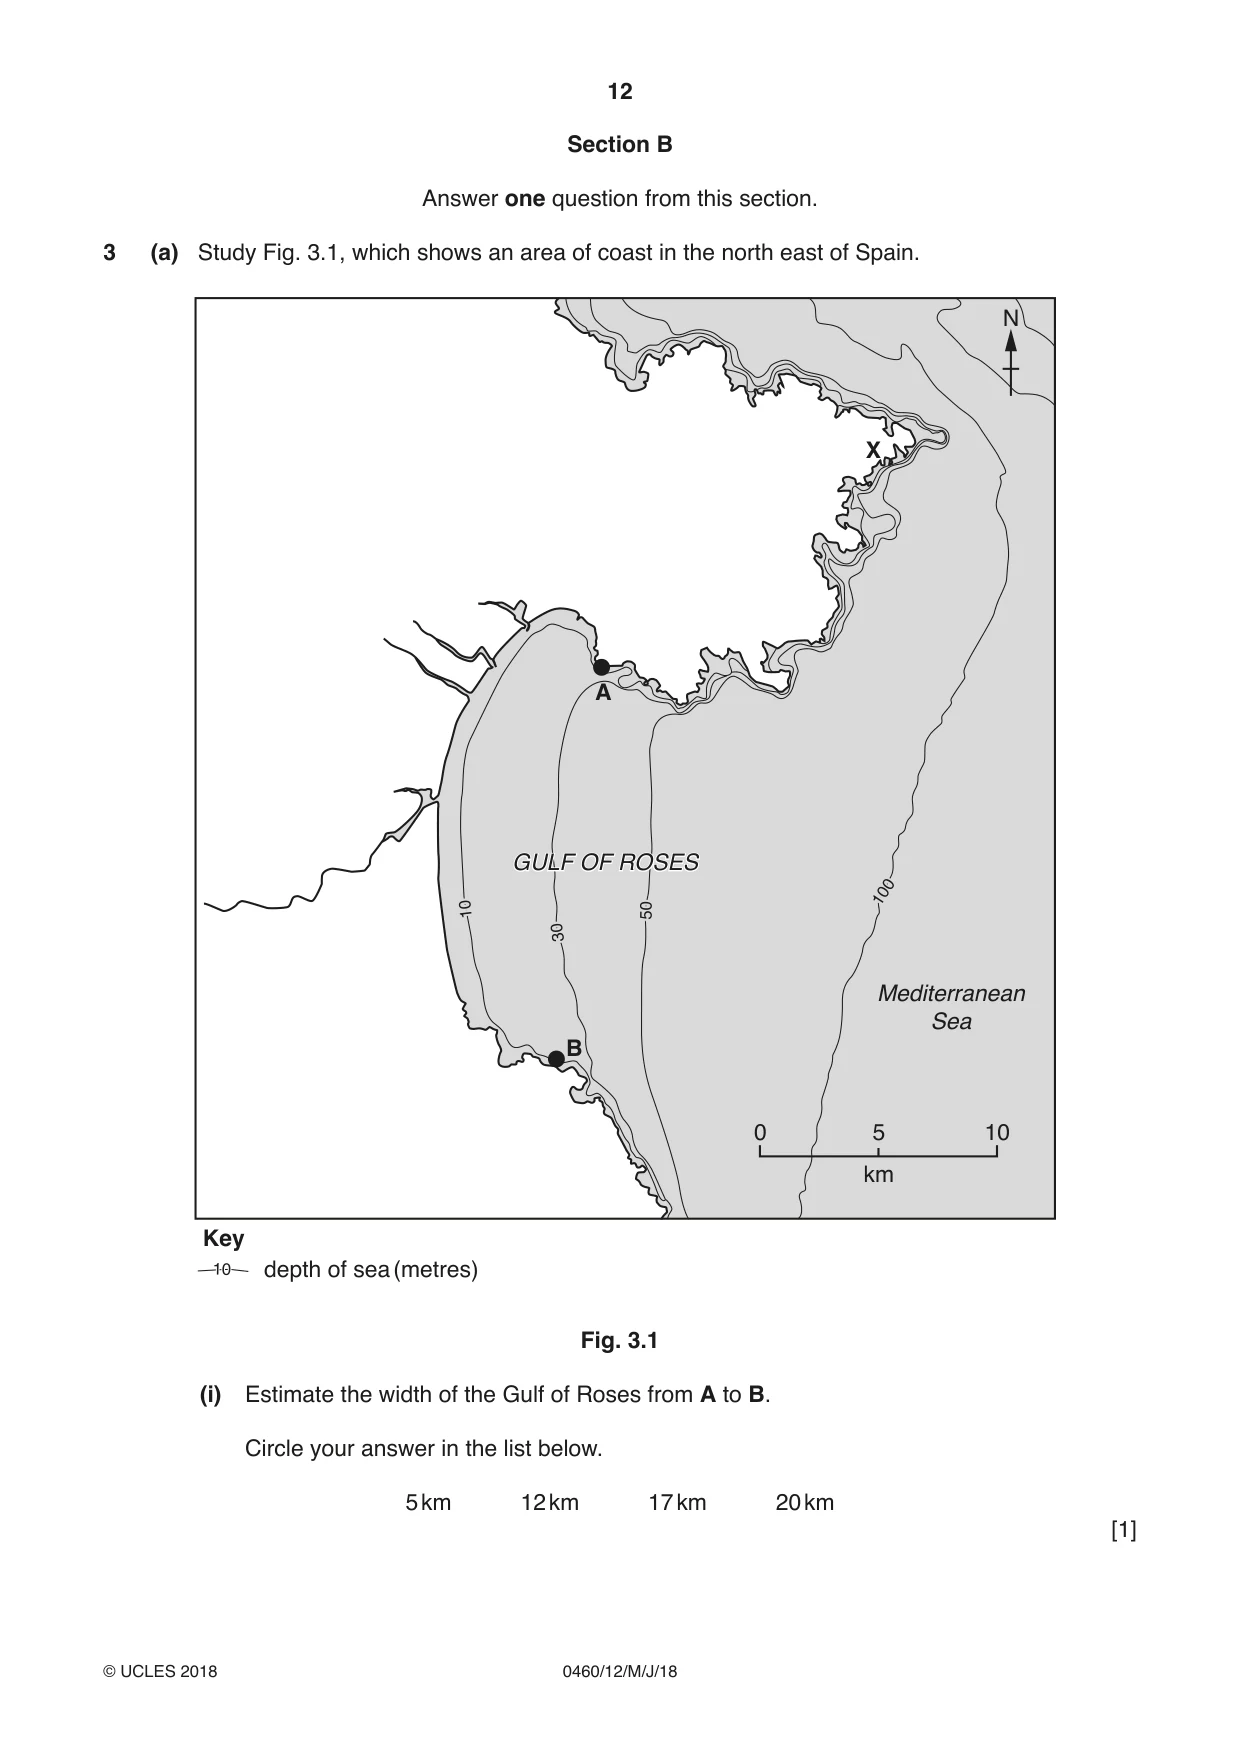
12 0460/12/M/J/18 © UCLES 2018 Section B Answer one question from this section. 3 (a) Study Fig. 3.1, which shows an area of coast in the north east of Spain. N 0 5 km 10 B Key GULF OF ROSES GULF OF ROSES 30 50 100 30 10 10 50 100 A X 10 10 depth of sea (metres) Mediterranean Sea Fig. 3.1 (i) Estimate the width of the Gulf of Roses from A to B. Circle your answer in the list below. 5 km 12 km 17 km 20 km [1]
Question paper, page 13
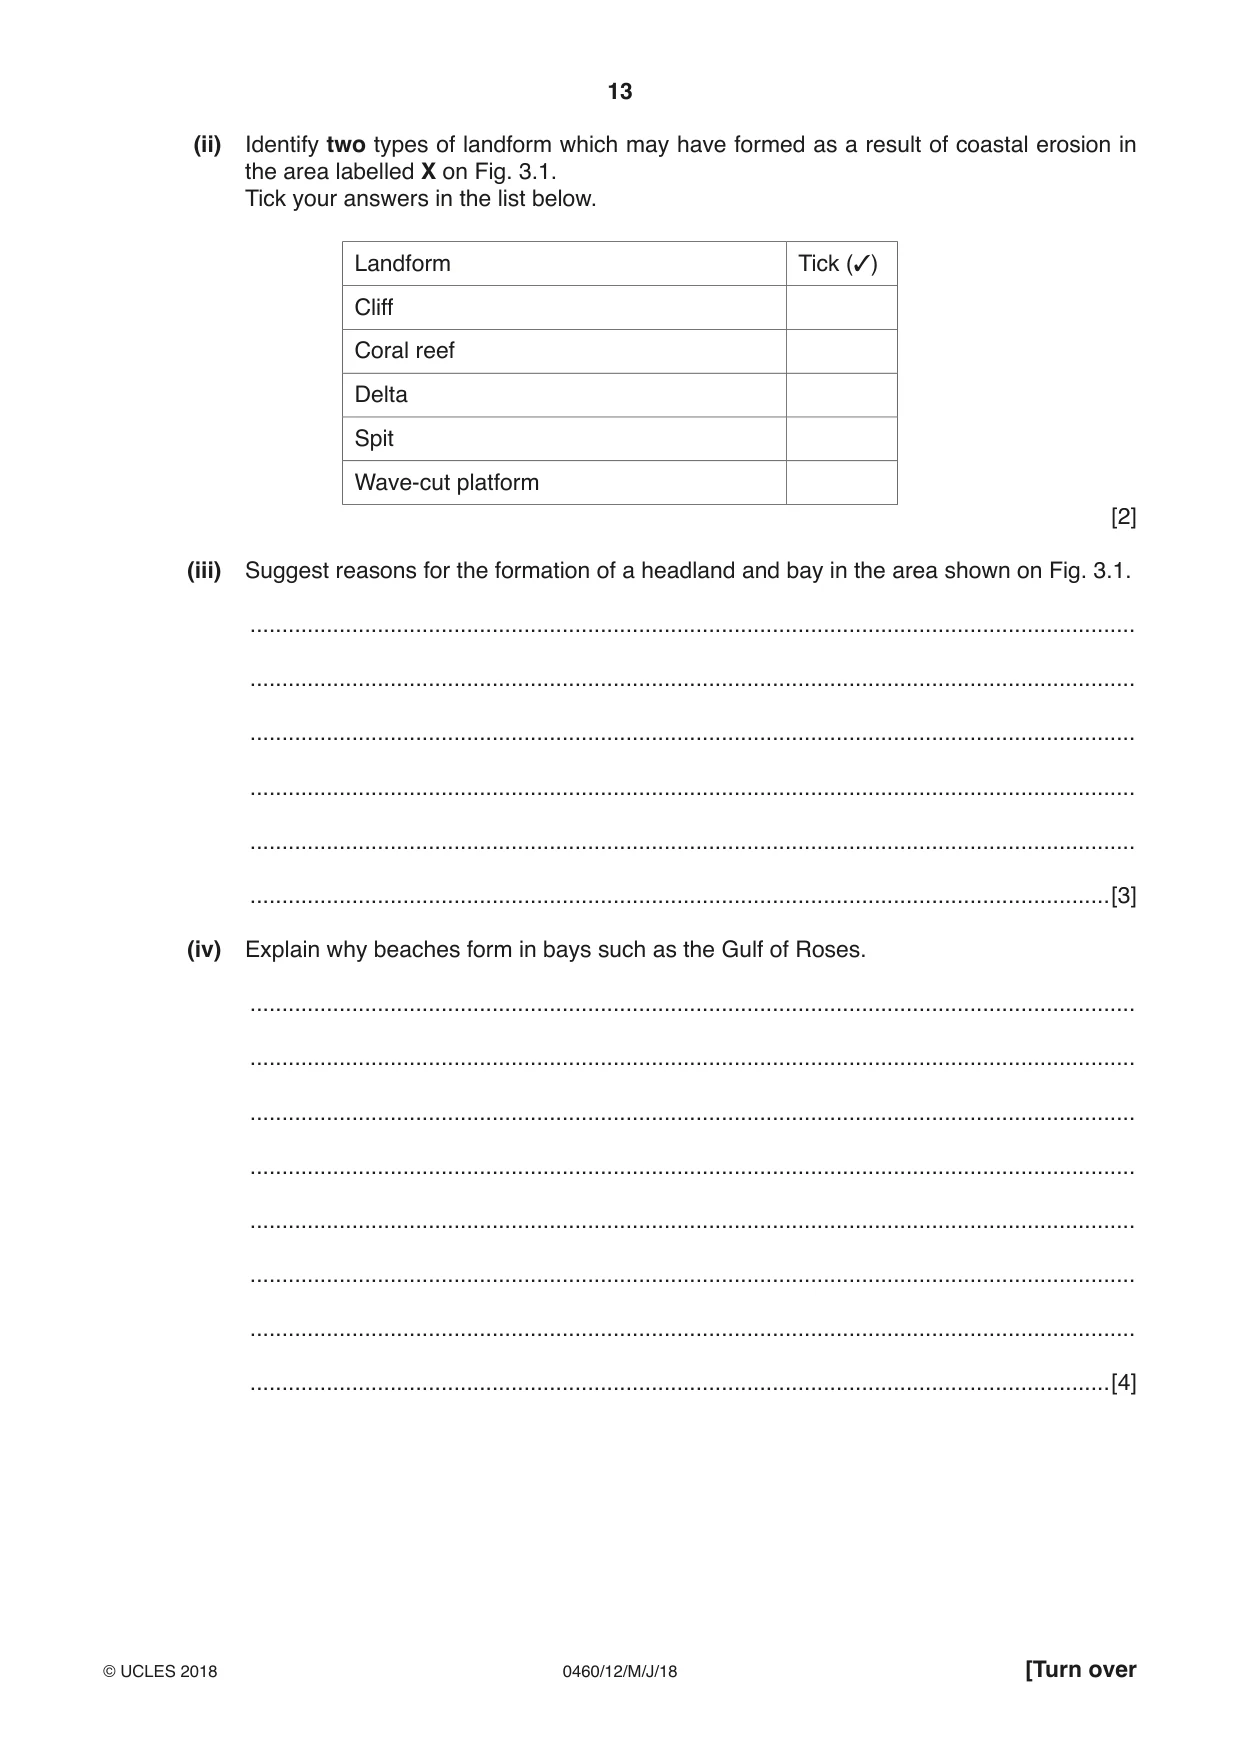
13 0460/12/M/J/18 © UCLES 2018 [Turn over (ii) Identify two types of landform which may have formed as a result of coastal erosion in the area labelled X on Fig. 3.1. Tick your answers in the list below. Landform Tick (✓) Cliff Coral reef Delta Spit Wave-cut platform [2] (iii) Suggest reasons for the formation of a headland and bay in the area shown on Fig. 3.1. … … … … … …[3] (iv) Explain why beaches form in bays such as the Gulf of Roses. … … … … … … … …[4]
Question paper, page 14
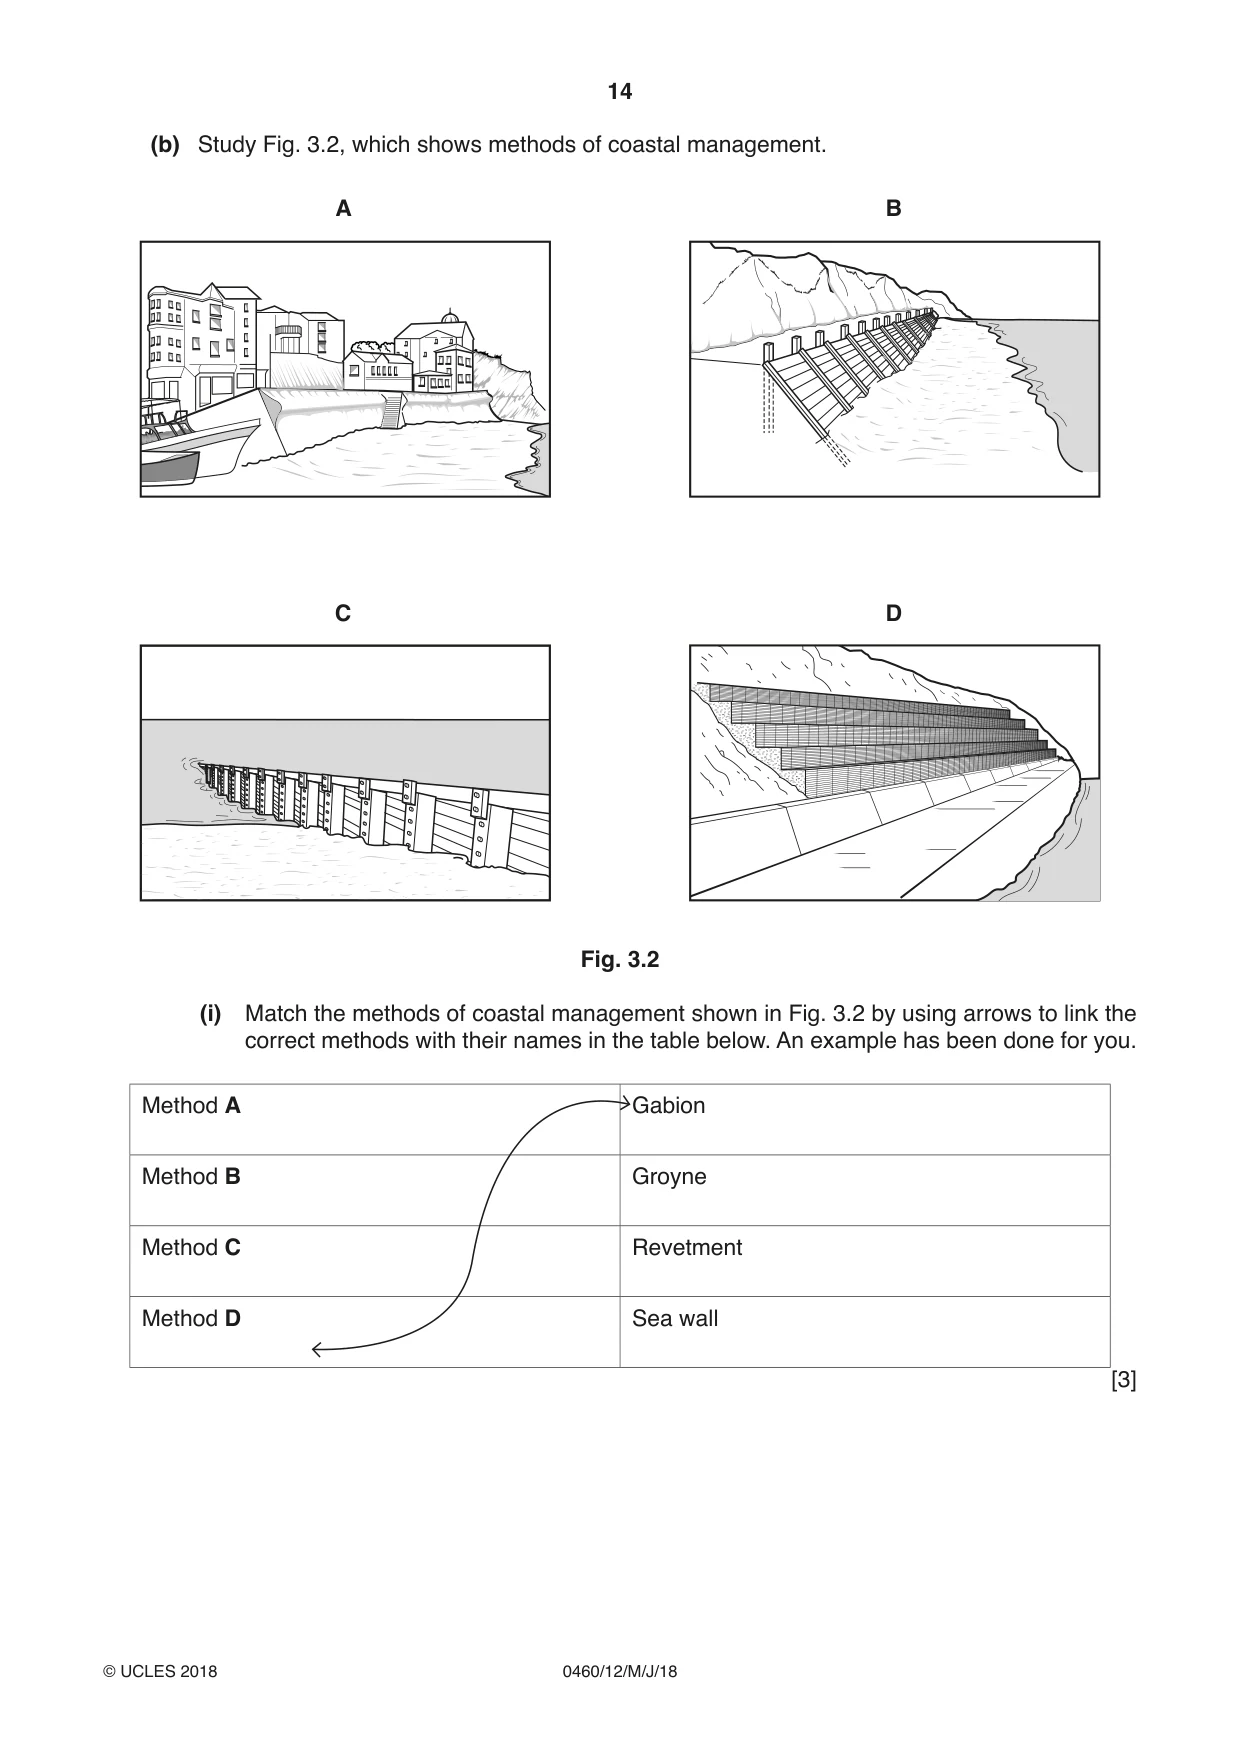
14 0460/12/M/J/18 © UCLES 2018 (b) Study Fig. 3.2, which shows methods of coastal management. A B C D Fig. 3.2 (i) Match the methods of coastal management shown in Fig. 3.2 by using arrows to link the correct methods with their names in the table below. An example has been done for you. Method A Gabion Method B Groyne Method C Revetment Method D Sea wall [3]
Question paper, page 15
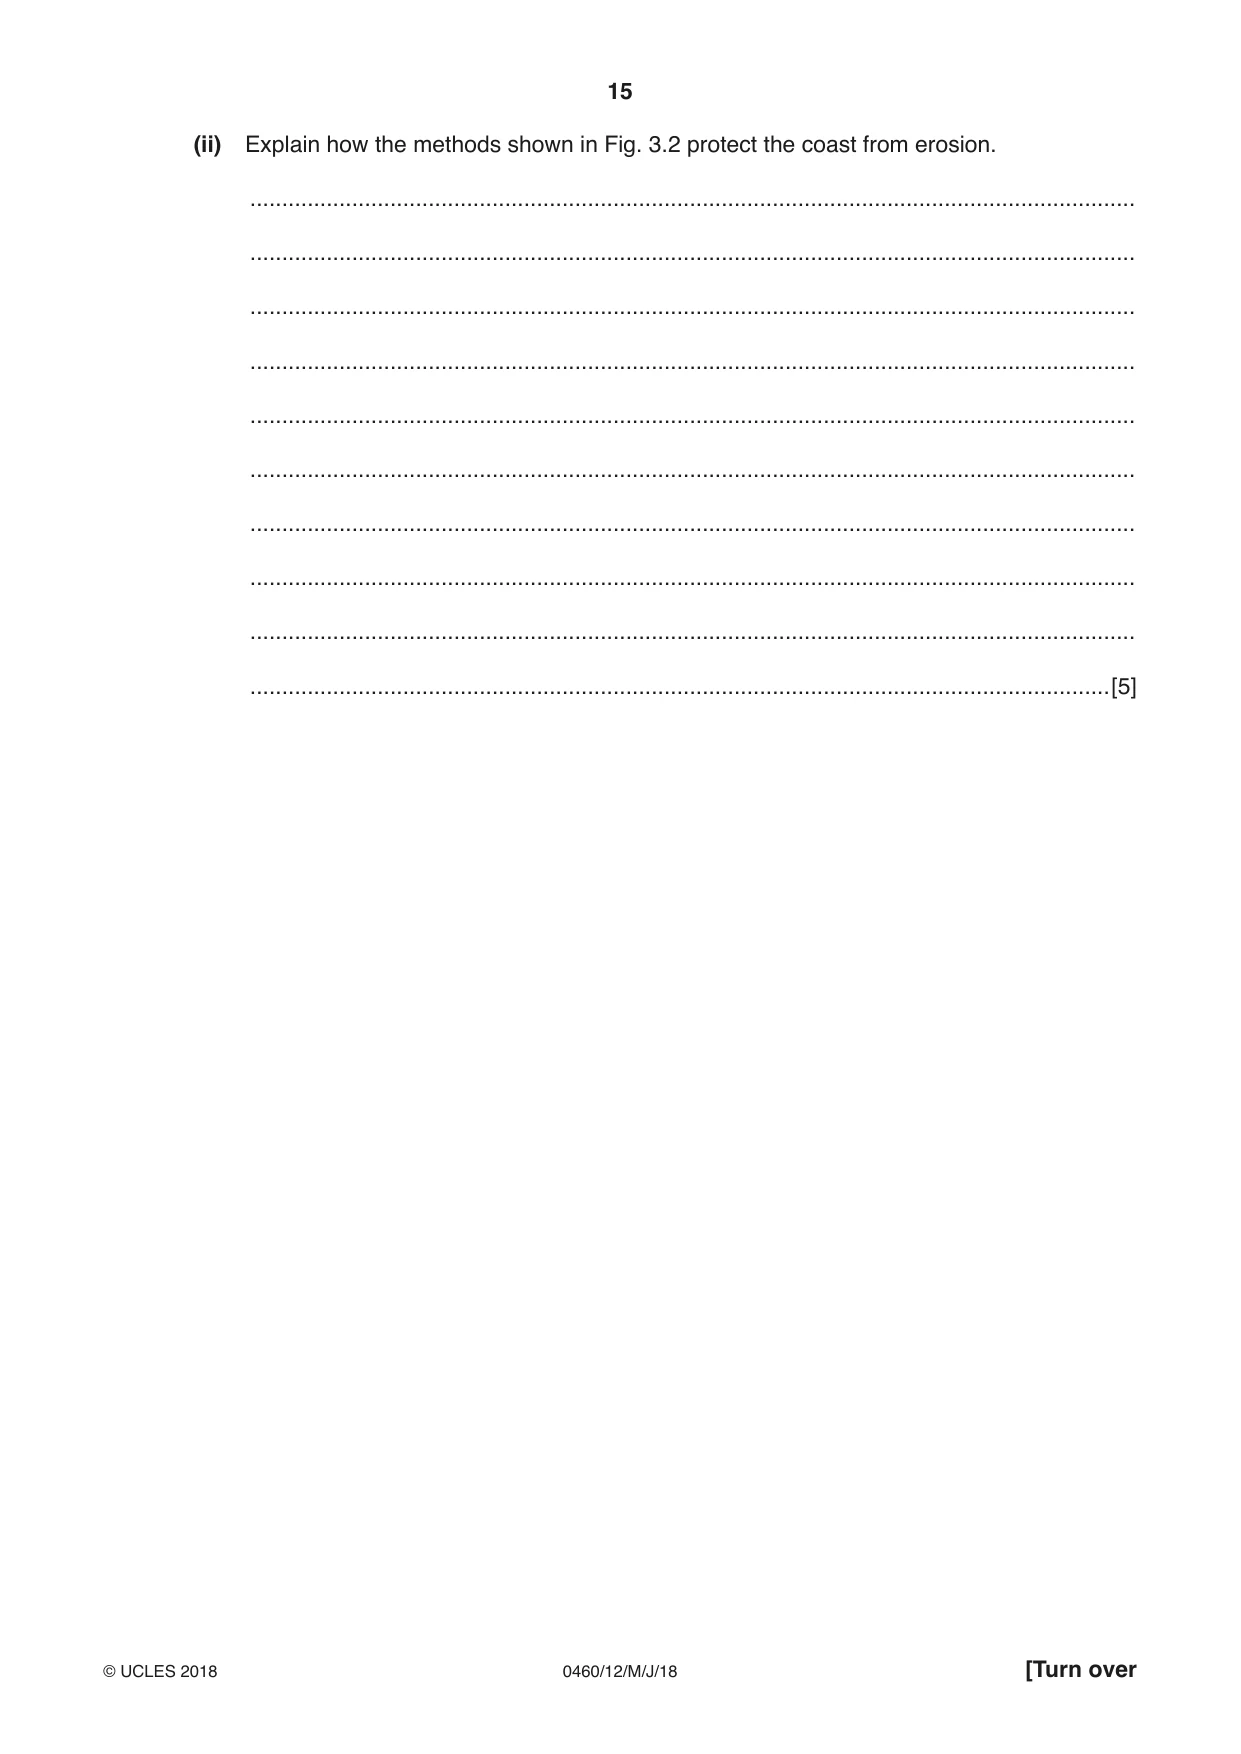
15 0460/12/M/J/18 © UCLES 2018 [Turn over (ii) Explain how the methods shown in Fig. 3.2 protect the coast from erosion. … … … … … … … … … …[5]
Question paper, page 16
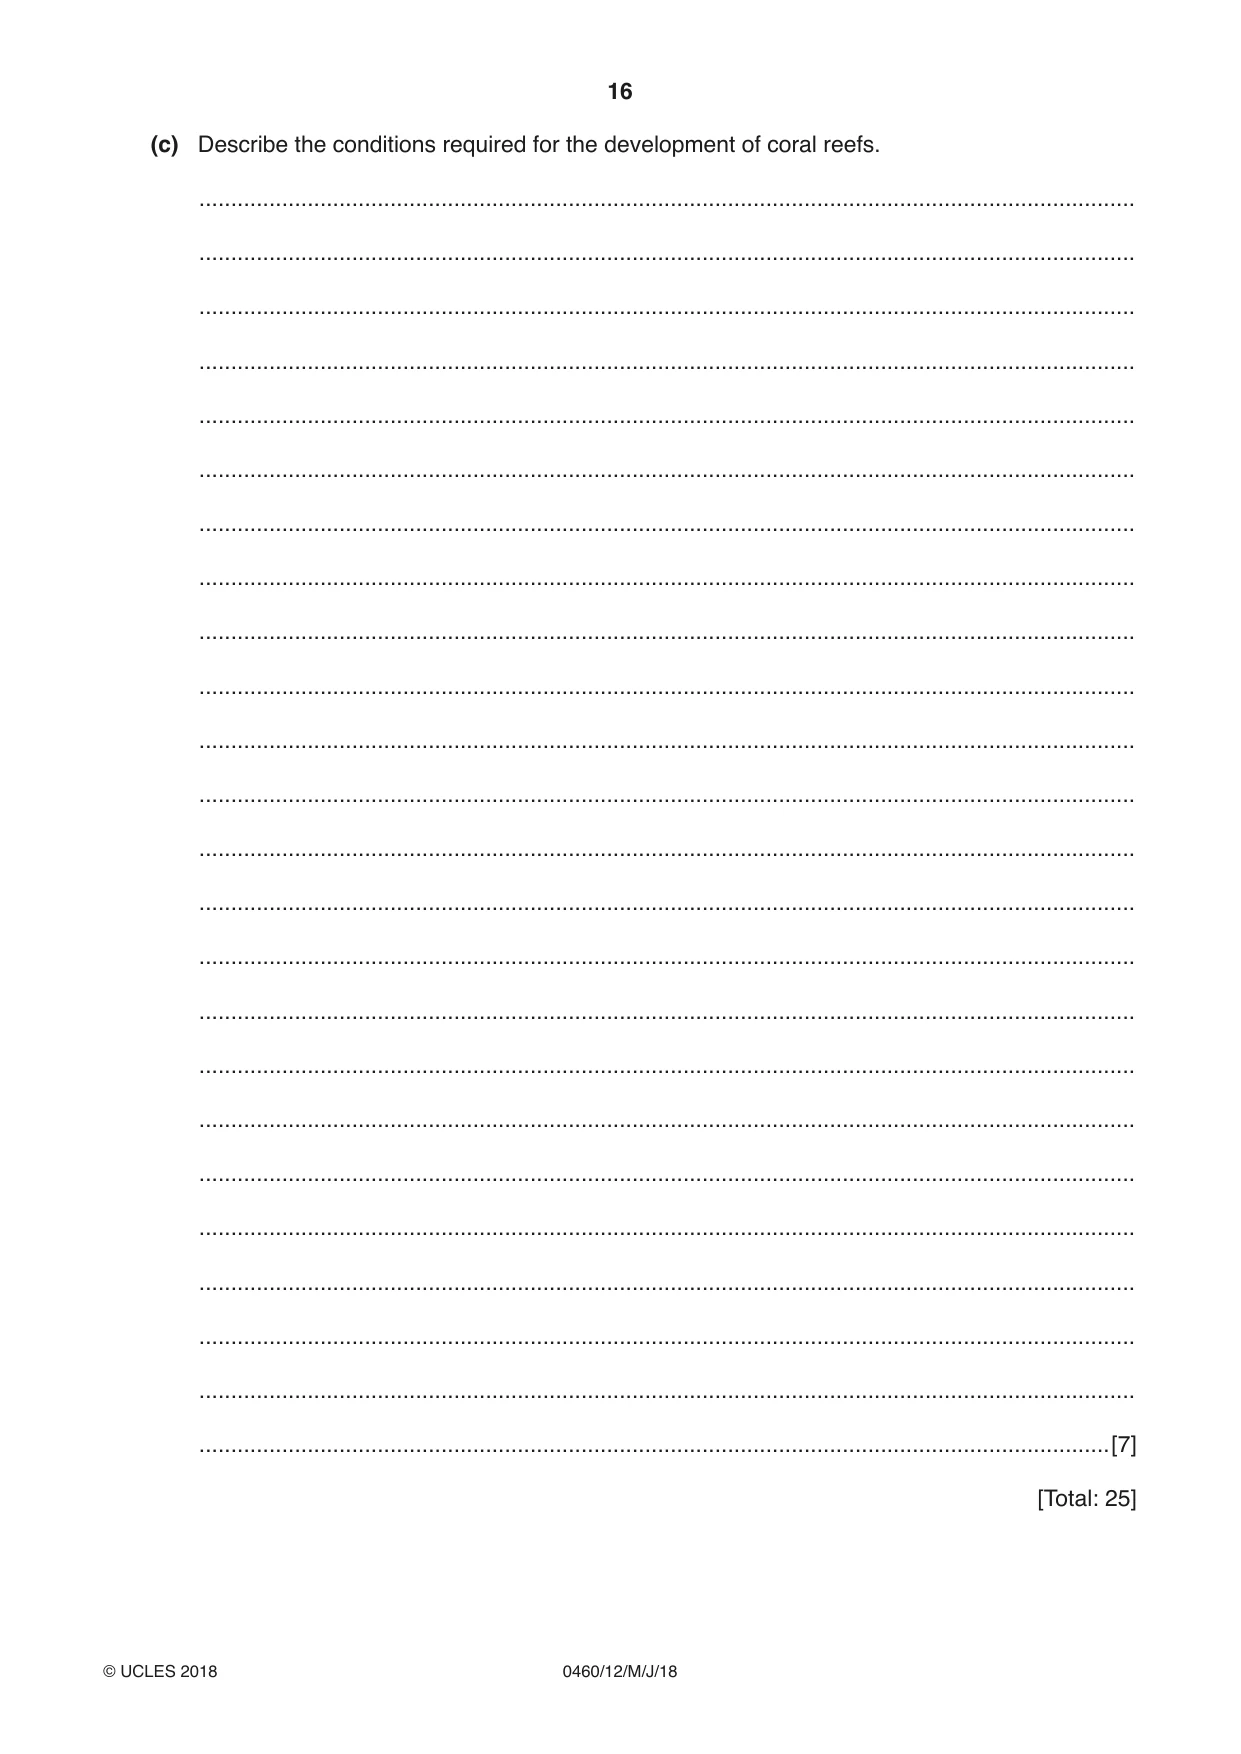
16 0460/12/M/J/18 © UCLES 2018 (c) Describe the conditions required for the development of coral reefs. … … … … … … … … … … … … … … … … … … … … … … … …[7] [Total: 25]
Question paper, page 17
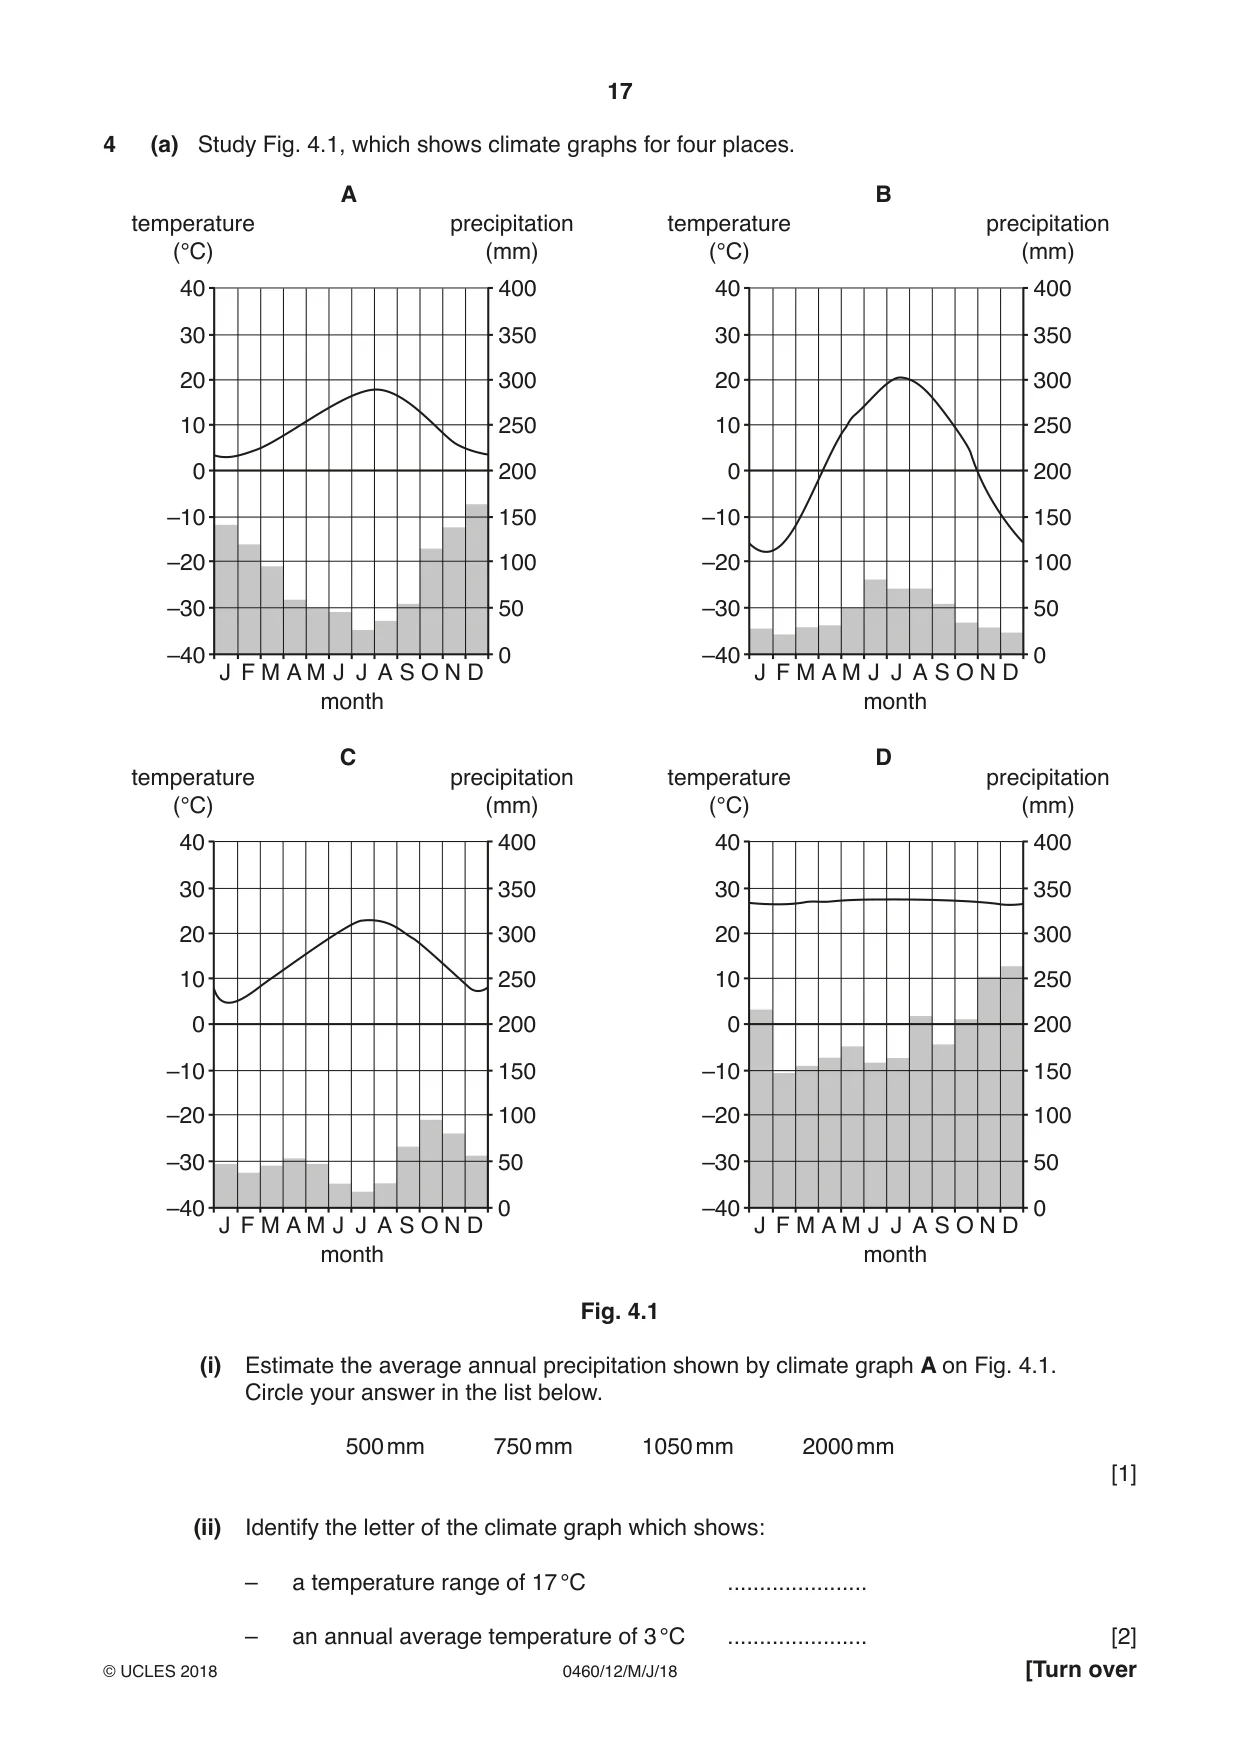
17 0460/12/M/J/18 © UCLES 2018 [Turn over 4 (a) Study Fig. 4.1, which shows climate graphs for four places. –40 J F M A M J J A S O N D 0 –30 50 –20 100 –10 150 0 200 10 250 20 300 30 350 40 400 –40 J F M A M J J A S O N D 0 –30 50 –20 100 –10 150 0 200 10 250 20 300 30 350 40 400 –40 J F M A M J J A S O N D 0 –30 50 –20 100 –10 150 0 200 10 250 20 300 30 350 40 400 –40 J F M A M J J A B C D A S O N D 0 –30 50 –20 100 –10 150 0 200 10 250 20 300 30 350 40 400 temperature (°C) precipitation (mm) temperature (°C) precipitation (mm) temperature (°C) precipitation (mm) temperature (°C) precipitation (mm) month month month month Fig. 4.1 (i) Estimate the average annual precipitation shown by climate graph A on Fig. 4.1. Circle your answer in the list below. 500 mm 750 mm 1050 mm 2000 mm [1] (ii) Identify the letter of the climate graph which shows: – a temperature range of 17 °C … – an annual average temperature of 3 °C … [2]
Question paper, page 18
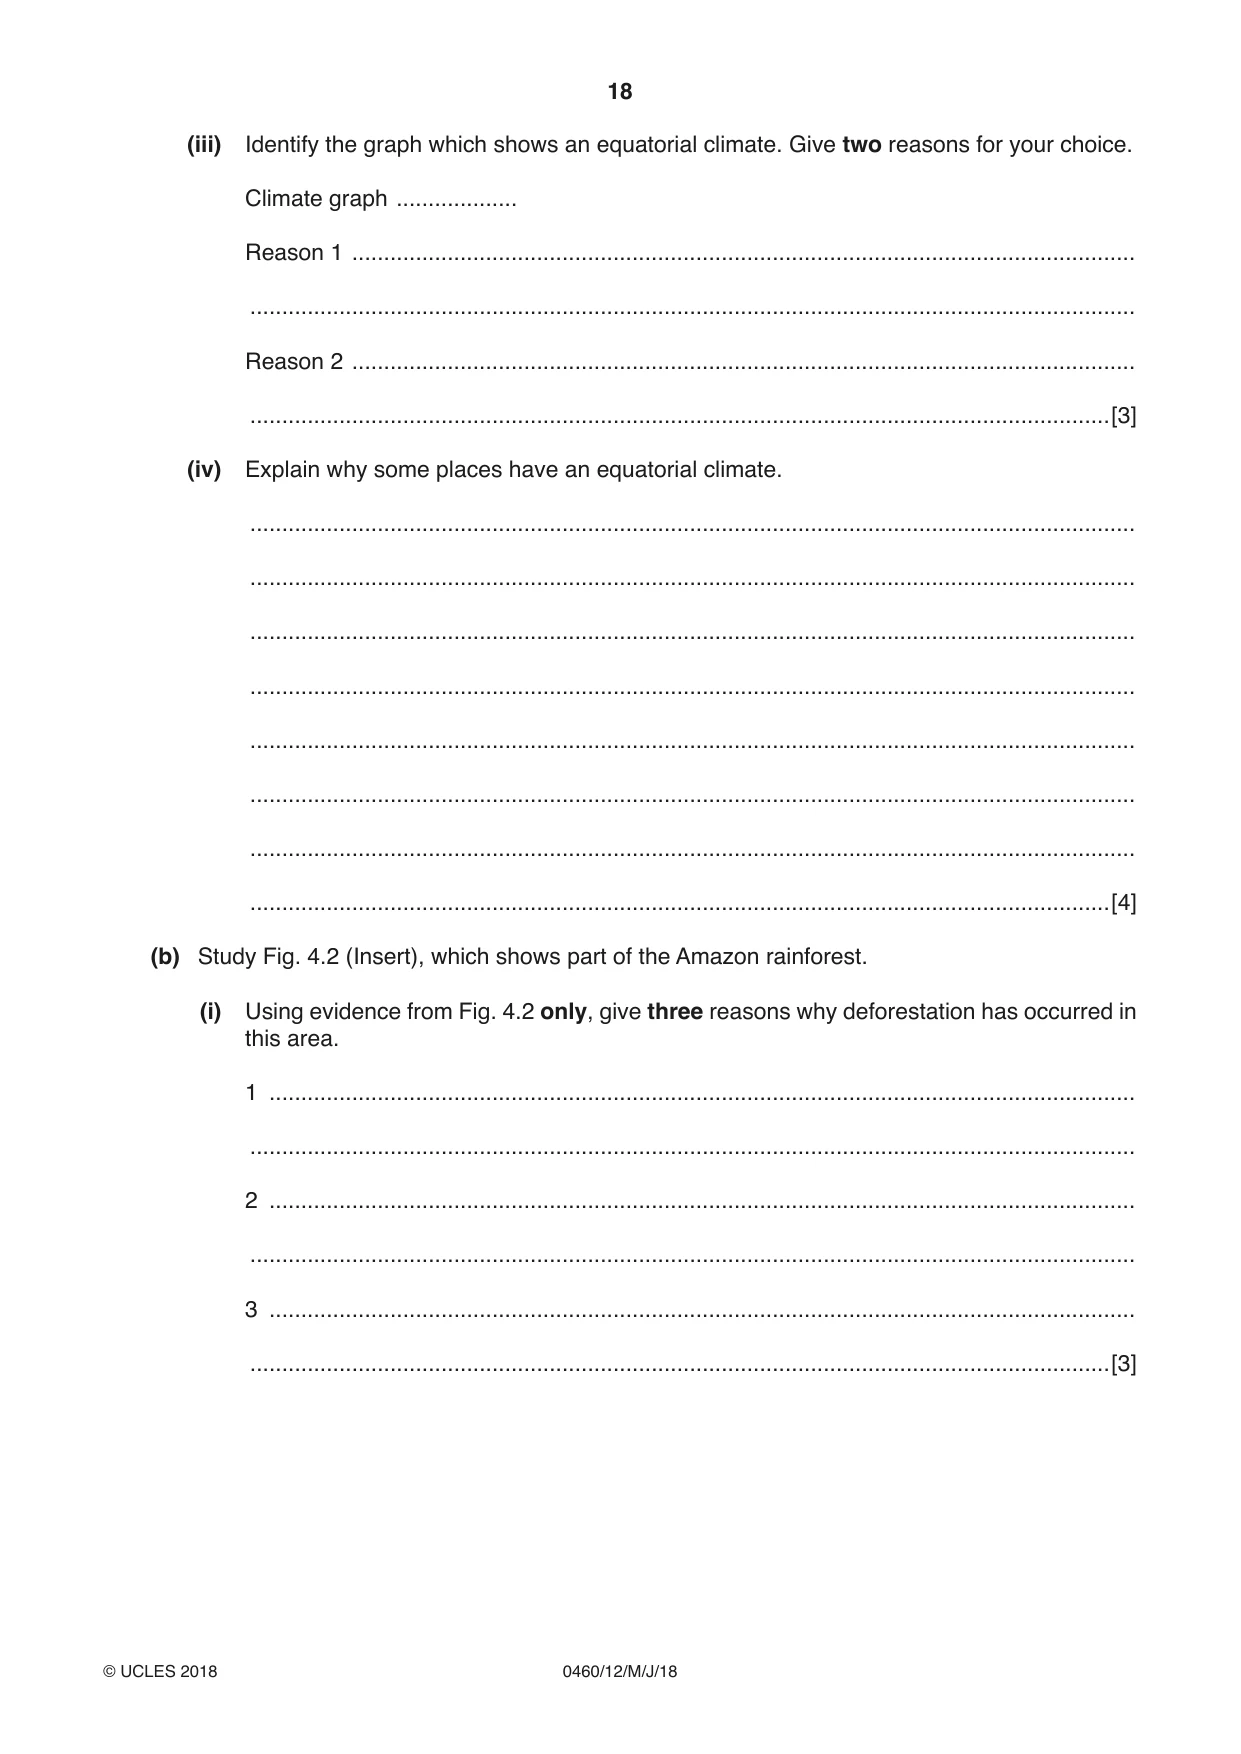
18 0460/12/M/J/18 © UCLES 2018 (iii) Identify the graph which shows an equatorial climate. Give two reasons for your choice. Climate graph … Reason 1 … … Reason 2 … …[3] (iv) Explain why some places have an equatorial climate. … … … … … … … …[4] (b) Study Fig. 4.2 (Insert), which shows part of the Amazon rainforest. (i) Using evidence from Fig. 4.2 only, give three reasons why deforestation has occurred in this area. 1 … … 2 … … 3 … …[3]
Question paper, page 19
19 0460/12/M/J/18 © UCLES 2018 [Turn over (ii) Explain why protecting the rainforest from deforestation is important for the local natural environment and for the people who live in the rainforest. … … … … … … … … … …[5]
Question paper, page 20
20 0460/12/M/J/18 © UCLES 2018 (c) Describe the problems caused by large-scale deforestation of tropical rainforests for the global natural environment and people who live in other named parts of the world. … … … … … … … … … … … … … … … … … … … … … … … …[7] [Total: 25]
Question paper, page 21
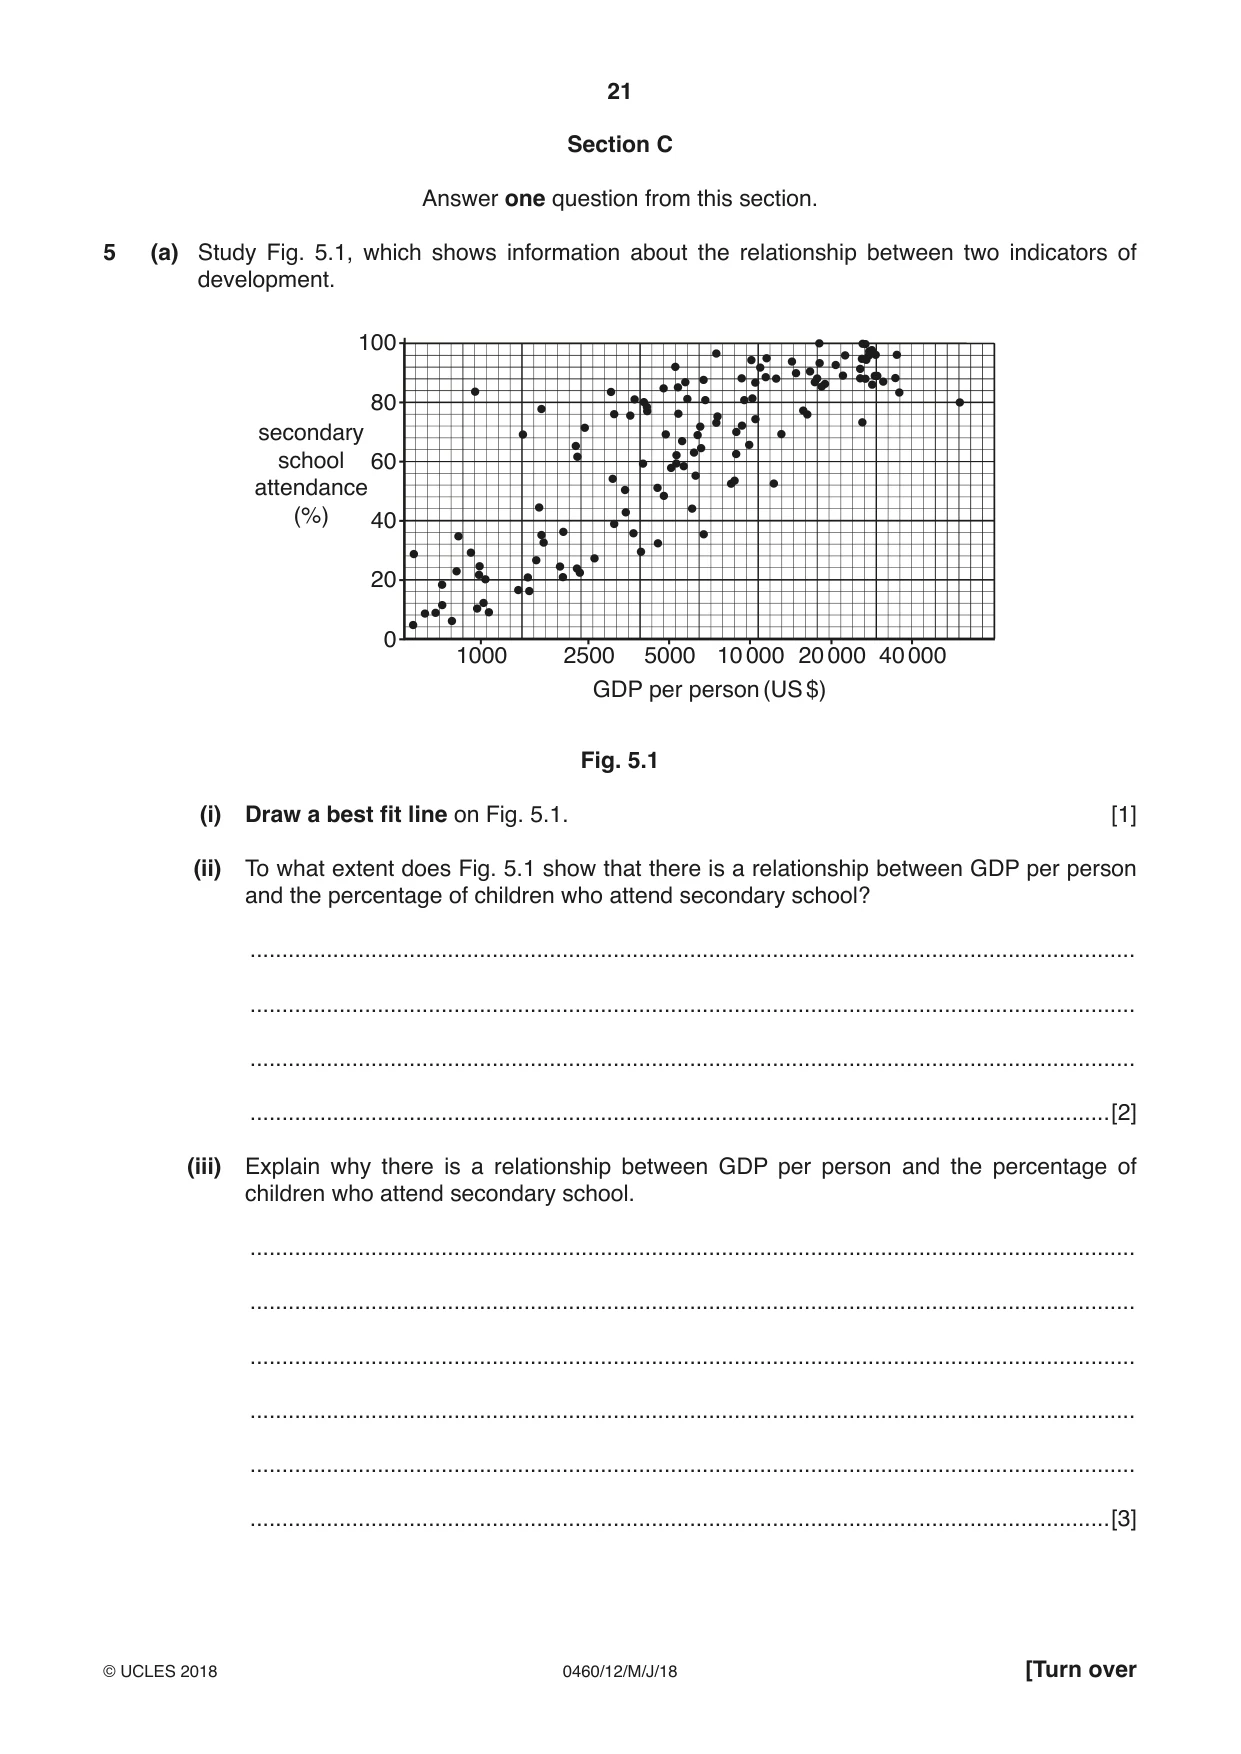
21 0460/12/M/J/18 © UCLES 2018 [Turn over Section C Answer one question from this section. 5 (a) Study Fig. 5.1, which shows information about the relationship between two indicators of development. 0 1000 2500 5000 GDP per person (US $) 10 000 20 000 40 000 20 40 60 80 100 secondary school attendance (%) Fig. 5.1 (i) Draw a best fit line on Fig. 5.1. [1] (ii) To what extent does Fig. 5.1 show that there is a relationship between GDP per person and the percentage of children who attend secondary school? … … … …[2] (iii) Explain why there is a relationship between GDP per person and the percentage of children who attend secondary school. … … … … … …[3]
Question paper, page 22
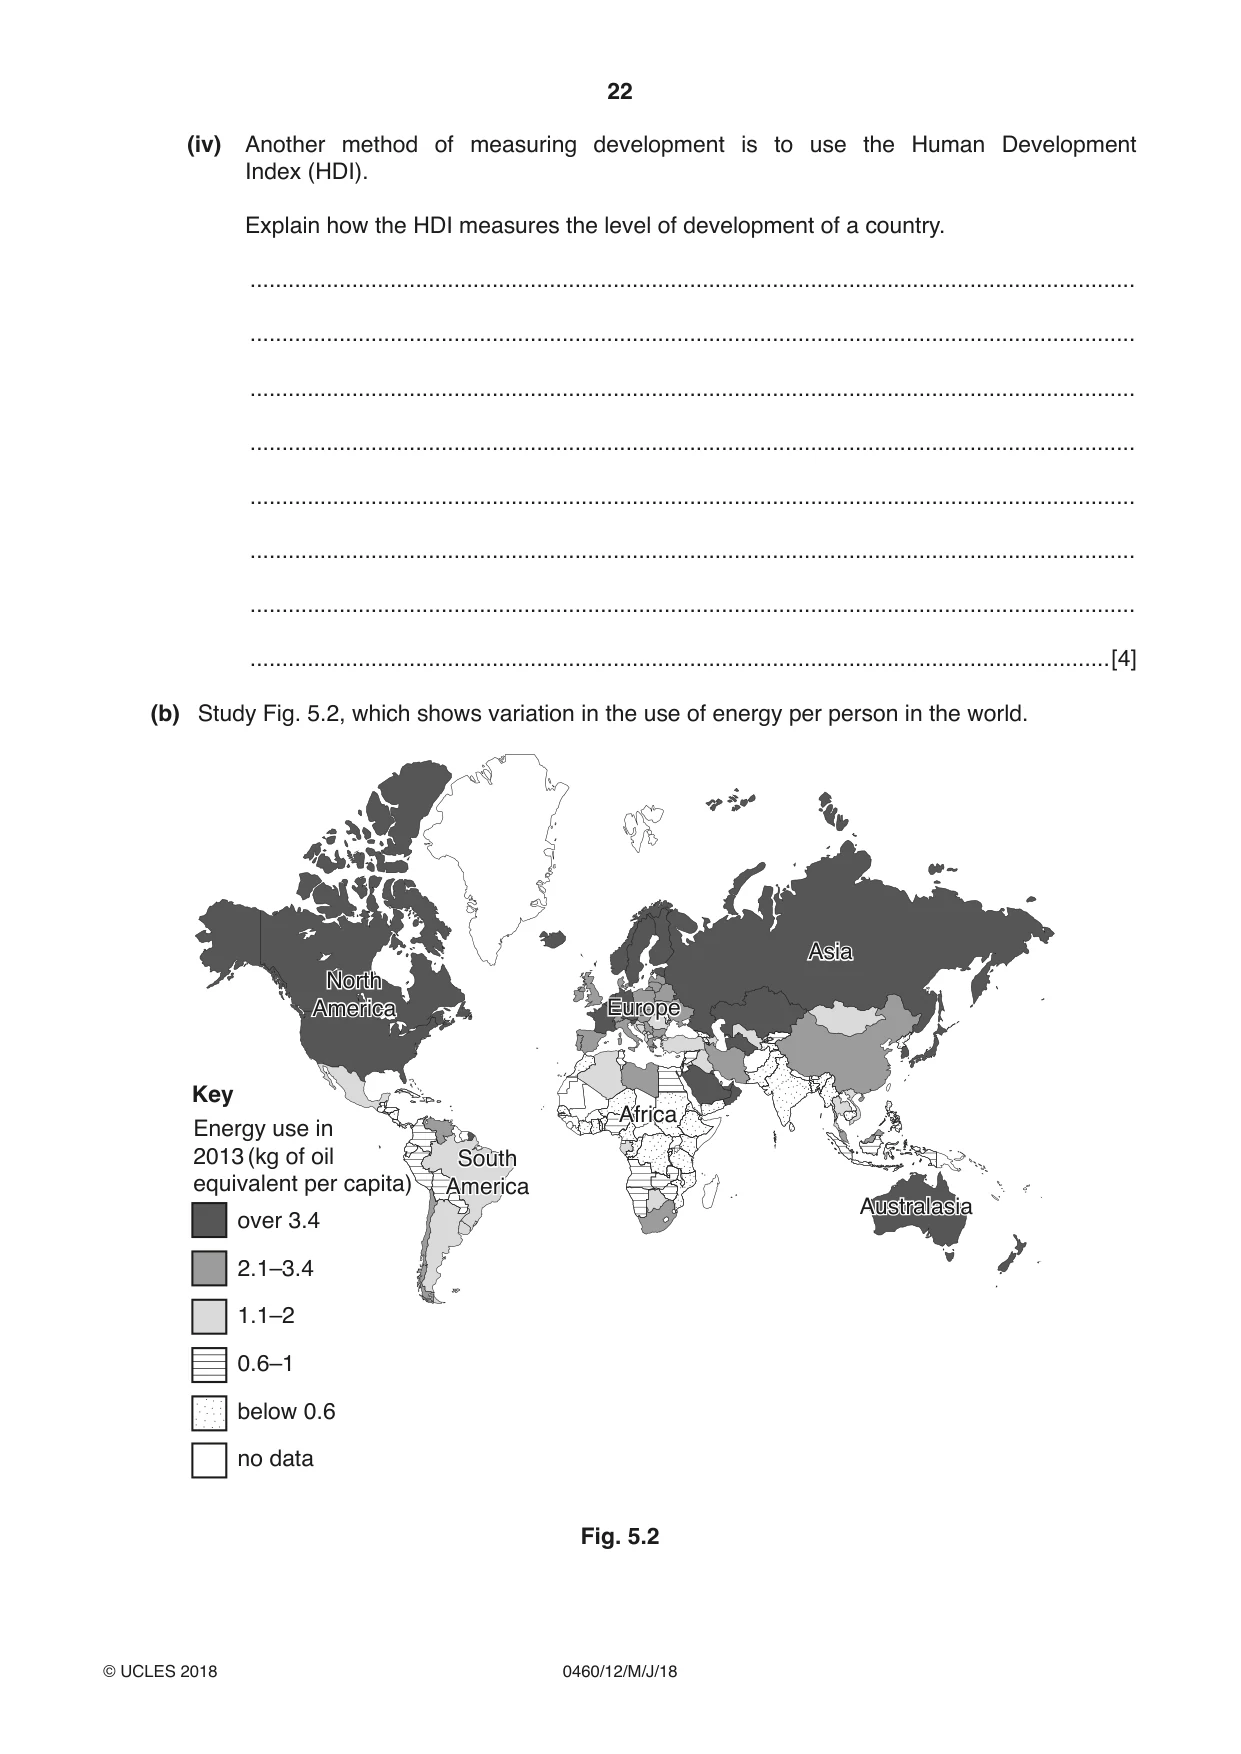
22 0460/12/M/J/18 © UCLES 2018 (iv) Another method of measuring development is to use the Human Development Index (HDI). Explain how the HDI measures the level of development of a country. … … … … … … … …[4] (b) Study Fig. 5.2, which shows variation in the use of energy per person in the world. Key below 0.6 no data Energy use in 2013 (kg of oil equivalent per capita) 0.6–1 1.1–2 2.1–3.4 over 3.4 North America North America South America Africa Europe Asia Australasia South America Africa Europe Asia Australasia Fig. 5.2
Question paper, page 23
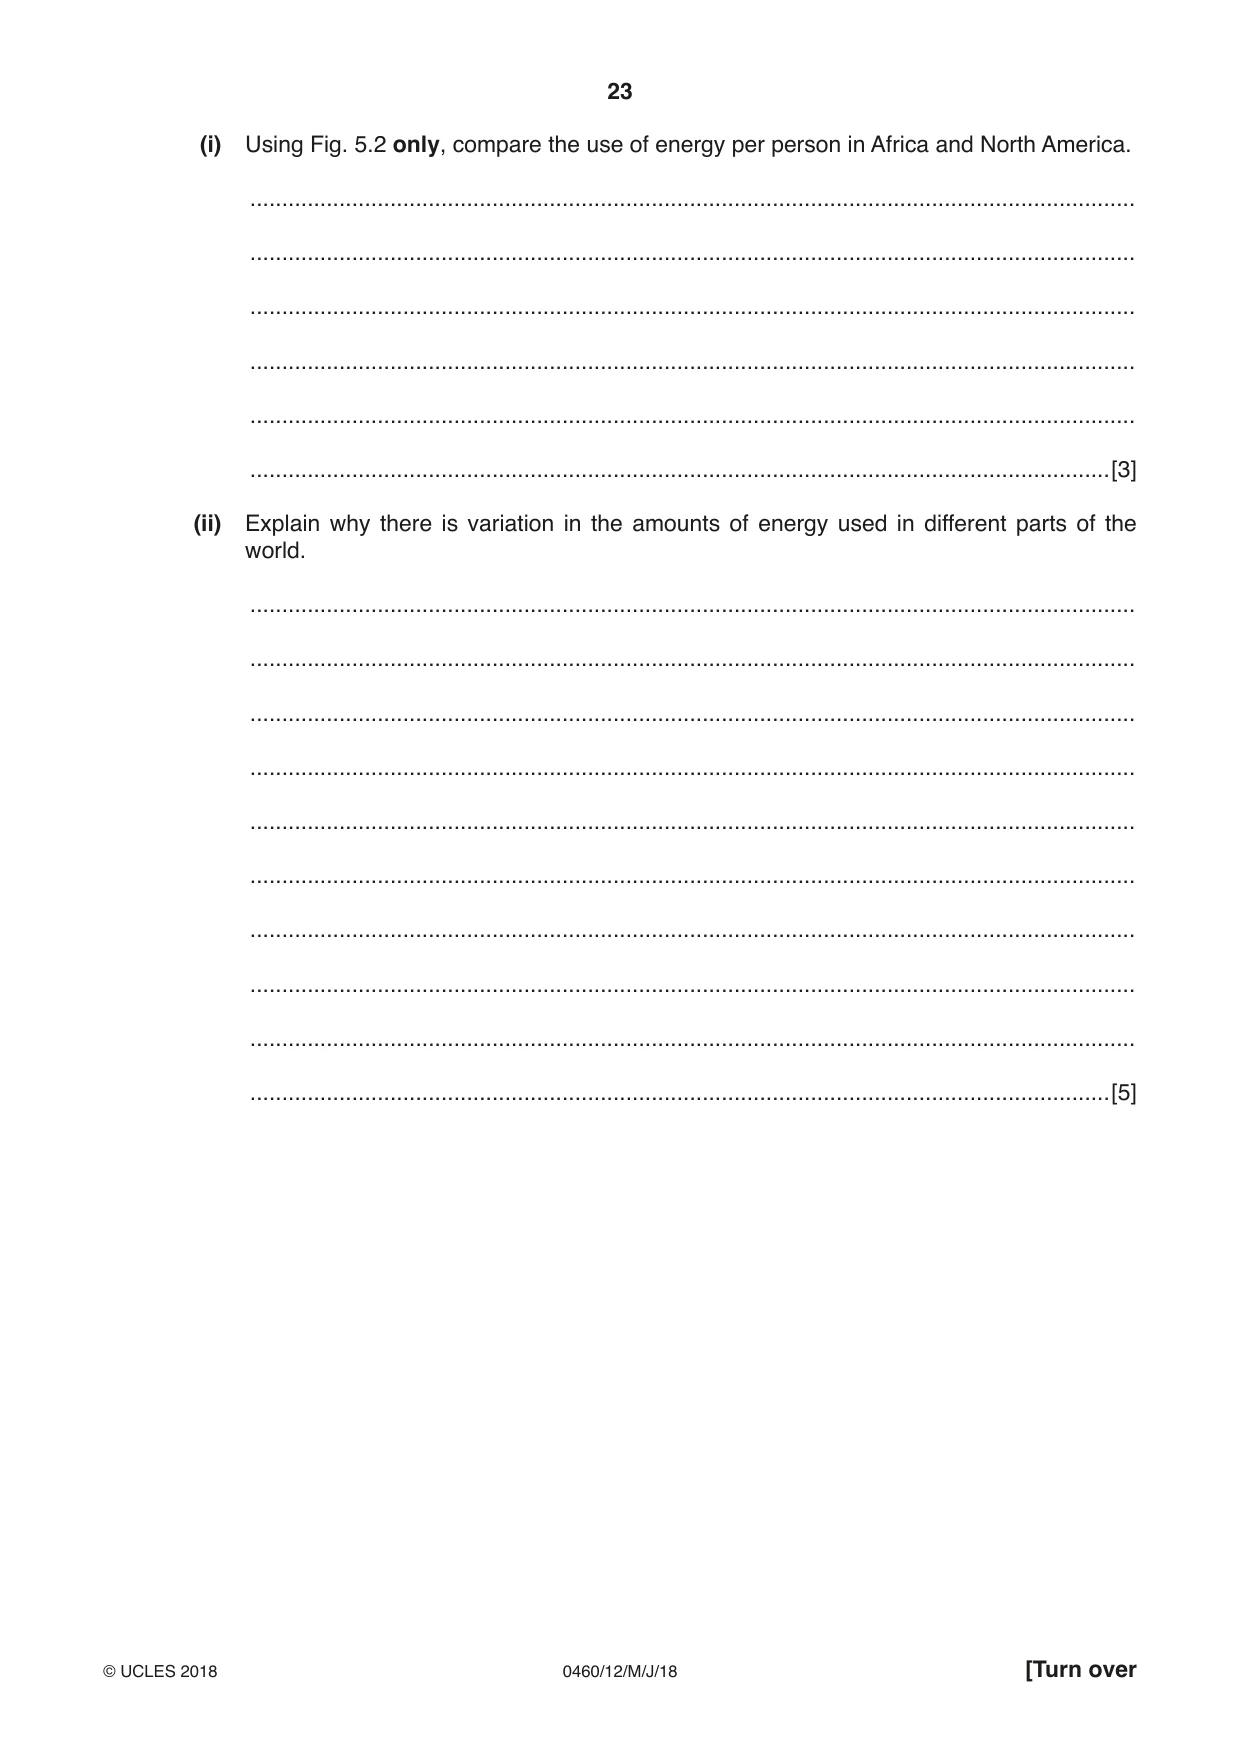
23 0460/12/M/J/18 © UCLES 2018 [Turn over (i) Using Fig. 5.2 only, compare the use of energy per person in Africa and North America. … … … … … …[3] (ii) Explain why there is variation in the amounts of energy used in different parts of the world. … … … … … … … … … …[5]
Question paper, page 24
24 0460/12/M/J/18 © UCLES 2018 (c) For a named country you have studied, describe and explain the importance of different types of energy sources. Name of country … … … … … … … … … … … … … … … … … … … … … … … … …[7] [Total: 25]
Question paper, page 25
25 0460/12/M/J/18 © UCLES 2018 [Turn over 6 (a) Study Fig. 6.1 (Insert), a map which shows an area in Zimbabwe where the tourist industry is important. (i) What is meant by the tourist industry? … …[1] (ii) Identify from Fig. 6.1: – one physical (natural) attraction for tourists. … – one human attraction for tourists. …[2] (iii) Using evidence from Fig. 6.1 only, suggest how the natural landscape has been changed in the area shown as a result of tourism. … … … … … …[3] (b) Study Fig. 6.2 (Insert), which is a photograph showing the entrance to a national park in Zimbabwe. (i) Suggest three ways in which the advice in the notices shown in Fig. 6.2 will help protect the natural environment of the national park. 1 … … 2 … … 3 … …[3]
Question paper, page 26
26 0460/12/M/J/18 © UCLES 2018 (ii) Suggest the likely benefits of tourism for people who live in or close to national parks such as Lake Chivero (Fig. 6.1) and Rhodes Matopos (Fig. 6.2). … … … … … … … …[4] (iii) Suggest how tourism may cause problems for local people. … … … … … … … … … …[5]
Question paper, page 27
27 0460/12/M/J/18 © UCLES 2018 (c) For a named country or area you have studied, describe the methods used to supply water. Name of country or area … … … … … … … … … … … … … … … … … … … … … … … … …[7] [Total: 25]
Question paper, page 28
28 0460/12/M/J/18 © UCLES 2018 Additional Pages If you use the following lined pages to complete the answer(s) to any question(s), the question number(s) must be clearly shown. … … … … … … … … … … … … … … … … … … … … … … … … … …
Question paper, page 29
29 0460/12/M/J/18 © UCLES 2018 … … … … … … … … … … … … … … … … … … … … … … … … … … … …
Question paper, page 30
30 0460/12/M/J/18 © UCLES 2018 BLANK PAGE
Question paper, page 31
31 0460/12/M/J/18 © UCLES 2018 BLANK PAGE
Question paper, page 32
32 0460/12/M/J/18 © UCLES 2018 Permission to reproduce items where third-party owned material protected by copyright is included has been sought and cleared where possible. Every reasonable effort has been made by the publisher (UCLES) to trace copyright holders, but if any items requiring clearance have unwittingly been included, the publisher will be pleased to make amends at the earliest possible opportunity. To avoid the issue of disclosure of answer-related information to candidates, all copyright acknowledgements are reproduced online in the Cambridge International Examinations Copyright Acknowledgements Booklet. This is produced for each series of examinations and is freely available to download at www.cie.org.uk after the live examination series. Cambridge International Examinations is part of the Cambridge Assessment Group. Cambridge Assessment is the brand name of University of Cambridge Local Examinations Syndicate (UCLES), which is itself a department of the University of Cambridge. BLANK PAGE
Mark scheme, page 1
IGCSE™ is a registered trademark. This syllabus is approved for use in England, Wales and Northern Ireland as a Cambridge International Level 1/Level 2 Certificate. This document consists of 15 printed pages. © UCLES 2018 [Turn over Cambridge Assessment International Education Cambridge International General Certificate of Secondary Education GEOGRAPHY 0460/12 Paper 1 May/June 2018 MARK SCHEME Maximum Mark: 75 Published This mark scheme is published as an aid to teachers and candidates, to indicate the requirements of the examination. It shows the basis on which Examiners were instructed to award marks. It does not indicate the details of the discussions that took place at an Examiners’ meeting before marking began, which would have considered the acceptability of alternative answers. Mark schemes should be read in conjunction with the question paper and the Principal Examiner Report for Teachers. Cambridge International will not enter into discussions about these mark schemes. Cambridge International is publishing the mark schemes for the May/June 2018 series for most Cambridge IGCSE™, Cambridge International A and AS Level and Cambridge Pre-U components, and some Cambridge O Level components.
Mark scheme, page 2
0460/12 Cambridge IGCSE – Mark Scheme PUBLISHED May/June 2018 © UCLES 2018 Page 2 of 15 Generic Marking Principles These general marking principles must be applied by all examiners when marking candidate answers. They should be applied alongside the specific content of the mark scheme or generic level descriptors for a question. Each question paper and mark scheme will also comply with these marking principles. GENERIC MARKING PRINCIPLE 1: Marks must be awarded in line with: • the specific content of the mark scheme or the generic level descriptors for the question • the specific skills defined in the mark scheme or in the generic level descriptors for the question • the standard of response required by a candidate as exemplified by the standardisation scripts. GENERIC MARKING PRINCIPLE 2: Marks awarded are always whole marks (not half marks, or other fractions). GENERIC MARKING PRINCIPLE 3: Marks must be awarded positively: • marks are awarded for correct/valid answers, as defined in the mark scheme. However, credit is given for valid answers which go beyond the scope of the syllabus and mark scheme, referring to your Team Leader as appropriate • marks are awarded when candidates clearly demonstrate what they know and can do • marks are not deducted for errors • marks are not deducted for omissions • answers should only be judged on the quality of spelling, punctuation and grammar when these features are specifically assessed by the question as indicated by the mark scheme. The meaning, however, should be unambiguous. GENERIC MARKING PRINCIPLE 4: Rules must be applied consistently e.g. in situations where candidates have not followed instructions or in the application of generic level descriptors. GENERIC MARKING PRINCIPLE 5: Marks should be awarded using the full range of marks defined in the mark scheme for the question (however; the use of the full mark range may be limited according to the quality of the candidate responses seen). GENERIC MARKING PRINCIPLE 6: Marks awarded are based solely on the requirements as defined in the mark scheme. Marks should not be awarded with grade thresholds or grade descriptors in mind.
Mark scheme, page 3
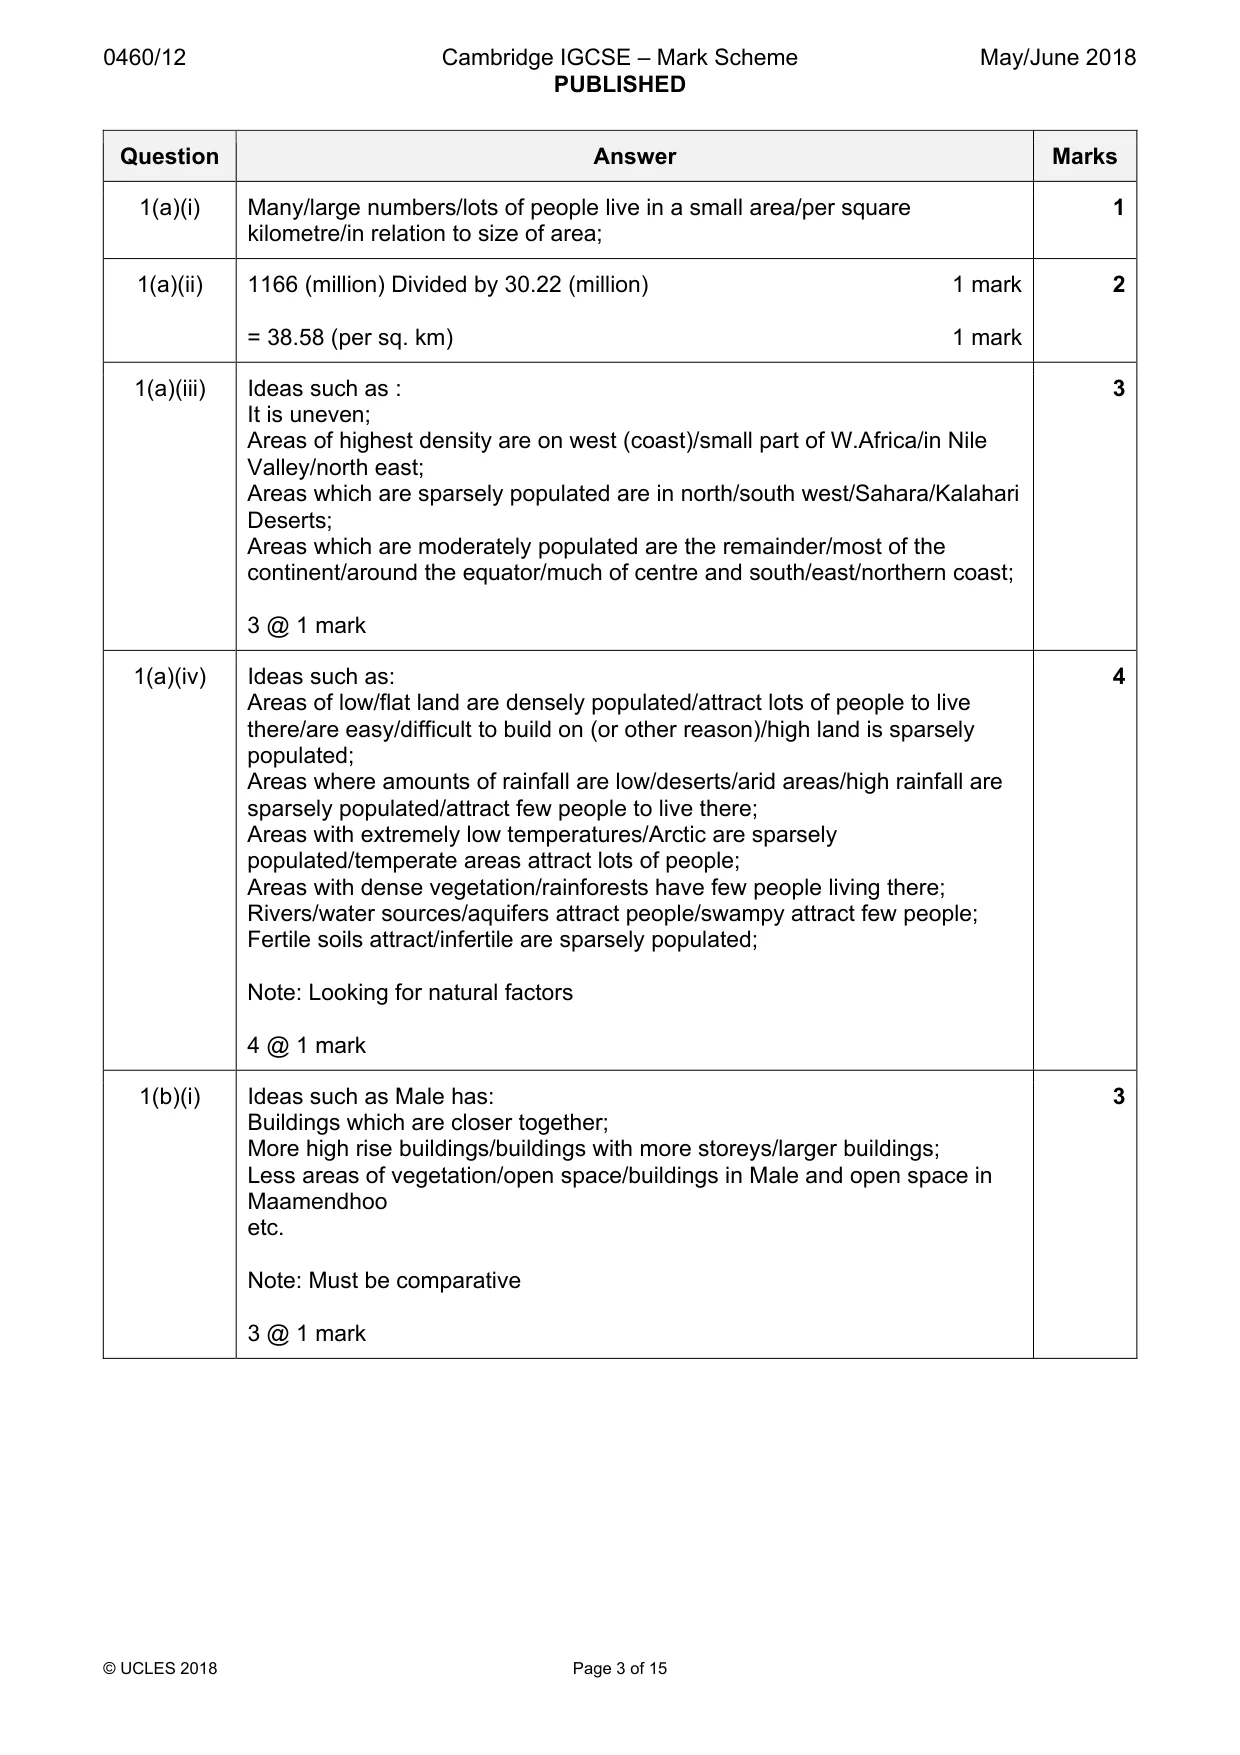
0460/12 Cambridge IGCSE – Mark Scheme PUBLISHED May/June 2018 © UCLES 2018 Page 3 of 15 Question Answer Marks 1(a)(i) Many/large numbers/lots of people live in a small area/per square kilometre/in relation to size of area; 1 1(a)(ii) 1166 (million) Divided by 30.22 (million) 1 mark = 38.58 (per sq. km) 1 mark 2 1(a)(iii) Ideas such as : It is uneven; Areas of highest density are on west (coast)/small part of W.Africa/in Nile Valley/north east; Areas which are sparsely populated are in north/south west/Sahara/Kalahari Deserts; Areas which are moderately populated are the remainder/most of the continent/around the equator/much of centre and south/east/northern coast; 3 @ 1 mark 3 1(a)(iv) Ideas such as: Areas of low/flat land are densely populated/attract lots of people to live there/are easy/difficult to build on (or other reason)/high land is sparsely populated; Areas where amounts of rainfall are low/deserts/arid areas/high rainfall are sparsely populated/attract few people to live there; Areas with extremely low temperatures/Arctic are sparsely populated/temperate areas attract lots of people; Areas with dense vegetation/rainforests have few people living there; Rivers/water sources/aquifers attract people/swampy attract few people; Fertile soils attract/infertile are sparsely populated; Note: Looking for natural factors 4 @ 1 mark 4 1(b)(i) Ideas such as Male has: Buildings which are closer together; More high rise buildings/buildings with more storeys/larger buildings; Less areas of vegetation/open space/buildings in Male and open space in Maamendhoo etc. Note: Must be comparative 3 @ 1 mark 3
Mark scheme, page 4
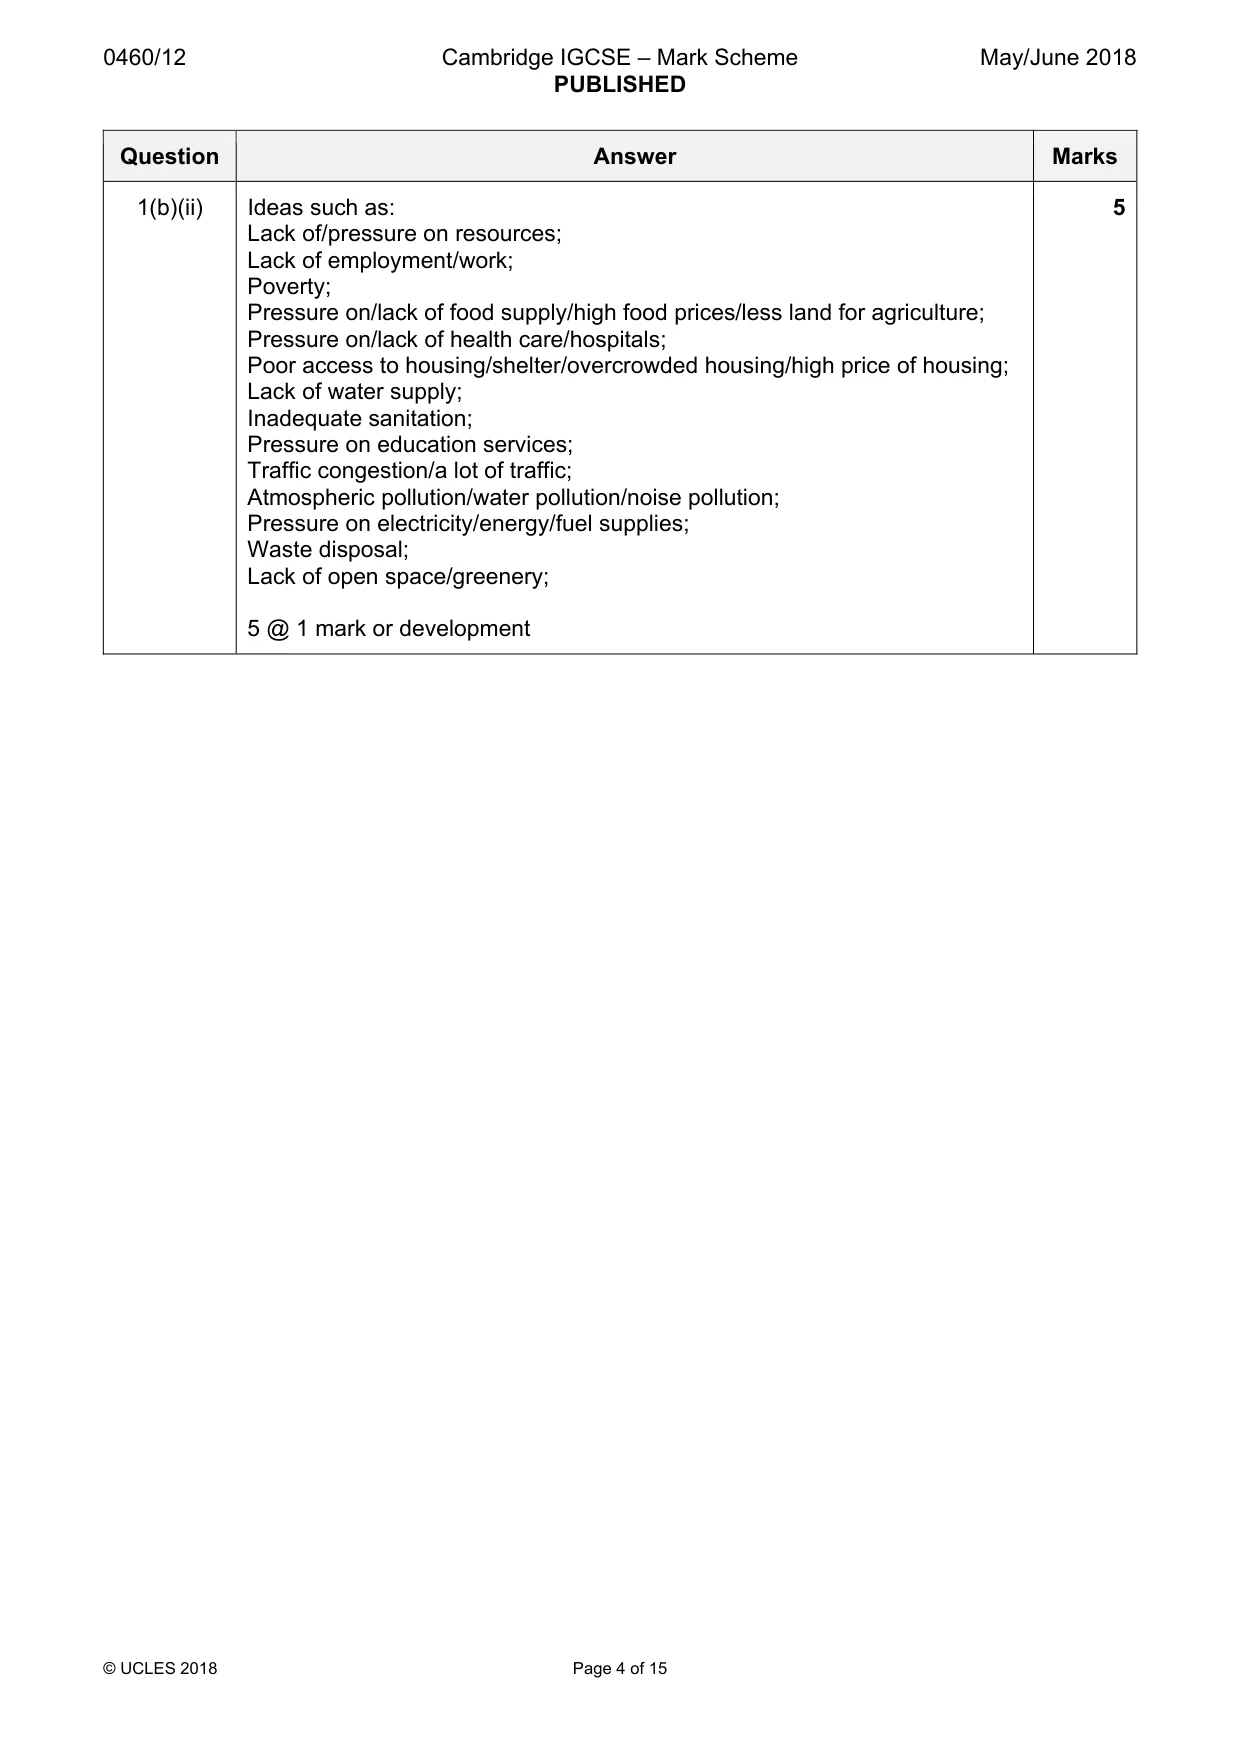
0460/12 Cambridge IGCSE – Mark Scheme PUBLISHED May/June 2018 © UCLES 2018 Page 4 of 15 Question Answer Marks 1(b)(ii) Ideas such as: Lack of/pressure on resources; Lack of employment/work; Poverty; Pressure on/lack of food supply/high food prices/less land for agriculture; Pressure on/lack of health care/hospitals; Poor access to housing/shelter/overcrowded housing/high price of housing; Lack of water supply; Inadequate sanitation; Pressure on education services; Traffic congestion/a lot of traffic; Atmospheric pollution/water pollution/noise pollution; Pressure on electricity/energy/fuel supplies; Waste disposal; Lack of open space/greenery; 5 @ 1 mark or development 5
Mark scheme, page 5
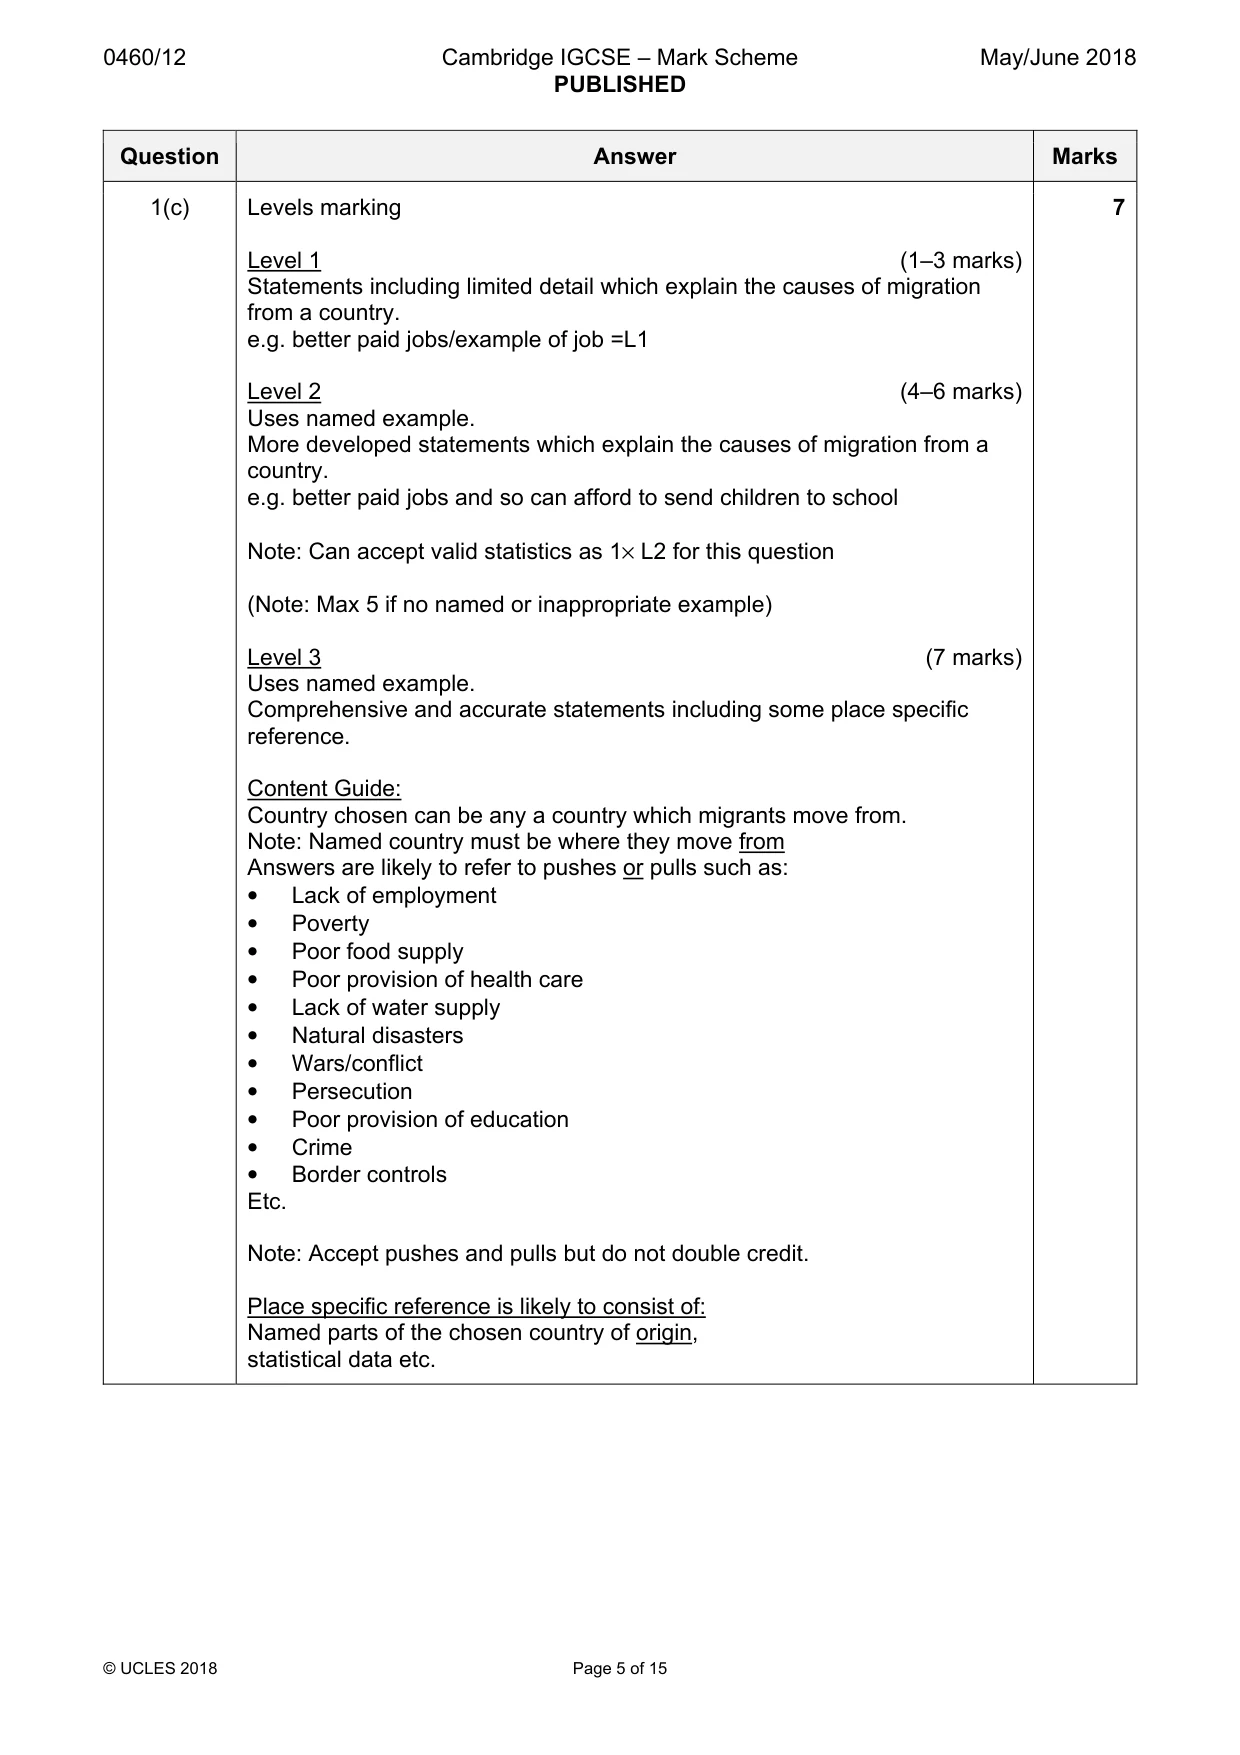
0460/12 Cambridge IGCSE – Mark Scheme PUBLISHED May/June 2018 © UCLES 2018 Page 5 of 15 Question Answer Marks 1(c) Levels marking Level 1 (1–3 marks) Statements including limited detail which explain the causes of migration from a country. e.g. better paid jobs/example of job =L1 Level 2 (4–6 marks) Uses named example. More developed statements which explain the causes of migration from a country. e.g. better paid jobs and so can afford to send children to school Note: Can accept valid statistics as 1× L2 for this question (Note: Max 5 if no named or inappropriate example) Level 3 (7 marks) Uses named example. Comprehensive and accurate statements including some place specific reference. Content Guide: Country chosen can be any a country which migrants move from. Note: Named country must be where they move from Answers are likely to refer to pushes or pulls such as: • Lack of employment • Poverty • Poor food supply • Poor provision of health care • Lack of water supply • Natural disasters • Wars/conflict • Persecution • Poor provision of education • Crime • Border controls Etc. Note: Accept pushes and pulls but do not double credit. Place specific reference is likely to consist of: Named parts of the chosen country of origin, statistical data etc. 7
Mark scheme, page 6
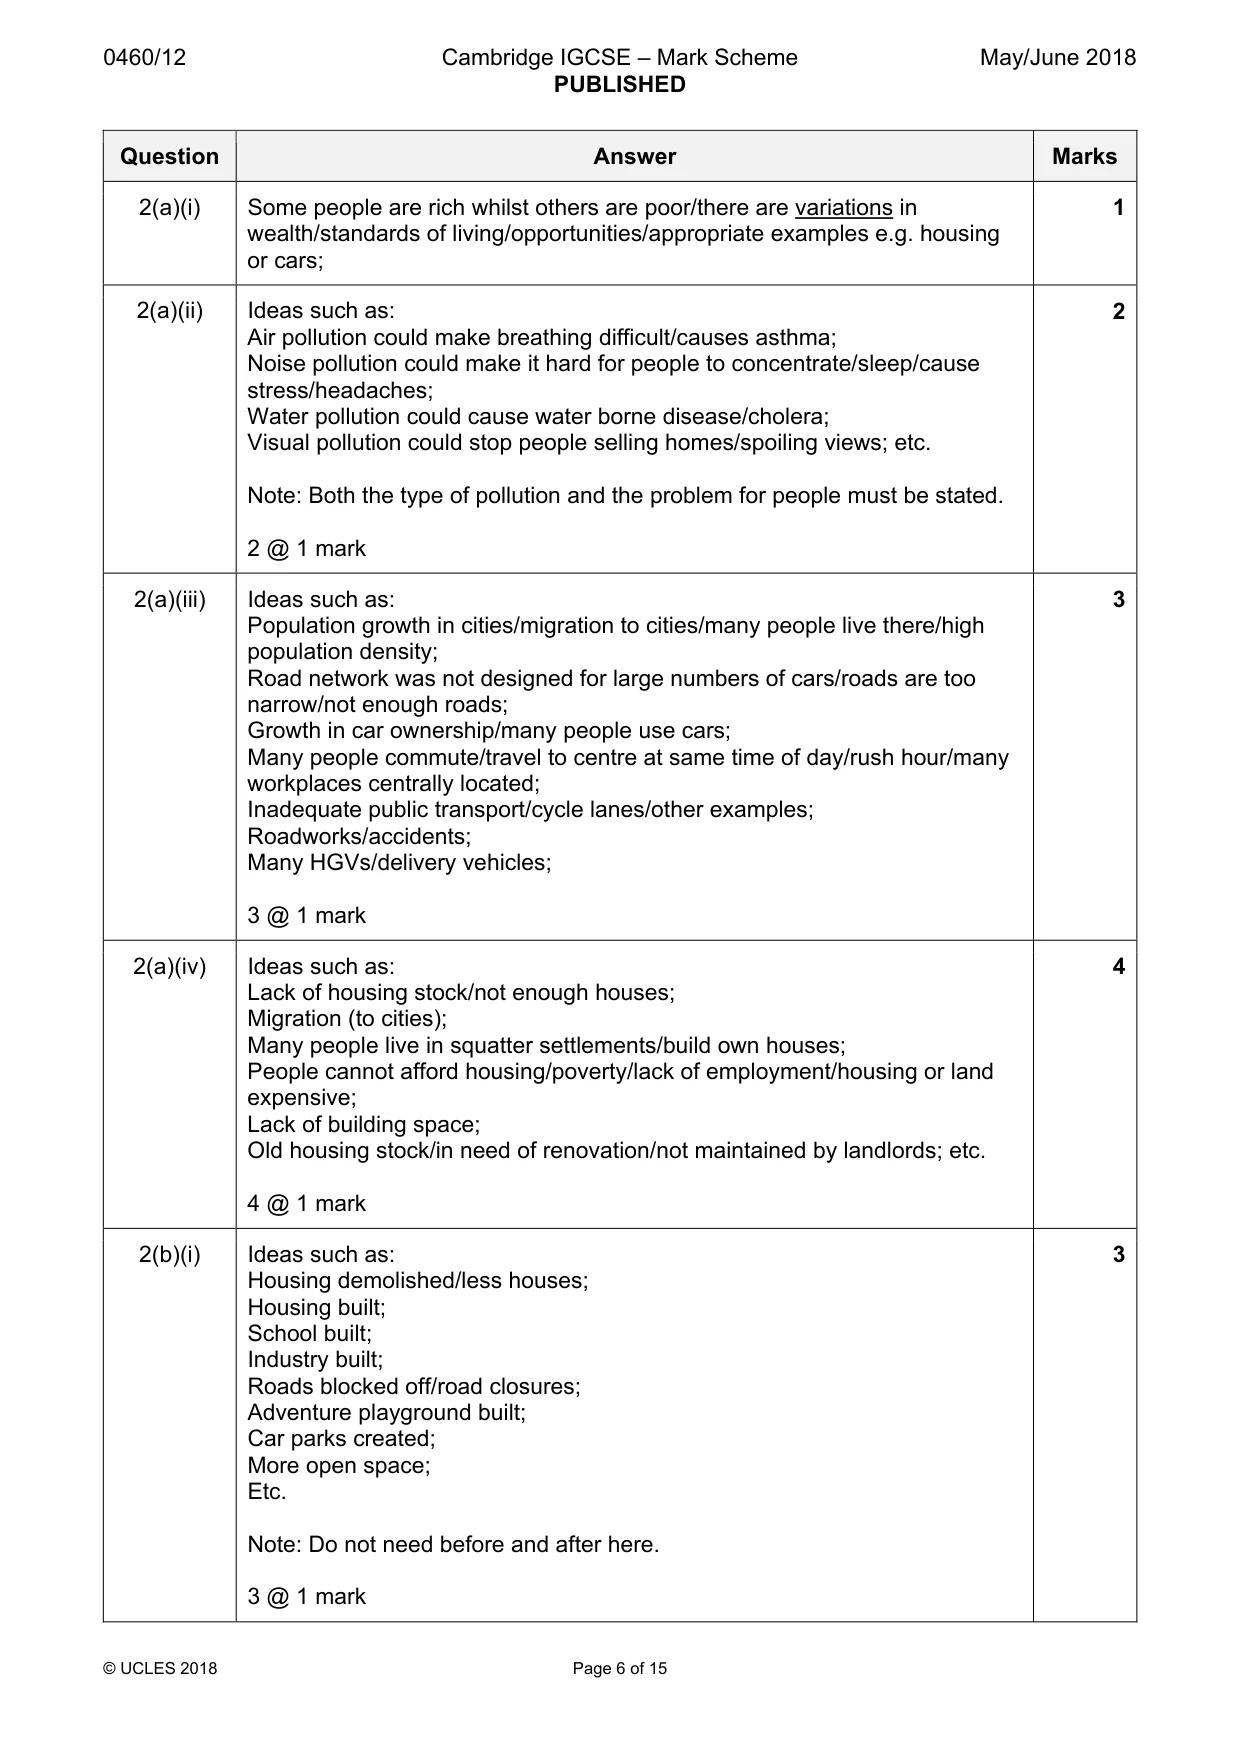
0460/12 Cambridge IGCSE – Mark Scheme PUBLISHED May/June 2018 © UCLES 2018 Page 6 of 15 Question Answer Marks 2(a)(i) Some people are rich whilst others are poor/there are variations in wealth/standards of living/opportunities/appropriate examples e.g. housing or cars; 1 2(a)(ii) Ideas such as: Air pollution could make breathing difficult/causes asthma; Noise pollution could make it hard for people to concentrate/sleep/cause stress/headaches; Water pollution could cause water borne disease/cholera; Visual pollution could stop people selling homes/spoiling views; etc. Note: Both the type of pollution and the problem for people must be stated. 2 @ 1 mark 2 2(a)(iii) Ideas such as: Population growth in cities/migration to cities/many people live there/high population density; Road network was not designed for large numbers of cars/roads are too narrow/not enough roads; Growth in car ownership/many people use cars; Many people commute/travel to centre at same time of day/rush hour/many workplaces centrally located; Inadequate public transport/cycle lanes/other examples; Roadworks/accidents; Many HGVs/delivery vehicles; 3 @ 1 mark 3 2(a)(iv) Ideas such as: Lack of housing stock/not enough houses; Migration (to cities); Many people live in squatter settlements/build own houses; People cannot afford housing/poverty/lack of employment/housing or land expensive; Lack of building space; Old housing stock/in need of renovation/not maintained by landlords; etc. 4 @ 1 mark 4 2(b)(i) Ideas such as: Housing demolished/less houses; Housing built; School built; Industry built; Roads blocked off/road closures; Adventure playground built; Car parks created; More open space; Etc. Note: Do not need before and after here. 3 @ 1 mark 3
Mark scheme, page 7
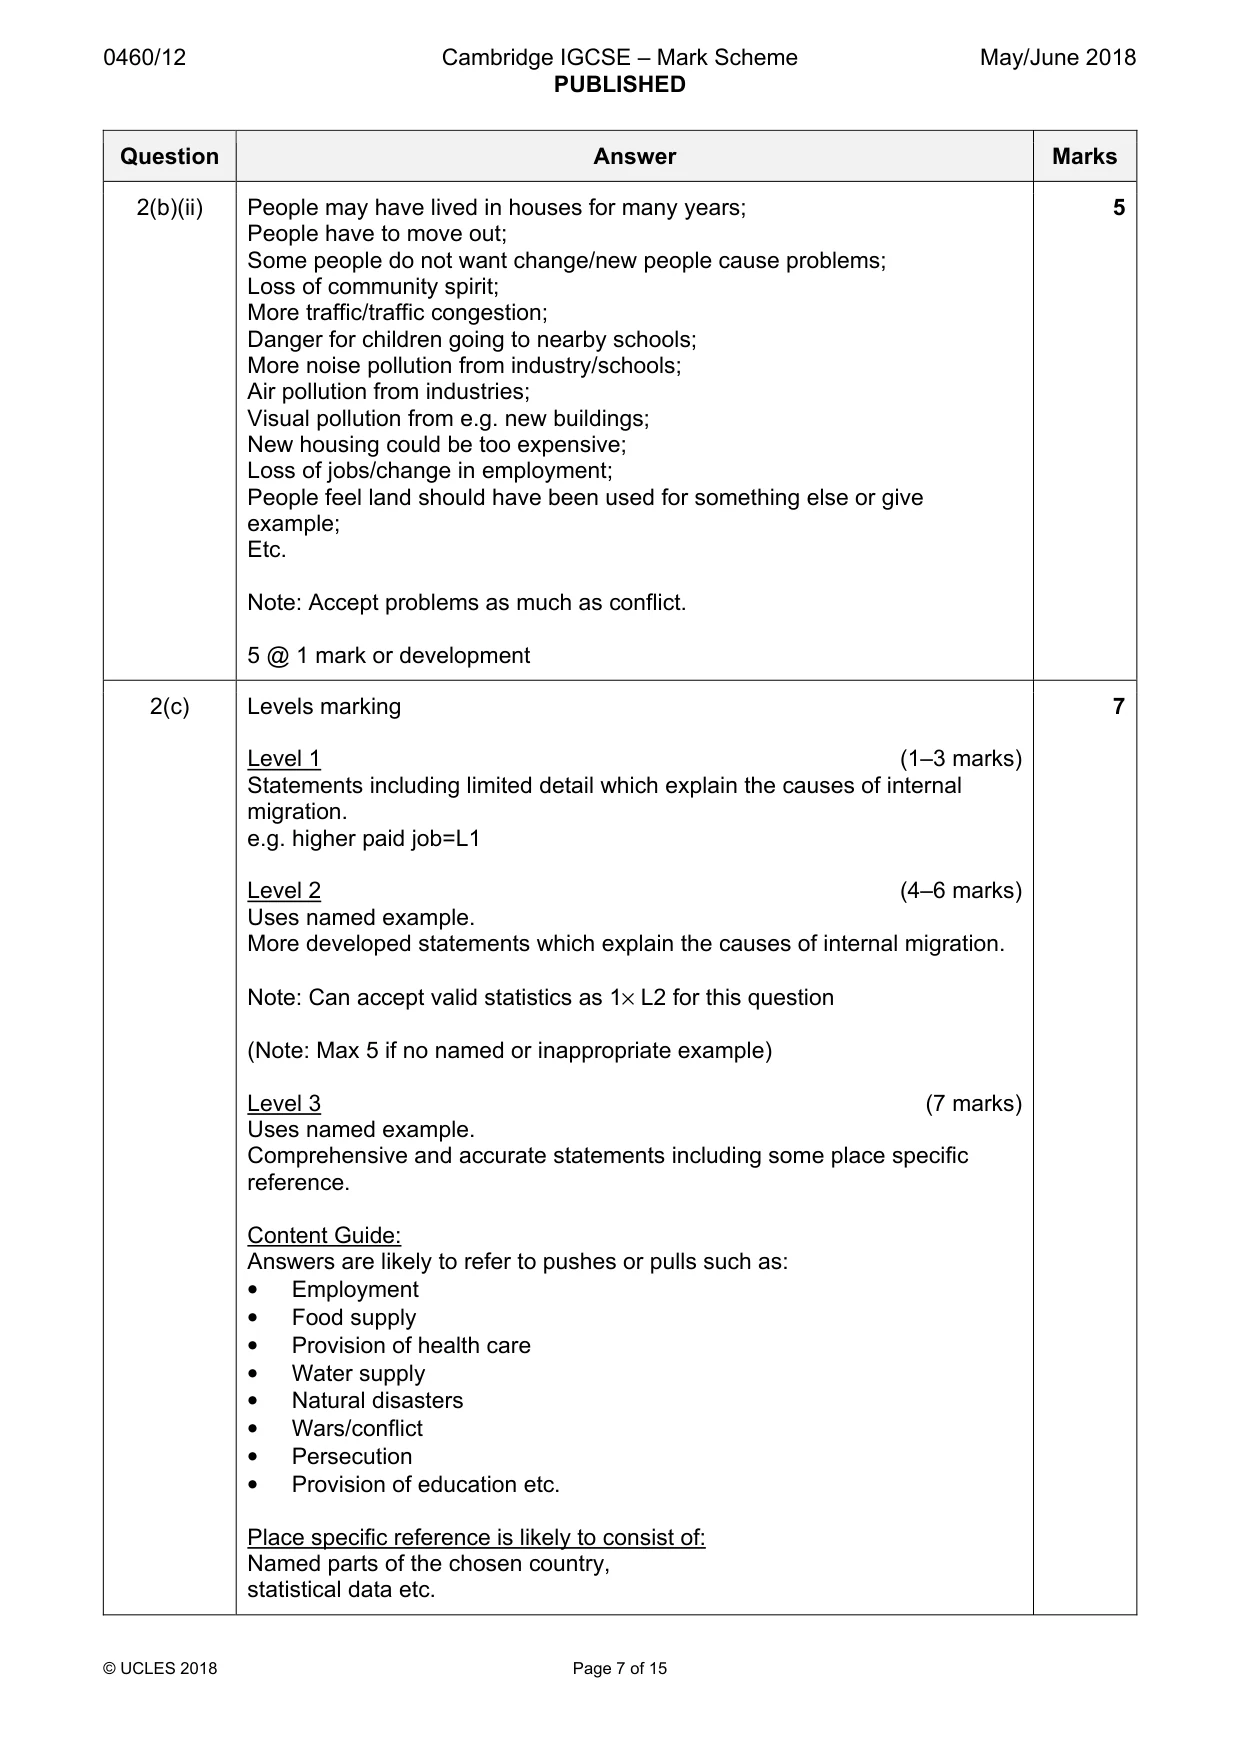
0460/12 Cambridge IGCSE – Mark Scheme PUBLISHED May/June 2018 © UCLES 2018 Page 7 of 15 Question Answer Marks 2(b)(ii) People may have lived in houses for many years; People have to move out; Some people do not want change/new people cause problems; Loss of community spirit; More traffic/traffic congestion; Danger for children going to nearby schools; More noise pollution from industry/schools; Air pollution from industries; Visual pollution from e.g. new buildings; New housing could be too expensive; Loss of jobs/change in employment; People feel land should have been used for something else or give example; Etc. Note: Accept problems as much as conflict. 5 @ 1 mark or development 5 2(c) Levels marking Level 1 (1–3 marks) Statements including limited detail which explain the causes of internal migration. e.g. higher paid job=L1 Level 2 (4–6 marks) Uses named example. More developed statements which explain the causes of internal migration. Note: Can accept valid statistics as 1× L2 for this question (Note: Max 5 if no named or inappropriate example) Level 3 (7 marks) Uses named example. Comprehensive and accurate statements including some place specific reference. Content Guide: Answers are likely to refer to pushes or pulls such as: • Employment • Food supply • Provision of health care • Water supply • Natural disasters • Wars/conflict • Persecution • Provision of education etc. Place specific reference is likely to consist of: Named parts of the chosen country, statistical data etc. 7
Mark scheme, page 8
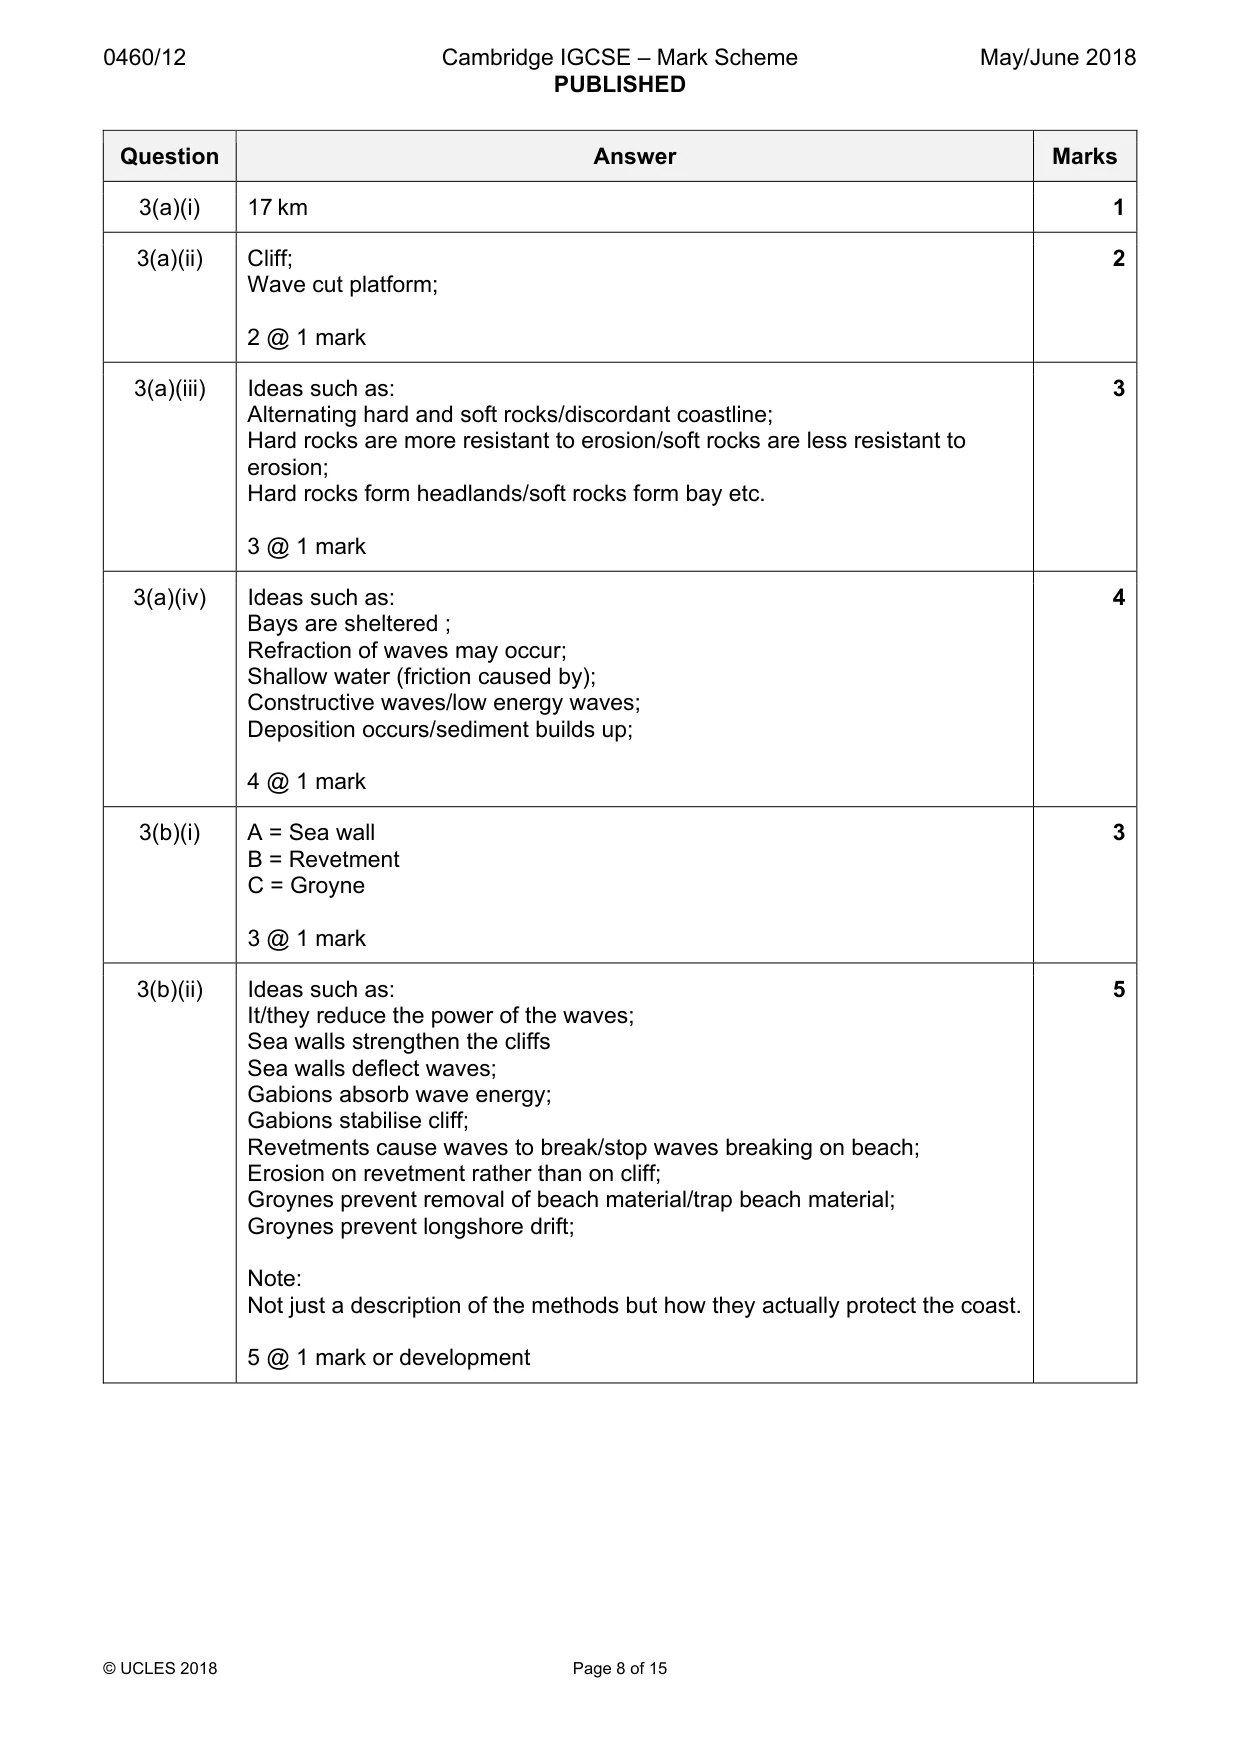
0460/12 Cambridge IGCSE – Mark Scheme PUBLISHED May/June 2018 © UCLES 2018 Page 8 of 15 Question Answer Marks 3(a)(i) 17 km 1 3(a)(ii) Cliff; Wave cut platform; 2 @ 1 mark 2 3(a)(iii) Ideas such as: Alternating hard and soft rocks/discordant coastline; Hard rocks are more resistant to erosion/soft rocks are less resistant to erosion; Hard rocks form headlands/soft rocks form bay etc. 3 @ 1 mark 3 3(a)(iv) Ideas such as: Bays are sheltered ; Refraction of waves may occur; Shallow water (friction caused by); Constructive waves/low energy waves; Deposition occurs/sediment builds up; 4 @ 1 mark 4 3(b)(i) A = Sea wall B = Revetment C = Groyne 3 @ 1 mark 3 3(b)(ii) Ideas such as: It/they reduce the power of the waves; Sea walls strengthen the cliffs Sea walls deflect waves; Gabions absorb wave energy; Gabions stabilise cliff; Revetments cause waves to break/stop waves breaking on beach; Erosion on revetment rather than on cliff; Groynes prevent removal of beach material/trap beach material; Groynes prevent longshore drift; Note: Not just a description of the methods but how they actually protect the coast. 5 @ 1 mark or development 5
Mark scheme, page 9
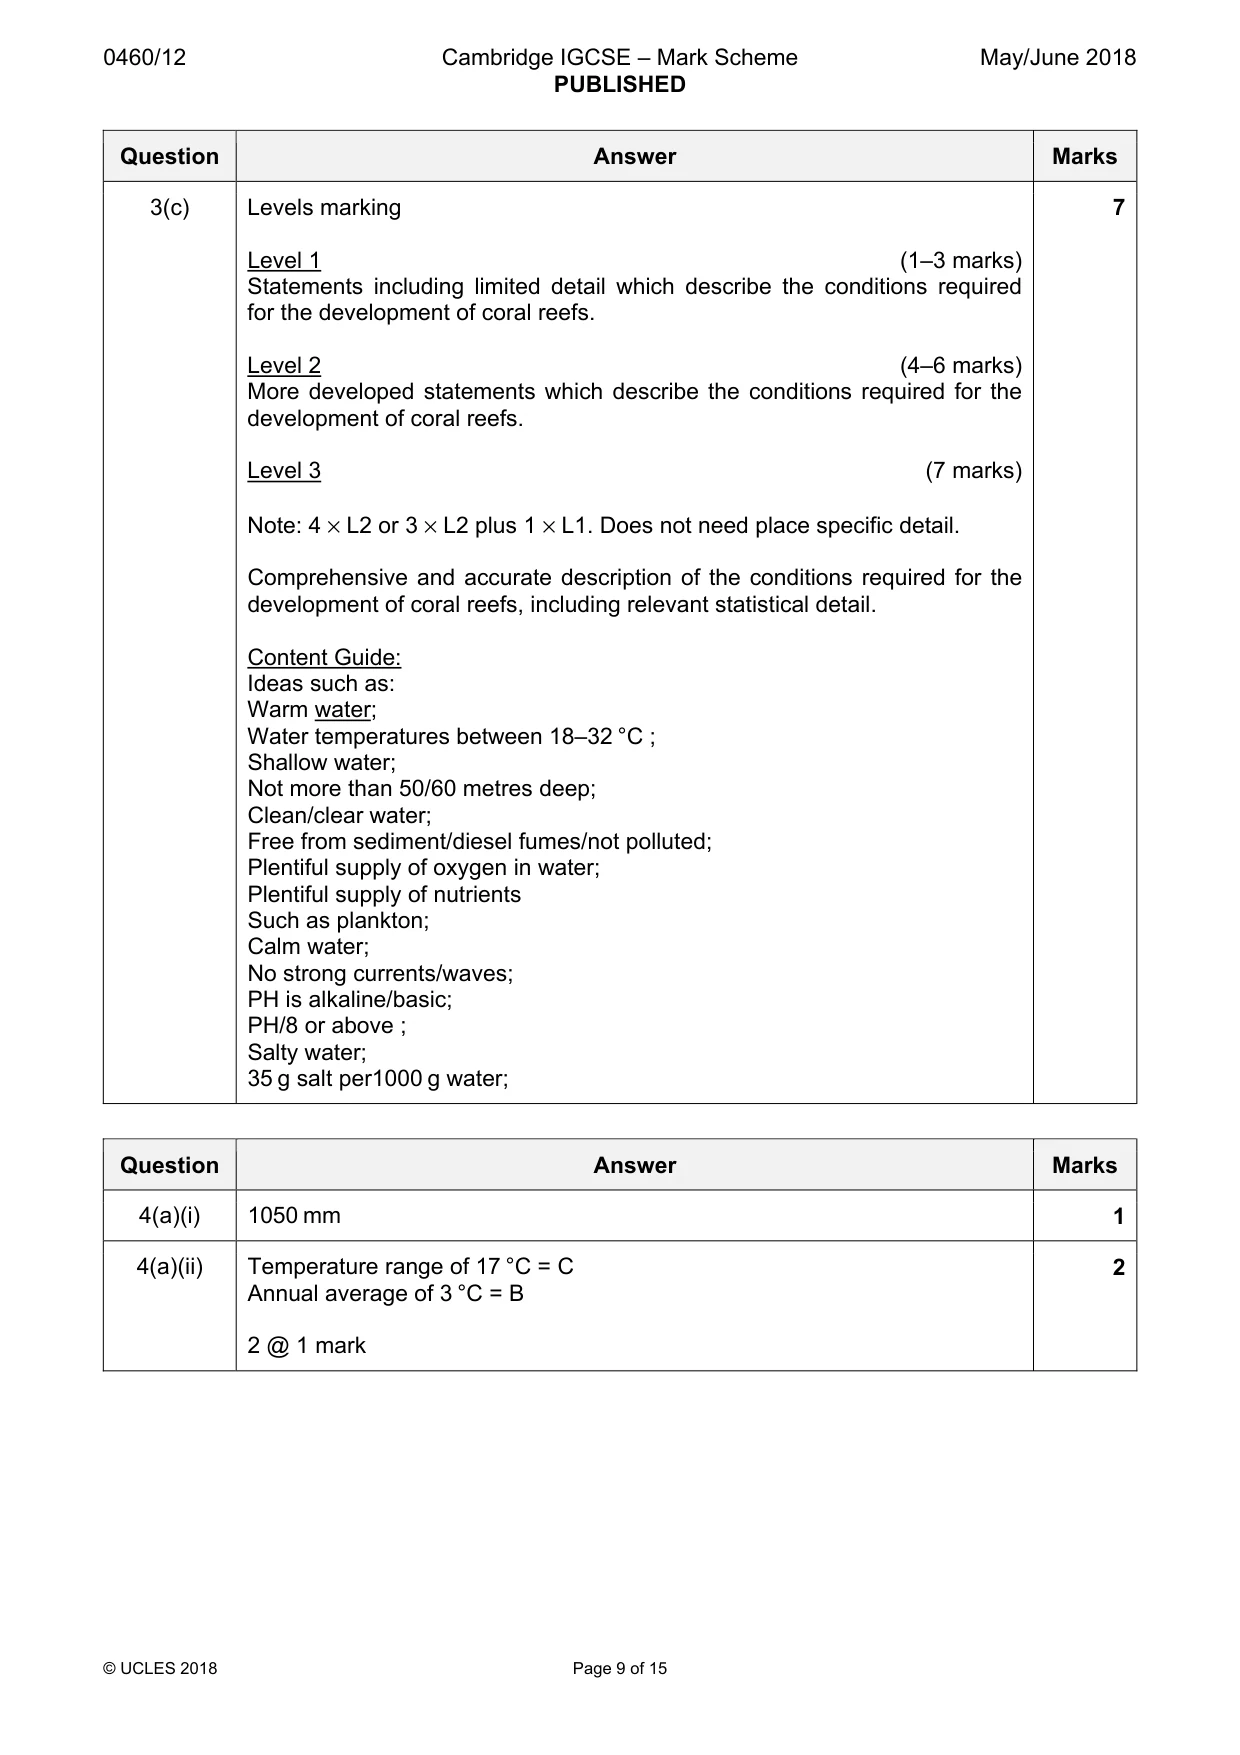
0460/12 Cambridge IGCSE – Mark Scheme PUBLISHED May/June 2018 © UCLES 2018 Page 9 of 15 Question Answer Marks 3(c) Levels marking Level 1 (1–3 marks) Statements including limited detail which describe the conditions required for the development of coral reefs. Level 2 (4–6 marks) More developed statements which describe the conditions required for the development of coral reefs. Level 3 (7 marks) Note: 4 × L2 or 3 × L2 plus 1 × L1. Does not need place specific detail. Comprehensive and accurate description of the conditions required for the development of coral reefs, including relevant statistical detail. Content Guide: Ideas such as: Warm water; Water temperatures between 18–32 °C ; Shallow water; Not more than 50/60 metres deep; Clean/clear water; Free from sediment/diesel fumes/not polluted; Plentiful supply of oxygen in water; Plentiful supply of nutrients Such as plankton; Calm water; No strong currents/waves; PH is alkaline/basic; PH/8 or above ; Salty water; 35 g salt per1000 g water; 7 Question Answer Marks 4(a)(i) 1050 mm 1 4(a)(ii) Temperature range of 17 °C = C Annual average of 3 °C = B 2 @ 1 mark 2
Mark scheme, page 10
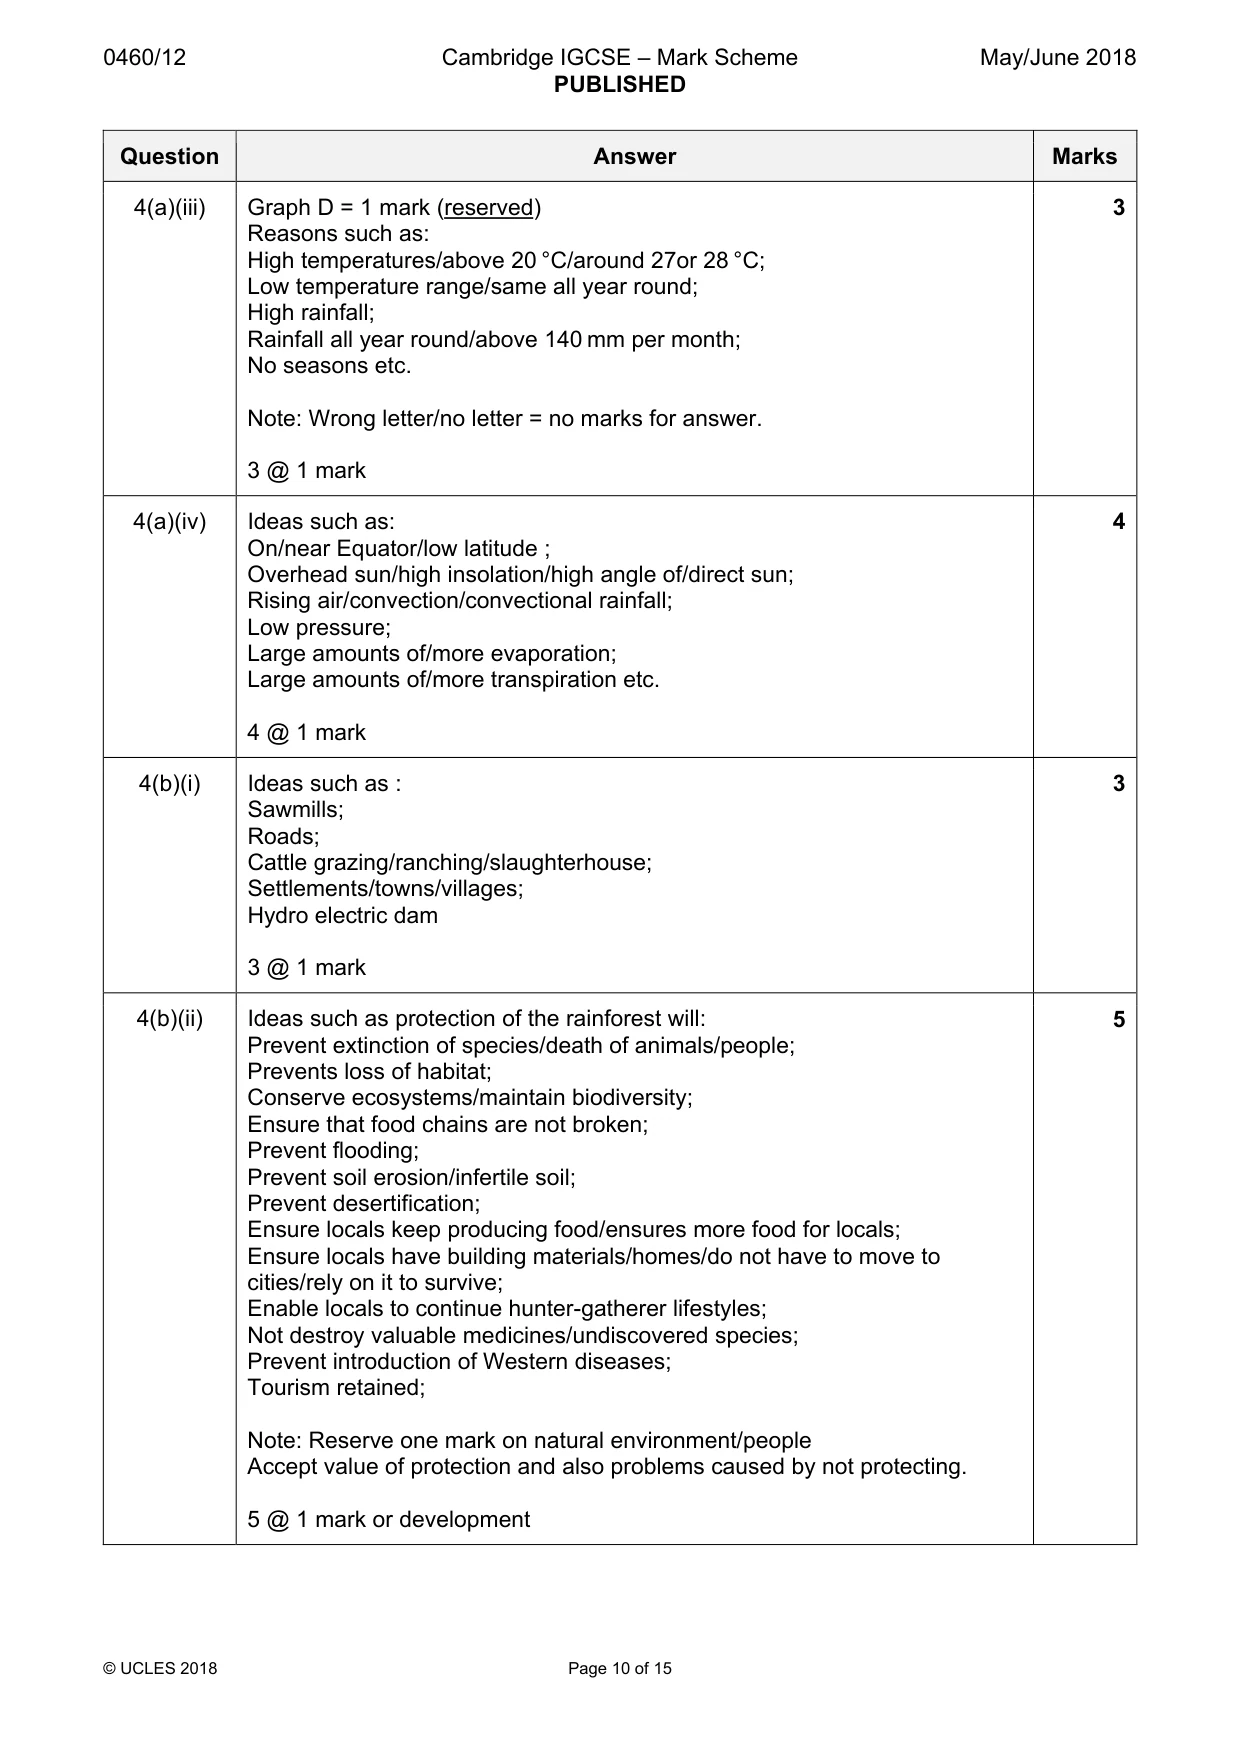
0460/12 Cambridge IGCSE – Mark Scheme PUBLISHED May/June 2018 © UCLES 2018 Page 10 of 15 Question Answer Marks 4(a)(iii) Graph D = 1 mark (reserved) Reasons such as: High temperatures/above 20 °C/around 27or 28 °C; Low temperature range/same all year round; High rainfall; Rainfall all year round/above 140 mm per month; No seasons etc. Note: Wrong letter/no letter = no marks for answer. 3 @ 1 mark 3 4(a)(iv) Ideas such as: On/near Equator/low latitude ; Overhead sun/high insolation/high angle of/direct sun; Rising air/convection/convectional rainfall; Low pressure; Large amounts of/more evaporation; Large amounts of/more transpiration etc. 4 @ 1 mark 4 4(b)(i) Ideas such as : Sawmills; Roads; Cattle grazing/ranching/slaughterhouse; Settlements/towns/villages; Hydro electric dam 3 @ 1 mark 3 4(b)(ii) Ideas such as protection of the rainforest will: Prevent extinction of species/death of animals/people; Prevents loss of habitat; Conserve ecosystems/maintain biodiversity; Ensure that food chains are not broken; Prevent flooding; Prevent soil erosion/infertile soil; Prevent desertification; Ensure locals keep producing food/ensures more food for locals; Ensure locals have building materials/homes/do not have to move to cities/rely on it to survive; Enable locals to continue hunter-gatherer lifestyles; Not destroy valuable medicines/undiscovered species; Prevent introduction of Western diseases; Tourism retained; Note: Reserve one mark on natural environment/people Accept value of protection and also problems caused by not protecting. 5 @ 1 mark or development 5
Mark scheme, page 11
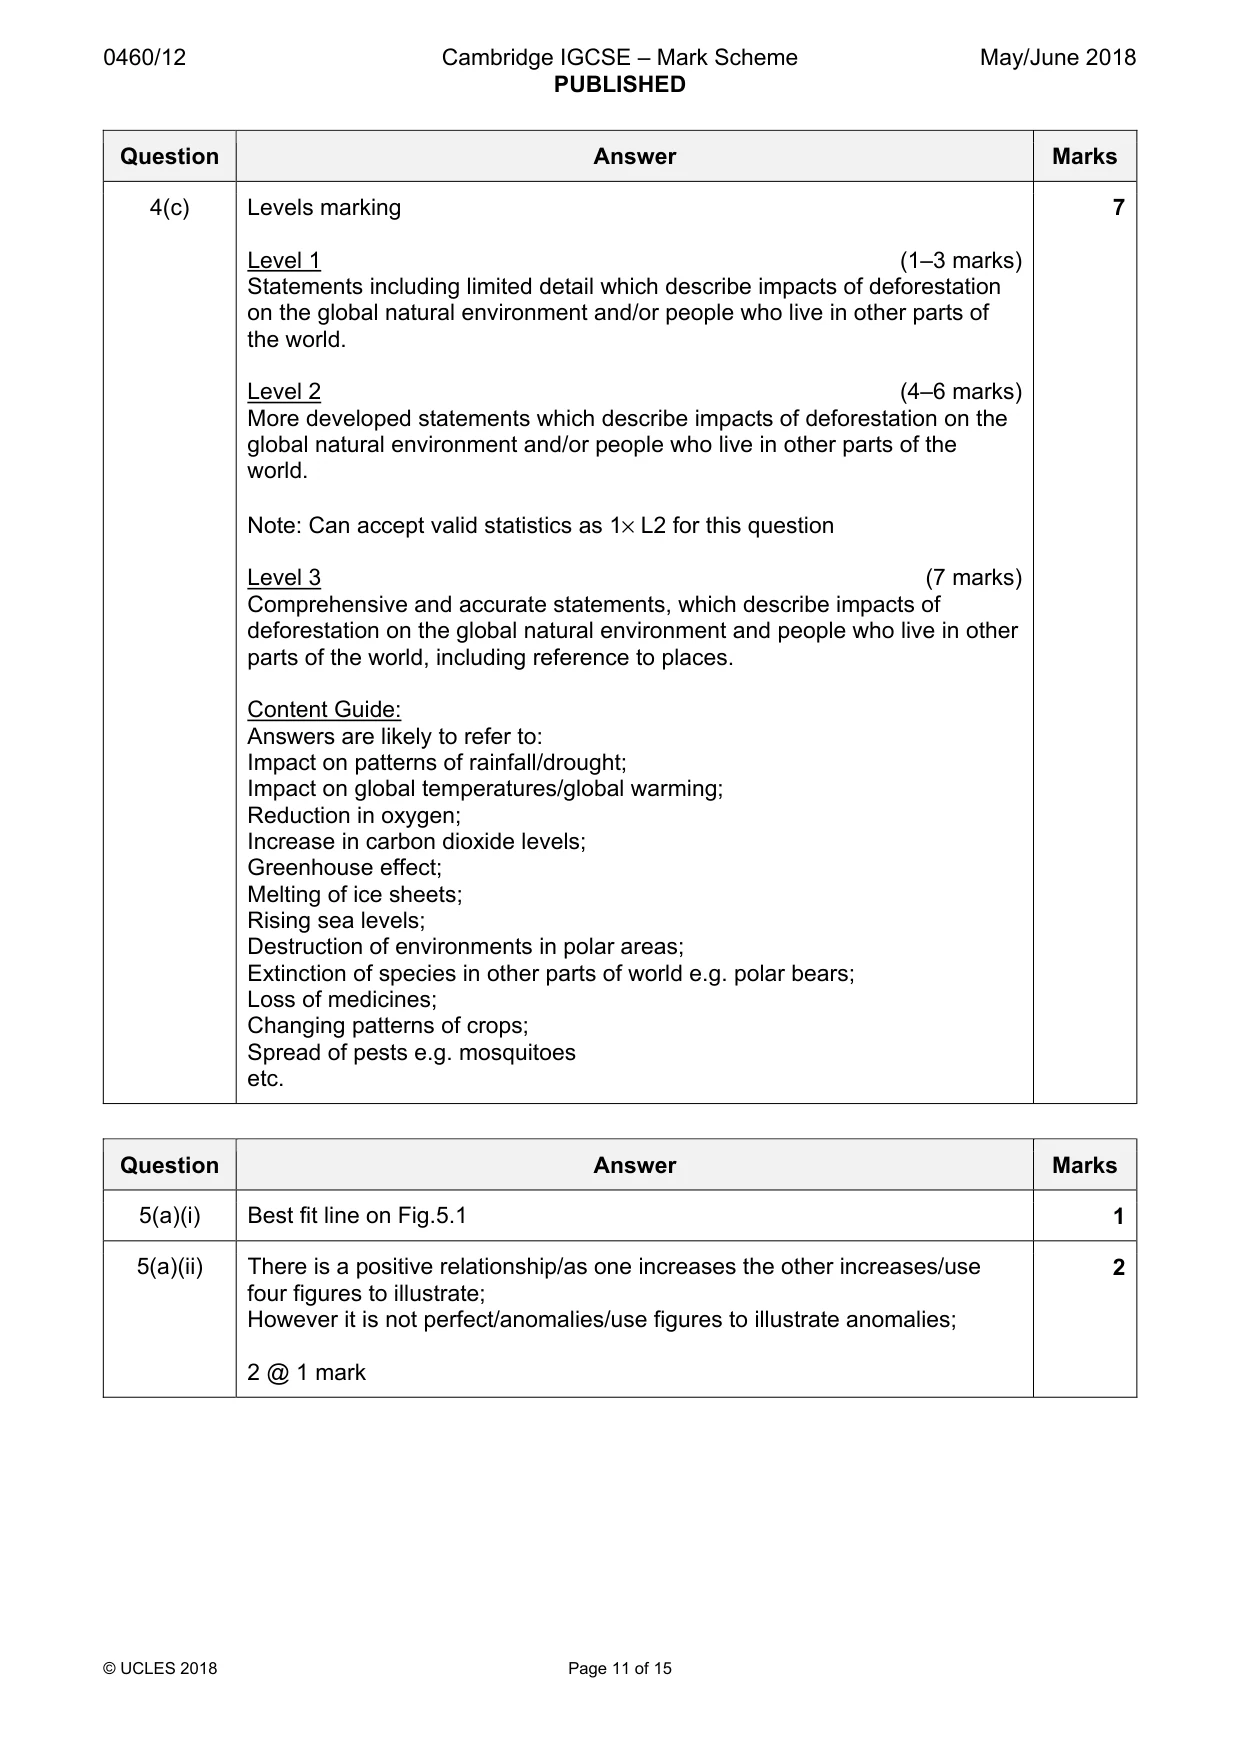
0460/12 Cambridge IGCSE – Mark Scheme PUBLISHED May/June 2018 © UCLES 2018 Page 11 of 15 Question Answer Marks 4(c) Levels marking Level 1 (1–3 marks) Statements including limited detail which describe impacts of deforestation on the global natural environment and/or people who live in other parts of the world. Level 2 (4–6 marks) More developed statements which describe impacts of deforestation on the global natural environment and/or people who live in other parts of the world. Note: Can accept valid statistics as 1× L2 for this question Level 3 (7 marks) Comprehensive and accurate statements, which describe impacts of deforestation on the global natural environment and people who live in other parts of the world, including reference to places. Content Guide: Answers are likely to refer to: Impact on patterns of rainfall/drought; Impact on global temperatures/global warming; Reduction in oxygen; Increase in carbon dioxide levels; Greenhouse effect; Melting of ice sheets; Rising sea levels; Destruction of environments in polar areas; Extinction of species in other parts of world e.g. polar bears; Loss of medicines; Changing patterns of crops; Spread of pests e.g. mosquitoes etc. 7 Question Answer Marks 5(a)(i) Best fit line on Fig.5.1 1 5(a)(ii) There is a positive relationship/as one increases the other increases/use four figures to illustrate; However it is not perfect/anomalies/use figures to illustrate anomalies; 2 @ 1 mark 2
Mark scheme, page 12
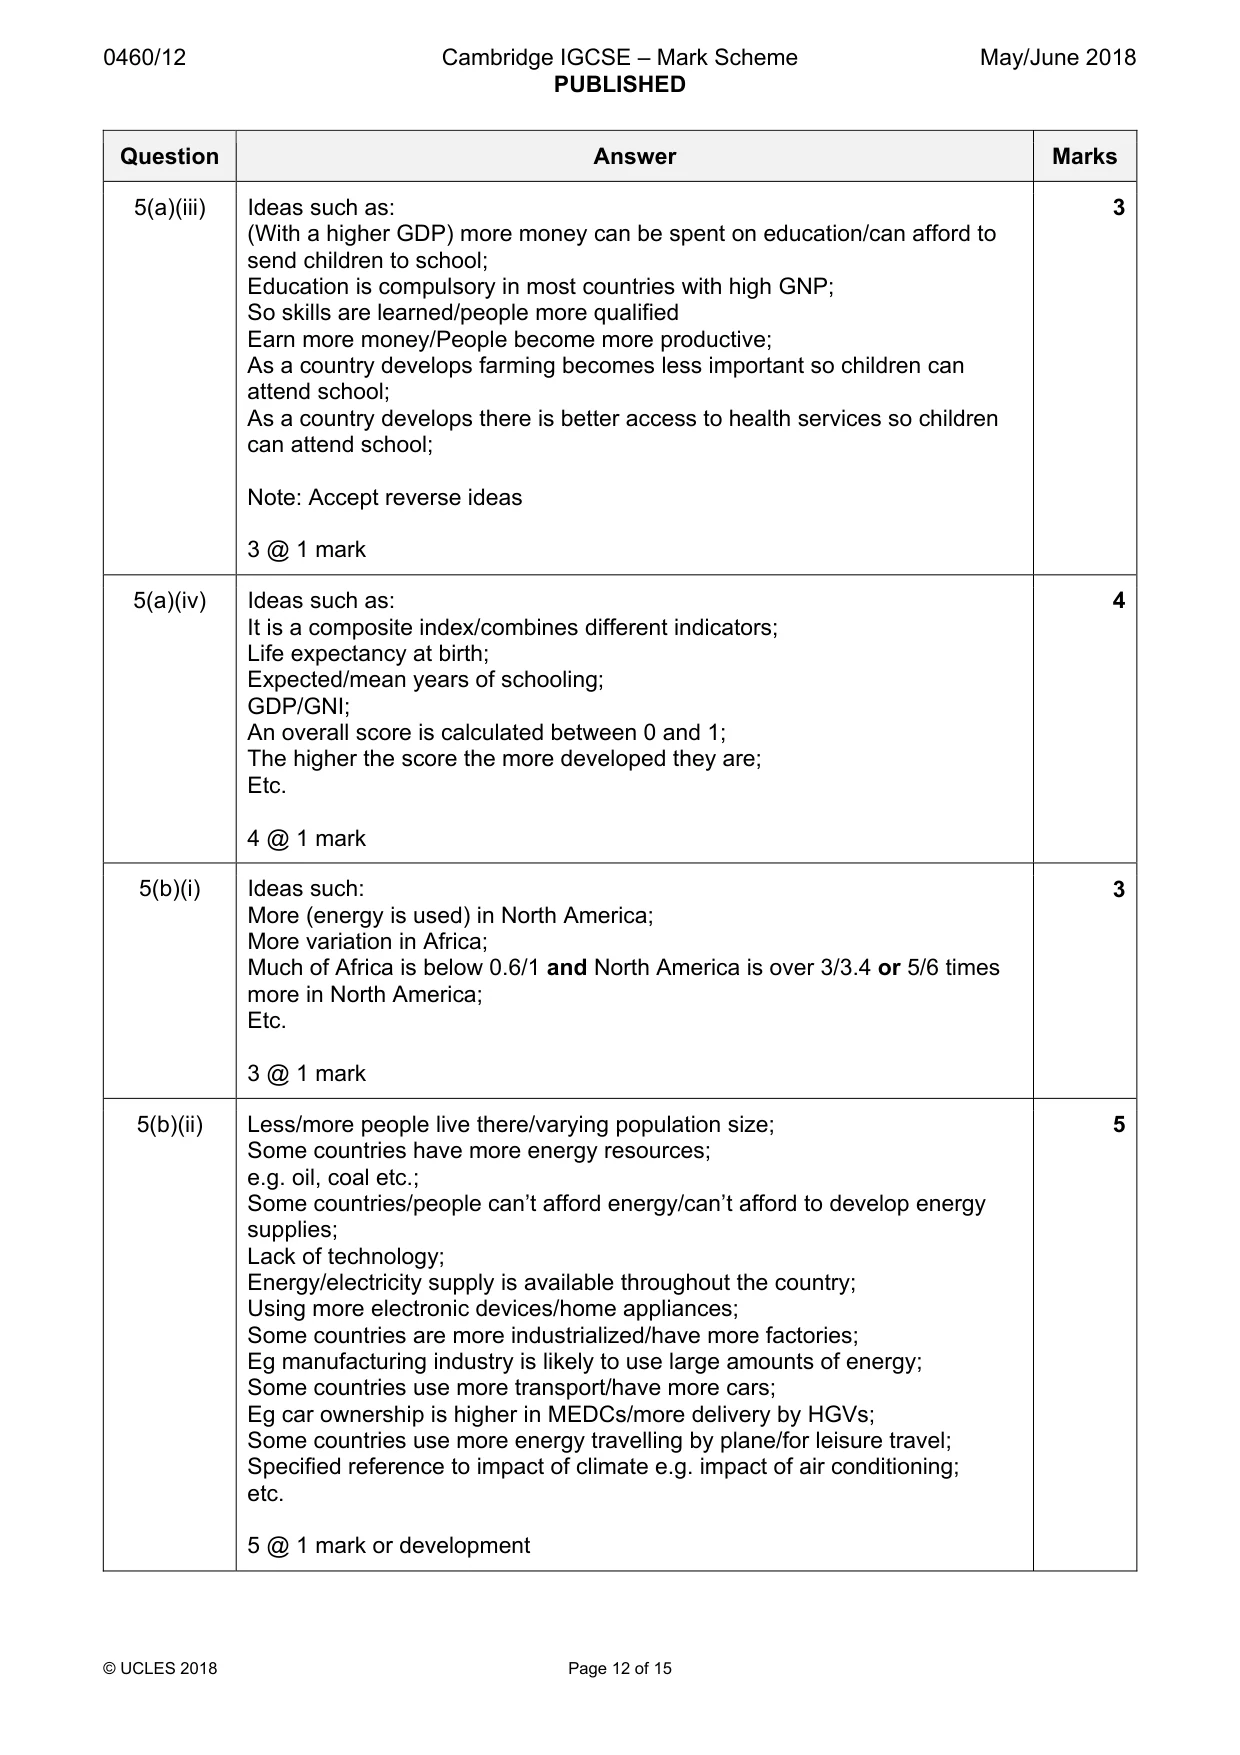
0460/12 Cambridge IGCSE – Mark Scheme PUBLISHED May/June 2018 © UCLES 2018 Page 12 of 15 Question Answer Marks 5(a)(iii) Ideas such as: (With a higher GDP) more money can be spent on education/can afford to send children to school; Education is compulsory in most countries with high GNP; So skills are learned/people more qualified Earn more money/People become more productive; As a country develops farming becomes less important so children can attend school; As a country develops there is better access to health services so children can attend school; Note: Accept reverse ideas 3 @ 1 mark 3 5(a)(iv) Ideas such as: It is a composite index/combines different indicators; Life expectancy at birth; Expected/mean years of schooling; GDP/GNI; An overall score is calculated between 0 and 1; The higher the score the more developed they are; Etc. 4 @ 1 mark 4 5(b)(i) Ideas such: More (energy is used) in North America; More variation in Africa; Much of Africa is below 0.6/1 and North America is over 3/3.4 or 5/6 times more in North America; Etc. 3 @ 1 mark 3 5(b)(ii) Less/more people live there/varying population size; Some countries have more energy resources; e.g. oil, coal etc.; Some countries/people can’t afford energy/can’t afford to develop energy supplies; Lack of technology; Energy/electricity supply is available throughout the country; Using more electronic devices/home appliances; Some countries are more industrialized/have more factories; Eg manufacturing industry is likely to use large amounts of energy; Some countries use more transport/have more cars; Eg car ownership is higher in MEDCs/more delivery by HGVs; Some countries use more energy travelling by plane/for leisure travel; Specified reference to impact of climate e.g. impact of air conditioning; etc. 5 @ 1 mark or development 5
Mark scheme, page 13
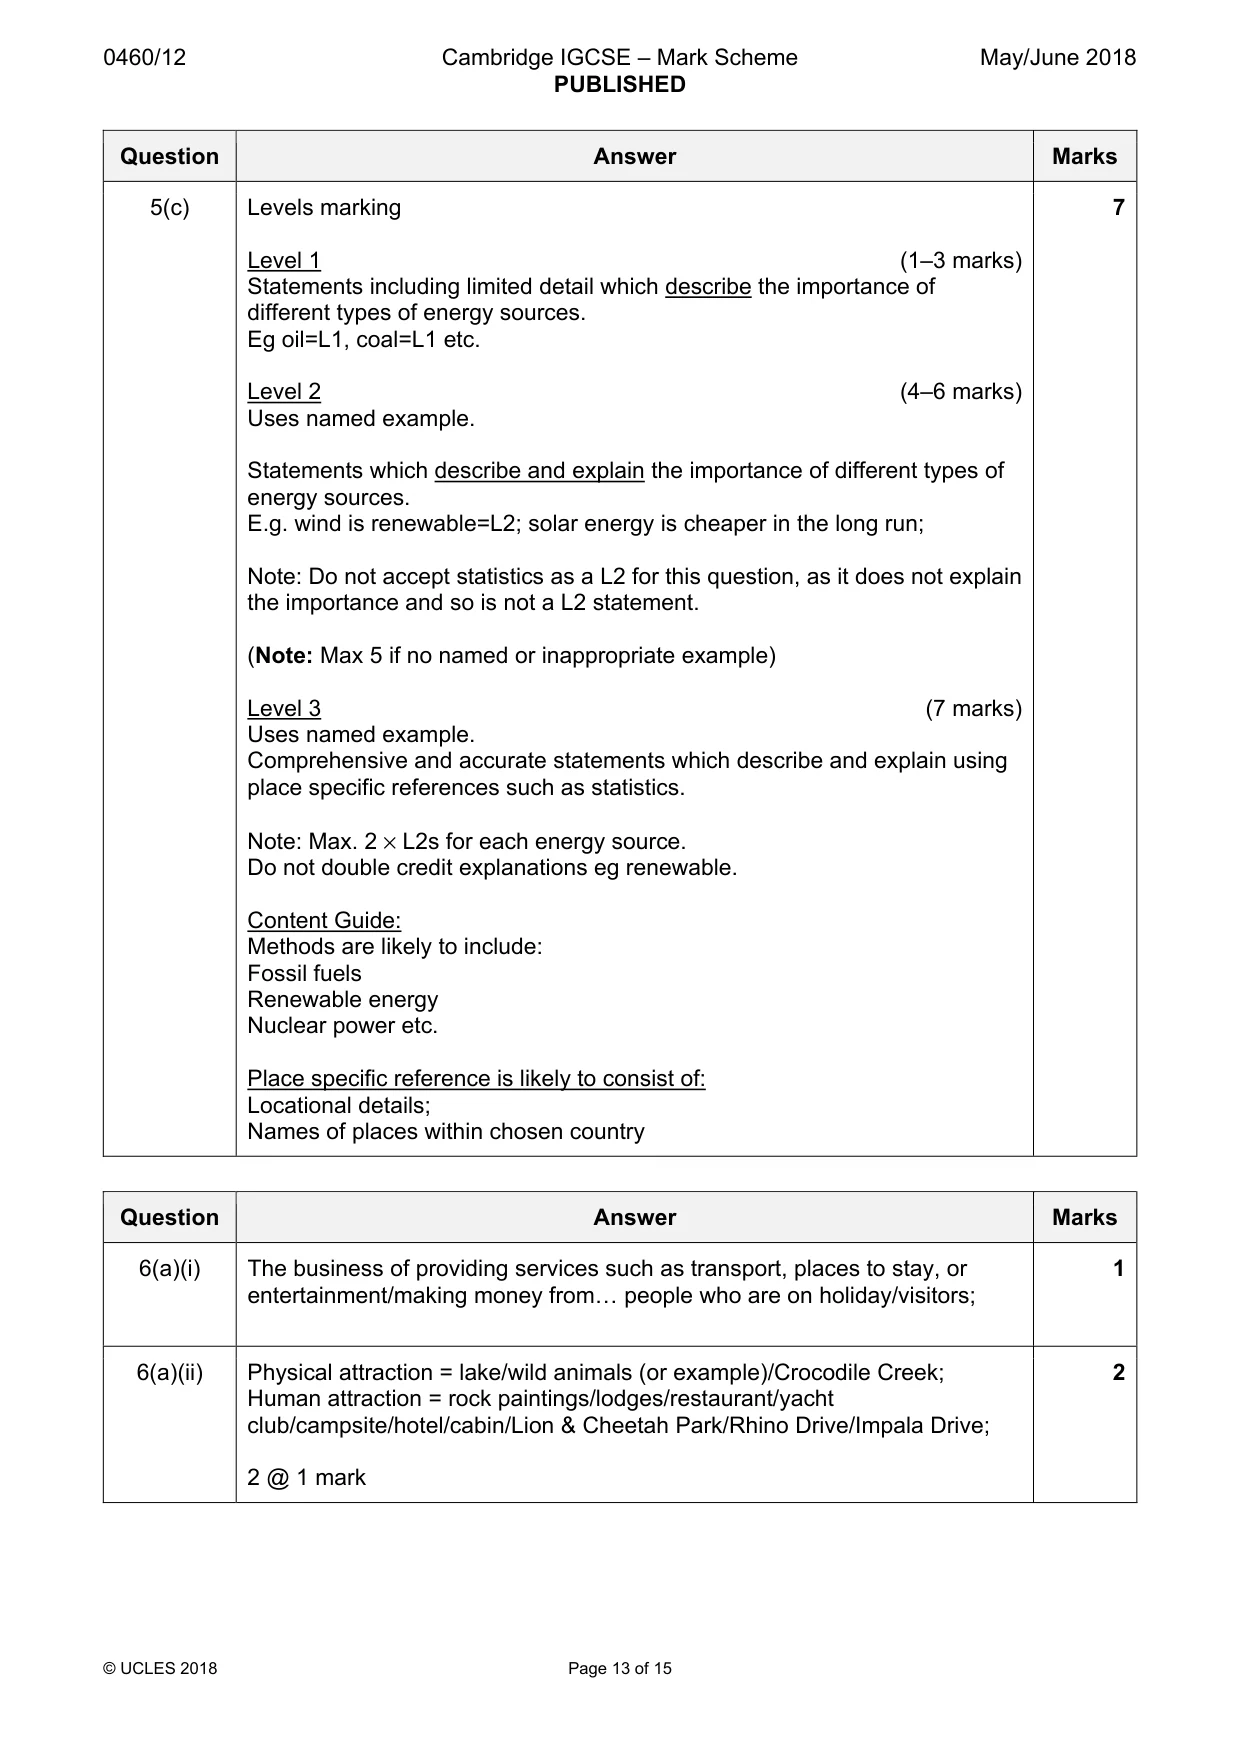
0460/12 Cambridge IGCSE – Mark Scheme PUBLISHED May/June 2018 © UCLES 2018 Page 13 of 15 Question Answer Marks 5(c) Levels marking Level 1 (1–3 marks) Statements including limited detail which describe the importance of different types of energy sources. Eg oil=L1, coal=L1 etc. Level 2 (4–6 marks) Uses named example. Statements which describe and explain the importance of different types of energy sources. E.g. wind is renewable=L2; solar energy is cheaper in the long run; Note: Do not accept statistics as a L2 for this question, as it does not explain the importance and so is not a L2 statement. (Note: Max 5 if no named or inappropriate example) Level 3 (7 marks) Uses named example. Comprehensive and accurate statements which describe and explain using place specific references such as statistics. Note: Max. 2 × L2s for each energy source. Do not double credit explanations eg renewable. Content Guide: Methods are likely to include: Fossil fuels Renewable energy Nuclear power etc. Place specific reference is likely to consist of: Locational details; Names of places within chosen country 7 Question Answer Marks 6(a)(i) The business of providing services such as transport, places to stay, or entertainment/making money from« people who are on holiday/visitors; 1 6(a)(ii) Physical attraction = lake/wild animals (or example)/Crocodile Creek; Human attraction = rock paintings/lodges/restaurant/yacht club/campsite/hotel/cabin/Lion & Cheetah Park/Rhino Drive/Impala Drive; 2 @ 1 mark 2
Mark scheme, page 14
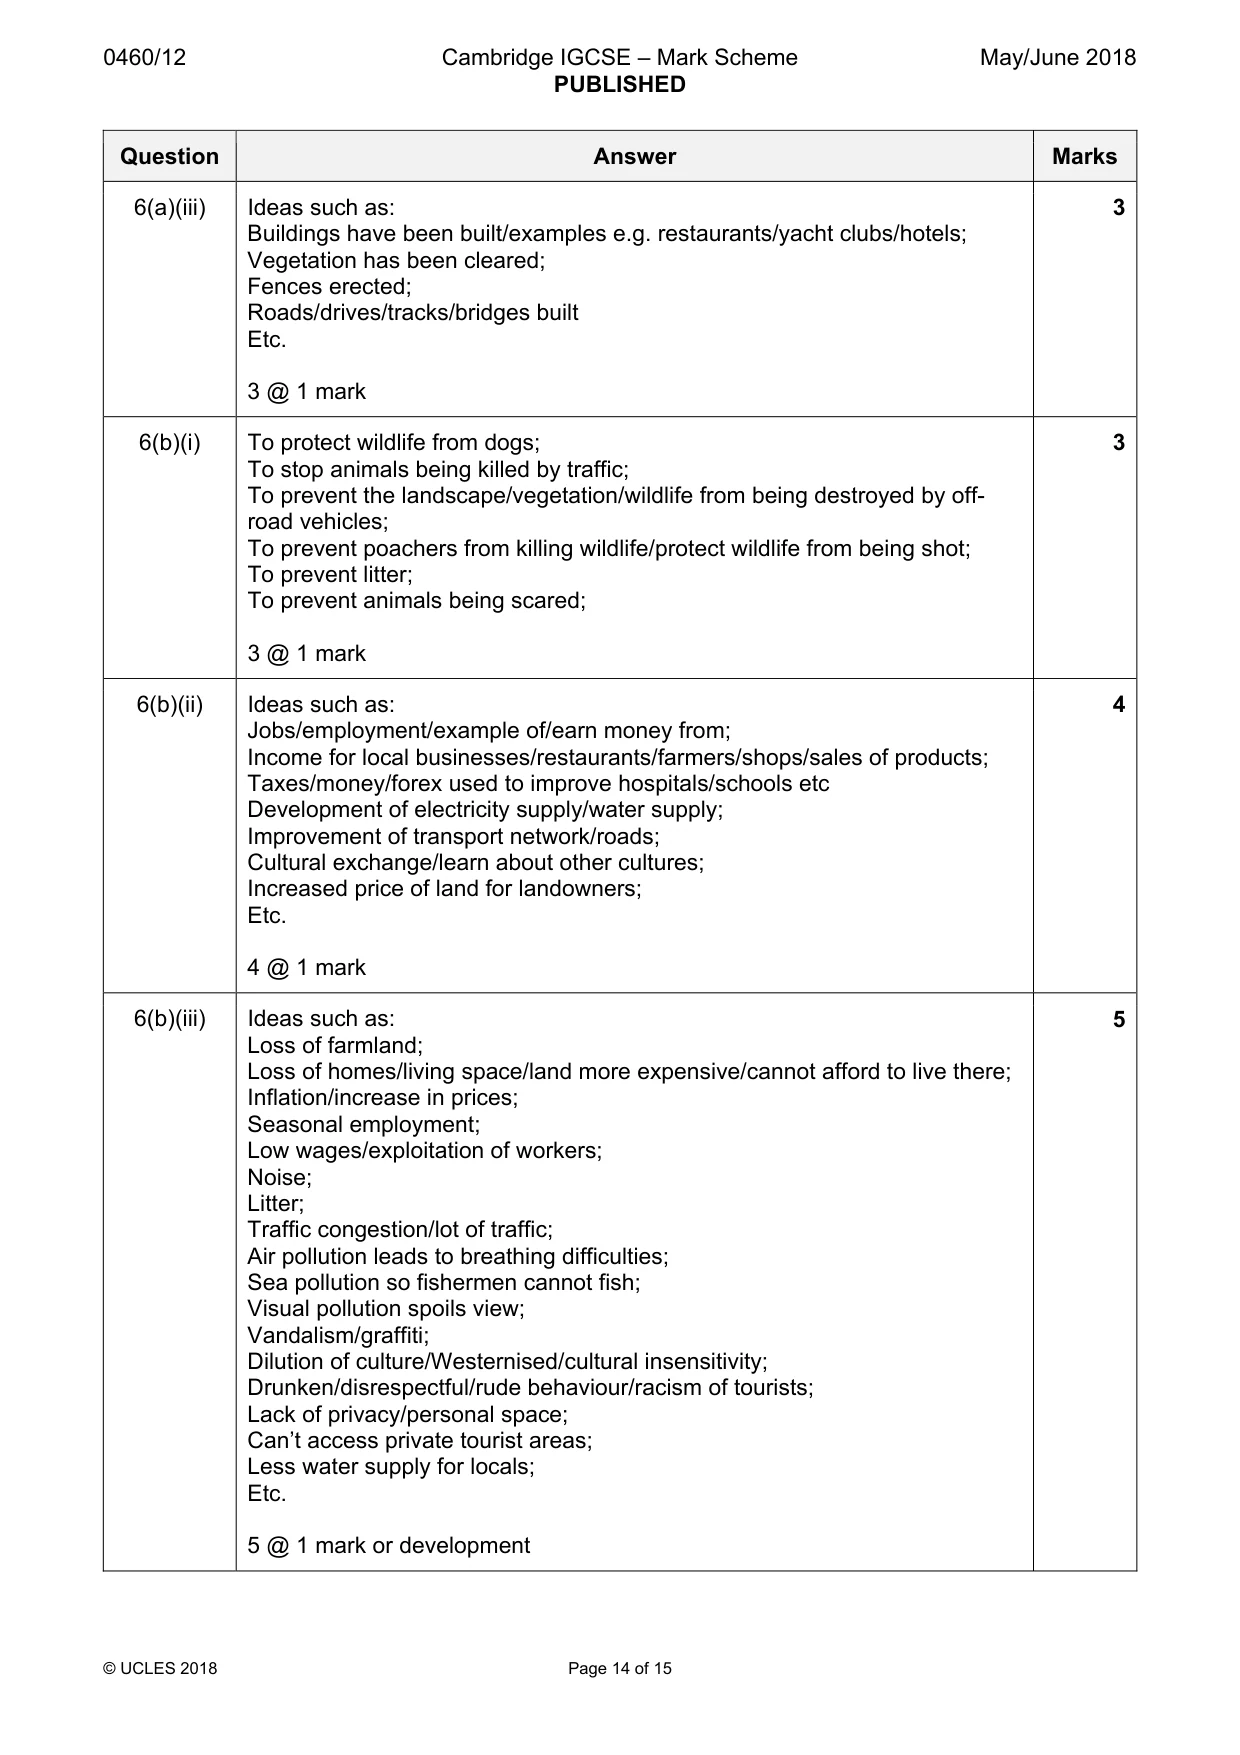
0460/12 Cambridge IGCSE – Mark Scheme PUBLISHED May/June 2018 © UCLES 2018 Page 14 of 15 Question Answer Marks 6(a)(iii) Ideas such as: Buildings have been built/examples e.g. restaurants/yacht clubs/hotels; Vegetation has been cleared; Fences erected; Roads/drives/tracks/bridges built Etc. 3 @ 1 mark 3 6(b)(i) To protect wildlife from dogs; To stop animals being killed by traffic; To prevent the landscape/vegetation/wildlife from being destroyed by off- road vehicles; To prevent poachers from killing wildlife/protect wildlife from being shot; To prevent litter; To prevent animals being scared; 3 @ 1 mark 3 6(b)(ii) Ideas such as: Jobs/employment/example of/earn money from; Income for local businesses/restaurants/farmers/shops/sales of products; Taxes/money/forex used to improve hospitals/schools etc Development of electricity supply/water supply; Improvement of transport network/roads; Cultural exchange/learn about other cultures; Increased price of land for landowners; Etc. 4 @ 1 mark 4 6(b)(iii) Ideas such as: Loss of farmland; Loss of homes/living space/land more expensive/cannot afford to live there; Inflation/increase in prices; Seasonal employment; Low wages/exploitation of workers; Noise; Litter; Traffic congestion/lot of traffic; Air pollution leads to breathing difficulties; Sea pollution so fishermen cannot fish; Visual pollution spoils view; Vandalism/graffiti; Dilution of culture/Westernised/cultural insensitivity; Drunken/disrespectful/rude behaviour/racism of tourists; Lack of privacy/personal space; Can’t access private tourist areas; Less water supply for locals; Etc. 5 @ 1 mark or development 5
Mark scheme, page 15
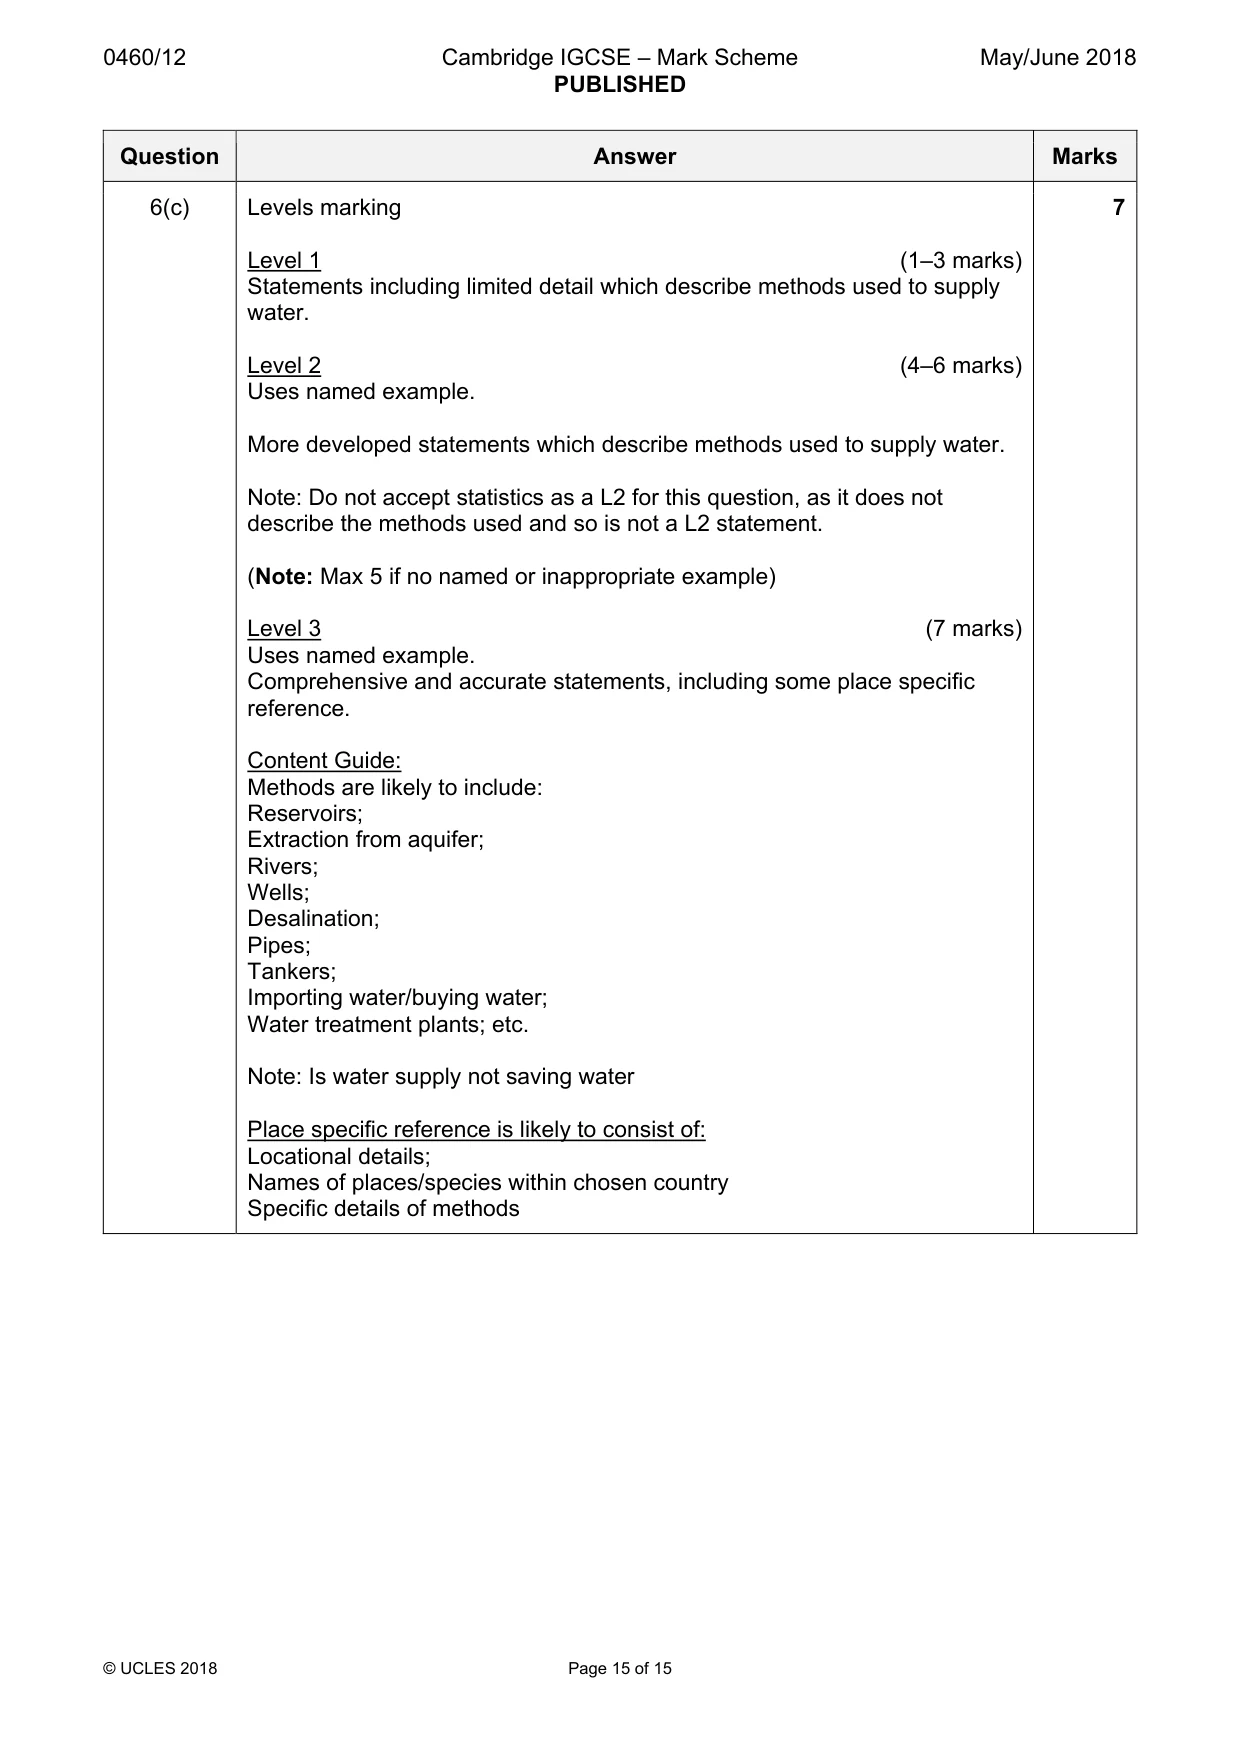
0460/12 Cambridge IGCSE – Mark Scheme PUBLISHED May/June 2018 © UCLES 2018 Page 15 of 15 Question Answer Marks 6(c) Levels marking Level 1 (1–3 marks) Statements including limited detail which describe methods used to supply water. Level 2 (4–6 marks) Uses named example. More developed statements which describe methods used to supply water. Note: Do not accept statistics as a L2 for this question, as it does not describe the methods used and so is not a L2 statement. (Note: Max 5 if no named or inappropriate example) Level 3 (7 marks) Uses named example. Comprehensive and accurate statements, including some place specific reference. Content Guide: Methods are likely to include: Reservoirs; Extraction from aquifer; Rivers; Wells; Desalination; Pipes; Tankers; Importing water/buying water; Water treatment plants; etc. Note: Is water supply not saving water Place specific reference is likely to consist of: Locational details; Names of places/species within chosen country Specific details of methods 7
What you needed in this session
Cambridge’s own grade thresholds for 2018 May/June, Paper 1 · Variant 2. A higher threshold means an easier paper — the bar moves with how the cohort did.