Cambridge IGCSE Geography 0460 — 2017 Oct/Nov Paper 1 · Variant 3
0460/13/O/N/17 · 75 marks · ≈84 min
The question paper and its mark scheme, free to read here and free to download. This is Cambridge’s own paper, exactly as it was sat.
Question paper32 pages

Mark scheme16 pages
Answers below. Sit the paper first if you are practising.
Paper as text
Question paper, page 1
This document consists of 31 printed pages, 1 blank page and 1 Insert. DC (LK/SW) 132662/4 © UCLES 2017 [Turn over Cambridge International Examinations Cambridge International General Certificate of Secondary Education * 4 2 1 1 4 7 2 9 4 6 * GEOGRAPHY 0460/13 Paper 1 October/November 2017 1 hour 45 minutes Candidates answer on the Question Paper. Additional Materials: Calculator Ruler READ THESE INSTRUCTIONS FIRST Write your Centre number, candidate number and name in the spaces provided. Write in dark blue or black pen. You may use an HB pencil for any diagrams or graphs. Do not use staples, paper clips, glue or correction fluid. DO NOT WRITE IN ANY BARCODES. Write your answer to each question in the space provided. If additional space is required, you should use the lined pages at the end of this booklet. The question number(s) must be clearly shown. Answer three questions, one from each section. The Insert contains Photographs A and B for Question 2, and Photograph C for Question 3. The Insert is not required by the Examiner. Sketch maps and diagrams should be drawn whenever they serve to illustrate an answer. At the end of the examination, fasten all your work securely together. The number of marks is given in brackets [ ] at the end of each question or part question. Definitions MEDCs – More Economically Developed Countries LEDCs – Less Economically Developed Countries The syllabus is approved for use in England, Wales and Northern Ireland as a Cambridge International Level 1/Level 2 Certificate.
Question paper, page 2
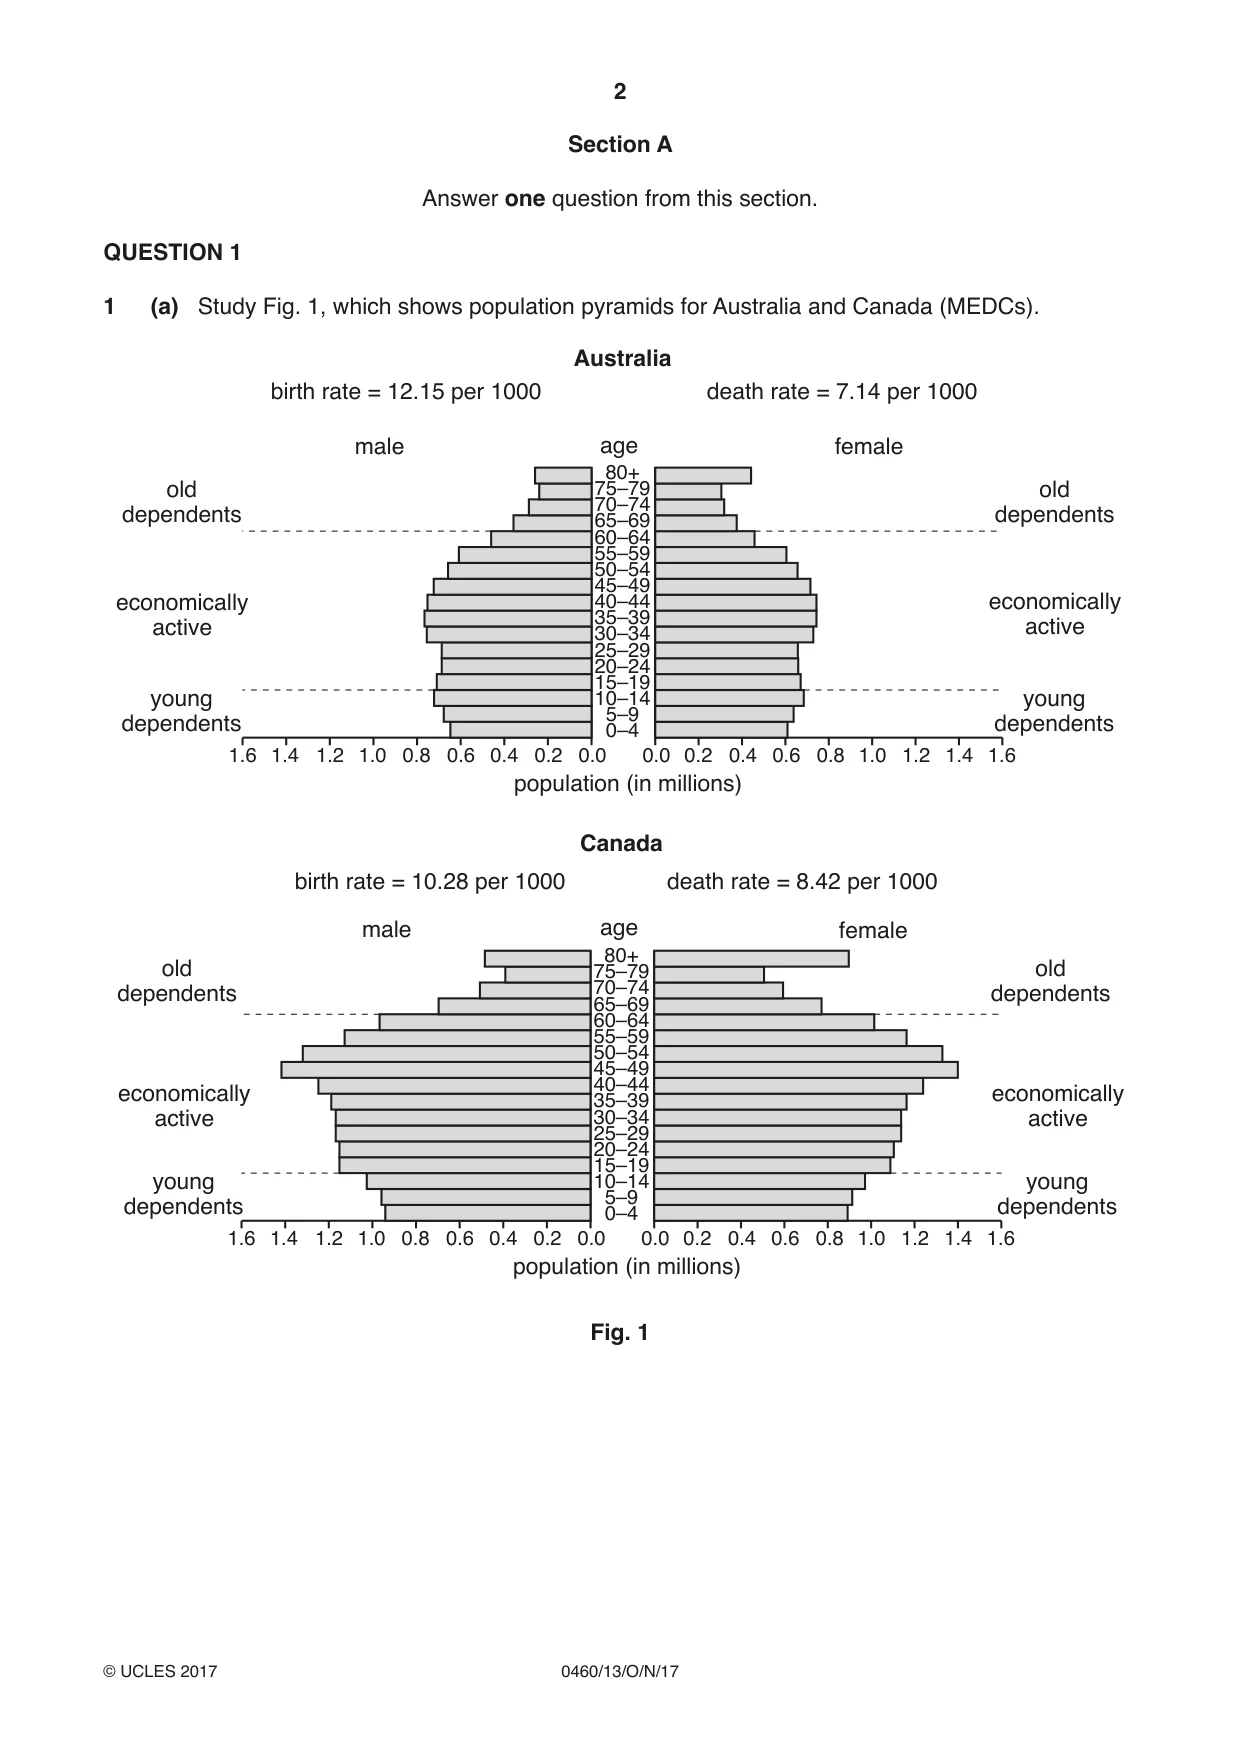
2 0460/13/O/N/17 © UCLES 2017 Section A Answer one question from this section. QUESTION 1 1 (a) Study Fig. 1, which shows population pyramids for Australia and Canada (MEDCs). 80+ 75–79 70–74 65–69 60–64 55–59 50–54 45–49 40–44 35–39 30–34 25–29 20–24 15–19 10–14 5–9 0–4 Canada population (in millions) male young dependents old dependents economically active young dependents old dependents economically active female 1.6 1.2 1.4 0.6 0.6 0.8 0.8 1.0 1.2 1.4 1.6 1.0 0.4 0.4 0.2 0.2 0.0 0.0 80+ 75–79 70–74 65–69 60–64 55–59 50–54 45–49 40–44 35–39 30–34 25–29 20–24 15–19 10–14 5–9 0–4 Australia population (in millions) male birth rate = 12.15 per 1000 death rate = 7.14 per 1000 birth rate = 10.28 per 1000 death rate = 8.42 per 1000 young dependents old dependents economically active young dependents old dependents economically active female age age 1.6 1.2 1.4 0.6 0.6 0.8 0.8 1.0 1.2 1.4 1.6 1.0 0.4 0.4 0.2 0.2 0.0 0.0 Fig. 1
Question paper, page 3
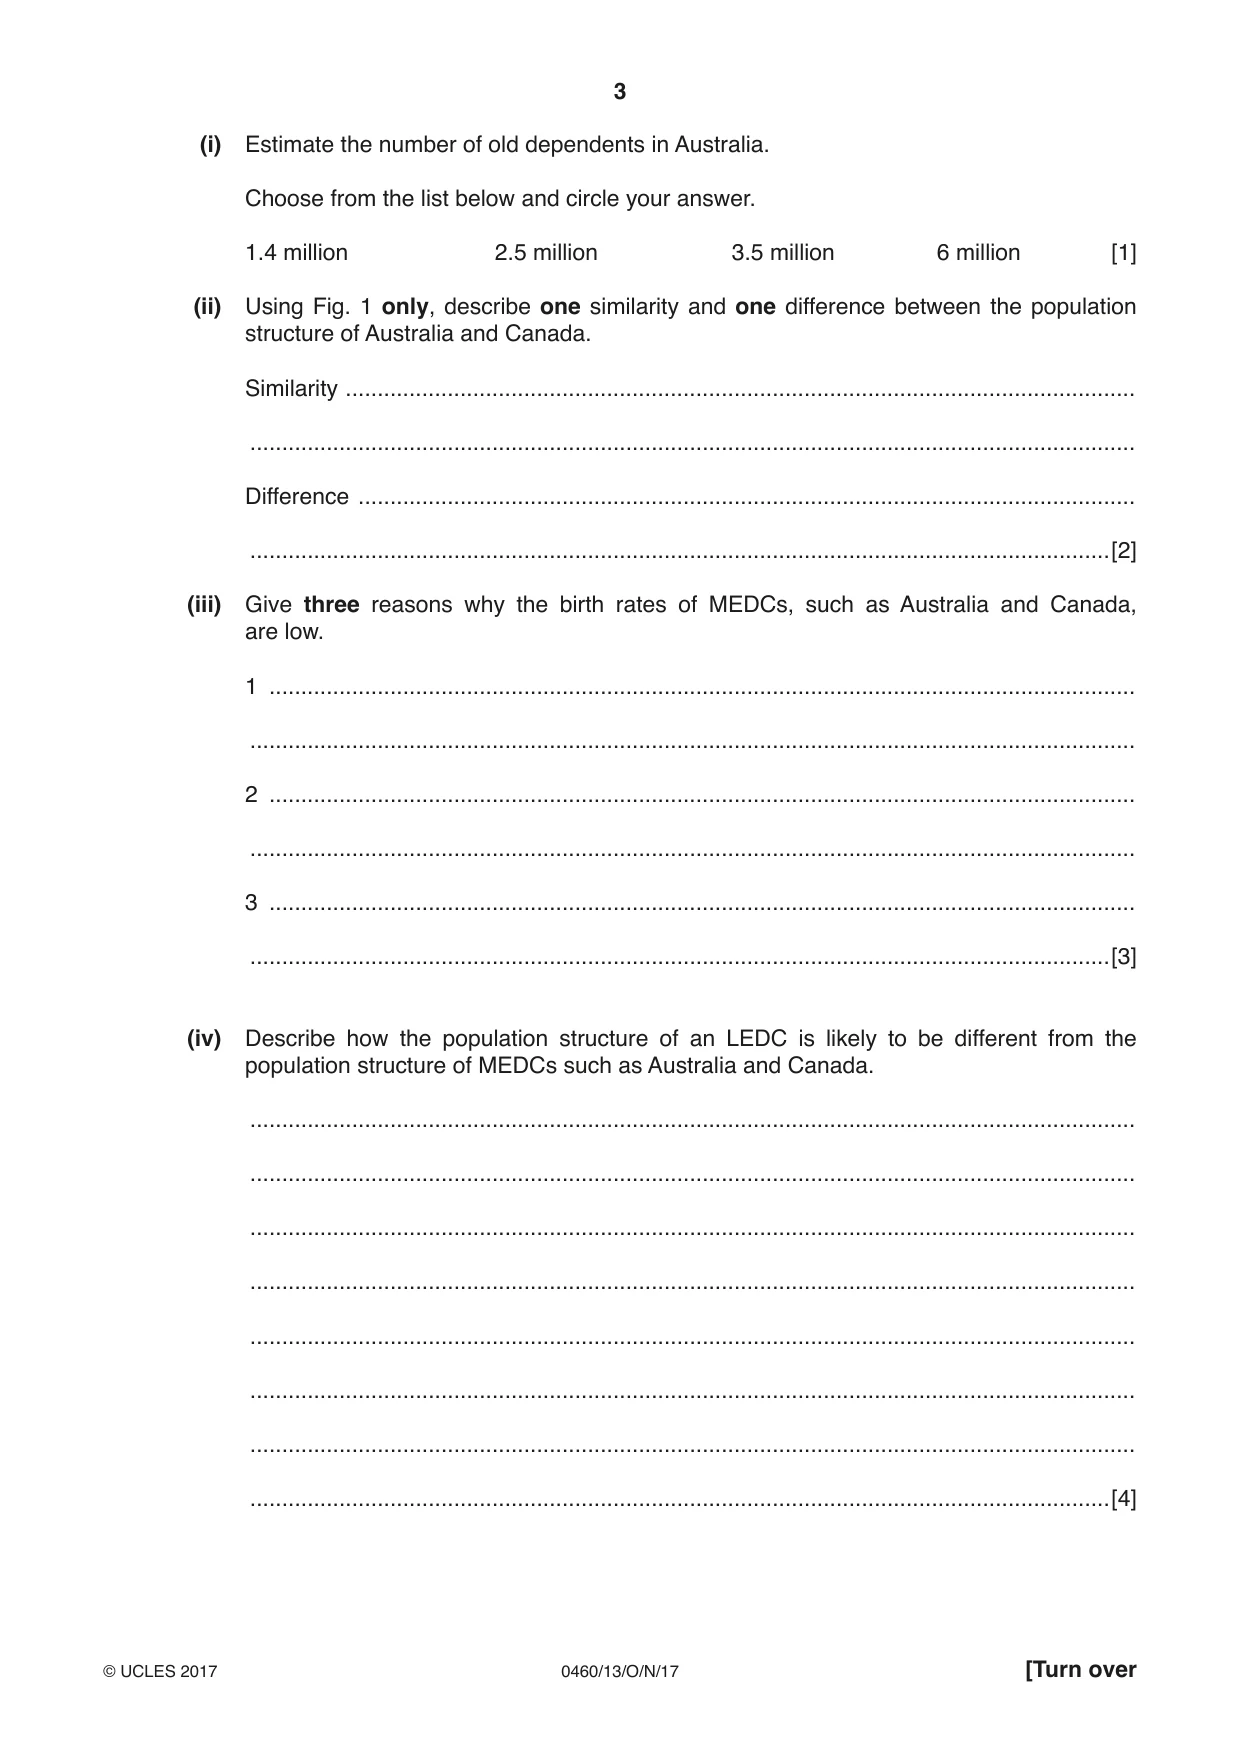
3 0460/13/O/N/17 © UCLES 2017 [Turn over (i) Estimate the number of old dependents in Australia. Choose from the list below and circle your answer. 1.4 million 2.5 million 3.5 million 6 million [1] (ii) Using Fig. 1 only, describe one similarity and one difference between the population structure of Australia and Canada. Similarity … … Difference … …[2] (iii) Give three reasons why the birth rates of MEDCs, such as Australia and Canada, are low. 1 … … 2 … … 3 … …[3] (iv) Describe how the population structure of an LEDC is likely to be different from the population structure of MEDCs such as Australia and Canada. … … … … … … … …[4]
Question paper, page 4
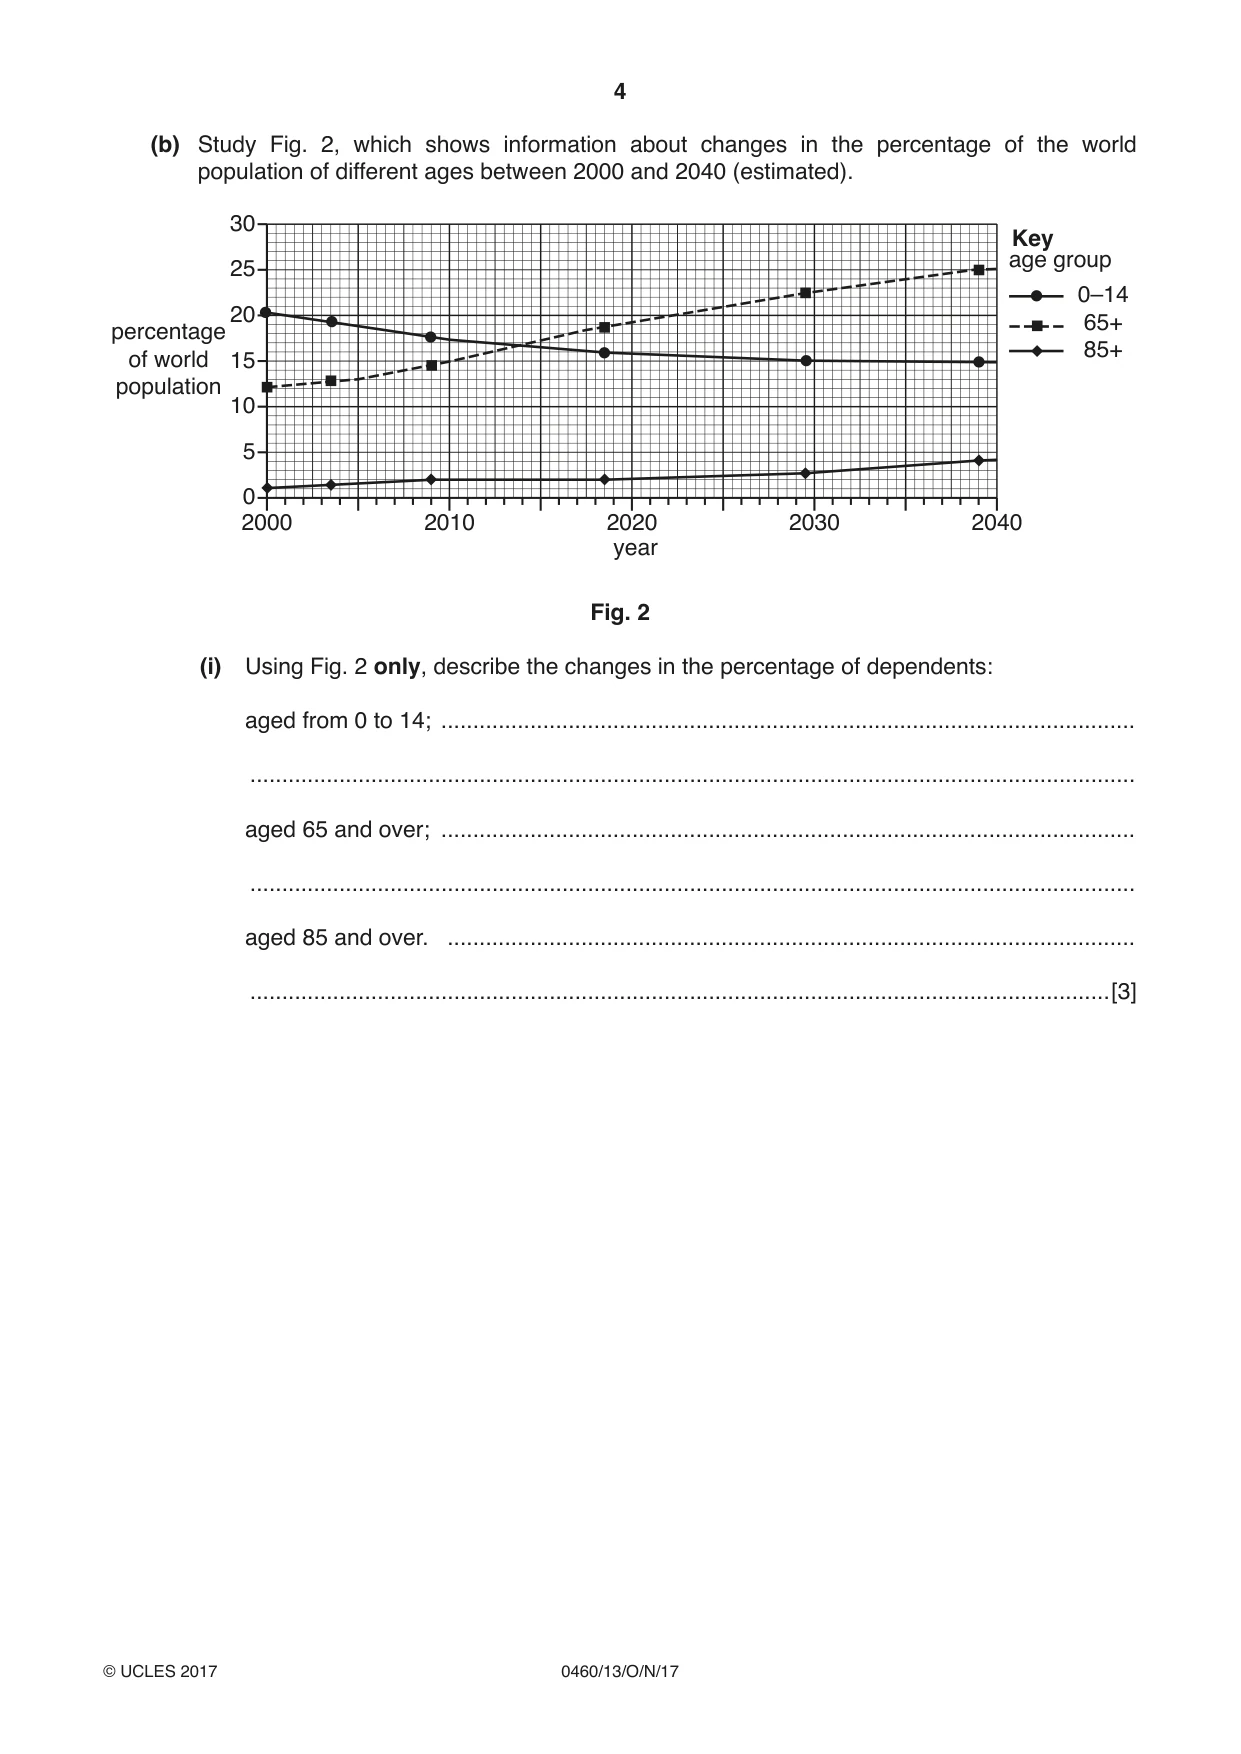
4 0460/13/O/N/17 © UCLES 2017 (b) Study Fig. 2, which shows information about changes in the percentage of the world population of different ages between 2000 and 2040 (estimated). 2000 2010 2020 2030 2040 0–14 65+ 85+ age group Key 0 5 10 15 20 percentage of world population year 25 30 Fig. 2 (i) Using Fig. 2 only, describe the changes in the percentage of dependents: aged from 0 to 14; … … aged 65 and over; … … aged 85 and over. … …[3]
Question paper, page 5
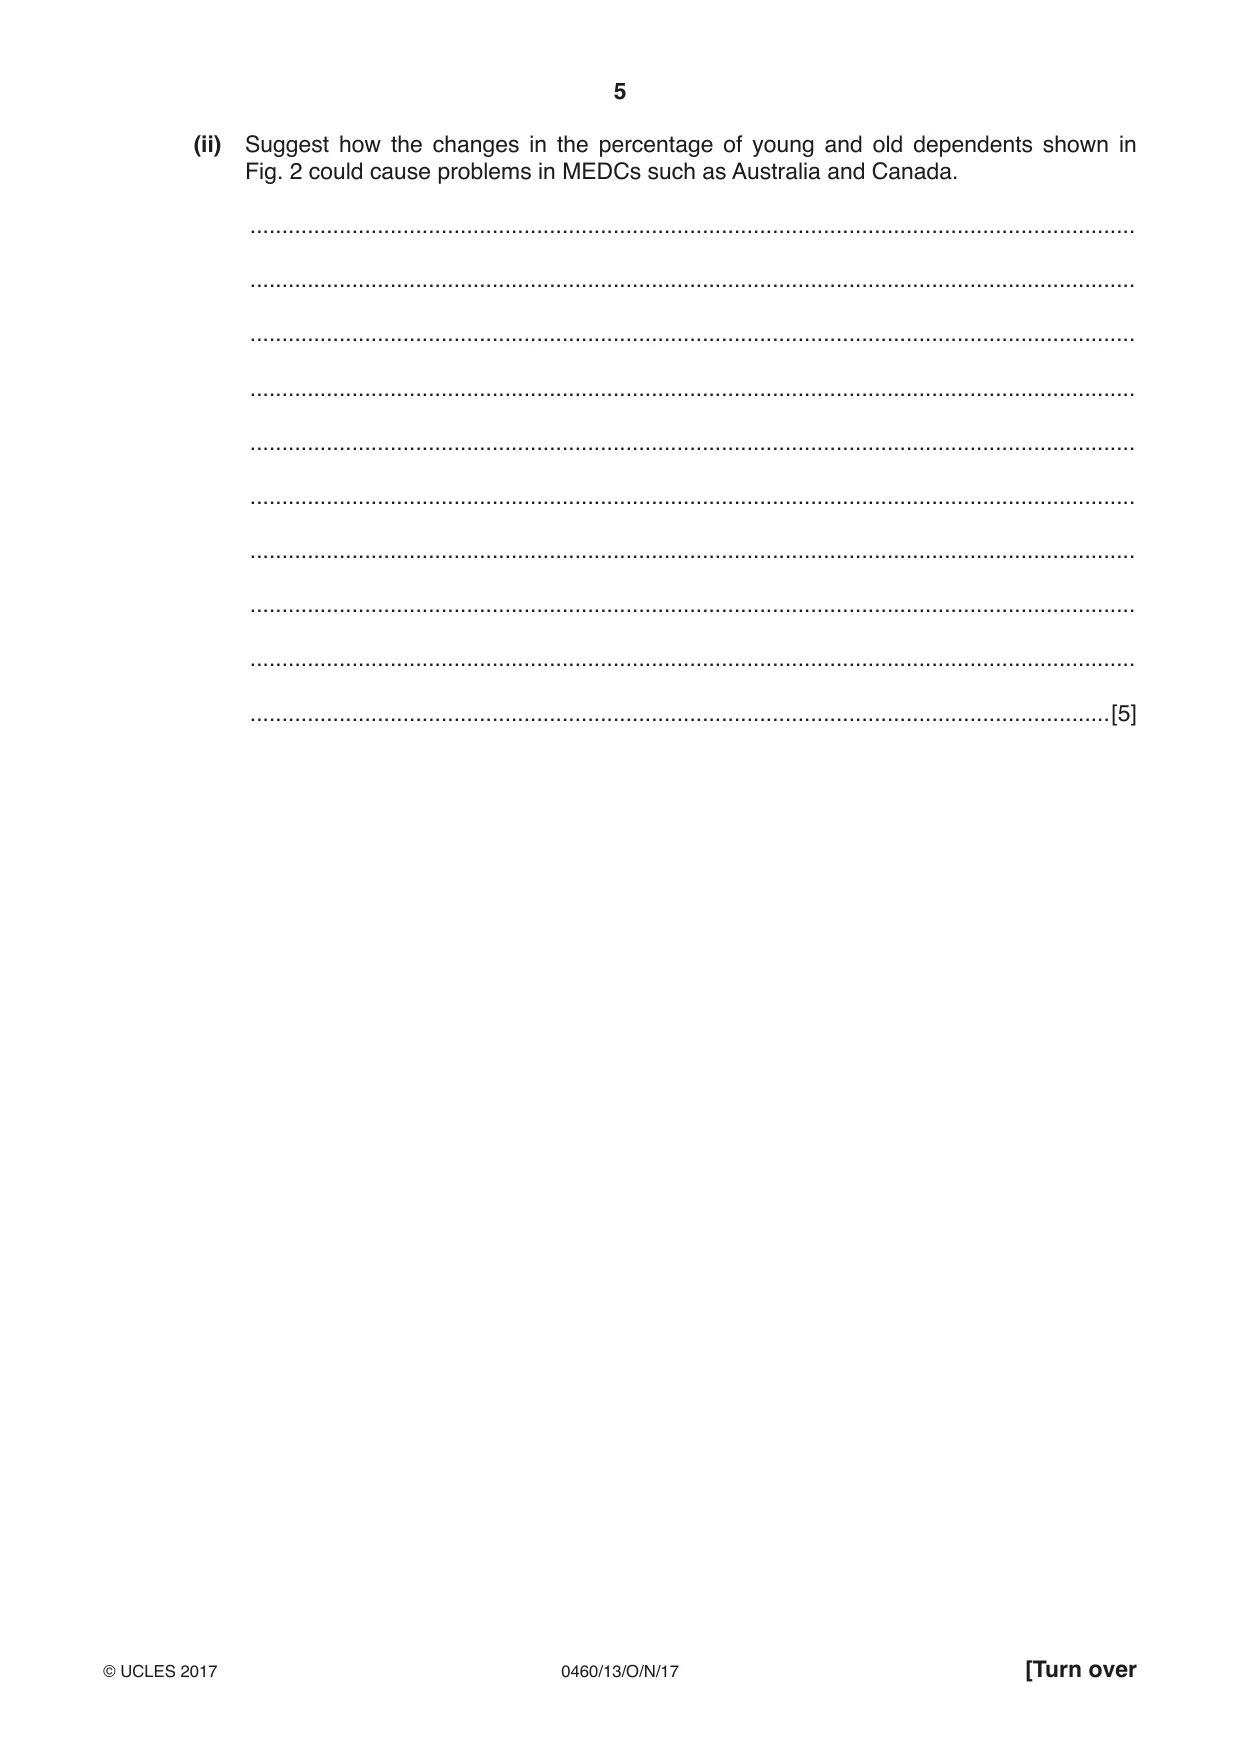
5 0460/13/O/N/17 © UCLES 2017 [Turn over (ii) Suggest how the changes in the percentage of young and old dependents shown in Fig. 2 could cause problems in MEDCs such as Australia and Canada. … … … … … … … … … …[5]
Question paper, page 6
6 0460/13/O/N/17 © UCLES 2017 (c) Describe the consequences of over-population for a named country you have studied. Name of country … … … … … … … … … … … … … … … … … … … … … … … … …[7] [Total: 25 marks] END OF QUESTION 1
Question paper, page 7
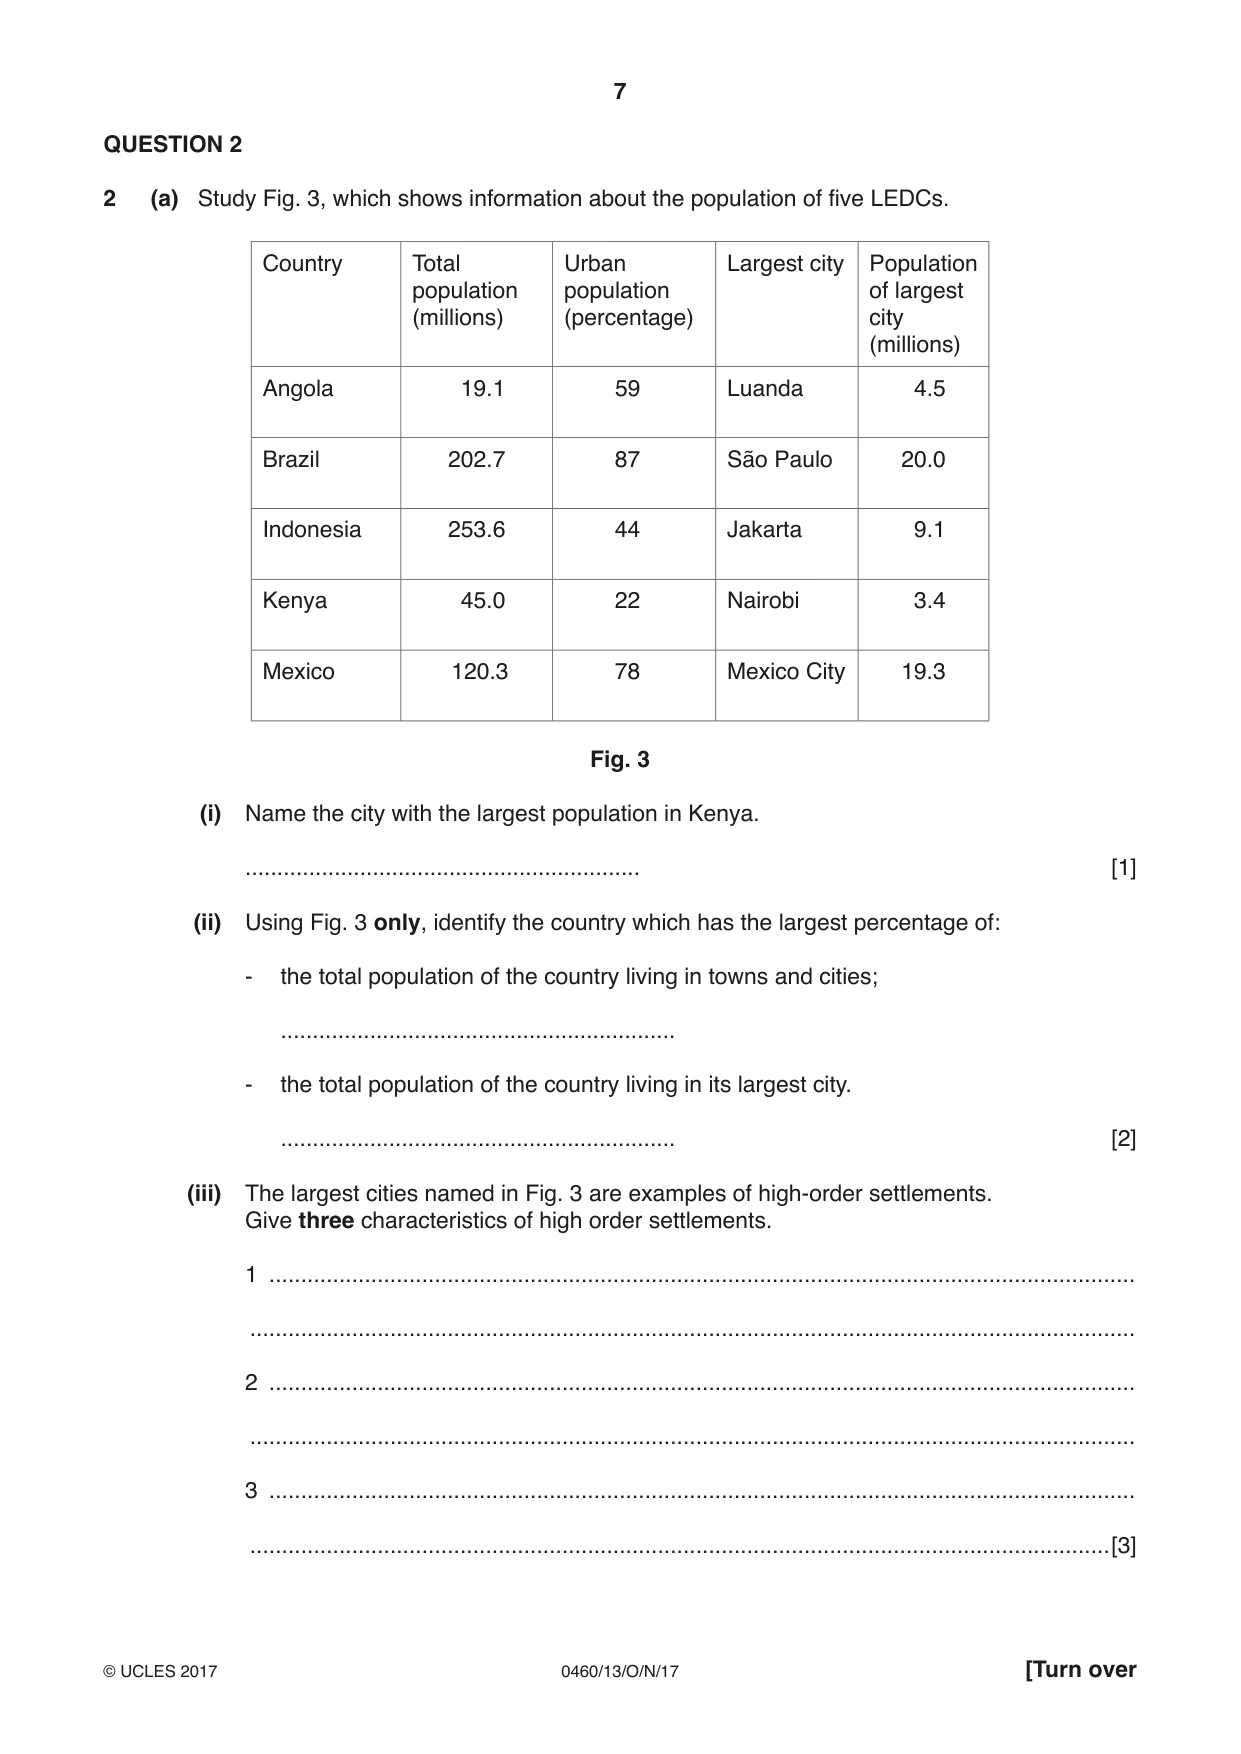
7 0460/13/O/N/17 © UCLES 2017 [Turn over QUESTION 2 2 (a) Study Fig. 3, which shows information about the population of five LEDCs. Country Total population (millions) Urban population (percentage) Largest city Population of largest city (millions) Angola 19.1 59 Luanda 4.5 Brazil 202.7 87 São Paulo 20.0 Indonesia 253.6 44 Jakarta 9.1 Kenya 45.0 22 Nairobi 3.4 Mexico 120.3 78 Mexico City 19.3 Fig. 3 (i) Name the city with the largest population in Kenya. … [1] (ii) Using Fig. 3 only, identify the country which has the largest percentage of: - the total population of the country living in towns and cities; … - the total population of the country living in its largest city. … [2] (iii) The largest cities named in Fig. 3 are examples of high-order settlements. Give three characteristics of high order settlements. 1 … … 2 … … 3 … …[3]
Question paper, page 8
8 0460/13/O/N/17 © UCLES 2017 (iv) Explain why many people migrate from rural areas to cities in LEDCs. … … … … … … … …[4]
Question paper, page 9
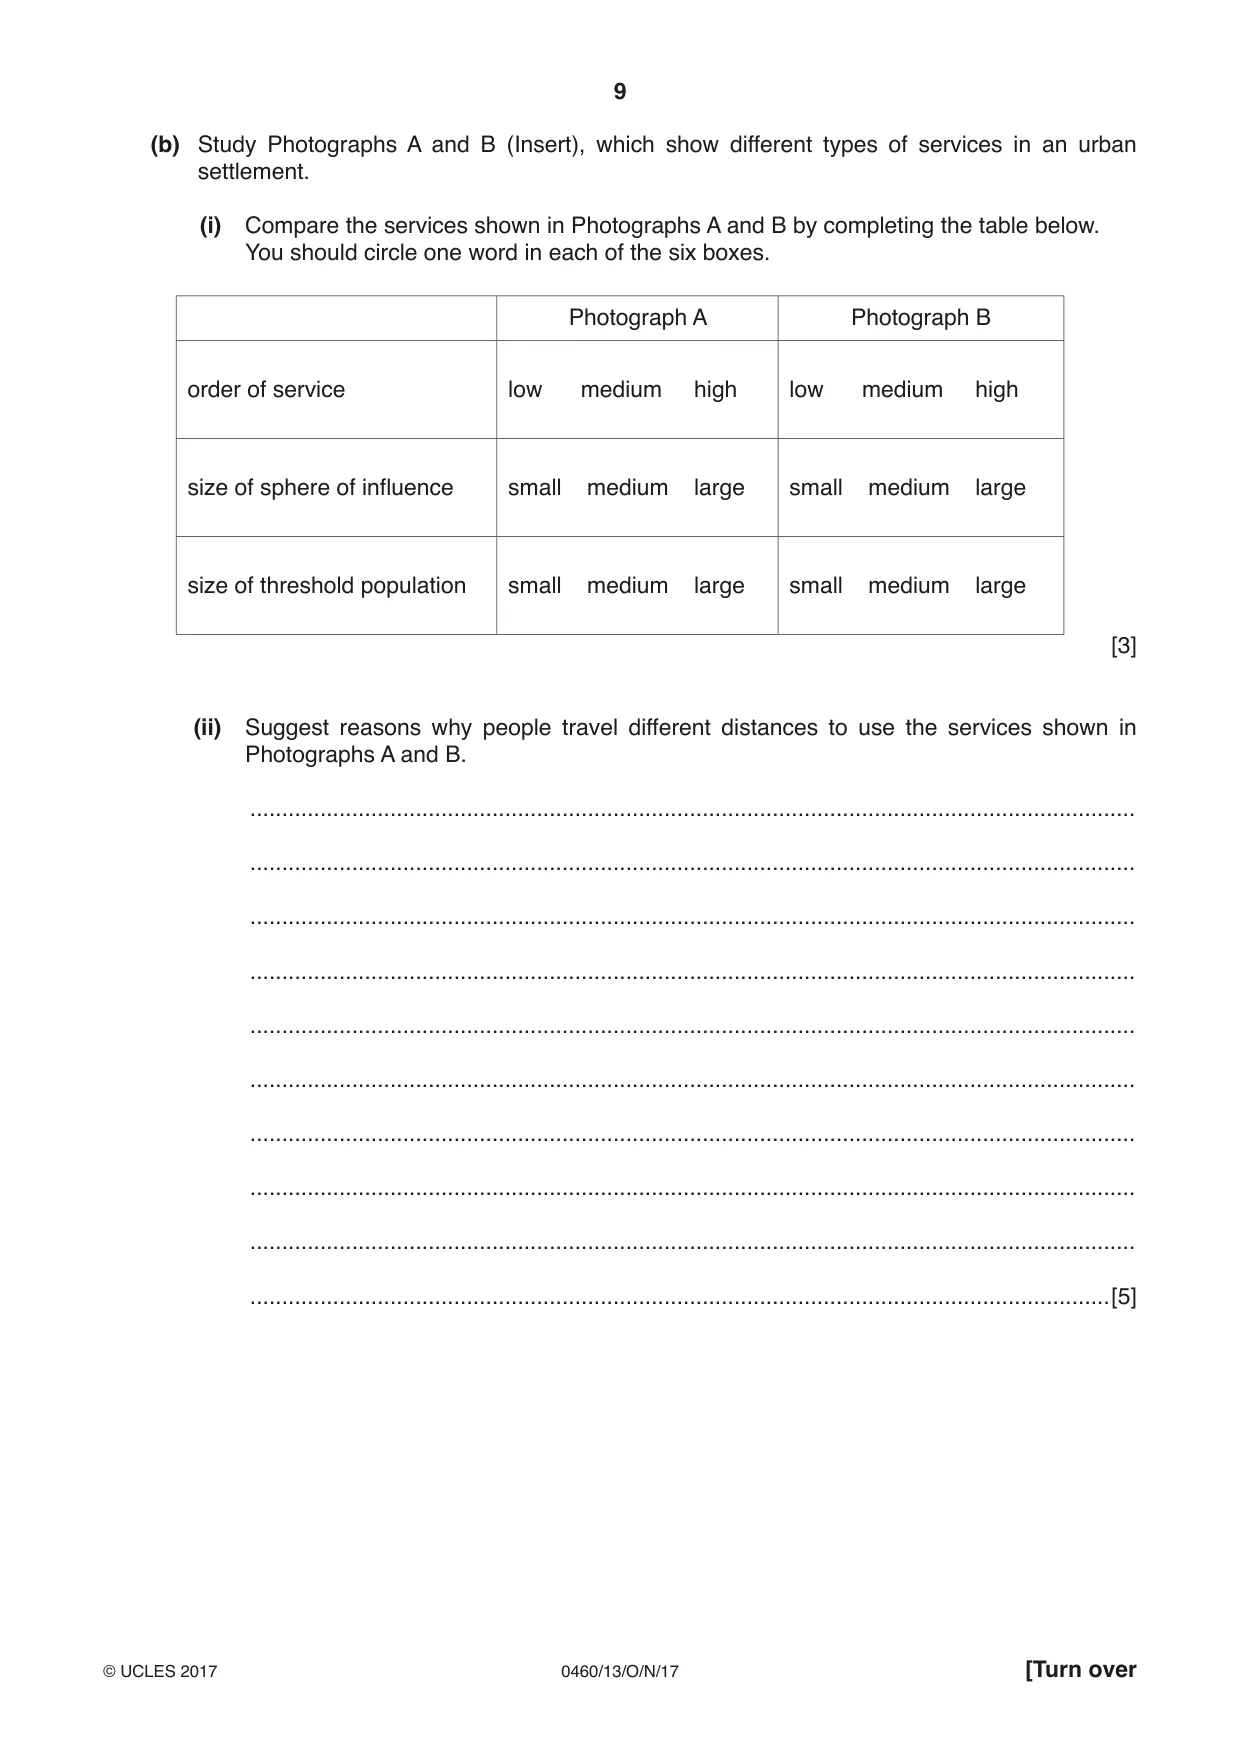
9 0460/13/O/N/17 © UCLES 2017 [Turn over (b) Study Photographs A and B (Insert), which show different types of services in an urban settlement. (i) Compare the services shown in Photographs A and B by completing the table below. You should circle one word in each of the six boxes. Photograph A Photograph B order of service low medium high low medium high size of sphere of influence small medium large small medium large size of threshold population small medium large small medium large [3] (ii) Suggest reasons why people travel different distances to use the services shown in Photographs A and B. … … … … … … … … … …[5]
Question paper, page 10
10 0460/13/O/N/17 © UCLES 2017 (c) For an area or country you have studied, describe the hierarchy of settlement and service provision. Name of area or country … … … … … … … … … … … … … … … … … … … … … … … … …[7] [Total: 25 marks] END OF QUESTION 2
Question paper, page 11
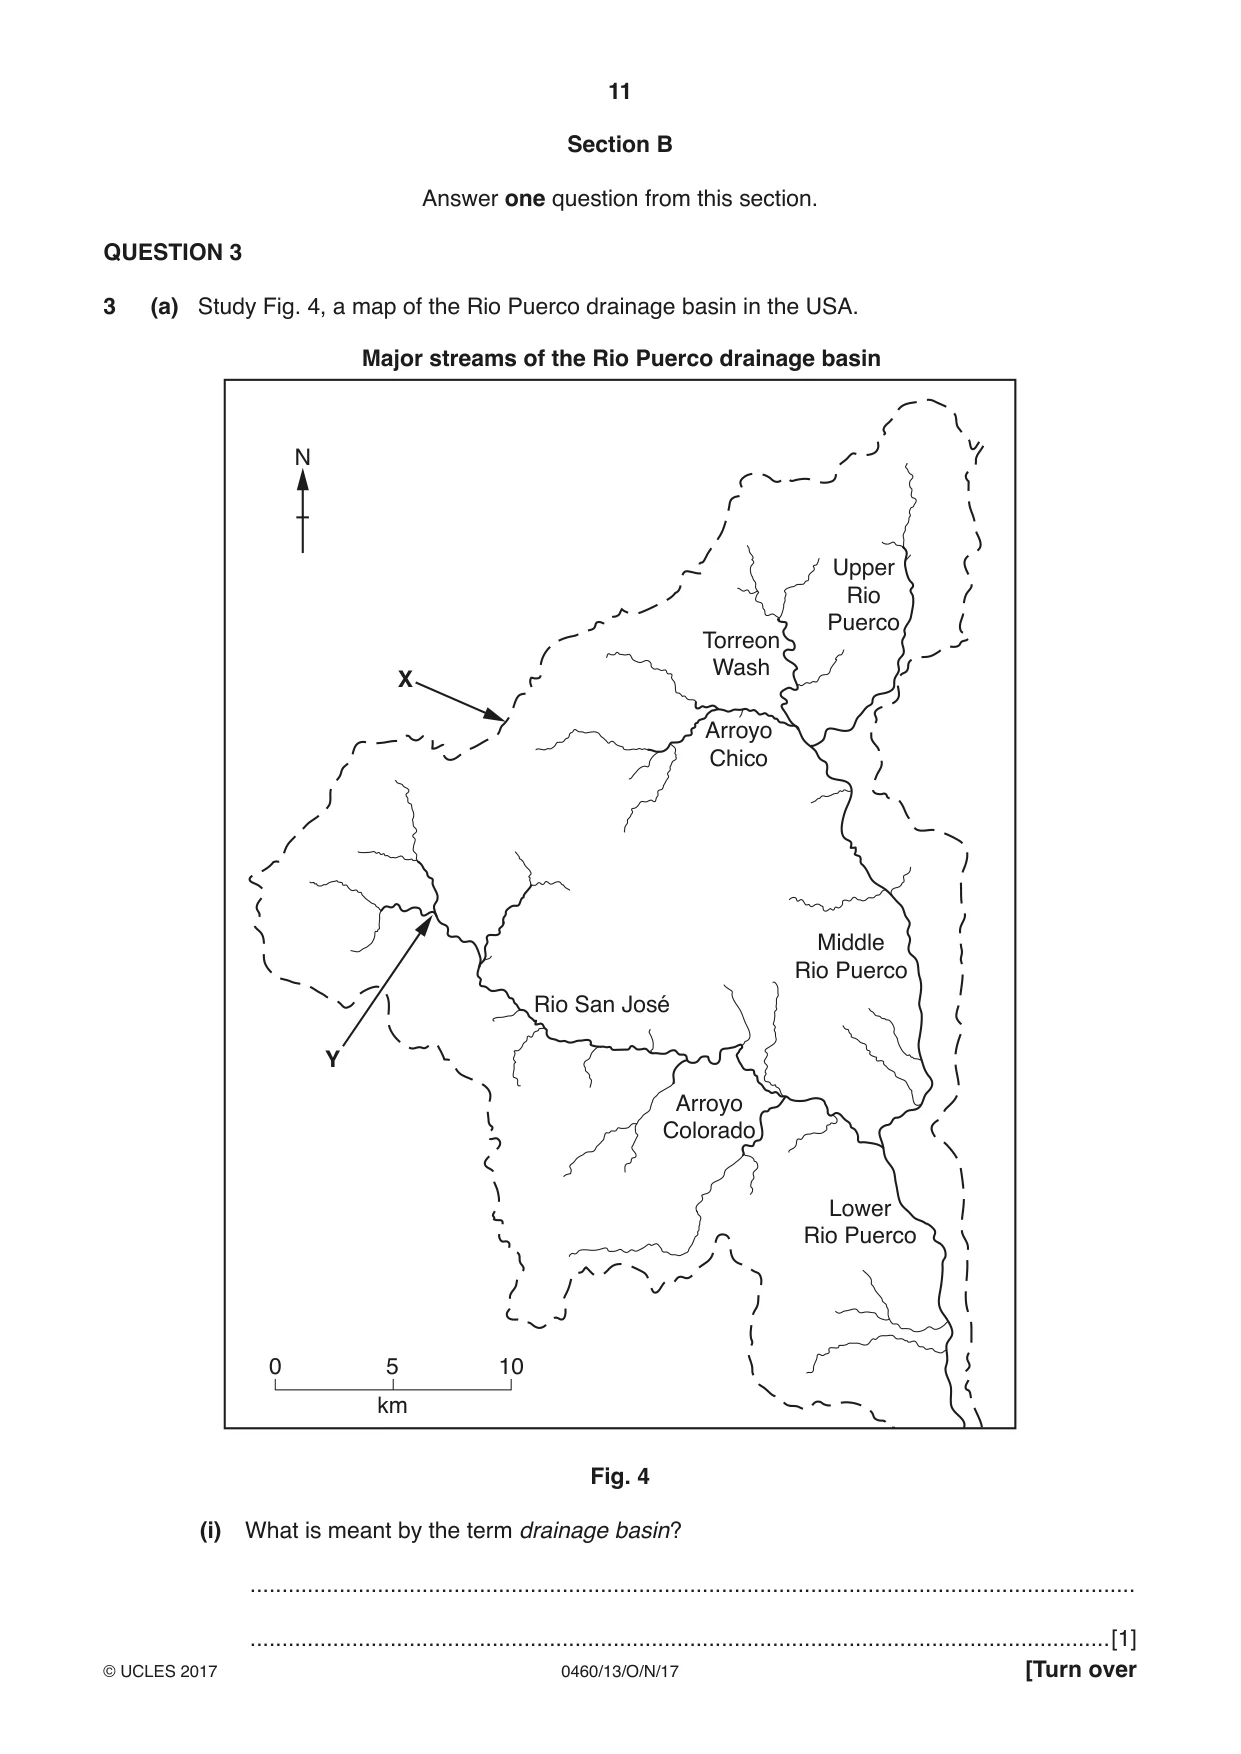
11 0460/13/O/N/17 © UCLES 2017 [Turn over Section B Answer one question from this section. QUESTION 3 3 (a) Study Fig. 4, a map of the Rio Puerco drainage basin in the USA. 0 10 5 km N Rio San José Arroyo Colorado Lower Rio Puerco Middle Rio Puerco Upper Rio Puerco Torreon Wash Arroyo Chico Major streams of the Rio Puerco drainage basin Y X Fig. 4 (i) What is meant by the term drainage basin? … …[1]
Question paper, page 12
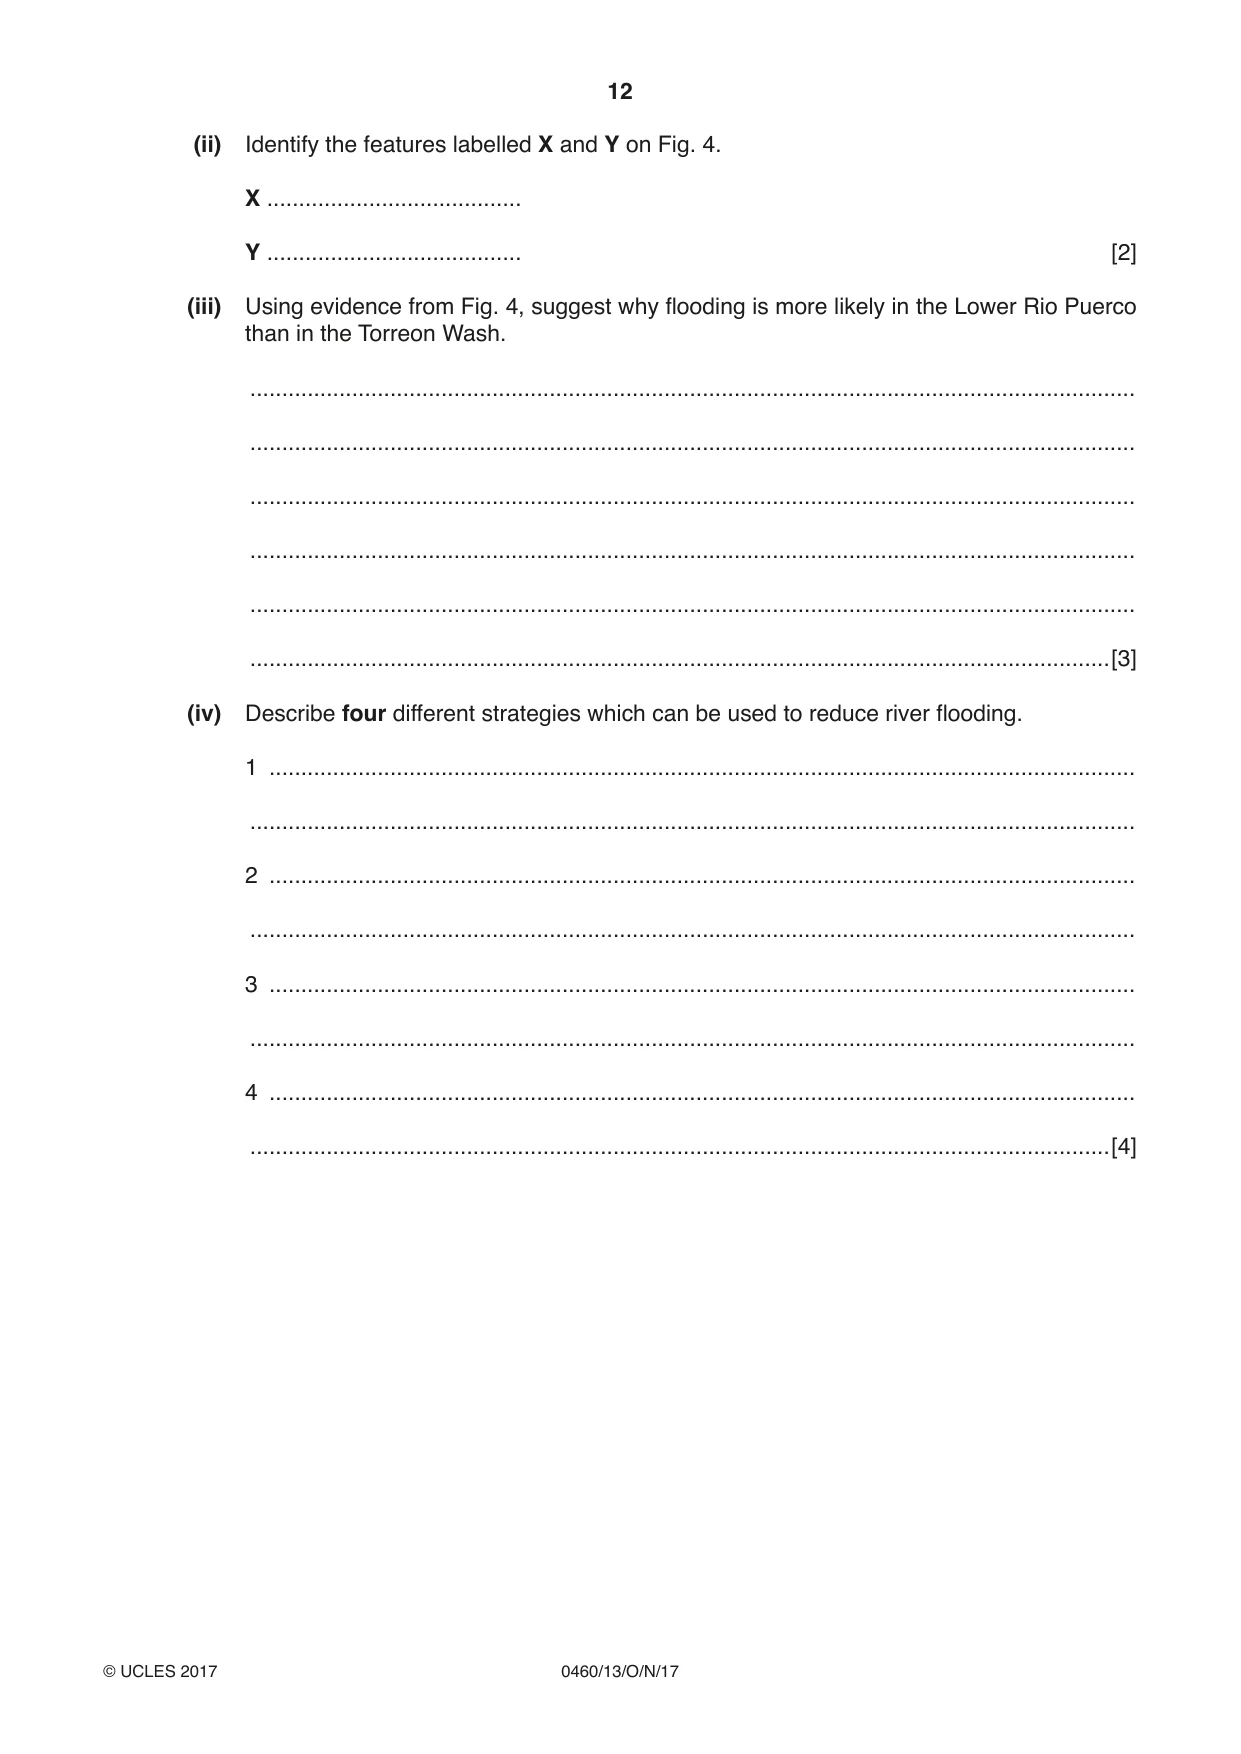
12 0460/13/O/N/17 © UCLES 2017 (ii) Identify the features labelled X and Y on Fig. 4. X … Y … [2] (iii) Using evidence from Fig. 4, suggest why flooding is more likely in the Lower Rio Puerco than in the Torreon Wash. … … … … … …[3] (iv) Describe four different strategies which can be used to reduce river flooding. 1 … … 2 … … 3 … … 4 … …[4]
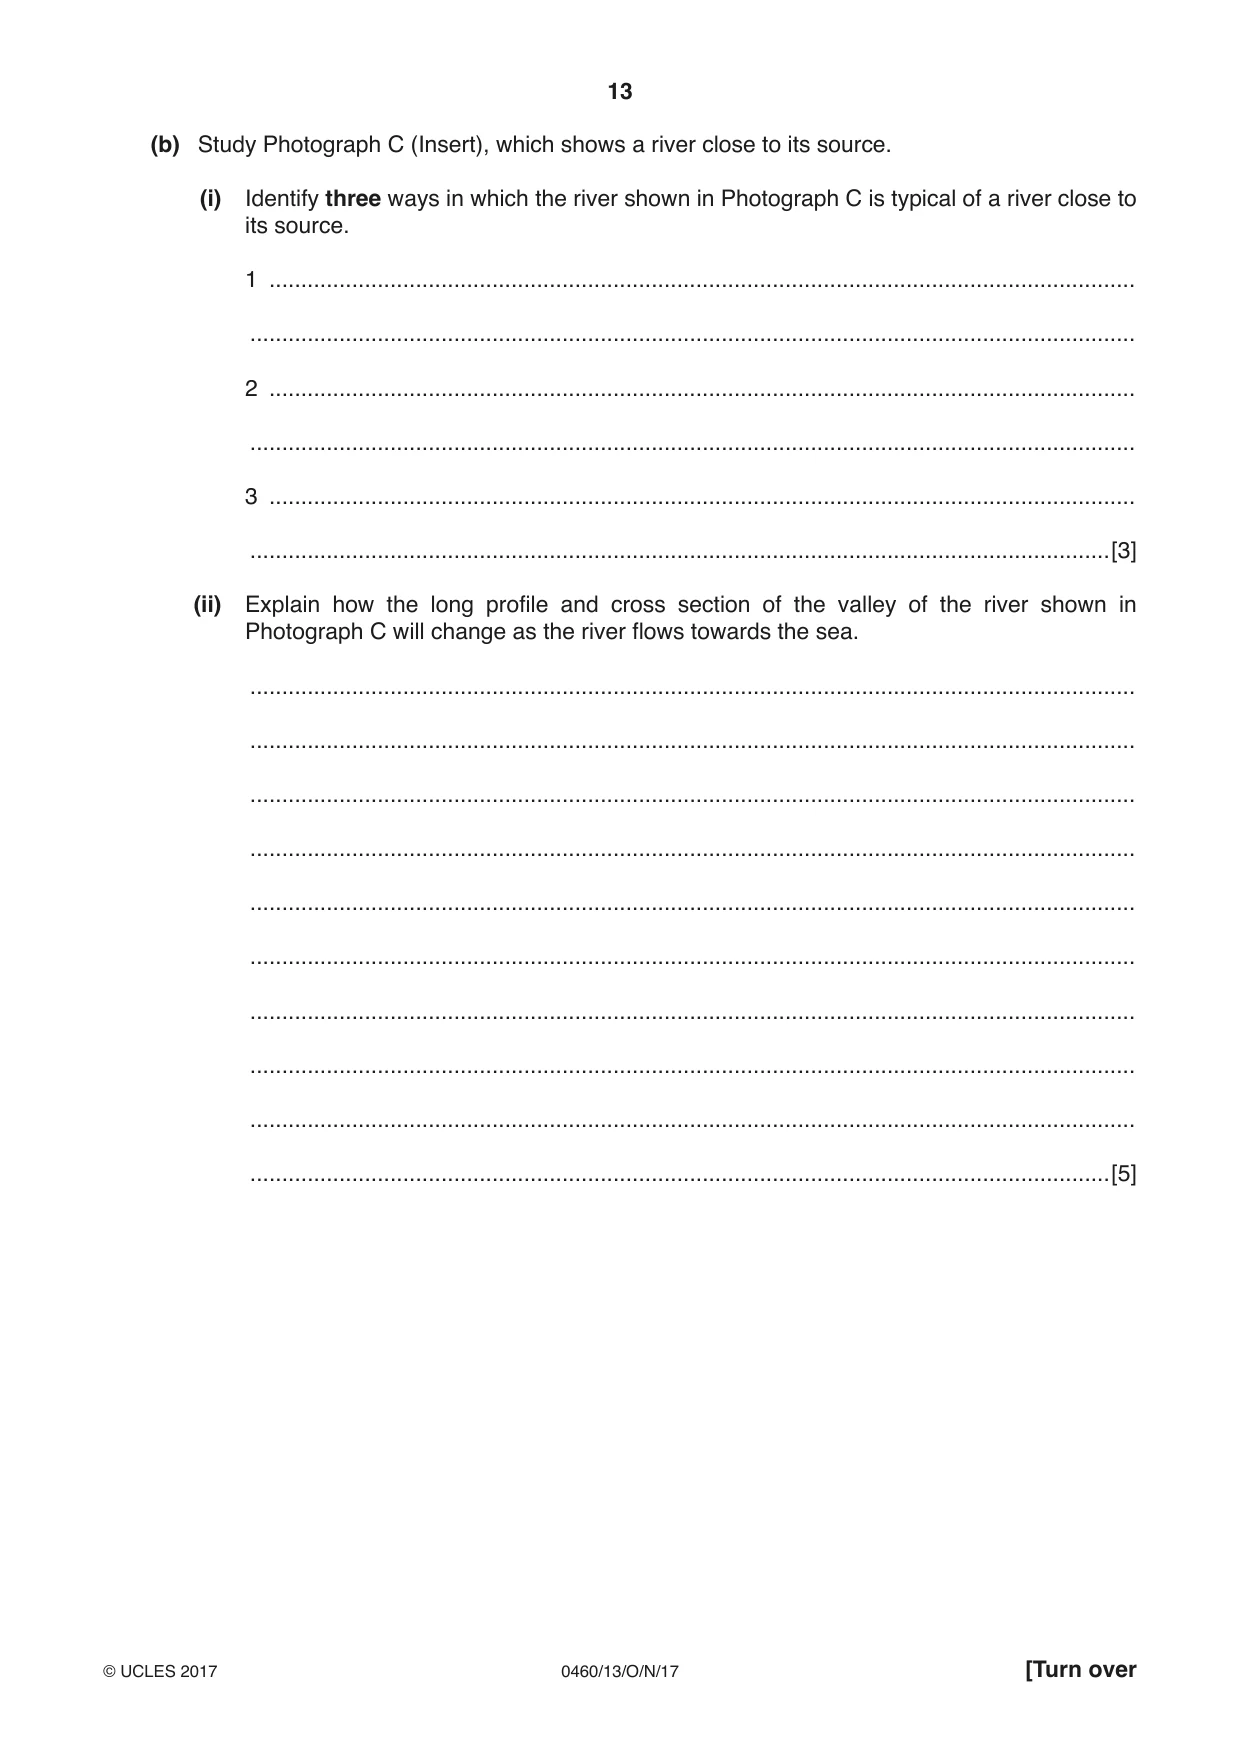
Question paper, page 13
13 0460/13/O/N/17 © UCLES 2017 [Turn over (b) Study Photograph C (Insert), which shows a river close to its source. (i) Identify three ways in which the river shown in Photograph C is typical of a river close to its source. 1 … … 2 … … 3 … …[3] (ii) Explain how the long profile and cross section of the valley of the river shown in Photograph C will change as the river flows towards the sea. … … … … … … … … … …[5]
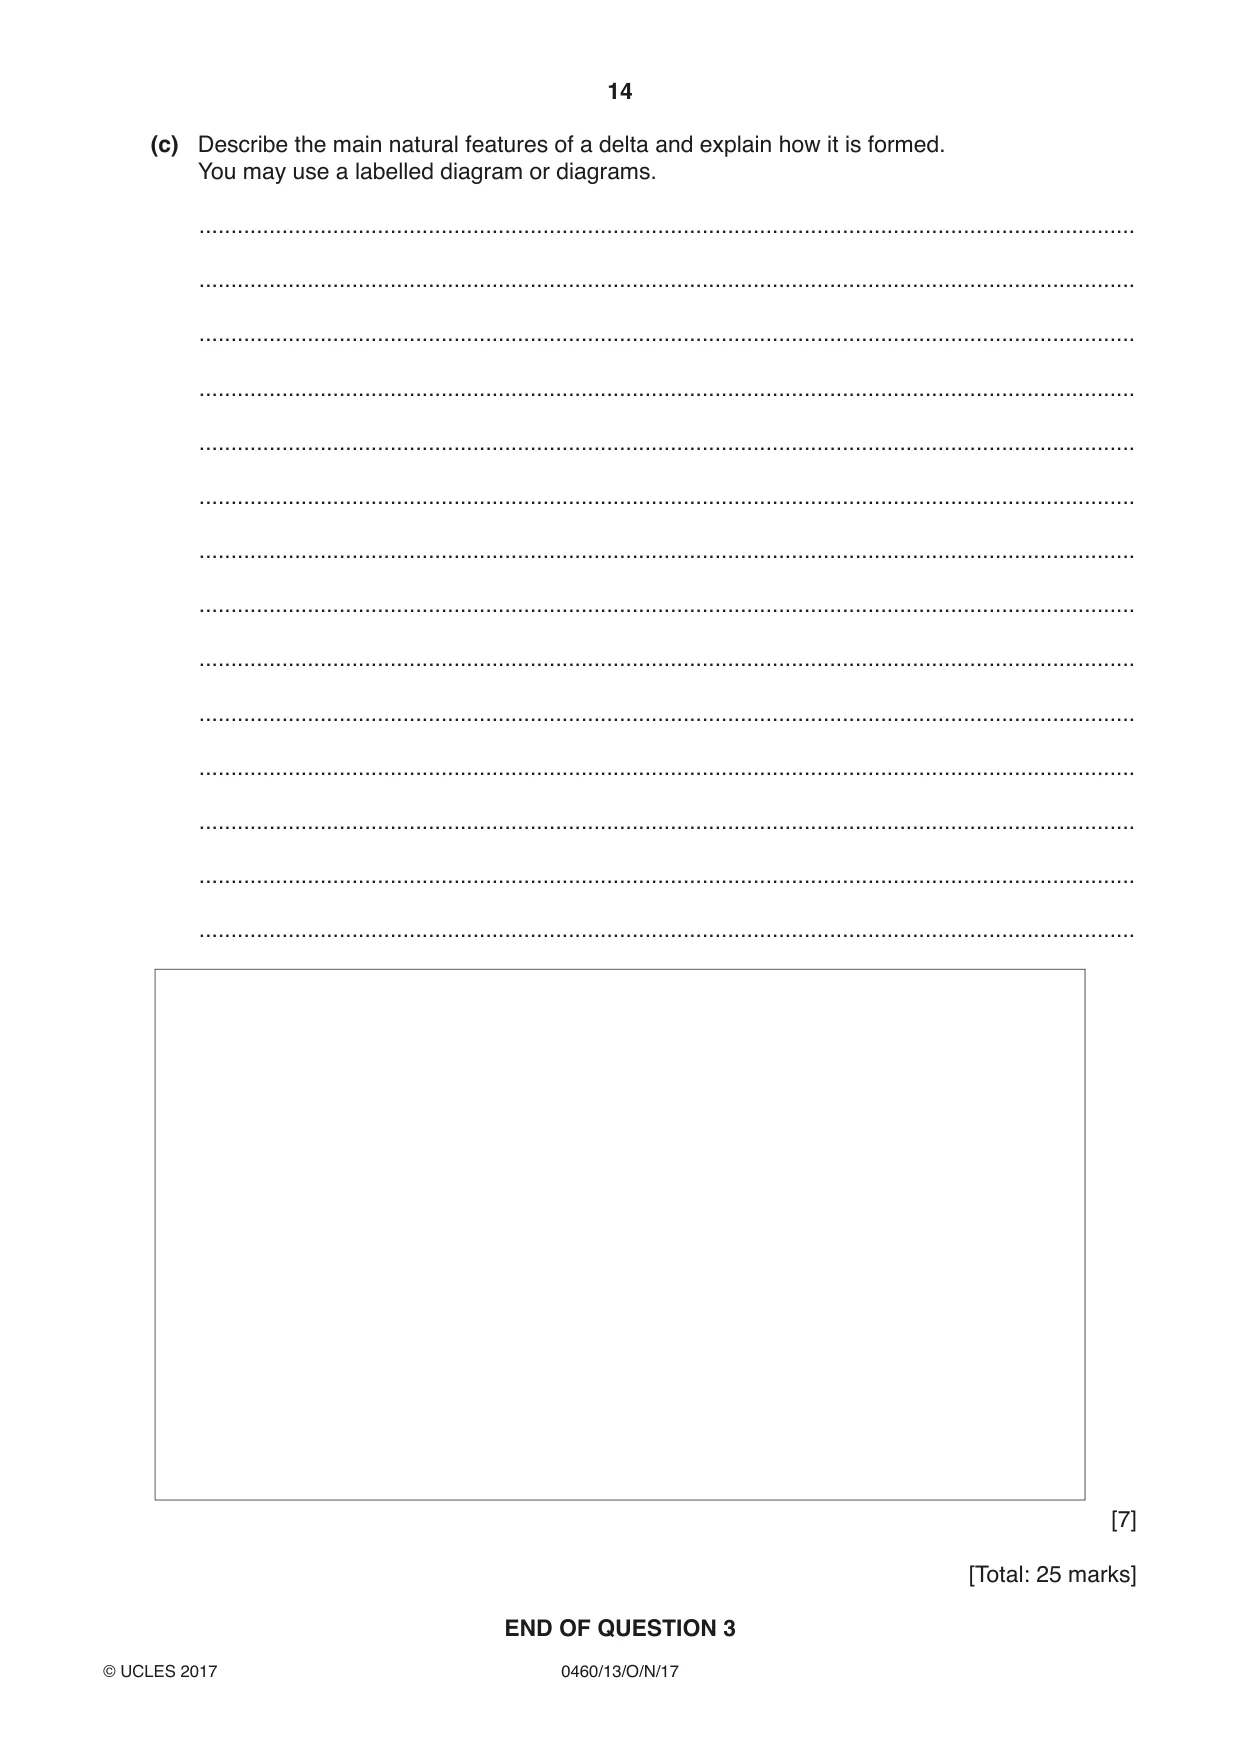
Question paper, page 14
14 0460/13/O/N/17 © UCLES 2017 (c) Describe the main natural features of a delta and explain how it is formed. You may use a labelled diagram or diagrams. … … … … … … … … … … … … … … [7] [Total: 25 marks] END OF QUESTION 3
Question paper, page 15
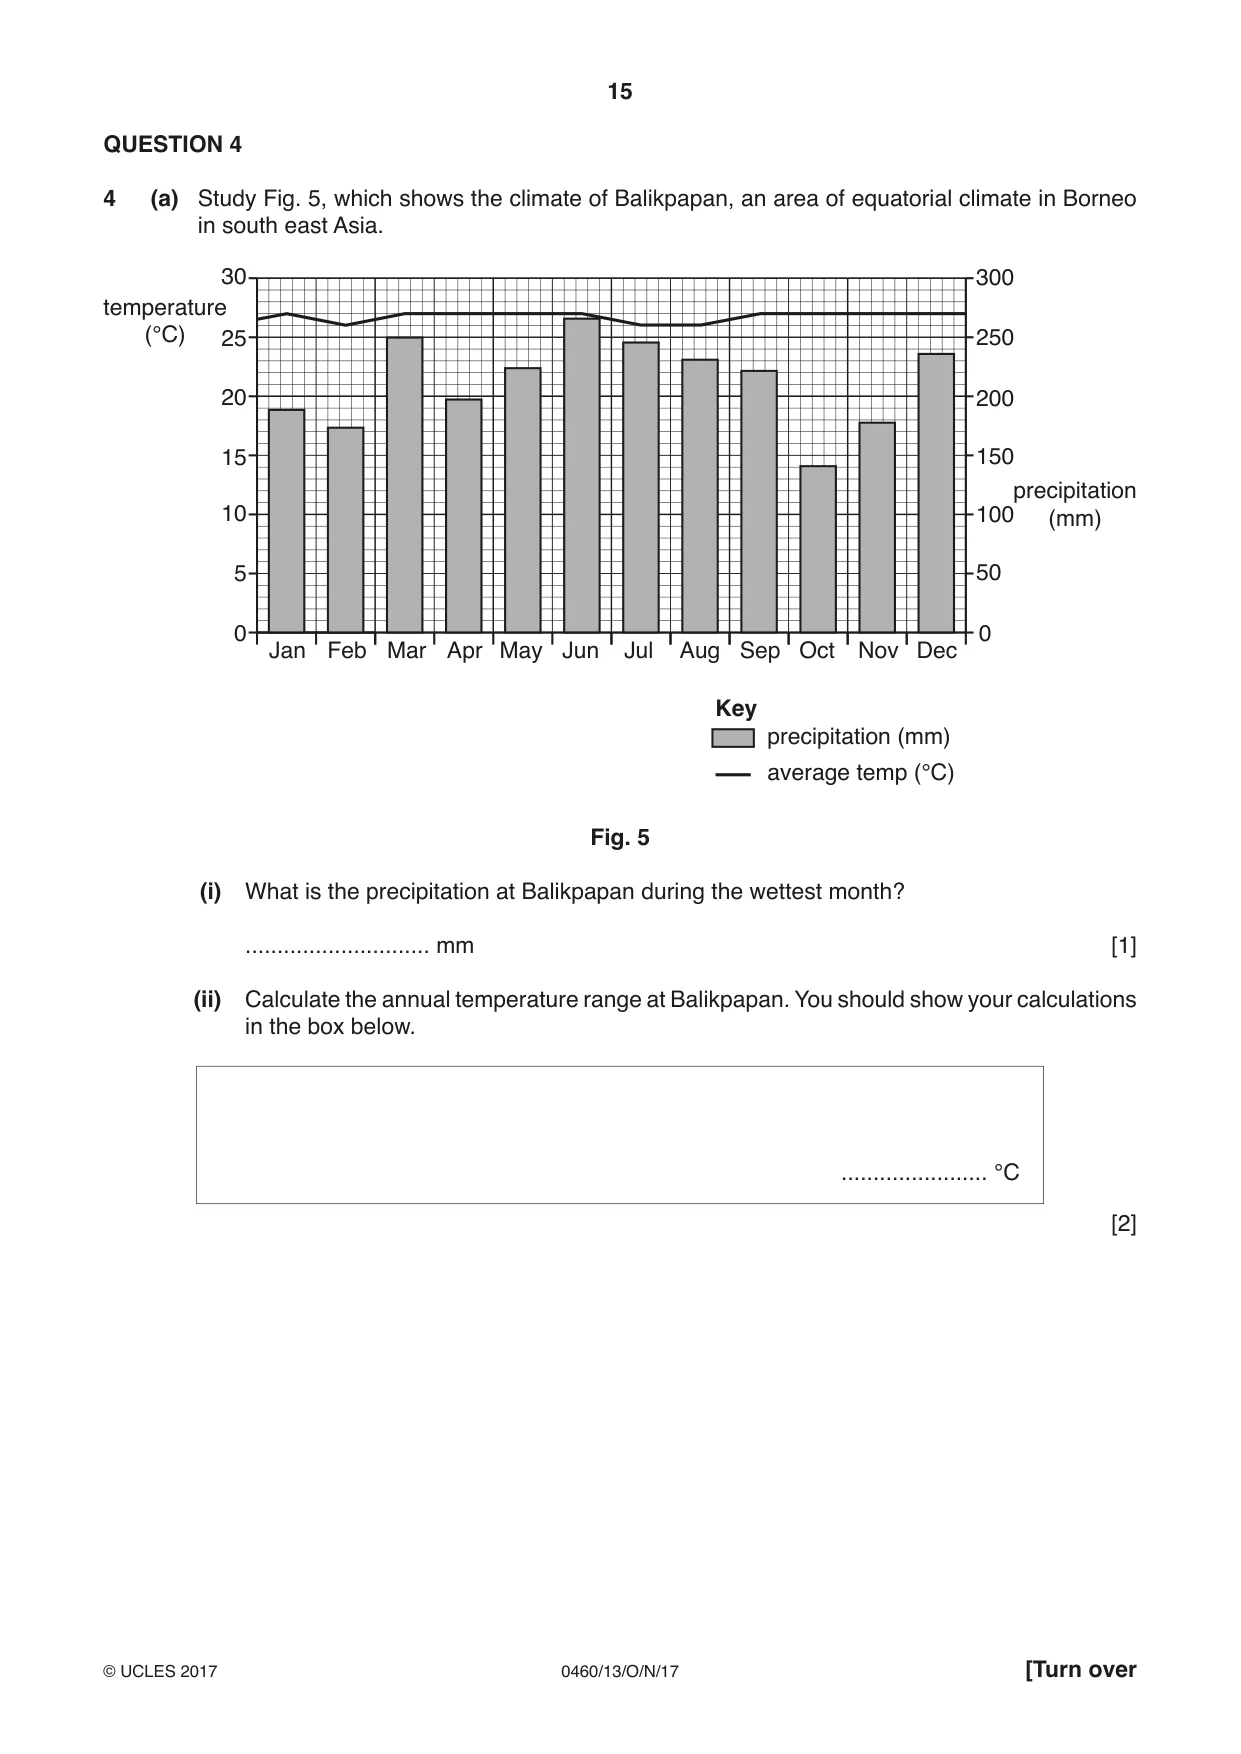
15 0460/13/O/N/17 © UCLES 2017 [Turn over QUESTION 4 4 (a) Study Fig. 5, which shows the climate of Balikpapan, an area of equatorial climate in Borneo in south east Asia. Jan Feb Mar Apr May Jun Jul Aug Sep Oct Nov Dec 0 0 5 10 15 20 25 30 50 100 150 precipitation (mm) temperature (°C) precipitation (mm) average temp (°C) Key 200 250 300 Fig. 5 (i) What is the precipitation at Balikpapan during the wettest month? … mm [1] (ii) Calculate the annual temperature range at Balikpapan. You should show your calculations in the box below. … °C [2]
Question paper, page 16
16 0460/13/O/N/17 © UCLES 2017 (iii) Explain why equatorial climates have a low temperature range. … … … … … …[3] (iv) Explain why equatorial climates have large amounts of rainfall. … … … … … … … …[4]
Question paper, page 17
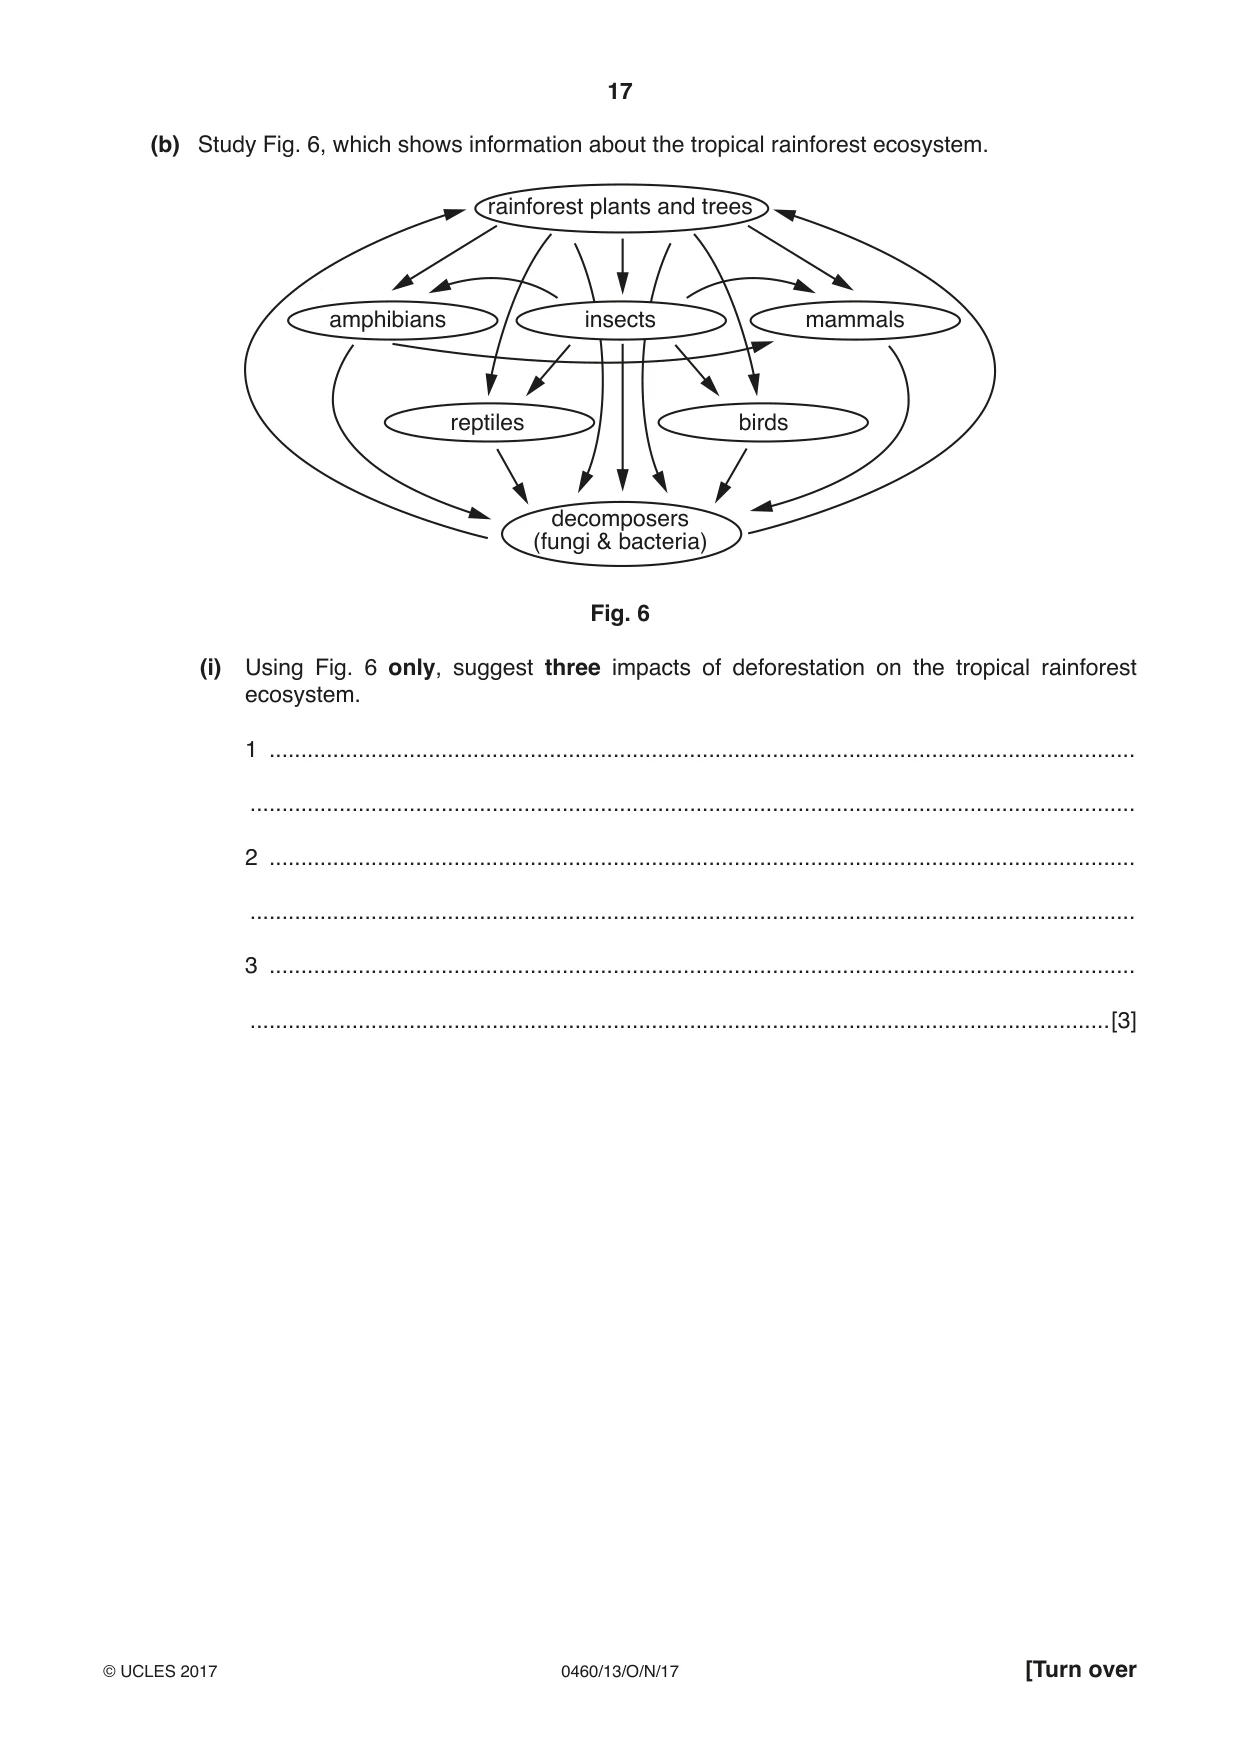
17 0460/13/O/N/17 © UCLES 2017 [Turn over (b) Study Fig. 6, which shows information about the tropical rainforest ecosystem. rainforest plants and trees reptiles birds amphibians mammals decomposers (fungi & bacteria) insects Fig. 6 (i) Using Fig. 6 only, suggest three impacts of deforestation on the tropical rainforest ecosystem. 1 … … 2 … … 3 … …[3]
Question paper, page 18
18 0460/13/O/N/17 © UCLES 2017 (ii) Explain why large amounts of deforestation are taking place in the tropical rainforest. … … … … … … … … … …[5]
Question paper, page 19
19 0460/13/O/N/17 © UCLES 2017 [Turn over (c) For a named area of hot desert you have studied, describe and explain the characteristics of the ecosystem. Name of desert … … … … … … … … … … … … … … … … … … … … … … … …[7] [Total: 25 marks] END OF QUESTION 4
Question paper, page 20
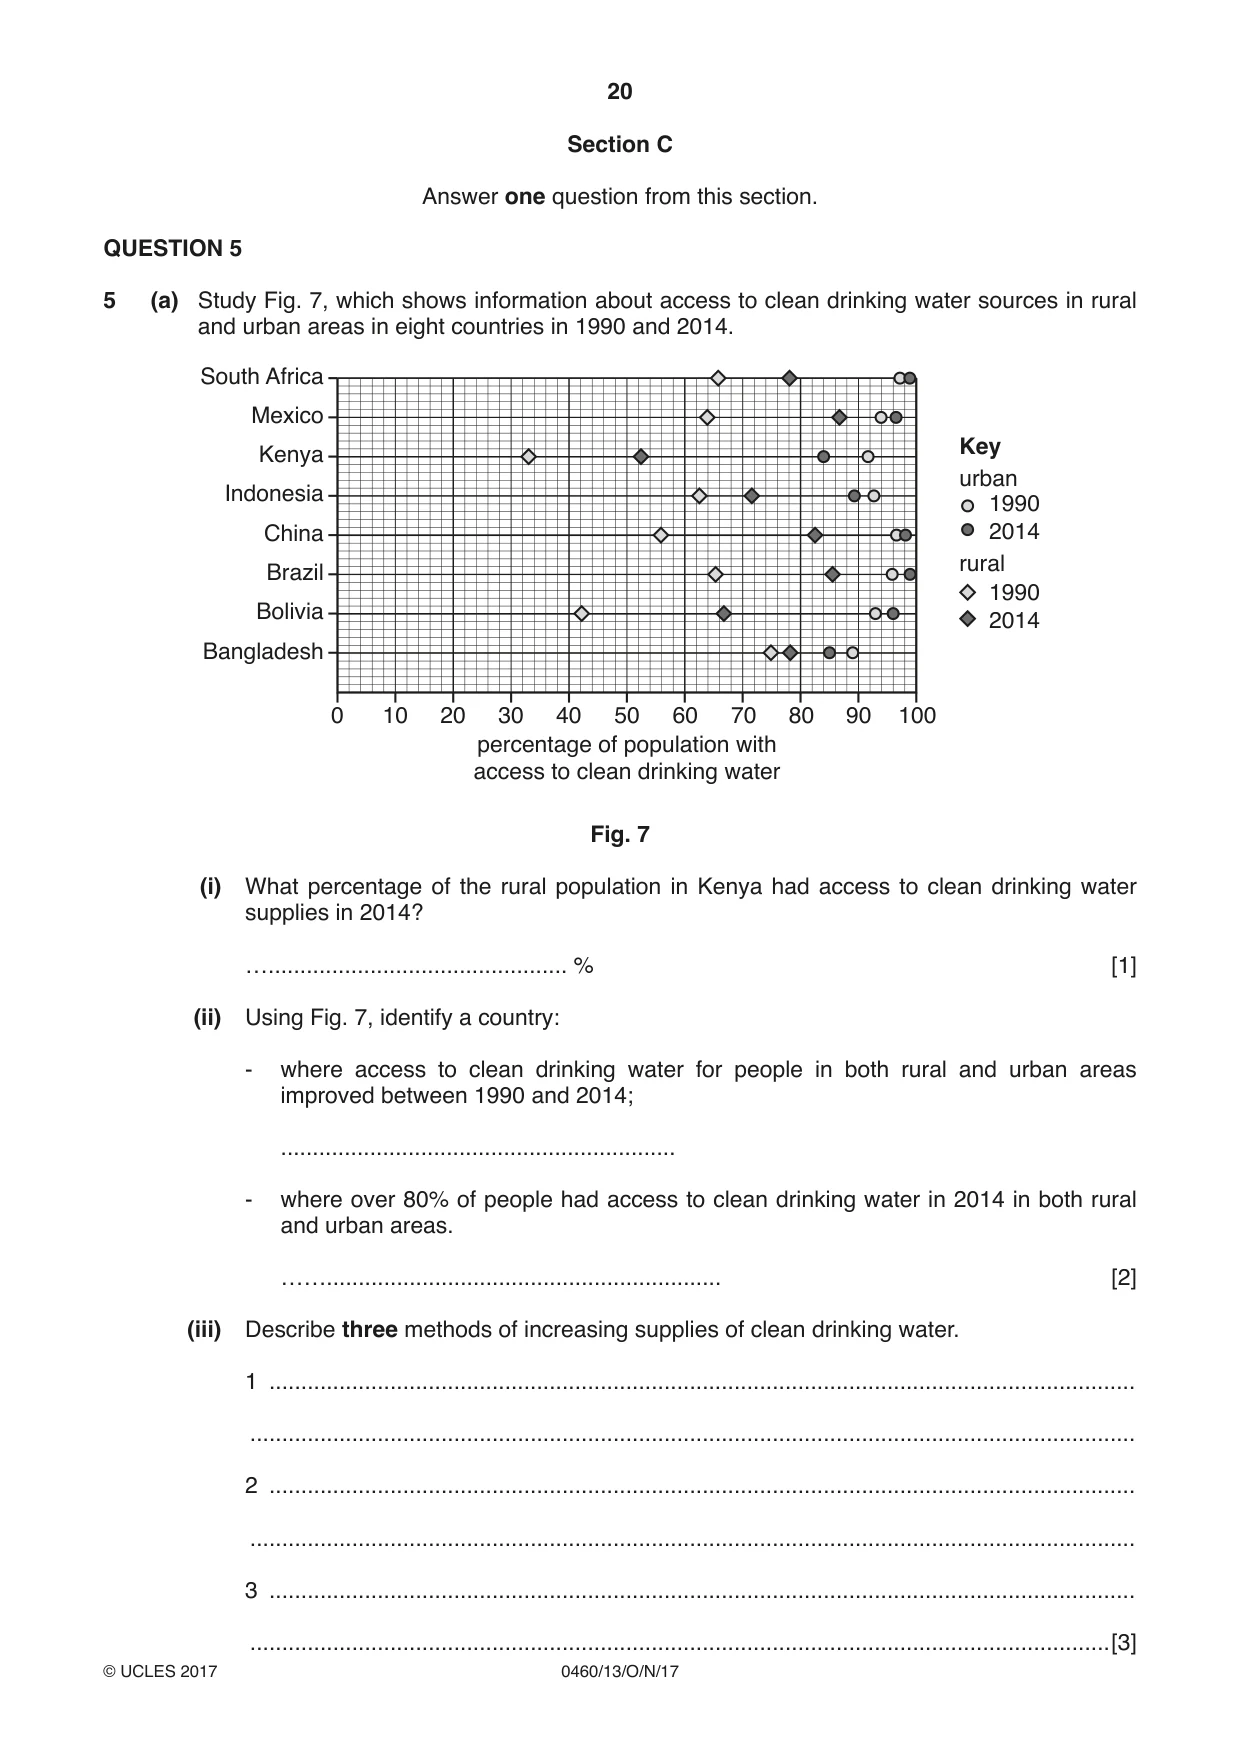
20 0460/13/O/N/17 © UCLES 2017 Section C Answer one question from this section. QUESTION 5 5 (a) Study Fig. 7, which shows information about access to clean drinking water sources in rural and urban areas in eight countries in 1990 and 2014. 0 10 20 30 40 50 percentage of population with access to clean drinking water 60 70 80 90 100 1990 2014 urban Key rural 1990 2014 Bangladesh Bolivia Brazil China Indonesia Kenya Mexico South Africa Fig. 7 (i) What percentage of the rural population in Kenya had access to clean drinking water supplies in 2014? …… % [1] (ii) Using Fig. 7, identify a country: - where access to clean drinking water for people in both rural and urban areas improved between 1990 and 2014; … - where over 80% of people had access to clean drinking water in 2014 in both rural and urban areas. ……… [2] (iii) Describe three methods of increasing supplies of clean drinking water. 1 … … 2 … … 3 … …[3]
Question paper, page 21
21 0460/13/O/N/17 © UCLES 2017 [Turn over (iv) Explain why it is important to increase clean drinking water supplies in LEDCs. … … … … … … … …[4]
Question paper, page 22
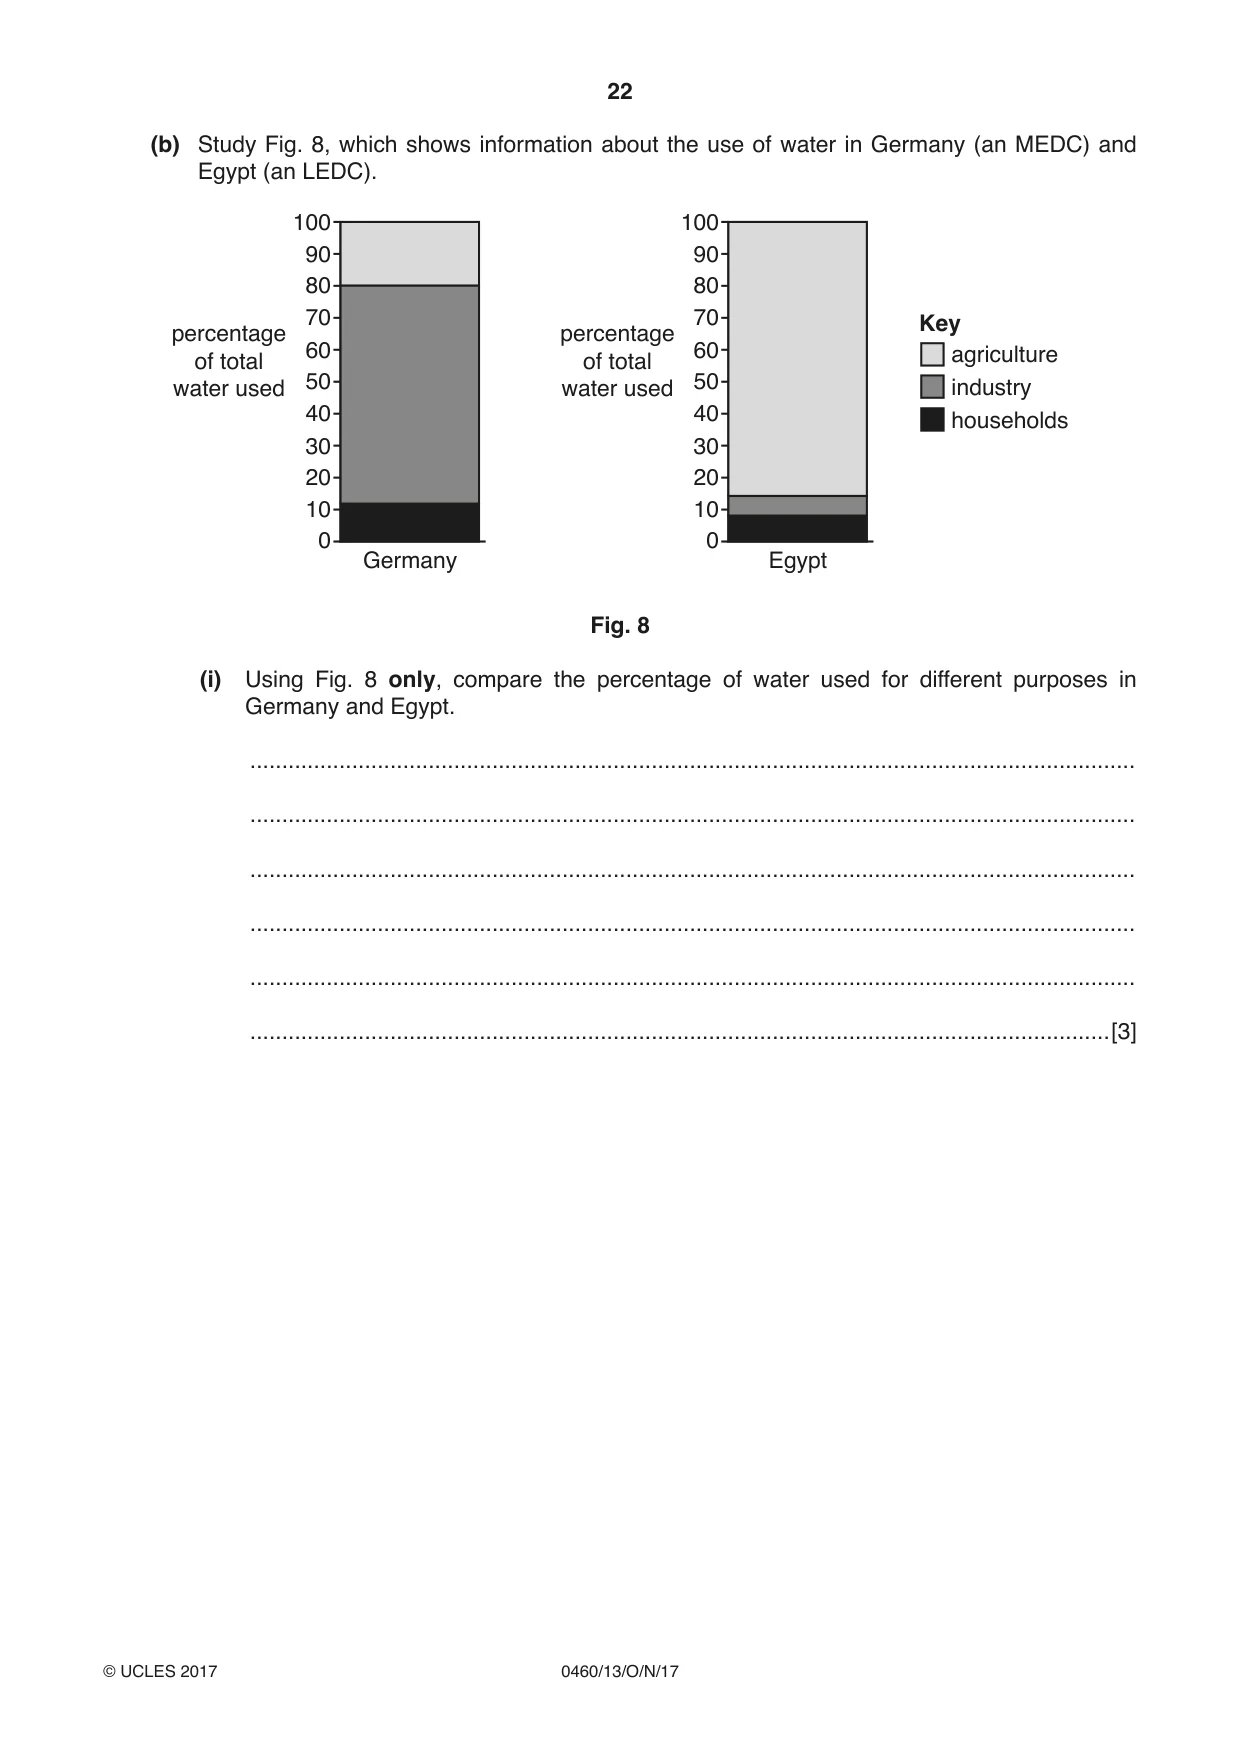
22 0460/13/O/N/17 © UCLES 2017 (b) Study Fig. 8, which shows information about the use of water in Germany (an MEDC) and Egypt (an LEDC). 100 90 80 70 60 50 percentage of total water used percentage of total water used 40 30 20 10 0 Germany 100 90 80 70 60 50 40 30 20 10 0 Egypt agriculture industry households Key Fig. 8 (i) Using Fig. 8 only, compare the percentage of water used for different purposes in Germany and Egypt. … … … … … …[3]
Question paper, page 23
23 0460/13/O/N/17 © UCLES 2017 [Turn over (ii) Suggest reasons for the differences in the percentage of water used for different purposes in Germany and Egypt. … … … … … … … … … …[5]
Question paper, page 24
24 0460/13/O/N/17 © UCLES 2017 (c) For a named country you have studied, explain how its energy is supplied. Name of country … … … … … … … … … … … … … … … … … … … … … … … … …[7] [Total: 25 marks] END OF QUESTION 5
Question paper, page 25
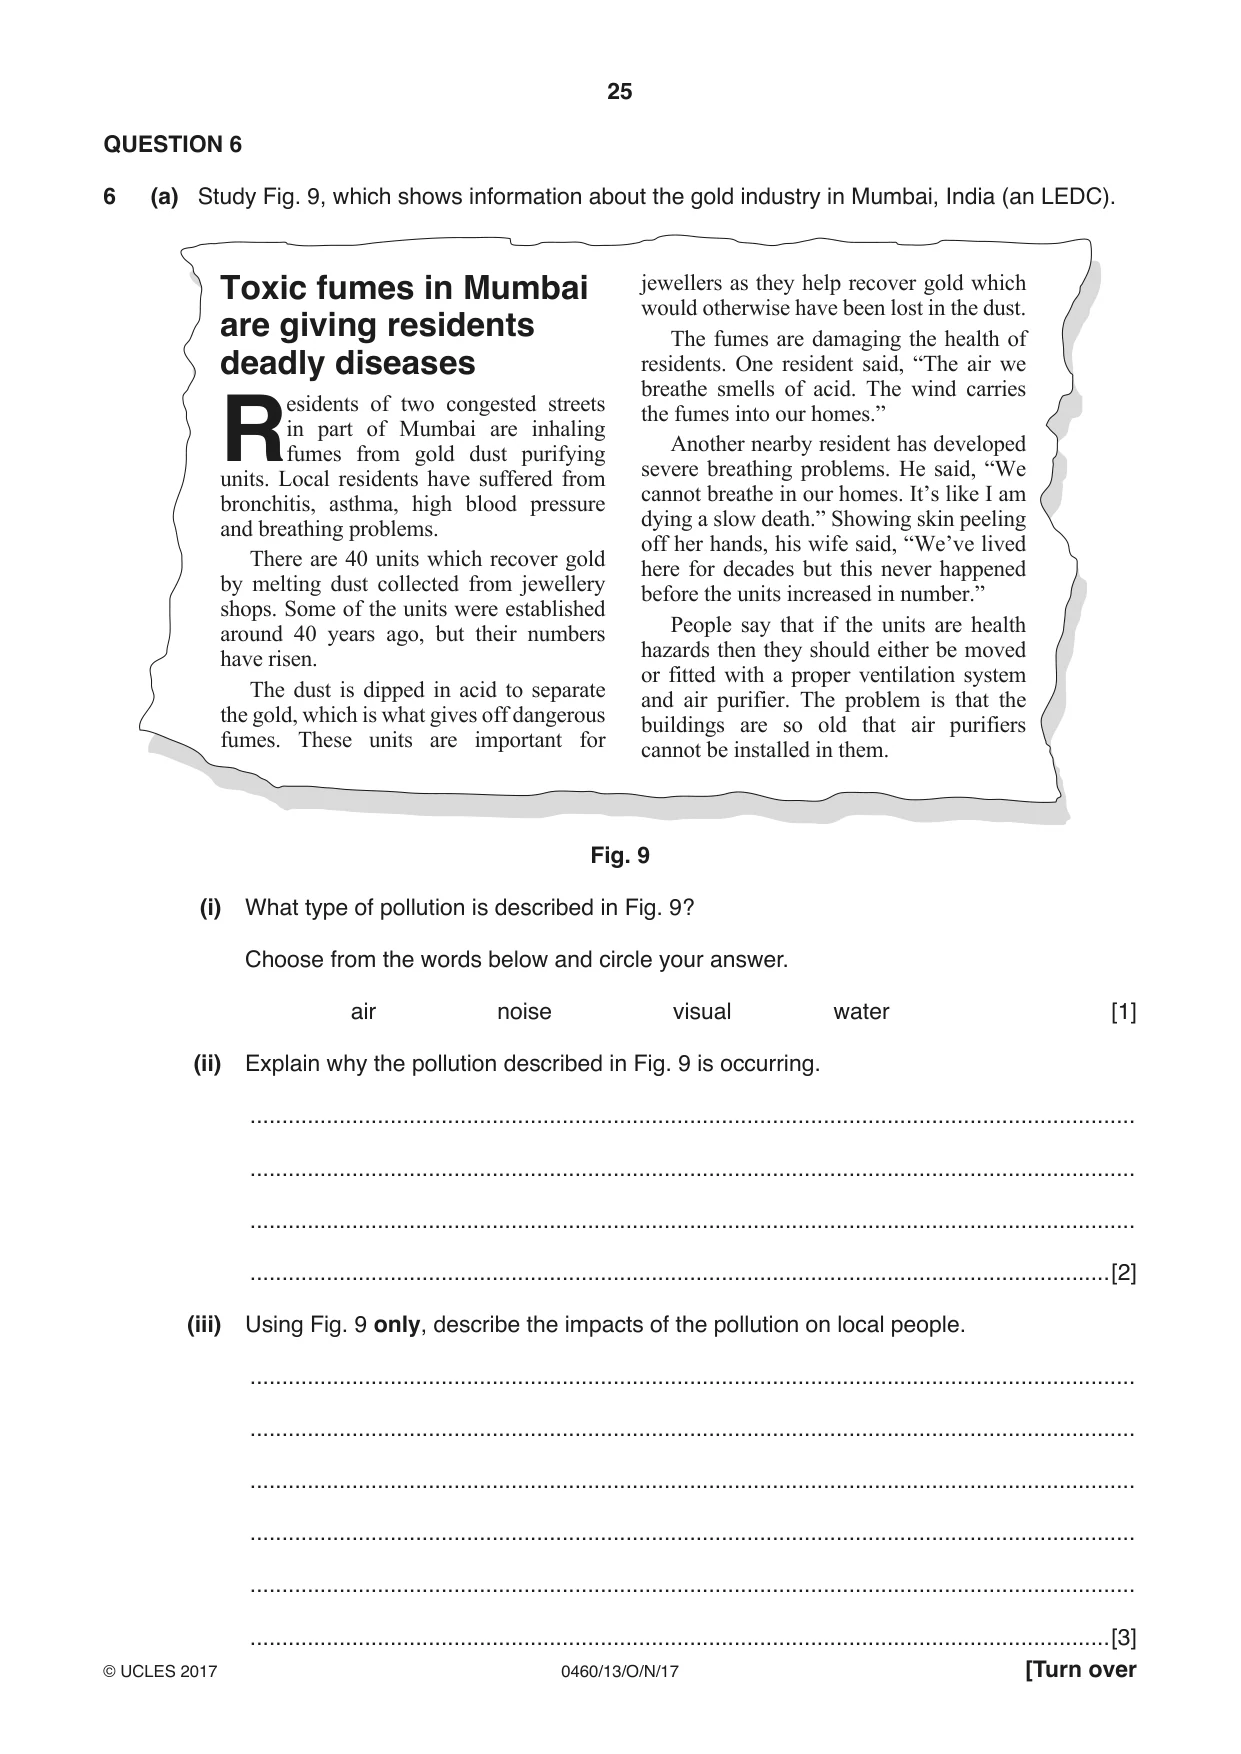
25 0460/13/O/N/17 © UCLES 2017 [Turn over QUESTION 6 6 (a) Study Fig. 9, which shows information about the gold industry in Mumbai, India (an LEDC). Toxic fumes in Mumbai are giving residents deadly diseases R esidents of two congested streets in part of Mumbai are inhaling fumes from gold dust purifying units. Local residents have suffered from bronchitis, asthma, high blood pressure and breathing problems. There are 40 units which recover gold by melting dust collected from jewellery shops. Some of the units were established around 40 years ago, but their numbers have risen. The dust is dipped in acid to separate the gold, which is what gives off dangerous fumes. These units are important for jewellers as they help recover gold which would otherwise have been lost in the dust. The fumes are damaging the health of residents. One resident said, “The air we breathe smells of acid. The wind carries the fumes into our homes.” Another nearby resident has developed severe breathing problems. He said, “We cannot breathe in our homes. It’s like I am dying a slow death.” Showing skin peeling off her hands, his wife said, “We’ve lived here for decades but this never happened before the units increased in number.” People say that if the units are health hazards then they should either be moved or fitted with a proper ventilation system and air purifier. The problem is that the buildings are so old that air purifiers cannot be installed in them. Fig. 9 (i) What type of pollution is described in Fig. 9? Choose from the words below and circle your answer. air noise visual water [1] (ii) Explain why the pollution described in Fig. 9 is occurring. … … … …[2] (iii) Using Fig. 9 only, describe the impacts of the pollution on local people. … … … … … …[3]
Question paper, page 26
26 0460/13/O/N/17 © UCLES 2017 (iv) Suggest reasons why the authorities may not want to solve the problems caused by the gold industry in Mumbai. … … … … … … … …[4]
Question paper, page 27
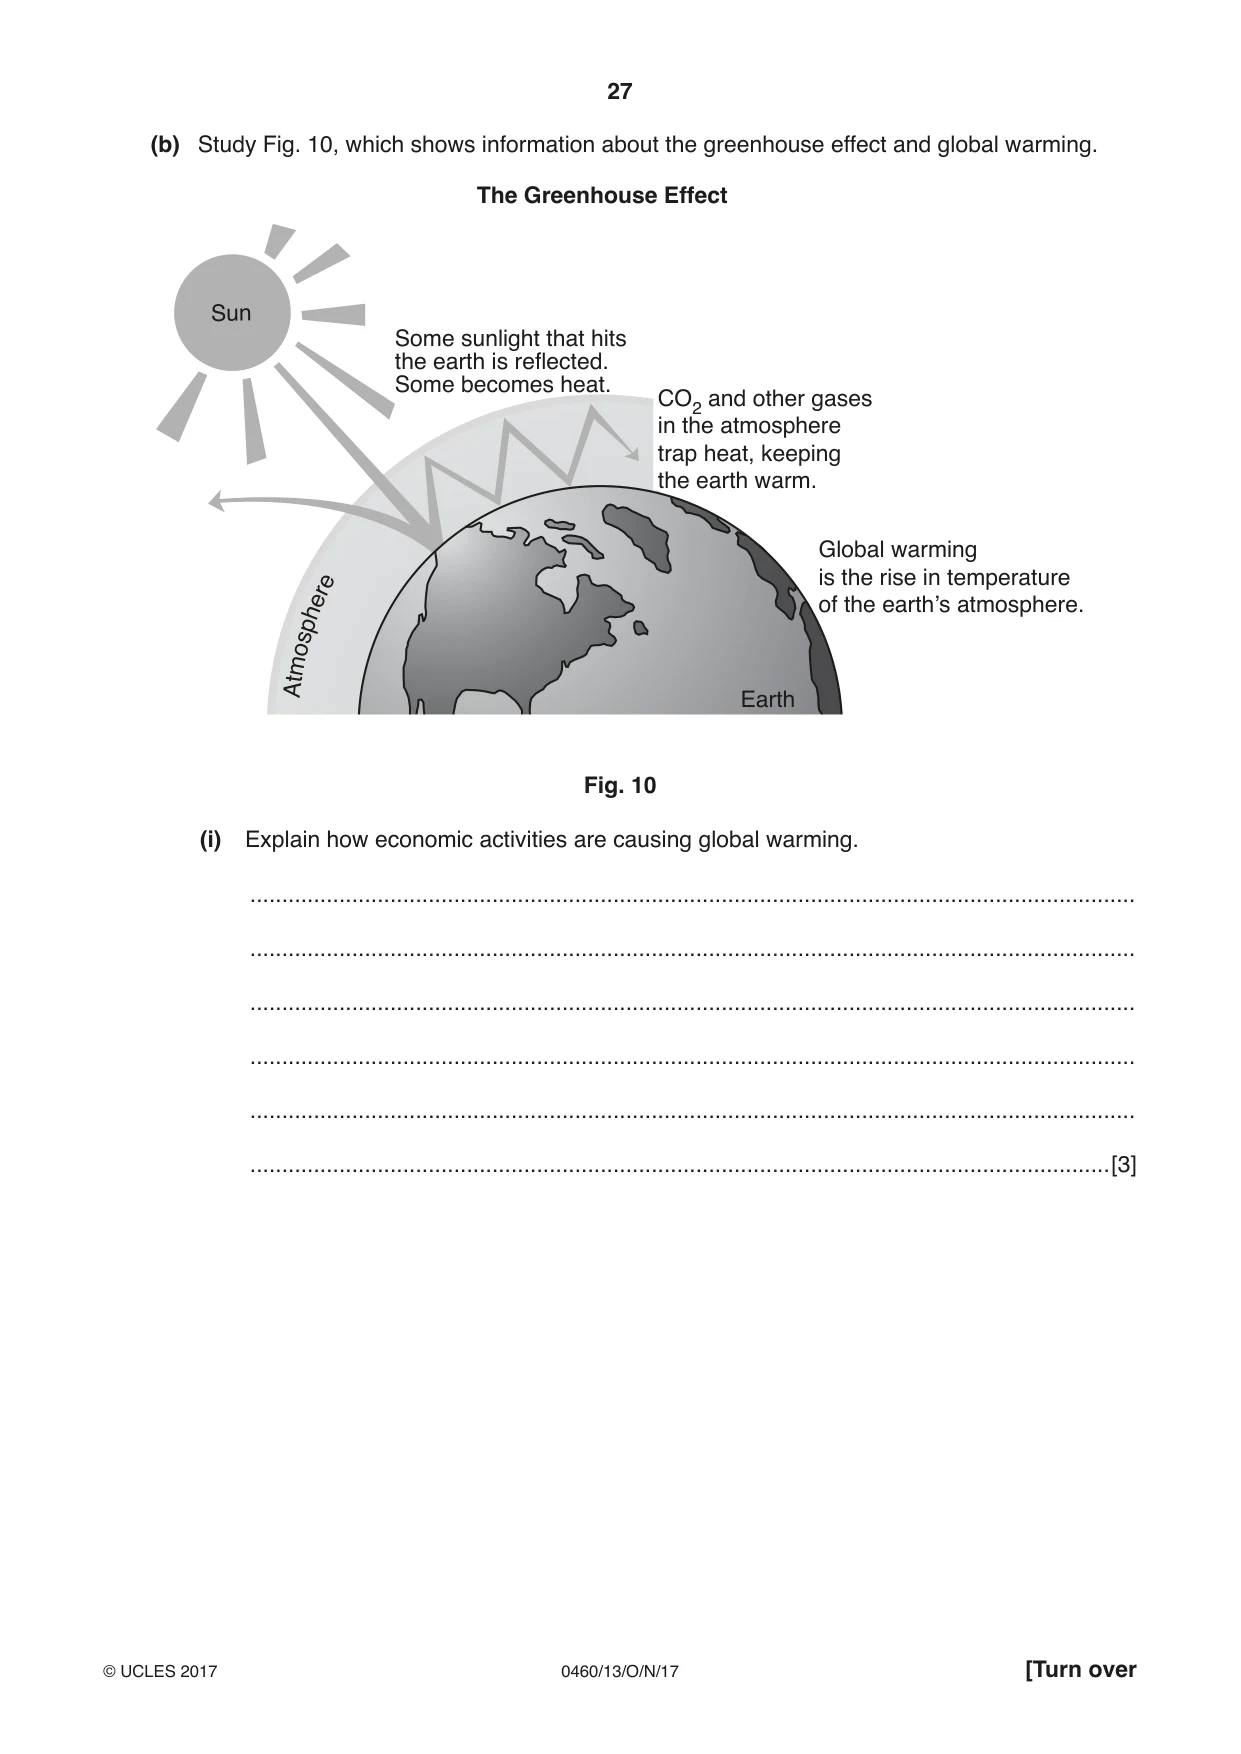
27 0460/13/O/N/17 © UCLES 2017 [Turn over (b) Study Fig. 10, which shows information about the greenhouse effect and global warming. Some sunlight that hits the earth is reflected. Some becomes heat. The Greenhouse Effect Sun CO2 and other gases in the atmosphere trap heat, keeping the earth warm. Global warming is the rise in temperature of the earth’s atmosphere. Earth A tm os ph er e Fig. 10 (i) Explain how economic activities are causing global warming. … … … … … …[3]
Question paper, page 28
28 0460/13/O/N/17 © UCLES 2017 (ii) Explain why global warming is a threat to the natural environment. … … … … … … … … … …[5]
Question paper, page 29
29 0460/13/O/N/17 © UCLES 2017 (c) Name an area which you have studied and state an economic activity which is causing the environment to be at risk. Explain how it is being managed so that it is more sustainable. Name of area … Economic activity … … … … … … … … … … … … … … … … … … … … … … … …[7] [Total: 25 marks] END OF QUESTION 6
Question paper, page 30
30 0460/13/O/N/17 © UCLES 2017 Additional Pages If you use the following lined pages to complete the answer(s) to any question(s), the question number(s) must be clearly shown. … … … … … … … … … … … … … … … … … … … … … … … … … …
Question paper, page 31
31 0460/13/O/N/17 © UCLES 2017 … … … … … … … … … … … … … … … … … … … … … … … … … … … …
Question paper, page 32
32 0460/13/O/N/17 © UCLES 2017 Permission to reproduce items where third-party owned material protected by copyright is included has been sought and cleared where possible. Every reasonable effort has been made by the publisher (UCLES) to trace copyright holders, but if any items requiring clearance have unwittingly been included, the publisher will be pleased to make amends at the earliest possible opportunity. To avoid the issue of disclosure of answer-related information to candidates, all copyright acknowledgements are reproduced online in the Cambridge International Examinations Copyright Acknowledgements Booklet. This is produced for each series of examinations and is freely available to download at www.cie.org.uk after the live examination series. Cambridge International Examinations is part of the Cambridge Assessment Group. Cambridge Assessment is the brand name of University of Cambridge Local Examinations Syndicate (UCLES), which is itself a department of the University of Cambridge. BLANK PAGE
Mark scheme, page 1
® IGCSE is a registered trademark. This syllabus is approved for use in England, Wales and Northern Ireland as a Cambridge International Level 1/Level 2 Certificate. This document consists of 16 printed pages. © UCLES 2017 [Turn over Cambridge Assessment International Education Cambridge International General Certificate of Secondary Education GEOGRAPHY 0460/13 Paper 1 October/November 2017 MARK SCHEME Maximum Mark: 75 Published This mark scheme is published as an aid to teachers and candidates, to indicate the requirements of the examination. It shows the basis on which Examiners were instructed to award marks. It does not indicate the details of the discussions that took place at an Examiners’ meeting before marking began, which would have considered the acceptability of alternative answers. Mark schemes should be read in conjunction with the question paper and the Principal Examiner Report for Teachers. Cambridge International will not enter into discussions about these mark schemes. Cambridge International is publishing the mark schemes for the October/November 2017 series for most Cambridge IGCSE®, Cambridge International A and AS Level components and some Cambridge O Level components.
Mark scheme, page 2
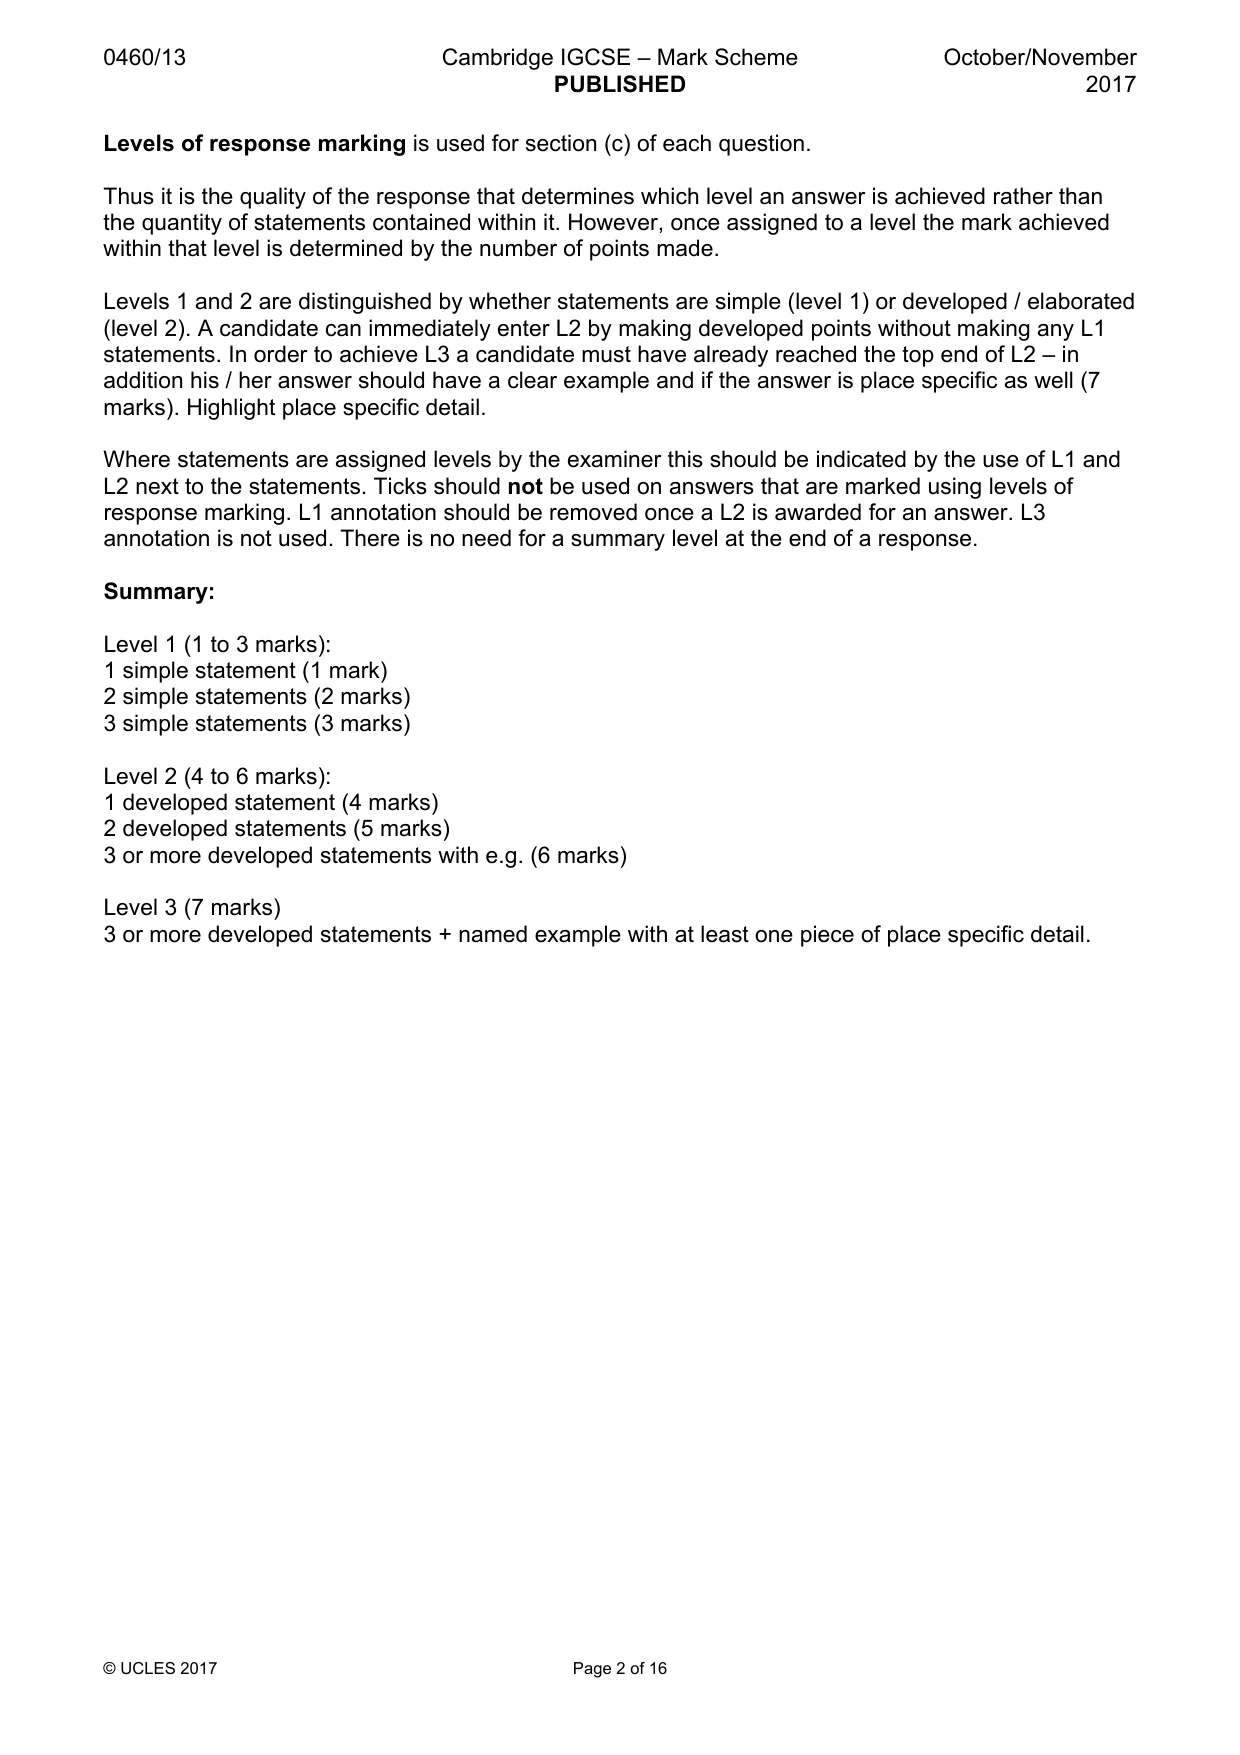
0460/13 Cambridge IGCSE – Mark Scheme PUBLISHED October/November 2017 © UCLES 2017 Page 2 of 16 Levels of response marking is used for section (c) of each question. Thus it is the quality of the response that determines which level an answer is achieved rather than the quantity of statements contained within it. However, once assigned to a level the mark achieved within that level is determined by the number of points made. Levels 1 and 2 are distinguished by whether statements are simple (level 1) or developed / elaborated (level 2). A candidate can immediately enter L2 by making developed points without making any L1 statements. In order to achieve L3 a candidate must have already reached the top end of L2 – in addition his / her answer should have a clear example and if the answer is place specific as well (7 marks). Highlight place specific detail. Where statements are assigned levels by the examiner this should be indicated by the use of L1 and L2 next to the statements. Ticks should not be used on answers that are marked using levels of response marking. L1 annotation should be removed once a L2 is awarded for an answer. L3 annotation is not used. There is no need for a summary level at the end of a response. Summary: Level 1 (1 to 3 marks): 1 simple statement (1 mark) 2 simple statements (2 marks) 3 simple statements (3 marks) Level 2 (4 to 6 marks): 1 developed statement (4 marks) 2 developed statements (5 marks) 3 or more developed statements with e.g. (6 marks) Level 3 (7 marks) 3 or more developed statements + named example with at least one piece of place specific detail.
Mark scheme, page 3
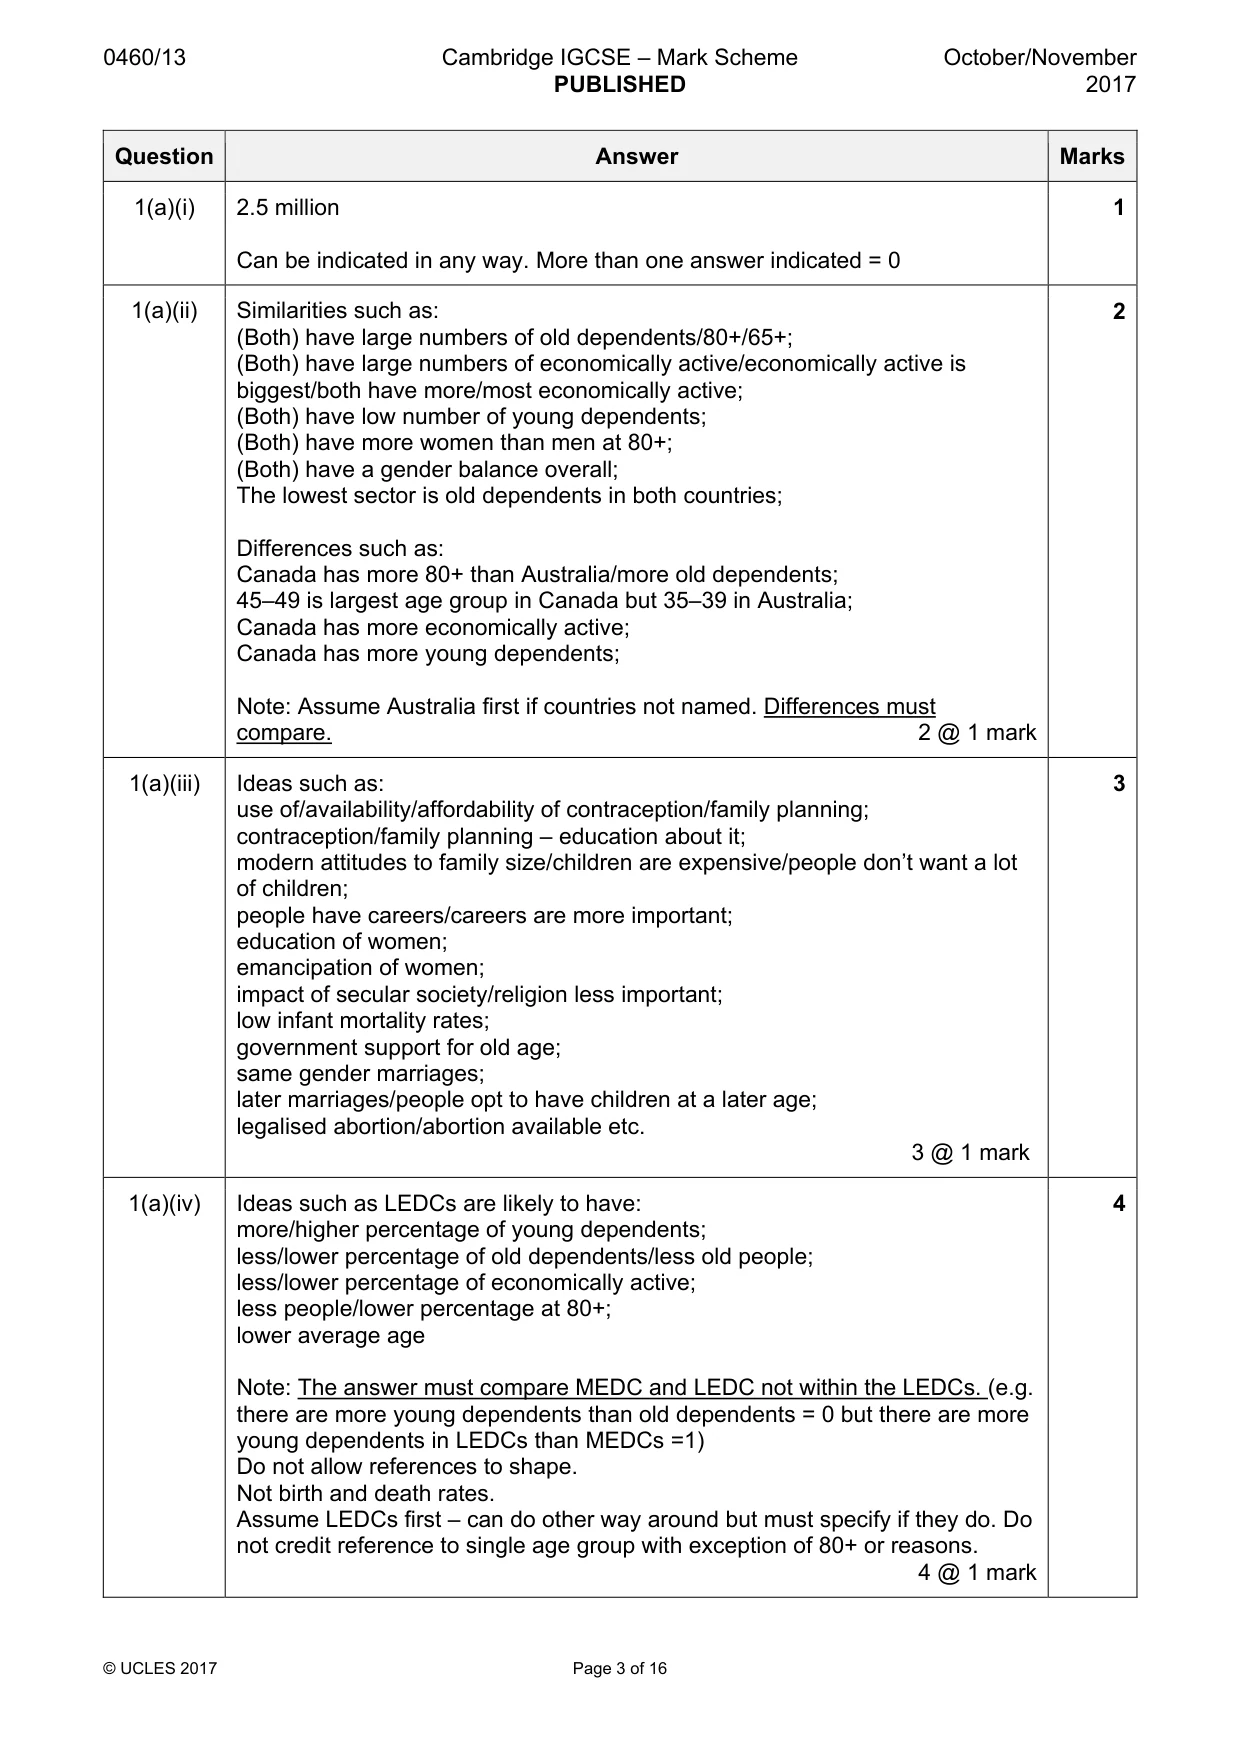
0460/13 Cambridge IGCSE – Mark Scheme PUBLISHED October/November 2017 © UCLES 2017 Page 3 of 16 Question Answer Marks 1(a)(i) 2.5 million Can be indicated in any way. More than one answer indicated = 0 1 1(a)(ii) Similarities such as: (Both) have large numbers of old dependents/80+/65+; (Both) have large numbers of economically active/economically active is biggest/both have more/most economically active; (Both) have low number of young dependents; (Both) have more women than men at 80+; (Both) have a gender balance overall; The lowest sector is old dependents in both countries; Differences such as: Canada has more 80+ than Australia/more old dependents; 45–49 is largest age group in Canada but 35–39 in Australia; Canada has more economically active; Canada has more young dependents; Note: Assume Australia first if countries not named. Differences must compare. 2 @ 1 mark 2 1(a)(iii) Ideas such as: use of/availability/affordability of contraception/family planning; contraception/family planning – education about it; modern attitudes to family size/children are expensive/people don’t want a lot of children; people have careers/careers are more important; education of women; emancipation of women; impact of secular society/religion less important; low infant mortality rates; government support for old age; same gender marriages; later marriages/people opt to have children at a later age; legalised abortion/abortion available etc. 3 @ 1 mark 3 1(a)(iv) Ideas such as LEDCs are likely to have: more/higher percentage of young dependents; less/lower percentage of old dependents/less old people; less/lower percentage of economically active; less people/lower percentage at 80+; lower average age Note: The answer must compare MEDC and LEDC not within the LEDCs. (e.g. there are more young dependents than old dependents = 0 but there are more young dependents in LEDCs than MEDCs =1) Do not allow references to shape. Not birth and death rates. Assume LEDCs first – can do other way around but must specify if they do. Do not credit reference to single age group with exception of 80+ or reasons. 4 @ 1 mark 4
Mark scheme, page 4
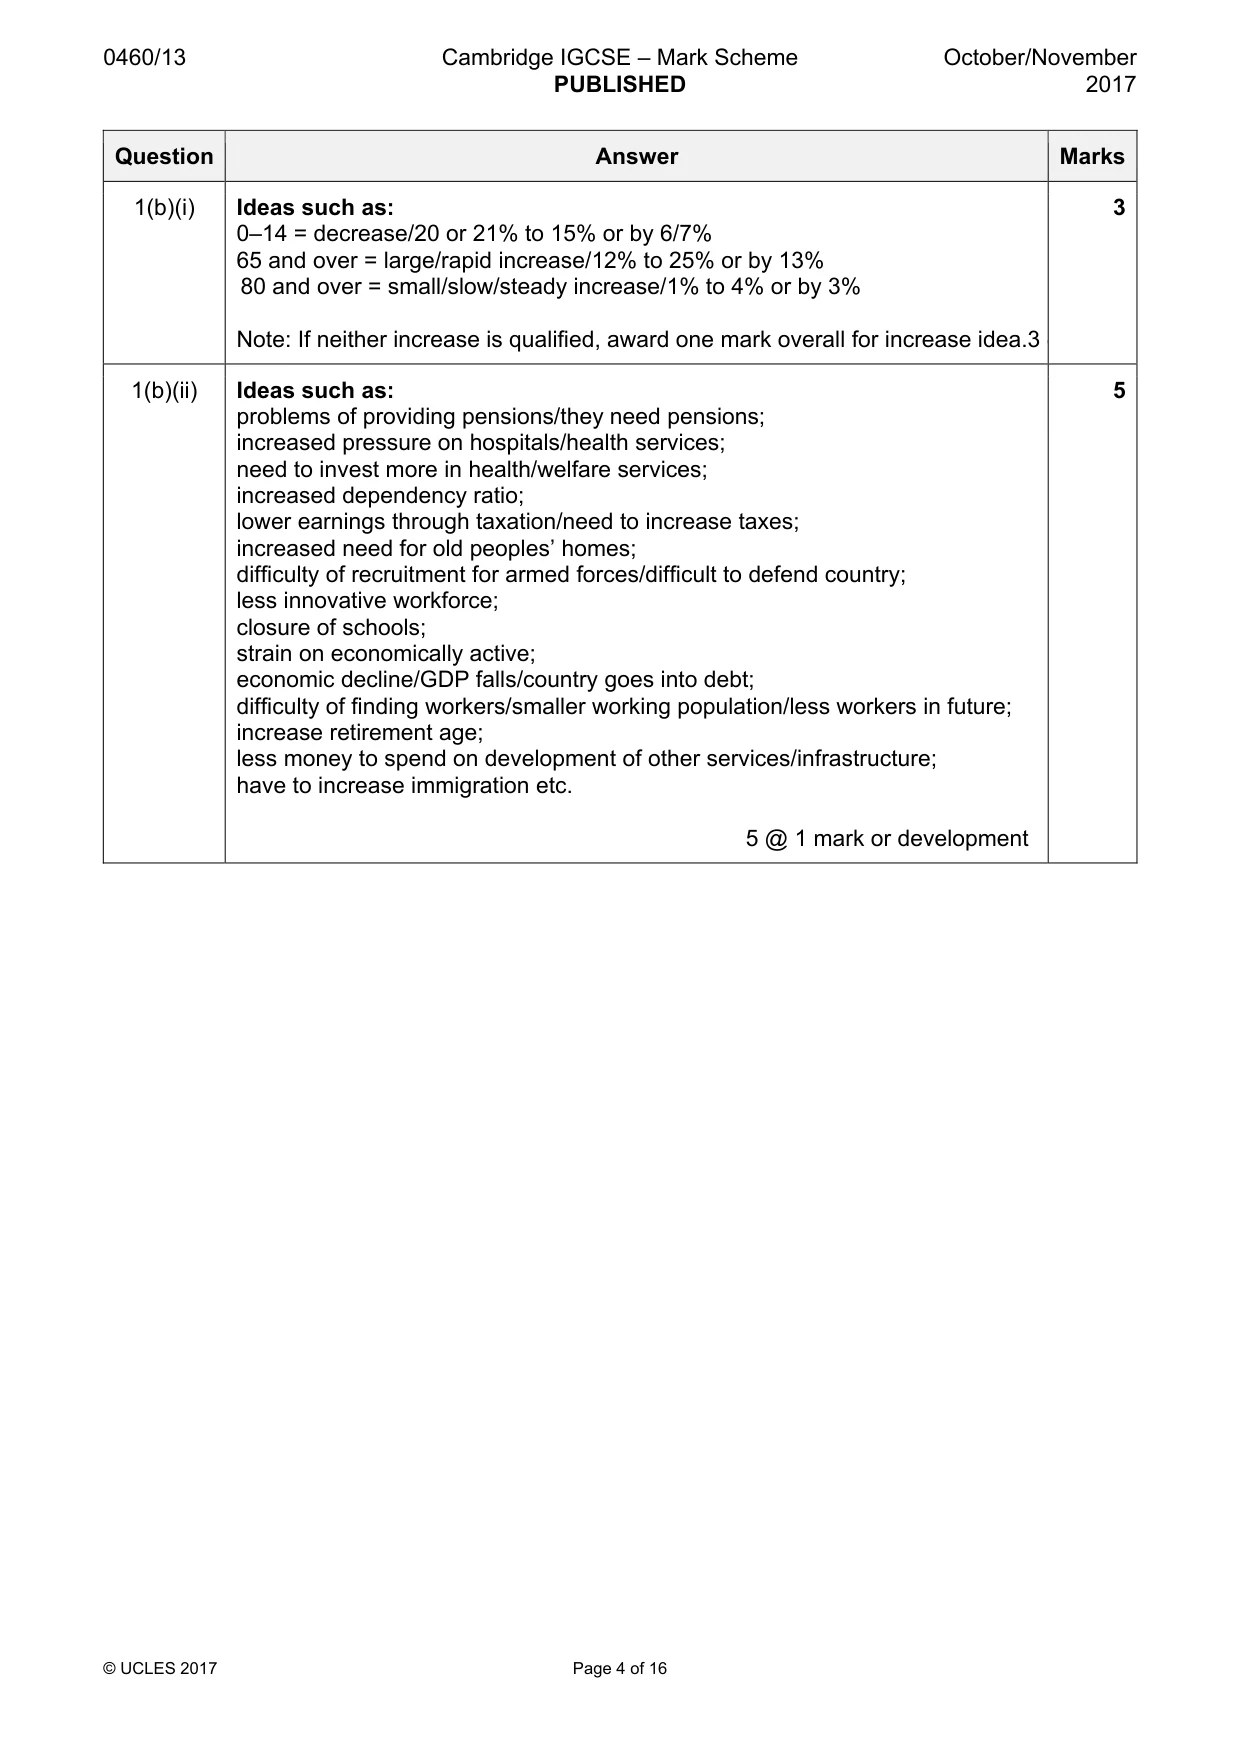
0460/13 Cambridge IGCSE – Mark Scheme PUBLISHED October/November 2017 © UCLES 2017 Page 4 of 16 Question Answer Marks 1(b)(i) Ideas such as: 0–14 = decrease/20 or 21% to 15% or by 6/7% 65 and over = large/rapid increase/12% to 25% or by 13% 80 and over = small/slow/steady increase/1% to 4% or by 3% Note: If neither increase is qualified, award one mark overall for increase idea.3 @ 3 1(b)(ii) Ideas such as: problems of providing pensions/they need pensions; increased pressure on hospitals/health services; need to invest more in health/welfare services; increased dependency ratio; lower earnings through taxation/need to increase taxes; increased need for old peoples’ homes; difficulty of recruitment for armed forces/difficult to defend country; less innovative workforce; closure of schools; strain on economically active; economic decline/GDP falls/country goes into debt; difficulty of finding workers/smaller working population/less workers in future; increase retirement age; less money to spend on development of other services/infrastructure; have to increase immigration etc. 5 @ 1 mark or development 5
Mark scheme, page 5
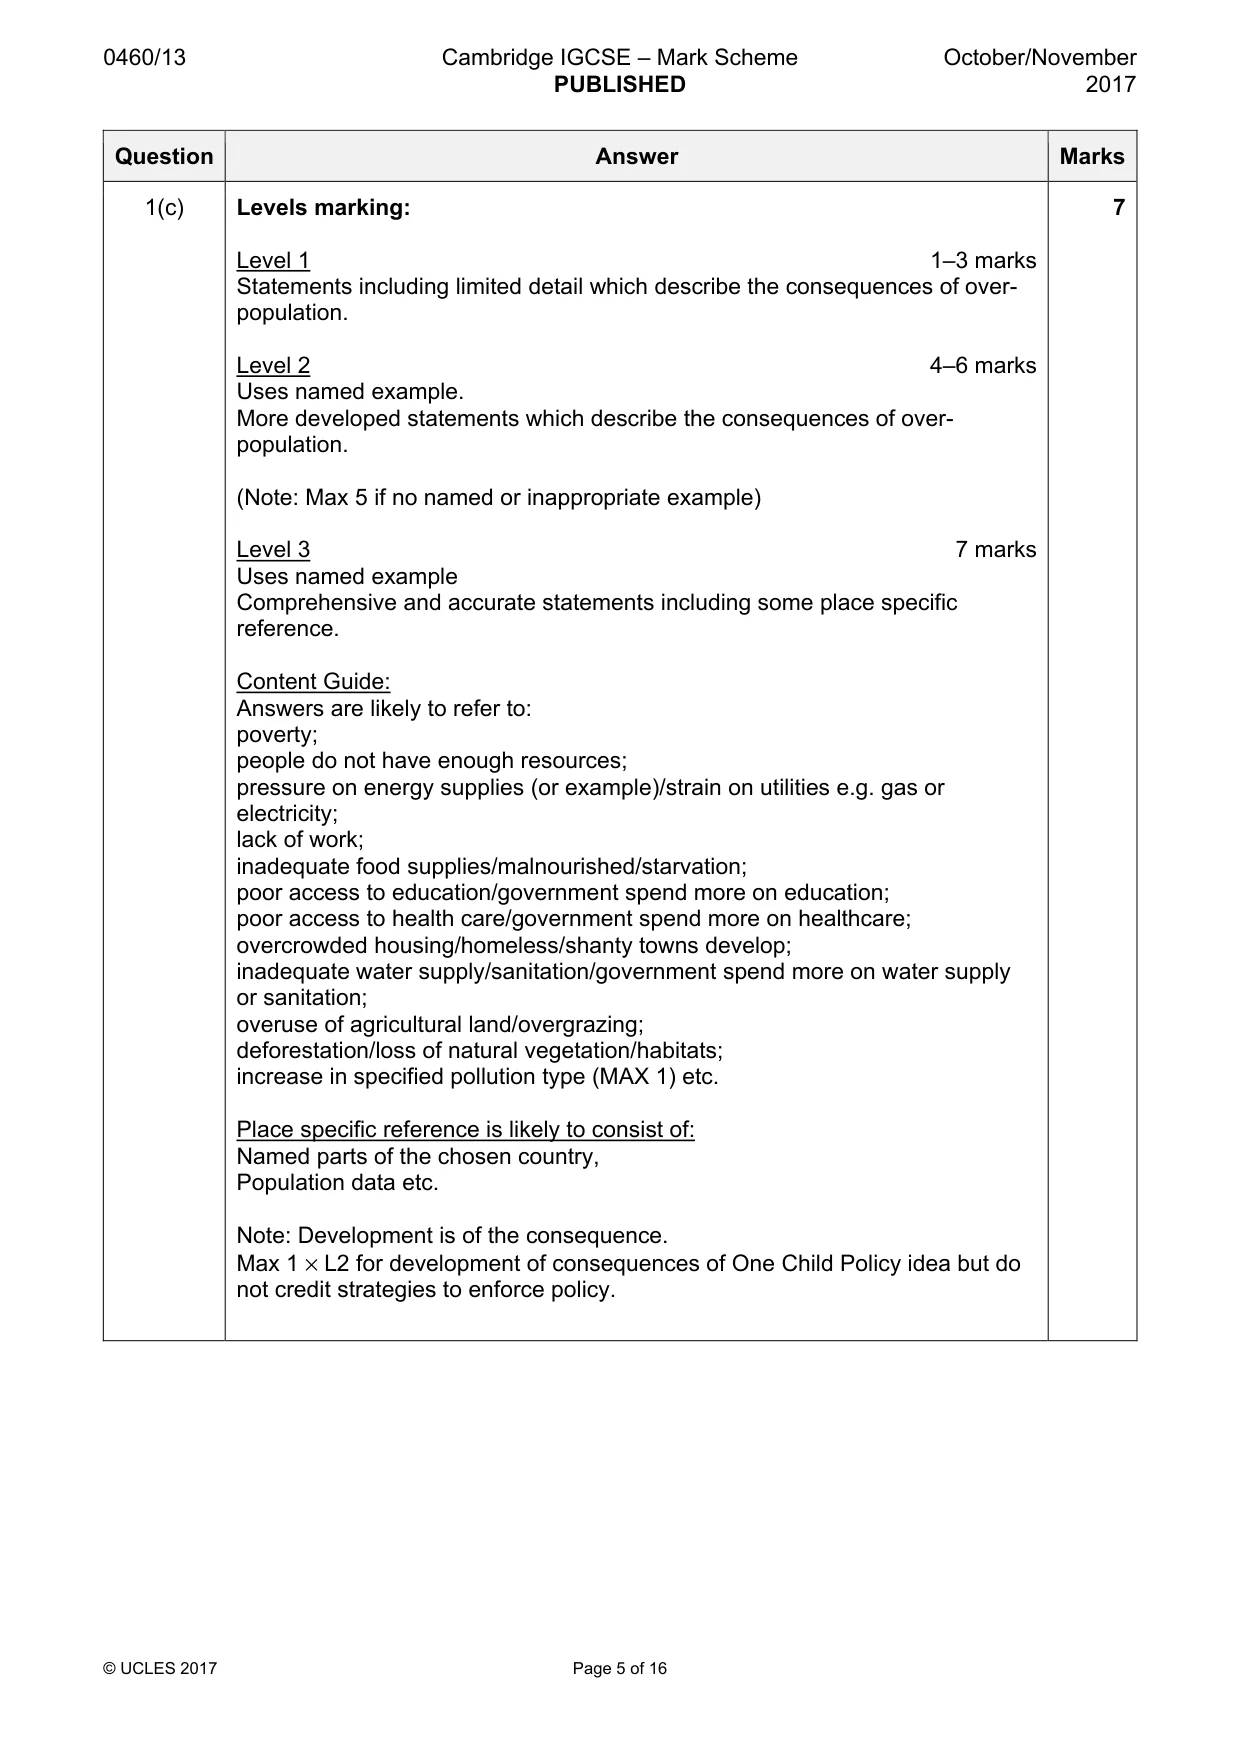
0460/13 Cambridge IGCSE – Mark Scheme PUBLISHED October/November 2017 © UCLES 2017 Page 5 of 16 Question Answer Marks 1(c) Levels marking: Level 1 1–3 marks Statements including limited detail which describe the consequences of over- population. Level 2 4–6 marks Uses named example. More developed statements which describe the consequences of over- population. (Note: Max 5 if no named or inappropriate example) Level 3 7 marks Uses named example Comprehensive and accurate statements including some place specific reference. Content Guide: Answers are likely to refer to: poverty; people do not have enough resources; pressure on energy supplies (or example)/strain on utilities e.g. gas or electricity; lack of work; inadequate food supplies/malnourished/starvation; poor access to education/government spend more on education; poor access to health care/government spend more on healthcare; overcrowded housing/homeless/shanty towns develop; inadequate water supply/sanitation/government spend more on water supply or sanitation; overuse of agricultural land/overgrazing; deforestation/loss of natural vegetation/habitats; increase in specified pollution type (MAX 1) etc. Place specific reference is likely to consist of: Named parts of the chosen country, Population data etc. Note: Development is of the consequence. Max 1 × L2 for development of consequences of One Child Policy idea but do not credit strategies to enforce policy. 7
Mark scheme, page 6
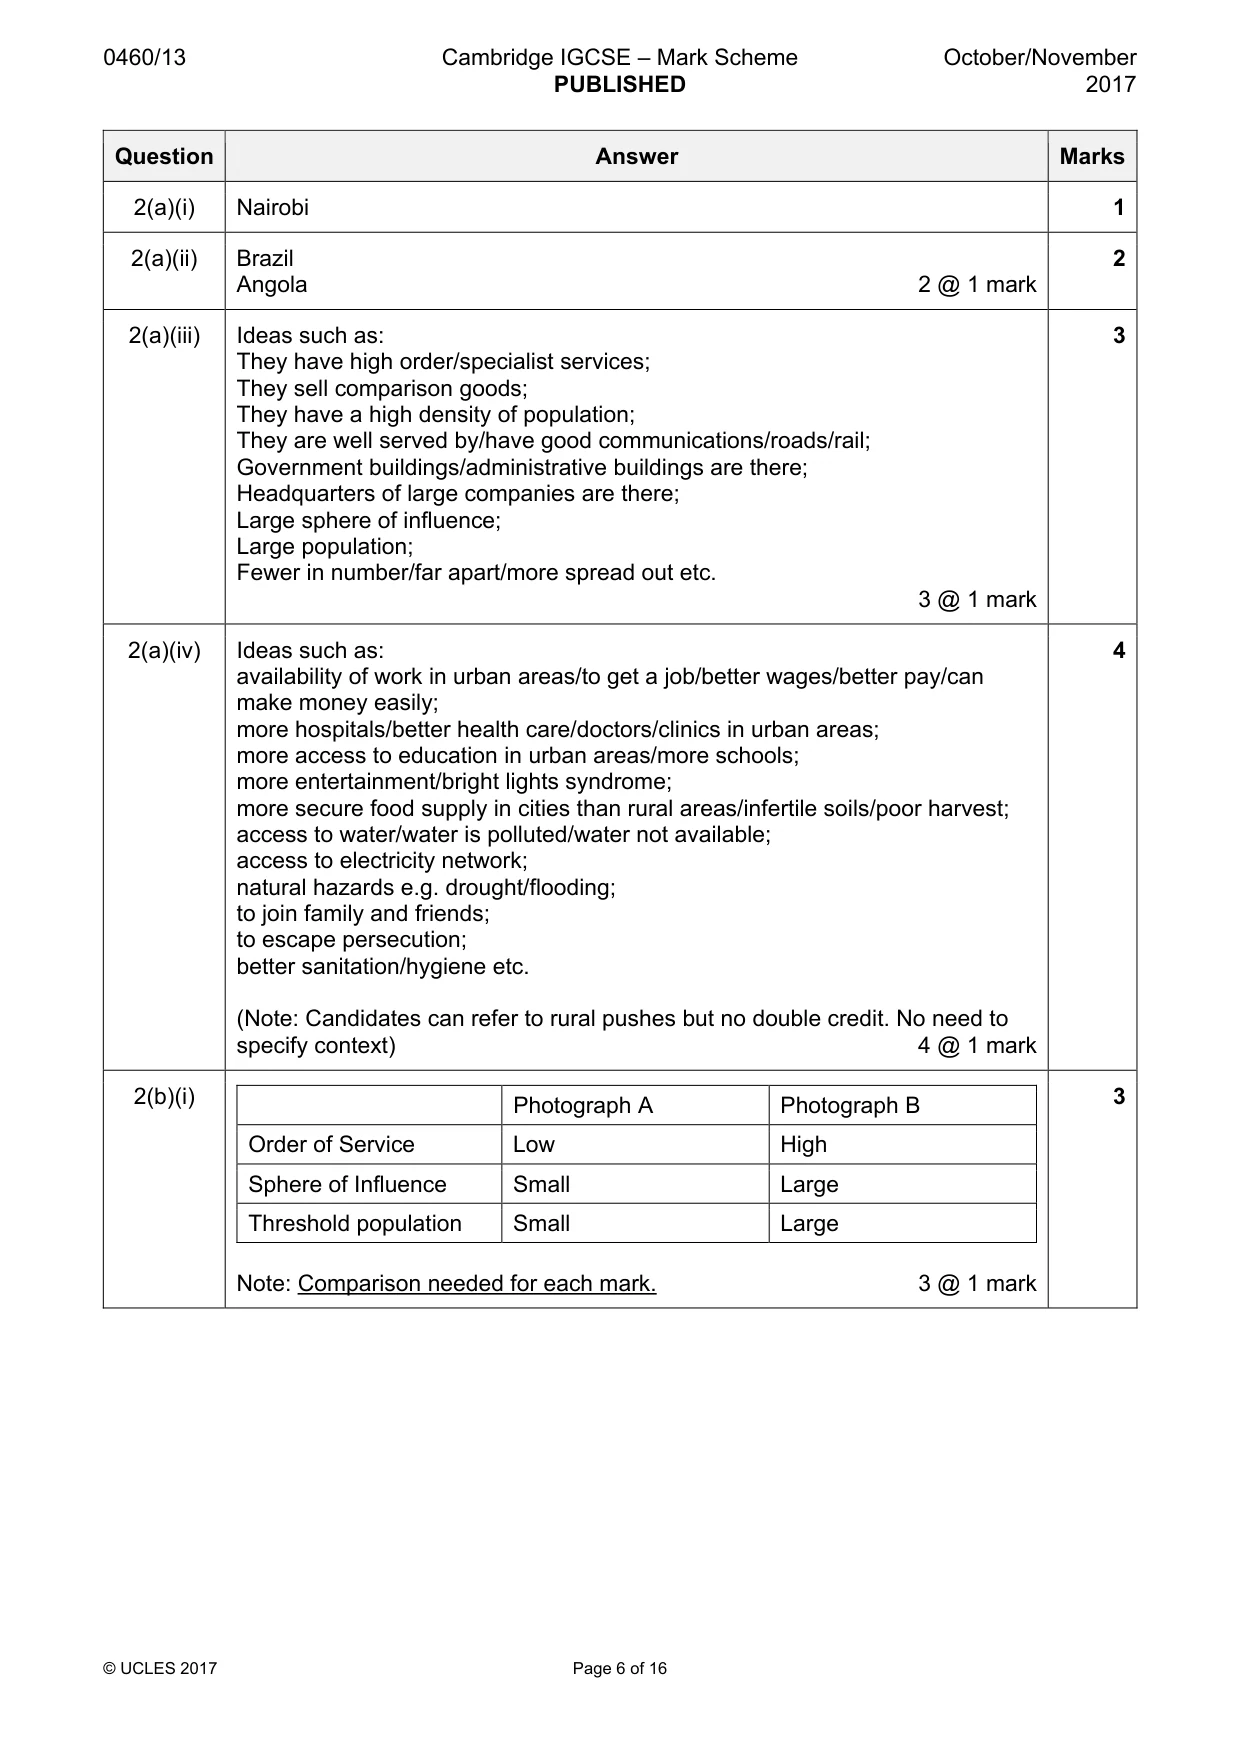
0460/13 Cambridge IGCSE – Mark Scheme PUBLISHED October/November 2017 © UCLES 2017 Page 6 of 16 Question Answer Marks 2(a)(i) Nairobi 1 2(a)(ii) Brazil Angola 2 @ 1 mark 2 2(a)(iii) Ideas such as: They have high order/specialist services; They sell comparison goods; They have a high density of population; They are well served by/have good communications/roads/rail; Government buildings/administrative buildings are there; Headquarters of large companies are there; Large sphere of influence; Large population; Fewer in number/far apart/more spread out etc. 3 @ 1 mark 3 2(a)(iv) Ideas such as: availability of work in urban areas/to get a job/better wages/better pay/can make money easily; more hospitals/better health care/doctors/clinics in urban areas; more access to education in urban areas/more schools; more entertainment/bright lights syndrome; more secure food supply in cities than rural areas/infertile soils/poor harvest; access to water/water is polluted/water not available; access to electricity network; natural hazards e.g. drought/flooding; to join family and friends; to escape persecution; better sanitation/hygiene etc. (Note: Candidates can refer to rural pushes but no double credit. No need to specify context) 4 @ 1 mark 4 2(b)(i) Photograph A Photograph B Order of Service Low High Sphere of Influence Small Large Threshold population Small Large Note: Comparison needed for each mark. 3 @ 1 mark 3
Mark scheme, page 7
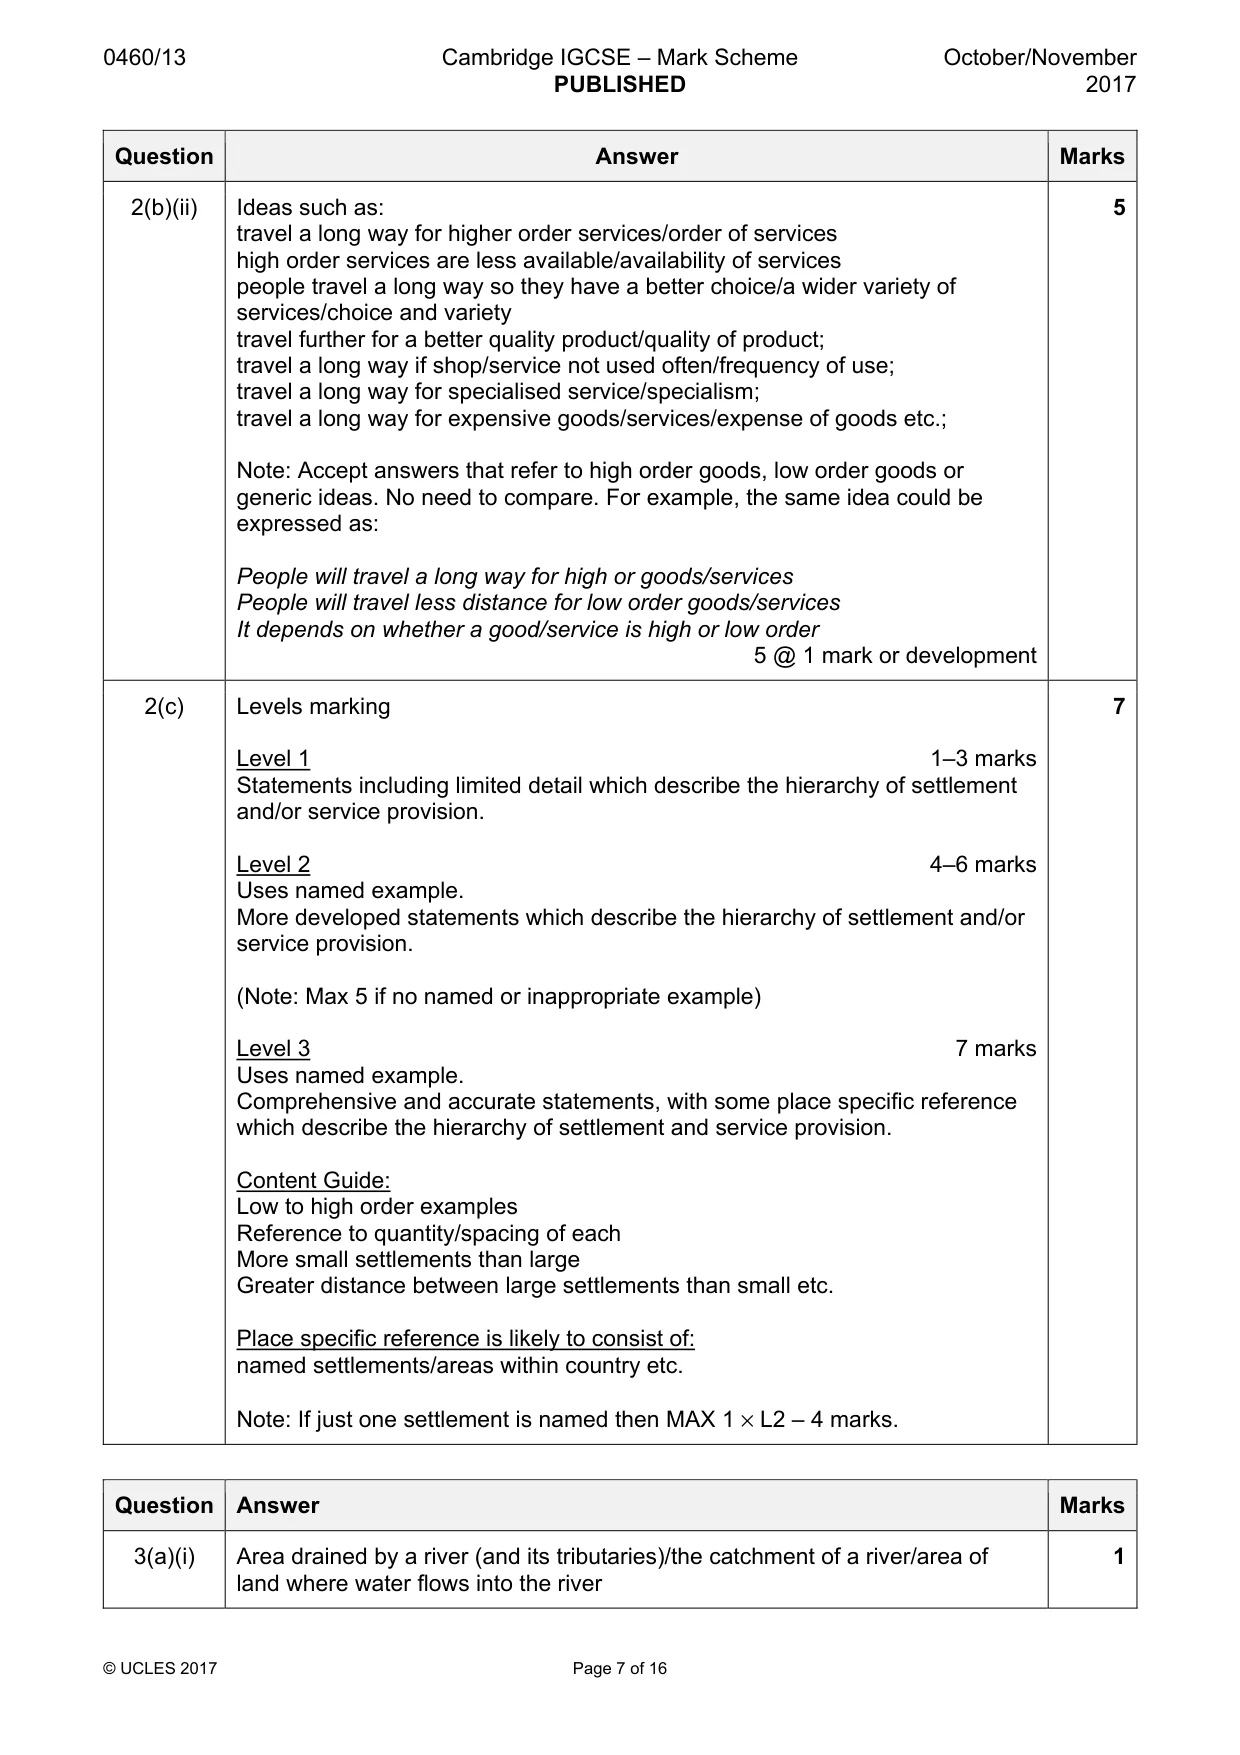
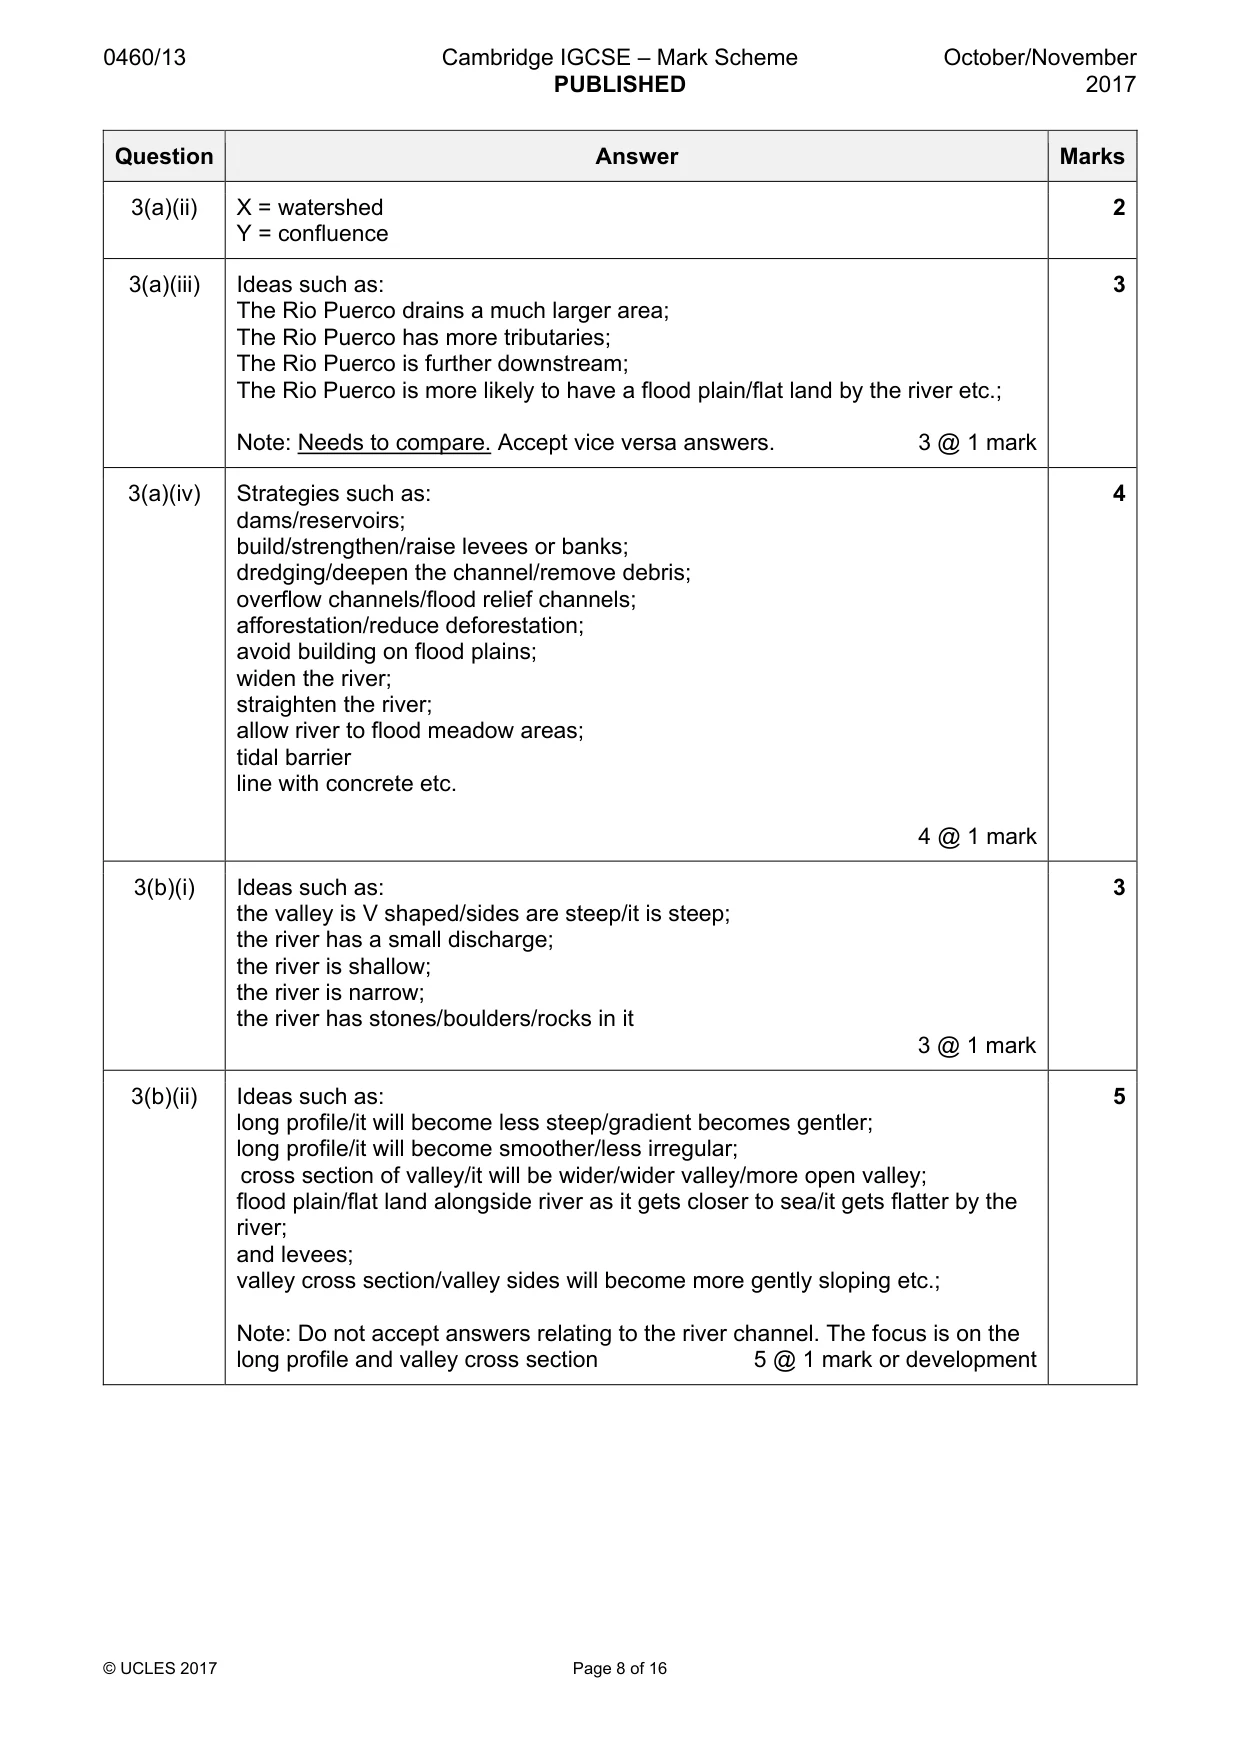
0460/13 Cambridge IGCSE – Mark Scheme PUBLISHED October/November 2017 © UCLES 2017 Page 7 of 16 Question Answer Marks 2(b)(ii) Ideas such as: travel a long way for higher order services/order of services high order services are less available/availability of services people travel a long way so they have a better choice/a wider variety of services/choice and variety travel further for a better quality product/quality of product; travel a long way if shop/service not used often/frequency of use; travel a long way for specialised service/specialism; travel a long way for expensive goods/services/expense of goods etc.; Note: Accept answers that refer to high order goods, low order goods or generic ideas. No need to compare. For example, the same idea could be expressed as: People will travel a long way for high or goods/services People will travel less distance for low order goods/services It depends on whether a good/service is high or low order 5 @ 1 mark or development 5 2(c) Levels marking Level 1 1–3 marks Statements including limited detail which describe the hierarchy of settlement and/or service provision. Level 2 4–6 marks Uses named example. More developed statements which describe the hierarchy of settlement and/or service provision. (Note: Max 5 if no named or inappropriate example) Level 3 7 marks Uses named example. Comprehensive and accurate statements, with some place specific reference which describe the hierarchy of settlement and service provision. Content Guide: Low to high order examples Reference to quantity/spacing of each More small settlements than large Greater distance between large settlements than small etc. Place specific reference is likely to consist of: named settlements/areas within country etc. Note: If just one settlement is named then MAX 1 × L2 – 4 marks. 7 Question Answer Marks 3(a)(i) Area drained by a river (and its tributaries)/the catchment of a river/area of land where water flows into the river 1
Mark scheme, page 8
0460/13 Cambridge IGCSE – Mark Scheme PUBLISHED October/November 2017 © UCLES 2017 Page 8 of 16 Question Answer Marks 3(a)(ii) X = watershed Y = confluence 2 3(a)(iii) Ideas such as: The Rio Puerco drains a much larger area; The Rio Puerco has more tributaries; The Rio Puerco is further downstream; The Rio Puerco is more likely to have a flood plain/flat land by the river etc.; Note: Needs to compare. Accept vice versa answers. 3 @ 1 mark 3 3(a)(iv) Strategies such as: dams/reservoirs; build/strengthen/raise levees or banks; dredging/deepen the channel/remove debris; overflow channels/flood relief channels; afforestation/reduce deforestation; avoid building on flood plains; widen the river; straighten the river; allow river to flood meadow areas; tidal barrier line with concrete etc. 4 @ 1 mark 4 3(b)(i) Ideas such as: the valley is V shaped/sides are steep/it is steep; the river has a small discharge; the river is shallow; the river is narrow; the river has stones/boulders/rocks in it 3 @ 1 mark 3 3(b)(ii) Ideas such as: long profile/it will become less steep/gradient becomes gentler; long profile/it will become smoother/less irregular; cross section of valley/it will be wider/wider valley/more open valley; flood plain/flat land alongside river as it gets closer to sea/it gets flatter by the river; and levees; valley cross section/valley sides will become more gently sloping etc.; Note: Do not accept answers relating to the river channel. The focus is on the long profile and valley cross section 5 @ 1 mark or development 5
Mark scheme, page 9
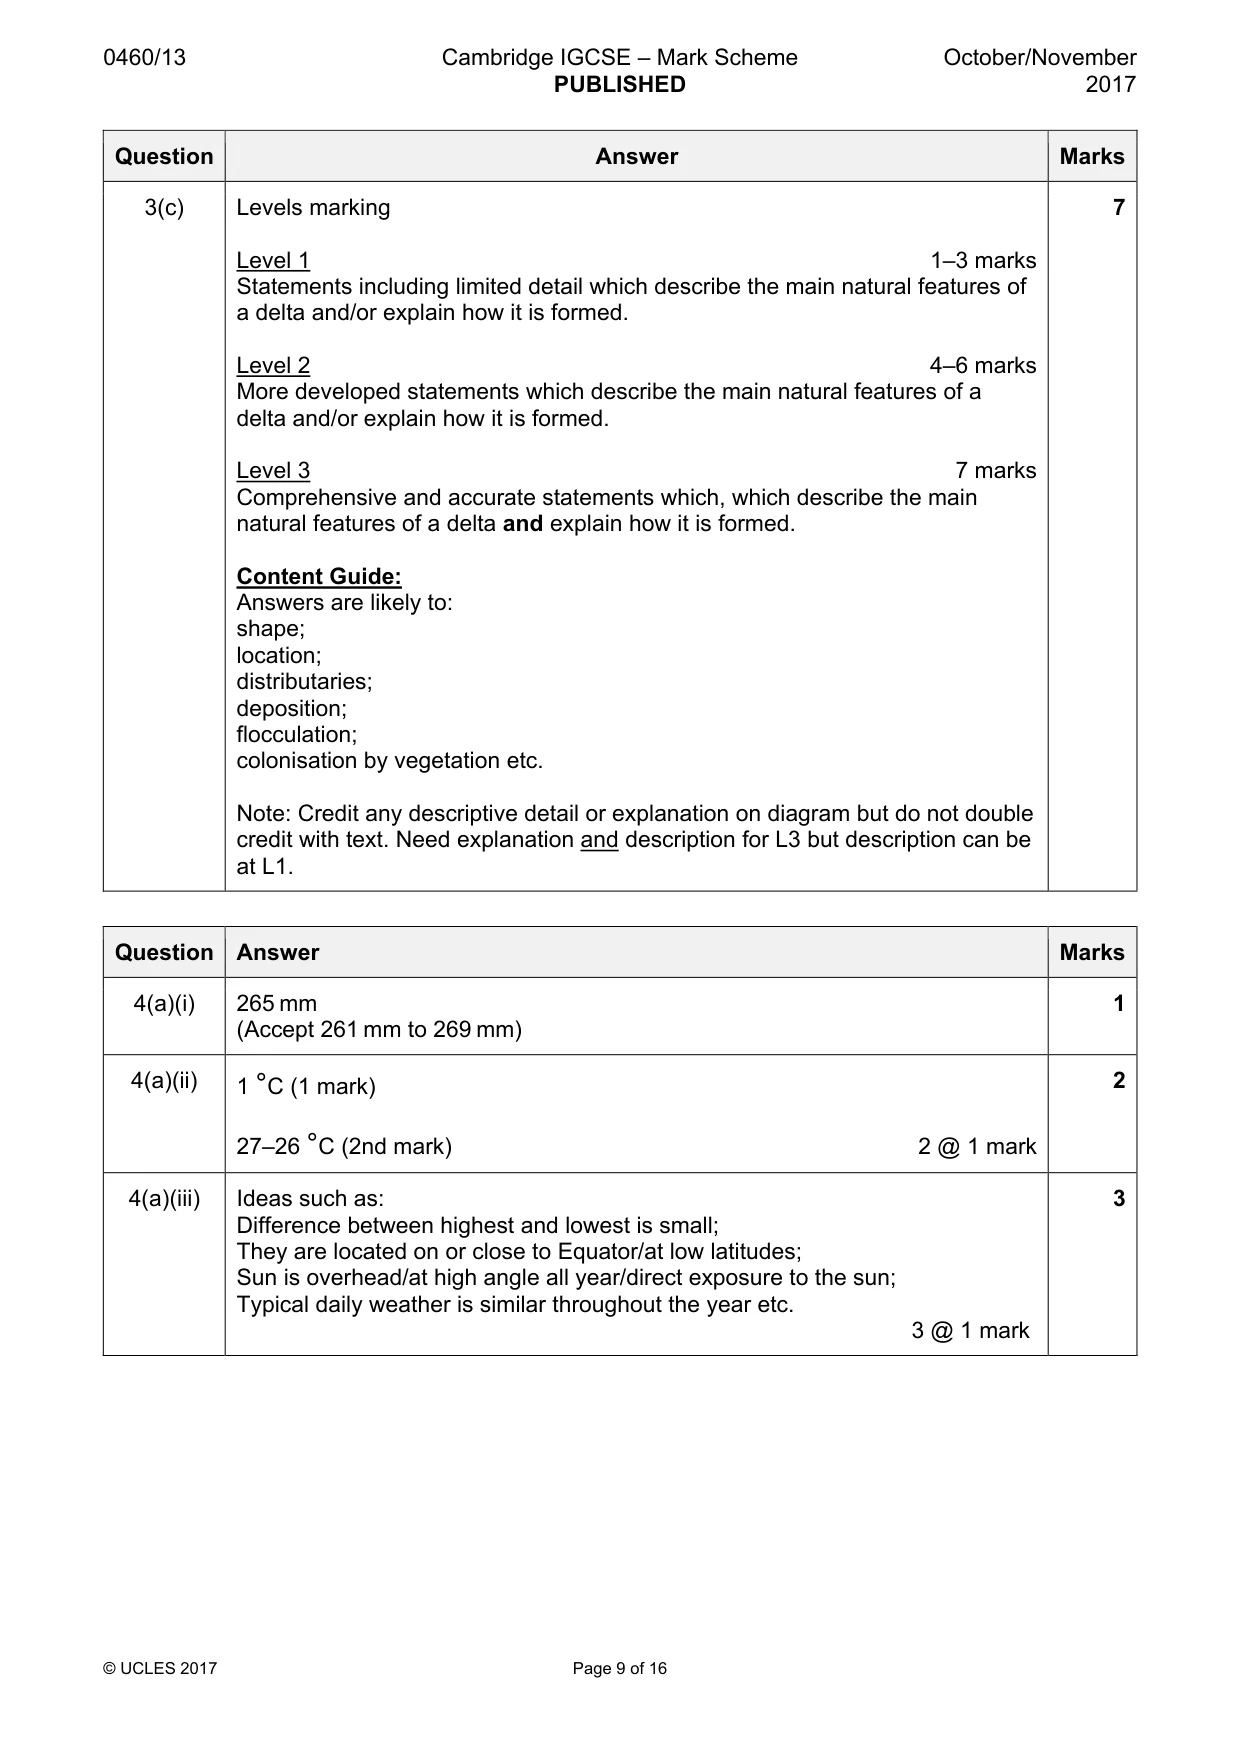
0460/13 Cambridge IGCSE – Mark Scheme PUBLISHED October/November 2017 © UCLES 2017 Page 9 of 16 Question Answer Marks 3(c) Levels marking Level 1 1–3 marks Statements including limited detail which describe the main natural features of a delta and/or explain how it is formed. Level 2 4–6 marks More developed statements which describe the main natural features of a delta and/or explain how it is formed. Level 3 7 marks Comprehensive and accurate statements which, which describe the main natural features of a delta and explain how it is formed. Content Guide: Answers are likely to: shape; location; distributaries; deposition; flocculation; colonisation by vegetation etc. Note: Credit any descriptive detail or explanation on diagram but do not double credit with text. Need explanation and description for L3 but description can be at L1. 7 Question Answer Marks 4(a)(i) 265 mm (Accept 261 mm to 269 mm) 1 4(a)(ii) 1 °C (1 mark) 27–26 °C (2nd mark) 2 @ 1 mark 2 4(a)(iii) Ideas such as: Difference between highest and lowest is small; They are located on or close to Equator/at low latitudes; Sun is overhead/at high angle all year/direct exposure to the sun; Typical daily weather is similar throughout the year etc. 3 @ 1 mark 3
Mark scheme, page 10
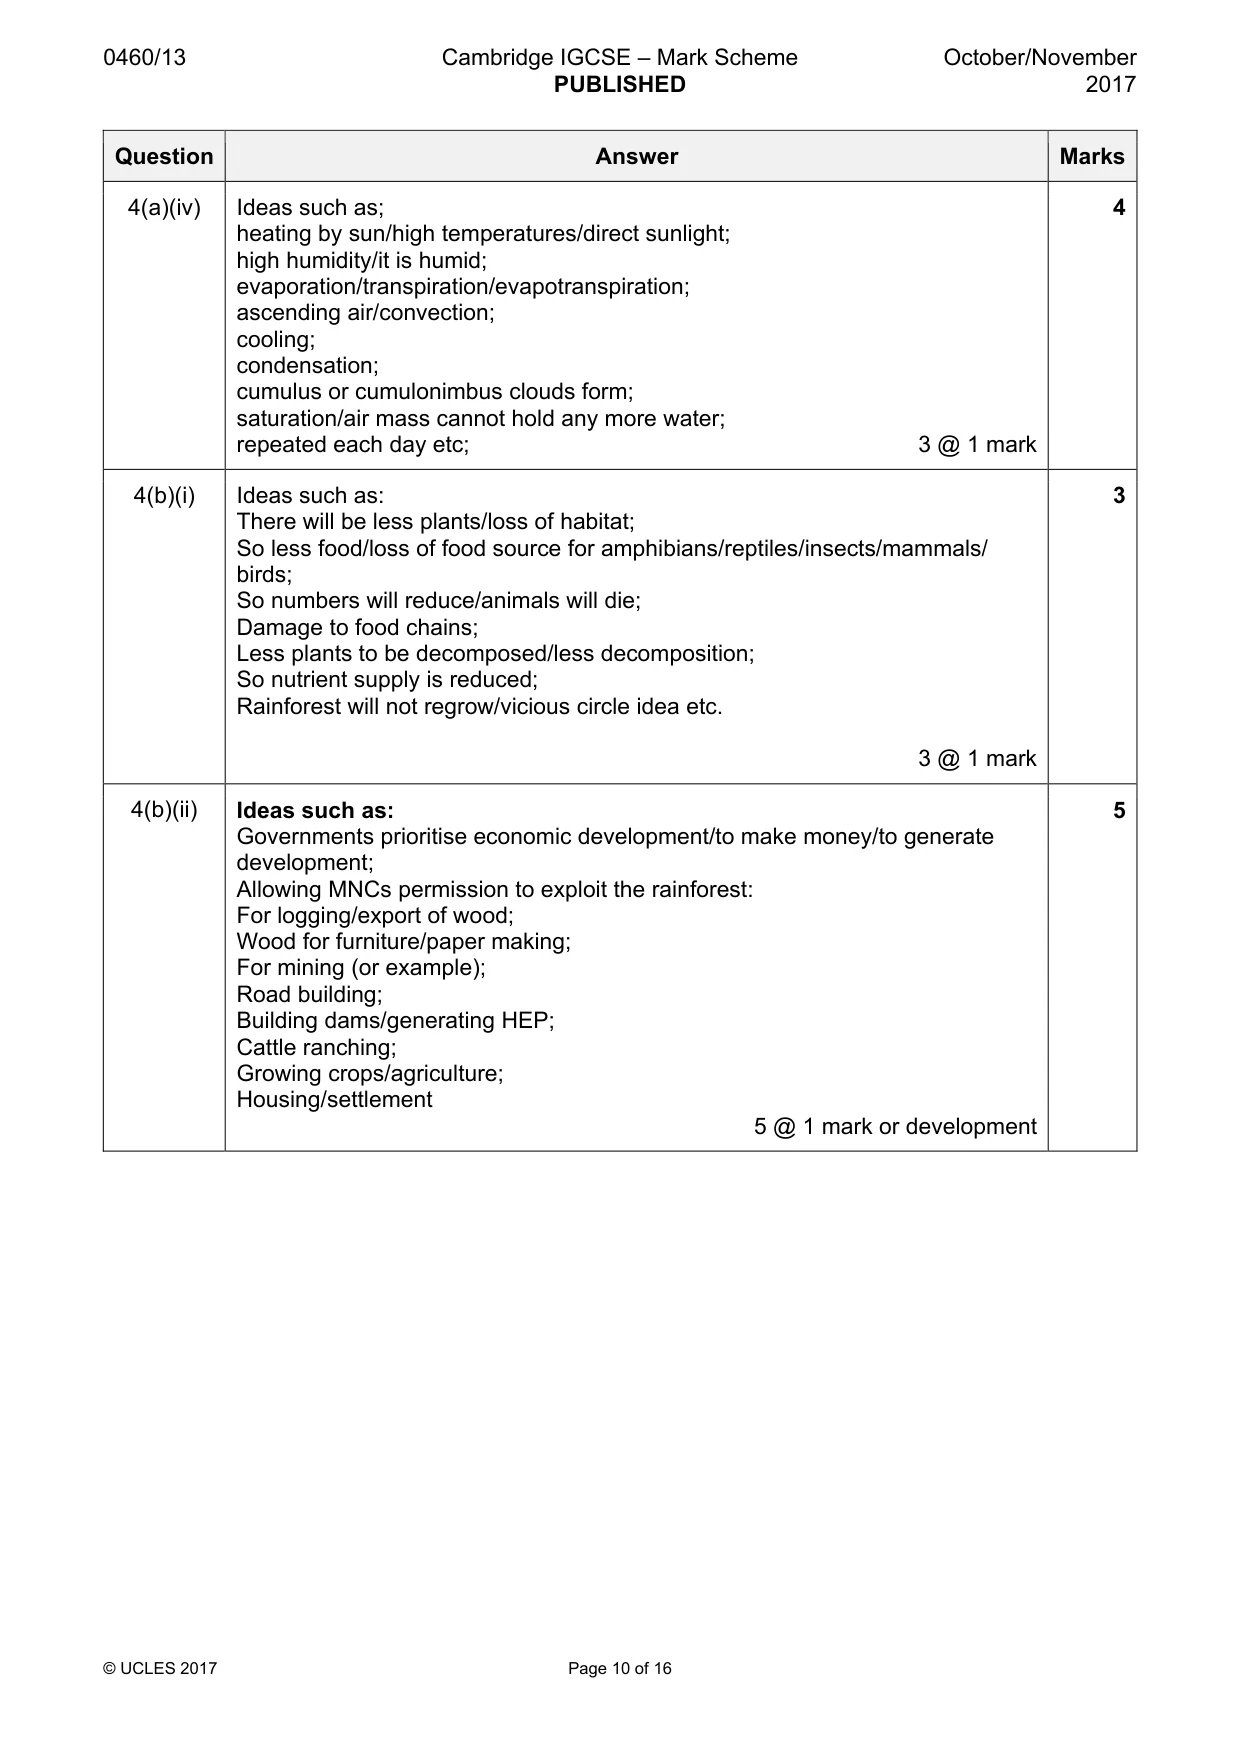
0460/13 Cambridge IGCSE – Mark Scheme PUBLISHED October/November 2017 © UCLES 2017 Page 10 of 16 Question Answer Marks 4(a)(iv) Ideas such as; heating by sun/high temperatures/direct sunlight; high humidity/it is humid; evaporation/transpiration/evapotranspiration; ascending air/convection; cooling; condensation; cumulus or cumulonimbus clouds form; saturation/air mass cannot hold any more water; repeated each day etc; 3 @ 1 mark 4 4(b)(i) Ideas such as: There will be less plants/loss of habitat; So less food/loss of food source for amphibians/reptiles/insects/mammals/ birds; So numbers will reduce/animals will die; Damage to food chains; Less plants to be decomposed/less decomposition; So nutrient supply is reduced; Rainforest will not regrow/vicious circle idea etc. 3 @ 1 mark 3 4(b)(ii) Ideas such as: Governments prioritise economic development/to make money/to generate development; Allowing MNCs permission to exploit the rainforest: For logging/export of wood; Wood for furniture/paper making; For mining (or example); Road building; Building dams/generating HEP; Cattle ranching; Growing crops/agriculture; Housing/settlement 5 @ 1 mark or development 5
Mark scheme, page 11
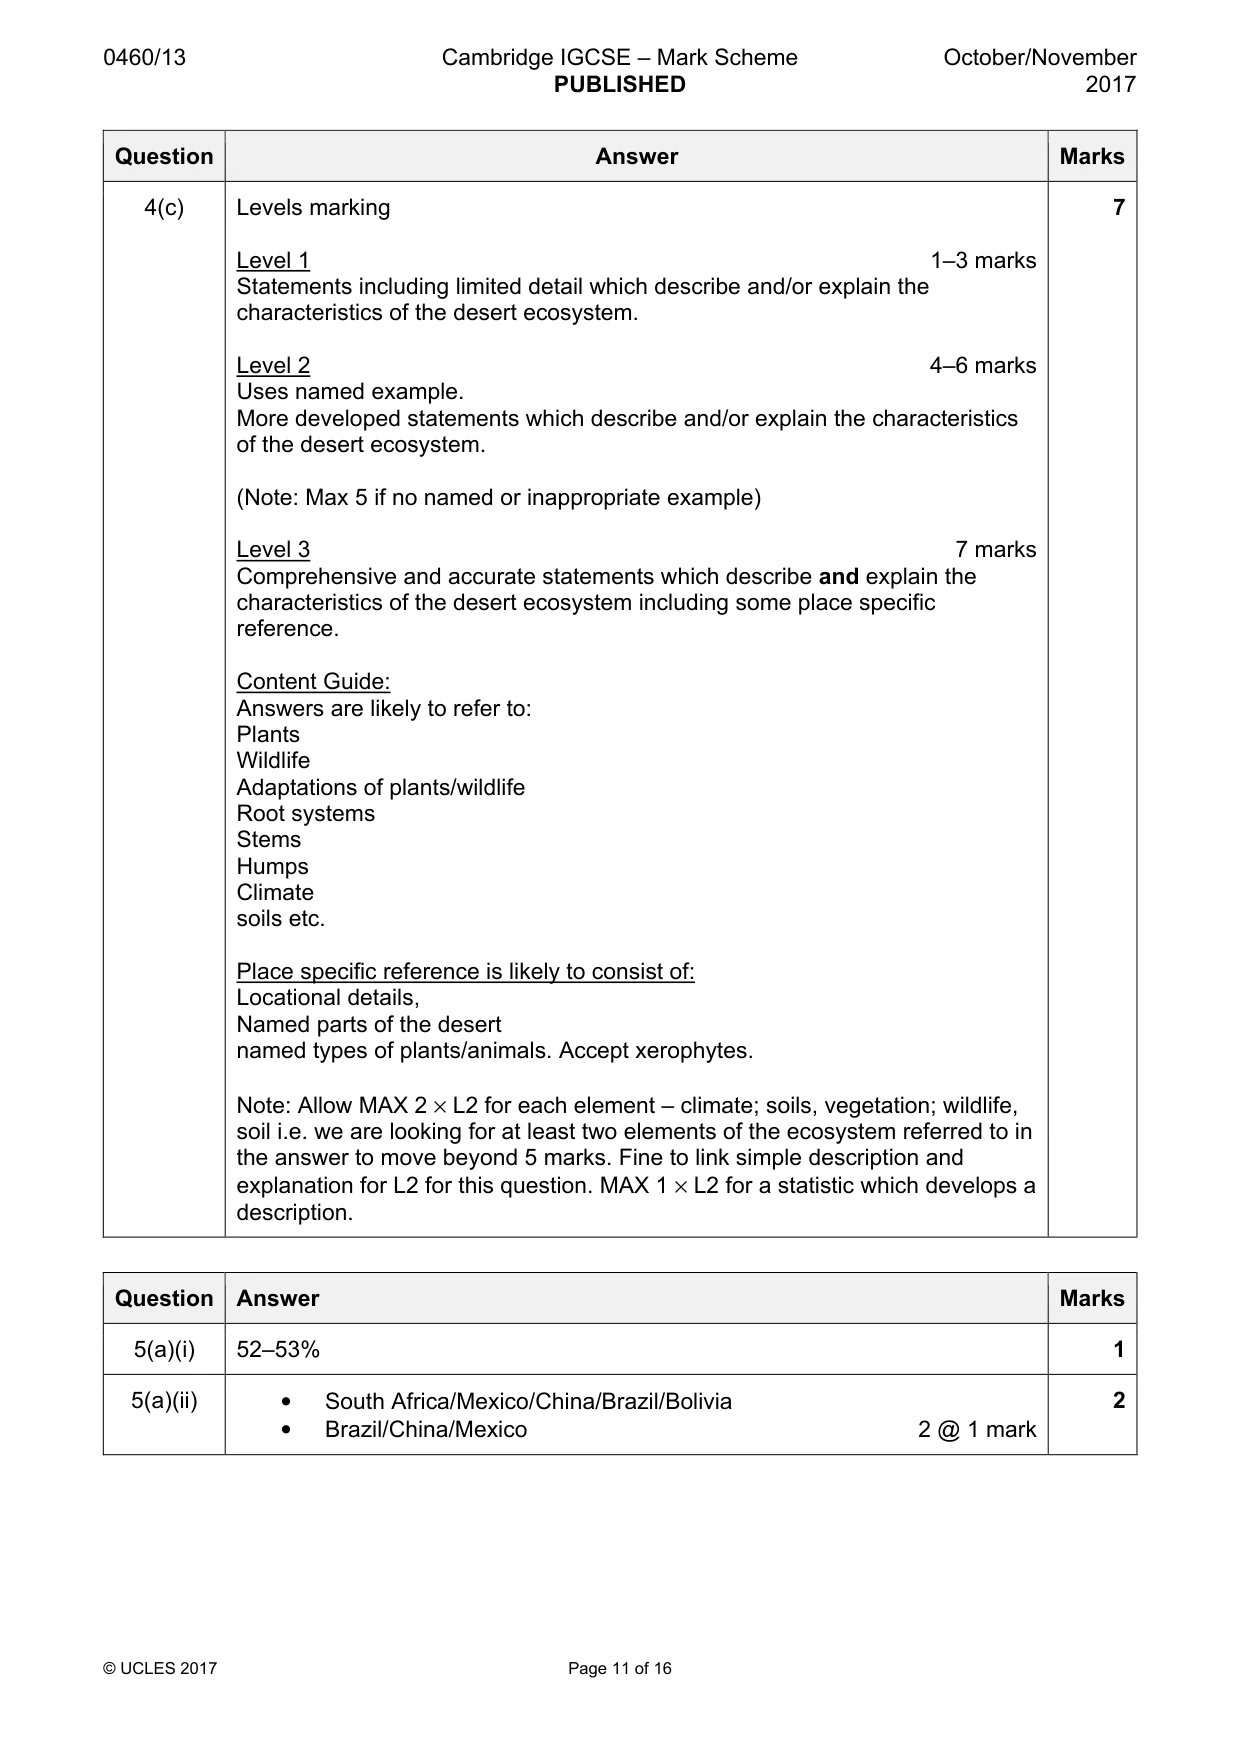
0460/13 Cambridge IGCSE – Mark Scheme PUBLISHED October/November 2017 © UCLES 2017 Page 11 of 16 Question Answer Marks 4(c) Levels marking Level 1 1–3 marks Statements including limited detail which describe and/or explain the characteristics of the desert ecosystem. Level 2 4–6 marks Uses named example. More developed statements which describe and/or explain the characteristics of the desert ecosystem. (Note: Max 5 if no named or inappropriate example) Level 3 7 marks Comprehensive and accurate statements which describe and explain the characteristics of the desert ecosystem including some place specific reference. Content Guide: Answers are likely to refer to: Plants Wildlife Adaptations of plants/wildlife Root systems Stems Humps Climate soils etc. Place specific reference is likely to consist of: Locational details, Named parts of the desert named types of plants/animals. Accept xerophytes. Note: Allow MAX 2 × L2 for each element – climate; soils, vegetation; wildlife, soil i.e. we are looking for at least two elements of the ecosystem referred to in the answer to move beyond 5 marks. Fine to link simple description and explanation for L2 for this question. MAX 1 × L2 for a statistic which develops a description. 7 Question Answer Marks 5(a)(i) 52–53% 1 5(a)(ii) • South Africa/Mexico/China/Brazil/Bolivia • Brazil/China/Mexico 2 @ 1 mark 2
Mark scheme, page 12
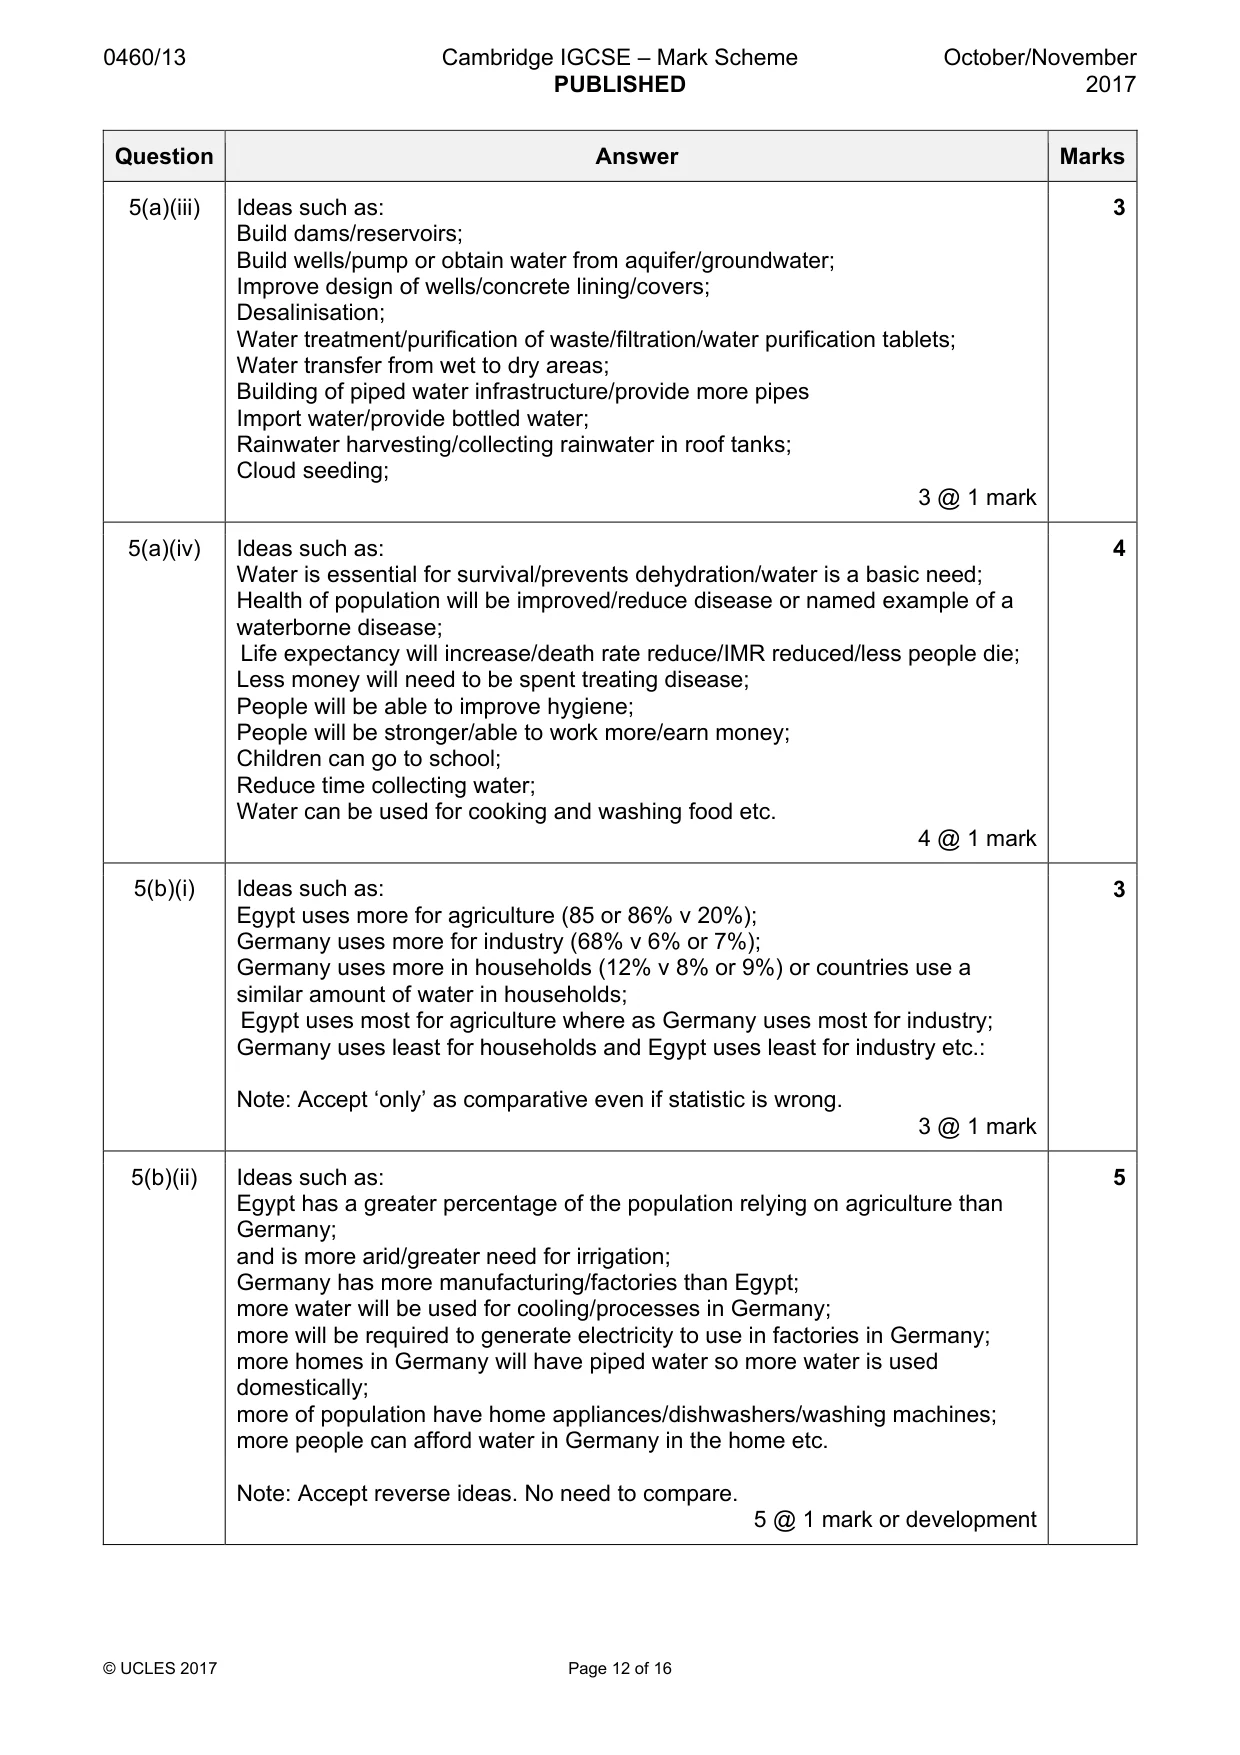
0460/13 Cambridge IGCSE – Mark Scheme PUBLISHED October/November 2017 © UCLES 2017 Page 12 of 16 Question Answer Marks 5(a)(iii) Ideas such as: Build dams/reservoirs; Build wells/pump or obtain water from aquifer/groundwater; Improve design of wells/concrete lining/covers; Desalinisation; Water treatment/purification of waste/filtration/water purification tablets; Water transfer from wet to dry areas; Building of piped water infrastructure/provide more pipes Import water/provide bottled water; Rainwater harvesting/collecting rainwater in roof tanks; Cloud seeding; 3 @ 1 mark 3 5(a)(iv) Ideas such as: Water is essential for survival/prevents dehydration/water is a basic need; Health of population will be improved/reduce disease or named example of a waterborne disease; Life expectancy will increase/death rate reduce/IMR reduced/less people die; Less money will need to be spent treating disease; People will be able to improve hygiene; People will be stronger/able to work more/earn money; Children can go to school; Reduce time collecting water; Water can be used for cooking and washing food etc. 4 @ 1 mark 4 5(b)(i) Ideas such as: Egypt uses more for agriculture (85 or 86% v 20%); Germany uses more for industry (68% v 6% or 7%); Germany uses more in households (12% v 8% or 9%) or countries use a similar amount of water in households; Egypt uses most for agriculture where as Germany uses most for industry; Germany uses least for households and Egypt uses least for industry etc.: Note: Accept ‘only’ as comparative even if statistic is wrong. 3 @ 1 mark 3 5(b)(ii) Ideas such as: Egypt has a greater percentage of the population relying on agriculture than Germany; and is more arid/greater need for irrigation; Germany has more manufacturing/factories than Egypt; more water will be used for cooling/processes in Germany; more will be required to generate electricity to use in factories in Germany; more homes in Germany will have piped water so more water is used domestically; more of population have home appliances/dishwashers/washing machines; more people can afford water in Germany in the home etc. Note: Accept reverse ideas. No need to compare. 5 @ 1 mark or development 5
Mark scheme, page 13
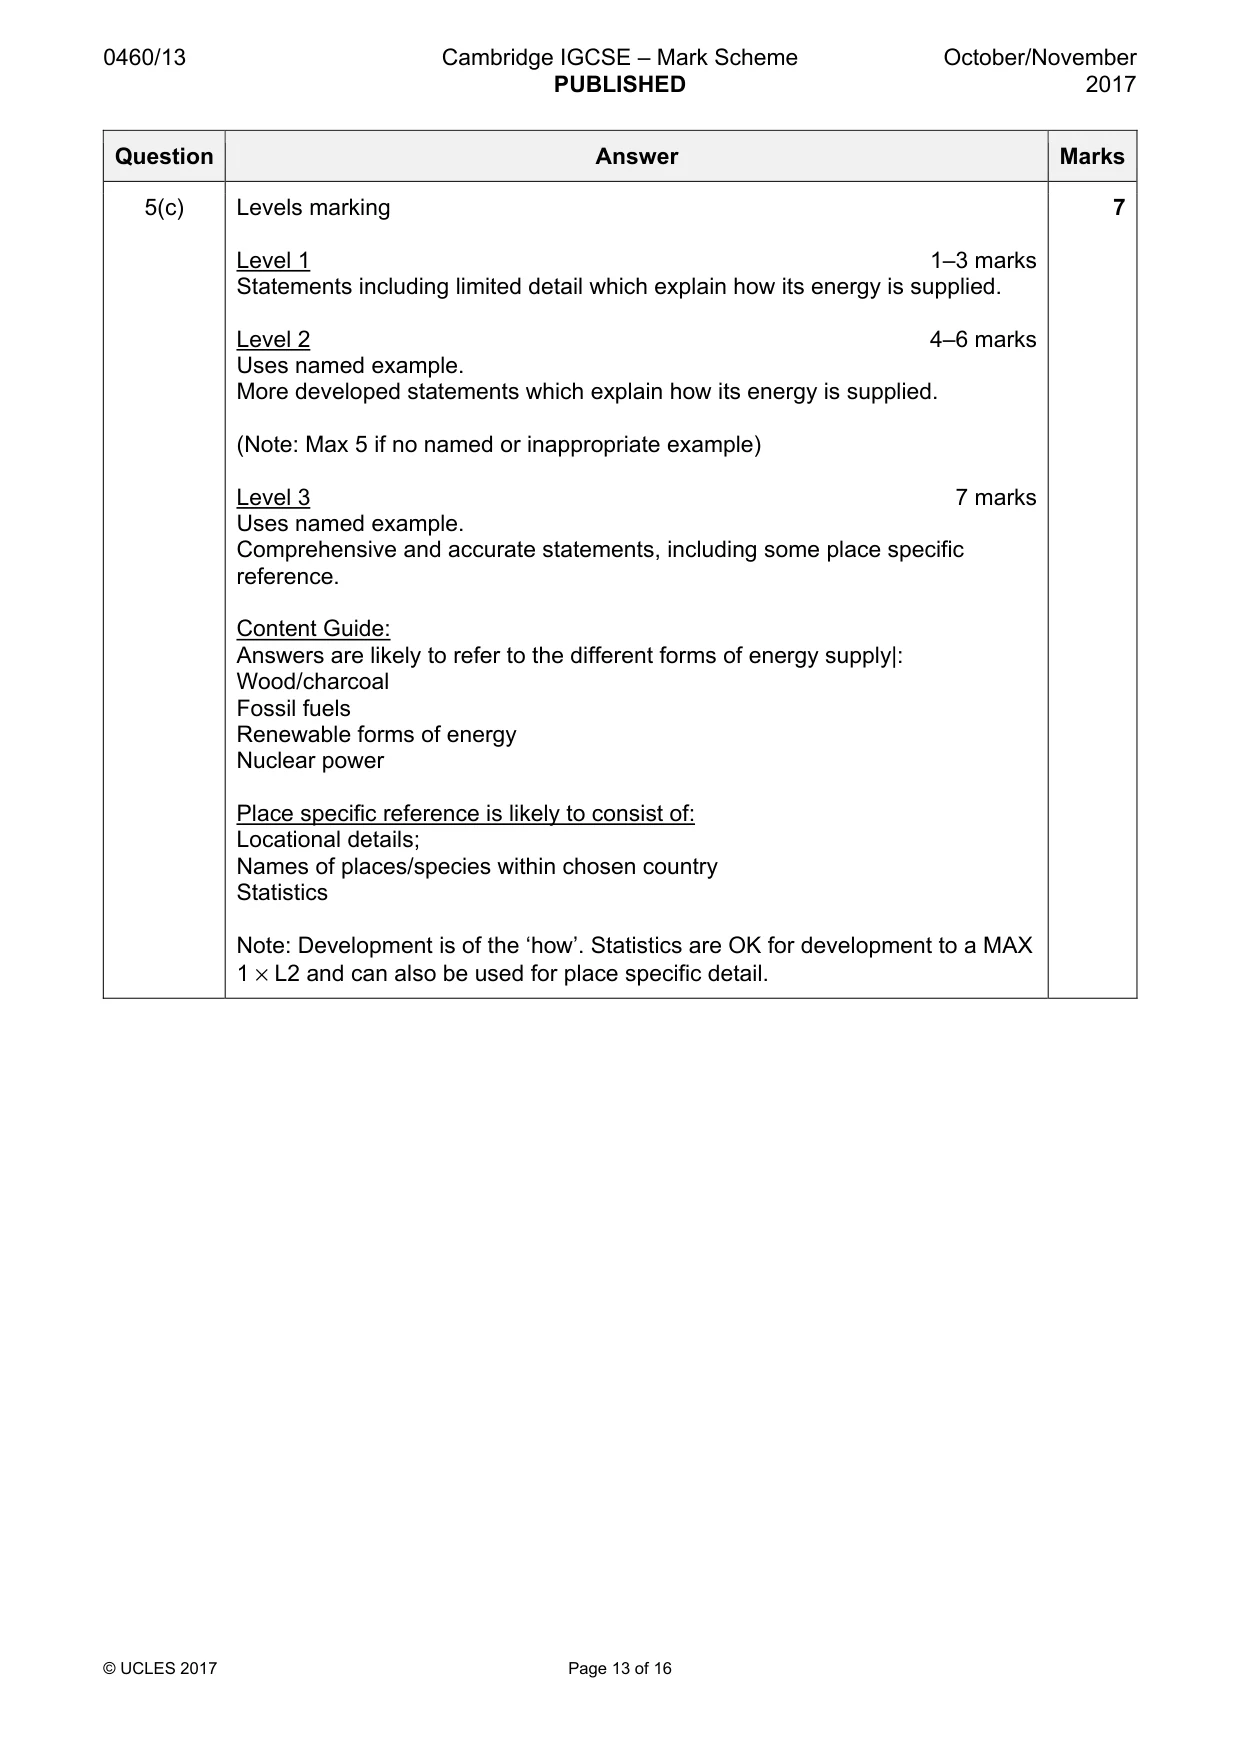
0460/13 Cambridge IGCSE – Mark Scheme PUBLISHED October/November 2017 © UCLES 2017 Page 13 of 16 Question Answer Marks 5(c) Levels marking Level 1 1–3 marks Statements including limited detail which explain how its energy is supplied. Level 2 4–6 marks Uses named example. More developed statements which explain how its energy is supplied. (Note: Max 5 if no named or inappropriate example) Level 3 7 marks Uses named example. Comprehensive and accurate statements, including some place specific reference. Content Guide: Answers are likely to refer to the different forms of energy supply|: Wood/charcoal Fossil fuels Renewable forms of energy Nuclear power Place specific reference is likely to consist of: Locational details; Names of places/species within chosen country Statistics Note: Development is of the ‘how’. Statistics are OK for development to a MAX 1 × L2 and can also be used for place specific detail. 7
Mark scheme, page 14
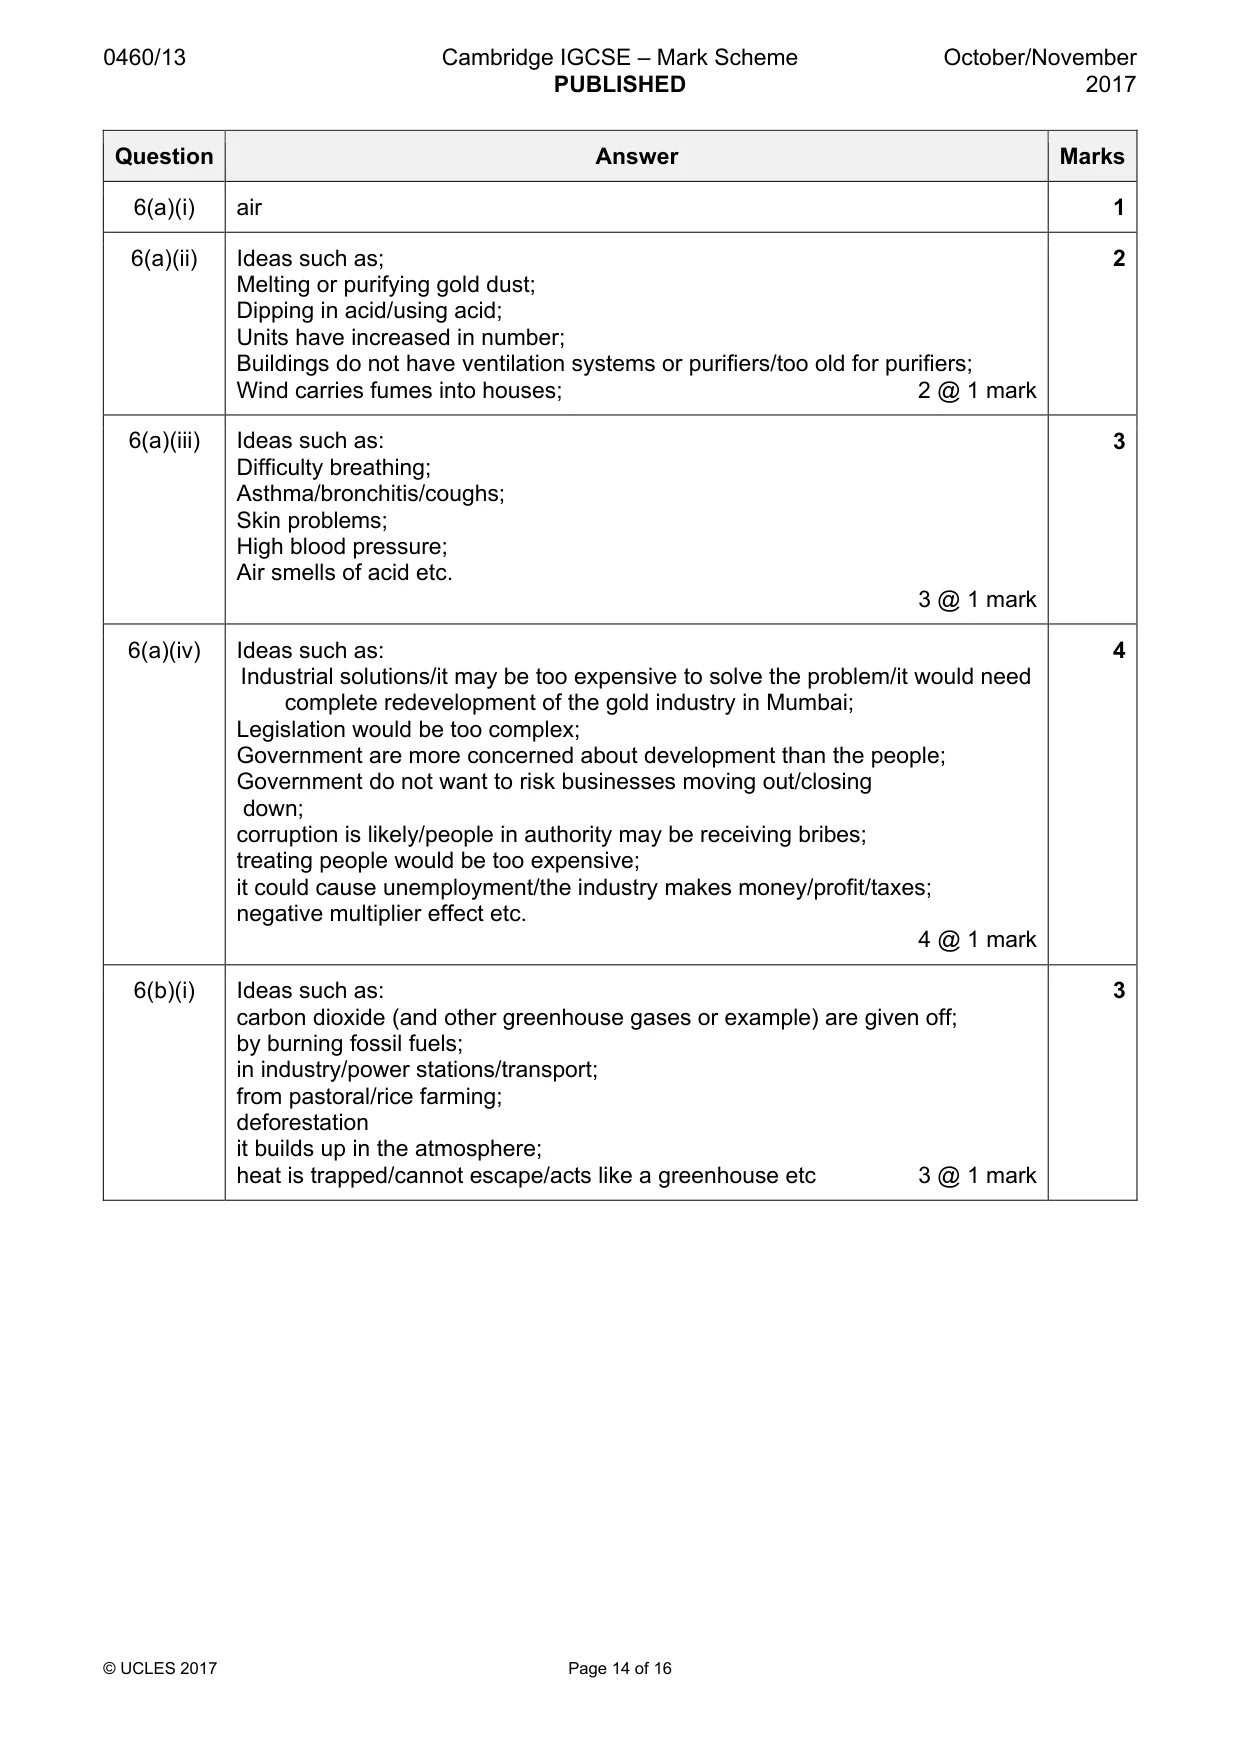
0460/13 Cambridge IGCSE – Mark Scheme PUBLISHED October/November 2017 © UCLES 2017 Page 14 of 16 Question Answer Marks 6(a)(i) air 1 6(a)(ii) Ideas such as; Melting or purifying gold dust; Dipping in acid/using acid; Units have increased in number; Buildings do not have ventilation systems or purifiers/too old for purifiers; Wind carries fumes into houses; 2 @ 1 mark 2 6(a)(iii) Ideas such as: Difficulty breathing; Asthma/bronchitis/coughs; Skin problems; High blood pressure; Air smells of acid etc. 3 @ 1 mark 3 6(a)(iv) Ideas such as: Industrial solutions/it may be too expensive to solve the problem/it would need complete redevelopment of the gold industry in Mumbai; Legislation would be too complex; Government are more concerned about development than the people; Government do not want to risk businesses moving out/closing down; corruption is likely/people in authority may be receiving bribes; treating people would be too expensive; it could cause unemployment/the industry makes money/profit/taxes; negative multiplier effect etc. 4 @ 1 mark 4 6(b)(i) Ideas such as: carbon dioxide (and other greenhouse gases or example) are given off; by burning fossil fuels; in industry/power stations/transport; from pastoral/rice farming; deforestation it builds up in the atmosphere; heat is trapped/cannot escape/acts like a greenhouse etc 3 @ 1 mark 3
Mark scheme, page 15
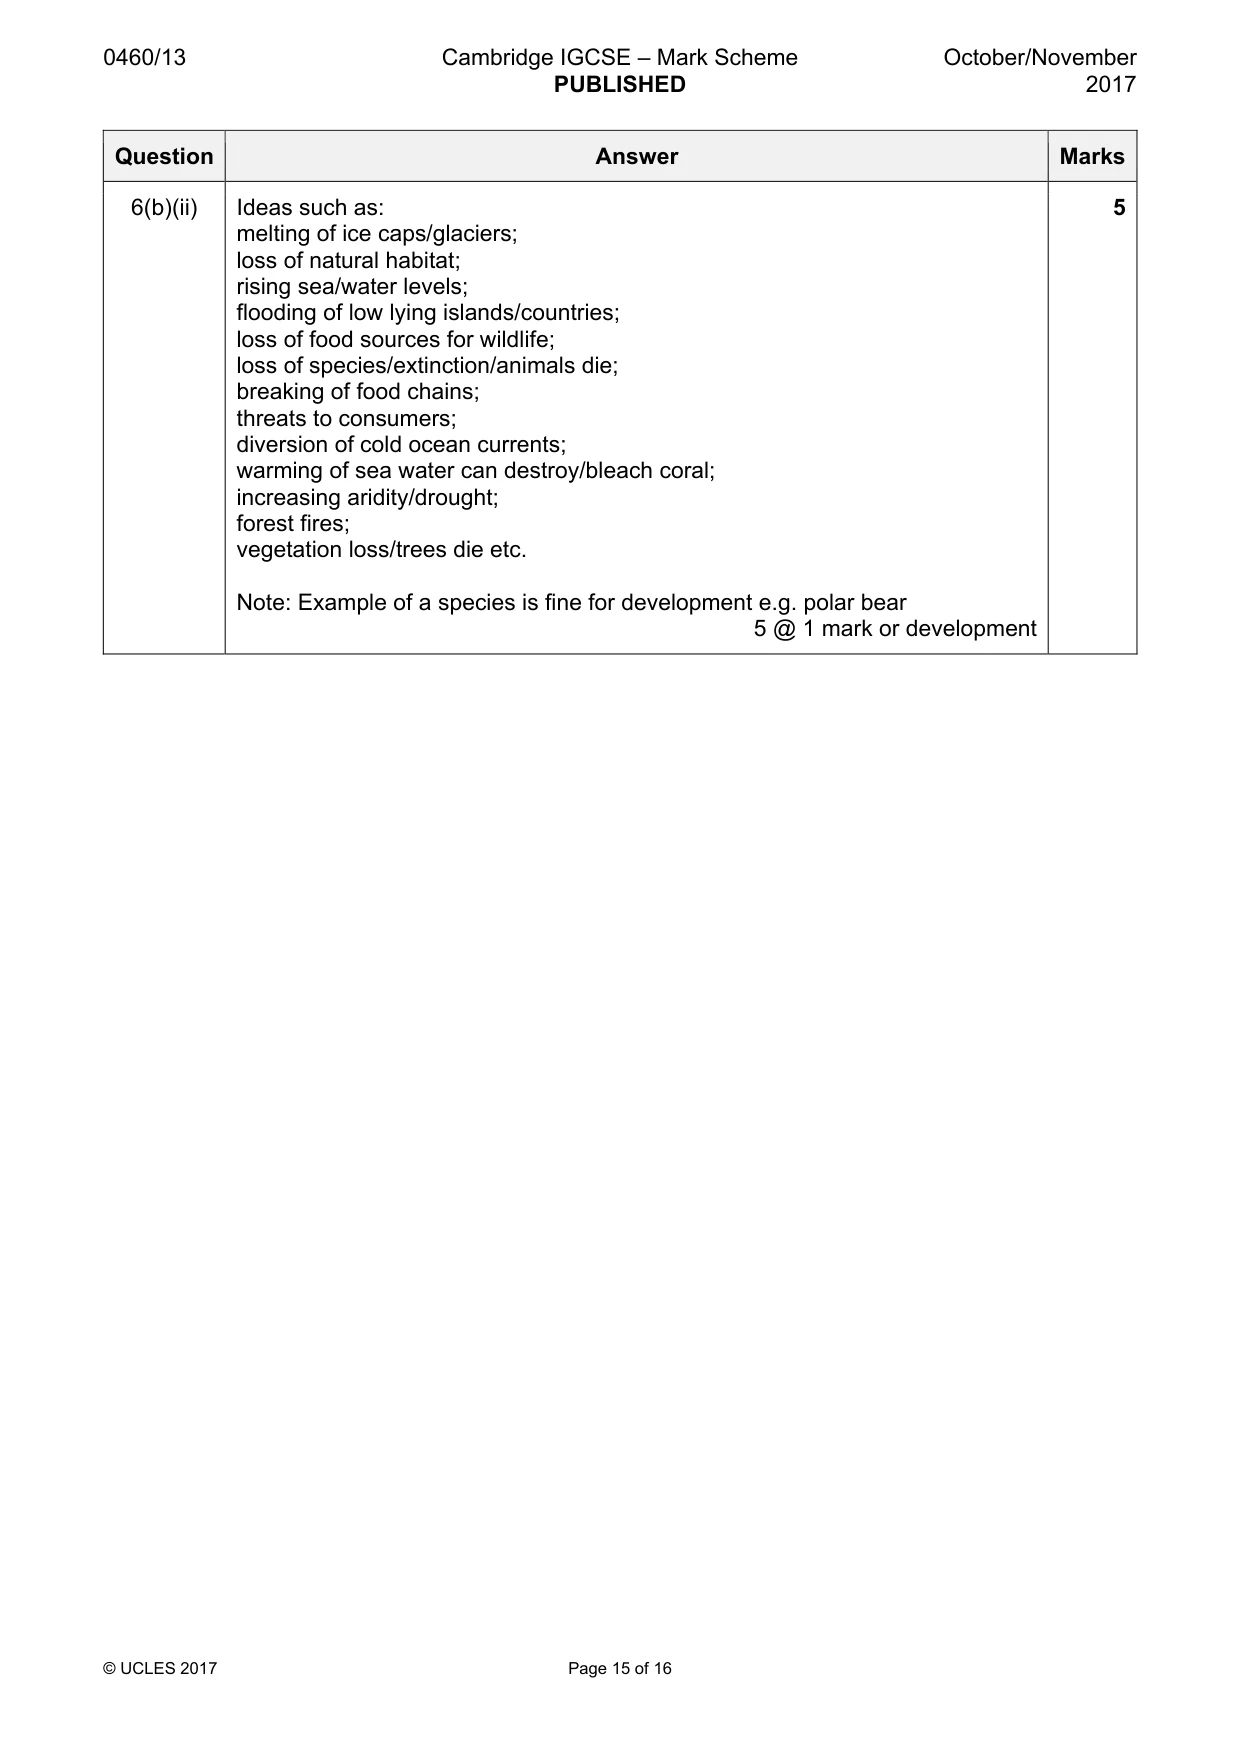
0460/13 Cambridge IGCSE – Mark Scheme PUBLISHED October/November 2017 © UCLES 2017 Page 15 of 16 Question Answer Marks 6(b)(ii) Ideas such as: melting of ice caps/glaciers; loss of natural habitat; rising sea/water levels; flooding of low lying islands/countries; loss of food sources for wildlife; loss of species/extinction/animals die; breaking of food chains; threats to consumers; diversion of cold ocean currents; warming of sea water can destroy/bleach coral; increasing aridity/drought; forest fires; vegetation loss/trees die etc. Note: Example of a species is fine for development e.g. polar bear 5 @ 1 mark or development 5
Mark scheme, page 16
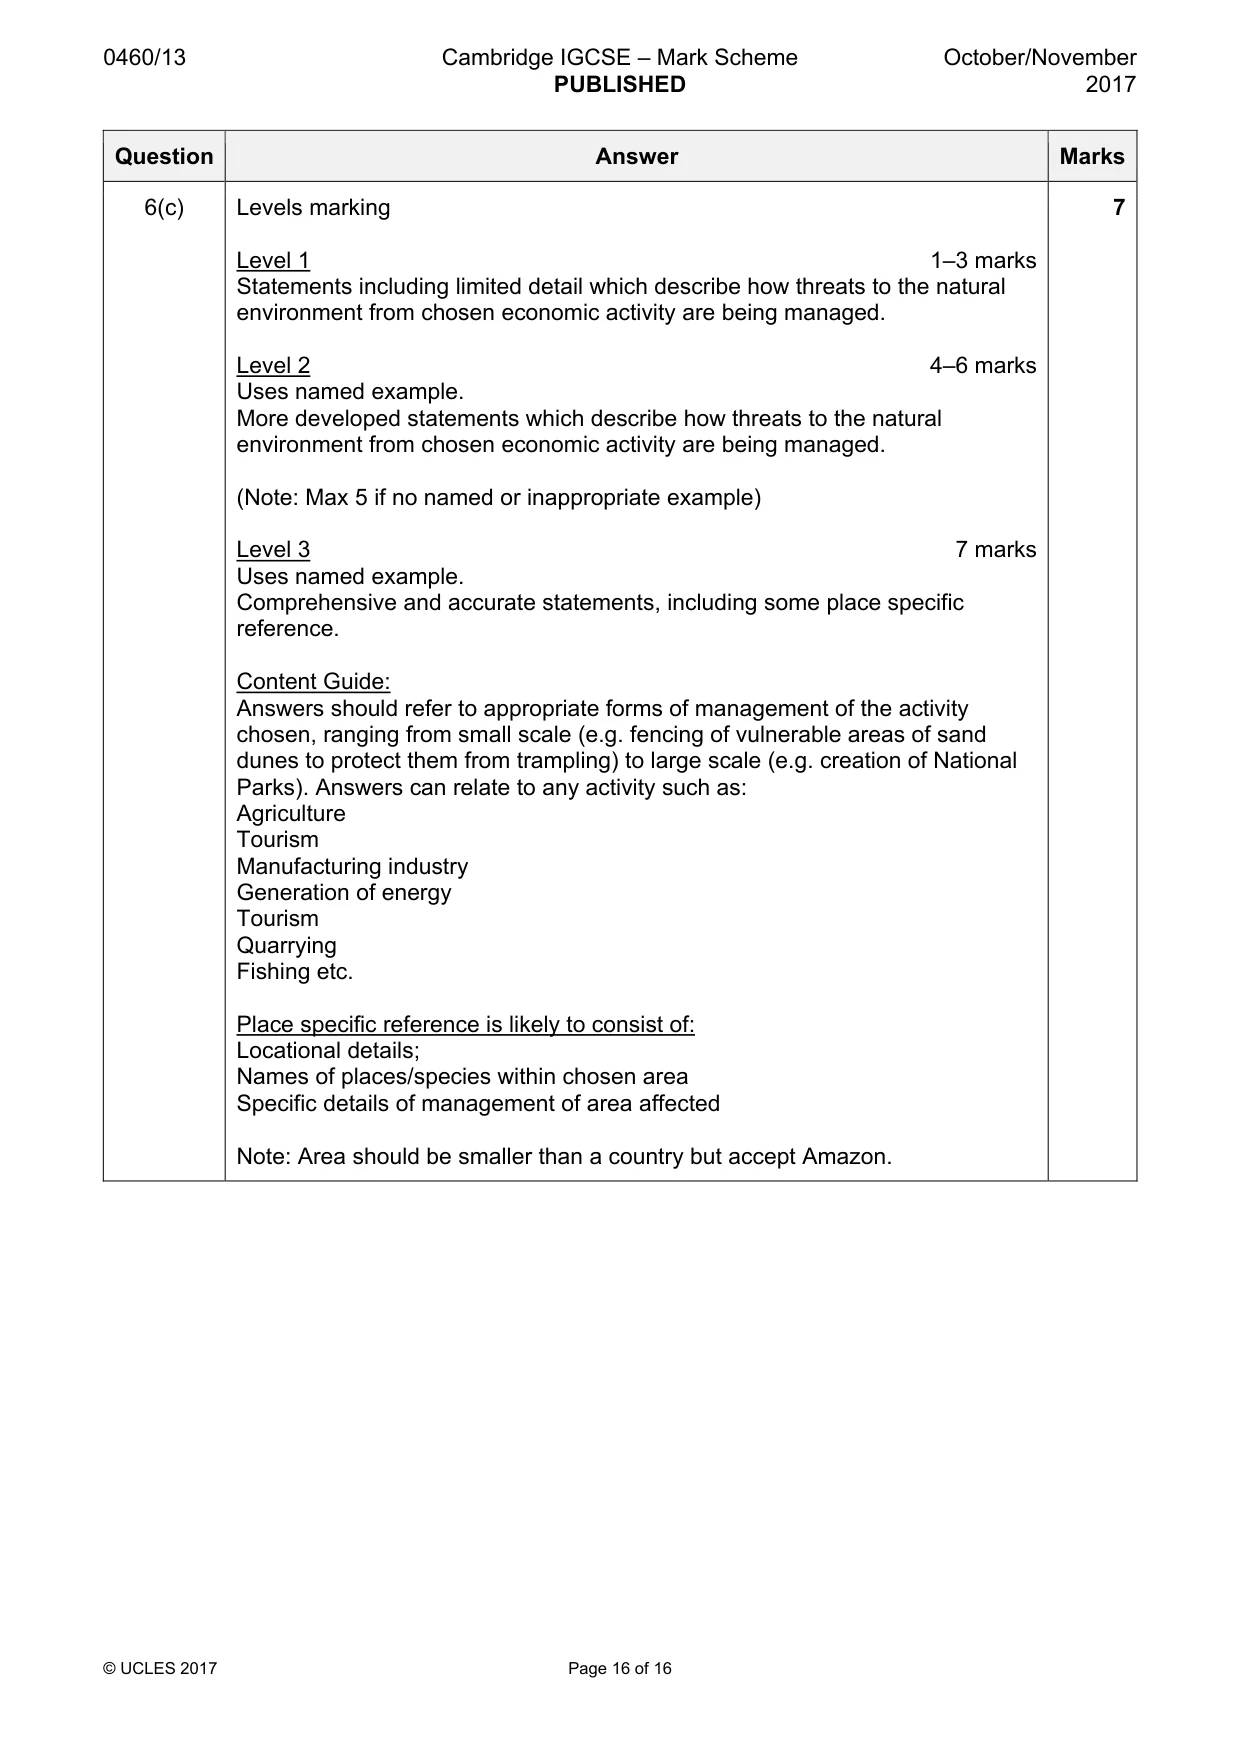
0460/13 Cambridge IGCSE – Mark Scheme PUBLISHED October/November 2017 © UCLES 2017 Page 16 of 16 Question Answer Marks 6(c) Levels marking Level 1 1–3 marks Statements including limited detail which describe how threats to the natural environment from chosen economic activity are being managed. Level 2 4–6 marks Uses named example. More developed statements which describe how threats to the natural environment from chosen economic activity are being managed. (Note: Max 5 if no named or inappropriate example) Level 3 7 marks Uses named example. Comprehensive and accurate statements, including some place specific reference. Content Guide: Answers should refer to appropriate forms of management of the activity chosen, ranging from small scale (e.g. fencing of vulnerable areas of sand dunes to protect them from trampling) to large scale (e.g. creation of National Parks). Answers can relate to any activity such as: Agriculture Tourism Manufacturing industry Generation of energy Tourism Quarrying Fishing etc. Place specific reference is likely to consist of: Locational details; Names of places/species within chosen area Specific details of management of area affected Note: Area should be smaller than a country but accept Amazon. 7
What you needed in this session
Cambridge’s own grade thresholds for 2017 Oct/Nov, Paper 1 · Variant 3. A higher threshold means an easier paper — the bar moves with how the cohort did.