Cambridge IGCSE Geography 0460 — 2015 Oct/Nov Paper 1 · Variant 1
0460/11/O/N/15 · 75 marks · ≈84 min
The question paper and its mark scheme, free to read here and free to download. This is Cambridge’s own paper, exactly as it was sat.
Question paper28 pages









Mark scheme15 pages
Answers below. Sit the paper first if you are practising.
Paper as text
Question paper, page 1
This document consists of 28 printed pages and 1 Insert. DC (CW/SW) 98318/5 © UCLES 2015 [Turn over Cambridge International Examinations Cambridge International General Certificate of Secondary Education * 6 2 0 5 0 7 4 4 8 1 * GEOGRAPHY 0460/11 Paper 1 October/November 2015 1 hour 45 minutes Candidates answer on the Question Paper. Additional Materials: Ruler Calculator READ THESE INSTRUCTIONS FIRST Write your Centre number, candidate number and name in the spaces provided. Write in dark blue or black pen. You may use an HB pencil for any diagrams or graphs. Do not use staples, paper clips, glue or correction fluid. DO NOT WRITE IN ANY BARCODES. Write your answer to each question in the space provided. If additional space is required, you should use the lined pages at the end of this booklet. The question number(s) must be clearly shown. Answer three questions. The Insert contains Photographs A, B and C for Question 3 and Fig. 12 for Question 6. The Insert is not required by the Examiner. Sketch maps and diagrams should be drawn whenever they serve to illustrate an answer. At the end of the examination, fasten all your work securely together. The number of marks is given in brackets [ ] at the end of each question or part question. The syllabus is approved for use in England, Wales and Northern Ireland as a Cambridge International Level 1/Level 2 Certificate.
Question paper, page 2
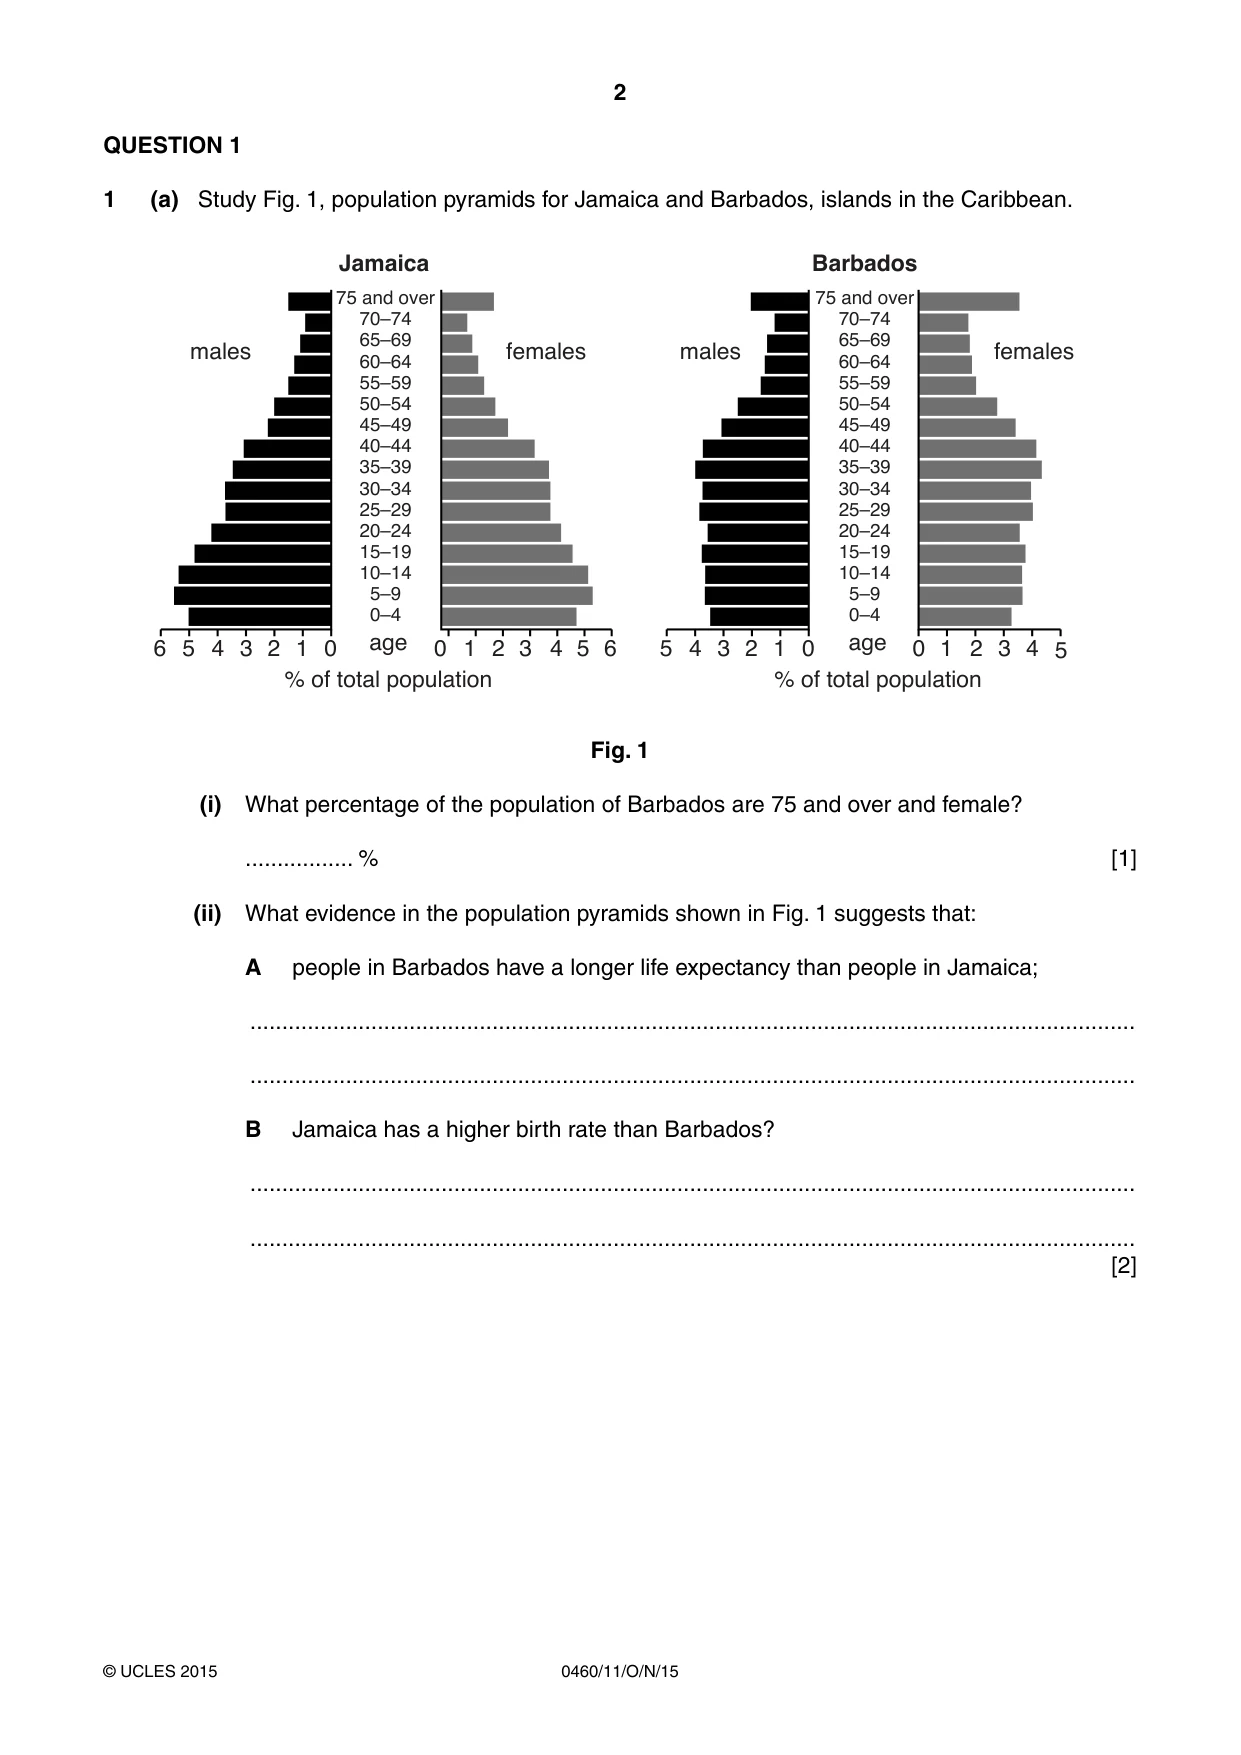
2 0460/11/O/N/15 © UCLES 2015 QUESTION 1 1 (a) Study Fig. 1, population pyramids for Jamaica and Barbados, islands in the Caribbean. 75 and over 70–74 65–69 60–64 55–59 50–54 45–49 40–44 35–39 30–34 25–29 20–24 15–19 10–14 5–9 0–4 age % of total population 75 and over 70–74 65–69 60–64 55–59 50–54 45–49 40–44 35–39 30–34 25–29 20–24 15–19 10–14 5–9 0–4 Jamaica Barbados age % of total population 0 0 1 2 3 4 5 6 1 2 3 4 5 6 0 0 1 1 2 2 3 3 4 4 5 5 males females males females Fig. 1 (i) What percentage of the population of Barbados are 75 and over and female? … % [1] (ii) What evidence in the population pyramids shown in Fig. 1 suggests that: A people in Barbados have a longer life expectancy than people in Jamaica; … … B Jamaica has a higher birth rate than Barbados? … … [2]
Question paper, page 3
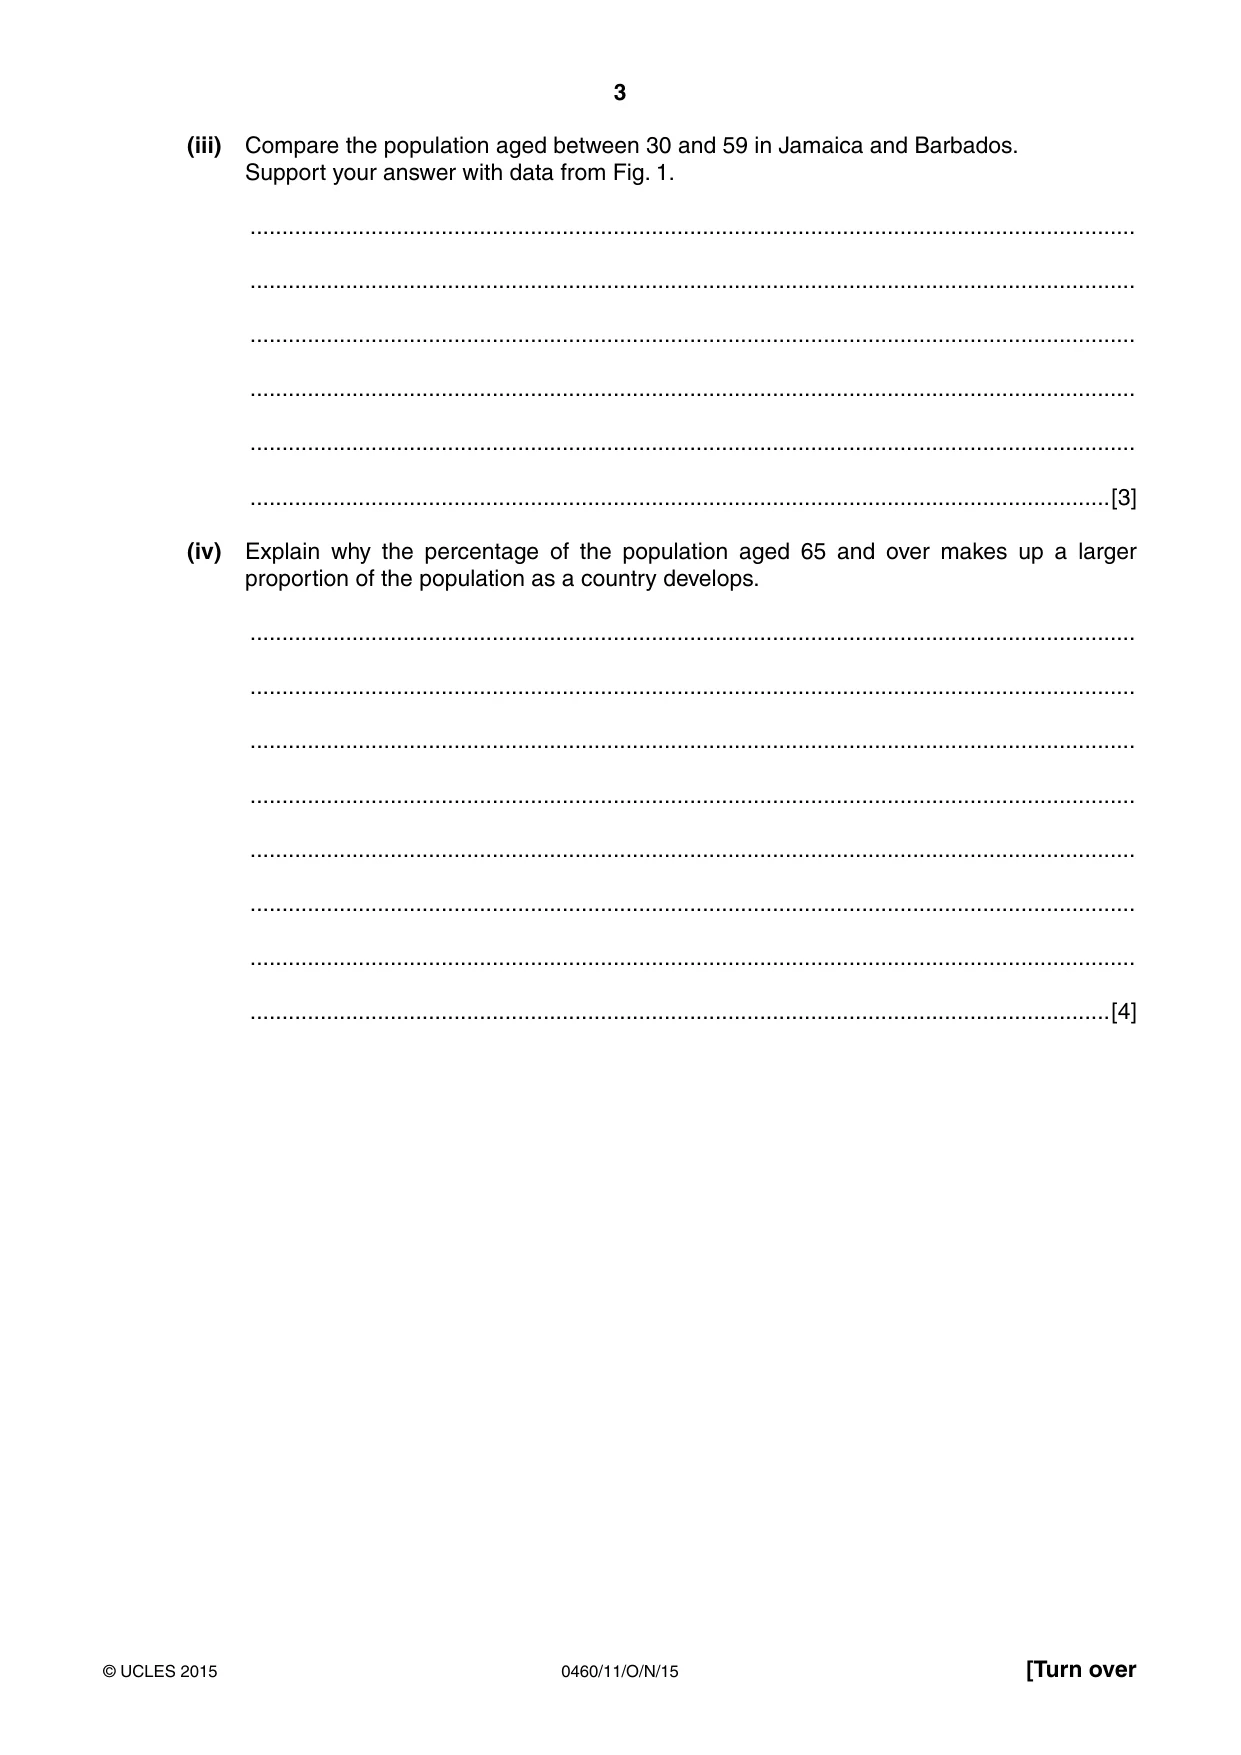
3 0460/11/O/N/15 © UCLES 2015 [Turn over (iii) Compare the population aged between 30 and 59 in Jamaica and Barbados. Support your answer with data from Fig. 1. … … … … … …[3] (iv) Explain why the percentage of the population aged 65 and over makes up a larger proportion of the population as a country develops. … … … … … … … …[4]
Question paper, page 4
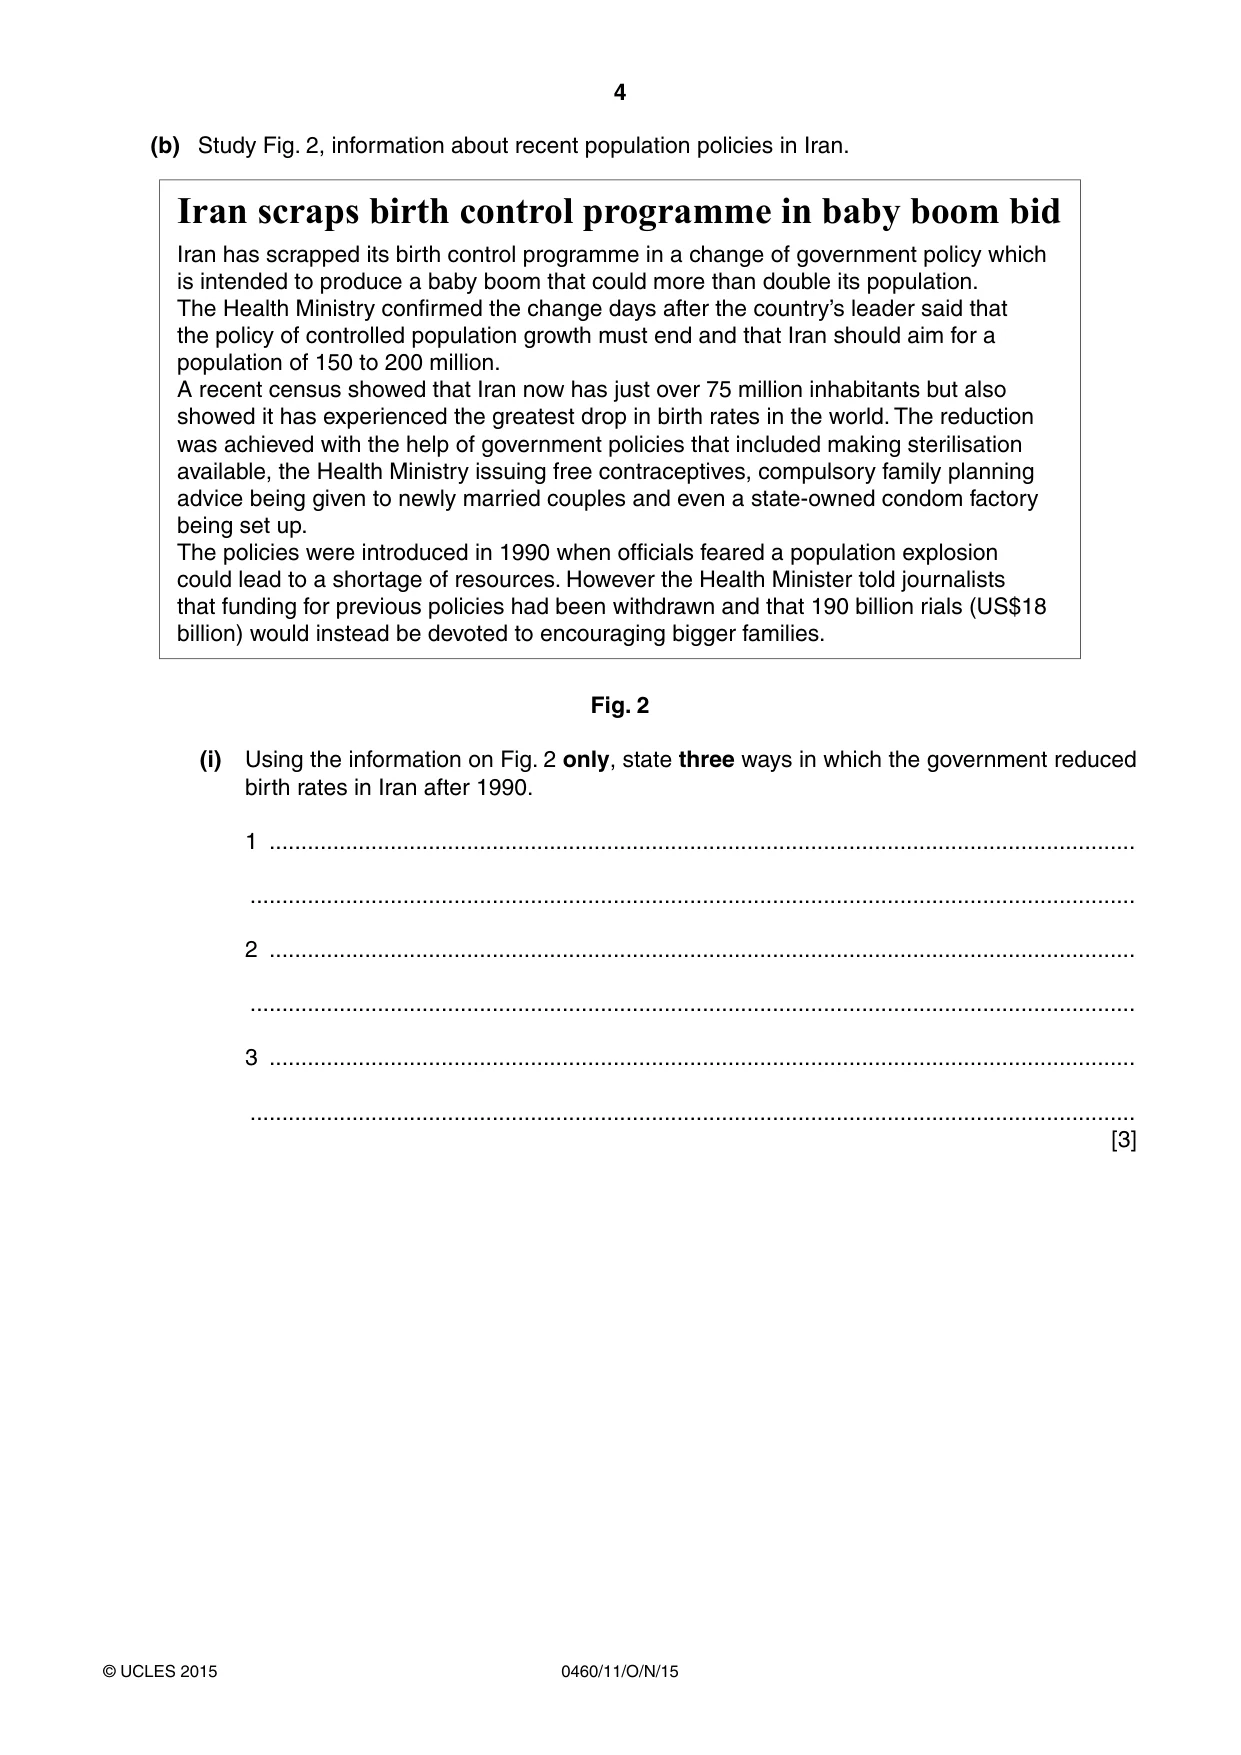
4 0460/11/O/N/15 © UCLES 2015 (b) Study Fig. 2, information about recent population policies in Iran. Iran scraps birth control programme in baby boom bid Iran has scrapped its birth control programme in a change of government policy which is intended to produce a baby boom that could more than double its population. The Health Ministry confirmed the change days after the country’s leader said that the policy of controlled population growth must end and that Iran should aim for a population of 150 to 200 million. A recent census showed that Iran now has just over 75 million inhabitants but also showed it has experienced the greatest drop in birth rates in the world. The reduction was achieved with the help of government policies that included making sterilisation available, the Health Ministry issuing free contraceptives, compulsory family planning advice being given to newly married couples and even a state-owned condom factory being set up. The policies were introduced in 1990 when officials feared a population explosion could lead to a shortage of resources. However the Health Minister told journalists that funding for previous policies had been withdrawn and that 190 billion rials (US$18 billion) would instead be devoted to encouraging bigger families. Fig. 2 (i) Using the information on Fig. 2 only, state three ways in which the government reduced birth rates in Iran after 1990. 1 … … 2 … … 3 … … [3]
Question paper, page 5
5 0460/11/O/N/15 © UCLES 2015 [Turn over (ii) Explain how government policies can be used to increase rates of natural population growth. … … … … … … … … … …[5]
Question paper, page 6
6 0460/11/O/N/15 © UCLES 2015 (c) The governments of some countries are worried by the increasing percentage of old people. For a named country you have studied, describe the problems and benefits caused by an ageing population. Name of country … … … … … … … … … … … … … … …[7] [Total: 25 marks] END OF QUESTION 1
Question paper, page 7
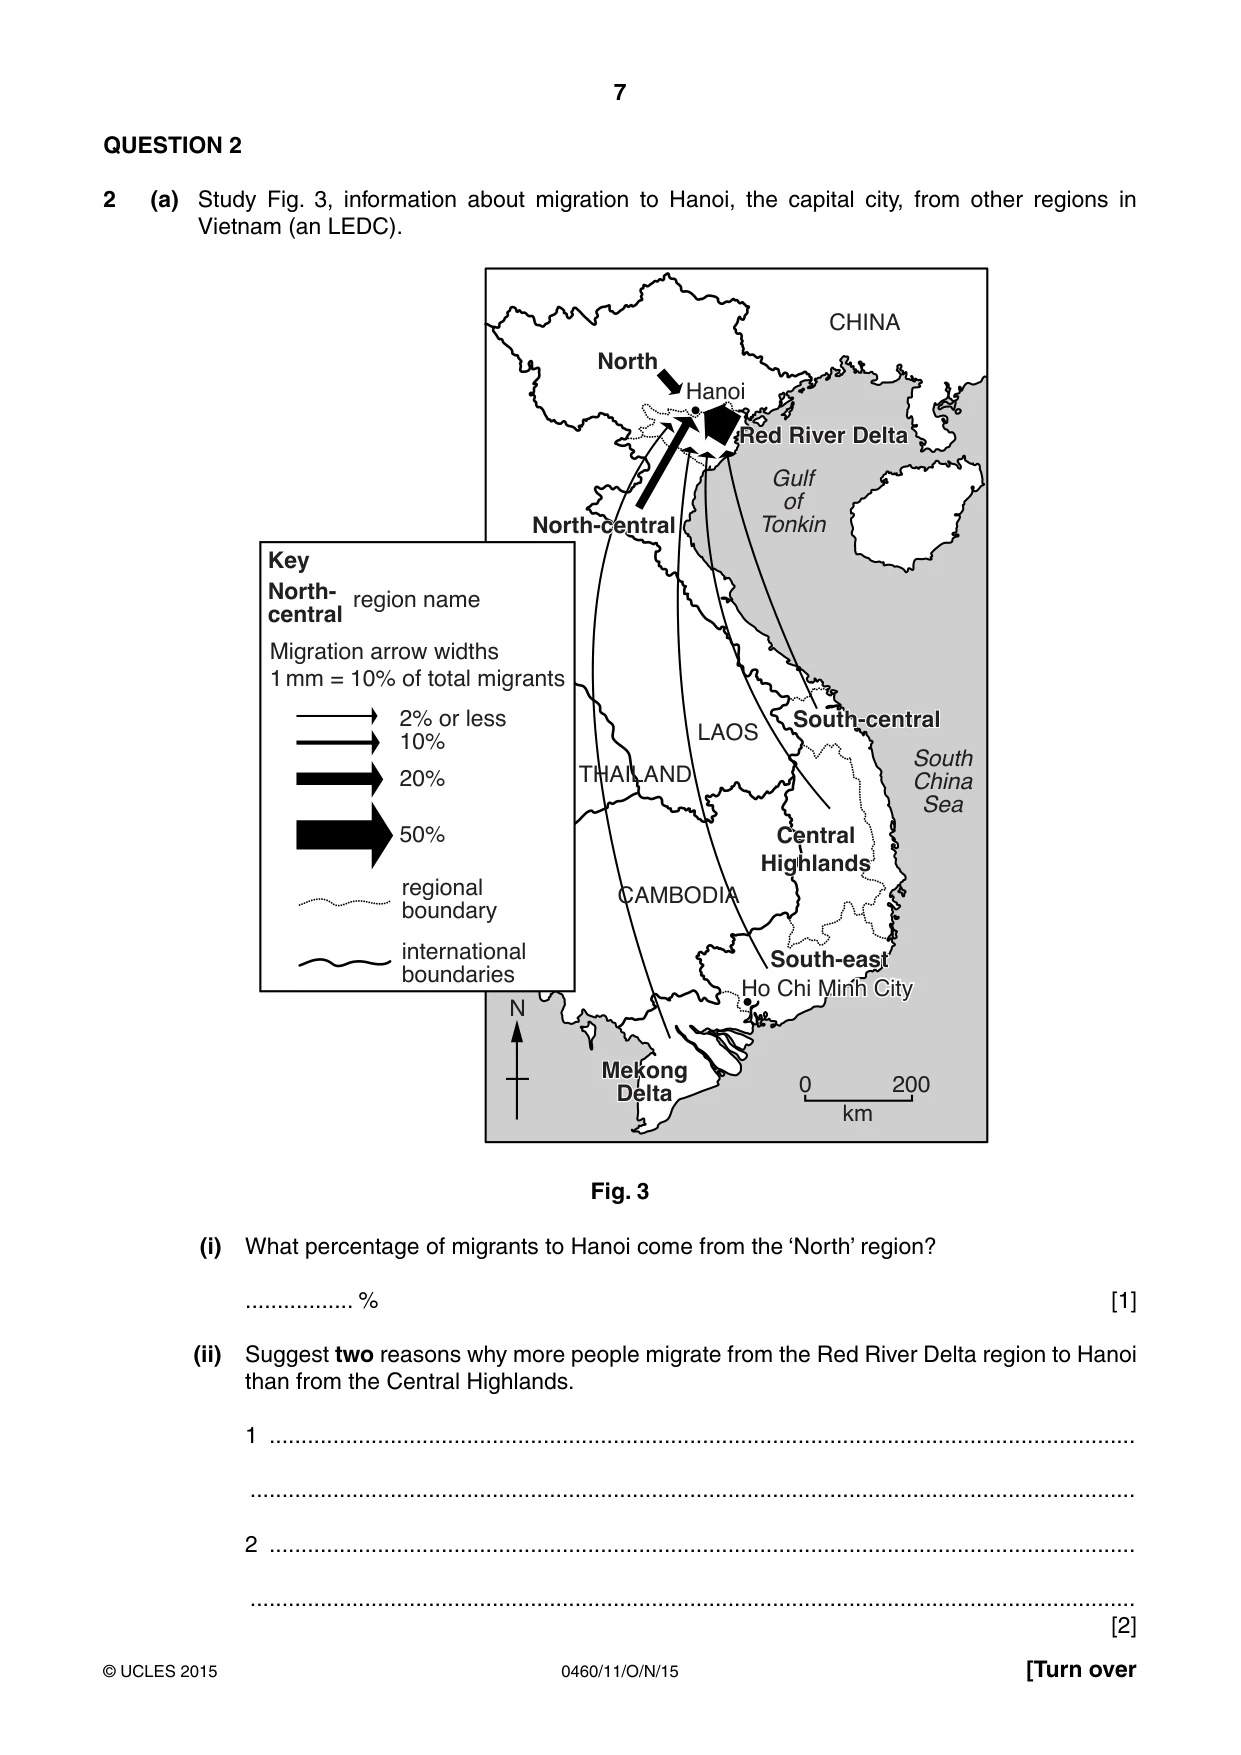
7 0460/11/O/N/15 © UCLES 2015 [Turn over QUESTION 2 2 (a) Study Fig. 3, information about migration to Hanoi, the capital city, from other regions in Vietnam (an LEDC). South China Sea Gulf of Tonkin 0 200 km N regional boundary international boundaries Key North- central region name Migration arrow widths 1 mm = 10% of total migrants 2% or less 10% 20% 50% Hanoi CAMBODIA THAILAND CHINA Ho Chi Minh City LAOS North North-central Red River Delta South-central Central Highlands South-east Mekong Delta Fig. 3 (i) What percentage of migrants to Hanoi come from the ‘North’ region? … % [1] (ii) Suggest two reasons why more people migrate from the Red River Delta region to Hanoi than from the Central Highlands. 1 … … 2 … … [2]
Question paper, page 8
8 0460/11/O/N/15 © UCLES 2015 (iii) Describe three pull factors of LEDC capital cities, such as Hanoi, for people who live in other parts of the country. 1 … … 2 … … 3 … … [3] (iv) Describe and explain the age and sex structure of migrants who move to cities in LEDCs. … … … … … … … …[4]
Question paper, page 9
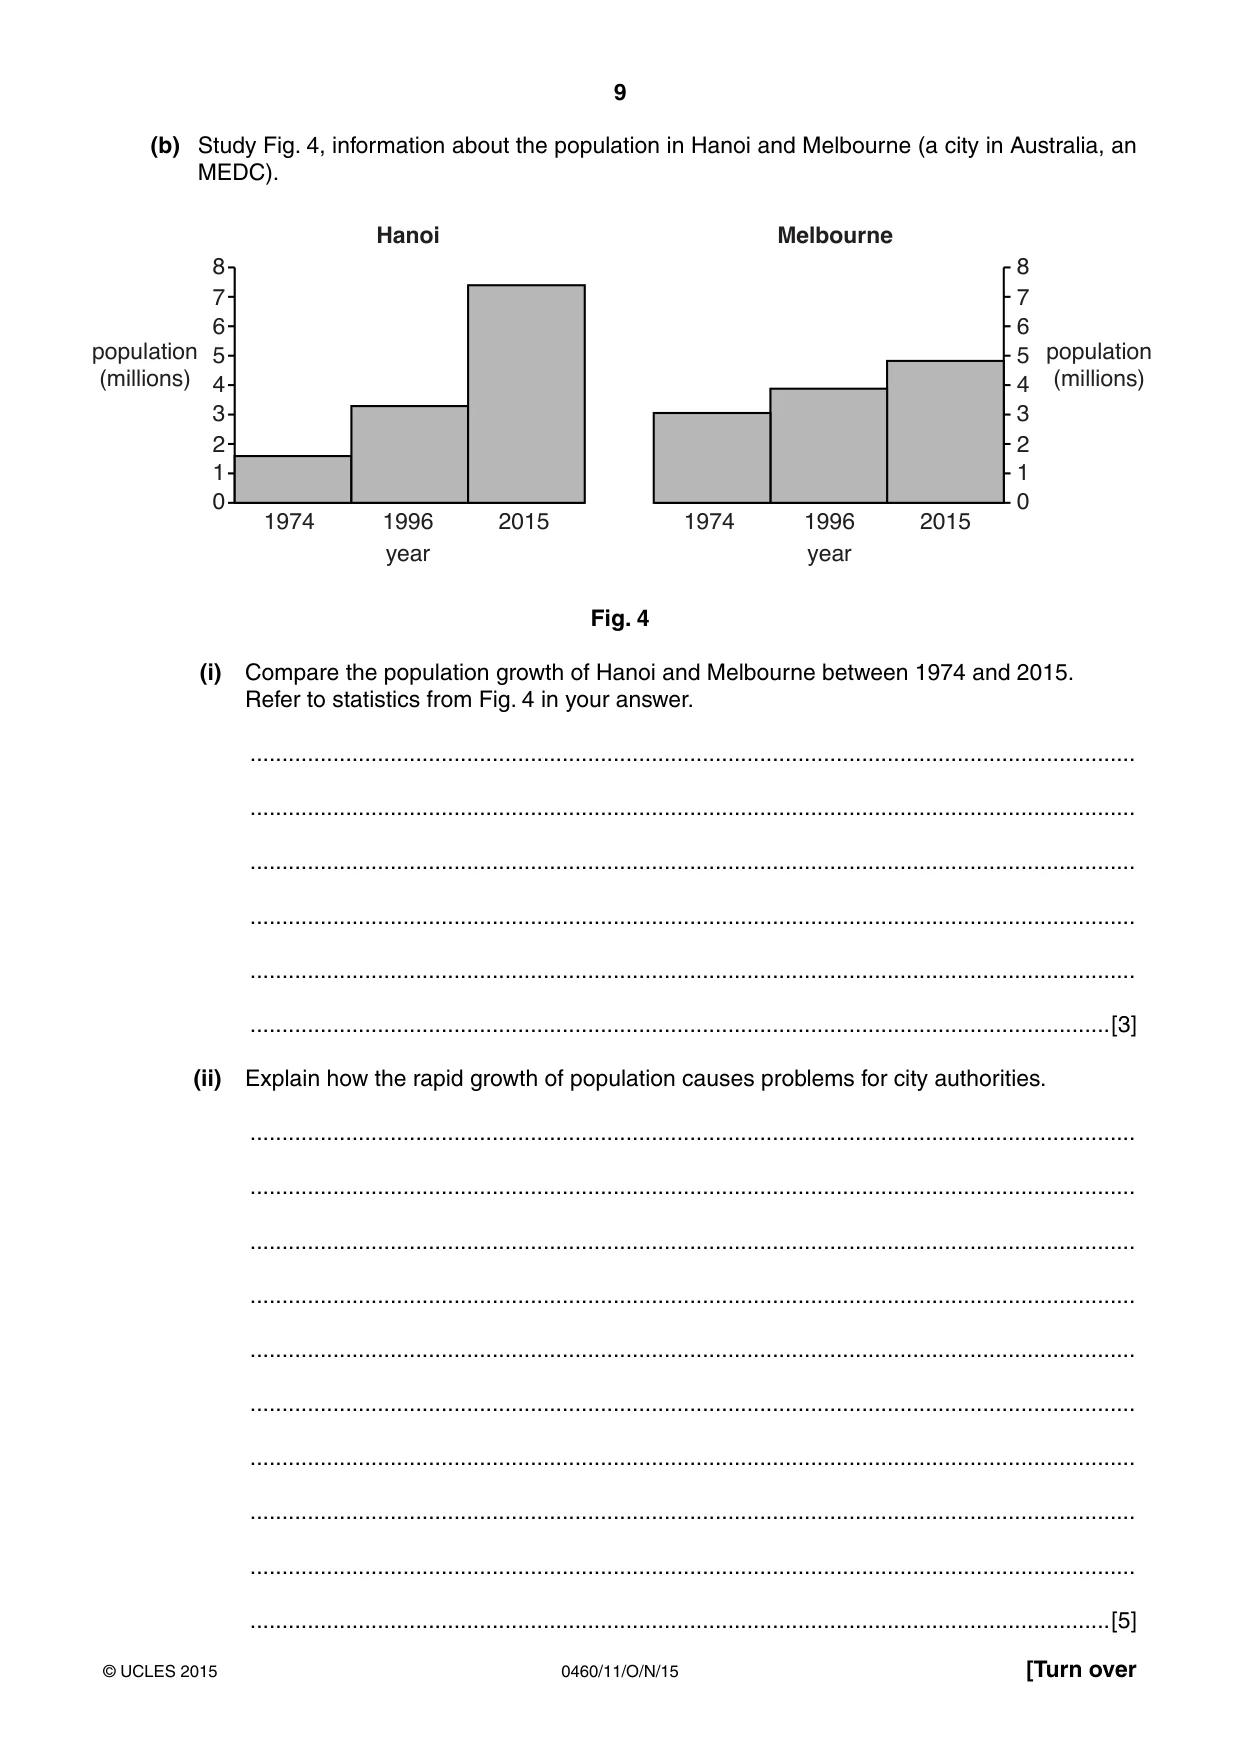
9 0460/11/O/N/15 © UCLES 2015 [Turn over (b) Study Fig. 4, information about the population in Hanoi and Melbourne (a city in Australia, an MEDC). 8 population (millions) population (millions) 7 6 5 4 3 2 1 0 8 7 6 5 4 3 2 1 0 1974 1974 1996 1996 year year Hanoi Melbourne 2015 2015 Fig. 4 (i) Compare the population growth of Hanoi and Melbourne between 1974 and 2015. Refer to statistics from Fig. 4 in your answer. … … … … … …[3] (ii) Explain how the rapid growth of population causes problems for city authorities. … … … … … … … … … …[5]
Question paper, page 10
10 0460/11/O/N/15 © UCLES 2015 (c) Choose one problem of living in urban areas. For a named urban area, describe the attempts which have been made to solve the problem which you have chosen. Name of urban area … Chosen problem … … … … … … … … … … … … … … …[7] [Total: 25 marks] END OF QUESTION 2
Question paper, page 11
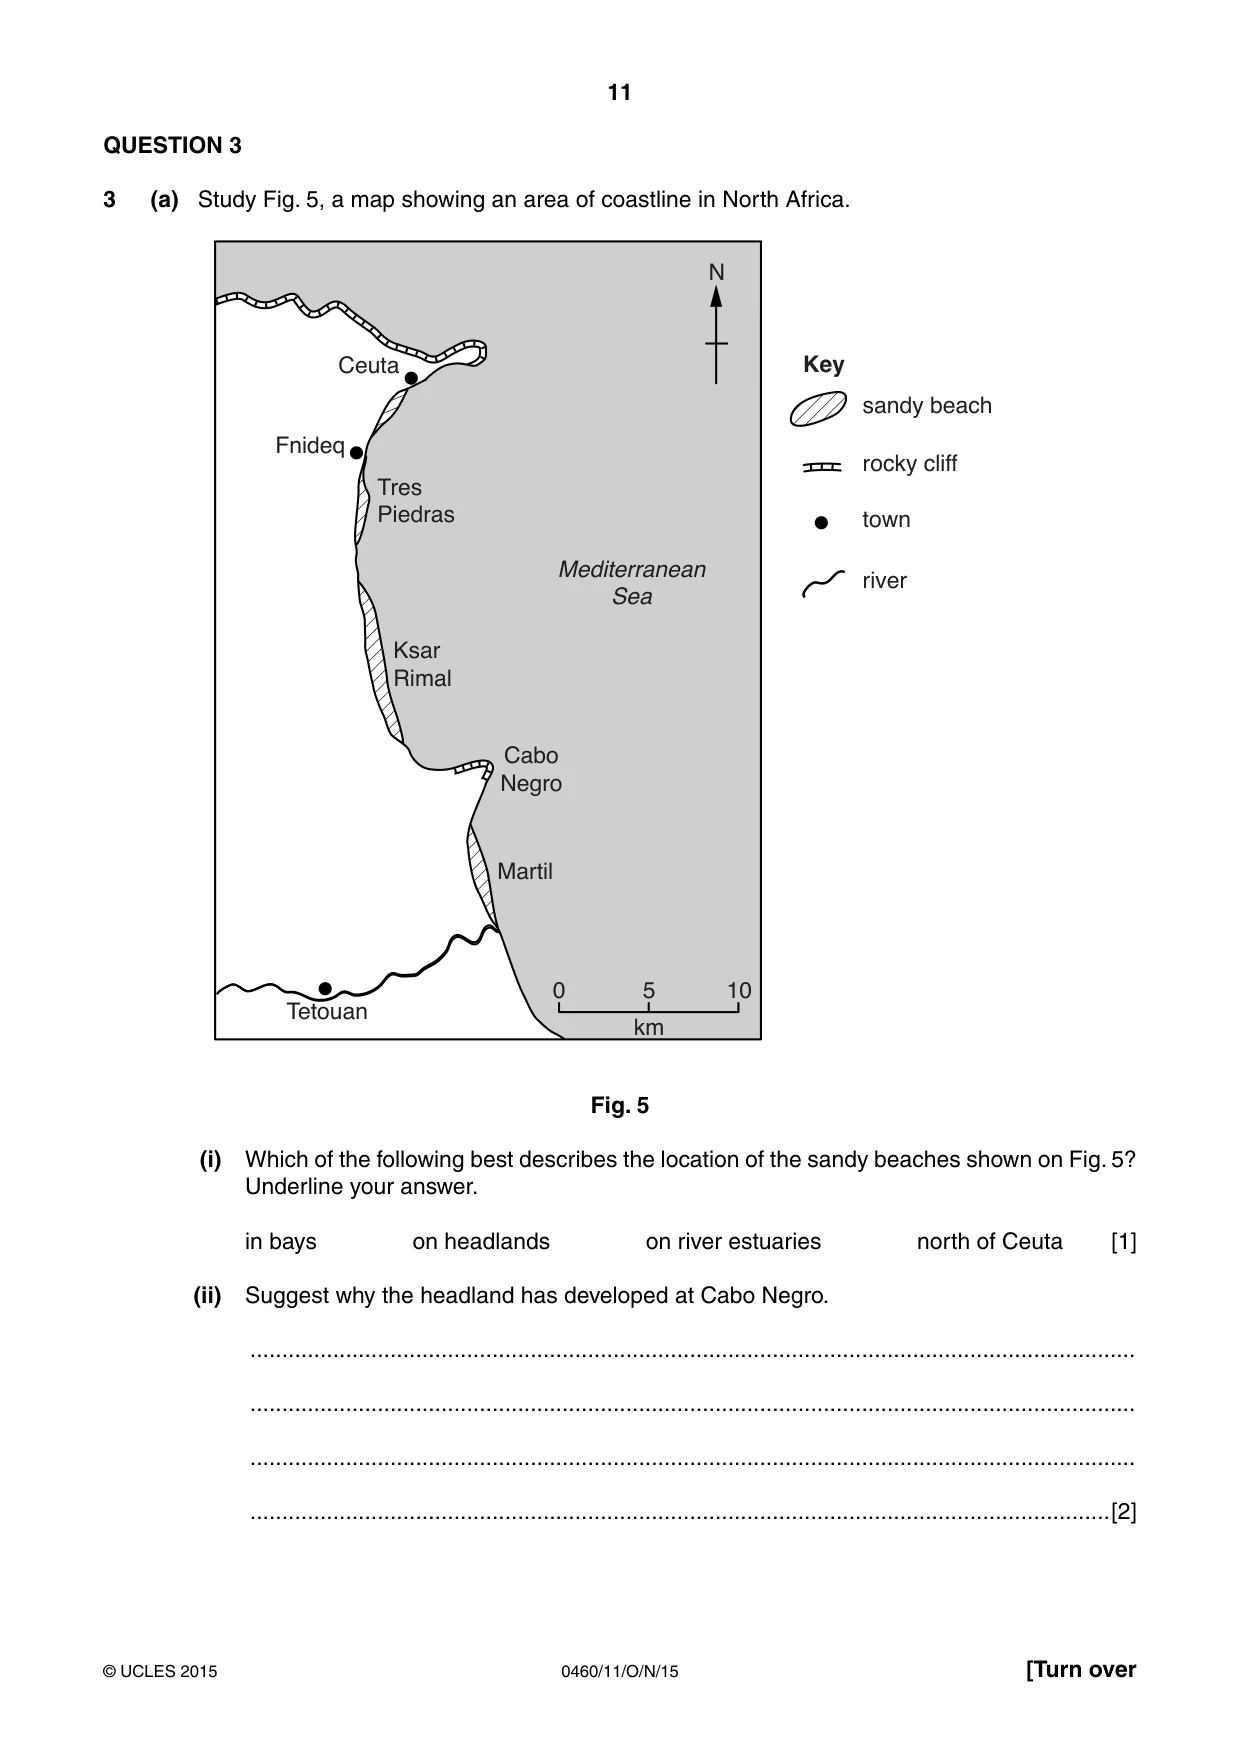
11 0460/11/O/N/15 © UCLES 2015 [Turn over QUESTION 3 3 (a) Study Fig. 5, a map showing an area of coastline in North Africa. N 0 5 km 10 sandy beach Key rocky cliff town river Mediterranean Sea Ceuta Tres Piedras Ksar Rimal Cabo Negro Martil Tetouan Fnideq Fig. 5 (i) Which of the following best describes the location of the sandy beaches shown on Fig. 5? Underline your answer. in bays on headlands on river estuaries north of Ceuta [1] (ii) Suggest why the headland has developed at Cabo Negro. … … … …[2]
Question paper, page 12
12 0460/11/O/N/15 © UCLES 2015 (iii) Name three coastal landforms which may develop on a headland as a result of coastal erosion. 1 … 2 … 3 … [3] (iv) Name and describe two processes of coastal erosion. Process 1 … … … … Process 2 … … … … [4]
Question paper, page 13
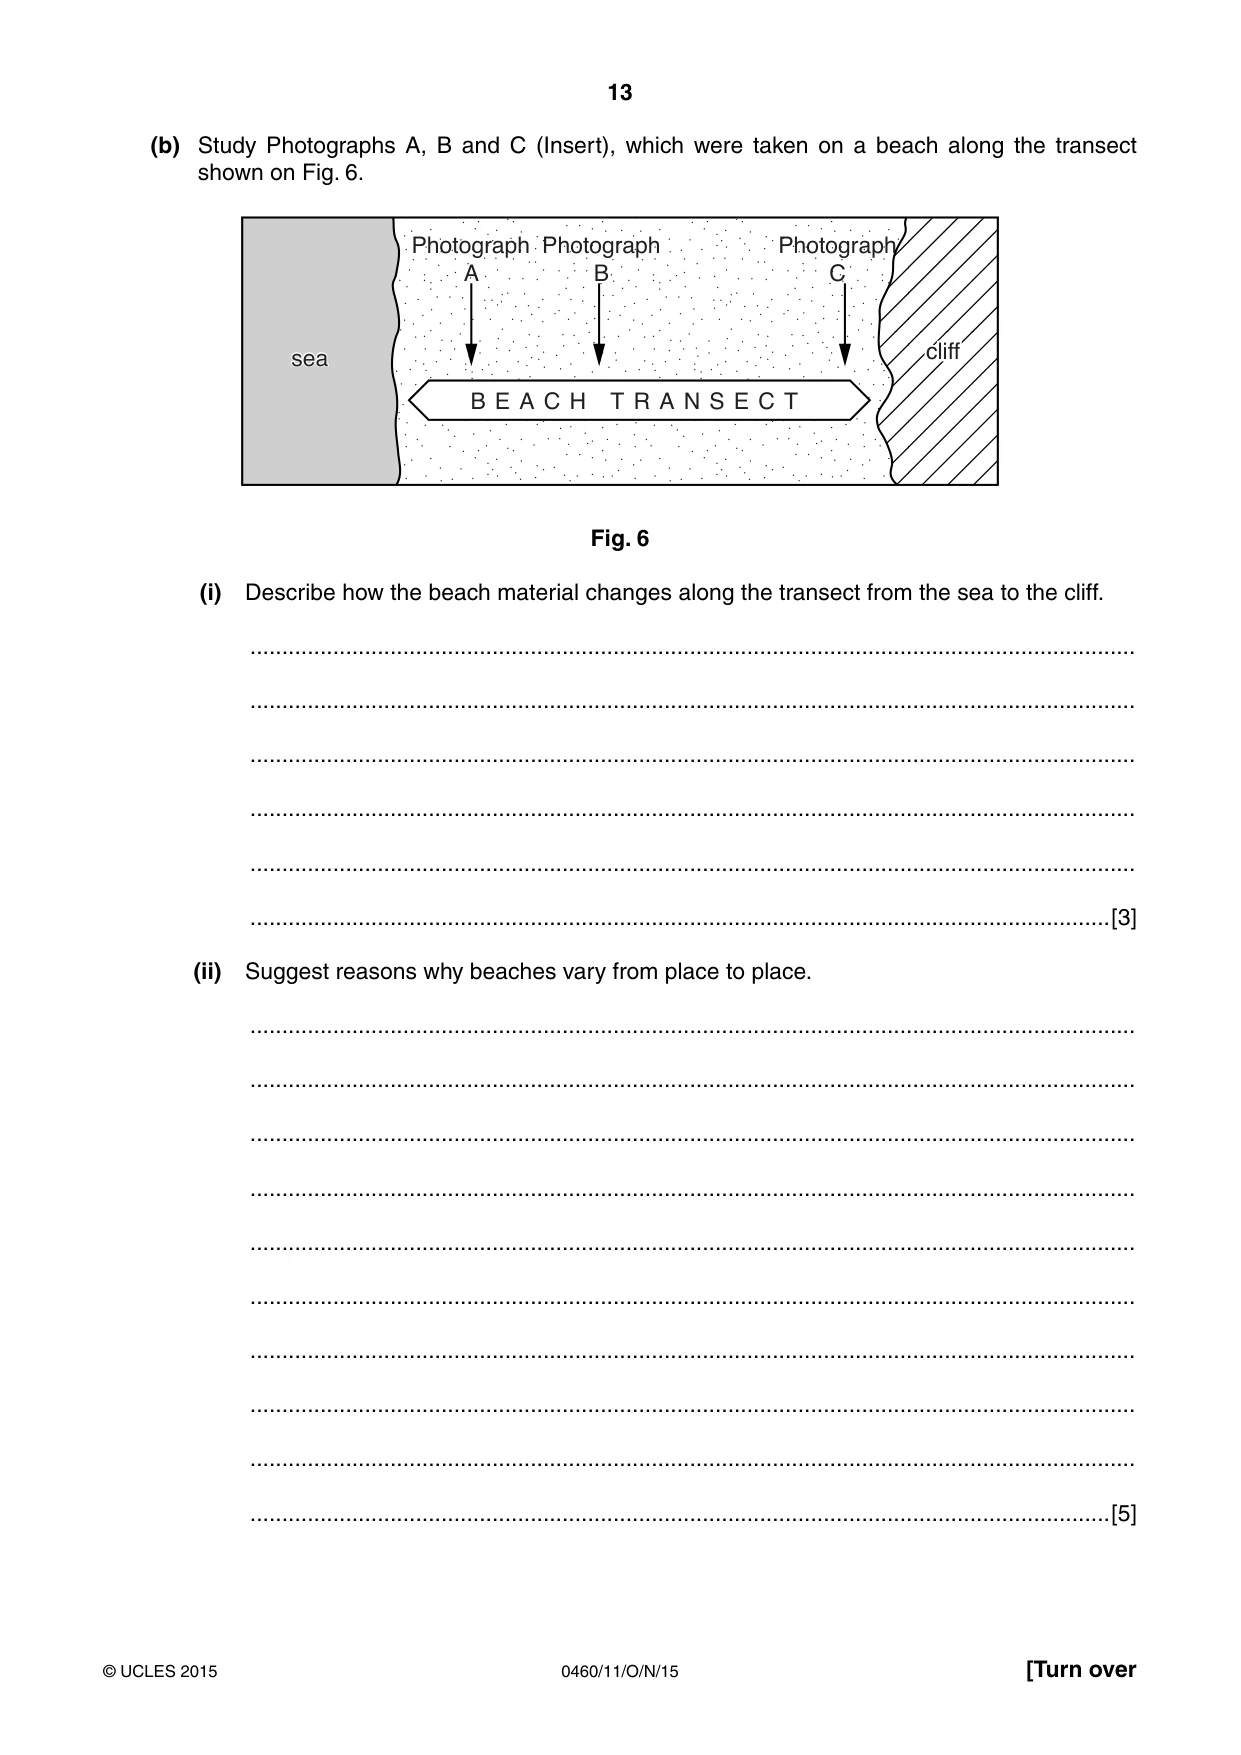
13 0460/11/O/N/15 © UCLES 2015 [Turn over (b) Study Photographs A, B and C (Insert), which were taken on a beach along the transect shown on Fig. 6. cliff sea Photograph A Photograph B Photograph C B E A C H T R A N S E C T Fig. 6 (i) Describe how the beach material changes along the transect from the sea to the cliff. … … … … … …[3] (ii) Suggest reasons why beaches vary from place to place. … … … … … … … … … …[5]
Question paper, page 14
14 0460/11/O/N/15 © UCLES 2015 (c) Explain how coastal sand dunes form and develop over time. … … … … … … … … … … … … … … …[7] [Total: 25 marks] END OF QUESTION 3
Question paper, page 15
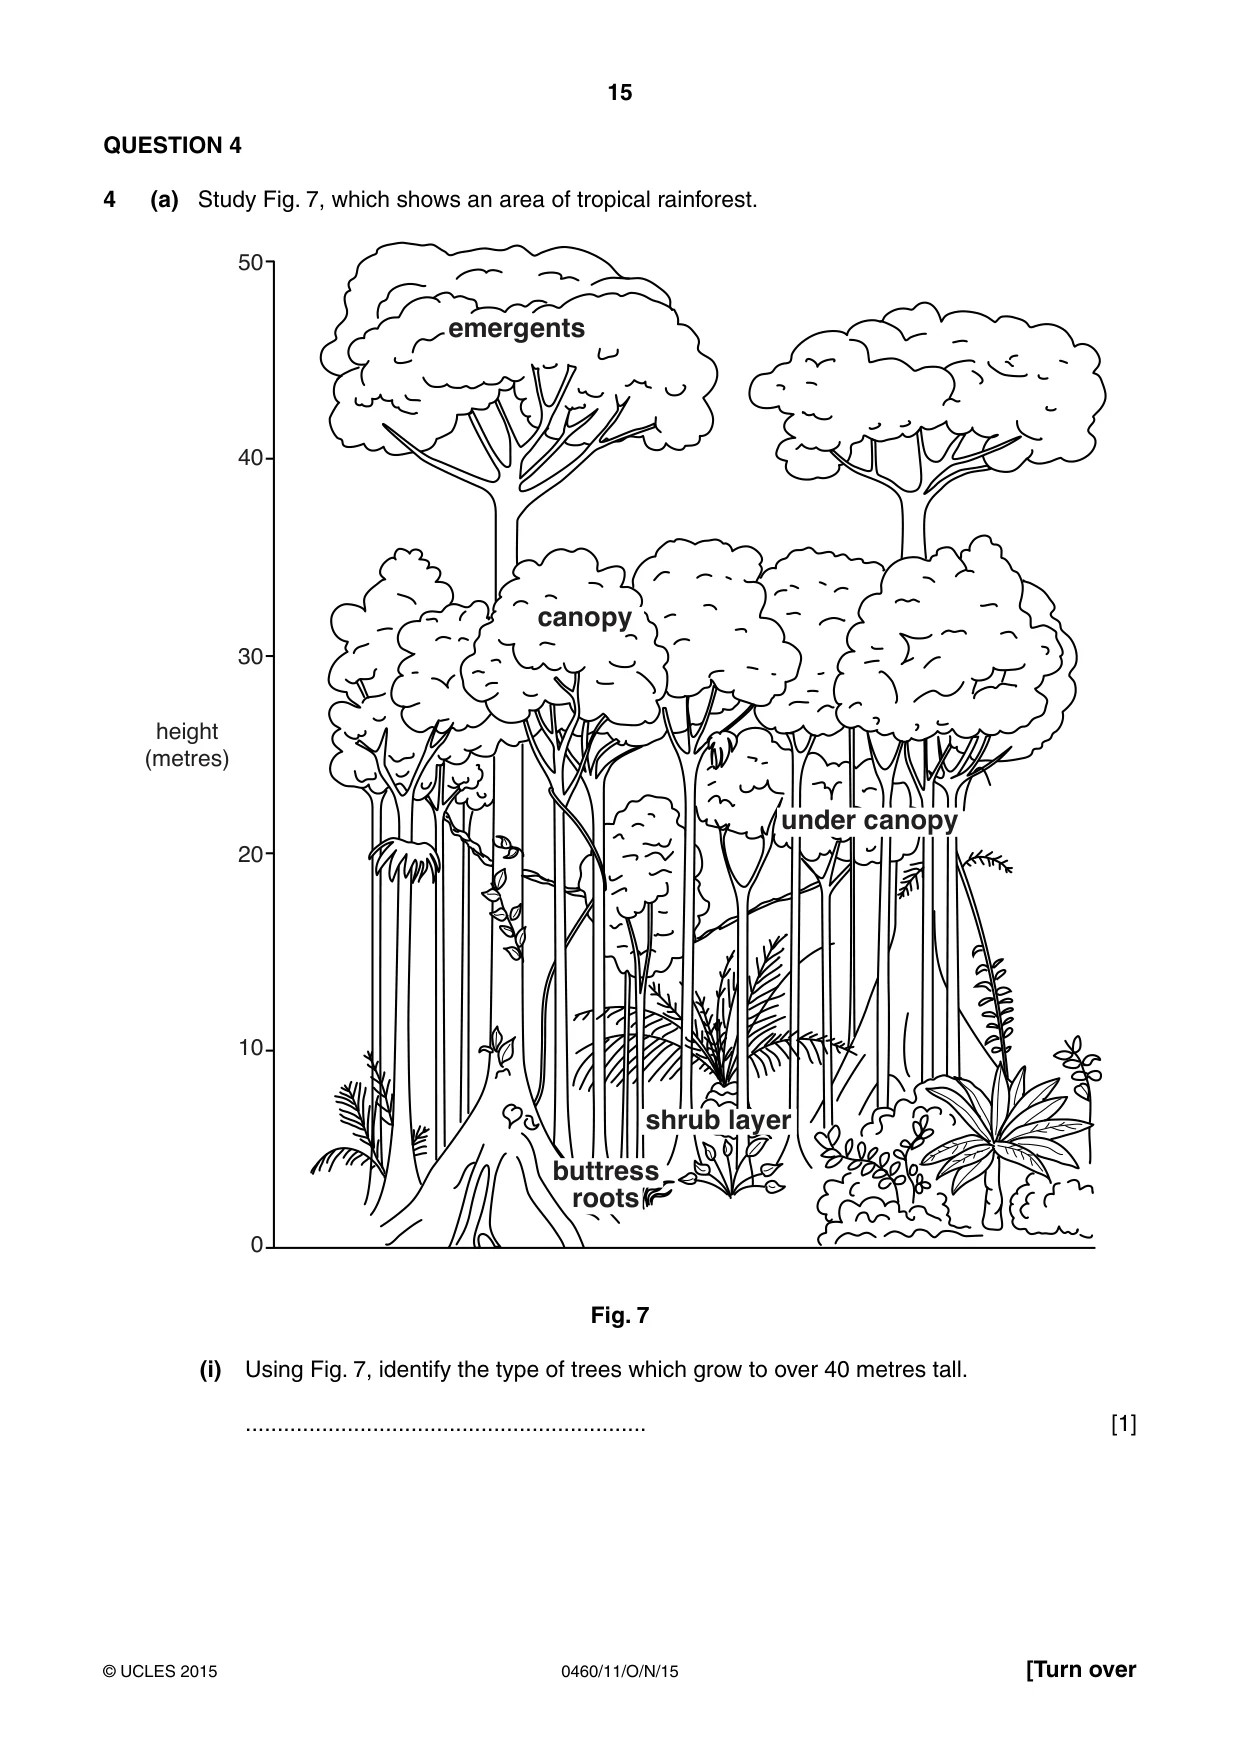
15 0460/11/O/N/15 © UCLES 2015 [Turn over QUESTION 4 4 (a) Study Fig. 7, which shows an area of tropical rainforest. 50 40 30 20 height (metres) 10 0 emergents canopy under canopy shrub layer buttress roots Fig. 7 (i) Using Fig. 7, identify the type of trees which grow to over 40 metres tall. … [1]
Question paper, page 16
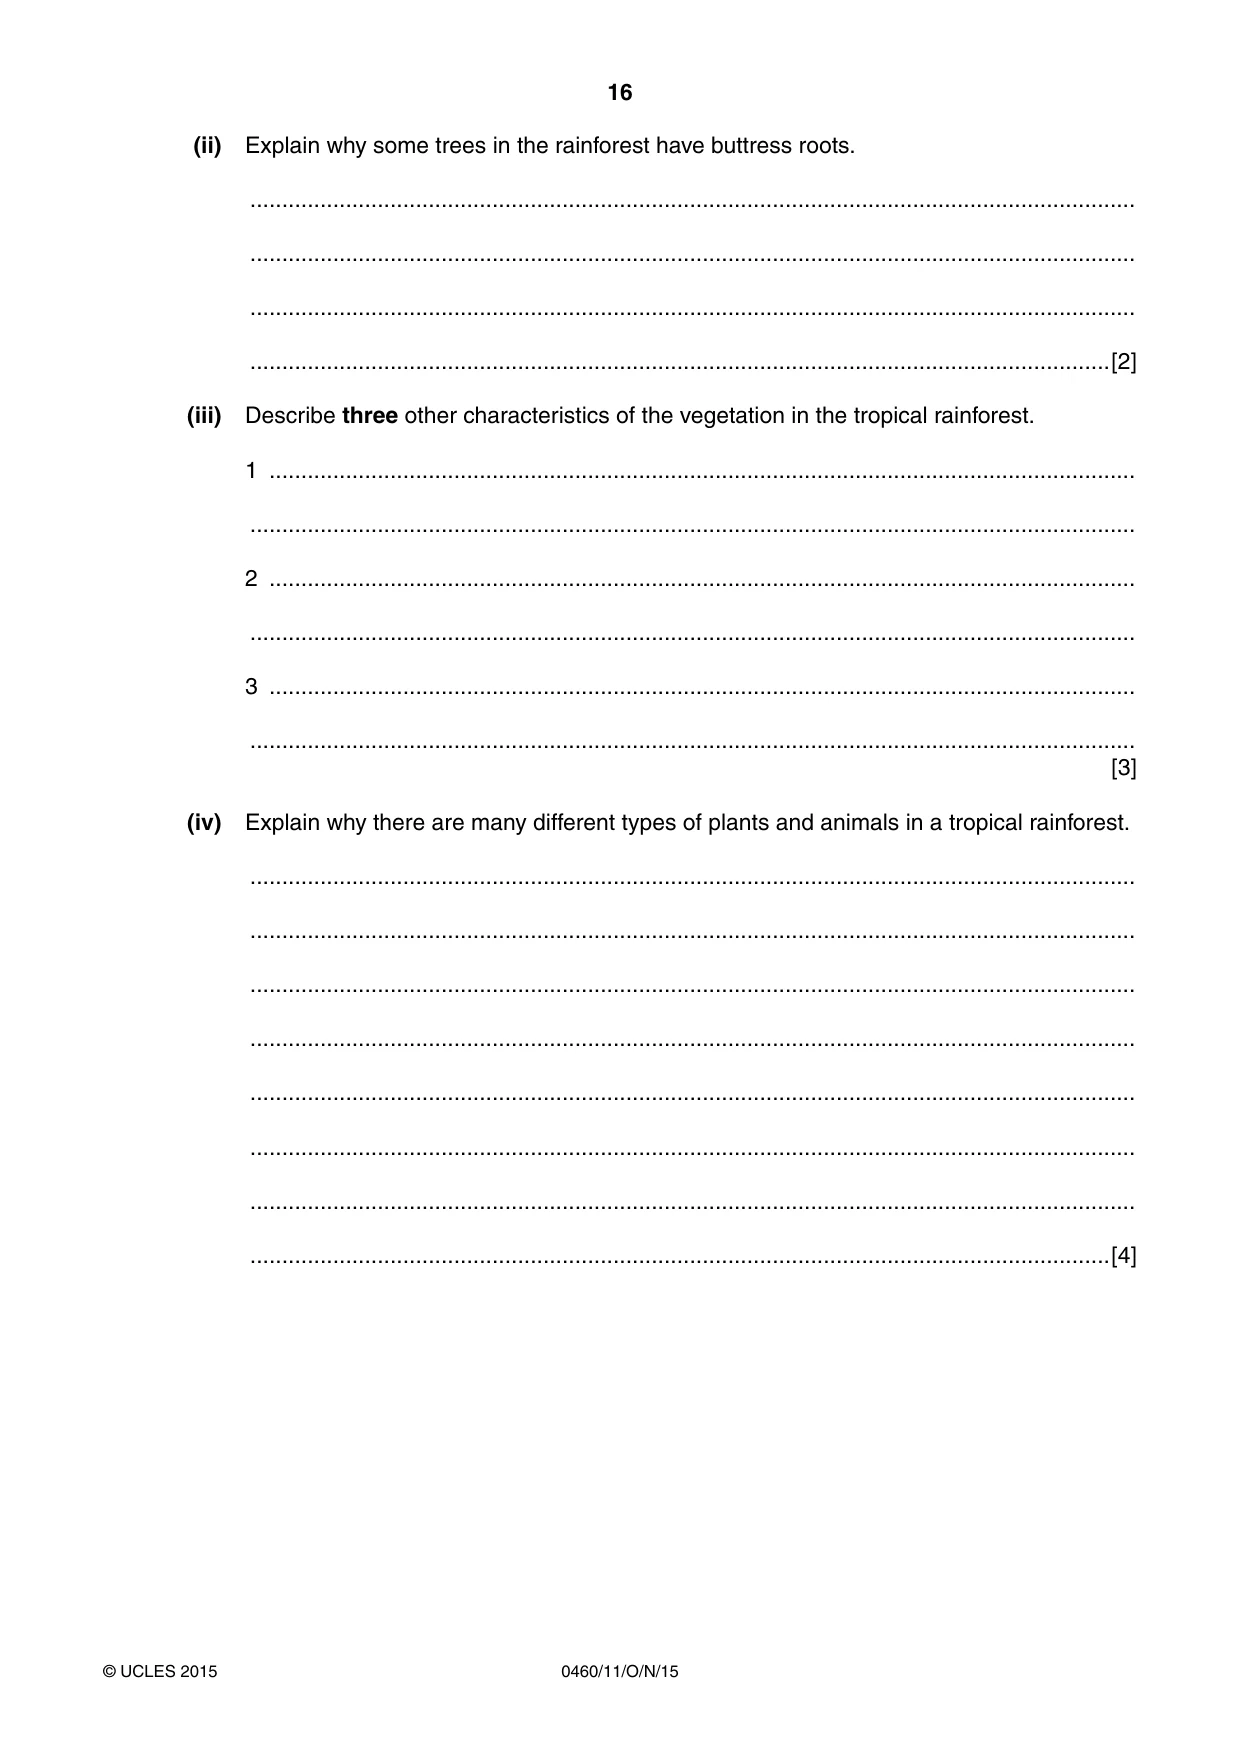
16 0460/11/O/N/15 © UCLES 2015 (ii) Explain why some trees in the rainforest have buttress roots. … … … …[2] (iii) Describe three other characteristics of the vegetation in the tropical rainforest. 1 … … 2 … … 3 … … [3] (iv) Explain why there are many different types of plants and animals in a tropical rainforest. … … … … … … … …[4]
Question paper, page 17
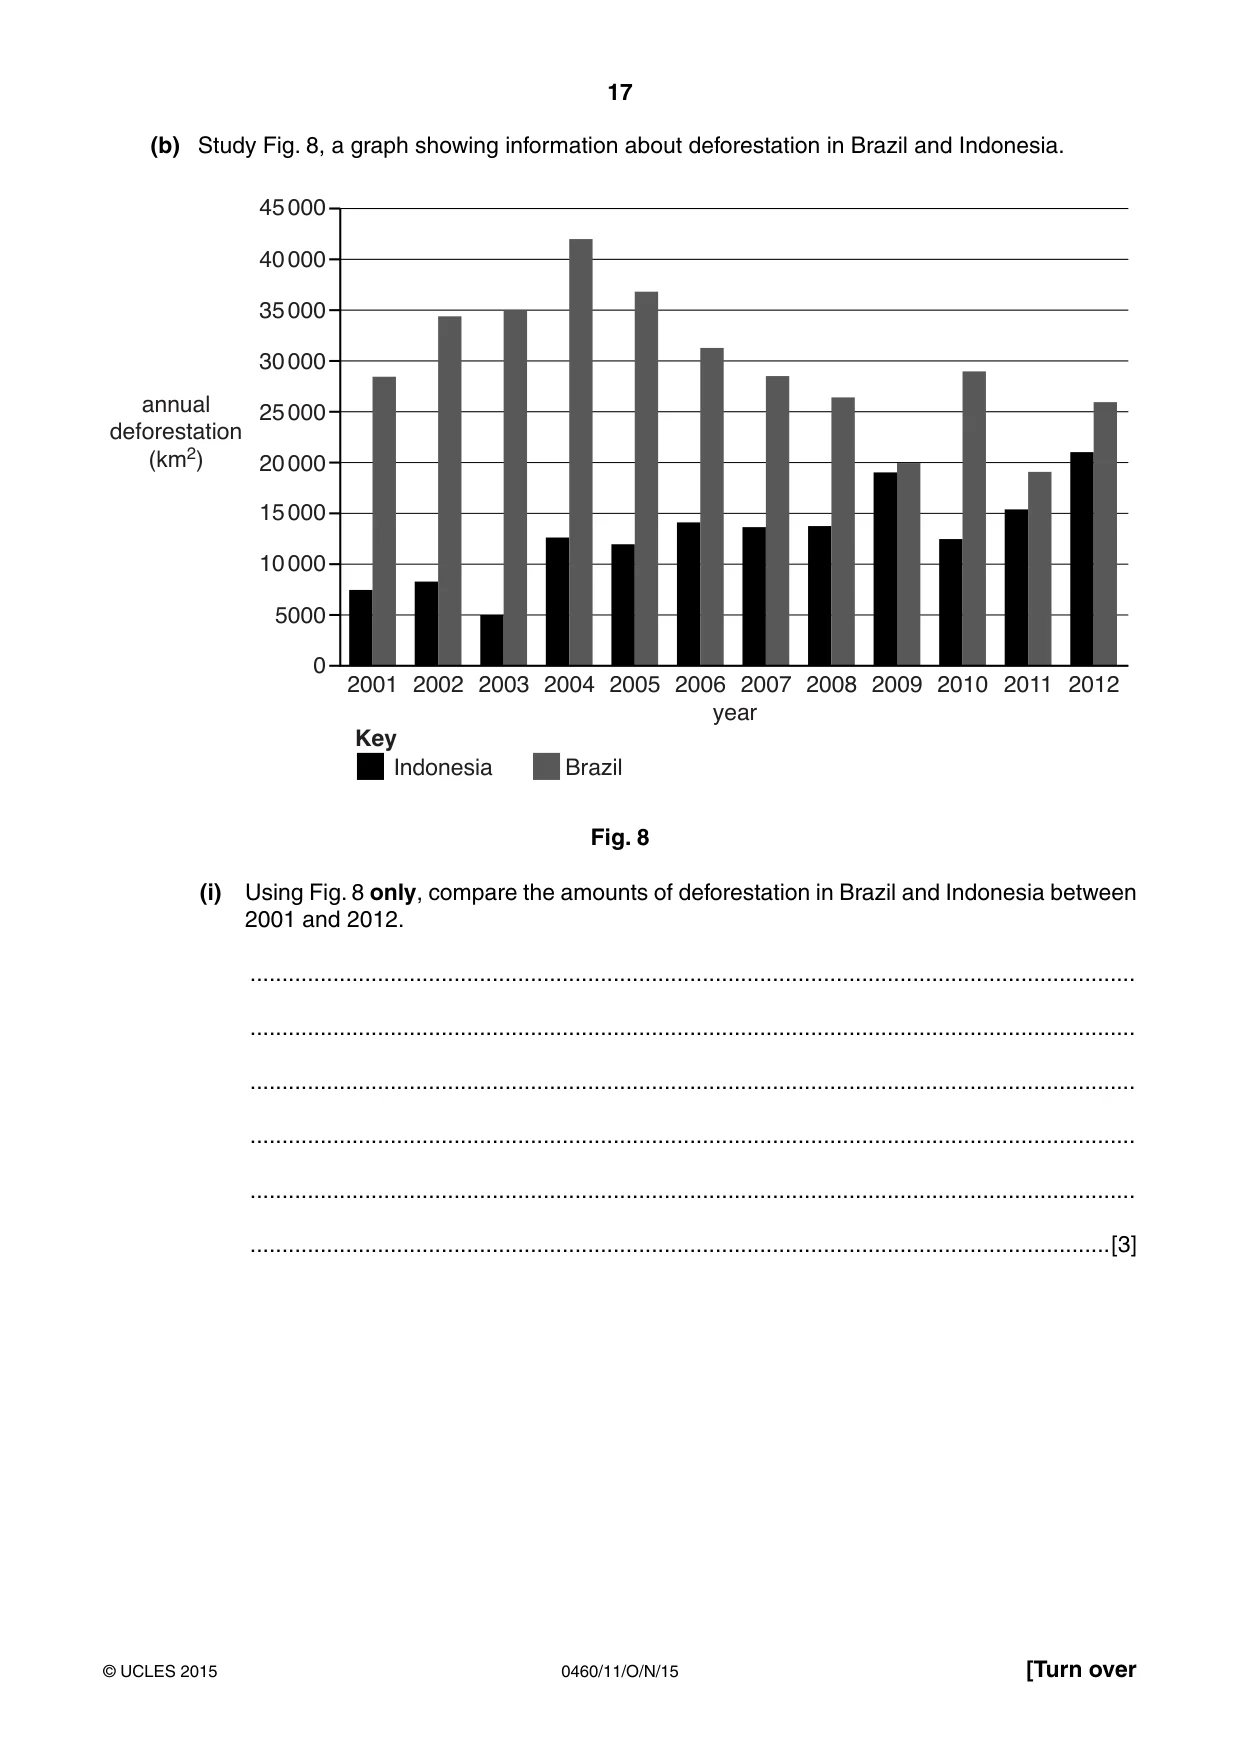
17 0460/11/O/N/15 © UCLES 2015 [Turn over (b) Study Fig. 8, a graph showing information about deforestation in Brazil and Indonesia. 45 000 40 000 35 000 30 000 25 000 20 000 annual deforestation (km2) 15 000 10 000 5000 0 2001 2002 2003 2004 2005 2006 year 2007 2008 2009 2010 2011 2012 Indonesia Key Brazil Fig. 8 (i) Using Fig. 8 only, compare the amounts of deforestation in Brazil and Indonesia between 2001 and 2012. … … … … … …[3]
Question paper, page 18
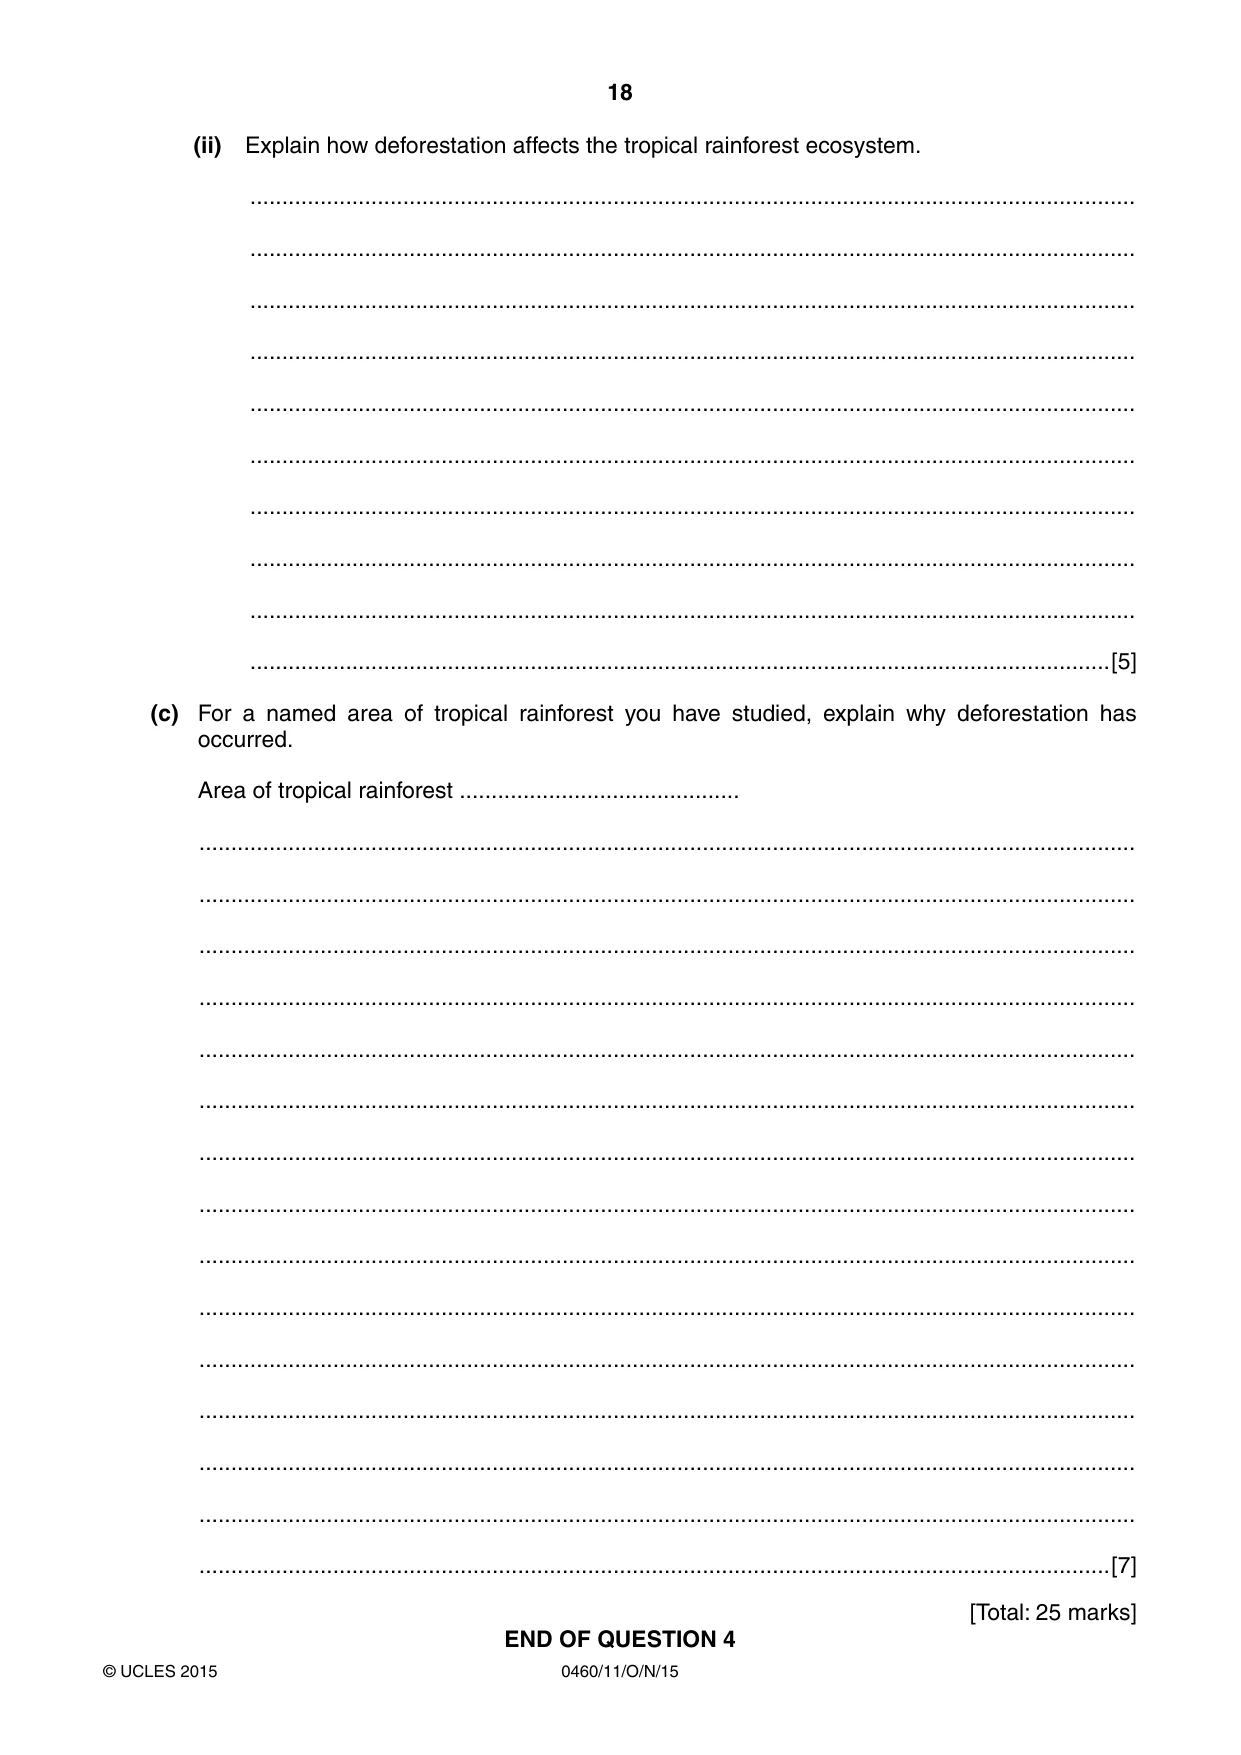
18 0460/11/O/N/15 © UCLES 2015 (ii) Explain how deforestation affects the tropical rainforest ecosystem. … … … … … … … … … …[5] (c) For a named area of tropical rainforest you have studied, explain why deforestation has occurred. Area of tropical rainforest … … … … … … … … … … … … … … … …[7] [Total: 25 marks] END OF QUESTION 4
Question paper, page 19
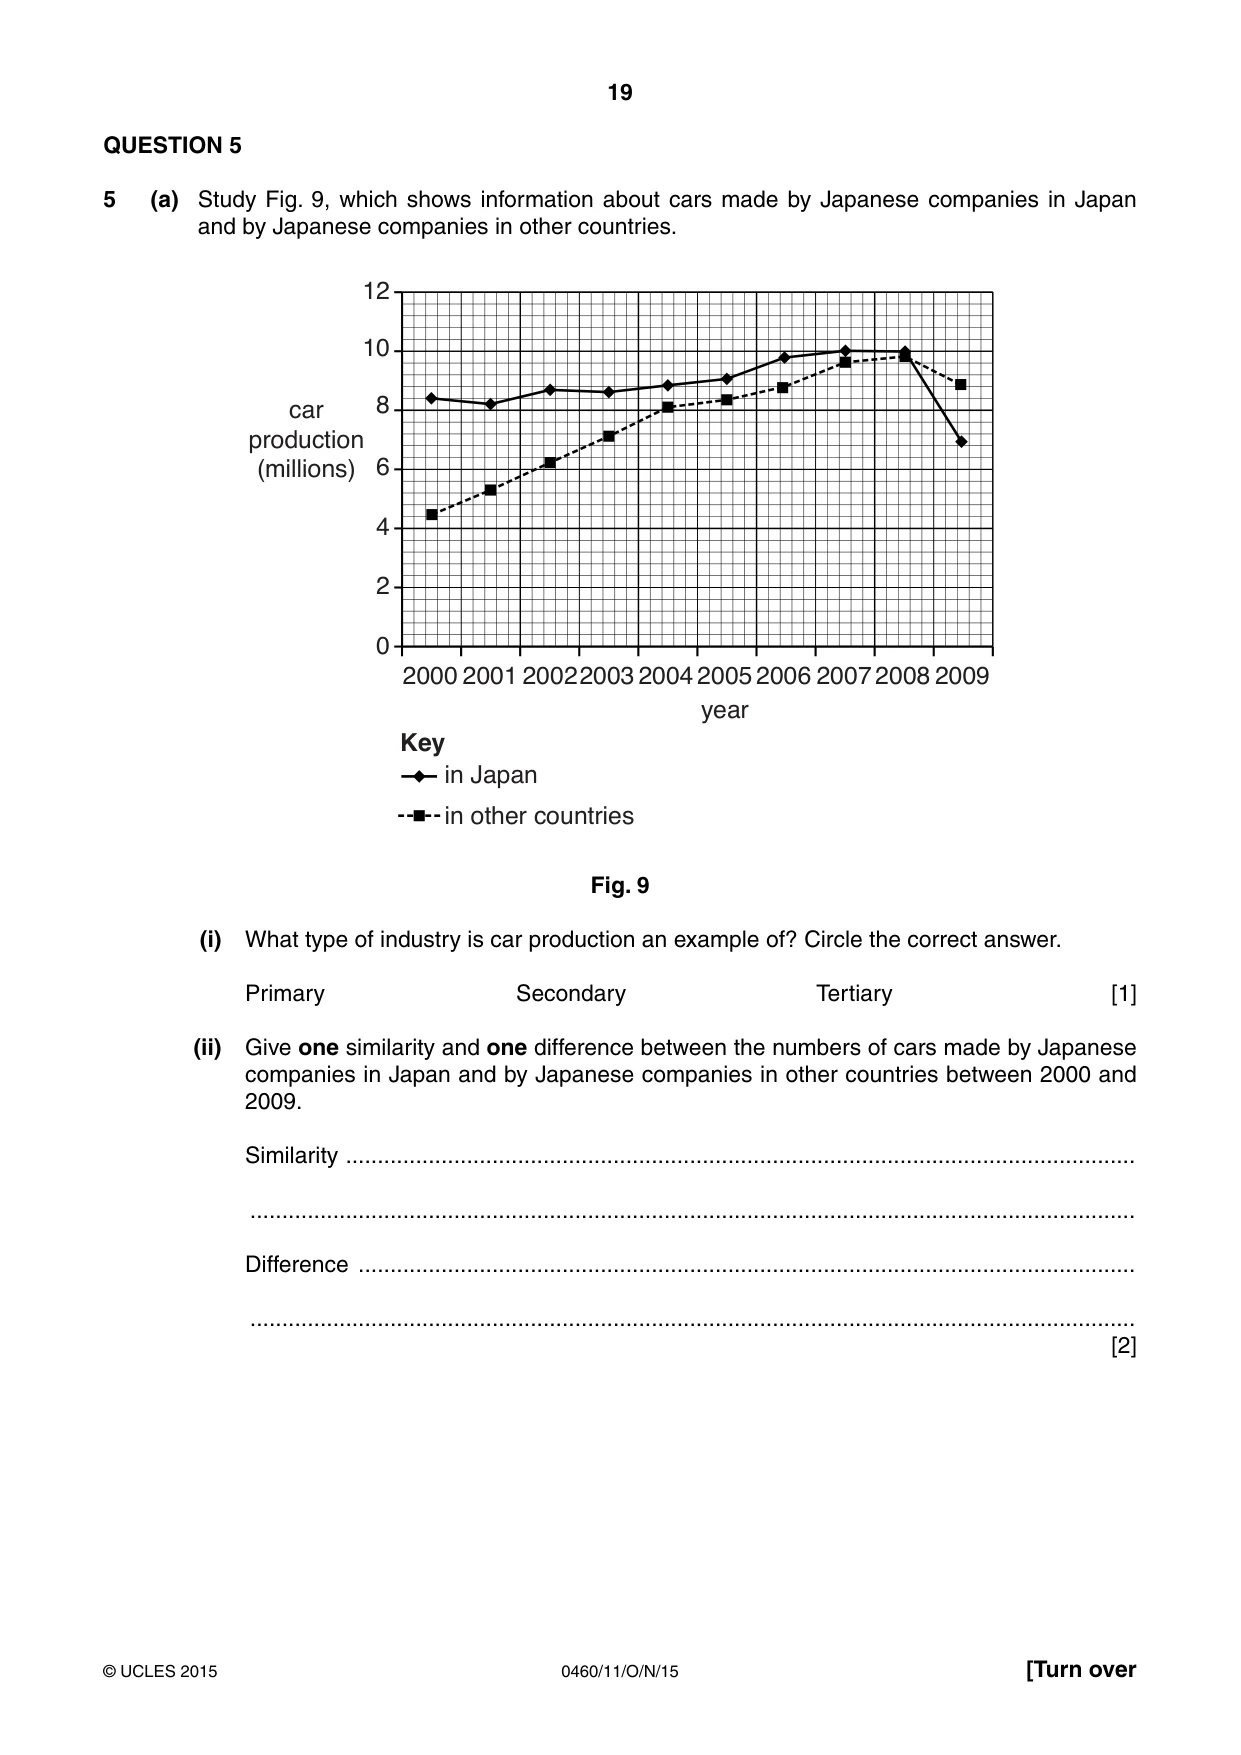
19 0460/11/O/N/15 © UCLES 2015 [Turn over QUESTION 5 5 (a) Study Fig. 9, which shows information about cars made by Japanese companies in Japan and by Japanese companies in other countries. 12 10 8 car production (millions) 6 4 2 0 2000 2001 20022003 20042005 year 2006 20072008 2009 in Japan in other countries Key Fig. 9 (i) What type of industry is car production an example of? Circle the correct answer. Primary Secondary Tertiary [1] (ii) Give one similarity and one difference between the numbers of cars made by Japanese companies in Japan and by Japanese companies in other countries between 2000 and 2009. Similarity … … Difference … … [2]
Question paper, page 20
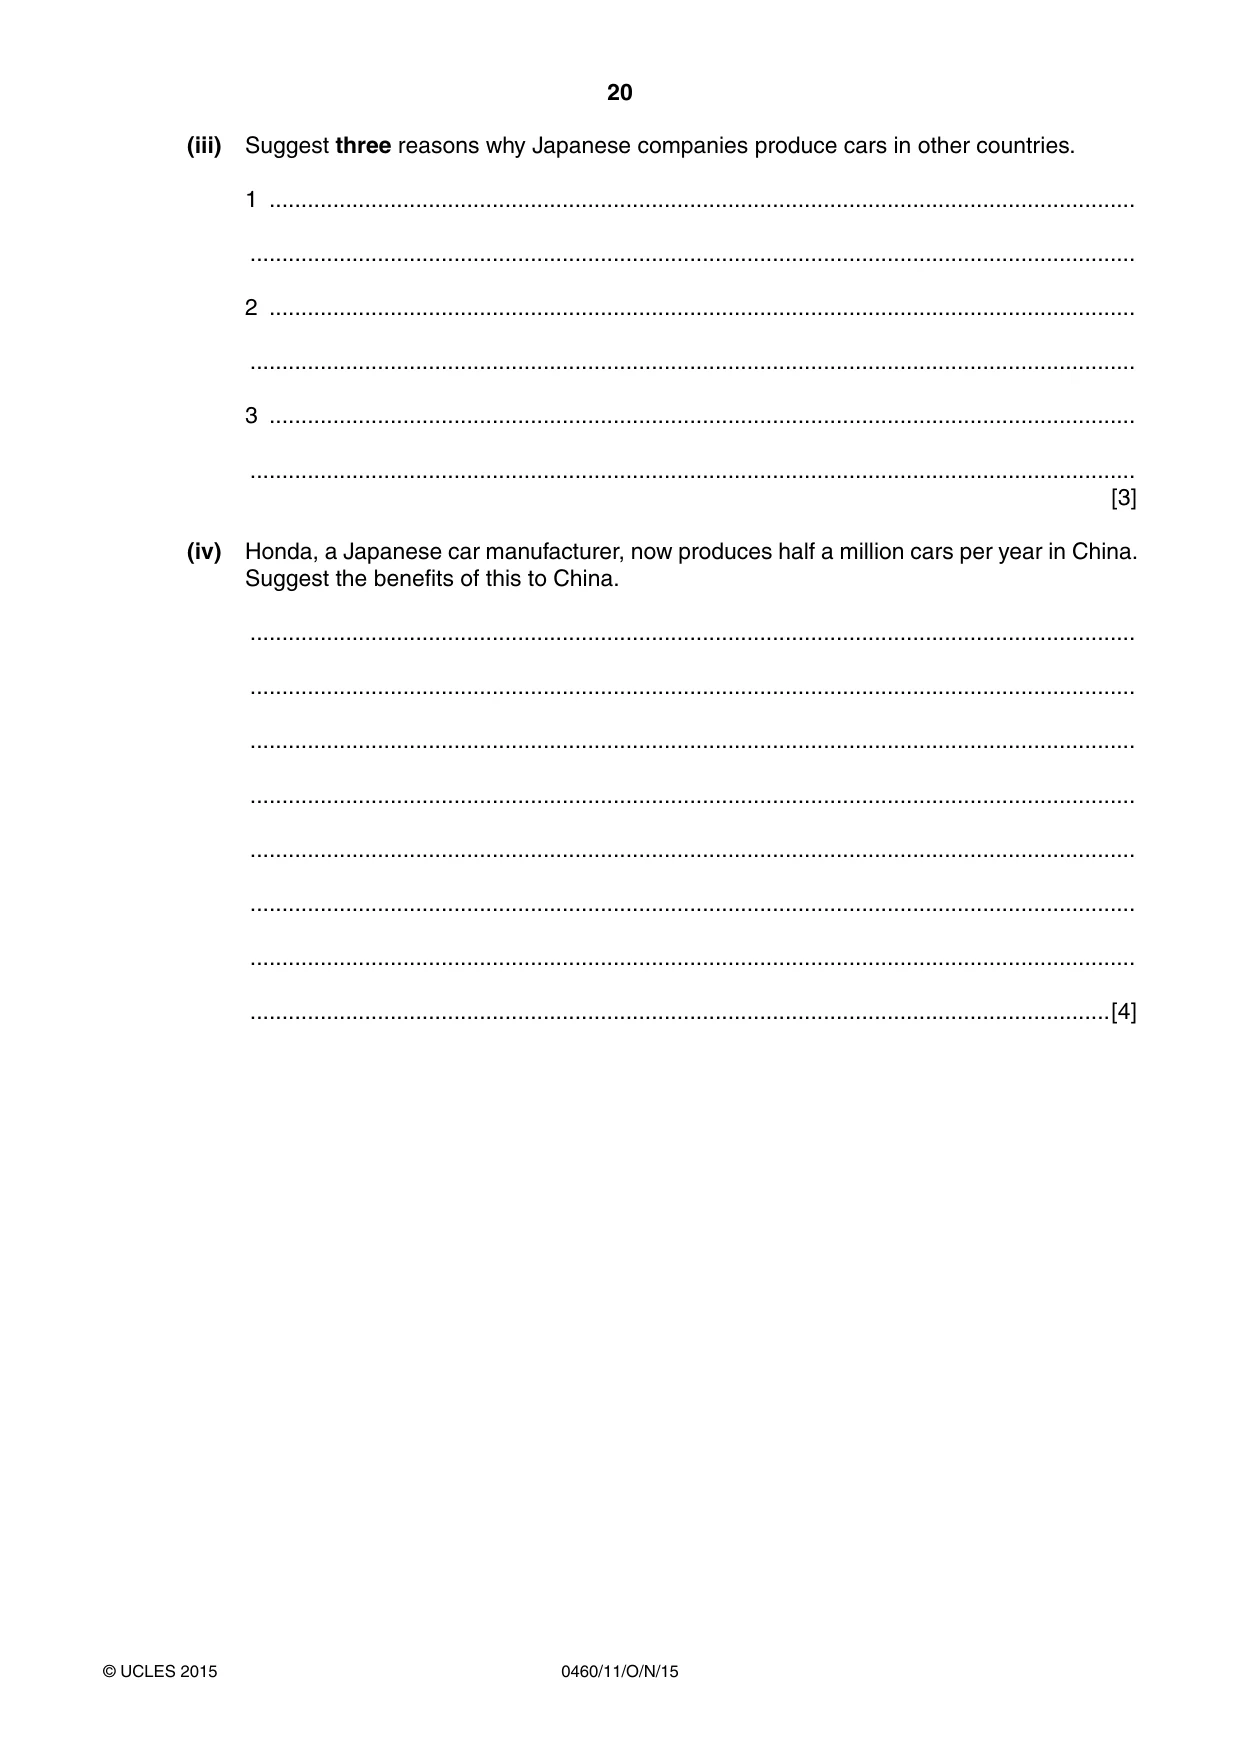
20 0460/11/O/N/15 © UCLES 2015 (iii) Suggest three reasons why Japanese companies produce cars in other countries. 1 … … 2 … … 3 … … [3] (iv) Honda, a Japanese car manufacturer, now produces half a million cars per year in China. Suggest the benefits of this to China. … … … … … … … …[4]
Question paper, page 21
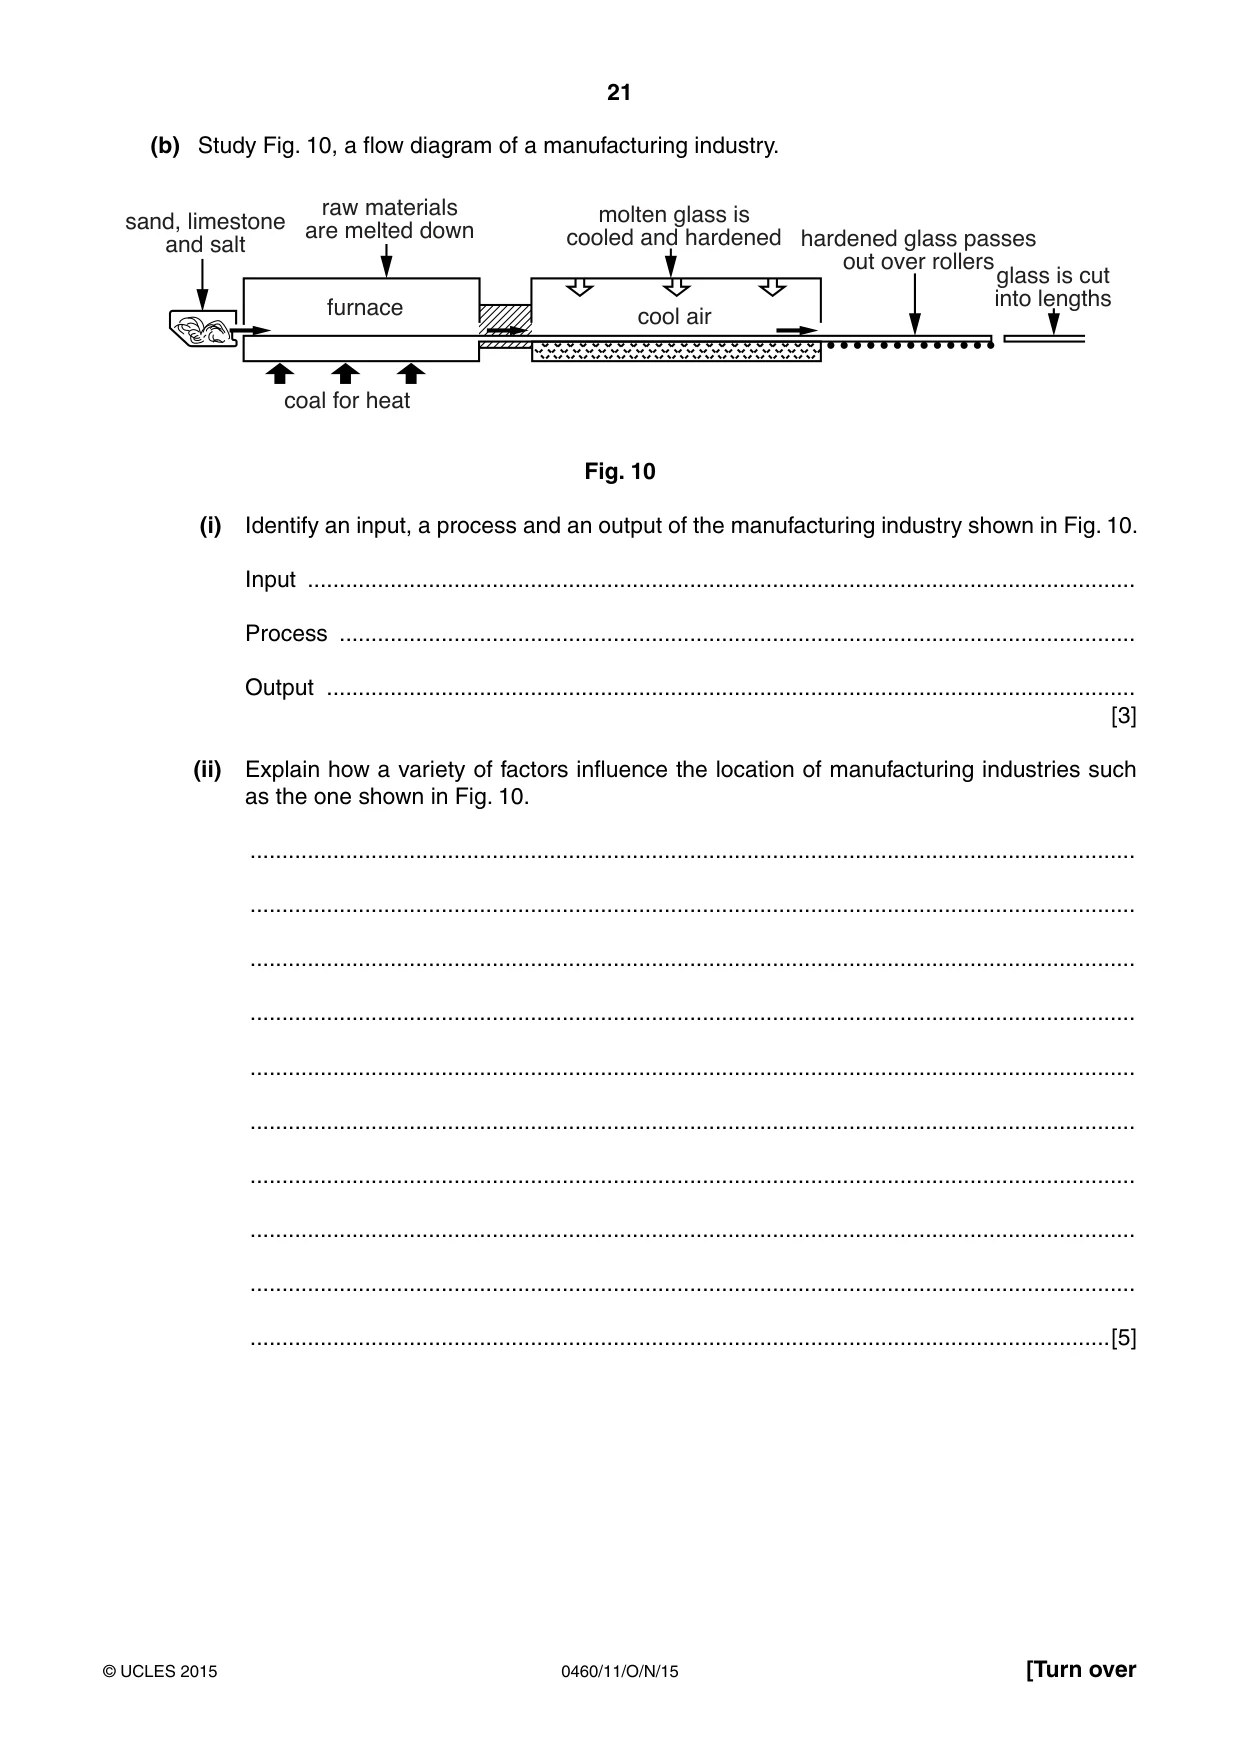
21 0460/11/O/N/15 © UCLES 2015 [Turn over (b) Study Fig. 10, a flow diagram of a manufacturing industry. glass is cut into lengths sand, limestone and salt raw materials are melted down furnace cool air hardened glass passes out over rollers coal for heat molten glass is cooled and hardened Fig. 10 (i) Identify an input, a process and an output of the manufacturing industry shown in Fig. 10. Input … Process … Output … [3] (ii) Explain how a variety of factors influence the location of manufacturing industries such as the one shown in Fig. 10. … … … … … … … … … …[5]
Question paper, page 22
22 0460/11/O/N/15 © UCLES 2015 (c) For a named area you have studied, describe the impacts of manufacturing industry on the natural environment. Named area … … … … … … … … … … … … … … … …[7] [Total: 25 marks] END OF QUESTION 5
Question paper, page 23
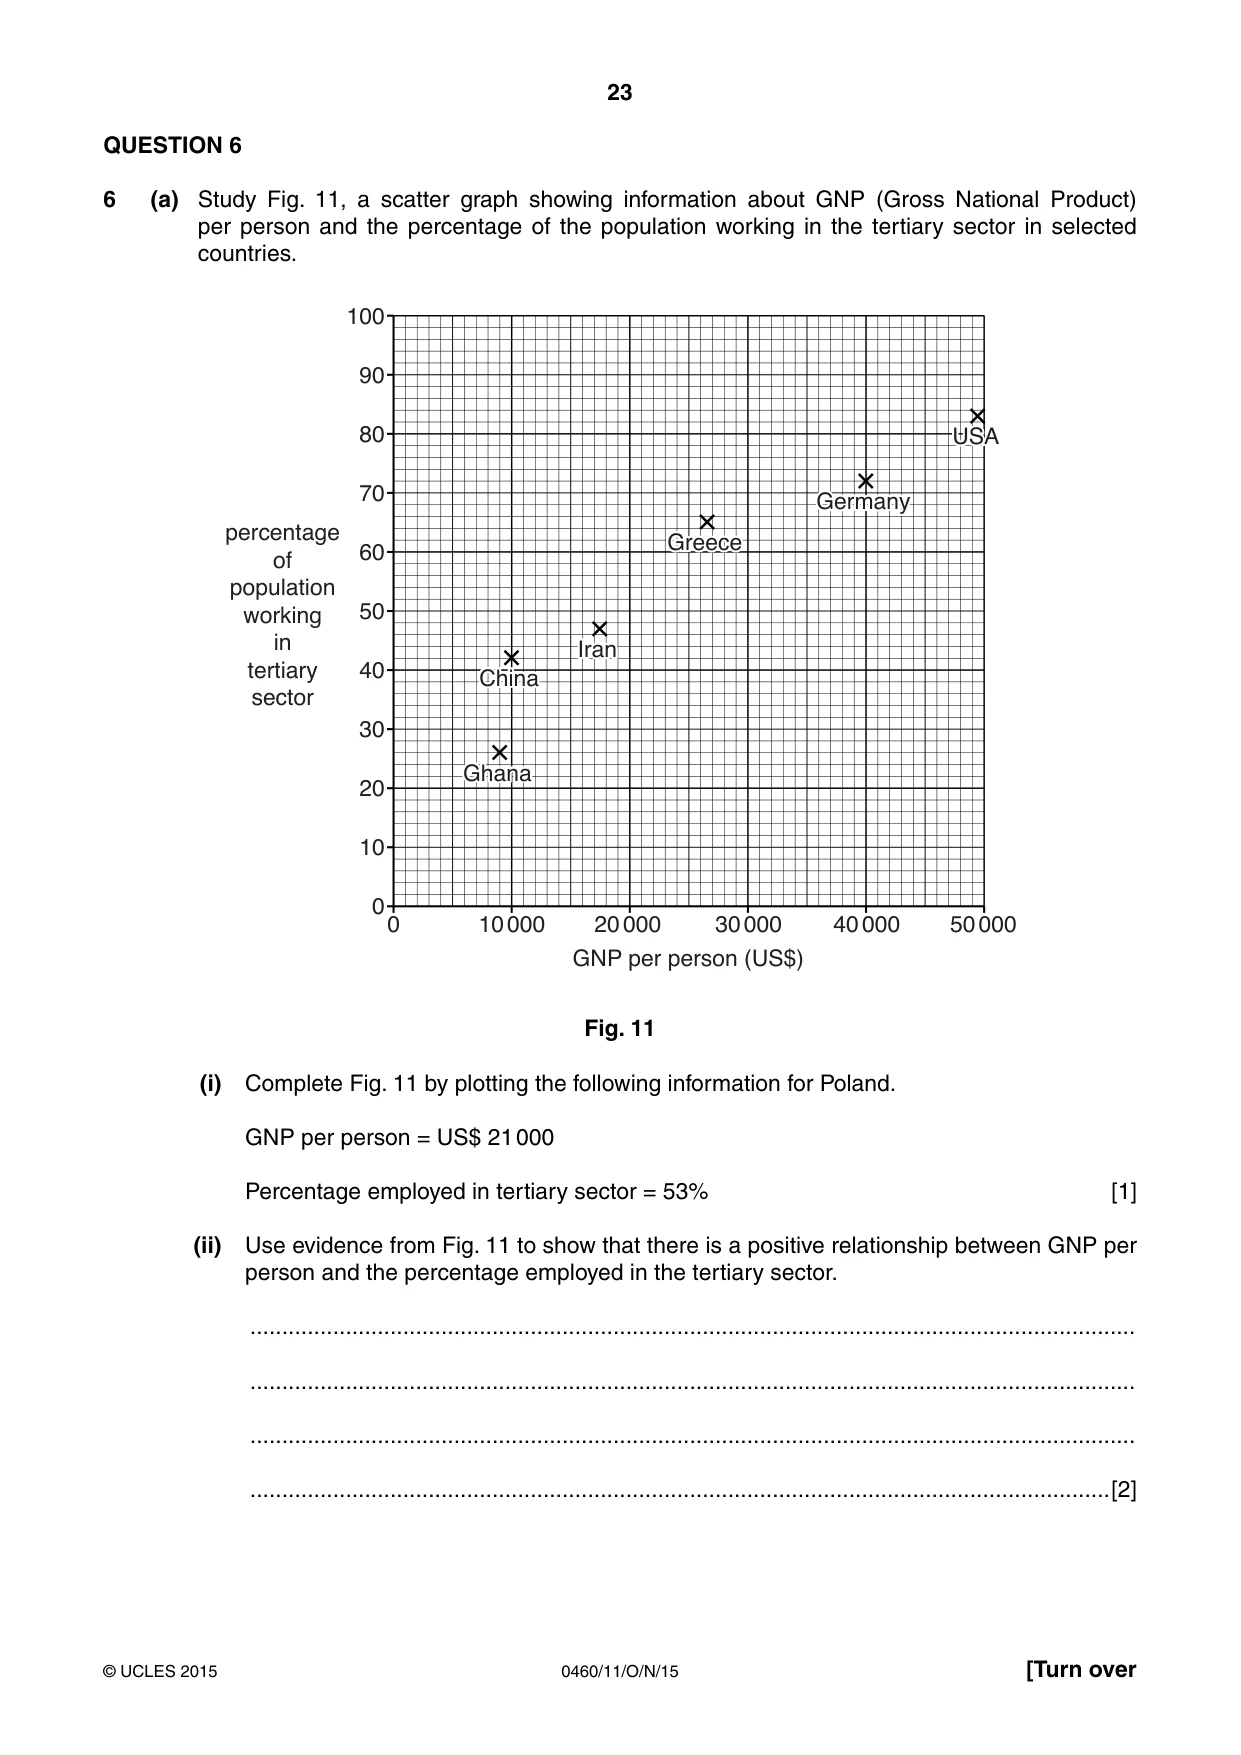
23 0460/11/O/N/15 © UCLES 2015 [Turn over QUESTION 6 6 (a) Study Fig. 11, a scatter graph showing information about GNP (Gross National Product) per person and the percentage of the population working in the tertiary sector in selected countries. 0 0 10 20 30 40 50 60 percentage of population working in tertiary sector 70 80 90 100 10 000 20 000 30 000 GNP per person (US$) 40 000 50 000 Ghana Iran Greece Germany USA China Fig. 11 (i) Complete Fig. 11 by plotting the following information for Poland. GNP per person = US$ 21 000 Percentage employed in tertiary sector = 53% [1] (ii) Use evidence from Fig. 11 to show that there is a positive relationship between GNP per person and the percentage employed in the tertiary sector. … … … …[2]
Question paper, page 24
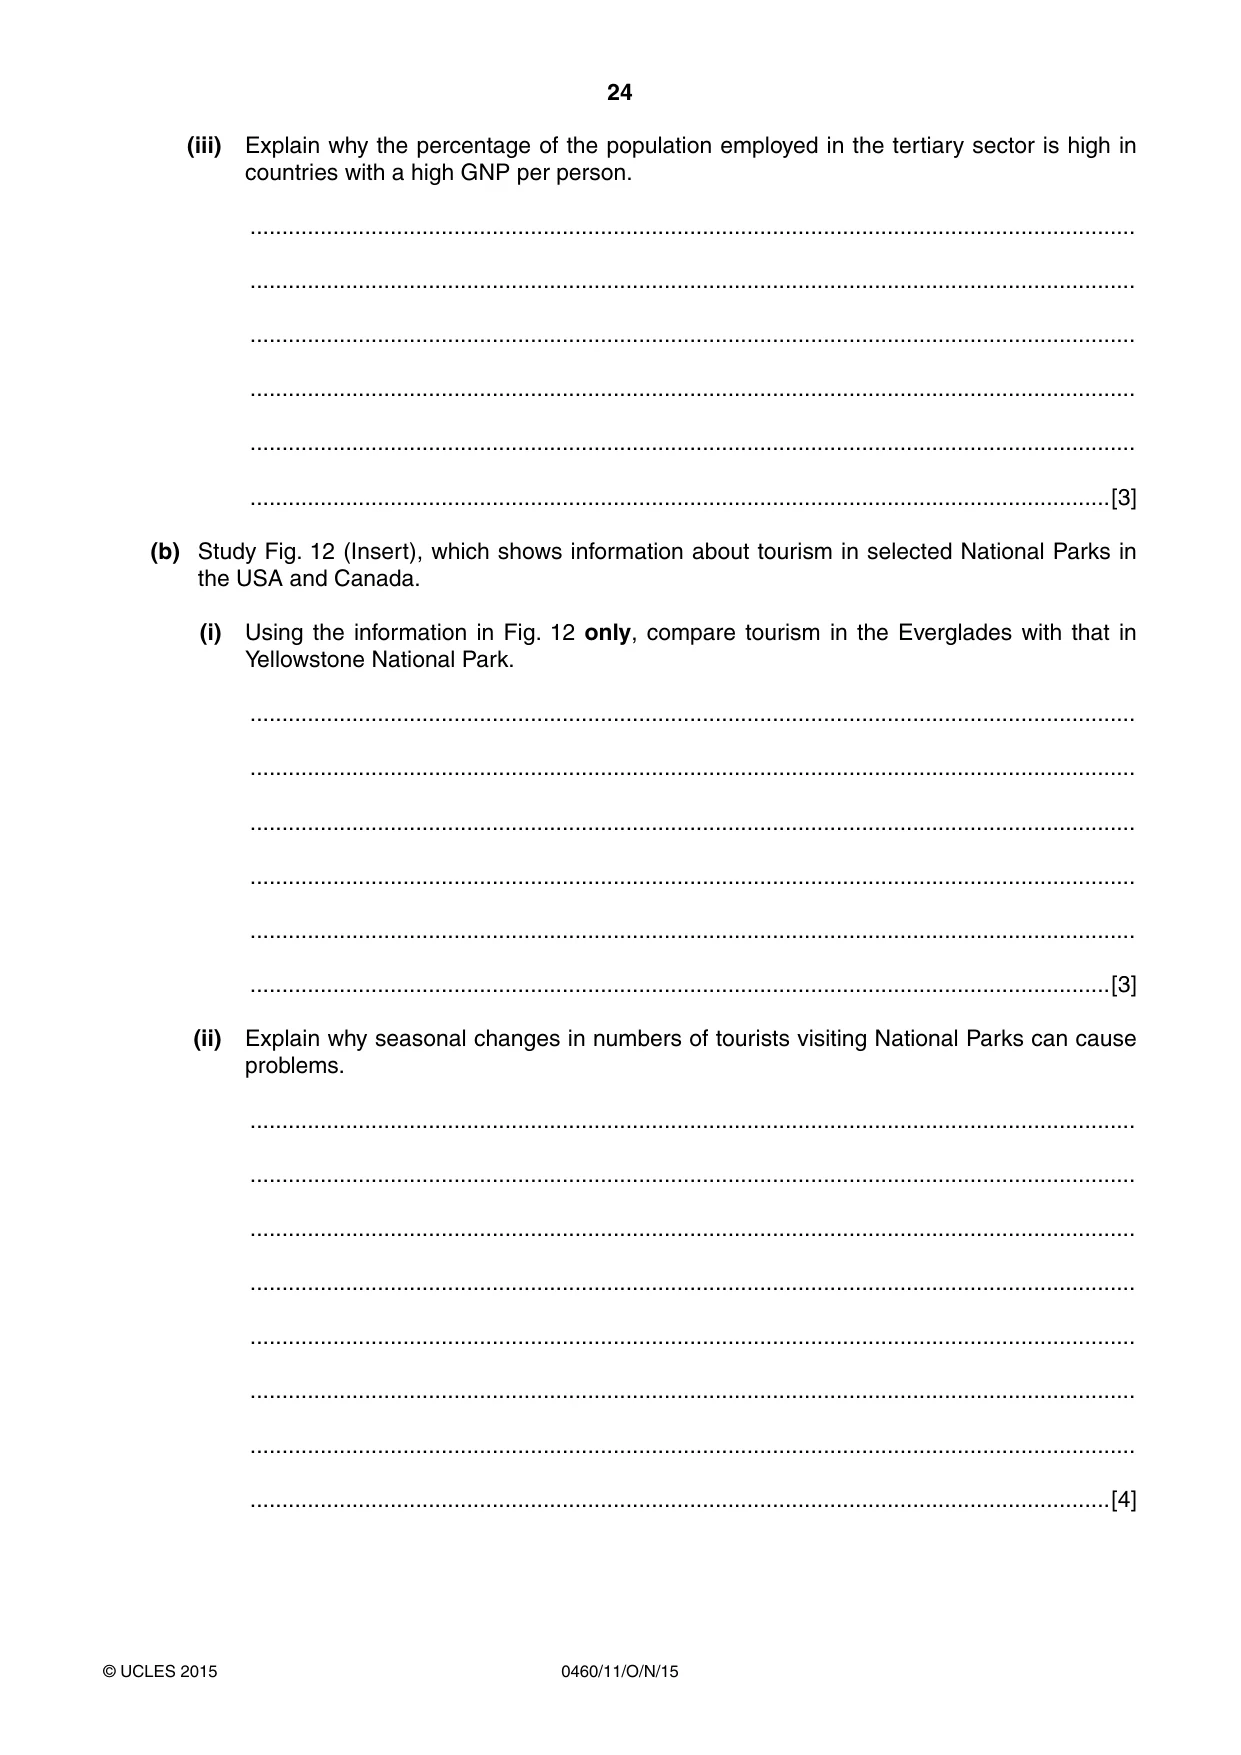
24 0460/11/O/N/15 © UCLES 2015 (iii) Explain why the percentage of the population employed in the tertiary sector is high in countries with a high GNP per person. … … … … … …[3] (b) Study Fig. 12 (Insert), which shows information about tourism in selected National Parks in the USA and Canada. (i) Using the information in Fig. 12 only, compare tourism in the Everglades with that in Yellowstone National Park. … … … … … …[3] (ii) Explain why seasonal changes in numbers of tourists visiting National Parks can cause problems. … … … … … … … …[4]
Question paper, page 25
25 0460/11/O/N/15 © UCLES 2015 [Turn over (iii) Explain how the tourist industry can have both positive and negative impacts on the natural environment. … … … … … … … … … …[5]
Question paper, page 26
26 0460/11/O/N/15 © UCLES 2015 (c) For a named area you have studied where the tourist industry is important, describe its natural and human attractions. Named tourist area … … … … … … … … … … … … … … … …[7] [Total: 25 marks] END OF QUESTION 6
Question paper, page 27
27 0460/11/O/N/15 © UCLES 2015 Additional Pages If you use the following lined pages to complete the answer(s) to any question(s), the question number(s) must be clearly shown. … … … … … … … … … … … … … … … … … … … … … … … … … …
Question paper, page 28
28 0460/11/O/N/15 © UCLES 2015 … … … … … … … … … … … … … … … … … … … … … … … Permission to reproduce items where third-party owned material protected by copyright is included has been sought and cleared where possible. Every reasonable effort has been made by the publisher (UCLES) to trace copyright holders, but if any items requiring clearance have unwittingly been included, the publisher will be pleased to make amends at the earliest possible opportunity. To avoid the issue of disclosure of answer-related information to candidates, all copyright acknowledgements are reproduced online in the Cambridge International Examinations Copyright Acknowledgements Booklet. This is produced for each series of examinations and is freely available to download at www.cie.org.uk after the live examination series. Cambridge International Examinations is part of the Cambridge Assessment Group. Cambridge Assessment is the brand name of University of Cambridge Local Examinations Syndicate (UCLES), which is itself a department of the University of Cambridge.
Mark scheme, page 1
® IGCSE is the registered trademark of Cambridge International Examinations. CAMBRIDGE INTERNATIONAL EXAMINATIONS Cambridge International General Certificate of Secondary Education MARK SCHEME for the October/November 2015 series 0460 GEOGRAPHY 0460/11 Paper 1, maximum raw mark 75 This mark scheme is published as an aid to teachers and candidates, to indicate the requirements of the examination. It shows the basis on which Examiners were instructed to award marks. It does not indicate the details of the discussions that took place at an Examiners’ meeting before marking began, which would have considered the acceptability of alternative answers. Mark schemes should be read in conjunction with the question paper and the Principal Examiner Report for Teachers. Cambridge will not enter into discussions about these mark schemes. Cambridge is publishing the mark schemes for the October/November 2015 series for most Cambridge IGCSE®, Cambridge International A and AS Level components and some Cambridge O Level components.
Mark scheme, page 2
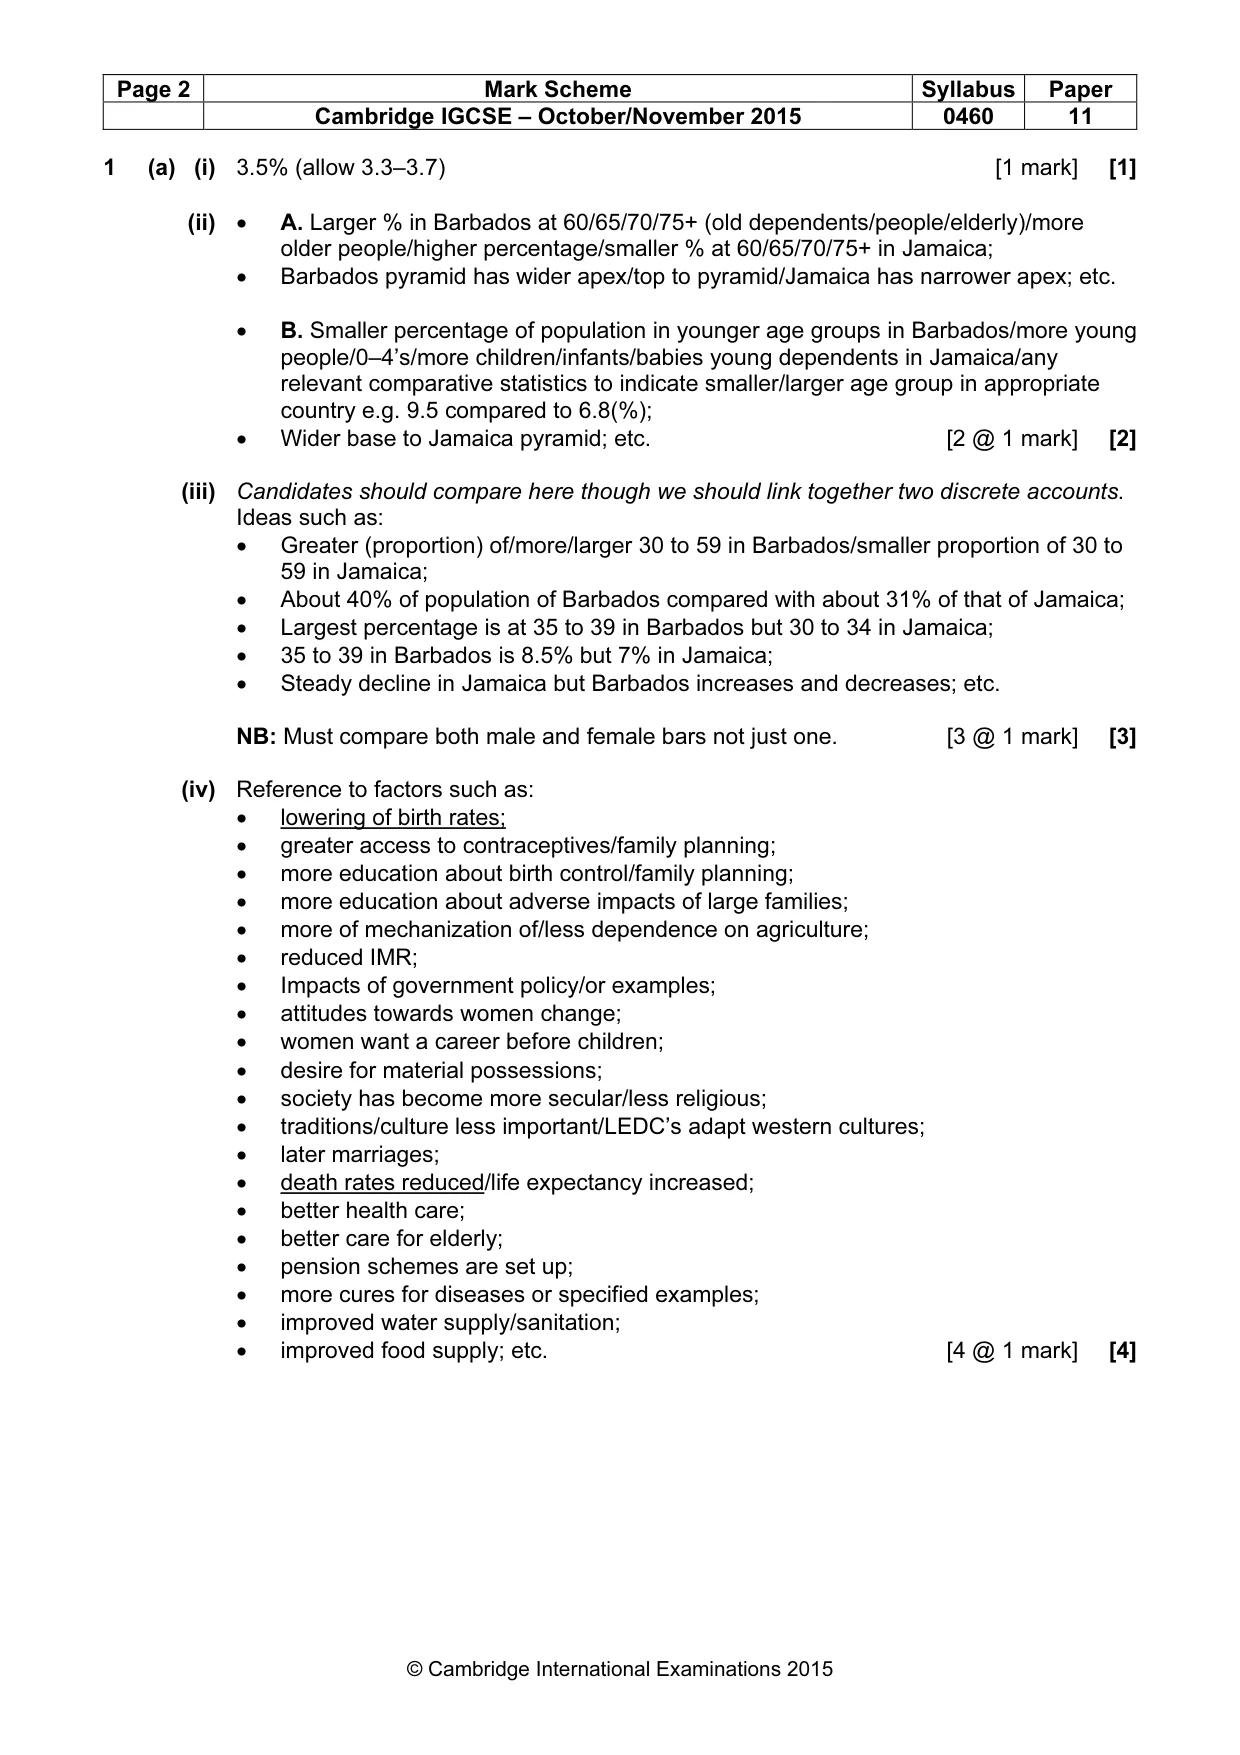
Page 2 Mark Scheme Syllabus Paper Cambridge IGCSE – October/November 2015 0460 11 © Cambridge International Examinations 2015 1 (a) (i) 3.5% (allow 3.3–3.7) [1 mark] [1] (ii) • A. Larger % in Barbados at 60/65/70/75+ (old dependents/people/elderly)/more older people/higher percentage/smaller % at 60/65/70/75+ in Jamaica; • Barbados pyramid has wider apex/top to pyramid/Jamaica has narrower apex; etc. • B. Smaller percentage of population in younger age groups in Barbados/more young people/0–4’s/more children/infants/babies young dependents in Jamaica/any relevant comparative statistics to indicate smaller/larger age group in appropriate country e.g. 9.5 compared to 6.8(%); • Wider base to Jamaica pyramid; etc. [2 @ 1 mark] [2] (iii) Candidates should compare here though we should link together two discrete accounts. Ideas such as: • Greater (proportion) of/more/larger 30 to 59 in Barbados/smaller proportion of 30 to 59 in Jamaica; • About 40% of population of Barbados compared with about 31% of that of Jamaica; • Largest percentage is at 35 to 39 in Barbados but 30 to 34 in Jamaica; • 35 to 39 in Barbados is 8.5% but 7% in Jamaica; • Steady decline in Jamaica but Barbados increases and decreases; etc. NB: Must compare both male and female bars not just one. [3 @ 1 mark] [3] (iv) Reference to factors such as: • lowering of birth rates; • greater access to contraceptives/family planning; • more education about birth control/family planning; • more education about adverse impacts of large families; • more of mechanization of/less dependence on agriculture; • reduced IMR; • Impacts of government policy/or examples; • attitudes towards women change; • women want a career before children; • desire for material possessions; • society has become more secular/less religious; • traditions/culture less important/LEDC’s adapt western cultures; • later marriages; • death rates reduced/life expectancy increased; • better health care; • better care for elderly; • pension schemes are set up; • more cures for diseases or specified examples; • improved water supply/sanitation; • improved food supply; etc. [4 @ 1 mark] [4]
Mark scheme, page 3
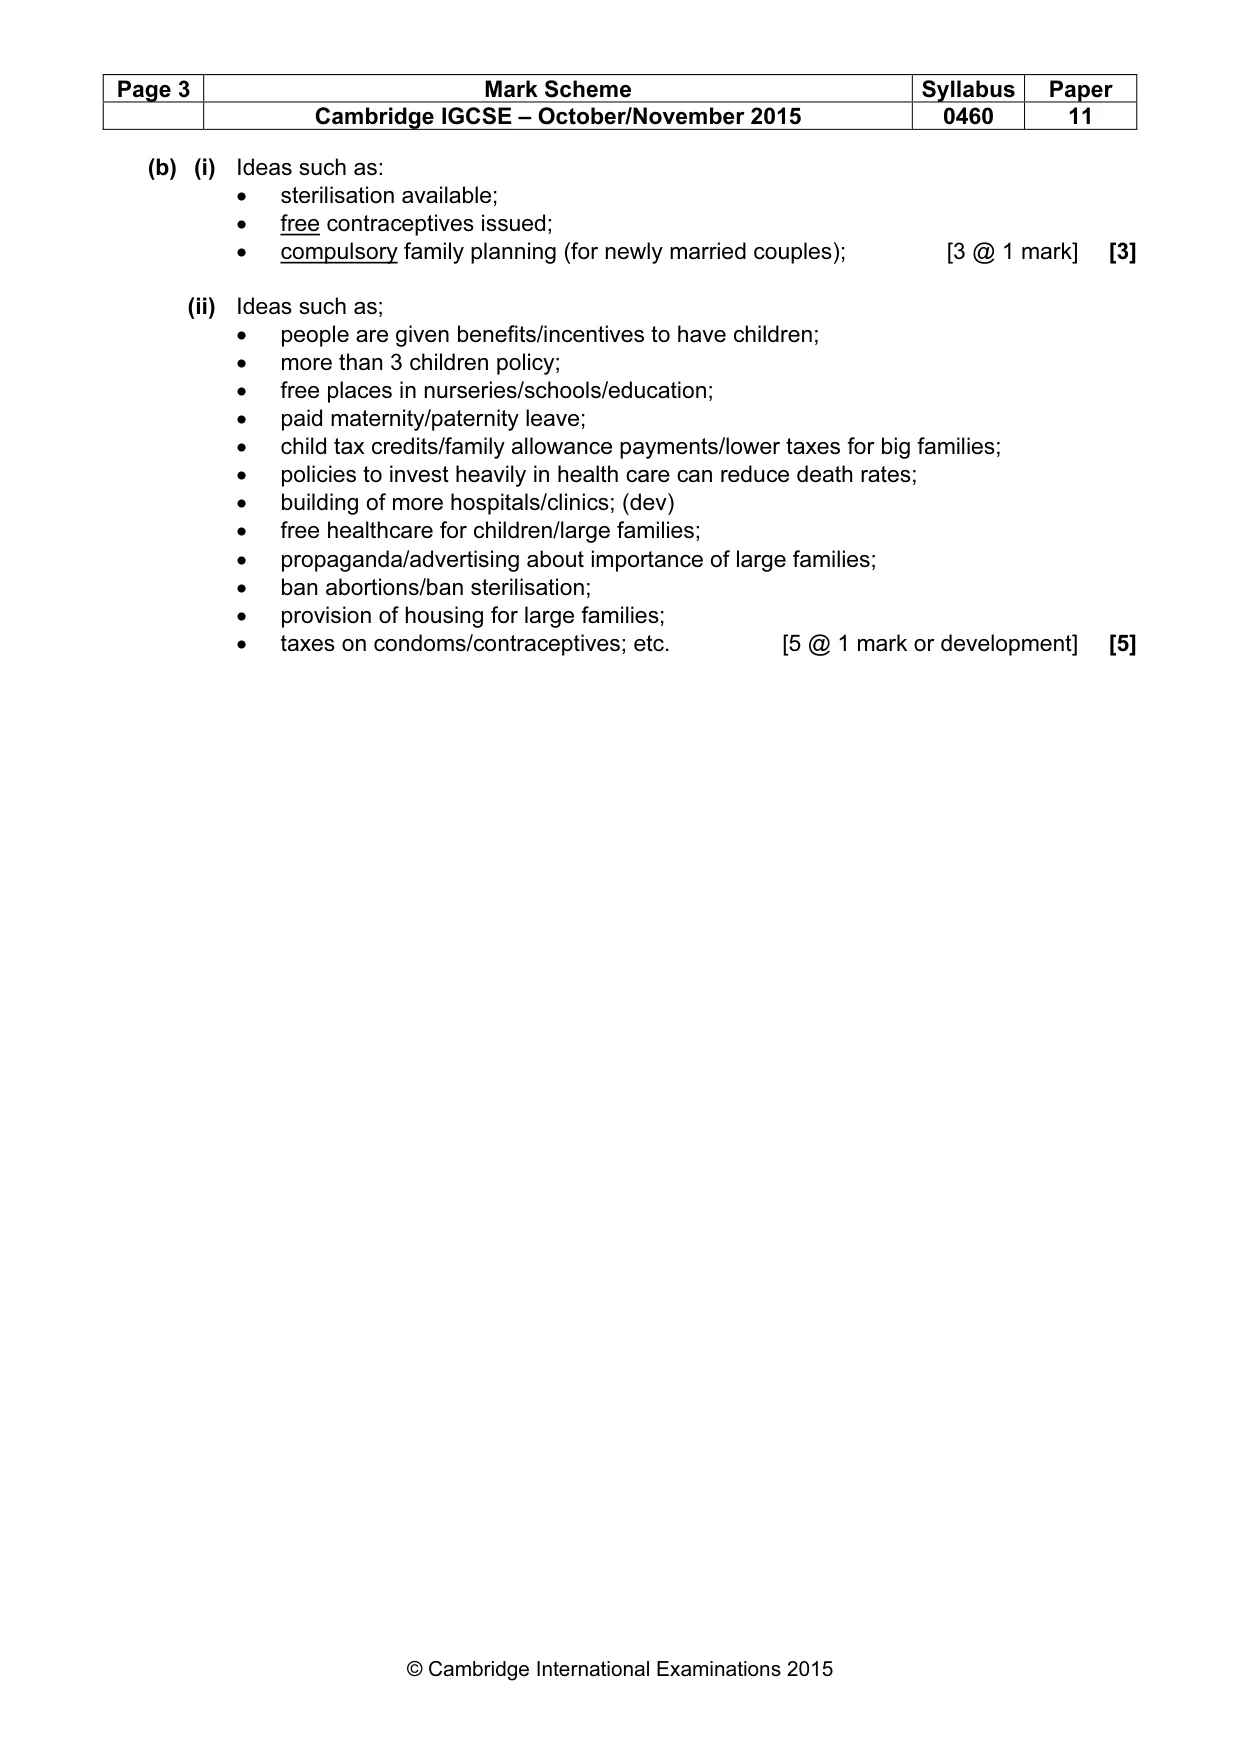
Page 3 Mark Scheme Syllabus Paper Cambridge IGCSE – October/November 2015 0460 11 © Cambridge International Examinations 2015 (b) (i) Ideas such as: • sterilisation available; • free contraceptives issued; • compulsory family planning (for newly married couples); [3 @ 1 mark] [3] (ii) Ideas such as; • people are given benefits/incentives to have children; • more than 3 children policy; • free places in nurseries/schools/education; • paid maternity/paternity leave; • child tax credits/family allowance payments/lower taxes for big families; • policies to invest heavily in health care can reduce death rates; • building of more hospitals/clinics; (dev) • free healthcare for children/large families; • propaganda/advertising about importance of large families; • ban abortions/ban sterilisation; • provision of housing for large families; • taxes on condoms/contraceptives; etc. [5 @ 1 mark or development] [5]
Mark scheme, page 4
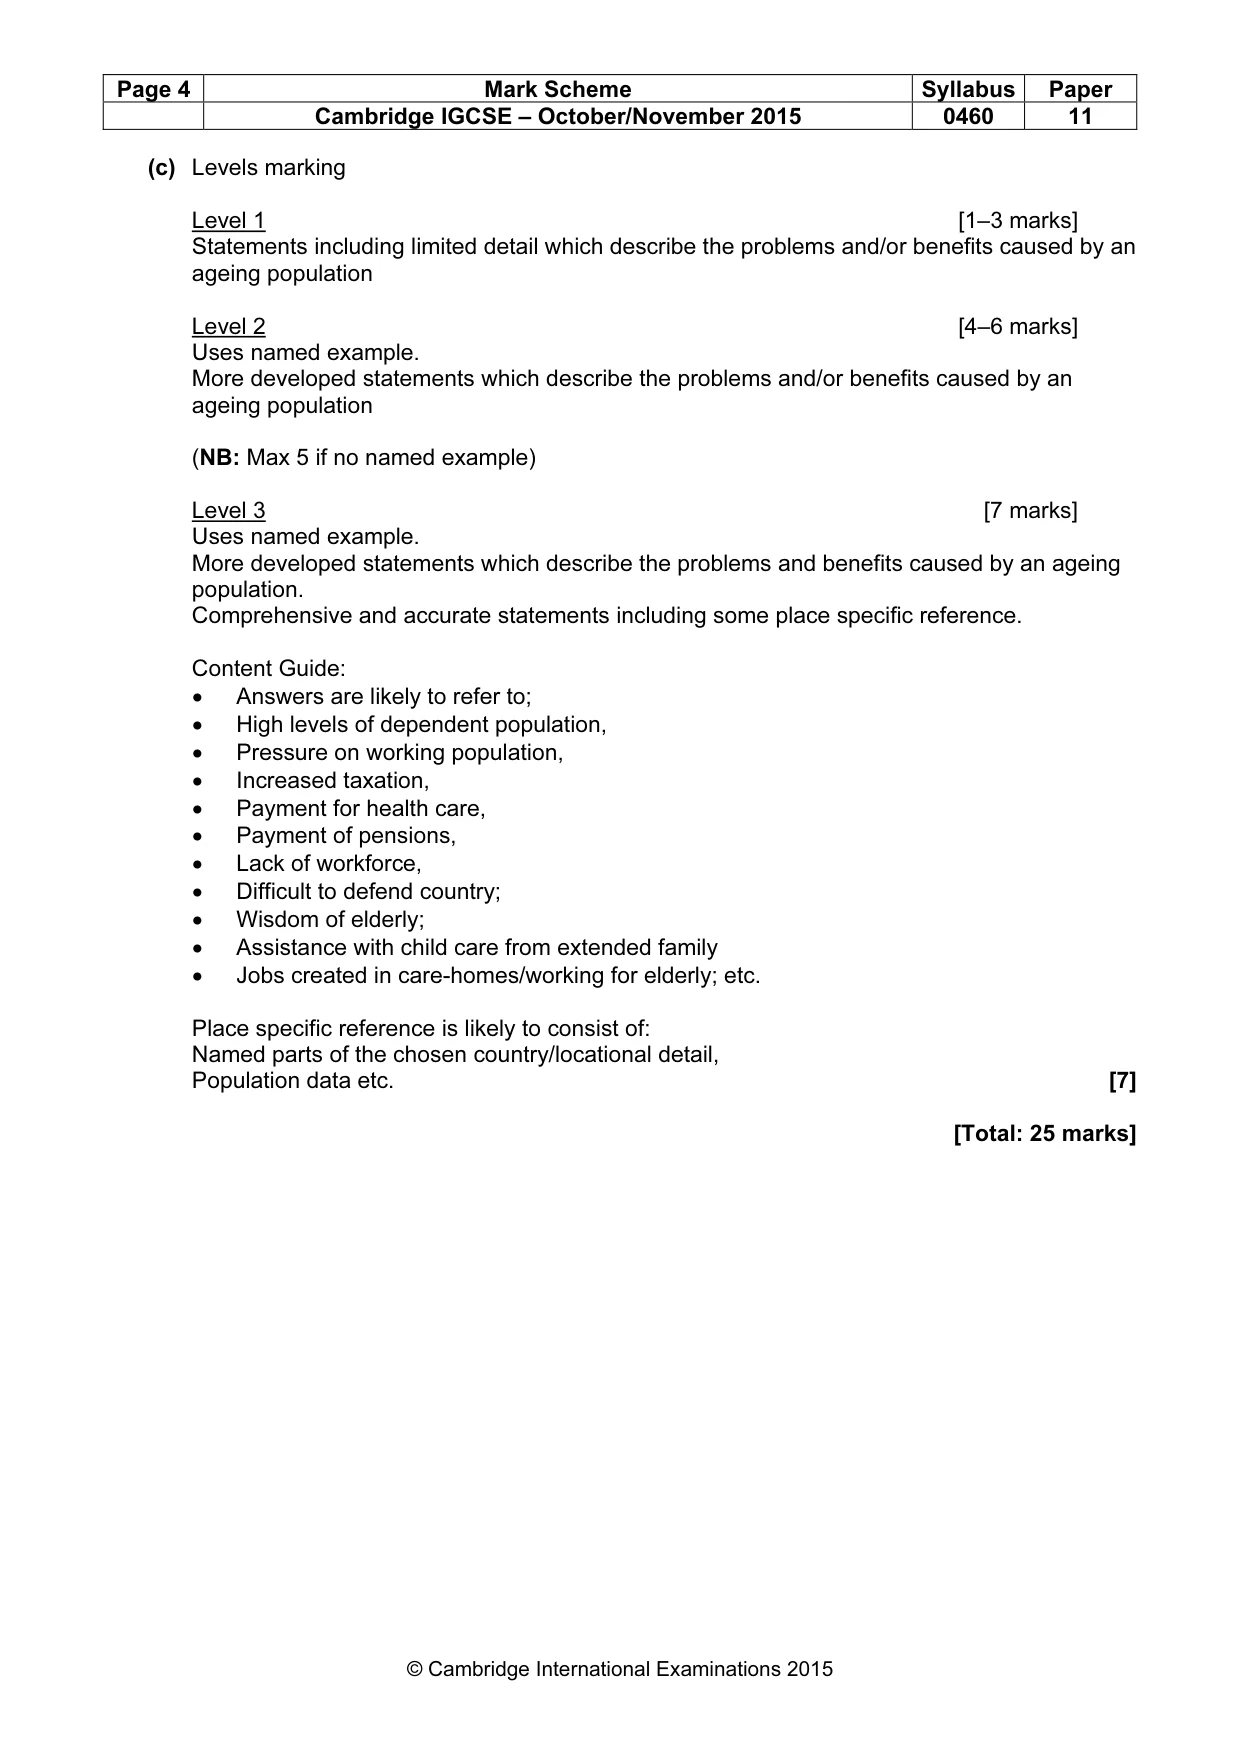
Page 4 Mark Scheme Syllabus Paper Cambridge IGCSE – October/November 2015 0460 11 © Cambridge International Examinations 2015 (c) Levels marking Level 1 [1–3 marks] Statements including limited detail which describe the problems and/or benefits caused by an ageing population Level 2 [4–6 marks] Uses named example. More developed statements which describe the problems and/or benefits caused by an ageing population (NB: Max 5 if no named example) Level 3 [7 marks] Uses named example. More developed statements which describe the problems and benefits caused by an ageing population. Comprehensive and accurate statements including some place specific reference. Content Guide: • Answers are likely to refer to; • High levels of dependent population, • Pressure on working population, • Increased taxation, • Payment for health care, • Payment of pensions, • Lack of workforce, • Difficult to defend country; • Wisdom of elderly; • Assistance with child care from extended family • Jobs created in care-homes/working for elderly; etc. Place specific reference is likely to consist of: Named parts of the chosen country/locational detail, Population data etc. [7] [Total: 25 marks]
Mark scheme, page 5
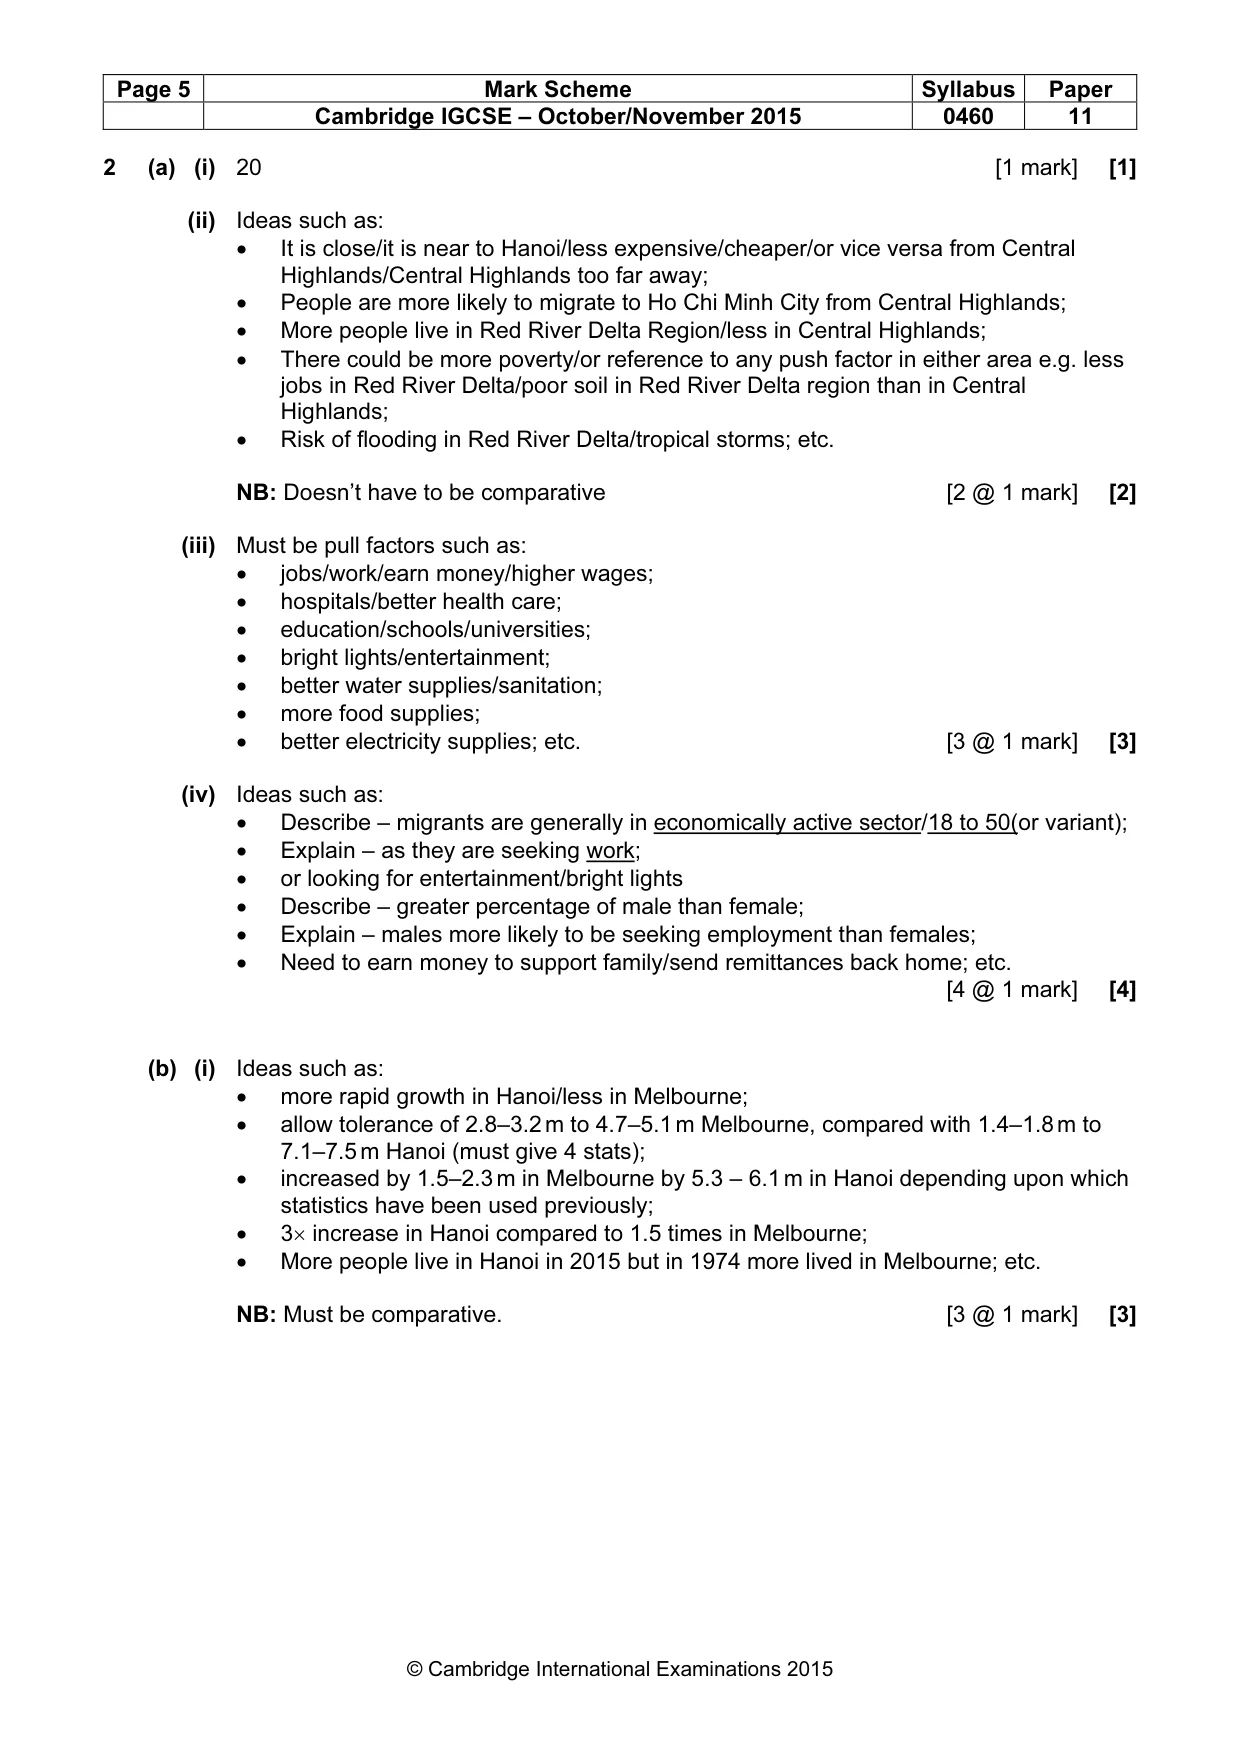
Page 5 Mark Scheme Syllabus Paper Cambridge IGCSE – October/November 2015 0460 11 © Cambridge International Examinations 2015 2 (a) (i) 20 [1 mark] [1] (ii) Ideas such as: • It is close/it is near to Hanoi/less expensive/cheaper/or vice versa from Central Highlands/Central Highlands too far away; • People are more likely to migrate to Ho Chi Minh City from Central Highlands; • More people live in Red River Delta Region/less in Central Highlands; • There could be more poverty/or reference to any push factor in either area e.g. less jobs in Red River Delta/poor soil in Red River Delta region than in Central Highlands; • Risk of flooding in Red River Delta/tropical storms; etc. NB: Doesn’t have to be comparative [2 @ 1 mark] [2] (iii) Must be pull factors such as: • jobs/work/earn money/higher wages; • hospitals/better health care; • education/schools/universities; • bright lights/entertainment; • better water supplies/sanitation; • more food supplies; • better electricity supplies; etc. [3 @ 1 mark] [3] (iv) Ideas such as: • Describe – migrants are generally in economically active sector/18 to 50(or variant); • Explain – as they are seeking work; • or looking for entertainment/bright lights • Describe – greater percentage of male than female; • Explain – males more likely to be seeking employment than females; • Need to earn money to support family/send remittances back home; etc. [4 @ 1 mark] [4] (b) (i) Ideas such as: • more rapid growth in Hanoi/less in Melbourne; • allow tolerance of 2.8–3.2 m to 4.7–5.1 m Melbourne, compared with 1.4–1.8 m to 7.1–7.5 m Hanoi (must give 4 stats); • increased by 1.5–2.3 m in Melbourne by 5.3 – 6.1 m in Hanoi depending upon which statistics have been used previously; • 3× increase in Hanoi compared to 1.5 times in Melbourne; • More people live in Hanoi in 2015 but in 1974 more lived in Melbourne; etc. NB: Must be comparative. [3 @ 1 mark] [3]
Mark scheme, page 6
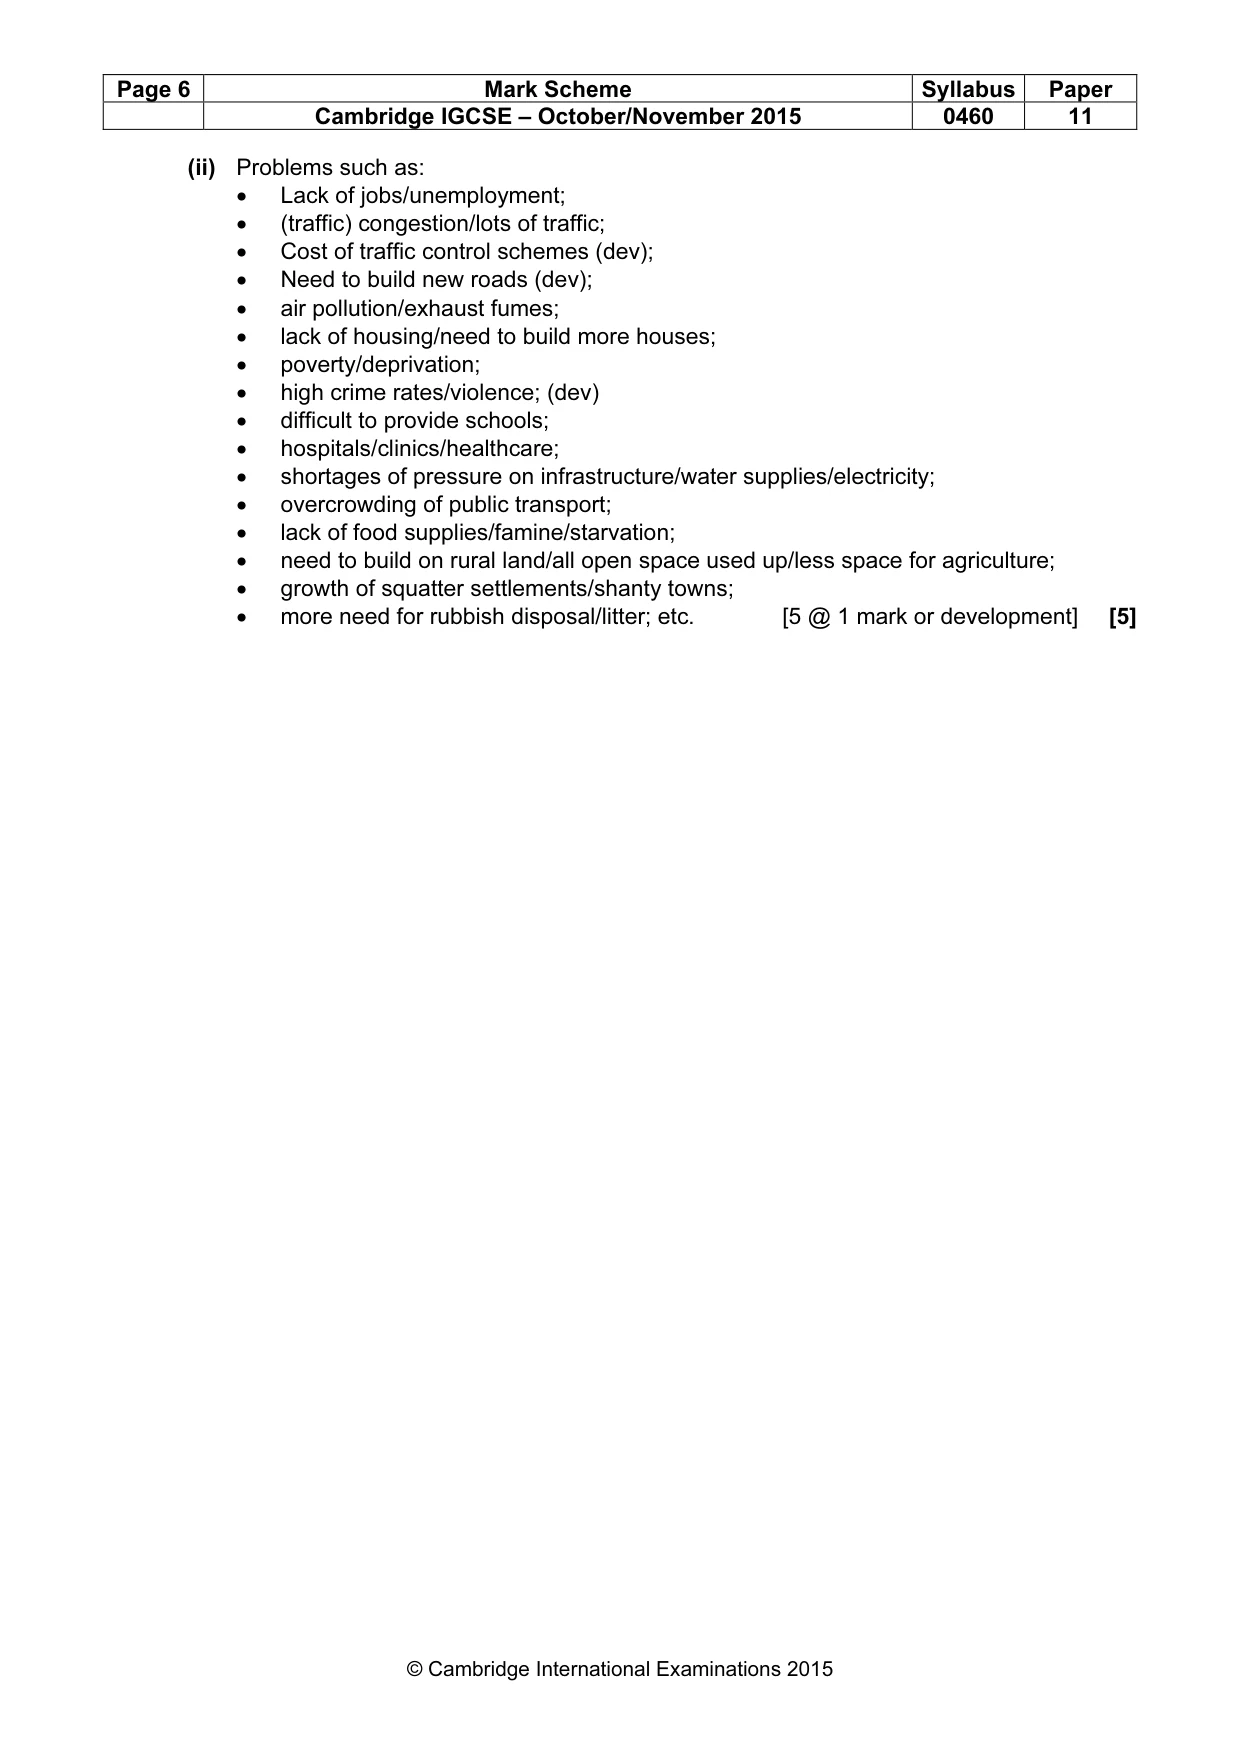
Page 6 Mark Scheme Syllabus Paper Cambridge IGCSE – October/November 2015 0460 11 © Cambridge International Examinations 2015 (ii) Problems such as: • Lack of jobs/unemployment; • (traffic) congestion/lots of traffic; • Cost of traffic control schemes (dev); • Need to build new roads (dev); • air pollution/exhaust fumes; • lack of housing/need to build more houses; • poverty/deprivation; • high crime rates/violence; (dev) • difficult to provide schools; • hospitals/clinics/healthcare; • shortages of pressure on infrastructure/water supplies/electricity; • overcrowding of public transport; • lack of food supplies/famine/starvation; • need to build on rural land/all open space used up/less space for agriculture; • growth of squatter settlements/shanty towns; • more need for rubbish disposal/litter; etc. [5 @ 1 mark or development] [5]
Mark scheme, page 7
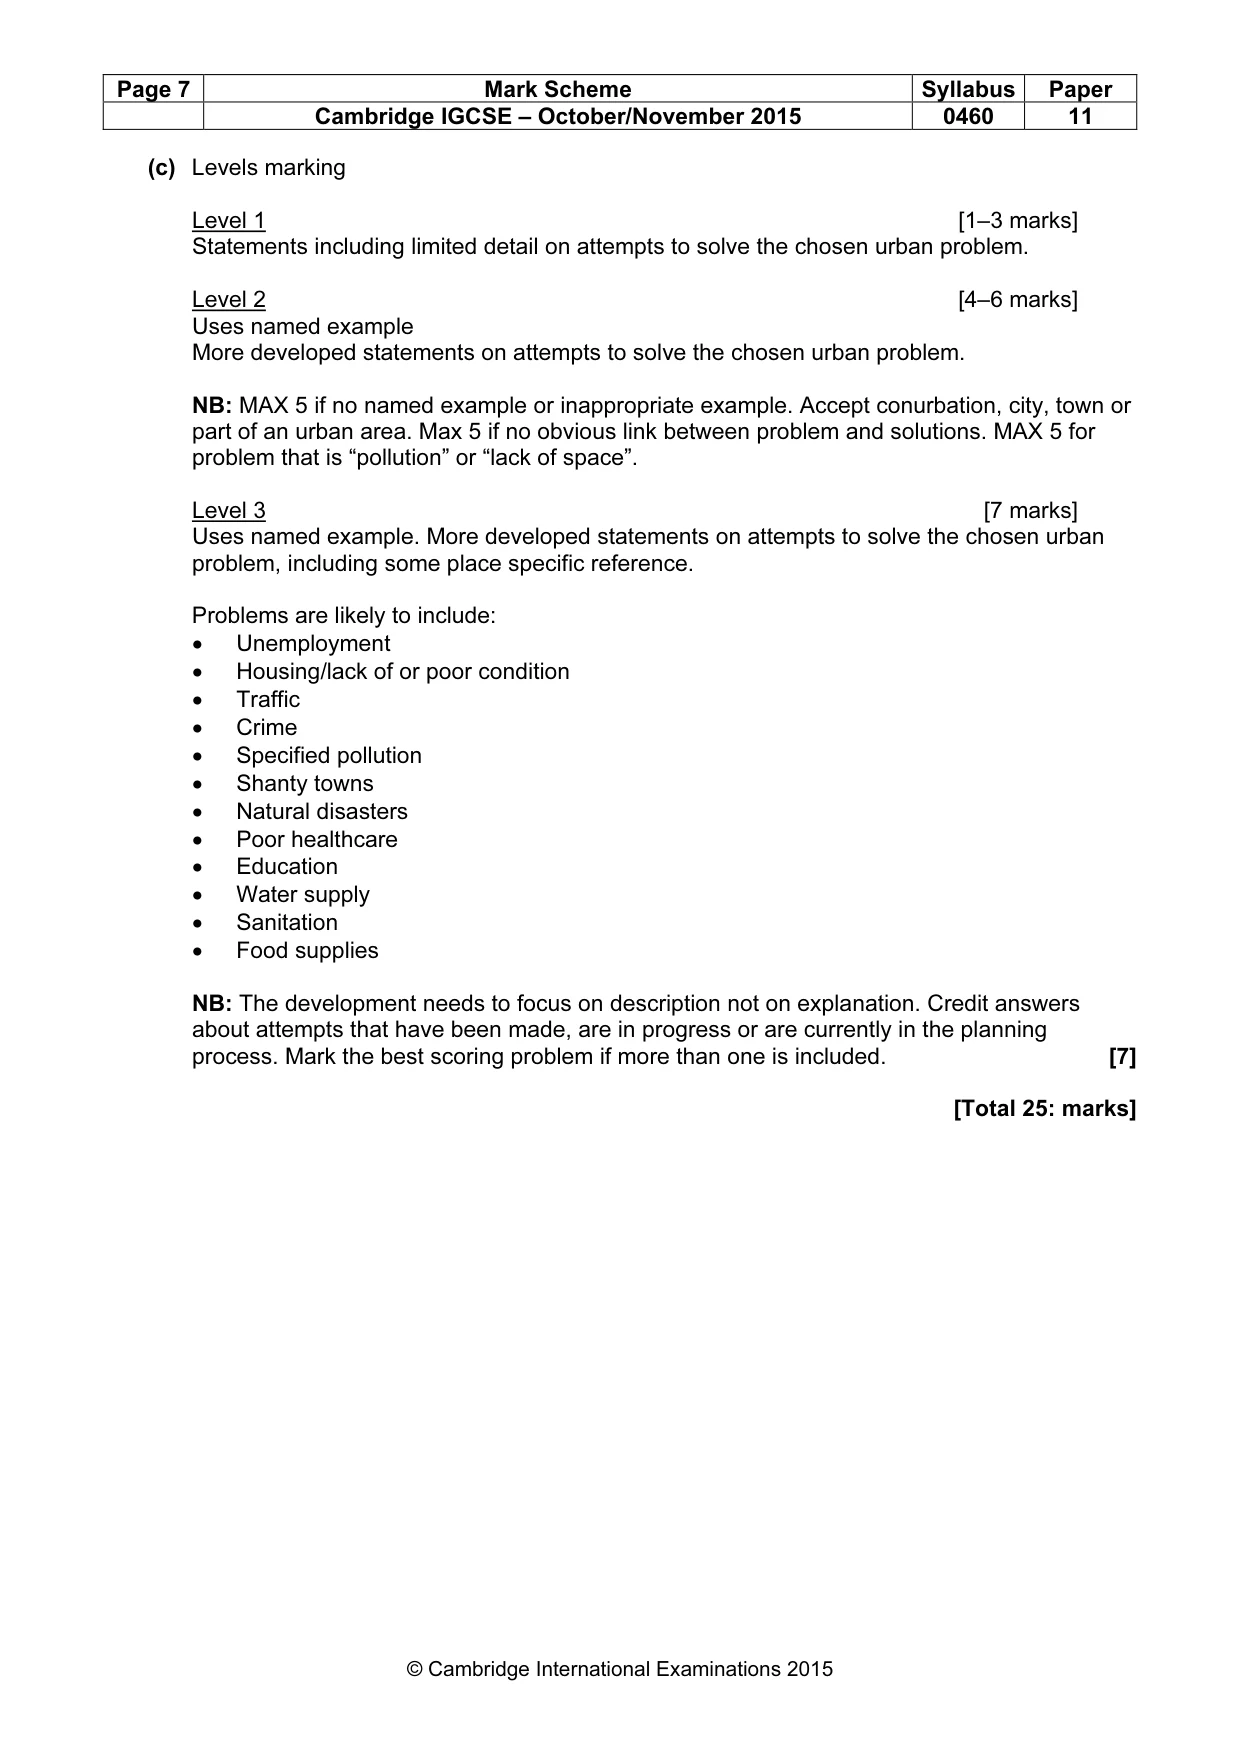
Page 7 Mark Scheme Syllabus Paper Cambridge IGCSE – October/November 2015 0460 11 © Cambridge International Examinations 2015 (c) Levels marking Level 1 [1–3 marks] Statements including limited detail on attempts to solve the chosen urban problem. Level 2 [4–6 marks] Uses named example More developed statements on attempts to solve the chosen urban problem. NB: MAX 5 if no named example or inappropriate example. Accept conurbation, city, town or part of an urban area. Max 5 if no obvious link between problem and solutions. MAX 5 for problem that is “pollution” or “lack of space”. Level 3 [7 marks] Uses named example. More developed statements on attempts to solve the chosen urban problem, including some place specific reference. Problems are likely to include: • Unemployment • Housing/lack of or poor condition • Traffic • Crime • Specified pollution • Shanty towns • Natural disasters • Poor healthcare • Education • Water supply • Sanitation • Food supplies NB: The development needs to focus on description not on explanation. Credit answers about attempts that have been made, are in progress or are currently in the planning process. Mark the best scoring problem if more than one is included. [7] [Total 25: marks]
Mark scheme, page 8
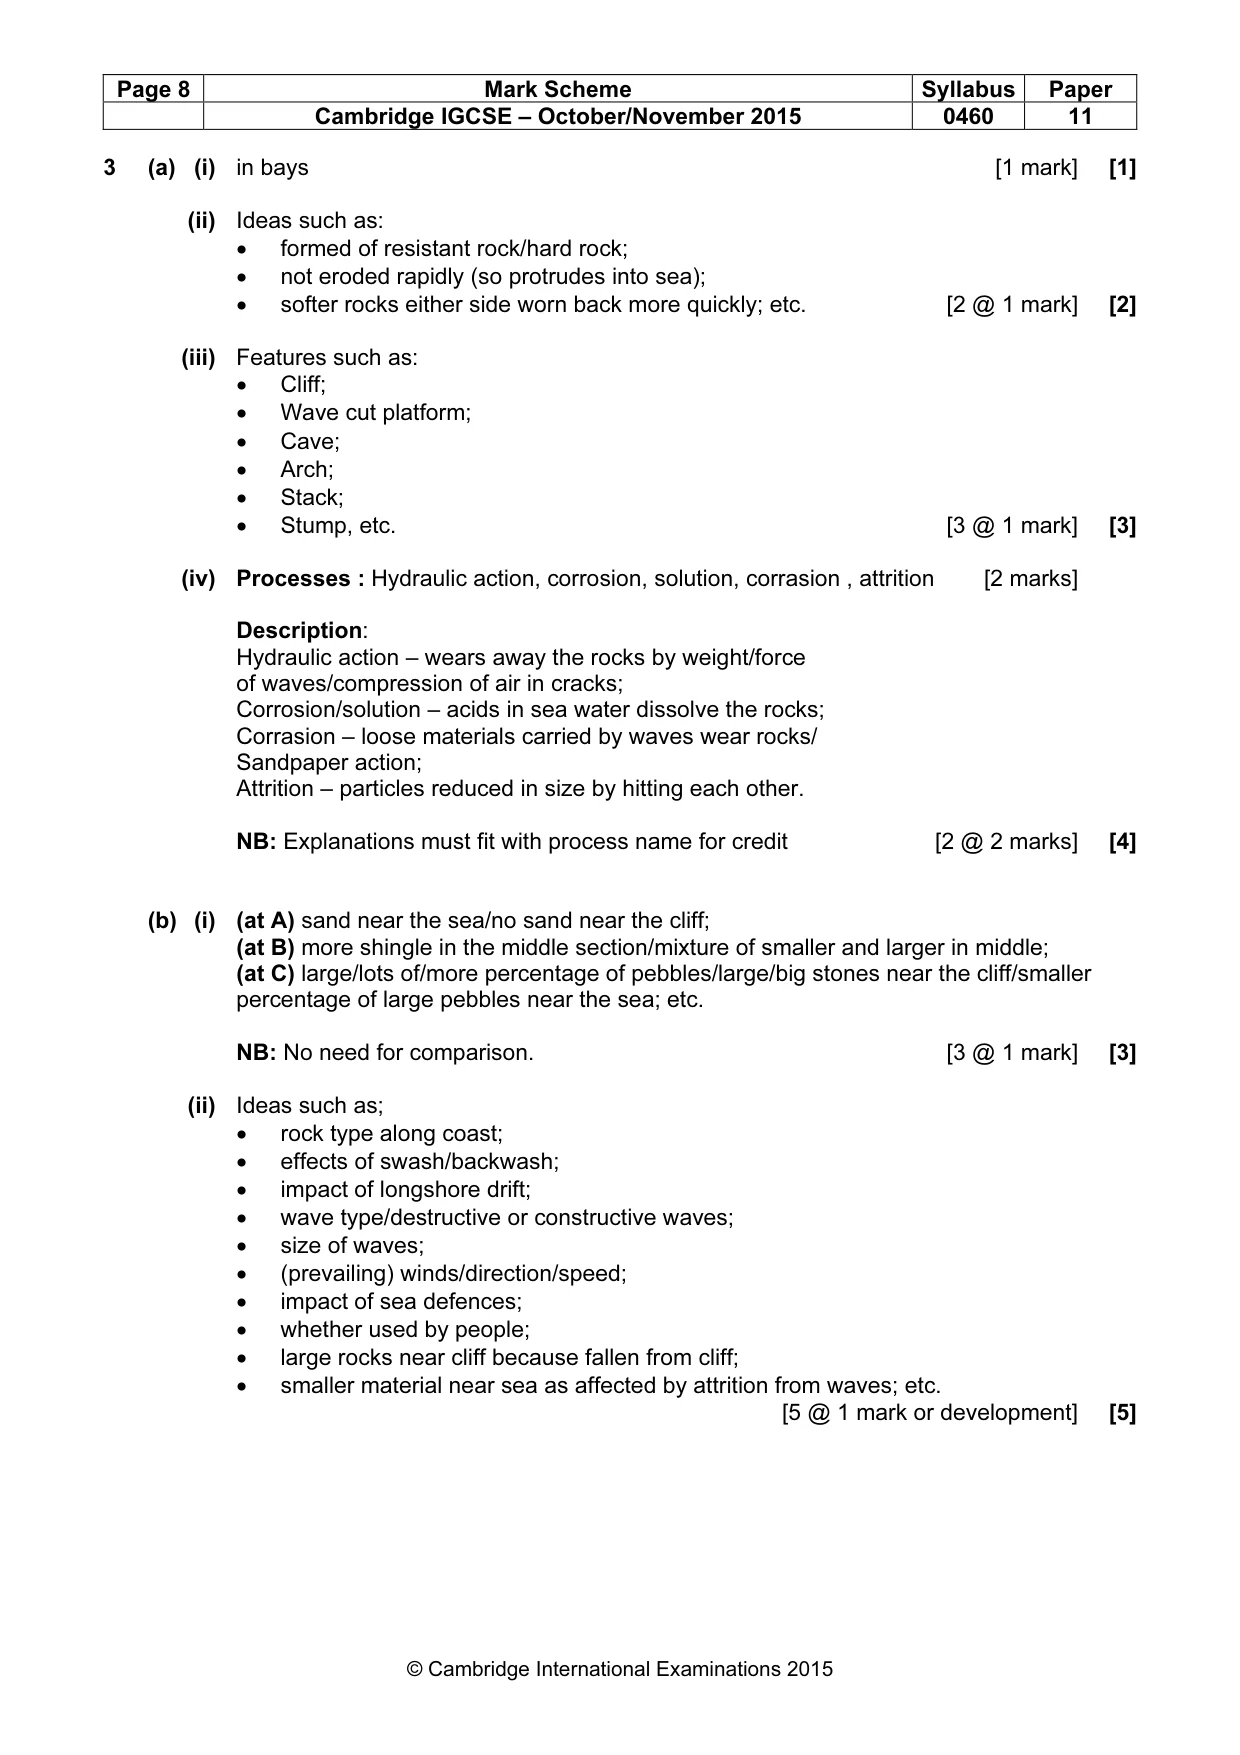
Page 8 Mark Scheme Syllabus Paper Cambridge IGCSE – October/November 2015 0460 11 © Cambridge International Examinations 2015 3 (a) (i) in bays [1 mark] [1] (ii) Ideas such as: • formed of resistant rock/hard rock; • not eroded rapidly (so protrudes into sea); • softer rocks either side worn back more quickly; etc. [2 @ 1 mark] [2] (iii) Features such as: • Cliff; • Wave cut platform; • Cave; • Arch; • Stack; • Stump, etc. [3 @ 1 mark] [3] (iv) Processes : Hydraulic action, corrosion, solution, corrasion , attrition [2 marks] Description: Hydraulic action – wears away the rocks by weight/force of waves/compression of air in cracks; Corrosion/solution – acids in sea water dissolve the rocks; Corrasion – loose materials carried by waves wear rocks/ Sandpaper action; Attrition – particles reduced in size by hitting each other. NB: Explanations must fit with process name for credit [2 @ 2 marks] [4] (b) (i) (at A) sand near the sea/no sand near the cliff; (at B) more shingle in the middle section/mixture of smaller and larger in middle; (at C) large/lots of/more percentage of pebbles/large/big stones near the cliff/smaller percentage of large pebbles near the sea; etc. NB: No need for comparison. [3 @ 1 mark] [3] (ii) Ideas such as; • rock type along coast; • effects of swash/backwash; • impact of longshore drift; • wave type/destructive or constructive waves; • size of waves; • (prevailing) winds/direction/speed; • impact of sea defences; • whether used by people; • large rocks near cliff because fallen from cliff; • smaller material near sea as affected by attrition from waves; etc. [5 @ 1 mark or development] [5]
Mark scheme, page 9
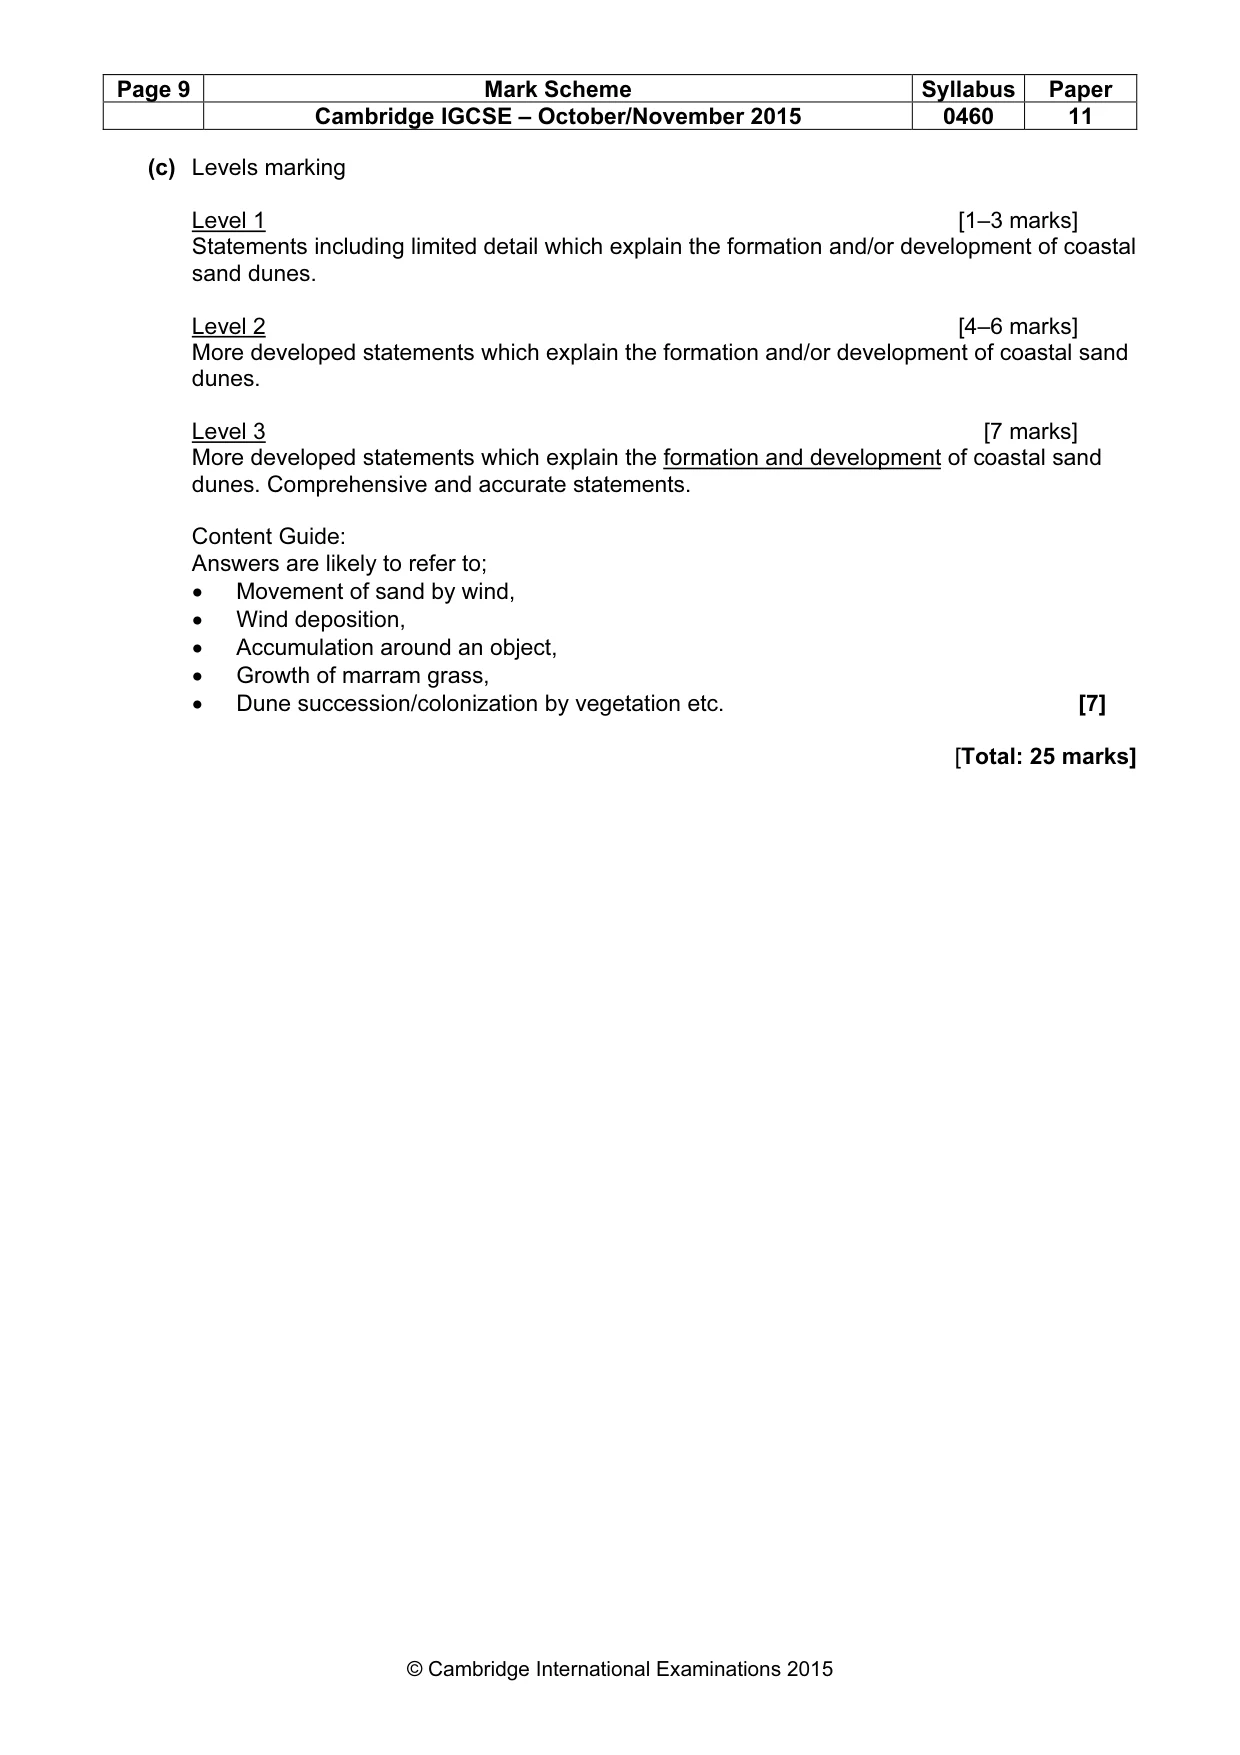
Page 9 Mark Scheme Syllabus Paper Cambridge IGCSE – October/November 2015 0460 11 © Cambridge International Examinations 2015 (c) Levels marking Level 1 [1–3 marks] Statements including limited detail which explain the formation and/or development of coastal sand dunes. Level 2 [4–6 marks] More developed statements which explain the formation and/or development of coastal sand dunes. Level 3 [7 marks] More developed statements which explain the formation and development of coastal sand dunes. Comprehensive and accurate statements. Content Guide: Answers are likely to refer to; • Movement of sand by wind, • Wind deposition, • Accumulation around an object, • Growth of marram grass, • Dune succession/colonization by vegetation etc. [7] [Total: 25 marks]
Mark scheme, page 10
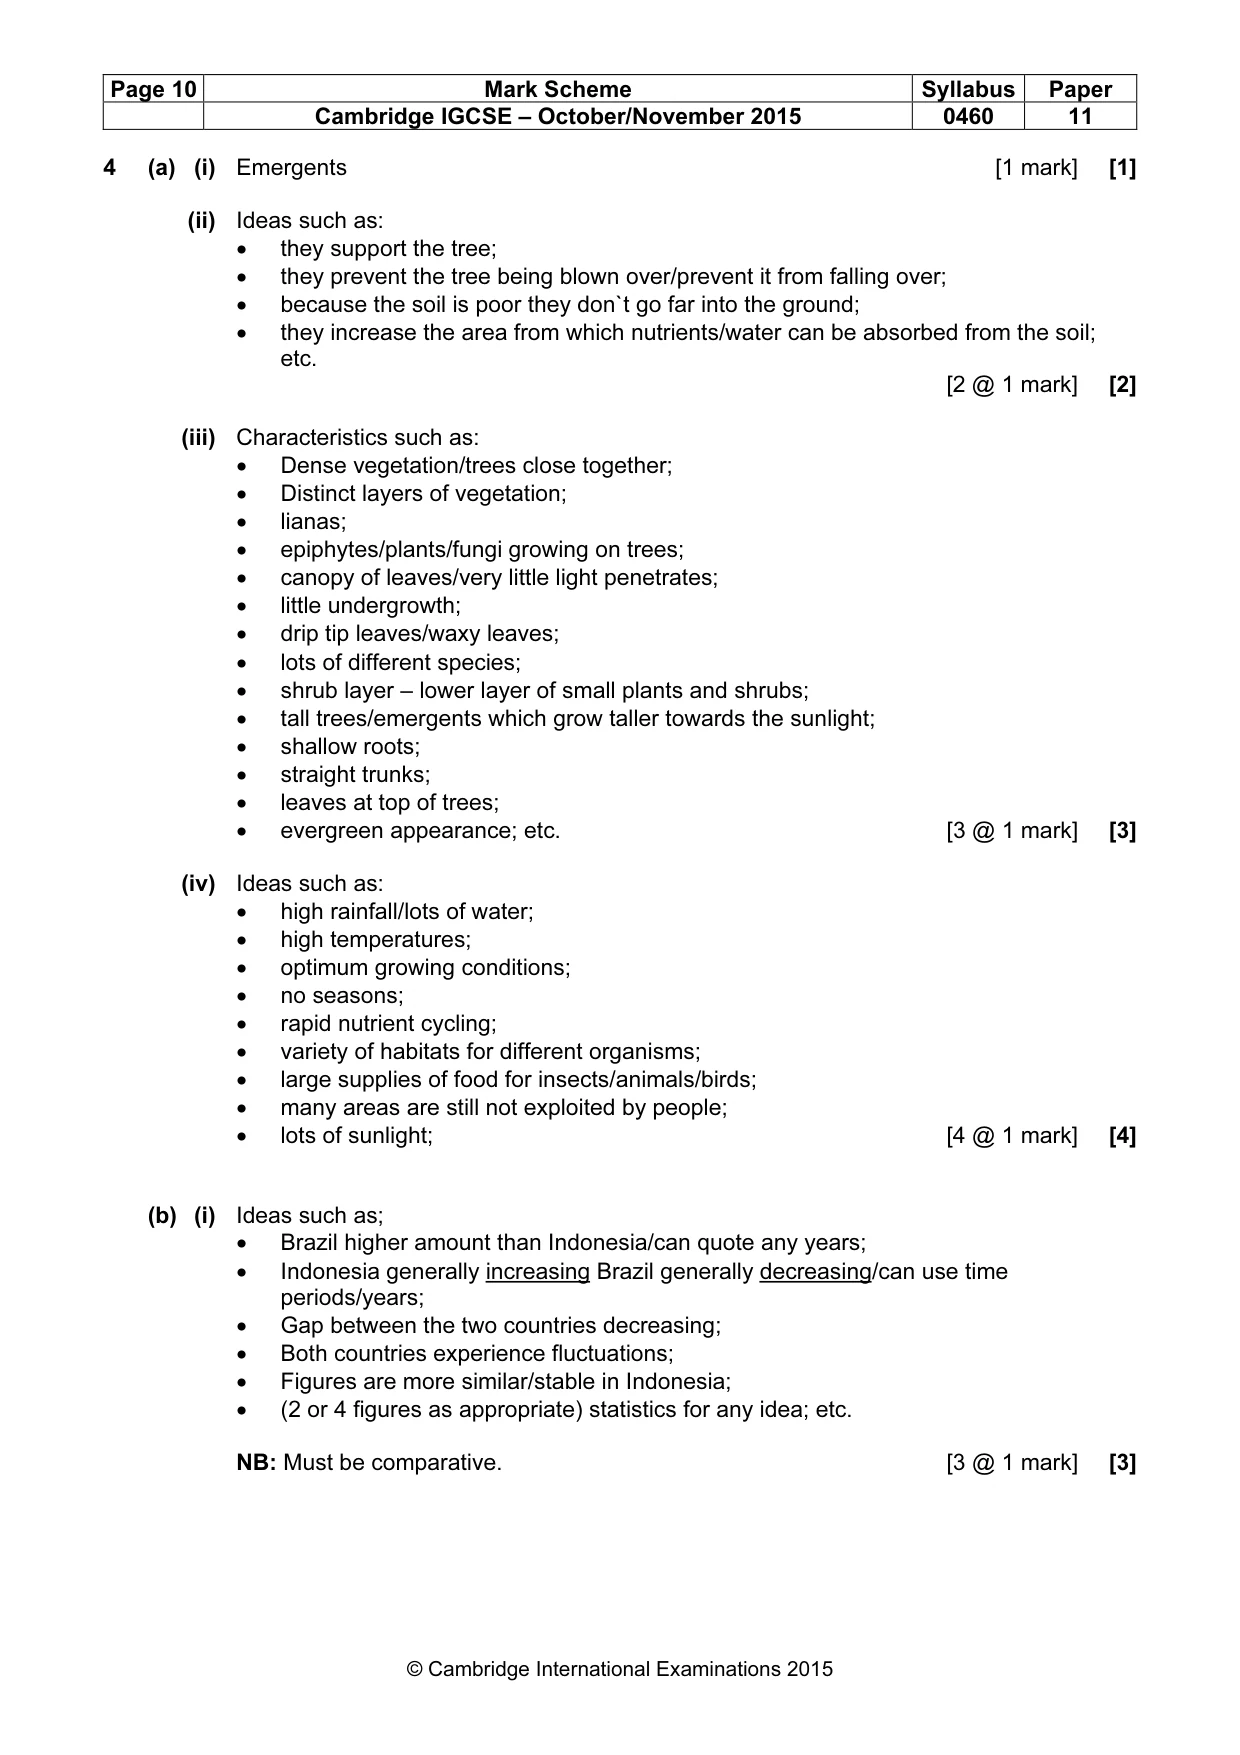
Page 10 Mark Scheme Syllabus Paper Cambridge IGCSE – October/November 2015 0460 11 © Cambridge International Examinations 2015 4 (a) (i) Emergents [1 mark] [1] (ii) Ideas such as: • they support the tree; • they prevent the tree being blown over/prevent it from falling over; • because the soil is poor they don`t go far into the ground; • they increase the area from which nutrients/water can be absorbed from the soil; etc. [2 @ 1 mark] [2] (iii) Characteristics such as: • Dense vegetation/trees close together; • Distinct layers of vegetation; • lianas; • epiphytes/plants/fungi growing on trees; • canopy of leaves/very little light penetrates; • little undergrowth; • drip tip leaves/waxy leaves; • lots of different species; • shrub layer – lower layer of small plants and shrubs; • tall trees/emergents which grow taller towards the sunlight; • shallow roots; • straight trunks; • leaves at top of trees; • evergreen appearance; etc. [3 @ 1 mark] [3] (iv) Ideas such as: • high rainfall/lots of water; • high temperatures; • optimum growing conditions; • no seasons; • rapid nutrient cycling; • variety of habitats for different organisms; • large supplies of food for insects/animals/birds; • many areas are still not exploited by people; • lots of sunlight; [4 @ 1 mark] [4] (b) (i) Ideas such as; • Brazil higher amount than Indonesia/can quote any years; • Indonesia generally increasing Brazil generally decreasing/can use time periods/years; • Gap between the two countries decreasing; • Both countries experience fluctuations; • Figures are more similar/stable in Indonesia; • (2 or 4 figures as appropriate) statistics for any idea; etc. NB: Must be comparative. [3 @ 1 mark] [3]
Mark scheme, page 11
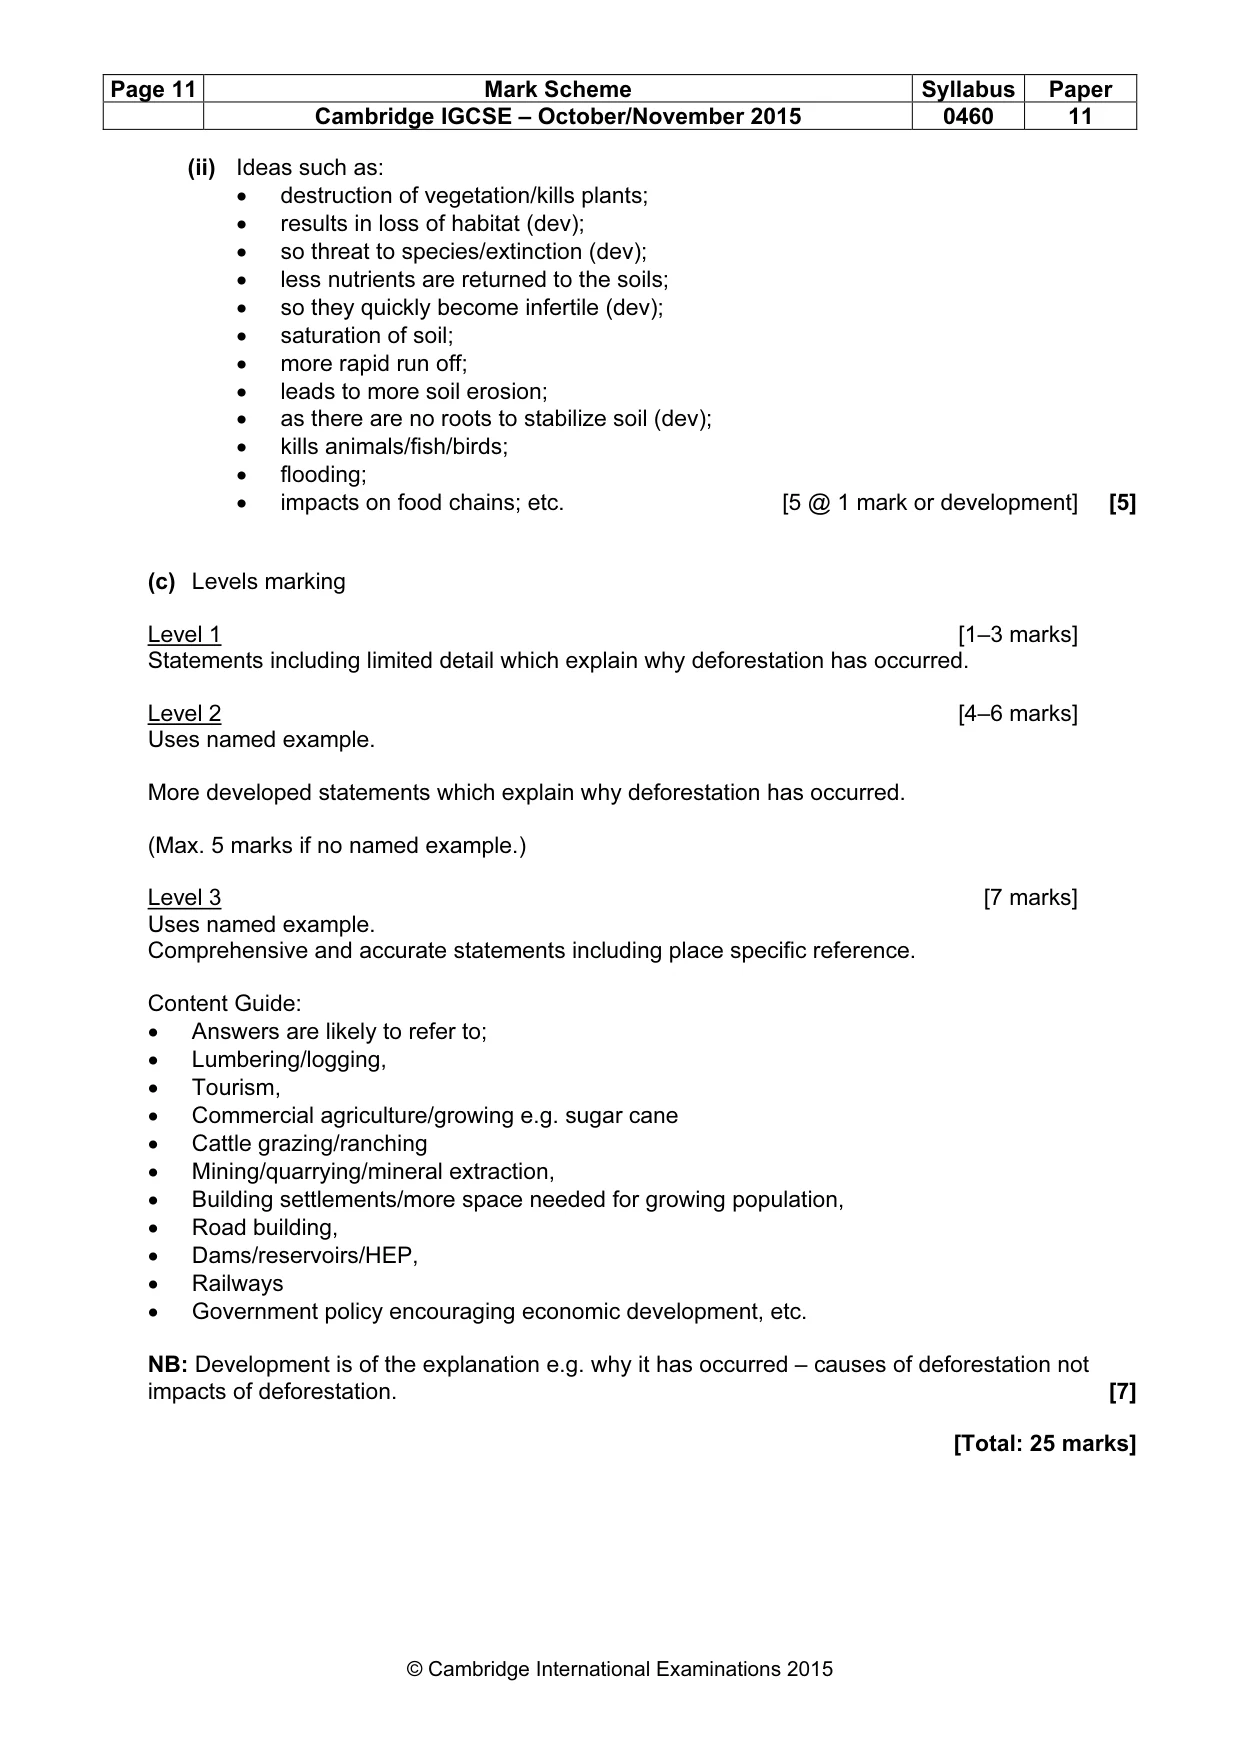
Page 11 Mark Scheme Syllabus Paper Cambridge IGCSE – October/November 2015 0460 11 © Cambridge International Examinations 2015 (ii) Ideas such as: • destruction of vegetation/kills plants; • results in loss of habitat (dev); • so threat to species/extinction (dev); • less nutrients are returned to the soils; • so they quickly become infertile (dev); • saturation of soil; • more rapid run off; • leads to more soil erosion; • as there are no roots to stabilize soil (dev); • kills animals/fish/birds; • flooding; • impacts on food chains; etc. [5 @ 1 mark or development] [5] (c) Levels marking Level 1 [1–3 marks] Statements including limited detail which explain why deforestation has occurred. Level 2 [4–6 marks] Uses named example. More developed statements which explain why deforestation has occurred. (Max. 5 marks if no named example.) Level 3 [7 marks] Uses named example. Comprehensive and accurate statements including place specific reference. Content Guide: • Answers are likely to refer to; • Lumbering/logging, • Tourism, • Commercial agriculture/growing e.g. sugar cane • Cattle grazing/ranching • Mining/quarrying/mineral extraction, • Building settlements/more space needed for growing population, • Road building, • Dams/reservoirs/HEP, • Railways • Government policy encouraging economic development, etc. NB: Development is of the explanation e.g. why it has occurred – causes of deforestation not impacts of deforestation. [7] [Total: 25 marks]
Mark scheme, page 12
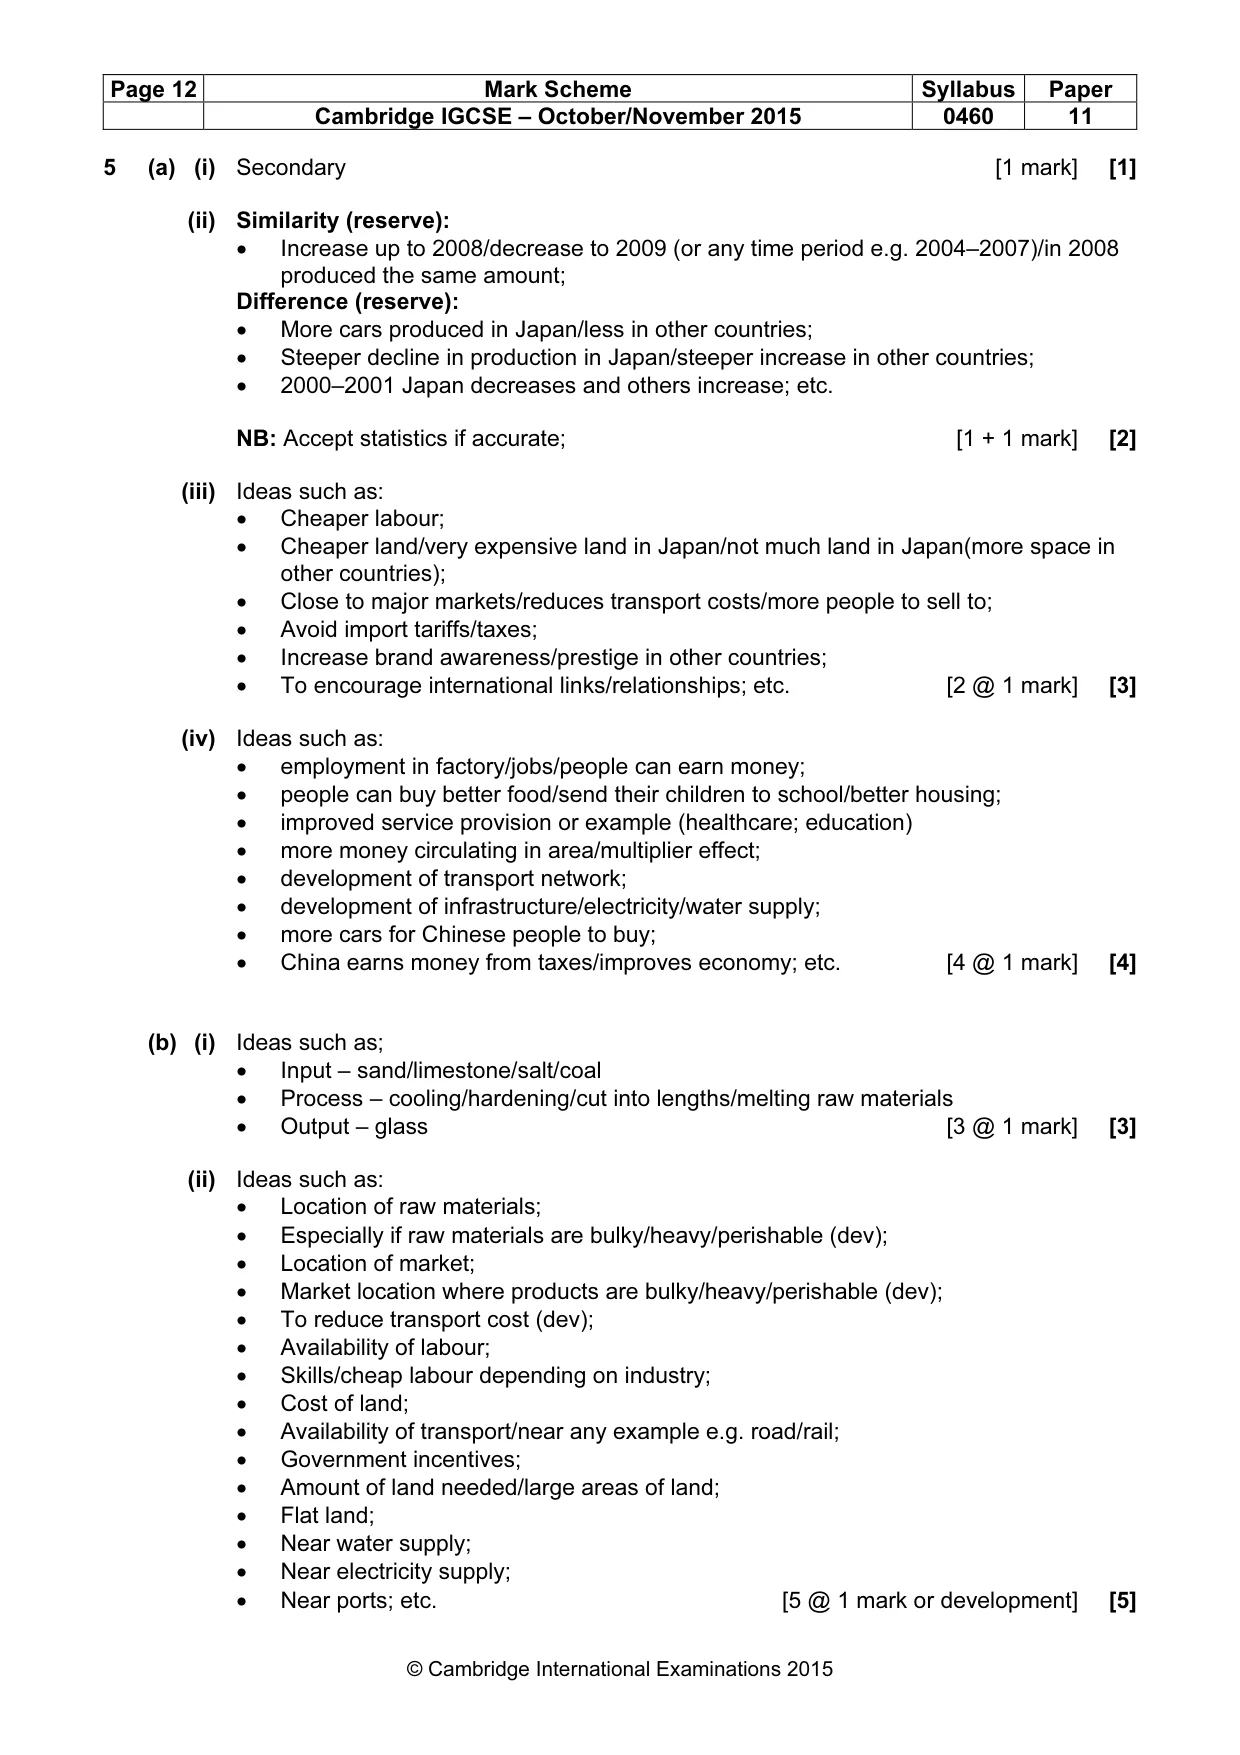
Page 12 Mark Scheme Syllabus Paper Cambridge IGCSE – October/November 2015 0460 11 © Cambridge International Examinations 2015 5 (a) (i) Secondary [1 mark] [1] (ii) Similarity (reserve): • Increase up to 2008/decrease to 2009 (or any time period e.g. 2004–2007)/in 2008 produced the same amount; Difference (reserve): • More cars produced in Japan/less in other countries; • Steeper decline in production in Japan/steeper increase in other countries; • 2000–2001 Japan decreases and others increase; etc. NB: Accept statistics if accurate; [1 + 1 mark] [2] (iii) Ideas such as: • Cheaper labour; • Cheaper land/very expensive land in Japan/not much land in Japan(more space in other countries); • Close to major markets/reduces transport costs/more people to sell to; • Avoid import tariffs/taxes; • Increase brand awareness/prestige in other countries; • To encourage international links/relationships; etc. [2 @ 1 mark] [3] (iv) Ideas such as: • employment in factory/jobs/people can earn money; • people can buy better food/send their children to school/better housing; • improved service provision or example (healthcare; education) • more money circulating in area/multiplier effect; • development of transport network; • development of infrastructure/electricity/water supply; • more cars for Chinese people to buy; • China earns money from taxes/improves economy; etc. [4 @ 1 mark] [4] (b) (i) Ideas such as; • Input – sand/limestone/salt/coal • Process – cooling/hardening/cut into lengths/melting raw materials • Output – glass [3 @ 1 mark] [3] (ii) Ideas such as: • Location of raw materials; • Especially if raw materials are bulky/heavy/perishable (dev); • Location of market; • Market location where products are bulky/heavy/perishable (dev); • To reduce transport cost (dev); • Availability of labour; • Skills/cheap labour depending on industry; • Cost of land; • Availability of transport/near any example e.g. road/rail; • Government incentives; • Amount of land needed/large areas of land; • Flat land; • Near water supply; • Near electricity supply; • Near ports; etc. [5 @ 1 mark or development] [5]
Mark scheme, page 13
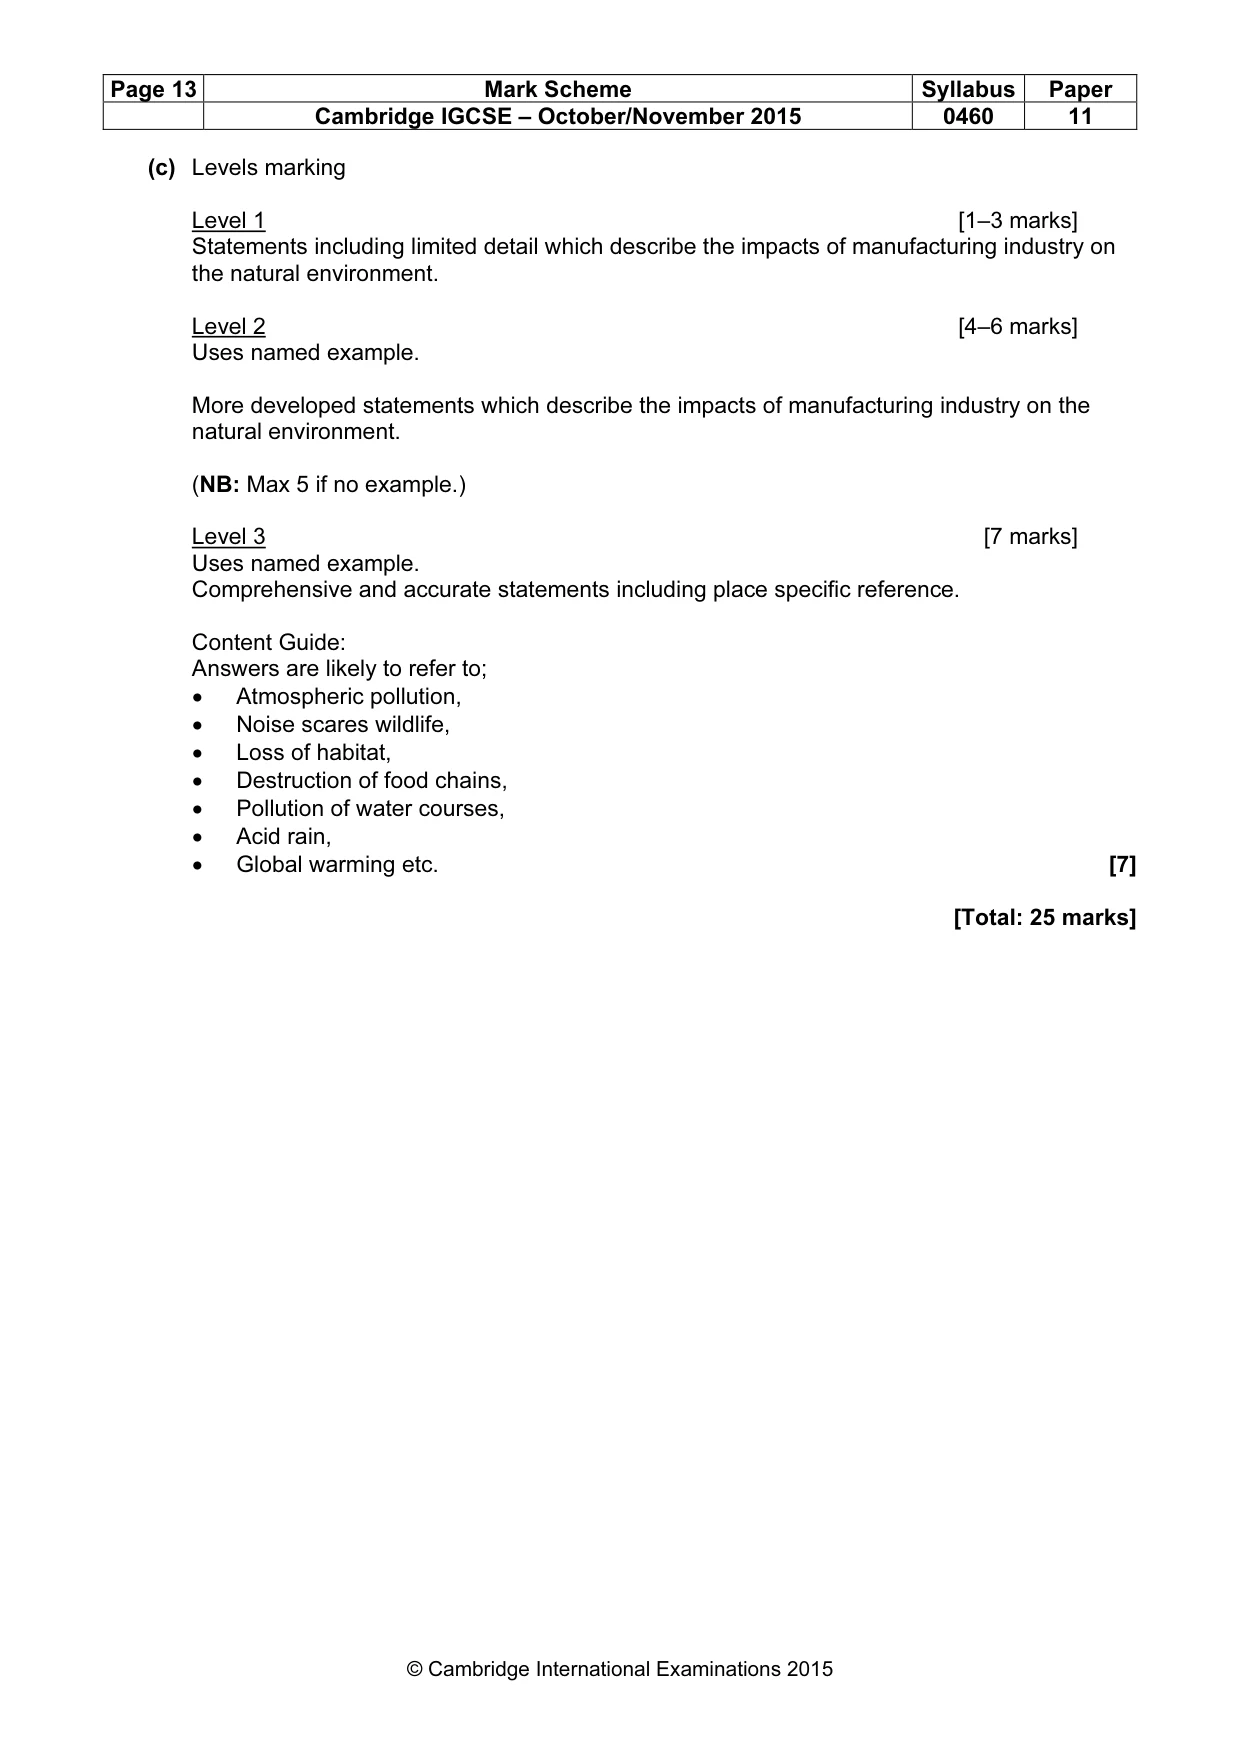
Page 13 Mark Scheme Syllabus Paper Cambridge IGCSE – October/November 2015 0460 11 © Cambridge International Examinations 2015 (c) Levels marking Level 1 [1–3 marks] Statements including limited detail which describe the impacts of manufacturing industry on the natural environment. Level 2 [4–6 marks] Uses named example. More developed statements which describe the impacts of manufacturing industry on the natural environment. (NB: Max 5 if no example.) Level 3 [7 marks] Uses named example. Comprehensive and accurate statements including place specific reference. Content Guide: Answers are likely to refer to; • Atmospheric pollution, • Noise scares wildlife, • Loss of habitat, • Destruction of food chains, • Pollution of water courses, • Acid rain, • Global warming etc. [7] [Total: 25 marks]
Mark scheme, page 14
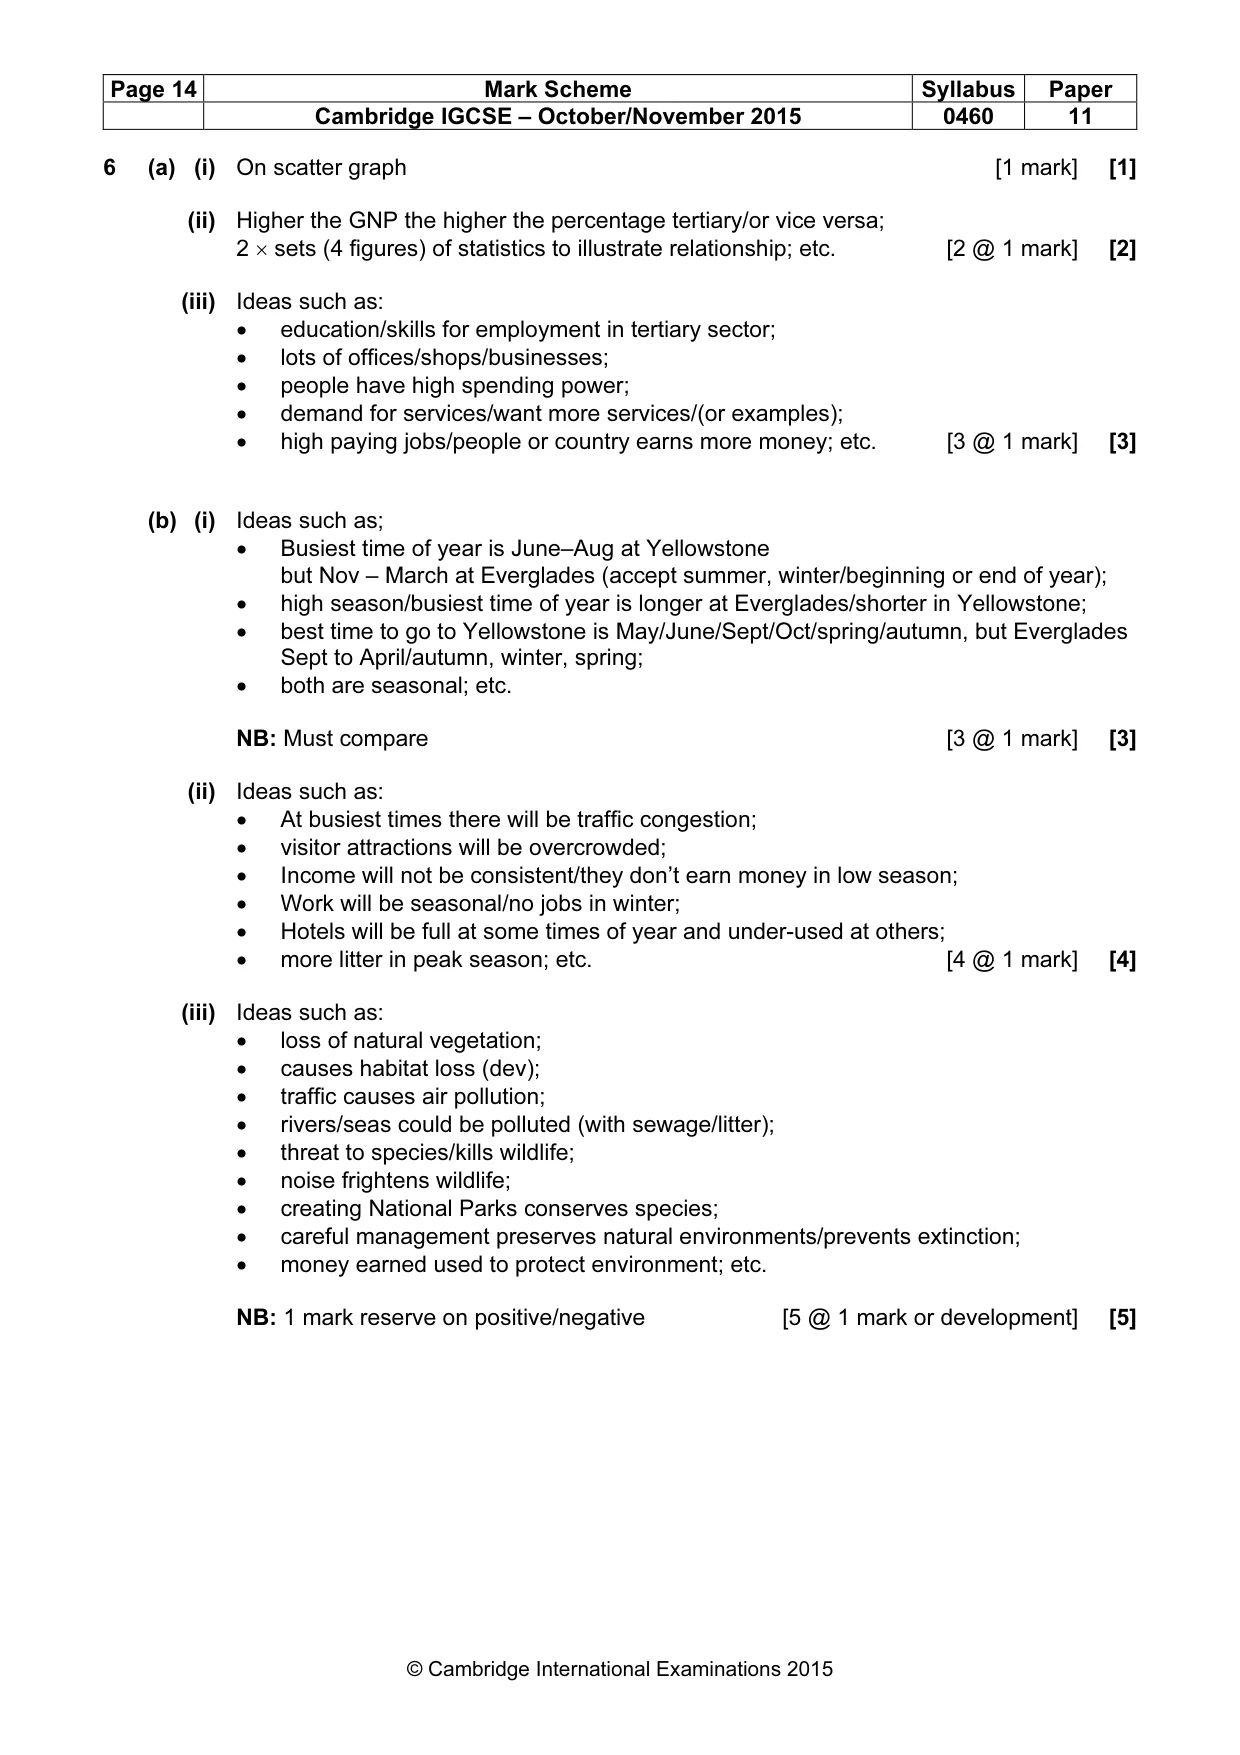
Page 14 Mark Scheme Syllabus Paper Cambridge IGCSE – October/November 2015 0460 11 © Cambridge International Examinations 2015 6 (a) (i) On scatter graph [1 mark] [1] (ii) Higher the GNP the higher the percentage tertiary/or vice versa; 2 × sets (4 figures) of statistics to illustrate relationship; etc. [2 @ 1 mark] [2] (iii) Ideas such as: • education/skills for employment in tertiary sector; • lots of offices/shops/businesses; • people have high spending power; • demand for services/want more services/(or examples); • high paying jobs/people or country earns more money; etc. [3 @ 1 mark] [3] (b) (i) Ideas such as; • Busiest time of year is June–Aug at Yellowstone but Nov – March at Everglades (accept summer, winter/beginning or end of year); • high season/busiest time of year is longer at Everglades/shorter in Yellowstone; • best time to go to Yellowstone is May/June/Sept/Oct/spring/autumn, but Everglades Sept to April/autumn, winter, spring; • both are seasonal; etc. NB: Must compare [3 @ 1 mark] [3] (ii) Ideas such as: • At busiest times there will be traffic congestion; • visitor attractions will be overcrowded; • Income will not be consistent/they don’t earn money in low season; • Work will be seasonal/no jobs in winter; • Hotels will be full at some times of year and under-used at others; • more litter in peak season; etc. [4 @ 1 mark] [4] (iii) Ideas such as: • loss of natural vegetation; • causes habitat loss (dev); • traffic causes air pollution; • rivers/seas could be polluted (with sewage/litter); • threat to species/kills wildlife; • noise frightens wildlife; • creating National Parks conserves species; • careful management preserves natural environments/prevents extinction; • money earned used to protect environment; etc. NB: 1 mark reserve on positive/negative [5 @ 1 mark or development] [5]
Mark scheme, page 15
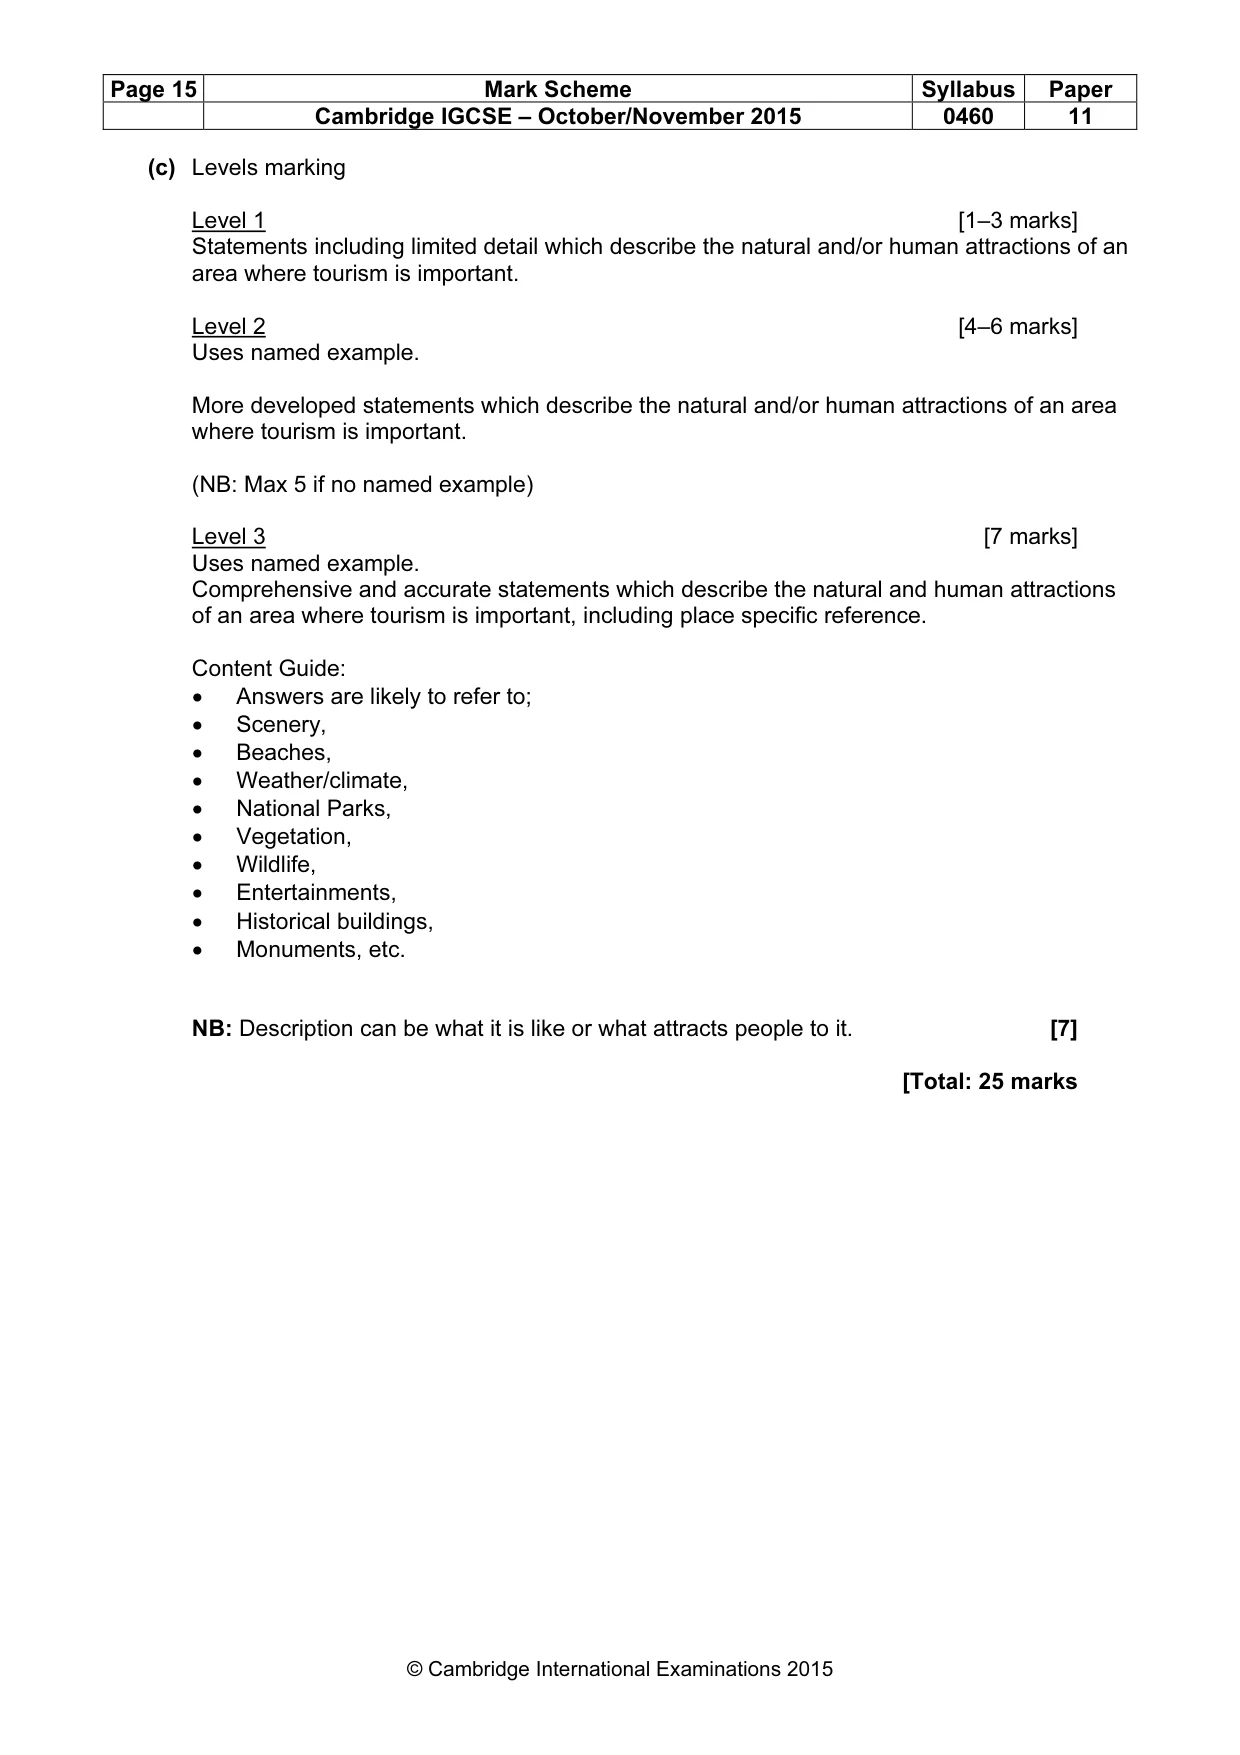
Page 15 Mark Scheme Syllabus Paper Cambridge IGCSE – October/November 2015 0460 11 © Cambridge International Examinations 2015 (c) Levels marking Level 1 [1–3 marks] Statements including limited detail which describe the natural and/or human attractions of an area where tourism is important. Level 2 [4–6 marks] Uses named example. More developed statements which describe the natural and/or human attractions of an area where tourism is important. (NB: Max 5 if no named example) Level 3 [7 marks] Uses named example. Comprehensive and accurate statements which describe the natural and human attractions of an area where tourism is important, including place specific reference. Content Guide: • Answers are likely to refer to; • Scenery, • Beaches, • Weather/climate, • National Parks, • Vegetation, • Wildlife, • Entertainments, • Historical buildings, • Monuments, etc. NB: Description can be what it is like or what attracts people to it. [7] [Total: 25 marks
What you needed in this session
Cambridge’s own grade thresholds for 2015 Oct/Nov, Paper 1 · Variant 1. A higher threshold means an easier paper — the bar moves with how the cohort did.