Cambridge IGCSE Geography 0460 — 2014 Oct/Nov Paper 1 · Variant 3
0460/13/O/N/14 · 75 marks · ≈84 min
The question paper and its mark scheme, free to read here and free to download. This is Cambridge’s own paper, exactly as it was sat.
Question paper28 pages
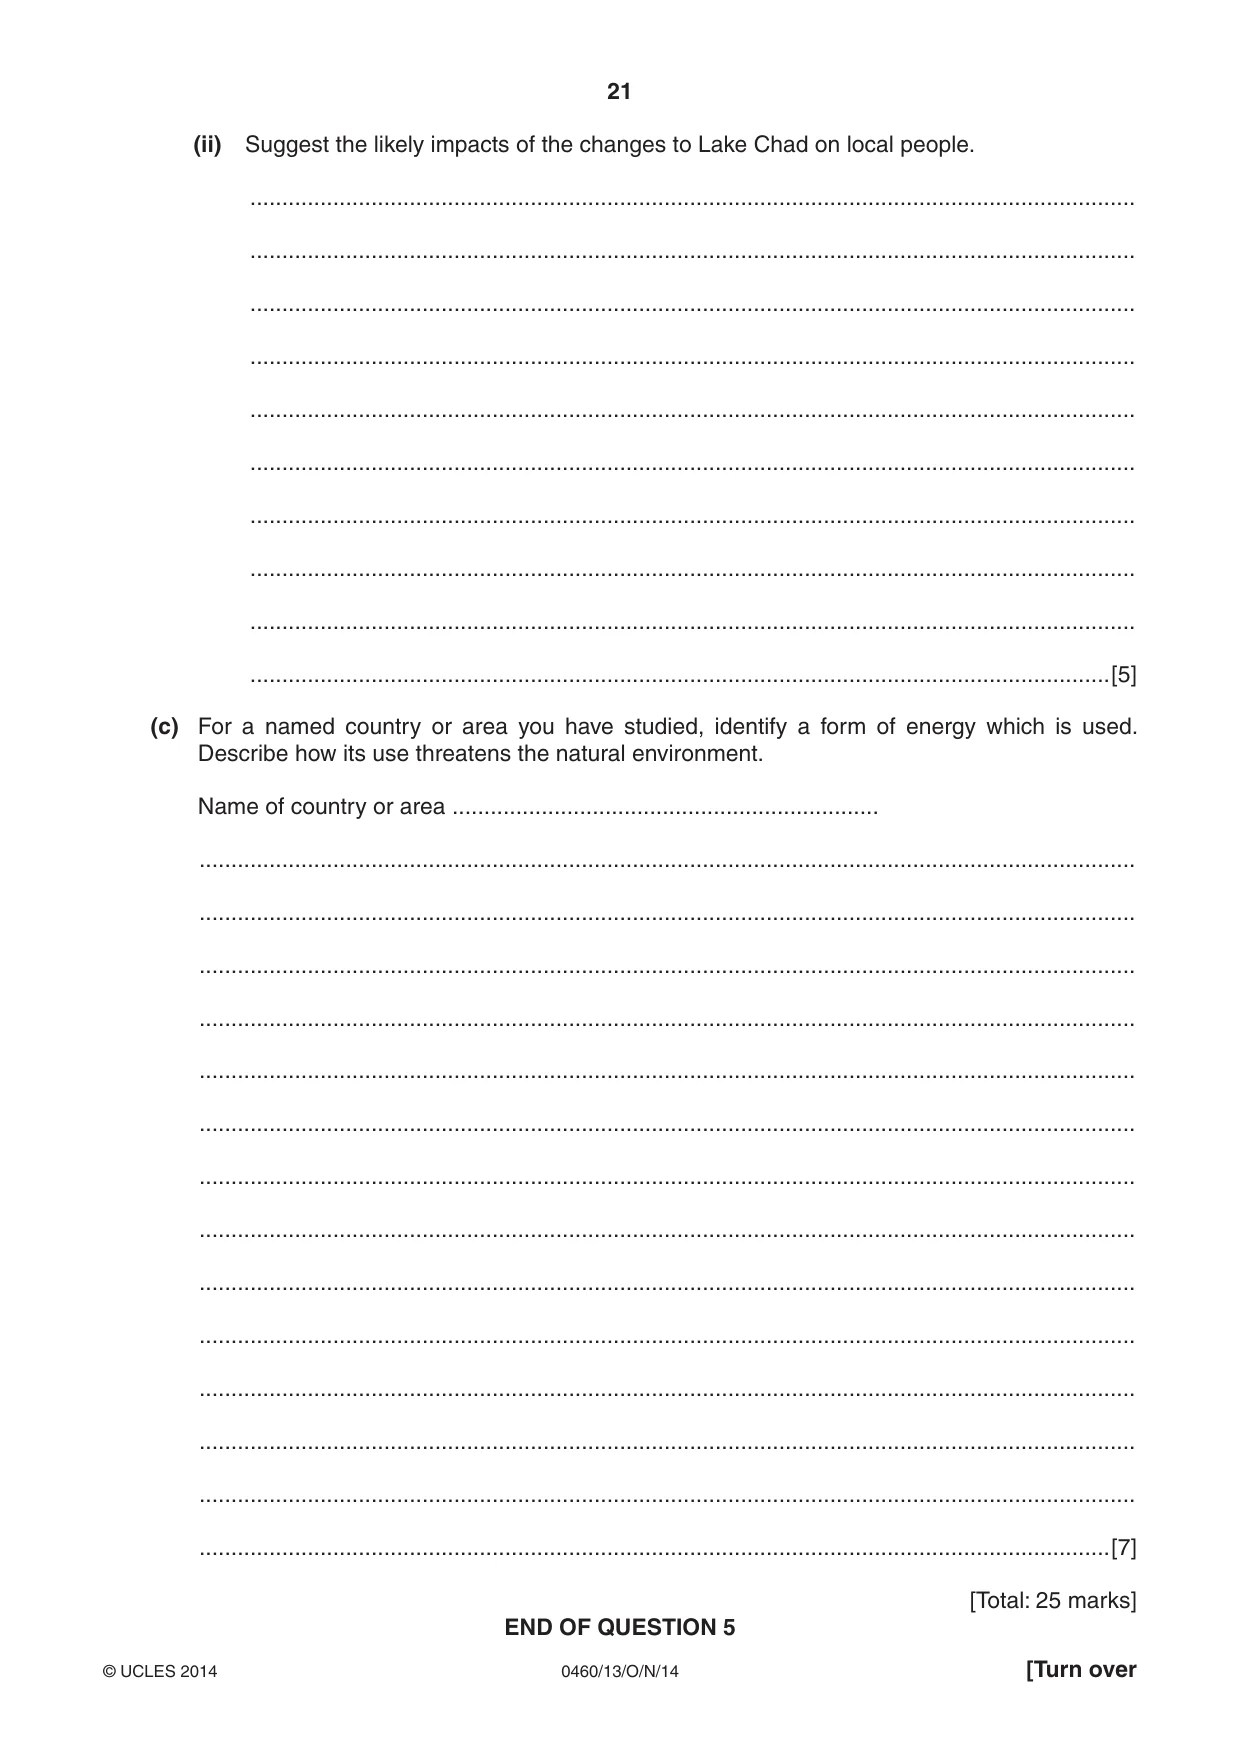
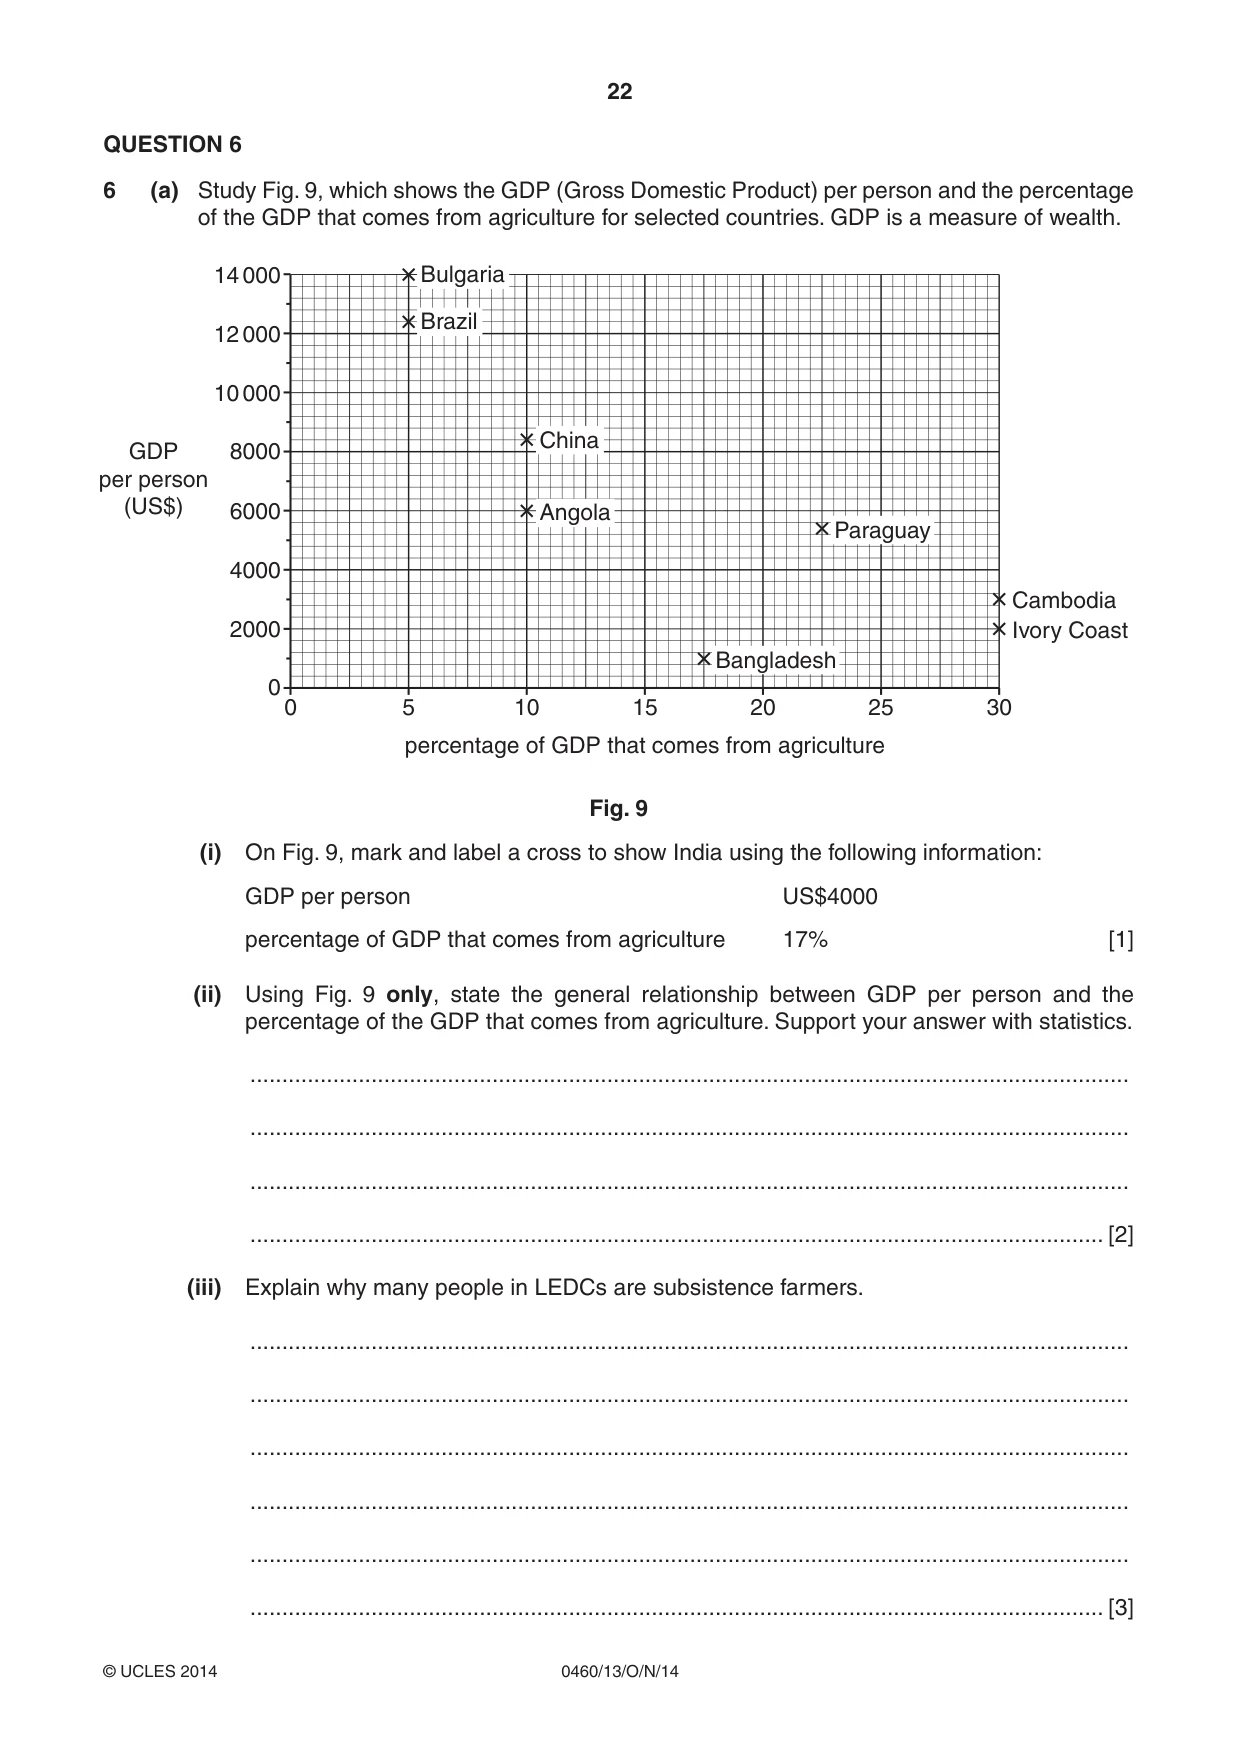
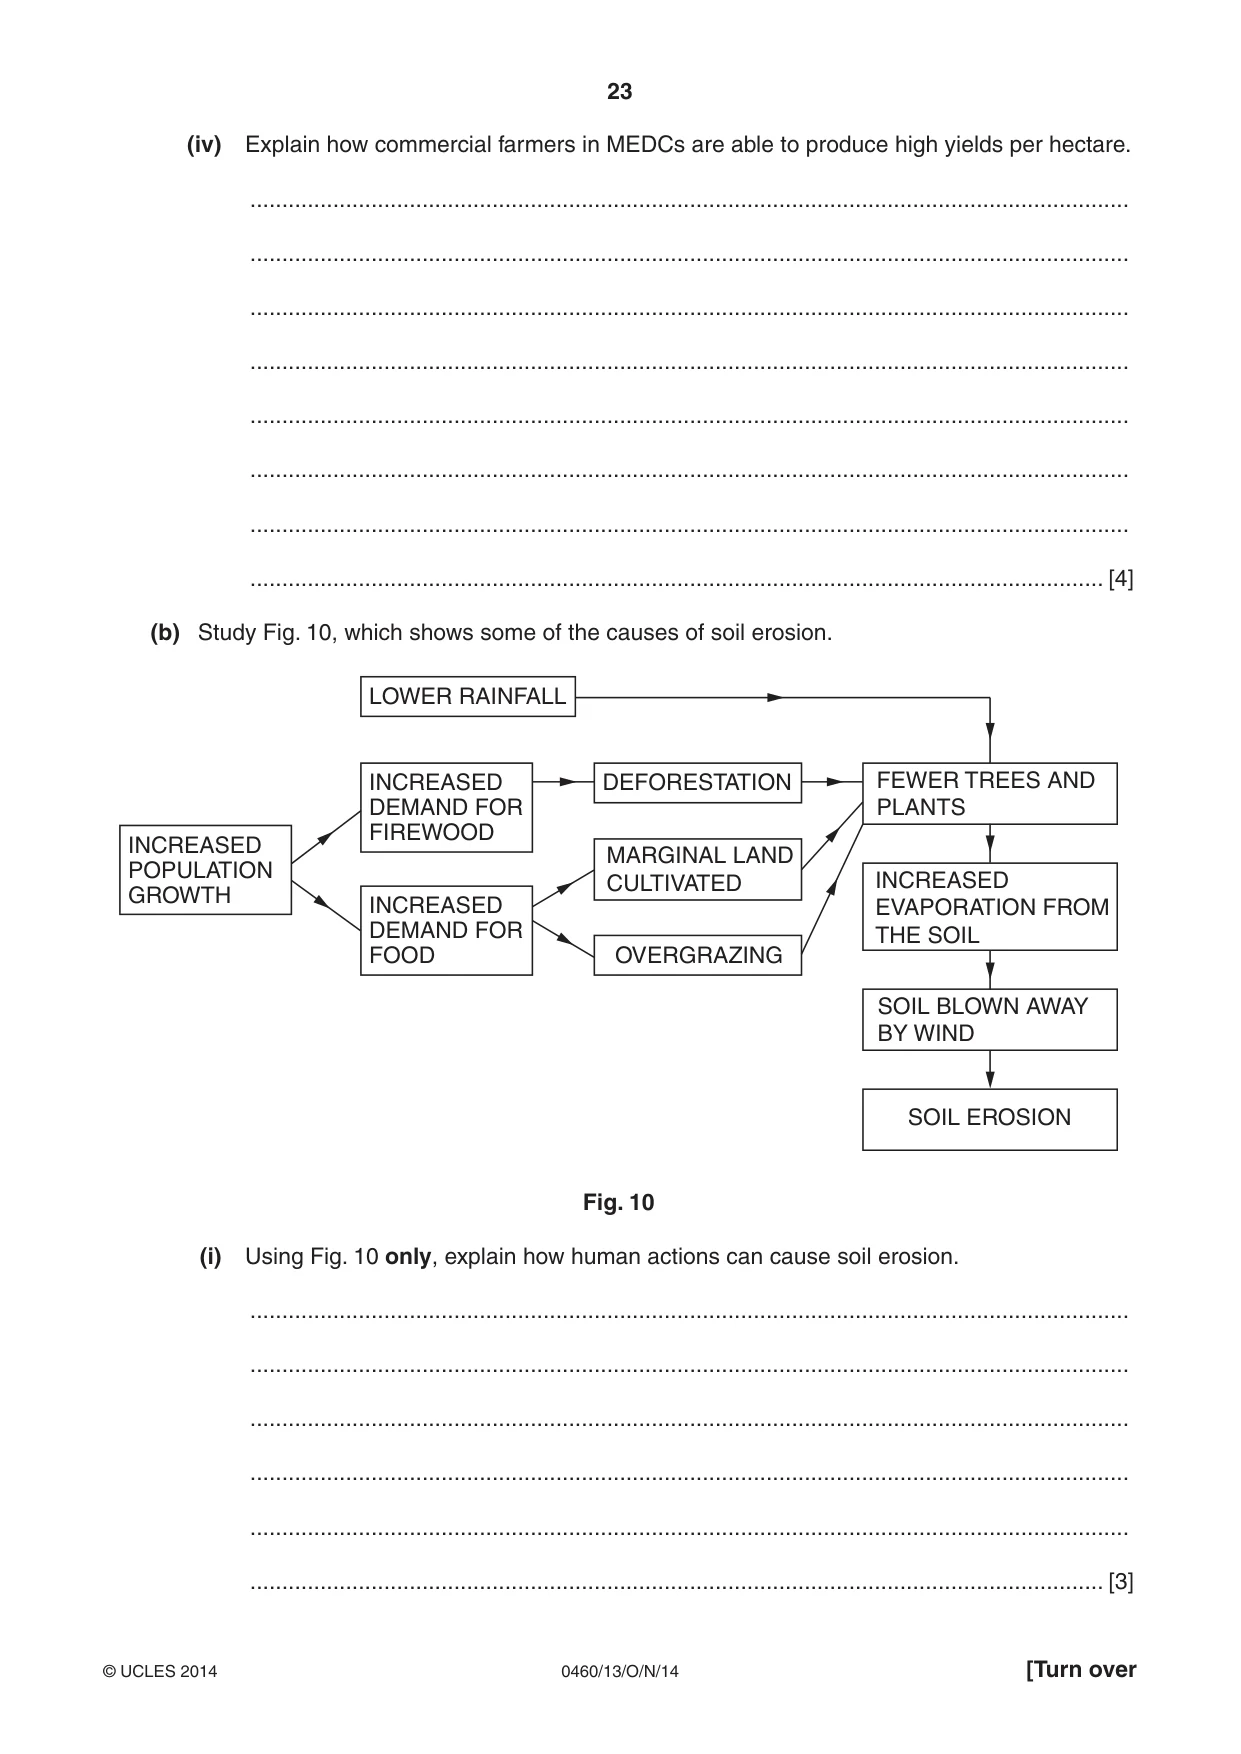


Mark scheme13 pages
Answers below. Sit the paper first if you are practising.
Paper as text
Question paper, page 1
This document consists of 26 printed pages, 2 blank pages and 1 Insert. DC (CW/CGW) 108647 © UCLES 2014 [Turn over Cambridge International Examinations Cambridge International General Certificate of Secondary Education * 6 2 2 3 4 1 6 0 1 5 * GEOGRAPHY 0460/13 Paper 1 October/November 2014 1 hour 45 minutes Candidates answer on the Question Paper. Additional Materials: Calculator Protractor Ruler READ THESE INSTRUCTIONS FIRST Write your Centre number, candidate number and name in the spaces provided. Write in dark blue or black pen. You may use an HB pencil for any diagrams or graphs. Do not use staples, paper clips, glue or correction fluid. DO NOT WRITE IN ANY BARCODES. Write your answer to each question in the space provided. If additional space is required, you should use the lined page at the end of this booklet. The question number(s) must be clearly shown. Answer three questions. The Insert contains Fig. 2 for Question 1, Photographs A and B for Question 2, and Photographs C, D, E and F for Question 3. The Insert is not required by the Examiner. Sketch maps and diagrams should be drawn whenever they serve to illustrate an answer. At the end of the examination, fasten all your work securely together. The number of marks is given in brackets [ ] at the end of each question or part question. The syllabus is approved for use in England, Wales and Northern Ireland as a Cambridge International Level 1/Level 2 Certificate.
Question paper, page 2
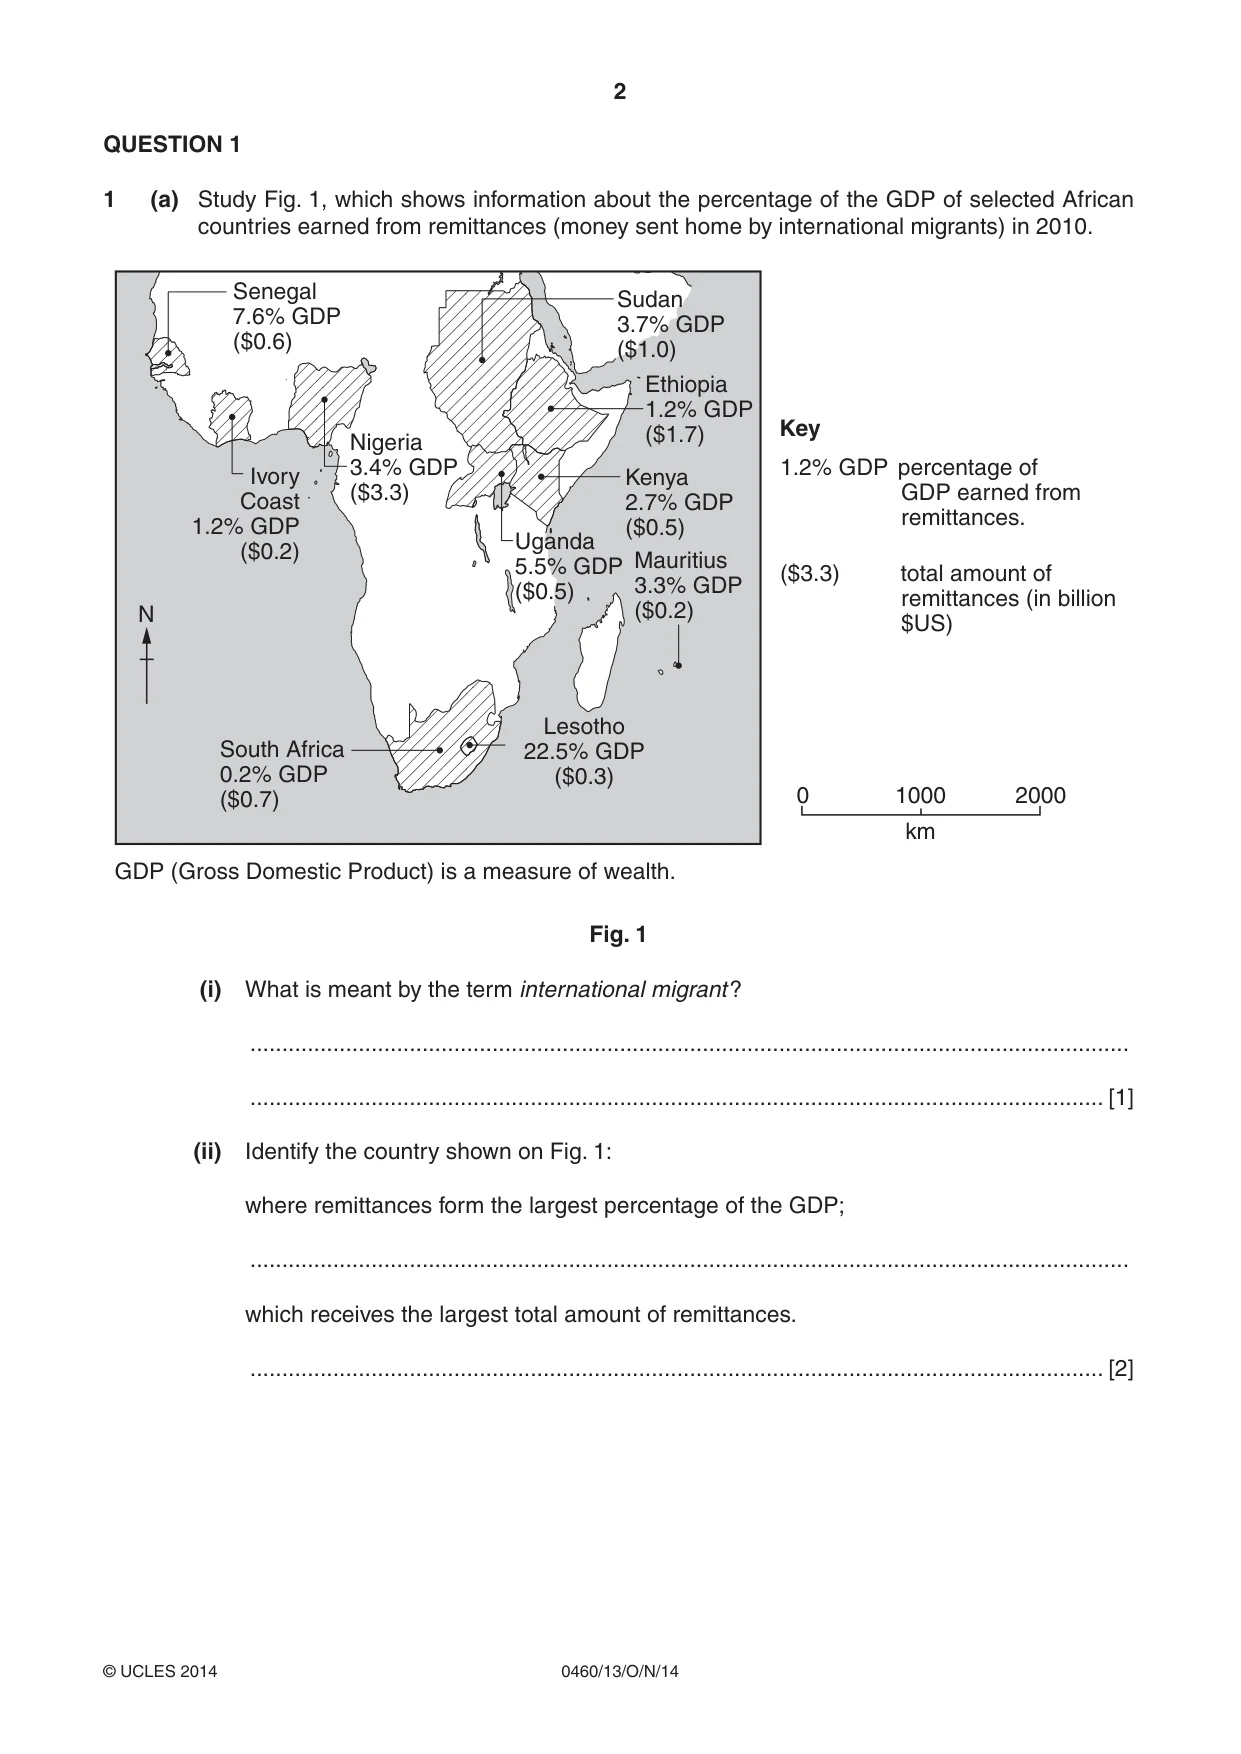
2 0460/13/O/N/14 © UCLES 2014 QUESTION 1 1 (a) Study Fig. 1, which shows information about the percentage of the GDP of selected African countries earned from remittances (money sent home by international migrants) in 2010. Senegal 7.6% GDP ($0.6) Mauritius 3.3% GDP ($0.2) GDP (Gross Domestic Product) is a measure of wealth. 0 1000 km 2000 Uganda 5.5% GDP ($0.5) Kenya 2.7% GDP ($0.5) South Africa 0.2% GDP ($0.7) Key ($3.3) total amount of remittances (in billion $US) 1.2% GDP percentage of GDP earned from remittances. Lesotho 22.5% GDP ($0.3) Ivory Coast 1.2% GDP ($0.2) Nigeria 3.4% GDP ($3.3) N Sudan 3.7% GDP ($1.0) Ethiopia 1.2% GDP ($1.7) Fig. 1 (i) What is meant by the term international migrant ? … … [1] (ii) Identify the country shown on Fig. 1: where remittances form the largest percentage of the GDP; … which receives the largest total amount of remittances. … [2]
Question paper, page 3
3 0460/13/O/N/14 © UCLES 2014 [Turn over (iii) Explain how remittance money sent home by international migrants may benefit people in the country from which they have migrated. … … … … … … [3] (iv) Suggest what problems may be caused in countries from which large numbers of people migrate. … … … … … … … … [4]
Question paper, page 4
4 0460/13/O/N/14 © UCLES 2014 (b) Study Fig. 2 (Insert), which shows the main migration routes from Africa to Europe. (i) Using the information in Fig. 2 only, describe one possible route of a migrant from Cameroon to Spain. … … … … … … [3] (ii) Suggest problems which may be faced by migrants who are living in MEDCs such as Spain. … … … … … … … … … … [5]
Question paper, page 5
5 0460/13/O/N/14 © UCLES 2014 [Turn over (c) For a named area you have studied, explain why it has a low population density. Name of area … … … … … … … … … … … … … … … [7] [Total: 25 marks] END OF QUESTION 1
Question paper, page 6
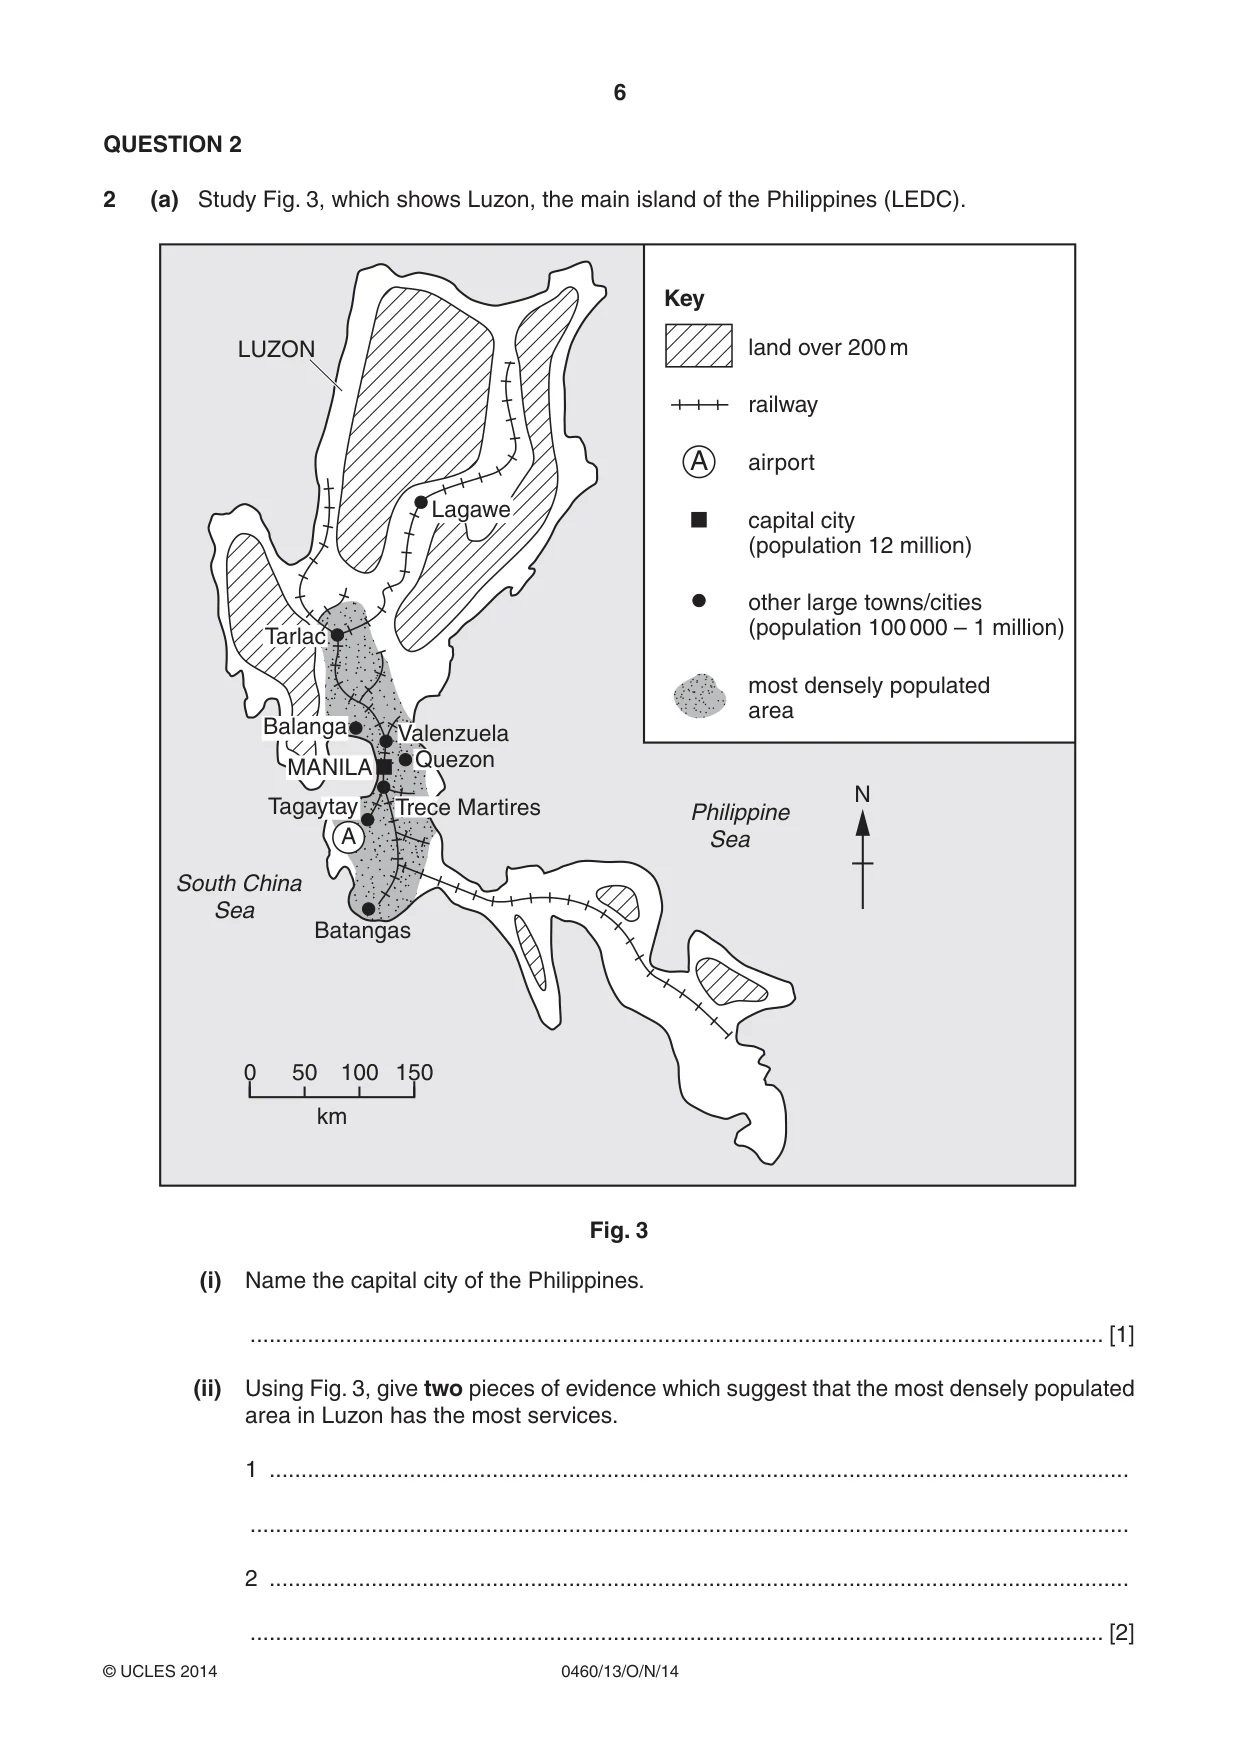
6 0460/13/O/N/14 © UCLES 2014 QUESTION 2 2 (a) Study Fig. 3, which shows Luzon, the main island of the Philippines (LEDC). A A Key land over 200 m N 0 50 100 km 150 railway LUZON airport Philippine Sea South China Sea capital city (population 12 million) other large towns/cities (population 100 000 – 1 million) most densely populated area Tarlac Lagawe Batangas Quezon Valenzuela Trece Martires Tagaytay MANILA Balanga Fig. 3 (i) Name the capital city of the Philippines. … [1] (ii) Using Fig. 3, give two pieces of evidence which suggest that the most densely populated area in Luzon has the most services. 1 … … 2 … … [2]
Question paper, page 7
7 0460/13/O/N/14 © UCLES 2014 [Turn over (iii) Explain why large numbers of people live in squatter settlements in cities in LEDCs. … … … … … … [3] (iv) Describe four ways to improve the housing in squatter settlements. 1 … … 2 … … 3 … … 4 … … [4]
Question paper, page 8
8 0460/13/O/N/14 © UCLES 2014 (b) Study Photographs A and B (Insert), which were taken in Maseru, the capital city of Lesotho, an LEDC in Africa. (i) Give three pieces of evidence from Photograph A that the area is part of the CBD. 1 … … 2 … … 3 … …[3] (ii) Photograph B shows a large shopping mall outside the CBD. Suggest reasons why the mall was located outside the CBD of Maseru rather than in it. … … … … … … … … … …[5]
Question paper, page 9
9 0460/13/O/N/14 © UCLES 2014 [Turn over (c) For a named example of a settlement you have studied, identify its main function and explain the reasons for its growth. Name of settlement … Main function … … … … … … … … … … … … … … … … …[7] [Total: 25 marks] END OF QUESTION 2
Question paper, page 10
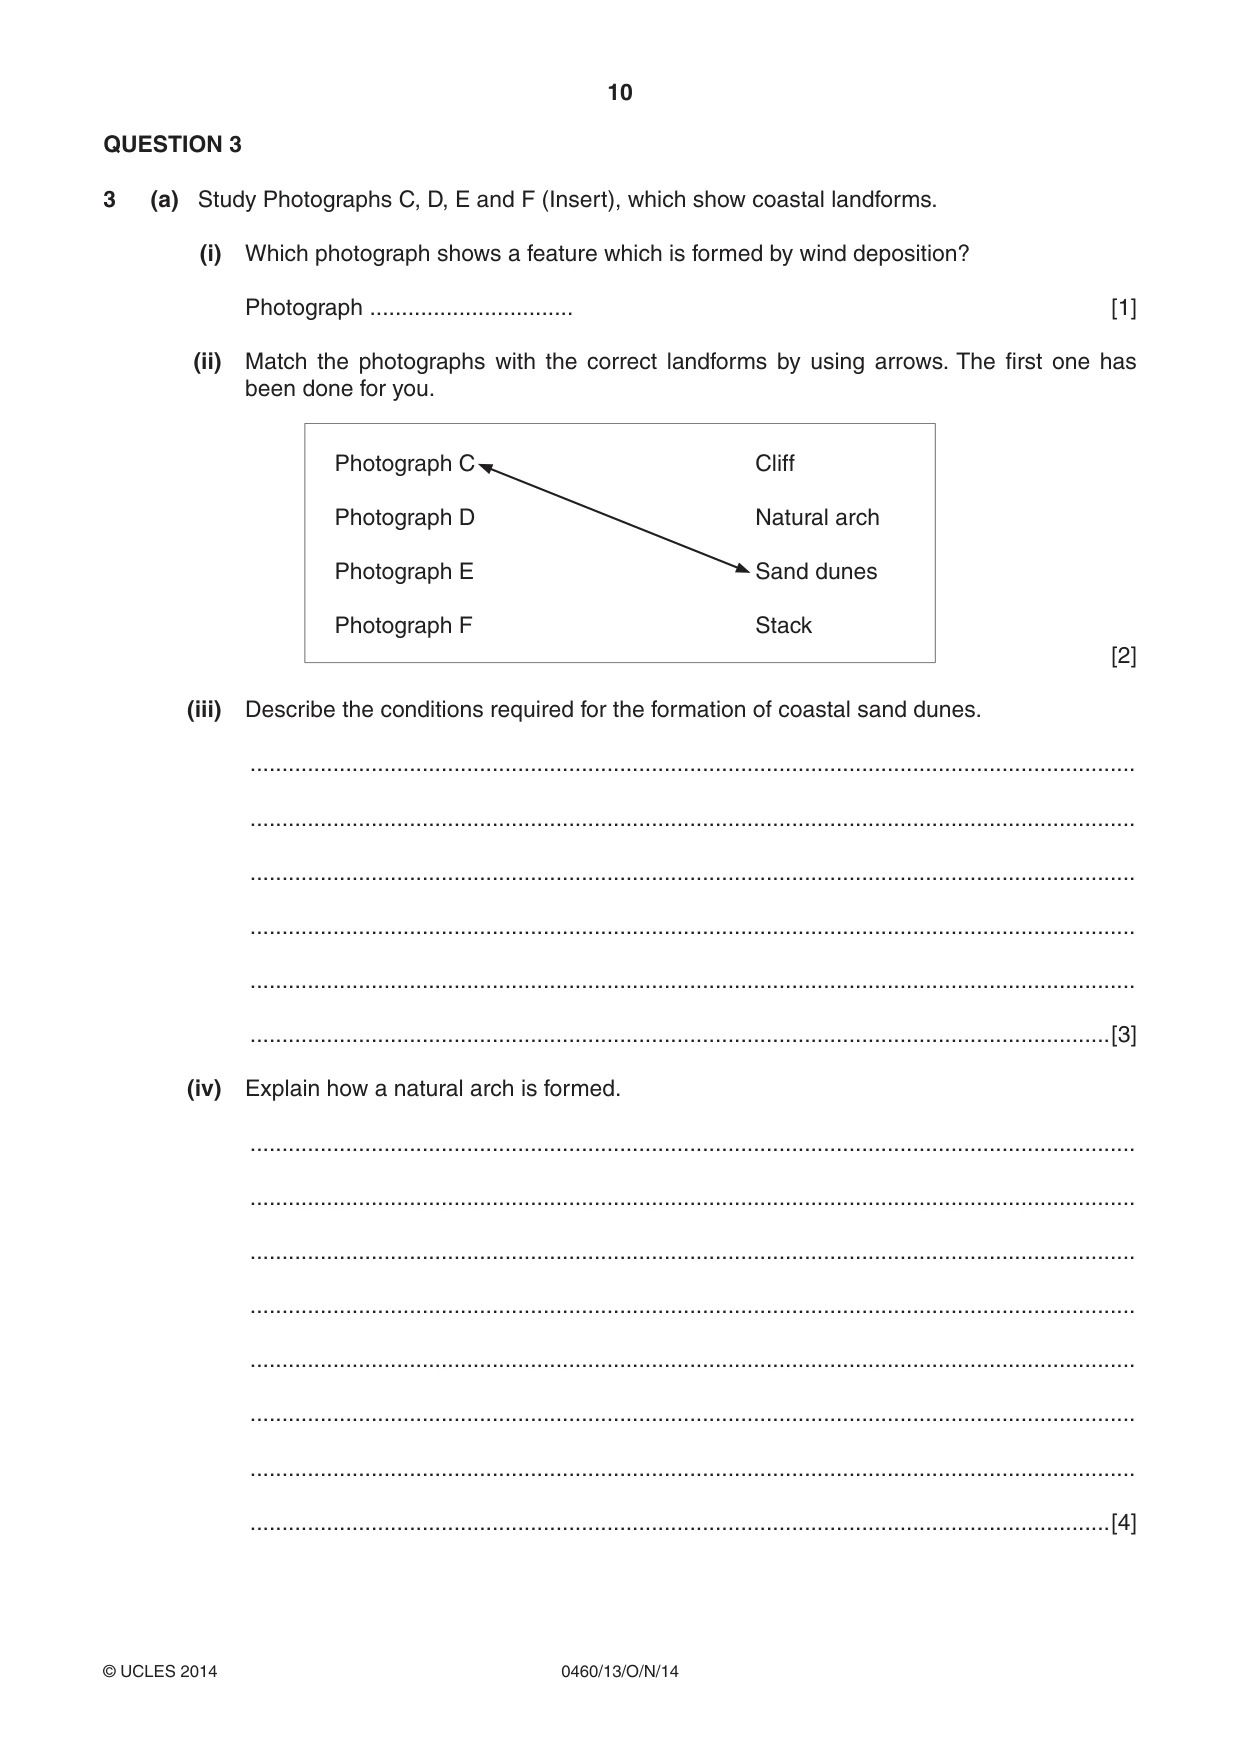
10 0460/13/O/N/14 © UCLES 2014 QUESTION 3 3 (a) Study Photographs C, D, E and F (Insert), which show coastal landforms. (i) Which photograph shows a feature which is formed by wind deposition? Photograph … [1] (ii) Match the photographs with the correct landforms by using arrows. The first one has been done for you. Photograph C Cliff Photograph D Natural arch Photograph E Sand dunes Photograph F Stack [2] (iii) Describe the conditions required for the formation of coastal sand dunes. … … … … … …[3] (iv) Explain how a natural arch is formed. … … … … … … … …[4]
Question paper, page 11
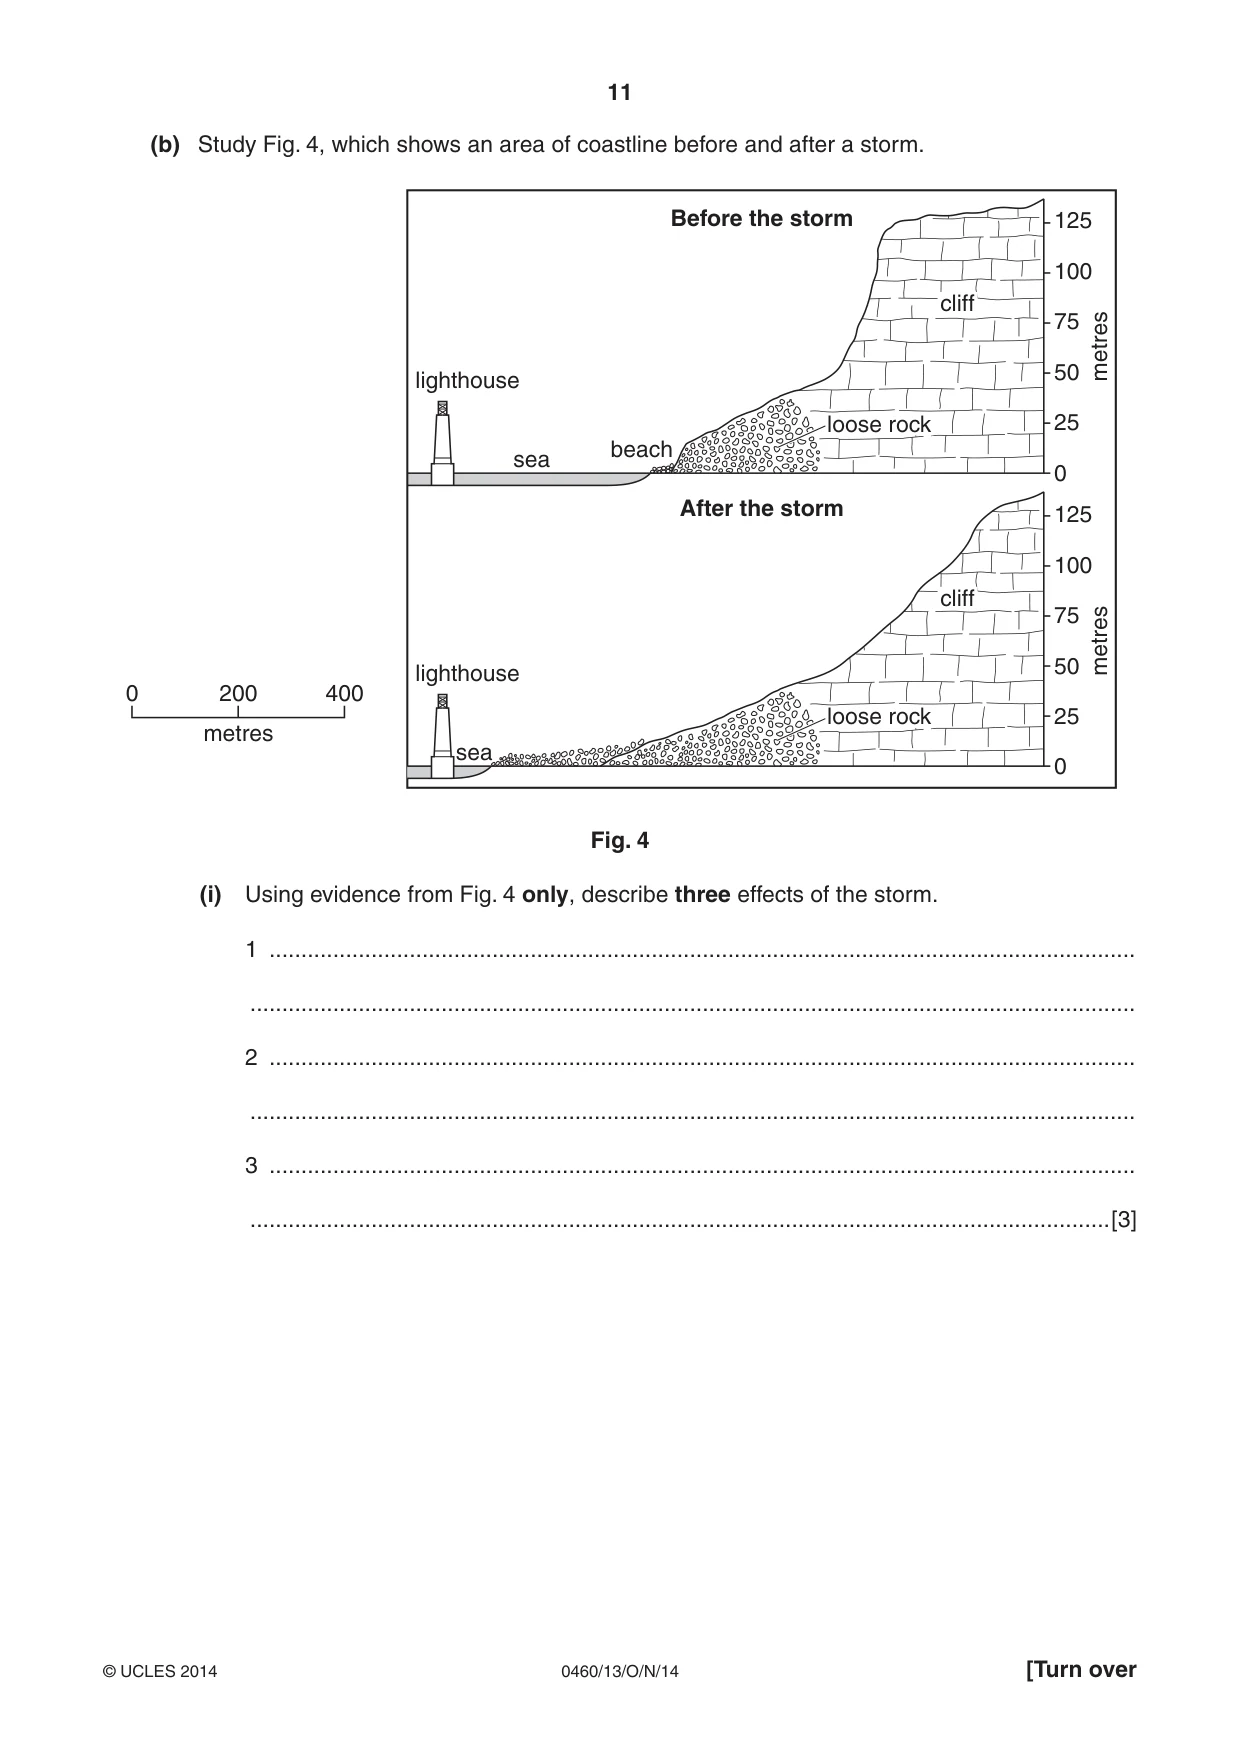
11 0460/13/O/N/14 © UCLES 2014 [Turn over (b) Study Fig. 4, which shows an area of coastline before and after a storm. lighthouse sea beach sea 0 200 metres 400 lighthouse After the storm Before the storm loose rock loose rock cliff cliff 125 100 75 50 25 0 125 100 75 metres metres 50 25 0 Fig. 4 (i) Using evidence from Fig. 4 only, describe three effects of the storm. 1 … … 2 … … 3 … …[3]
Question paper, page 12
12 0460/13/O/N/14 © UCLES 2014 (ii) Explain how erosion by the sea may cause problems for people living in coastal areas. … … … … … … … … … …[5]
Question paper, page 13
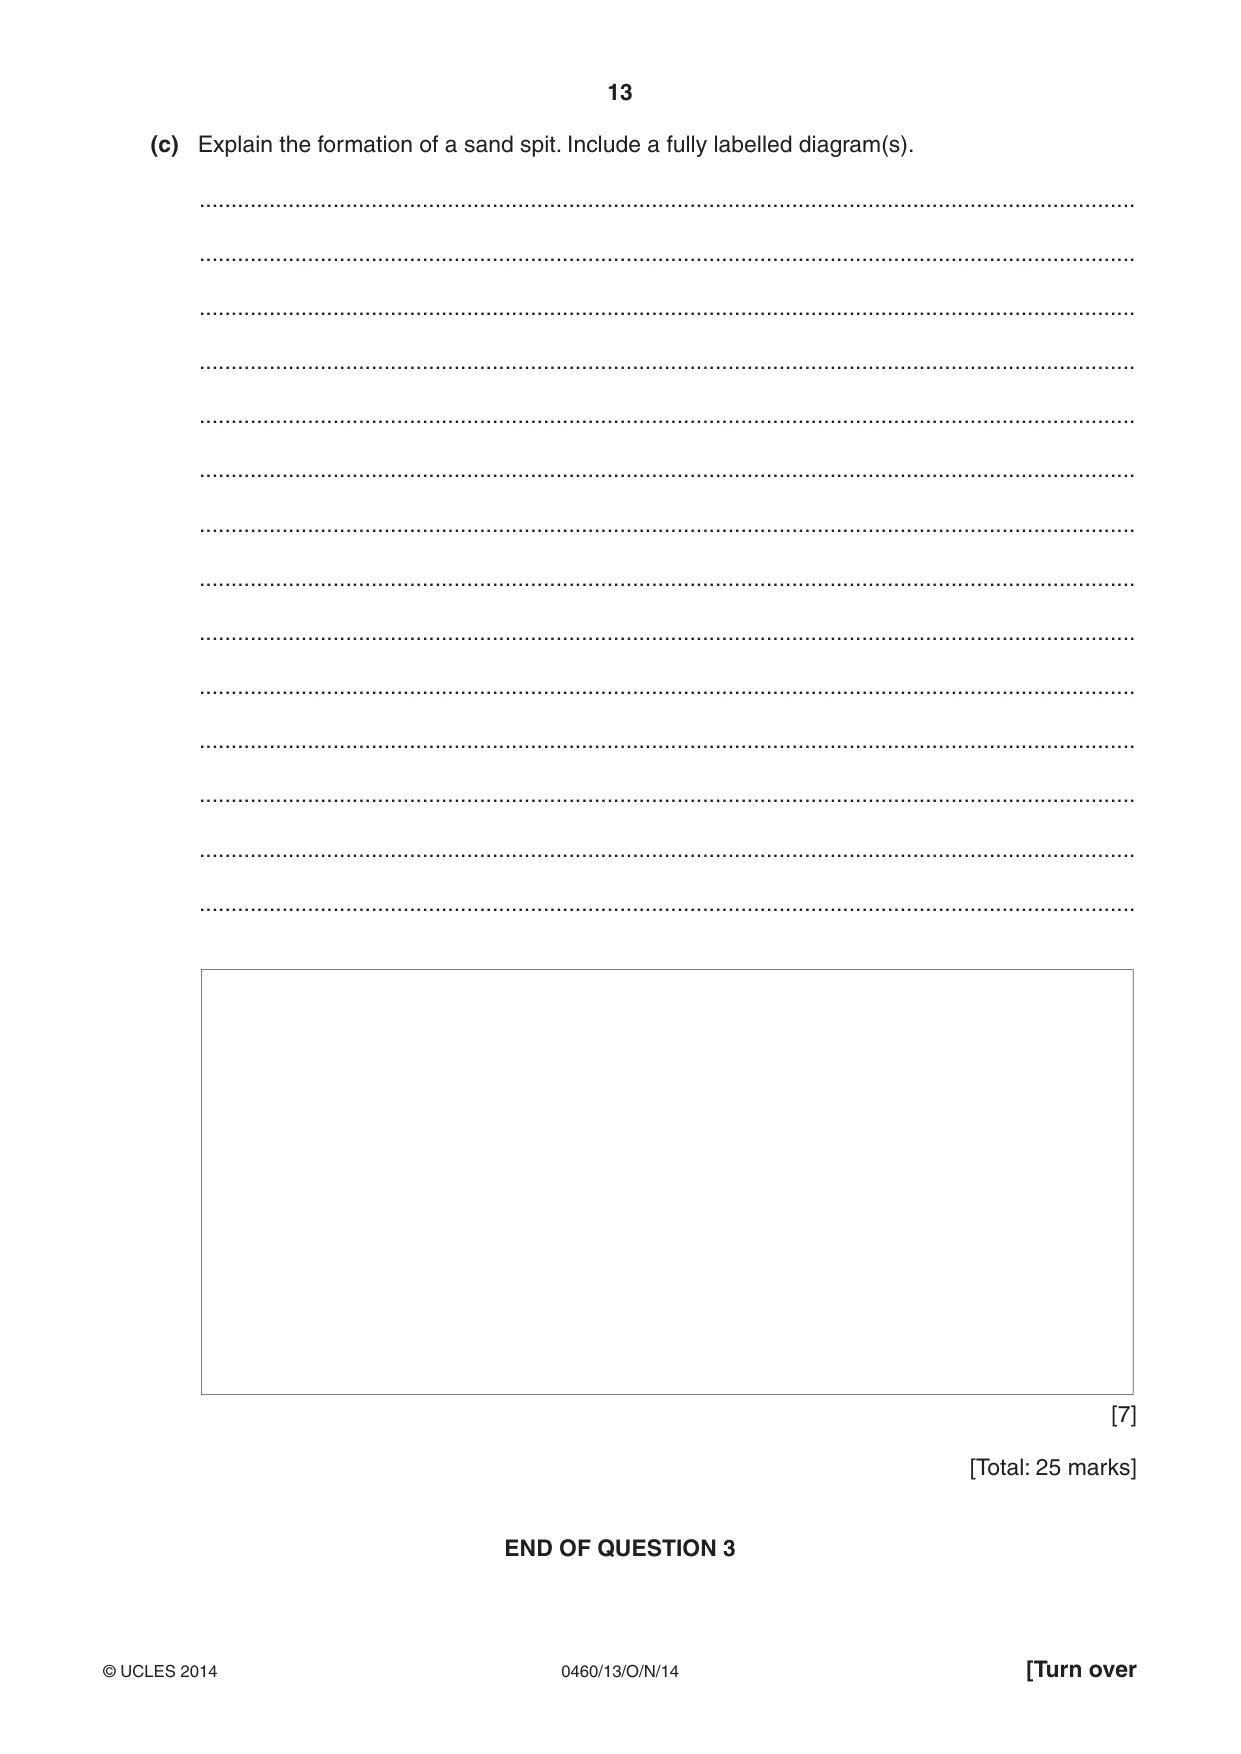
13 0460/13/O/N/14 © UCLES 2014 [Turn over (c) Explain the formation of a sand spit. Include a fully labelled diagram(s). … … … … … … … … … … … … … … [7] [Total: 25 marks] END OF QUESTION 3
Question paper, page 14
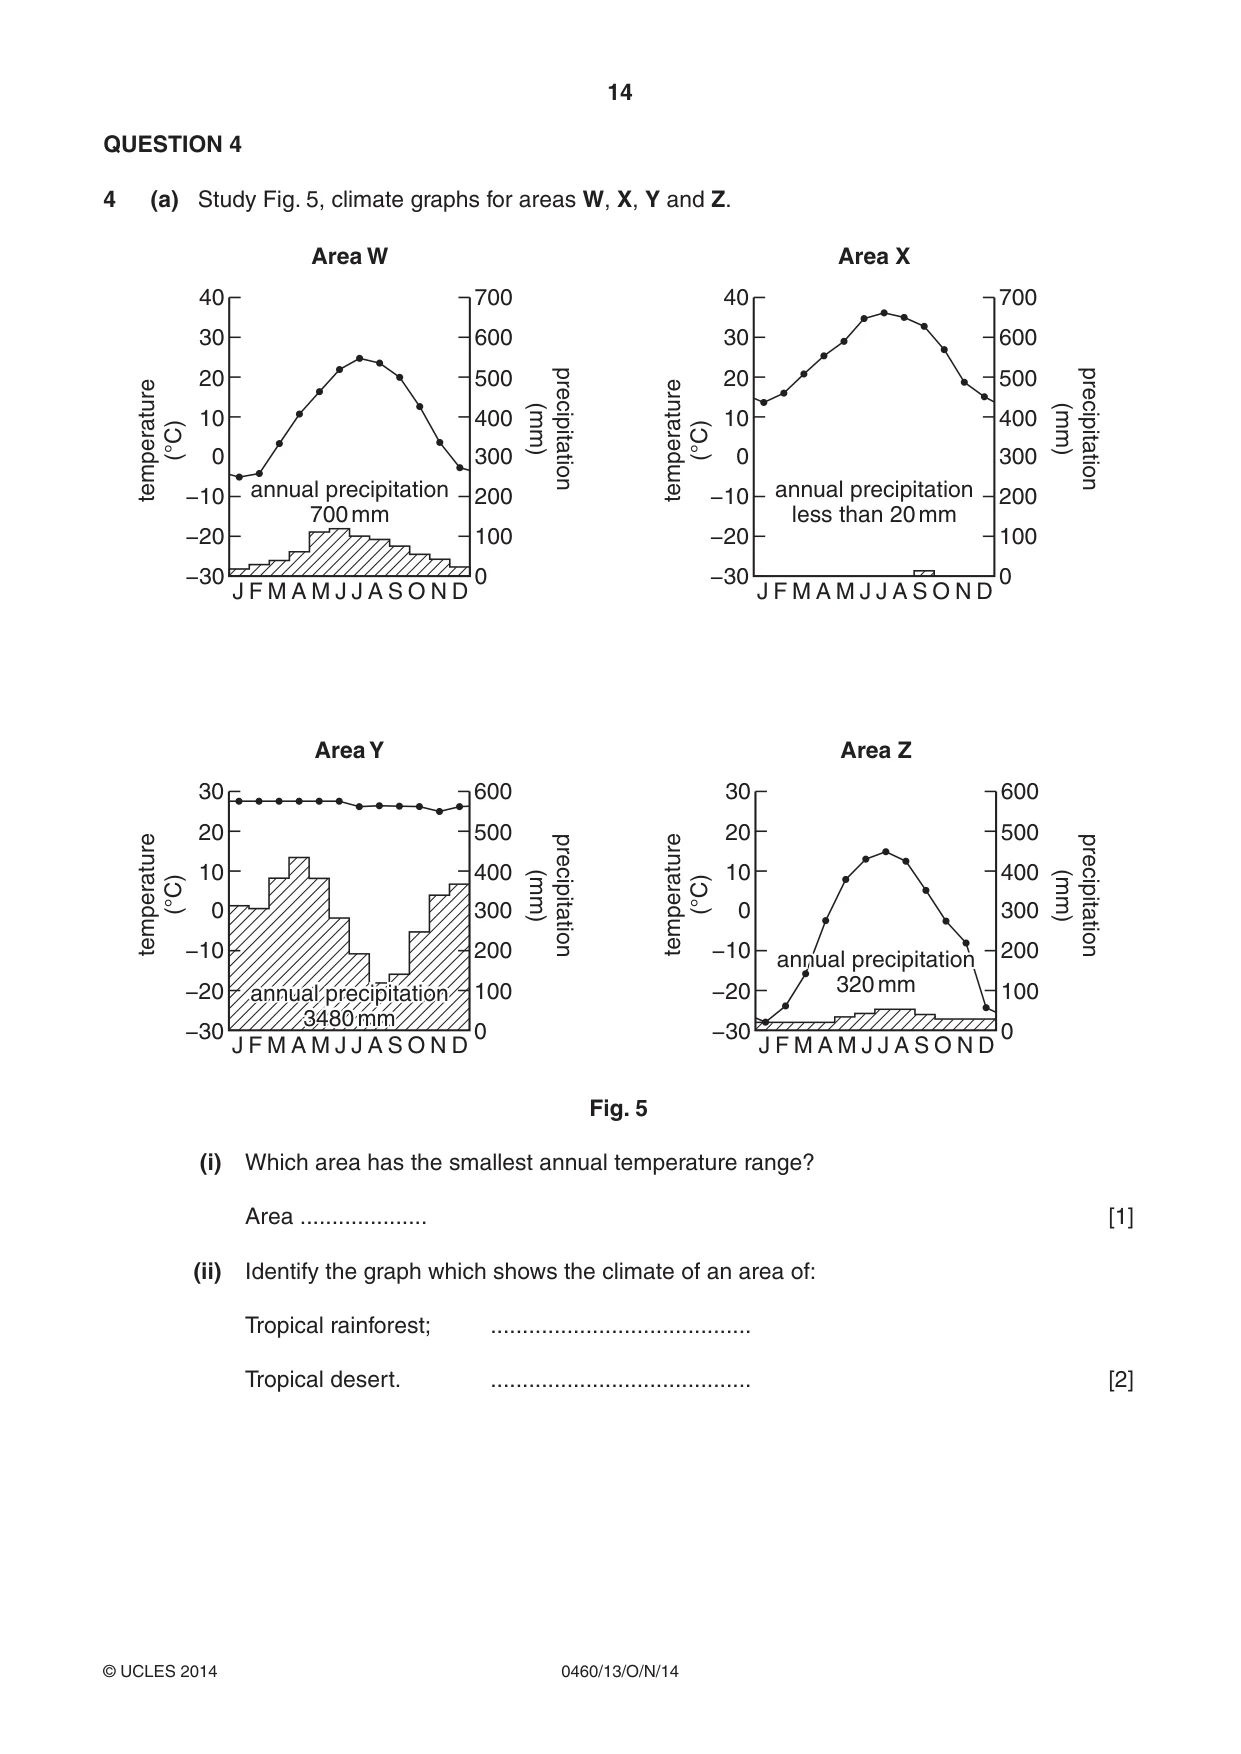
14 0460/13/O/N/14 © UCLES 2014 QUESTION 4 4 (a) Study Fig. 5, climate graphs for areas W, X, Y and Z. 40 30 20 temperature (°C) temperature (°C) 10 0 annual precipitation 700 mm Area W −10 −20 −30 700 600 500 400 300 200 100 0 J F M A M J J A S O N D 30 20 precipitation (mm) precipitation (mm) temperature (°C) temperature (°C) precipitation (mm) precipitation (mm) 10 0 annual precipitation 3480 mm Area Y −10 −20 −30 600 500 400 300 200 100 0 J F M A M J J A S O N D 40 30 20 10 0 annual precipitation less than 20 mm Area X −10 −20 −30 700 600 500 400 300 200 100 0 J F M A M J J A S O N D annual precipitation 3480 mm 30 20 10 0 annual precipitation 320 mm Area Z −10 −20 −30 600 500 400 300 200 100 0 J F M A M J J A S O N D annual precipitation 320 mm Fig. 5 (i) Which area has the smallest annual temperature range? Area … [1] (ii) Identify the graph which shows the climate of an area of: Tropical rainforest; … Tropical desert. … [2]
Question paper, page 15
15 0460/13/O/N/14 © UCLES 2014 [Turn over (iii) Explain why tropical deserts have high daytime temperatures and low temperatures at night. … … … … … …[3] (iv) Describe the processes which result in heavy convectional rainfall in tropical rainforests. … … … … … … … …[4]
Question paper, page 16
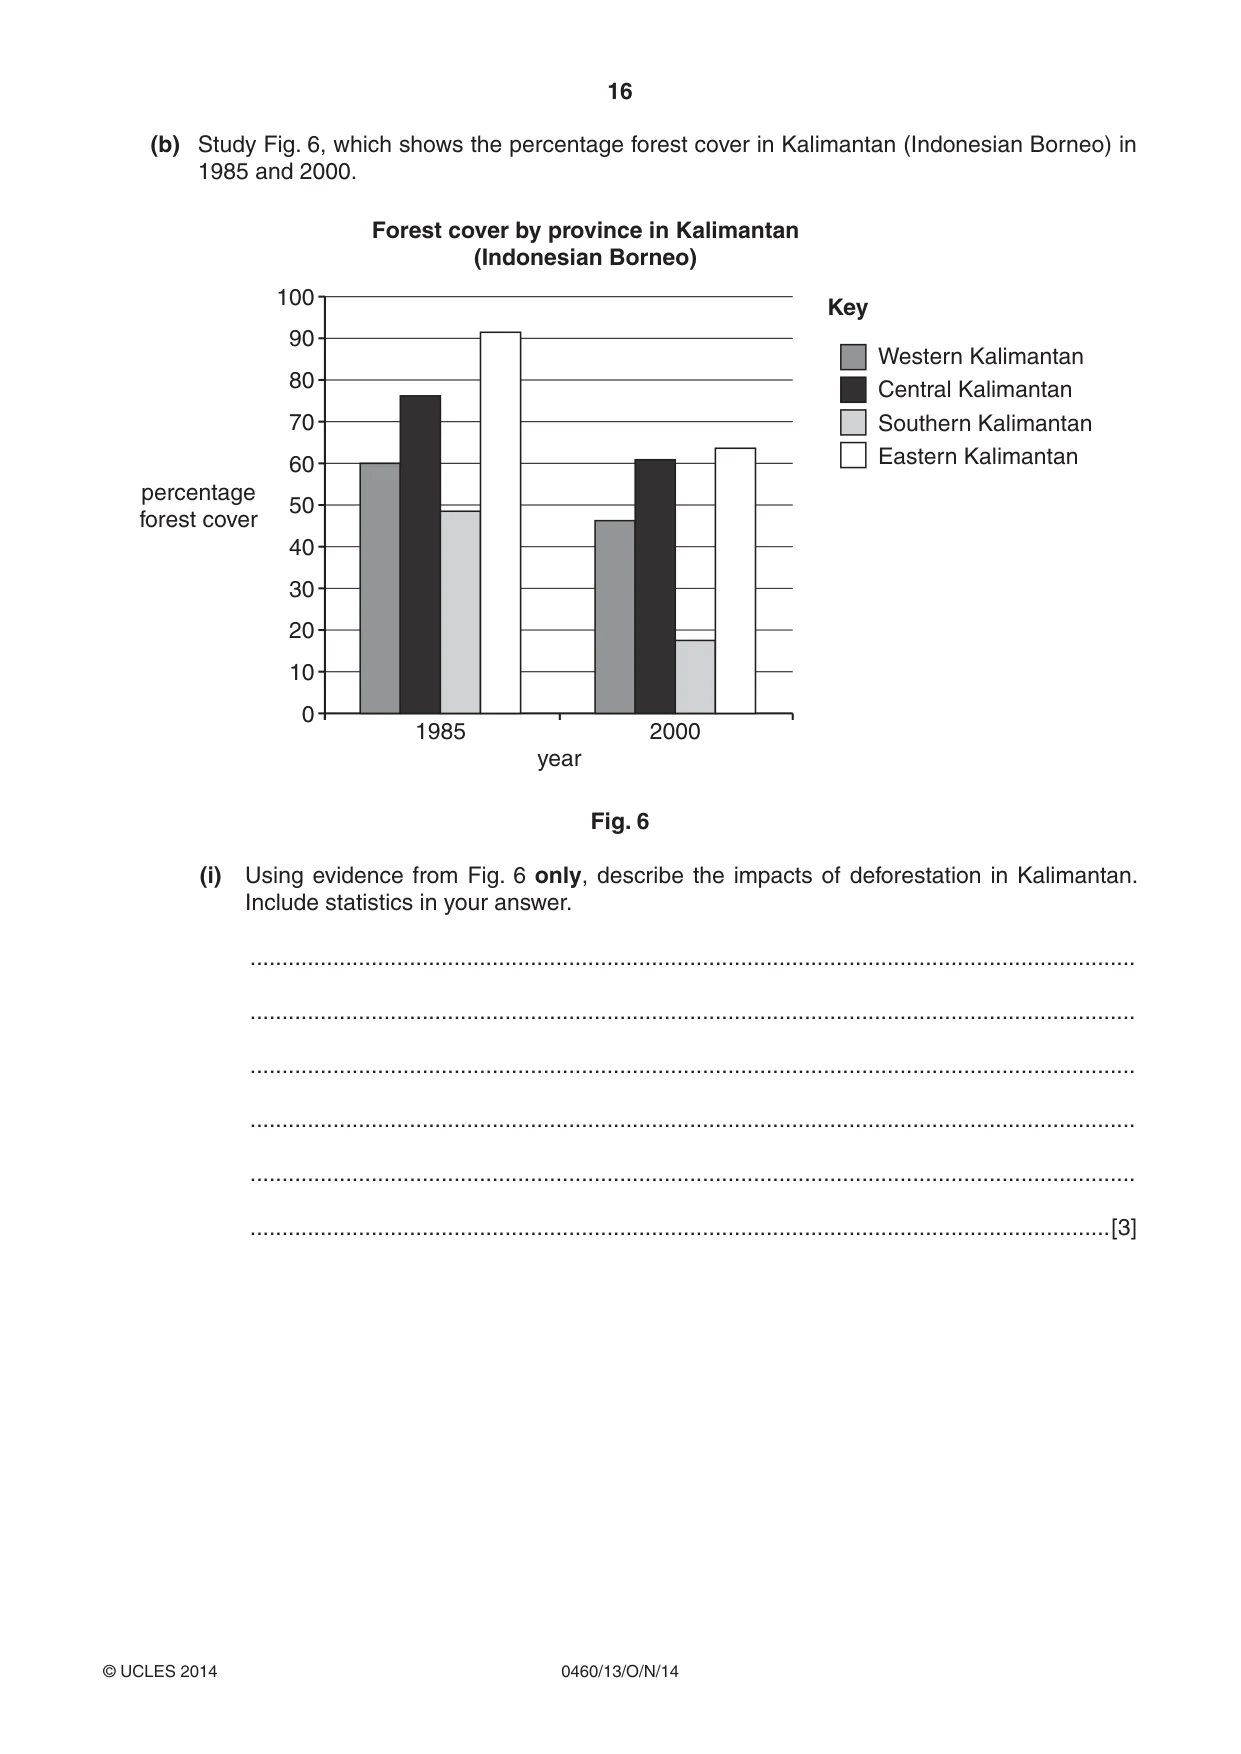
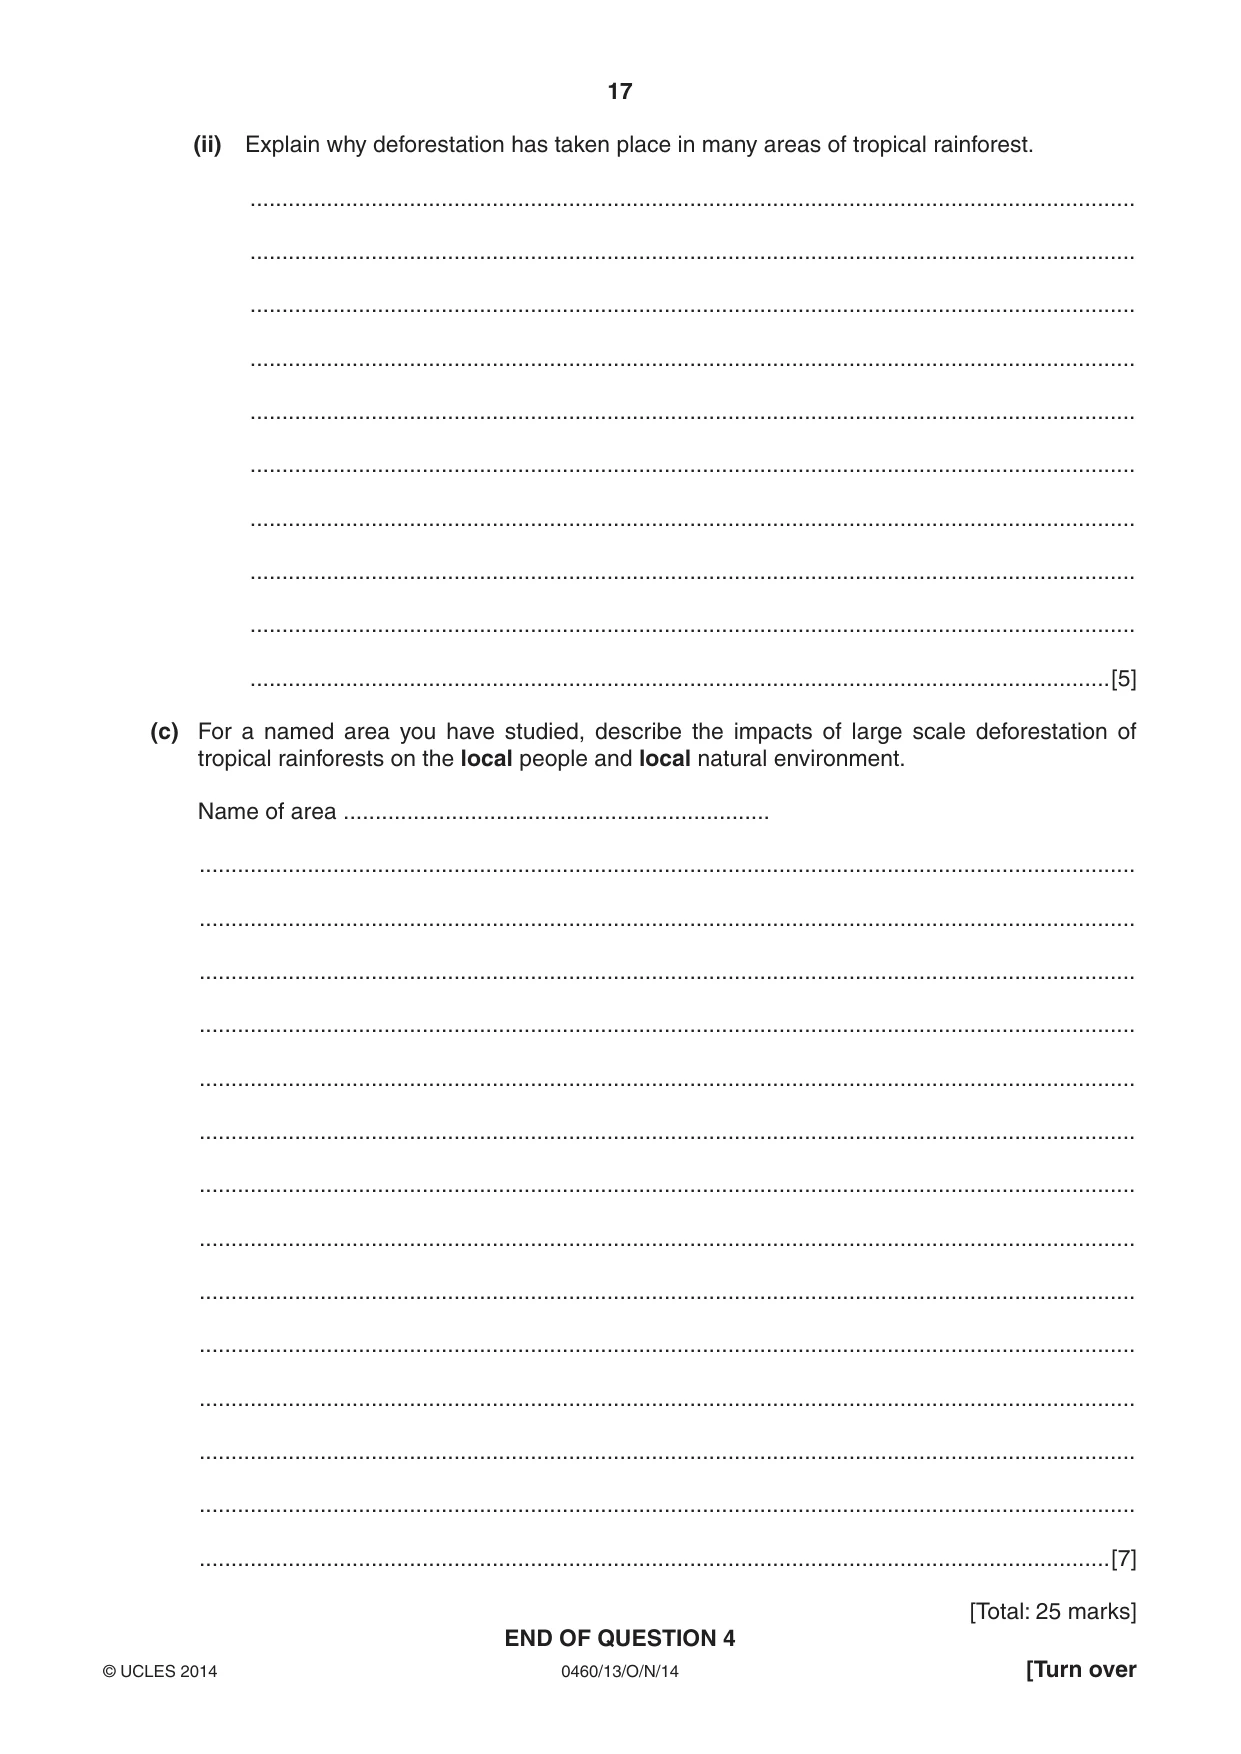
16 0460/13/O/N/14 © UCLES 2014 (b) Study Fig. 6, which shows the percentage forest cover in Kalimantan (Indonesian Borneo) in 1985 and 2000. 100 90 80 70 60 50 percentage forest cover 1985 year Key Forest cover by province in Kalimantan (Indonesian Borneo) 2000 40 30 20 10 0 Western Kalimantan Central Kalimantan Southern Kalimantan Eastern Kalimantan Fig. 6 (i) Using evidence from Fig. 6 only, describe the impacts of deforestation in Kalimantan. Include statistics in your answer. … … … … … …[3]
Question paper, page 17
17 0460/13/O/N/14 © UCLES 2014 [Turn over (ii) Explain why deforestation has taken place in many areas of tropical rainforest. … … … … … … … … … …[5] (c) For a named area you have studied, describe the impacts of large scale deforestation of tropical rainforests on the local people and local natural environment. Name of area … … … … … … … … … … … … … … …[7] [Total: 25 marks] END OF QUESTION 4
Question paper, page 18
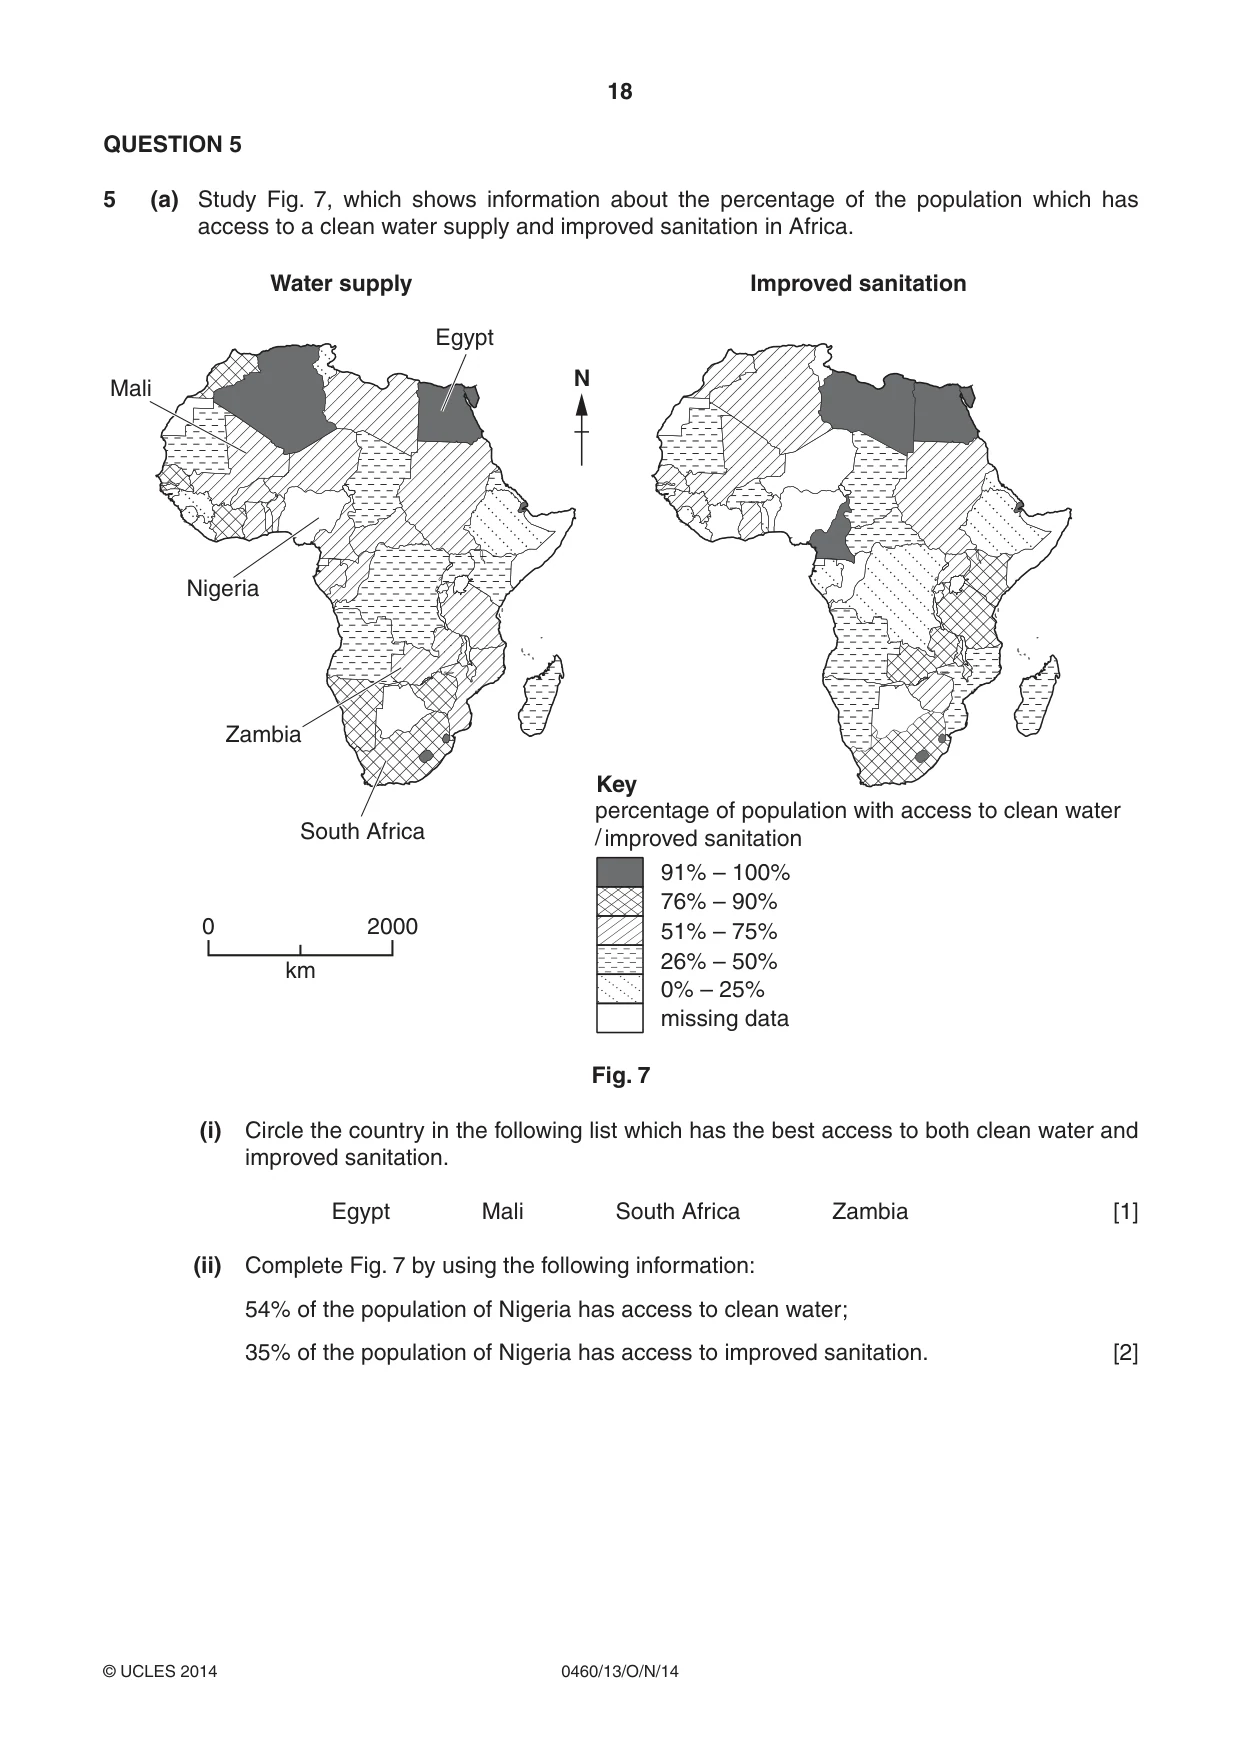
18 0460/13/O/N/14 © UCLES 2014 QUESTION 5 5 (a) Study Fig. 7, which shows information about the percentage of the population which has access to a clean water supply and improved sanitation in Africa. Key 0% – 25% Improved sanitation N Water supply 0 2000 Zambia percentage of population with access to clean water / improved sanitation Nigeria Mali Egypt South Africa km 26% – 50% 51% – 75% 76% – 90% 91% – 100% missing data Fig. 7 (i) Circle the country in the following list which has the best access to both clean water and improved sanitation. Egypt Mali South Africa Zambia [1] (ii) Complete Fig. 7 by using the following information: 54% of the population of Nigeria has access to clean water; 35% of the population of Nigeria has access to improved sanitation. [2]
Question paper, page 19
19 0460/13/O/N/14 © UCLES 2014 [Turn over (iii) Explain how sanitation can be improved in an LEDC. … … … … … …[3] (iv) Describe four different ways in which water supplies can be increased in a country. 1 … … 2 … … 3 … … 4 … …[4]
Question paper, page 20
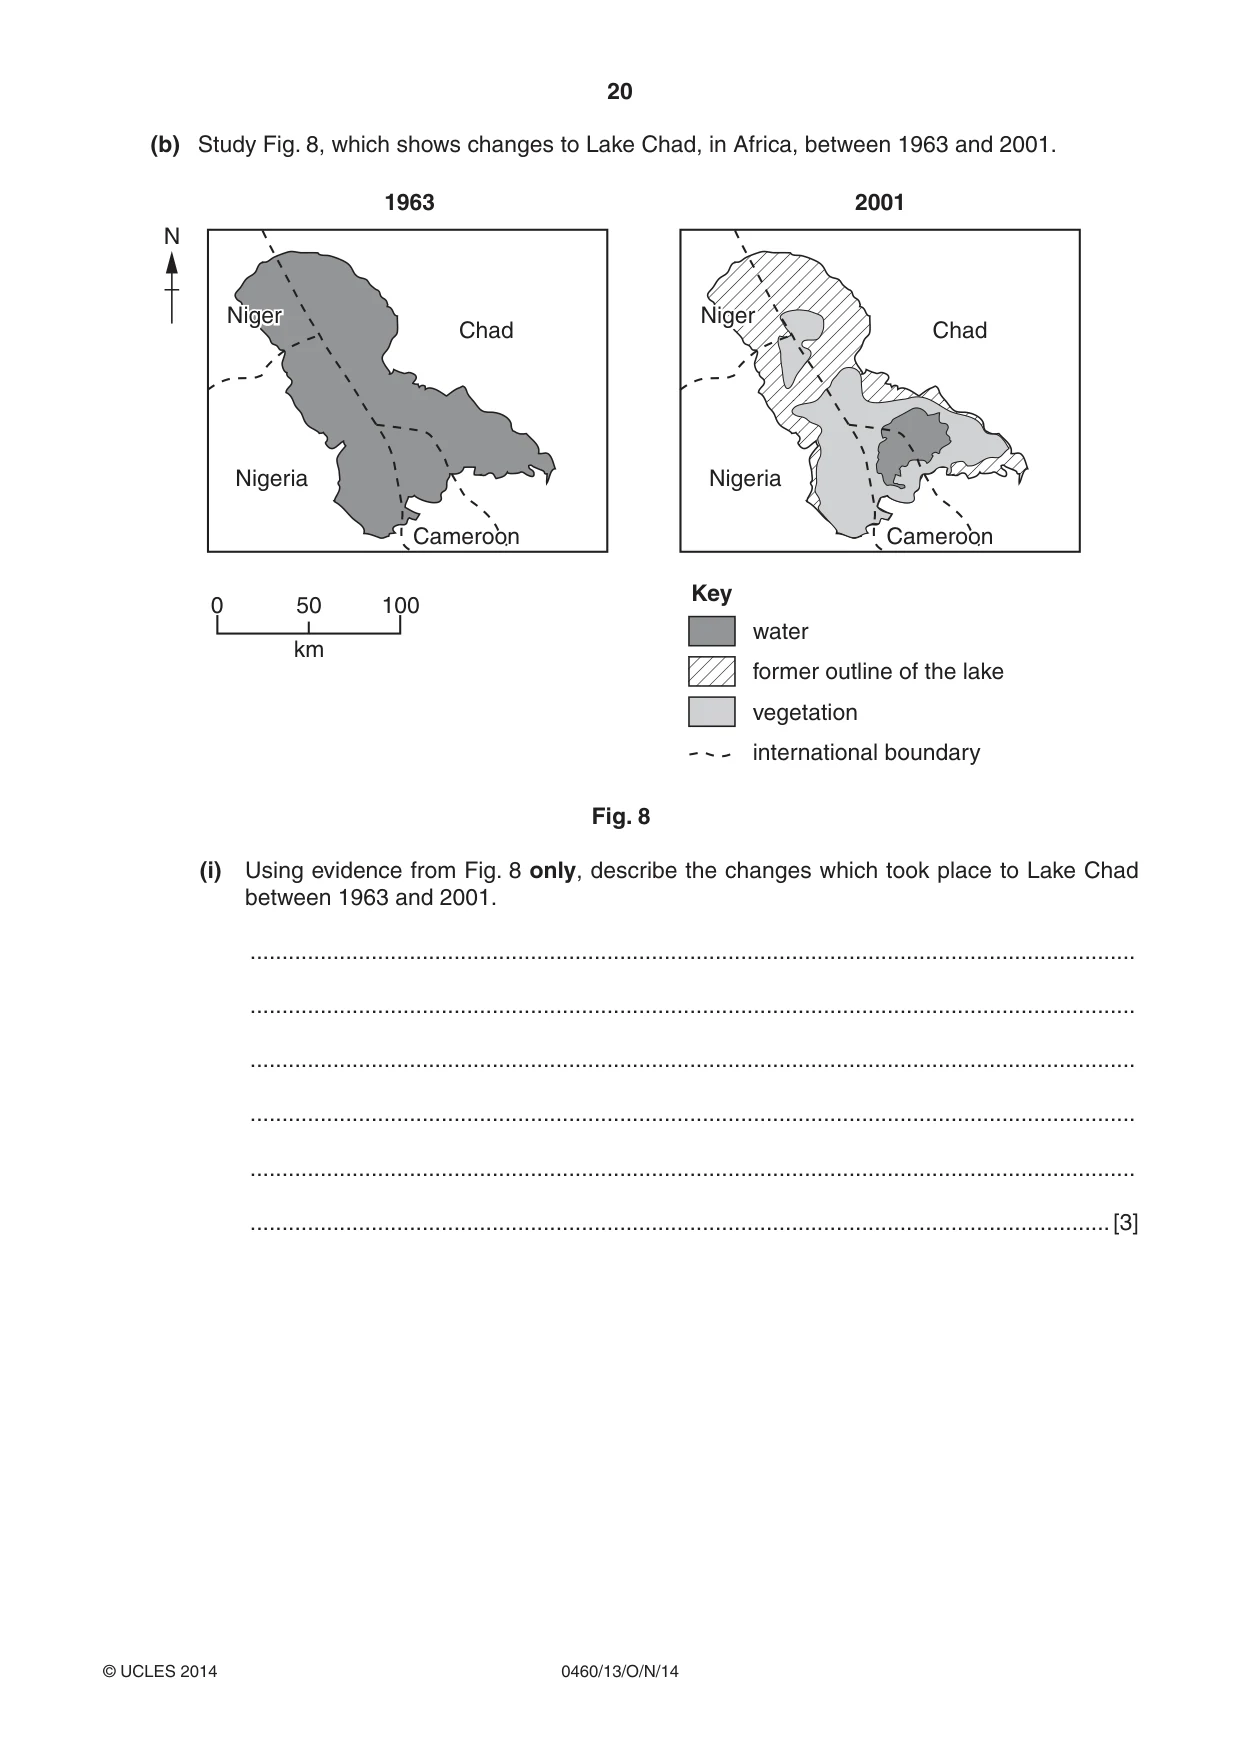
20 0460/13/O/N/14 © UCLES 2014 (b) Study Fig. 8, which shows changes to Lake Chad, in Africa, between 1963 and 2001. Key water former outline of the lake vegetation international boundary N 0 100 Chad Nigeria Chad Nigeria 50 km 1963 2001 Niger Niger Cameroon Cameroon Fig. 8 (i) Using evidence from Fig. 8 only, describe the changes which took place to Lake Chad between 1963 and 2001. … … … … … …[3]
Question paper, page 21
21 0460/13/O/N/14 © UCLES 2014 [Turn over (ii) Suggest the likely impacts of the changes to Lake Chad on local people. … … … … … … … … … …[5] (c) For a named country or area you have studied, identify a form of energy which is used. Describe how its use threatens the natural environment. Name of country or area … … … … … … … … … … … … … … …[7] [Total: 25 marks] END OF QUESTION 5
Question paper, page 22
22 0460/13/O/N/14 © UCLES 2014 QUESTION 6 6 (a) Study Fig. 9, which shows the GDP (Gross Domestic Product) per person and the percentage of the GDP that comes from agriculture for selected countries. GDP is a measure of wealth. 0 5 2000 4000 6000 8000 GDP per person (US$) 10 000 12 000 14 000 0 10 15 percentage of GDP that comes from agriculture 20 25 30 Bulgaria Brazil China Angola Paraguay Bangladesh Ivory Coast Cambodia Fig. 9 (i) On Fig. 9, mark and label a cross to show India using the following information: GDP per person US$4000 percentage of GDP that comes from agriculture 17% [1] (ii) Using Fig. 9 only, state the general relationship between GDP per person and the percentage of the GDP that comes from agriculture. Support your answer with statistics. … … … … [2] (iii) Explain why many people in LEDCs are subsistence farmers. … … … … … … [3]
Question paper, page 23
23 0460/13/O/N/14 © UCLES 2014 [Turn over (iv) Explain how commercial farmers in MEDCs are able to produce high yields per hectare. … … … … … … … … [4] (b) Study Fig. 10, which shows some of the causes of soil erosion. LOWER RAINFALL INCREASED DEMAND FOR FIREWOOD DEFORESTATION OVERGRAZING MARGINAL LAND CULTIVATED FEWER TREES AND PLANTS INCREASED EVAPORATION FROM THE SOIL SOIL BLOWN AWAY BY WIND SOIL EROSION INCREASED DEMAND FOR FOOD INCREASED POPULATION GROWTH Fig. 10 (i) Using Fig. 10 only, explain how human actions can cause soil erosion. … … … … … … [3]
Question paper, page 24
24 0460/13/O/N/14 © UCLES 2014 (ii) Explain how farmers can prevent soil erosion and maintain soil quality. … … … … … … … … … …[5]
Question paper, page 25
25 0460/13/O/N/14 © UCLES 2014 (c) For a named area you have studied, identify the type of farming which takes place and explain why the land is used in this way. Name of area … Type of farming … … … … … … … … … … … … … … … …[7] [Total: 25 marks] END OF QUESTION 6
Question paper, page 26
26 0460/13/O/N/14 © UCLES 2014 Additional Page If you use the following lined page to complete the answer(s) to any question(s), the question number(s) must be clearly shown. … … … … … … … … … … … … … … … … … … … … … … … … … …
Question paper, page 27
27 0460/13/O/N/14 © UCLES 2014 BLANK PAGE
Question paper, page 28
28 0460/13/O/N/14 © UCLES 2014 Copyright Acknowledgements: Question 1 Figs 1 & 2 Question 2 Photographs A & B Question 3 Photographs C, D, E & F Question 3 Fig. 4 Question 4 Fig. 5 Question 4 Fig. 6 Question 5 Fig. 7 Question 5 Fig. 8 © http://news.bbc.co.uk/1/hi/world/europe/6228236.stm S. Sibley © UCLES. S. Sibley © UCLES. © Ann Bowen & John Pallister; Revise for Geography GCSE: Syllabus A; Heinemann; 1999; 043510117X. © K. Brooks; Physical Geography: Process and System; Hodder Arnold H&S; 1985; 034035951X. © http://www.mongabay.com/borneo.html © WHO and UNICEF 2000. © GRID-Arendal; http://www.grida.no/publications/vg/africa/page/3115.aspx Permission to reproduce items where third-party owned material protected by copyright is included has been sought and cleared where possible. Every reasonable effort has been made by the publisher (UCLES) to trace copyright holders, but if any items requiring clearance have unwittingly been included, the publisher will be pleased to make amends at the earliest possible opportunity. Cambridge International Examinations is part of the Cambridge Assessment Group. Cambridge Assessment is the brand name of University of Cambridge Local Examinations Syndicate (UCLES), which is itself a department of the University of Cambridge. BLANK PAGE
Mark scheme, page 1
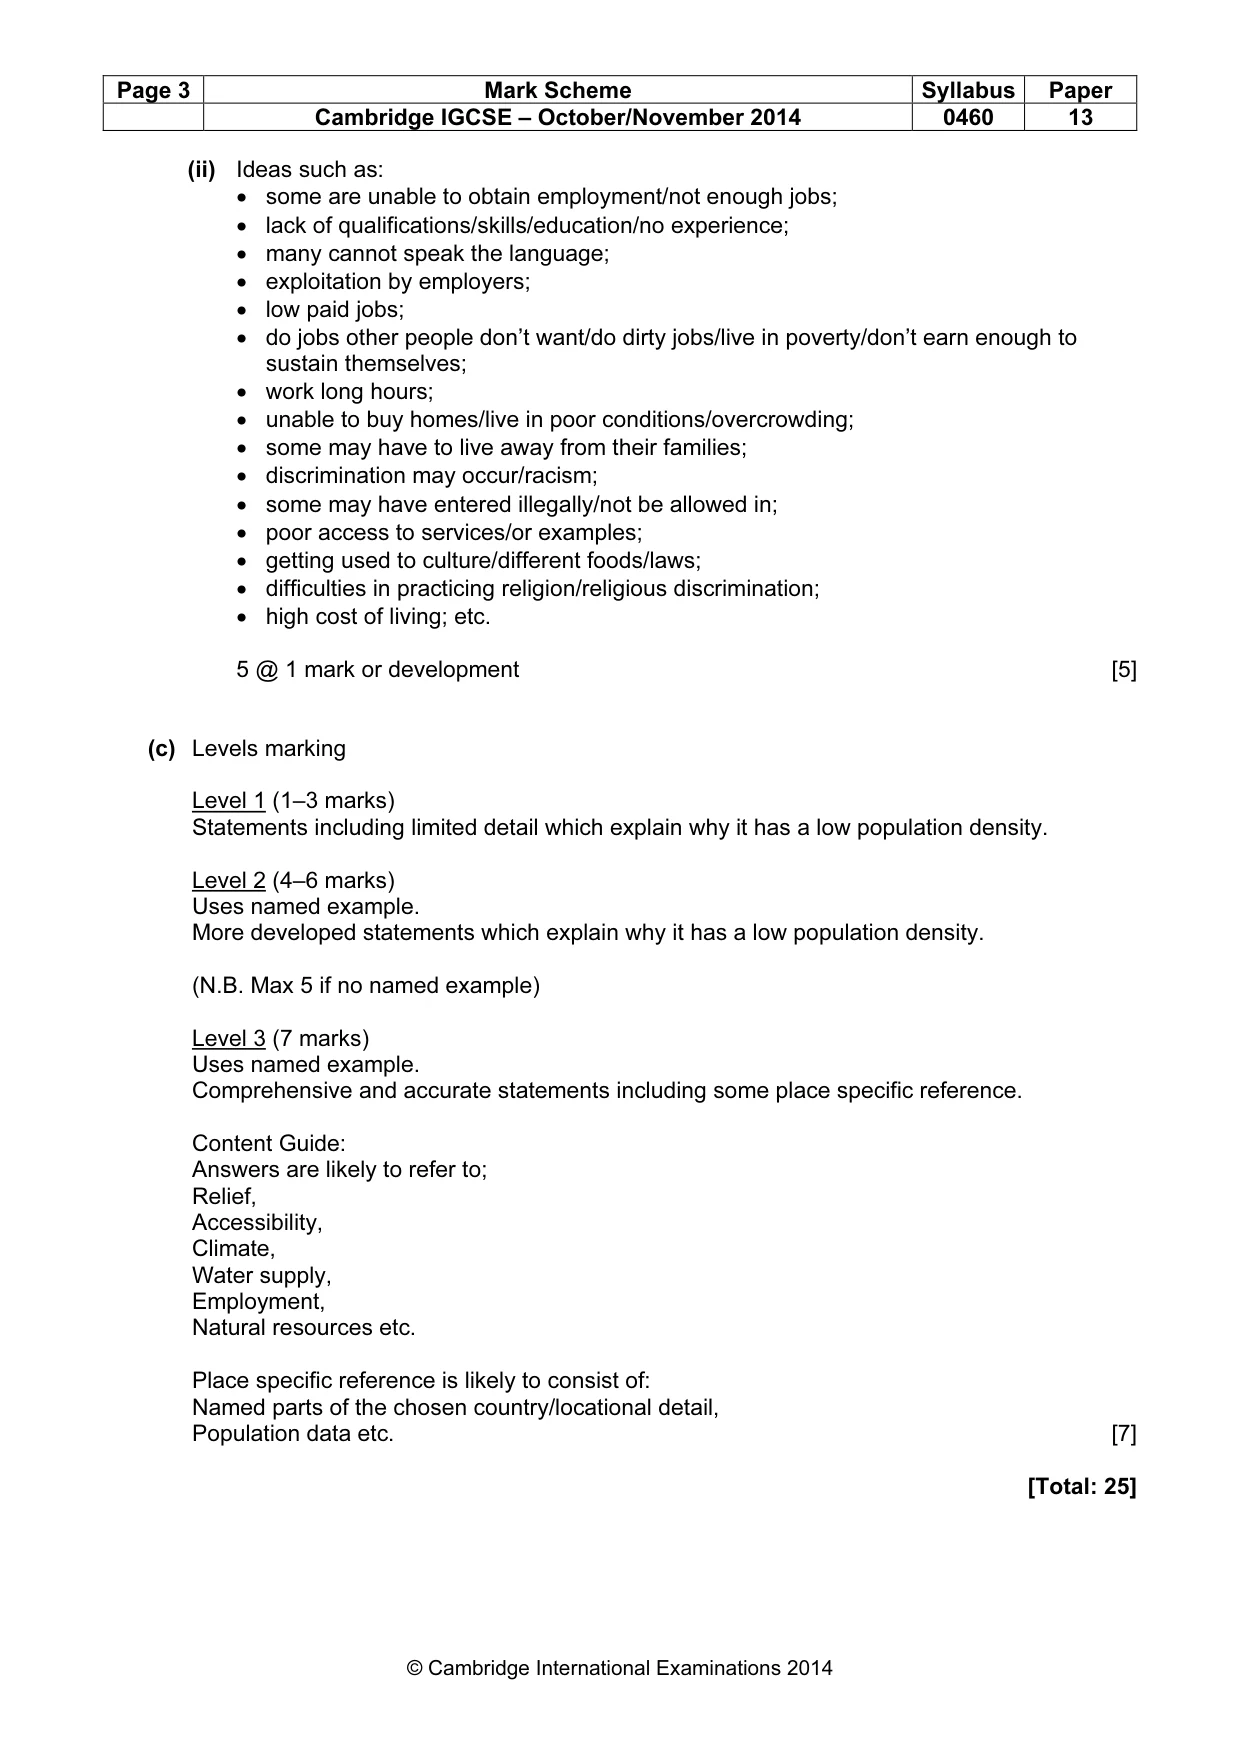
® IGCSE is the registered trademark of Cambridge International Examinations. CAMBRIDGE INTERNATIONAL EXAMINATIONS Cambridge International General Certificate of Secondary Education MARK SCHEME for the October/November 2014 series 0460 GEOGRAPHY 0460/13 Paper 1, maximum raw mark 75 This mark scheme is published as an aid to teachers and candidates, to indicate the requirements of the examination. It shows the basis on which Examiners were instructed to award marks. It does not indicate the details of the discussions that took place at an Examiners’ meeting before marking began, which would have considered the acceptability of alternative answers. Mark schemes should be read in conjunction with the question paper and the Principal Examiner Report for Teachers. Cambridge will not enter into discussions about these mark schemes. Cambridge is publishing the mark schemes for the October/November 2014 series for most Cambridge IGCSE®, Cambridge International A and AS Level components and some Cambridge O Level components.
Mark scheme, page 2
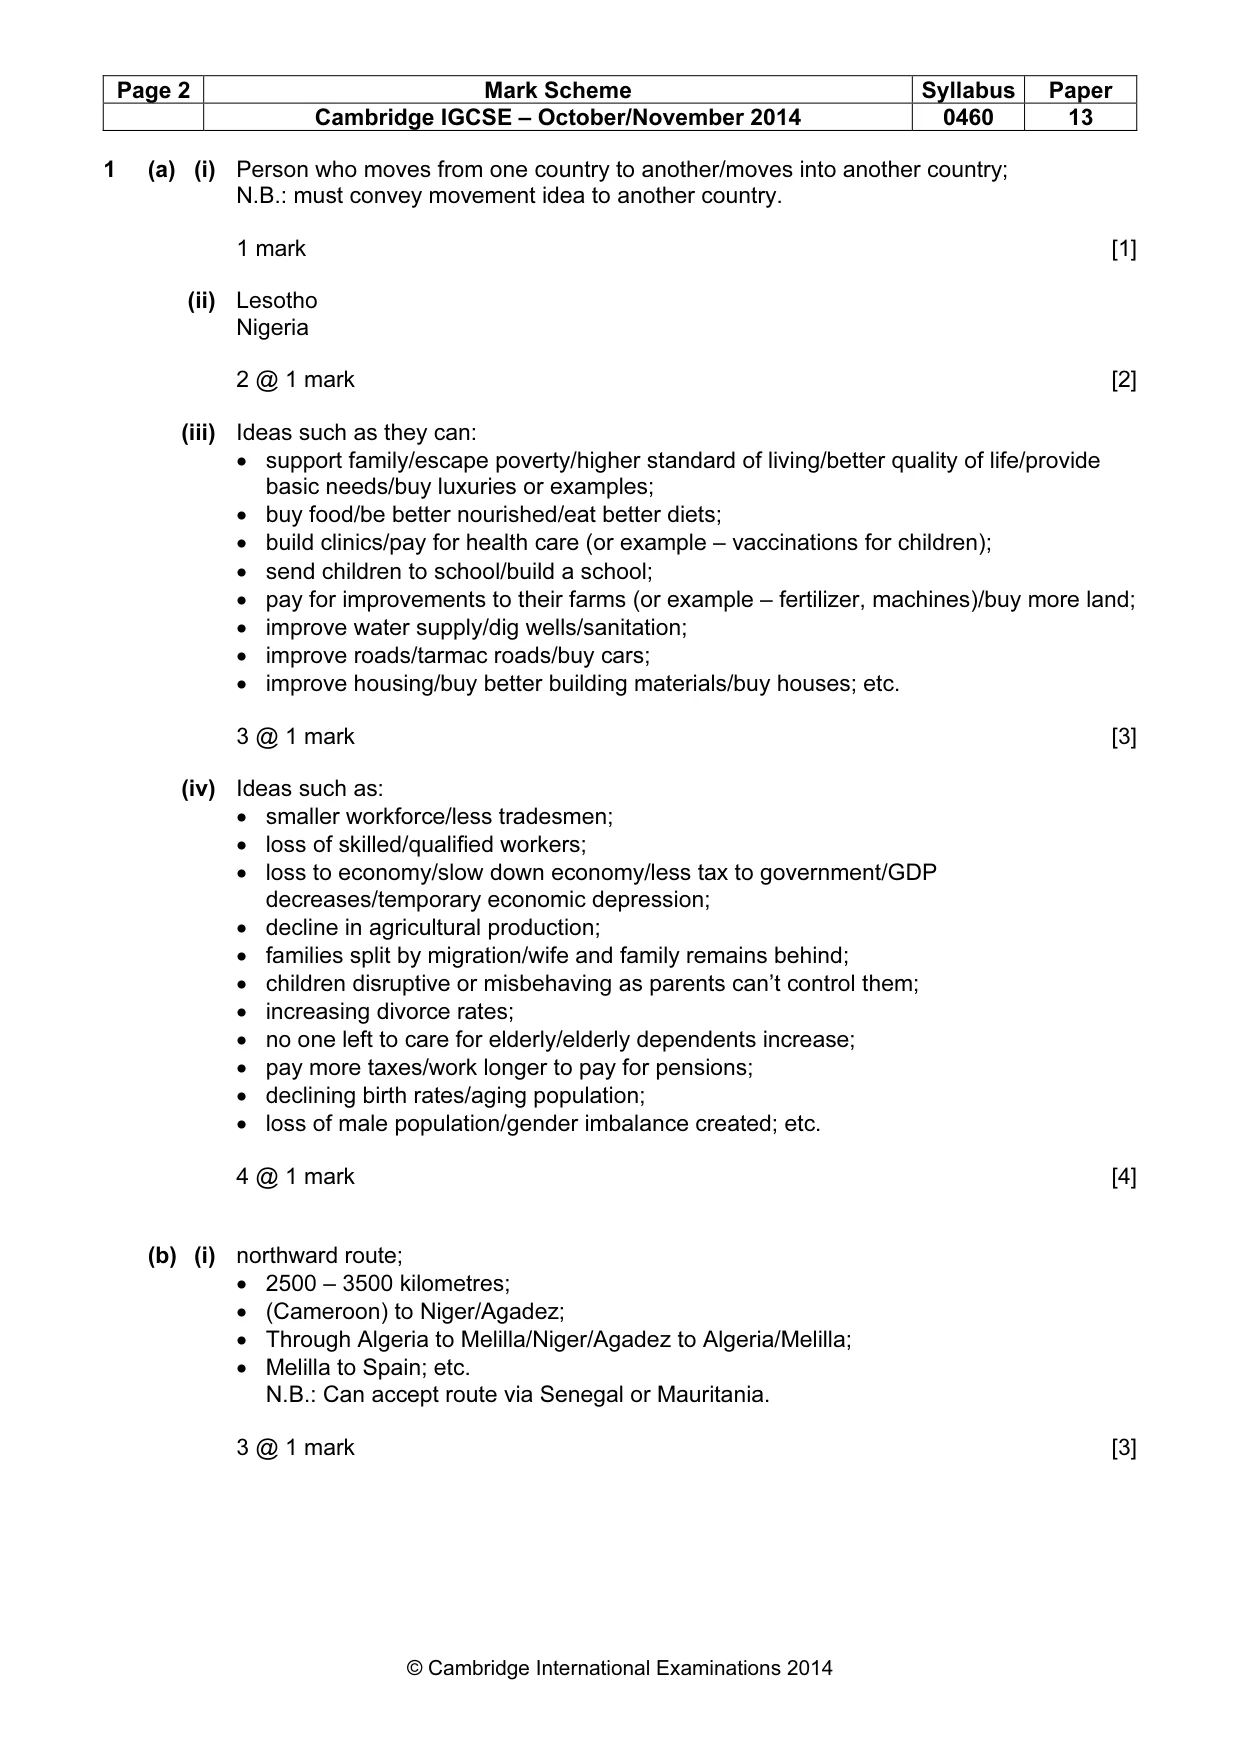
Page 2 Mark Scheme Syllabus Paper Cambridge IGCSE – October/November 2014 0460 13 © Cambridge International Examinations 2014 1 (a) (i) Person who moves from one country to another/moves into another country; N.B.: must convey movement idea to another country. 1 mark [1] (ii) Lesotho Nigeria 2 @ 1 mark [2] (iii) Ideas such as they can: • support family/escape poverty/higher standard of living/better quality of life/provide basic needs/buy luxuries or examples; • buy food/be better nourished/eat better diets; • build clinics/pay for health care (or example – vaccinations for children); • send children to school/build a school; • pay for improvements to their farms (or example – fertilizer, machines)/buy more land; • improve water supply/dig wells/sanitation; • improve roads/tarmac roads/buy cars; • improve housing/buy better building materials/buy houses; etc. 3 @ 1 mark [3] (iv) Ideas such as: • smaller workforce/less tradesmen; • loss of skilled/qualified workers; • loss to economy/slow down economy/less tax to government/GDP decreases/temporary economic depression; • decline in agricultural production; • families split by migration/wife and family remains behind; • children disruptive or misbehaving as parents can’t control them; • increasing divorce rates; • no one left to care for elderly/elderly dependents increase; • pay more taxes/work longer to pay for pensions; • declining birth rates/aging population; • loss of male population/gender imbalance created; etc. 4 @ 1 mark [4] (b) (i) northward route; • 2500 – 3500 kilometres; • (Cameroon) to Niger/Agadez; • Through Algeria to Melilla/Niger/Agadez to Algeria/Melilla; • Melilla to Spain; etc. N.B.: Can accept route via Senegal or Mauritania. 3 @ 1 mark [3]
Mark scheme, page 3
Page 3 Mark Scheme Syllabus Paper Cambridge IGCSE – October/November 2014 0460 13 © Cambridge International Examinations 2014 (ii) Ideas such as: • some are unable to obtain employment/not enough jobs; • lack of qualifications/skills/education/no experience; • many cannot speak the language; • exploitation by employers; • low paid jobs; • do jobs other people don’t want/do dirty jobs/live in poverty/don’t earn enough to sustain themselves; • work long hours; • unable to buy homes/live in poor conditions/overcrowding; • some may have to live away from their families; • discrimination may occur/racism; • some may have entered illegally/not be allowed in; • poor access to services/or examples; • getting used to culture/different foods/laws; • difficulties in practicing religion/religious discrimination; • high cost of living; etc. 5 @ 1 mark or development [5] (c) Levels marking Level 1 (1–3 marks) Statements including limited detail which explain why it has a low population density. Level 2 (4–6 marks) Uses named example. More developed statements which explain why it has a low population density. (N.B. Max 5 if no named example) Level 3 (7 marks) Uses named example. Comprehensive and accurate statements including some place specific reference. Content Guide: Answers are likely to refer to; Relief, Accessibility, Climate, Water supply, Employment, Natural resources etc. Place specific reference is likely to consist of: Named parts of the chosen country/locational detail, Population data etc. [7] [Total: 25]
Mark scheme, page 4
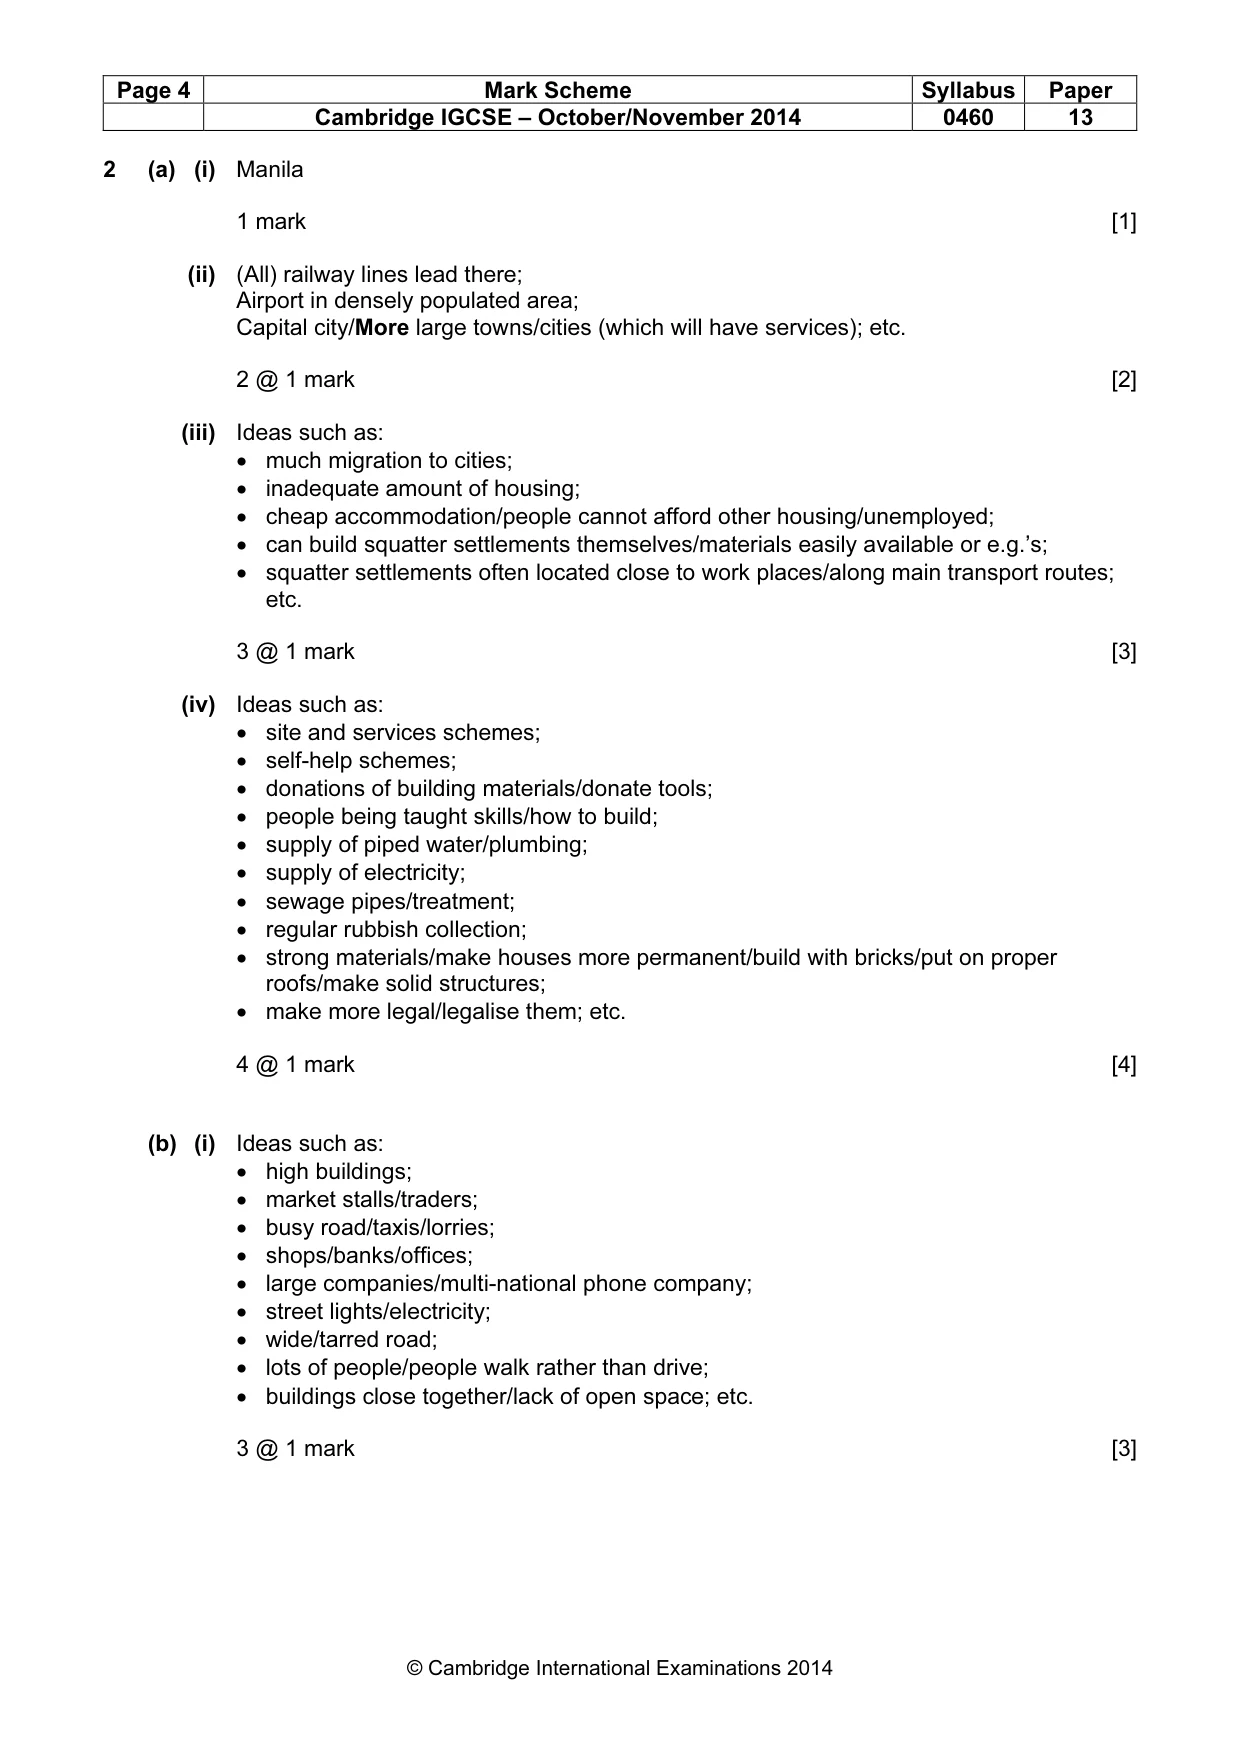
Page 4 Mark Scheme Syllabus Paper Cambridge IGCSE – October/November 2014 0460 13 © Cambridge International Examinations 2014 2 (a) (i) Manila 1 mark [1] (ii) (All) railway lines lead there; Airport in densely populated area; Capital city/More large towns/cities (which will have services); etc. 2 @ 1 mark [2] (iii) Ideas such as: • much migration to cities; • inadequate amount of housing; • cheap accommodation/people cannot afford other housing/unemployed; • can build squatter settlements themselves/materials easily available or e.g.’s; • squatter settlements often located close to work places/along main transport routes; etc. 3 @ 1 mark [3] (iv) Ideas such as: • site and services schemes; • self-help schemes; • donations of building materials/donate tools; • people being taught skills/how to build; • supply of piped water/plumbing; • supply of electricity; • sewage pipes/treatment; • regular rubbish collection; • strong materials/make houses more permanent/build with bricks/put on proper roofs/make solid structures; • make more legal/legalise them; etc. 4 @ 1 mark [4] (b) (i) Ideas such as: • high buildings; • market stalls/traders; • busy road/taxis/lorries; • shops/banks/offices; • large companies/multi-national phone company; • street lights/electricity; • wide/tarred road; • lots of people/people walk rather than drive; • buildings close together/lack of open space; etc. 3 @ 1 mark [3]
Mark scheme, page 5
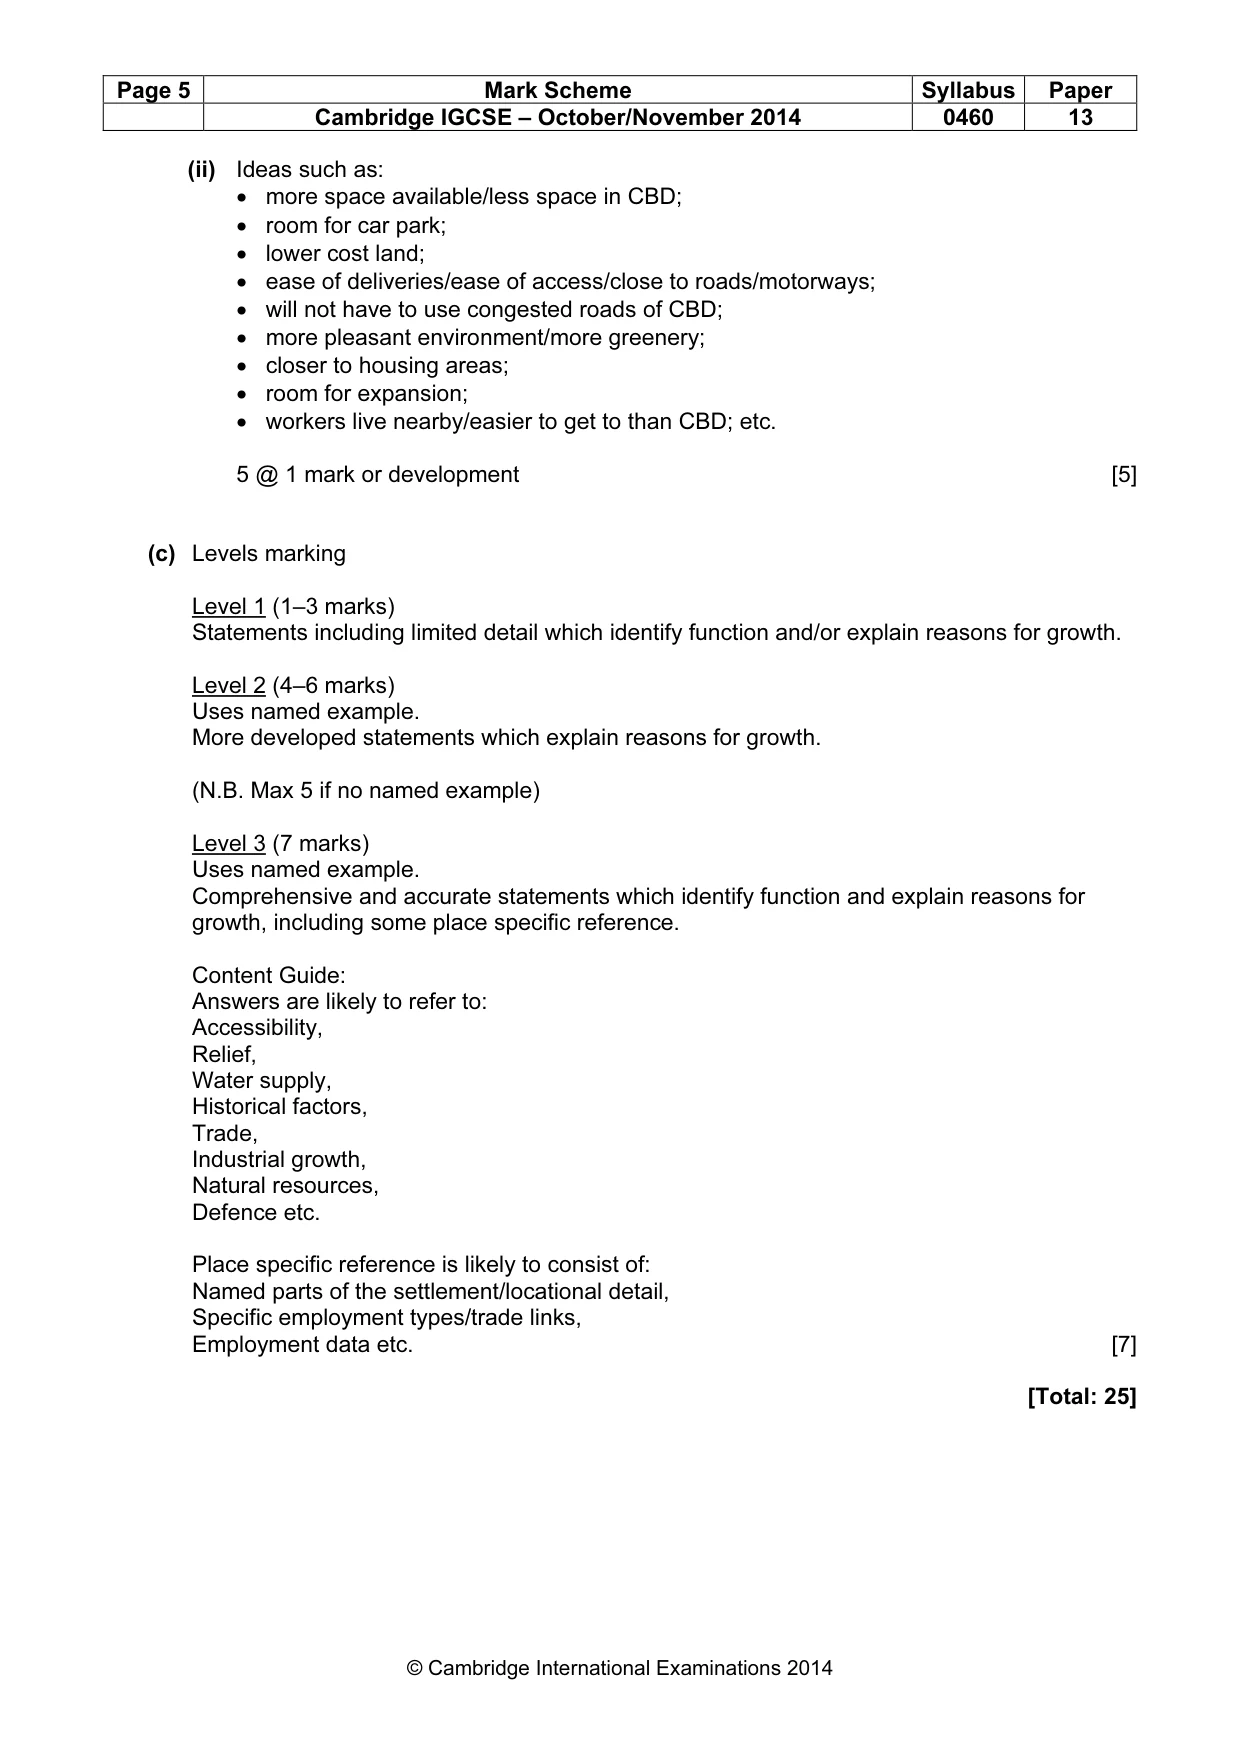
Page 5 Mark Scheme Syllabus Paper Cambridge IGCSE – October/November 2014 0460 13 © Cambridge International Examinations 2014 (ii) Ideas such as: • more space available/less space in CBD; • room for car park; • lower cost land; • ease of deliveries/ease of access/close to roads/motorways; • will not have to use congested roads of CBD; • more pleasant environment/more greenery; • closer to housing areas; • room for expansion; • workers live nearby/easier to get to than CBD; etc. 5 @ 1 mark or development [5] (c) Levels marking Level 1 (1–3 marks) Statements including limited detail which identify function and/or explain reasons for growth. Level 2 (4–6 marks) Uses named example. More developed statements which explain reasons for growth. (N.B. Max 5 if no named example) Level 3 (7 marks) Uses named example. Comprehensive and accurate statements which identify function and explain reasons for growth, including some place specific reference. Content Guide: Answers are likely to refer to: Accessibility, Relief, Water supply, Historical factors, Trade, Industrial growth, Natural resources, Defence etc. Place specific reference is likely to consist of: Named parts of the settlement/locational detail, Specific employment types/trade links, Employment data etc. [7] [Total: 25]
Mark scheme, page 6
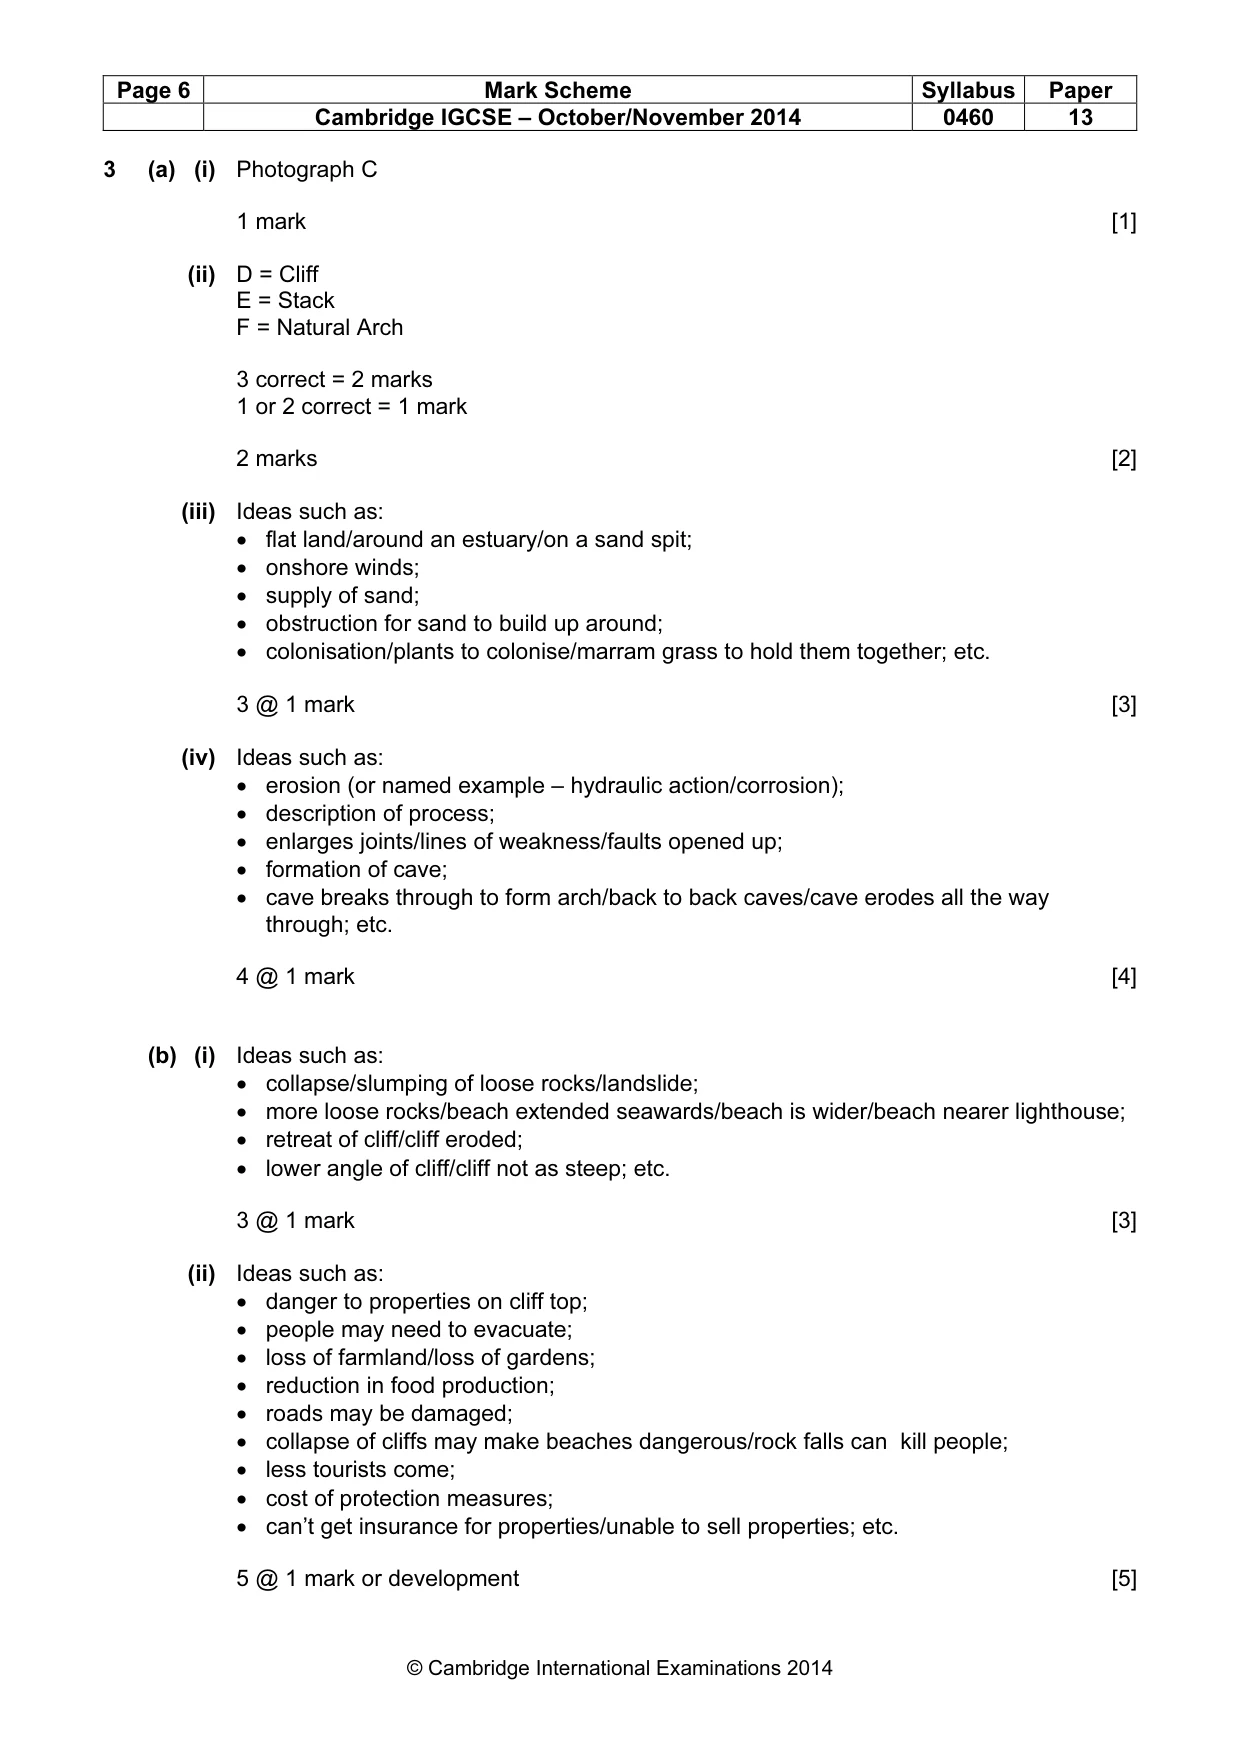
Page 6 Mark Scheme Syllabus Paper Cambridge IGCSE – October/November 2014 0460 13 © Cambridge International Examinations 2014 3 (a) (i) Photograph C 1 mark [1] (ii) D = Cliff E = Stack F = Natural Arch 3 correct = 2 marks 1 or 2 correct = 1 mark 2 marks [2] (iii) Ideas such as: • flat land/around an estuary/on a sand spit; • onshore winds; • supply of sand; • obstruction for sand to build up around; • colonisation/plants to colonise/marram grass to hold them together; etc. 3 @ 1 mark [3] (iv) Ideas such as: • erosion (or named example – hydraulic action/corrosion); • description of process; • enlarges joints/lines of weakness/faults opened up; • formation of cave; • cave breaks through to form arch/back to back caves/cave erodes all the way through; etc. 4 @ 1 mark [4] (b) (i) Ideas such as: • collapse/slumping of loose rocks/landslide; • more loose rocks/beach extended seawards/beach is wider/beach nearer lighthouse; • retreat of cliff/cliff eroded; • lower angle of cliff/cliff not as steep; etc. 3 @ 1 mark [3] (ii) Ideas such as: • danger to properties on cliff top; • people may need to evacuate; • loss of farmland/loss of gardens; • reduction in food production; • roads may be damaged; • collapse of cliffs may make beaches dangerous/rock falls can kill people; • less tourists come; • cost of protection measures; • can’t get insurance for properties/unable to sell properties; etc. 5 @ 1 mark or development [5]
Mark scheme, page 7
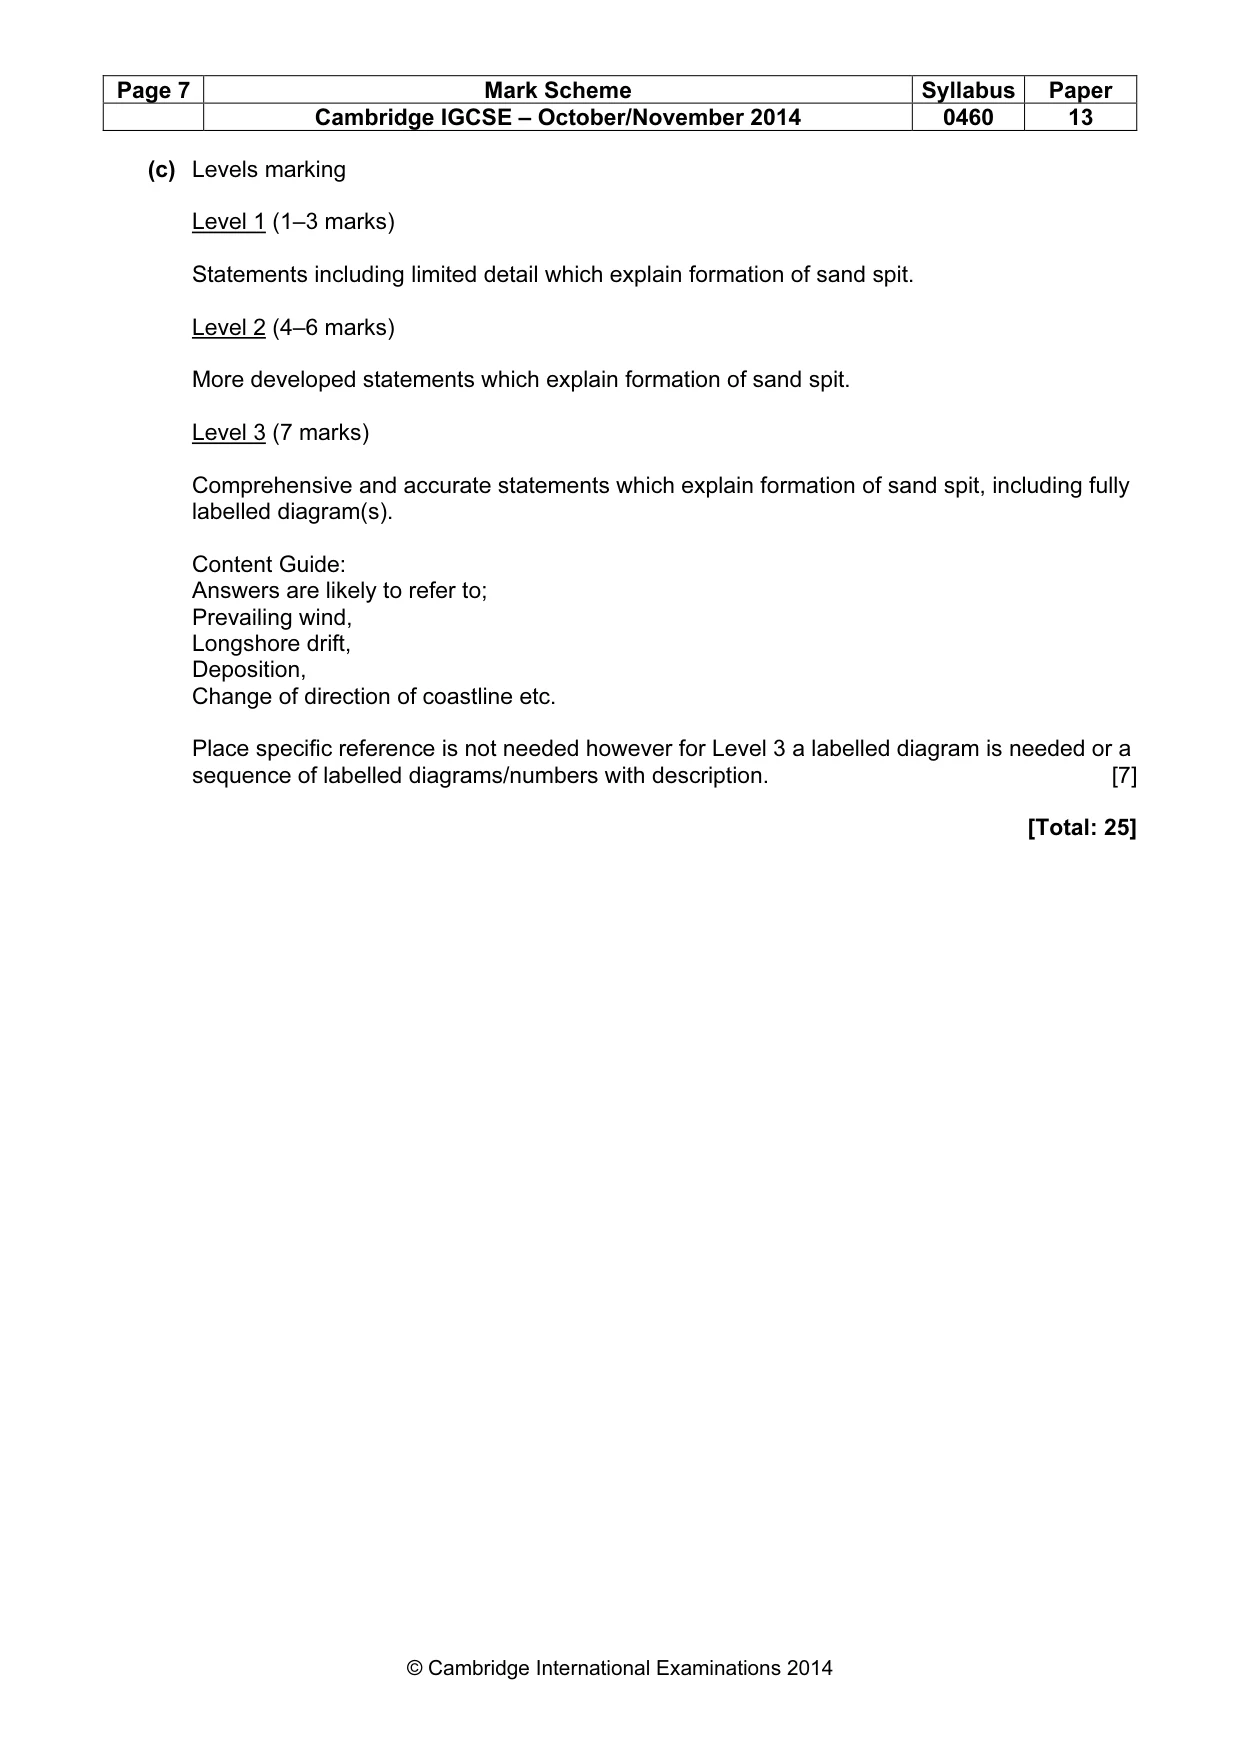
Page 7 Mark Scheme Syllabus Paper Cambridge IGCSE – October/November 2014 0460 13 © Cambridge International Examinations 2014 (c) Levels marking Level 1 (1–3 marks) Statements including limited detail which explain formation of sand spit. Level 2 (4–6 marks) More developed statements which explain formation of sand spit. Level 3 (7 marks) Comprehensive and accurate statements which explain formation of sand spit, including fully labelled diagram(s). Content Guide: Answers are likely to refer to; Prevailing wind, Longshore drift, Deposition, Change of direction of coastline etc. Place specific reference is not needed however for Level 3 a labelled diagram is needed or a sequence of labelled diagrams/numbers with description. [7] [Total: 25]
Mark scheme, page 8
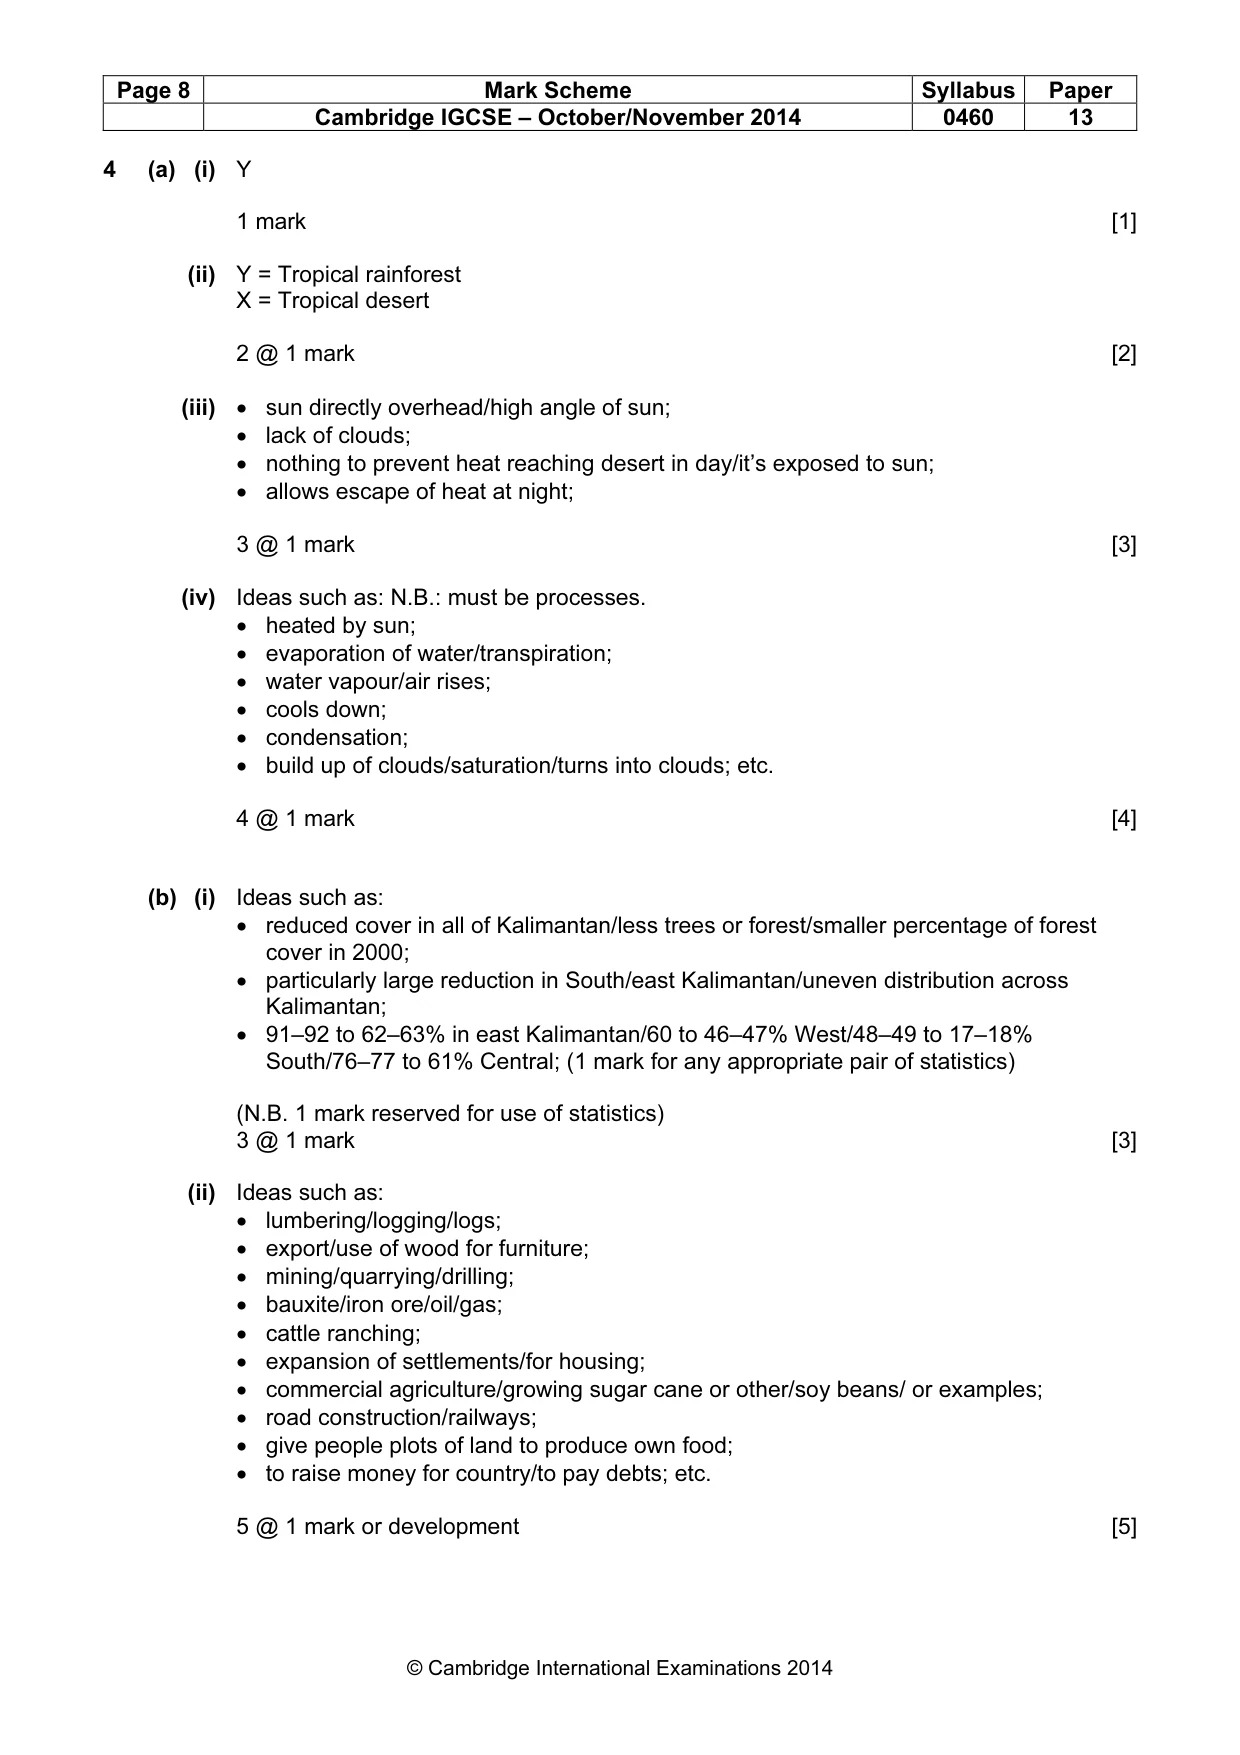
Page 8 Mark Scheme Syllabus Paper Cambridge IGCSE – October/November 2014 0460 13 © Cambridge International Examinations 2014 4 (a) (i) Y 1 mark [1] (ii) Y = Tropical rainforest X = Tropical desert 2 @ 1 mark [2] (iii) • sun directly overhead/high angle of sun; • lack of clouds; • nothing to prevent heat reaching desert in day/it’s exposed to sun; • allows escape of heat at night; 3 @ 1 mark [3] (iv) Ideas such as: N.B.: must be processes. • heated by sun; • evaporation of water/transpiration; • water vapour/air rises; • cools down; • condensation; • build up of clouds/saturation/turns into clouds; etc. 4 @ 1 mark [4] (b) (i) Ideas such as: • reduced cover in all of Kalimantan/less trees or forest/smaller percentage of forest cover in 2000; • particularly large reduction in South/east Kalimantan/uneven distribution across Kalimantan; • 91–92 to 62–63% in east Kalimantan/60 to 46–47% West/48–49 to 17–18% South/76–77 to 61% Central; (1 mark for any appropriate pair of statistics) (N.B. 1 mark reserved for use of statistics) 3 @ 1 mark [3] (ii) Ideas such as: • lumbering/logging/logs; • export/use of wood for furniture; • mining/quarrying/drilling; • bauxite/iron ore/oil/gas; • cattle ranching; • expansion of settlements/for housing; • commercial agriculture/growing sugar cane or other/soy beans/ or examples; • road construction/railways; • give people plots of land to produce own food; • to raise money for country/to pay debts; etc. 5 @ 1 mark or development [5]
Mark scheme, page 9
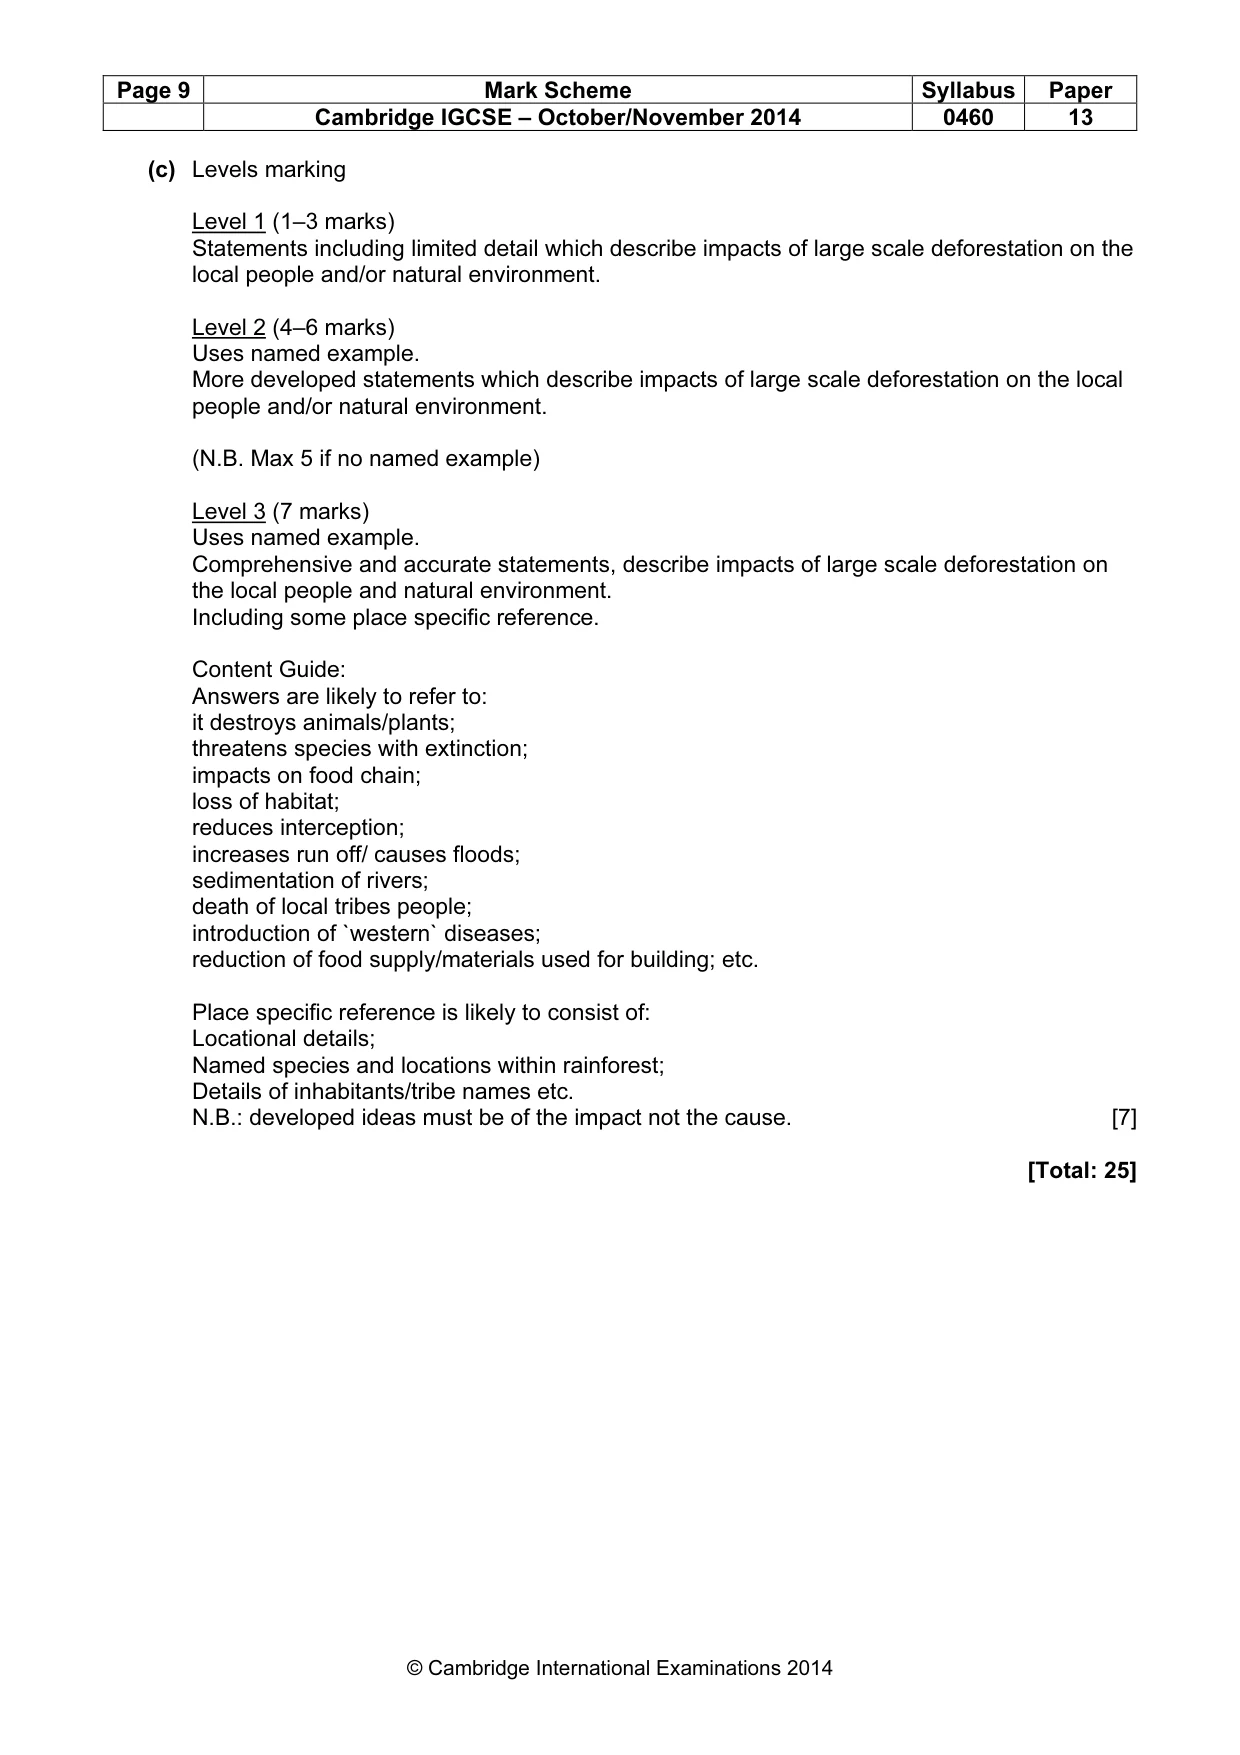
Page 9 Mark Scheme Syllabus Paper Cambridge IGCSE – October/November 2014 0460 13 © Cambridge International Examinations 2014 (c) Levels marking Level 1 (1–3 marks) Statements including limited detail which describe impacts of large scale deforestation on the local people and/or natural environment. Level 2 (4–6 marks) Uses named example. More developed statements which describe impacts of large scale deforestation on the local people and/or natural environment. (N.B. Max 5 if no named example) Level 3 (7 marks) Uses named example. Comprehensive and accurate statements, describe impacts of large scale deforestation on the local people and natural environment. Including some place specific reference. Content Guide: Answers are likely to refer to: it destroys animals/plants; threatens species with extinction; impacts on food chain; loss of habitat; reduces interception; increases run off/ causes floods; sedimentation of rivers; death of local tribes people; introduction of `western` diseases; reduction of food supply/materials used for building; etc. Place specific reference is likely to consist of: Locational details; Named species and locations within rainforest; Details of inhabitants/tribe names etc. N.B.: developed ideas must be of the impact not the cause. [7] [Total: 25]
Mark scheme, page 10
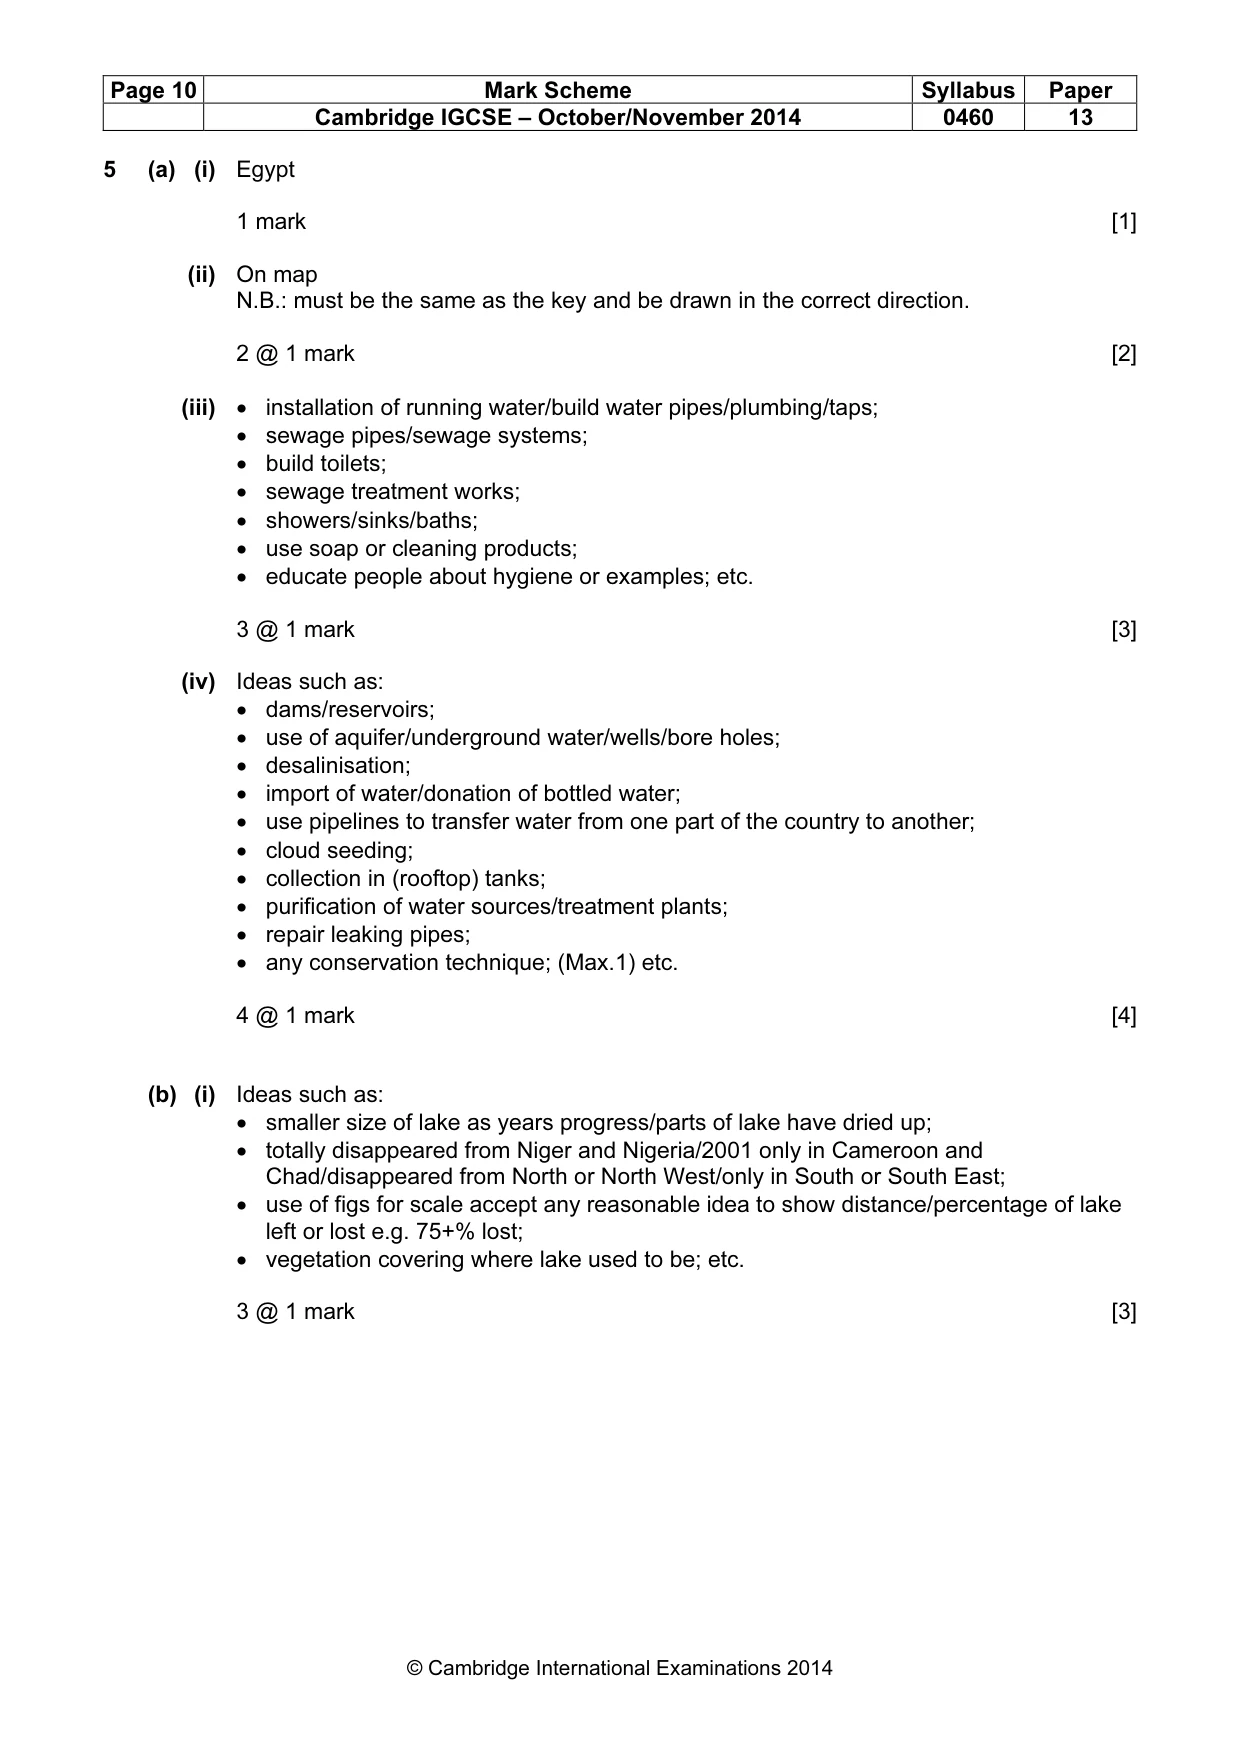
Page 10 Mark Scheme Syllabus Paper Cambridge IGCSE – October/November 2014 0460 13 © Cambridge International Examinations 2014 5 (a) (i) Egypt 1 mark [1] (ii) On map N.B.: must be the same as the key and be drawn in the correct direction. 2 @ 1 mark [2] (iii) • installation of running water/build water pipes/plumbing/taps; • sewage pipes/sewage systems; • build toilets; • sewage treatment works; • showers/sinks/baths; • use soap or cleaning products; • educate people about hygiene or examples; etc. 3 @ 1 mark [3] (iv) Ideas such as: • dams/reservoirs; • use of aquifer/underground water/wells/bore holes; • desalinisation; • import of water/donation of bottled water; • use pipelines to transfer water from one part of the country to another; • cloud seeding; • collection in (rooftop) tanks; • purification of water sources/treatment plants; • repair leaking pipes; • any conservation technique; (Max.1) etc. 4 @ 1 mark [4] (b) (i) Ideas such as: • smaller size of lake as years progress/parts of lake have dried up; • totally disappeared from Niger and Nigeria/2001 only in Cameroon and Chad/disappeared from North or North West/only in South or South East; • use of figs for scale accept any reasonable idea to show distance/percentage of lake left or lost e.g. 75+% lost; • vegetation covering where lake used to be; etc. 3 @ 1 mark [3]
Mark scheme, page 11
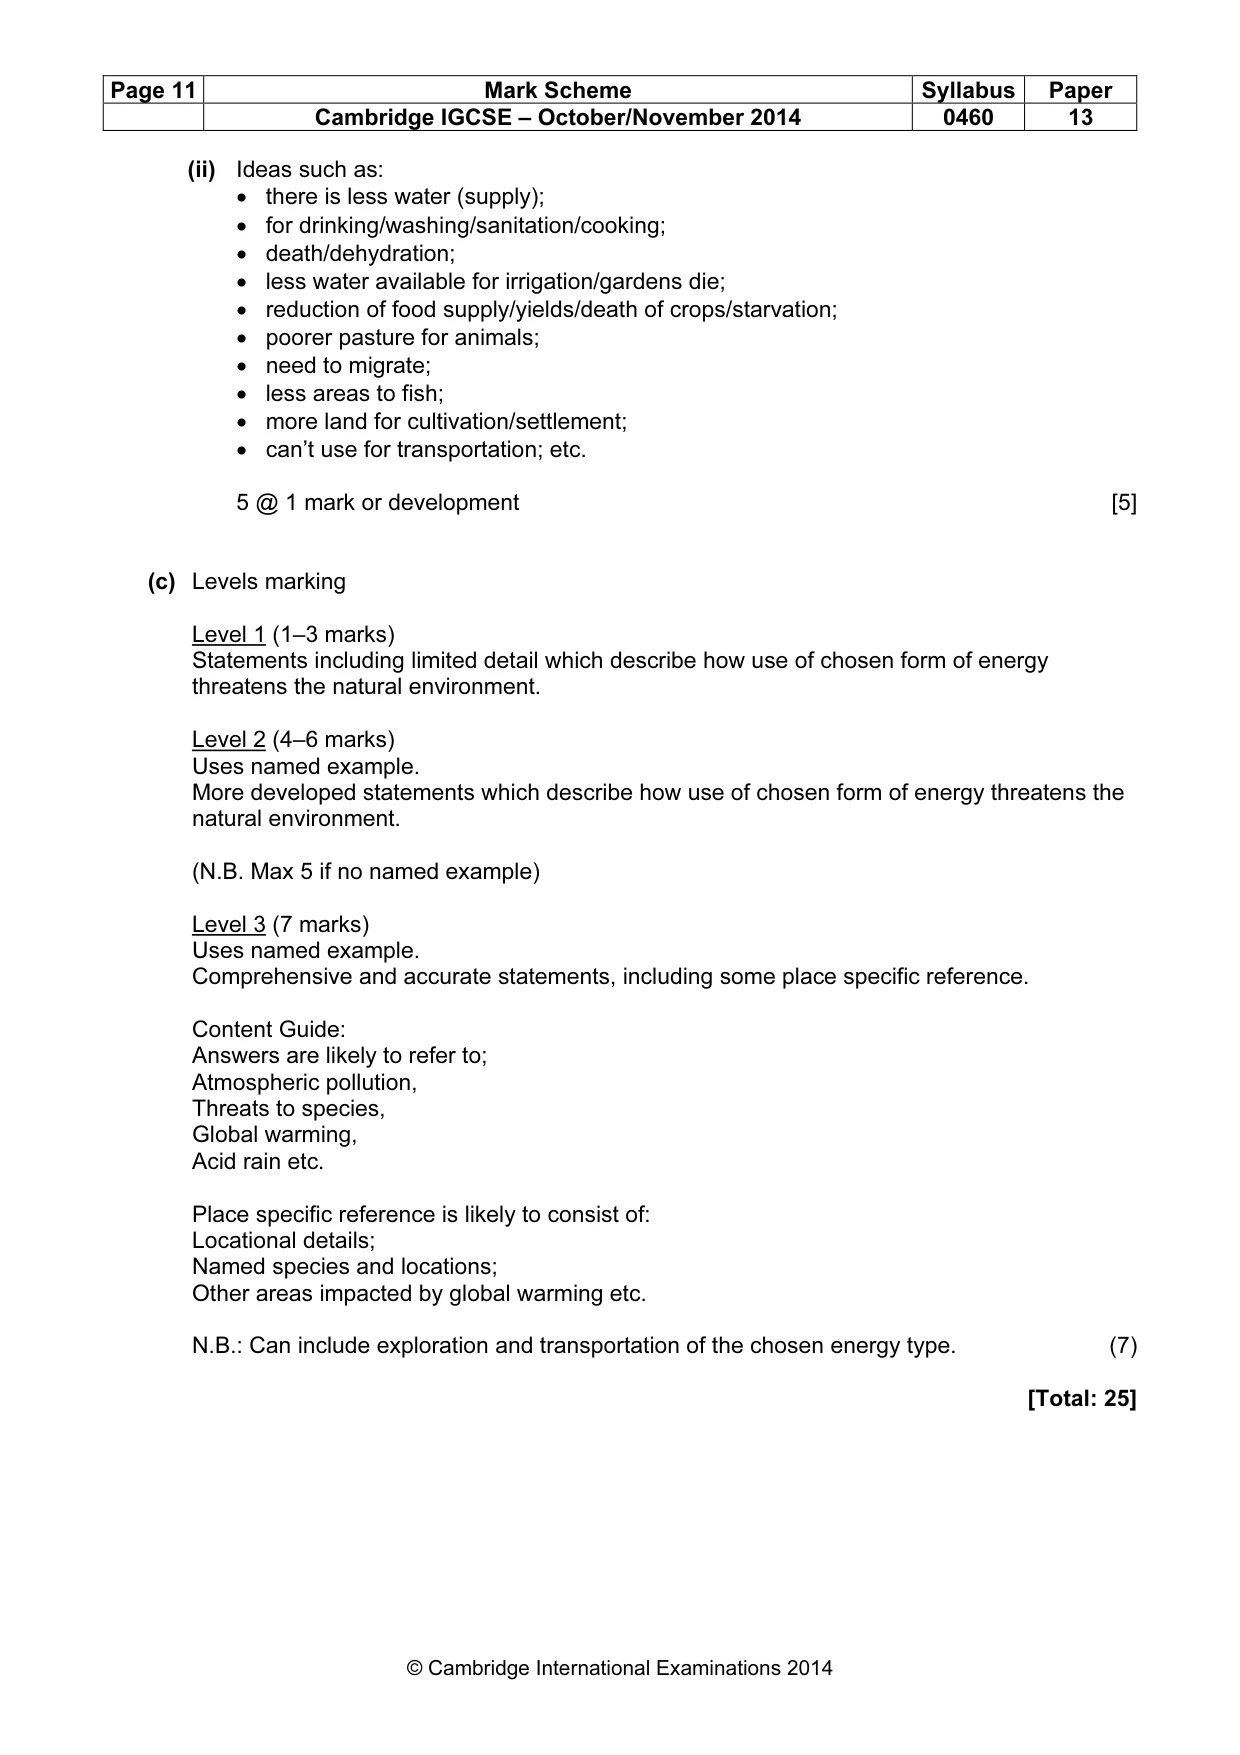
Page 11 Mark Scheme Syllabus Paper Cambridge IGCSE – October/November 2014 0460 13 © Cambridge International Examinations 2014 (ii) Ideas such as: • there is less water (supply); • for drinking/washing/sanitation/cooking; • death/dehydration; • less water available for irrigation/gardens die; • reduction of food supply/yields/death of crops/starvation; • poorer pasture for animals; • need to migrate; • less areas to fish; • more land for cultivation/settlement; • can’t use for transportation; etc. 5 @ 1 mark or development [5] (c) Levels marking Level 1 (1–3 marks) Statements including limited detail which describe how use of chosen form of energy threatens the natural environment. Level 2 (4–6 marks) Uses named example. More developed statements which describe how use of chosen form of energy threatens the natural environment. (N.B. Max 5 if no named example) Level 3 (7 marks) Uses named example. Comprehensive and accurate statements, including some place specific reference. Content Guide: Answers are likely to refer to; Atmospheric pollution, Threats to species, Global warming, Acid rain etc. Place specific reference is likely to consist of: Locational details; Named species and locations; Other areas impacted by global warming etc. N.B.: Can include exploration and transportation of the chosen energy type. (7) [Total: 25]
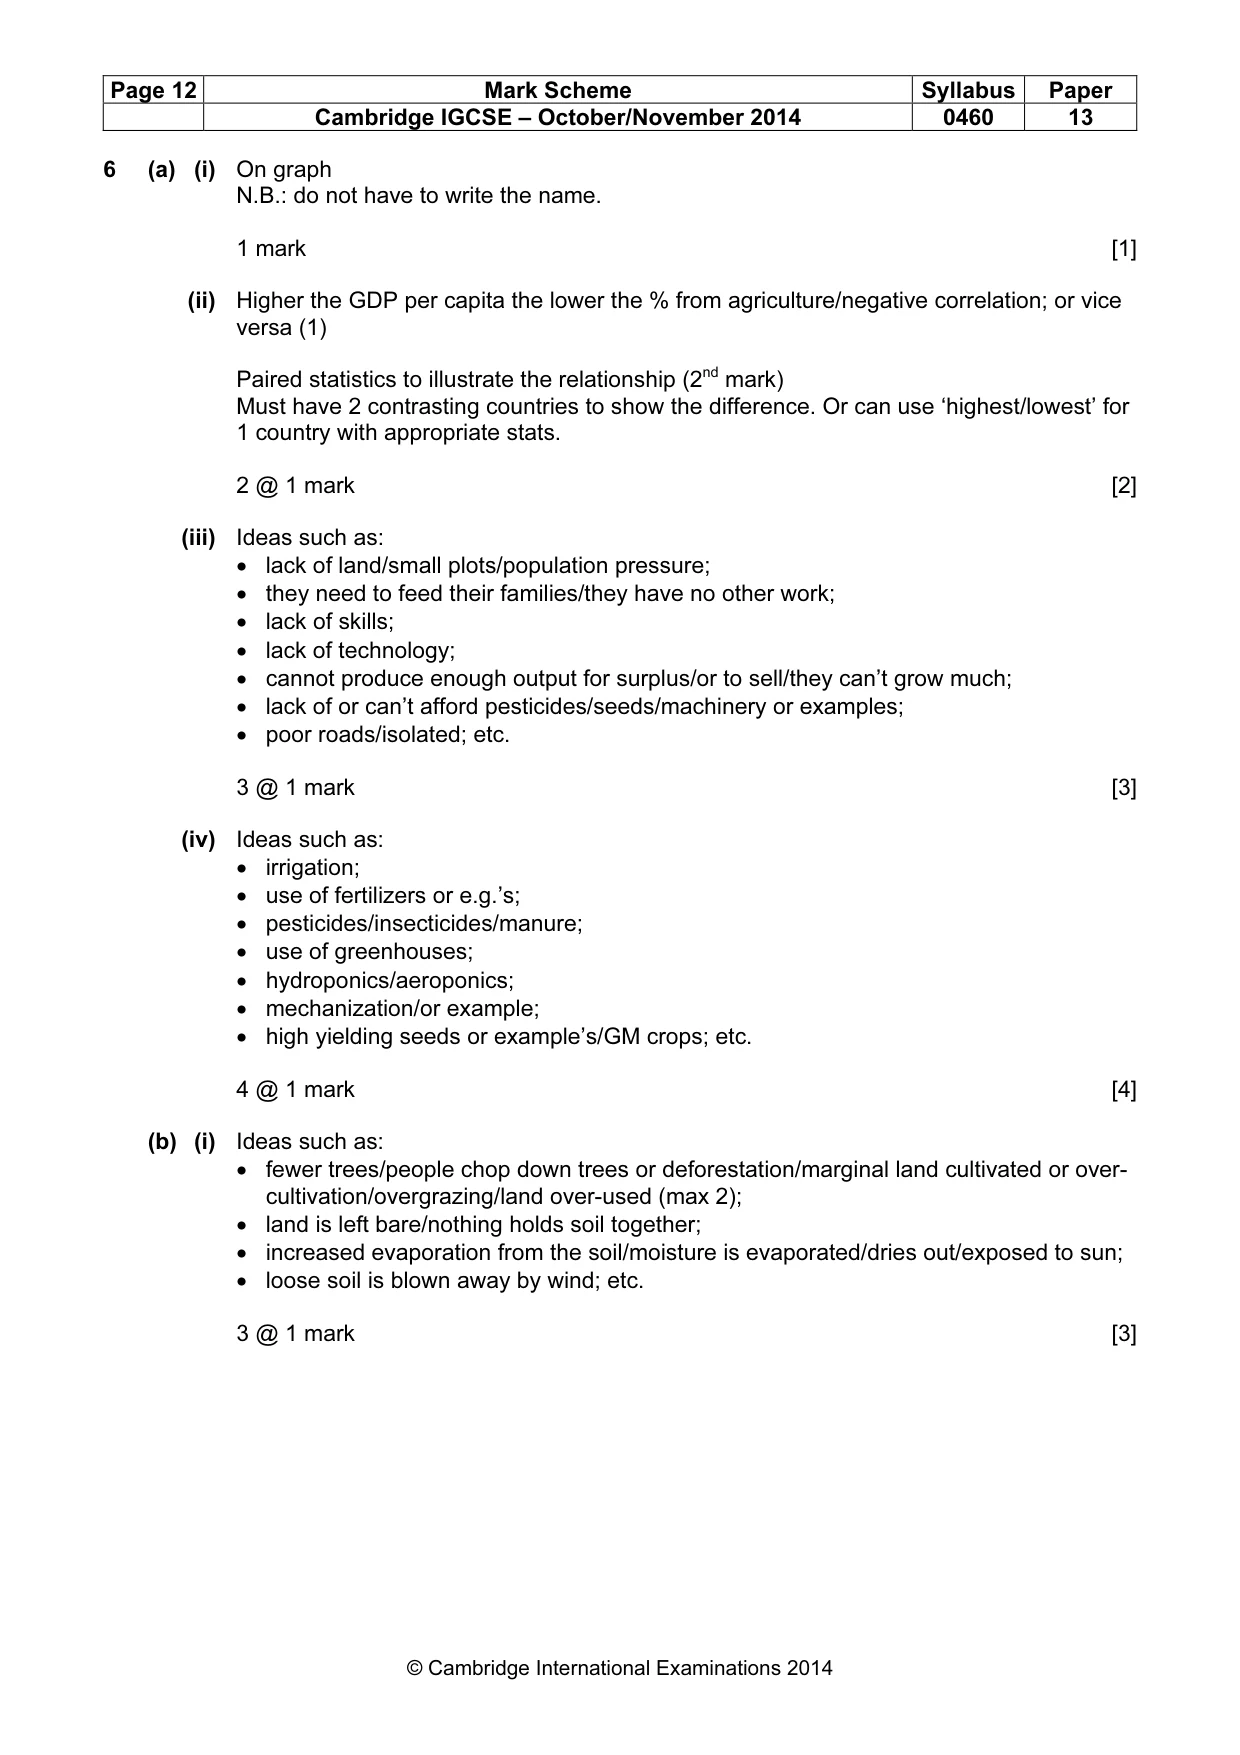
Mark scheme, page 12
Page 12 Mark Scheme Syllabus Paper Cambridge IGCSE – October/November 2014 0460 13 © Cambridge International Examinations 2014 6 (a) (i) On graph N.B.: do not have to write the name. 1 mark [1] (ii) Higher the GDP per capita the lower the % from agriculture/negative correlation; or vice versa (1) Paired statistics to illustrate the relationship (2nd mark) Must have 2 contrasting countries to show the difference. Or can use ‘highest/lowest’ for 1 country with appropriate stats. 2 @ 1 mark [2] (iii) Ideas such as: • lack of land/small plots/population pressure; • they need to feed their families/they have no other work; • lack of skills; • lack of technology; • cannot produce enough output for surplus/or to sell/they can’t grow much; • lack of or can’t afford pesticides/seeds/machinery or examples; • poor roads/isolated; etc. 3 @ 1 mark [3] (iv) Ideas such as: • irrigation; • use of fertilizers or e.g.’s; • pesticides/insecticides/manure; • use of greenhouses; • hydroponics/aeroponics; • mechanization/or example; • high yielding seeds or example’s/GM crops; etc. 4 @ 1 mark [4] (b) (i) Ideas such as: • fewer trees/people chop down trees or deforestation/marginal land cultivated or over- cultivation/overgrazing/land over-used (max 2); • land is left bare/nothing holds soil together; • increased evaporation from the soil/moisture is evaporated/dries out/exposed to sun; • loose soil is blown away by wind; etc. 3 @ 1 mark [3]
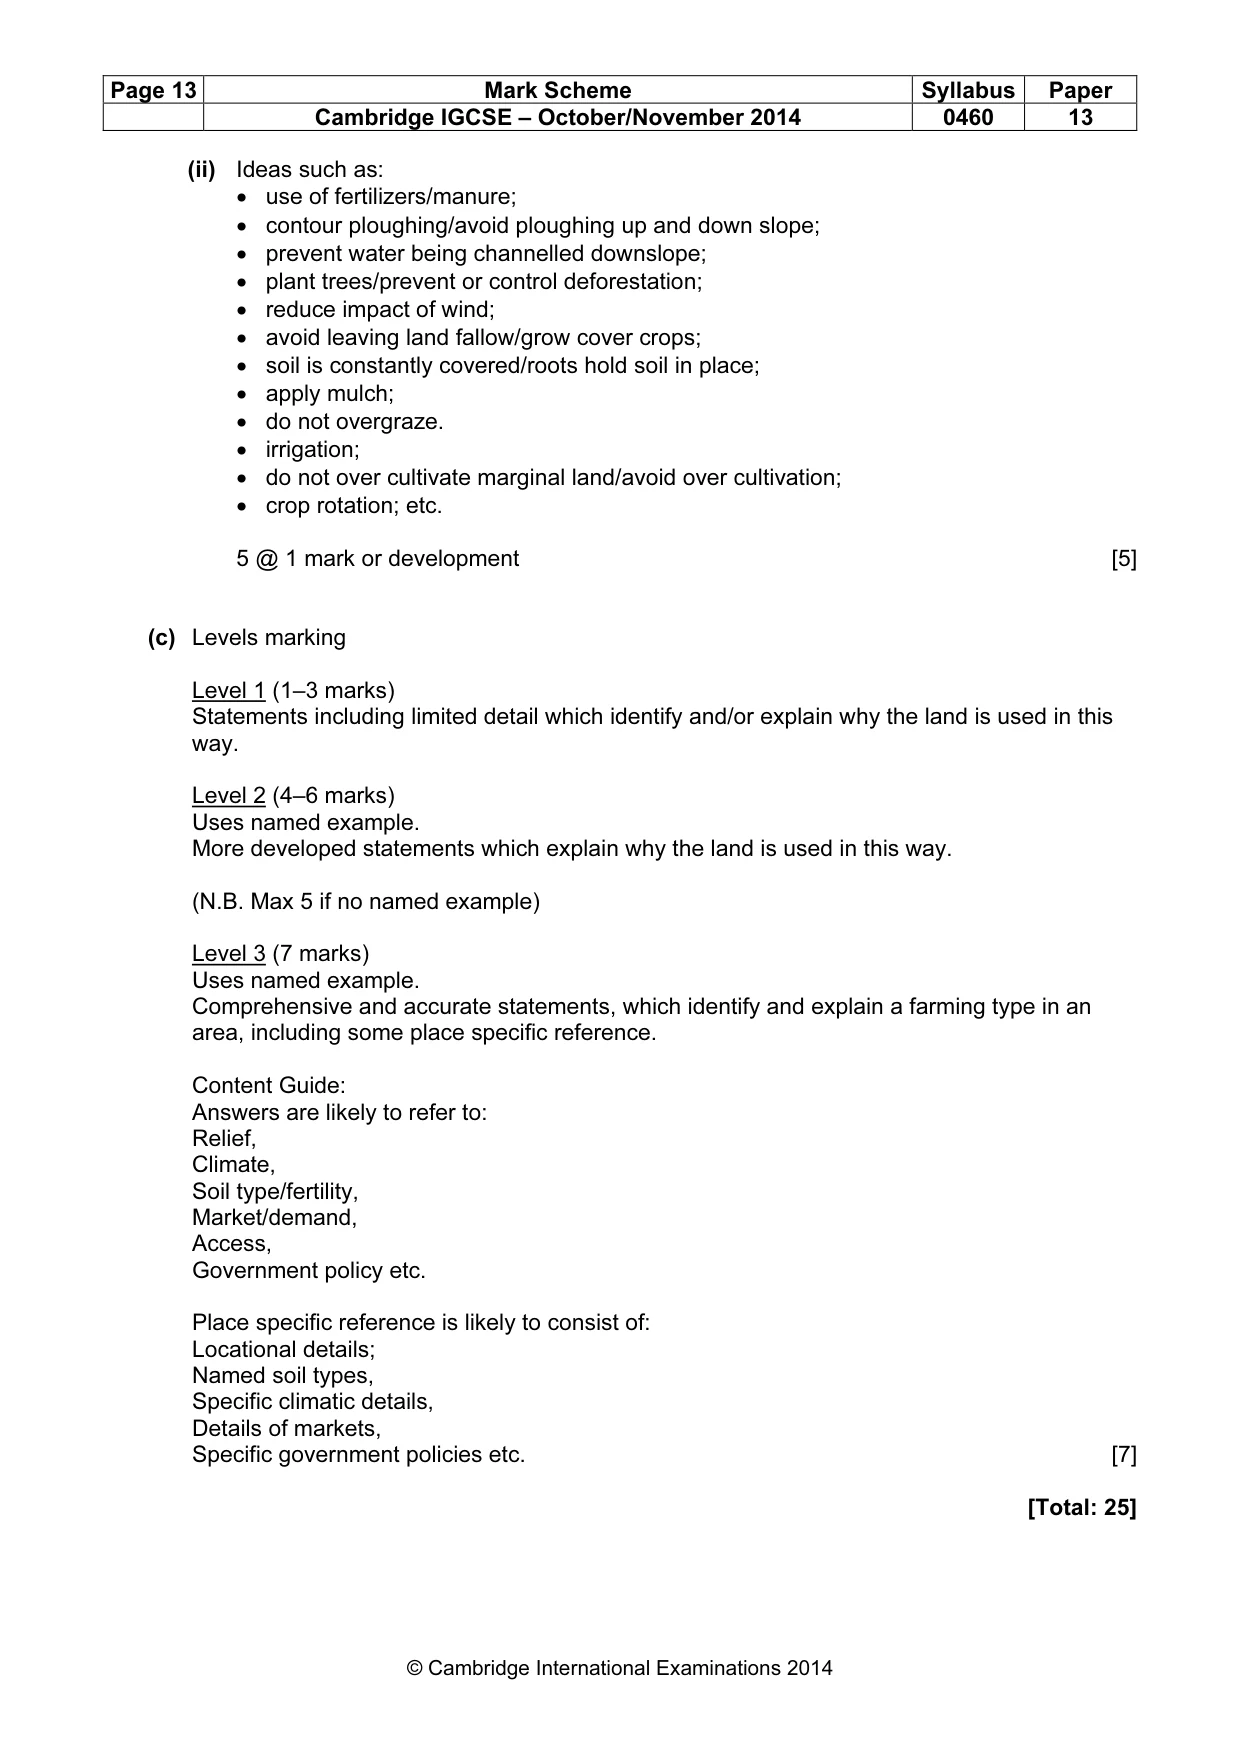
Mark scheme, page 13
Page 13 Mark Scheme Syllabus Paper Cambridge IGCSE – October/November 2014 0460 13 © Cambridge International Examinations 2014 (ii) Ideas such as: • use of fertilizers/manure; • contour ploughing/avoid ploughing up and down slope; • prevent water being channelled downslope; • plant trees/prevent or control deforestation; • reduce impact of wind; • avoid leaving land fallow/grow cover crops; • soil is constantly covered/roots hold soil in place; • apply mulch; • do not overgraze. • irrigation; • do not over cultivate marginal land/avoid over cultivation; • crop rotation; etc. 5 @ 1 mark or development [5] (c) Levels marking Level 1 (1–3 marks) Statements including limited detail which identify and/or explain why the land is used in this way. Level 2 (4–6 marks) Uses named example. More developed statements which explain why the land is used in this way. (N.B. Max 5 if no named example) Level 3 (7 marks) Uses named example. Comprehensive and accurate statements, which identify and explain a farming type in an area, including some place specific reference. Content Guide: Answers are likely to refer to: Relief, Climate, Soil type/fertility, Market/demand, Access, Government policy etc. Place specific reference is likely to consist of: Locational details; Named soil types, Specific climatic details, Details of markets, Specific government policies etc. [7] [Total: 25]
What you needed in this session
Cambridge’s own grade thresholds for 2014 Oct/Nov, Paper 1 · Variant 3. A higher threshold means an easier paper — the bar moves with how the cohort did.