Cambridge IGCSE Geography 0460 — 2014 Oct/Nov Paper 1 · Variant 2
0460/12/O/N/14 · 75 marks · ≈84 min
The question paper and its mark scheme, free to read here and free to download. This is Cambridge’s own paper, exactly as it was sat.
Question paper28 pages
Mark scheme18 pages
Answers below. Sit the paper first if you are practising.
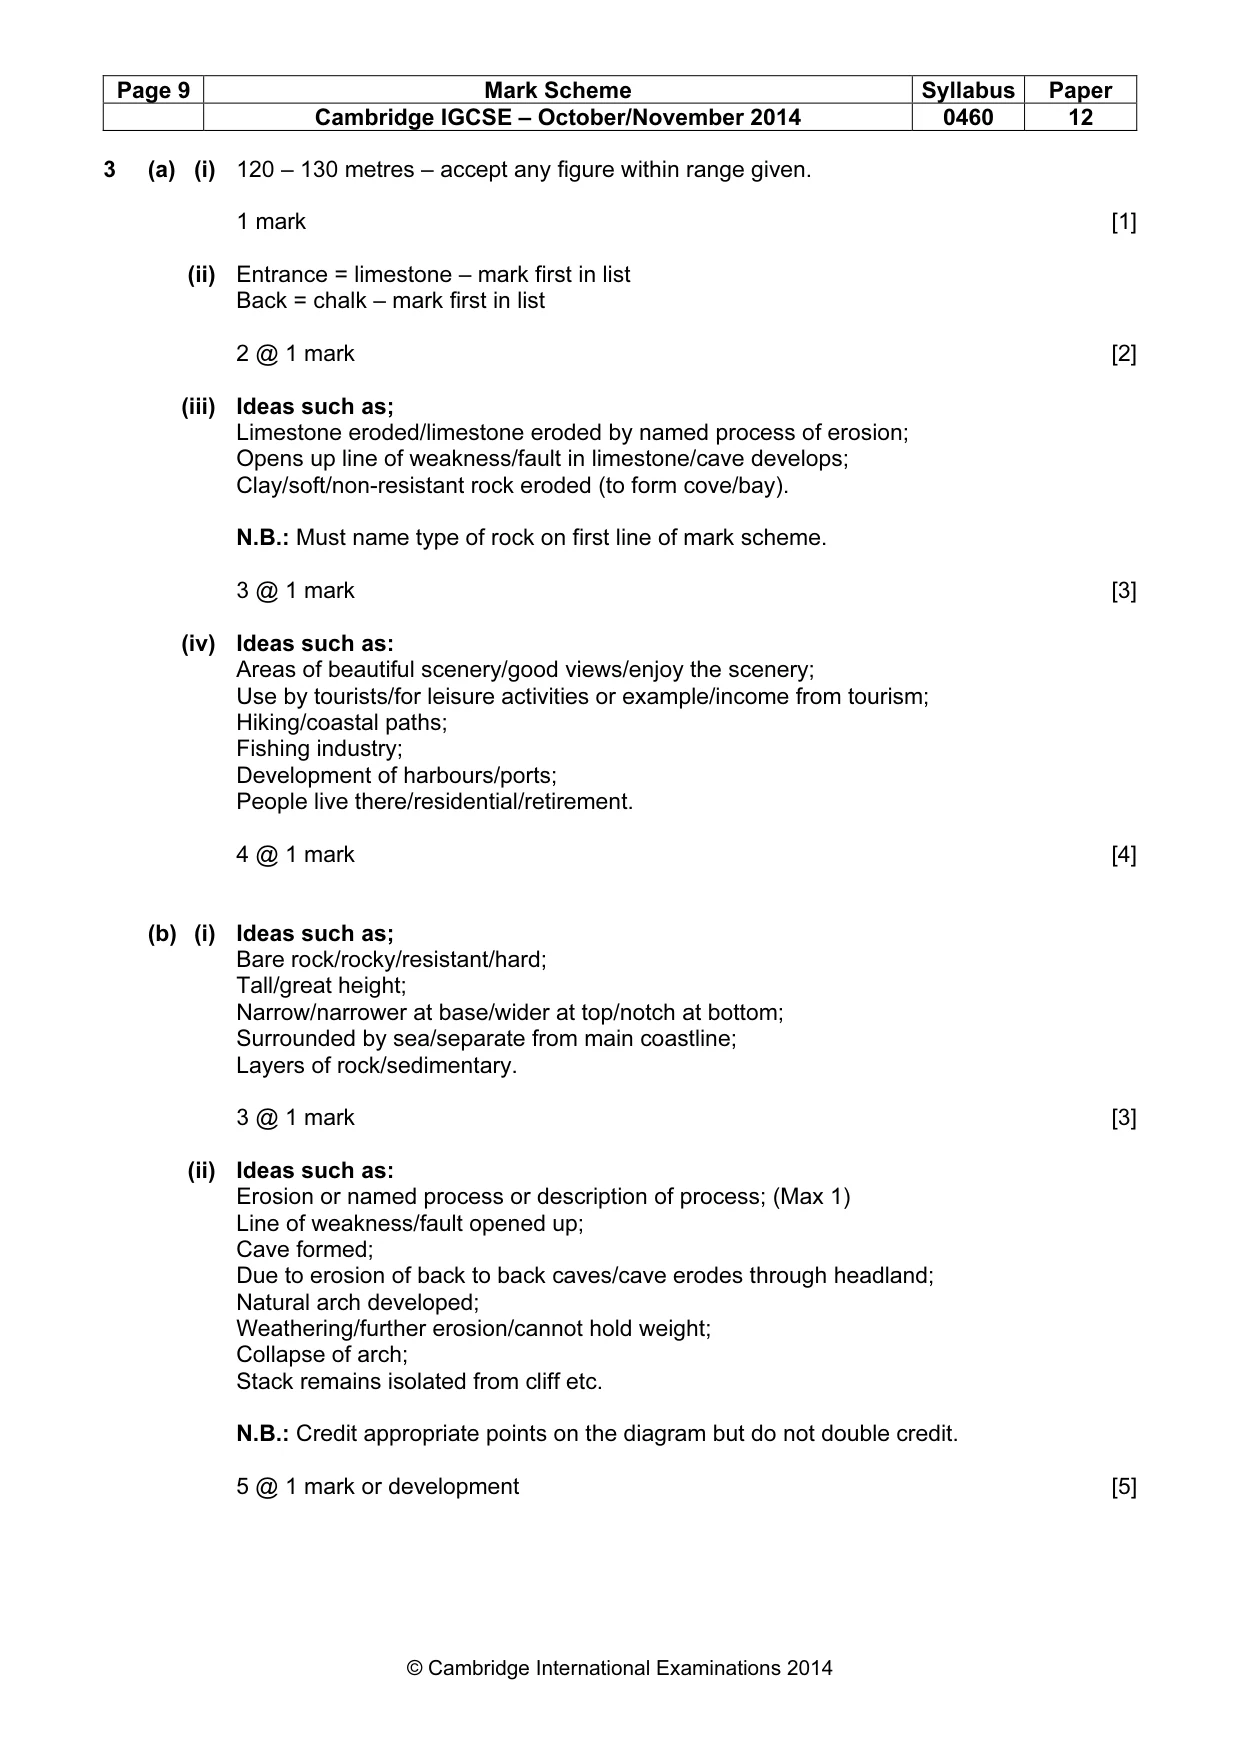
Paper as text
Question paper, page 1
This document consists of 28 printed pages and 1 Insert. DC (ST/SW) 108423 © UCLES 2014 [Turn over * 9 1 7 9 4 4 8 3 1 7 * GEOGRAPHY 0460/12 Paper 1 October/November 2014 1 hour 45 minutes Candidates answer on the Question Paper. Additional Materials: Ruler Protractor Calculator READ THESE INSTRUCTIONS FIRST Write your Centre number, candidate number and name in the spaces provided. Write in dark blue or black pen. You may use an HB pencil for any diagrams or graphs. Do not use staples, paper clips, glue or correction fluid. DO NOT WRITE IN ANY BARCODES. Write your answer to each question in the space provided. If additional space is required, you should use the lined page at the end of this booklet. The question number(s) must be clearly shown. Answer three questions. The Insert contains Photographs A, B, C and D for Question 2, Photographs E and F for Question 3, and Photograph G for Question 4. The Insert is not required by the Examiner. Sketch maps and diagrams should be drawn whenever they serve to illustrate an answer. At the end of the examination, fasten all your work securely together. The number of marks is given in brackets [ ] at the end of each question or part question. Cambridge International Examinations Cambridge International General Certificate of Secondary Education The syllabus is approved for use in England, Wales and Northern Ireland as a Cambridge International Level 1/Level 2 Certificate.
Question paper, page 2
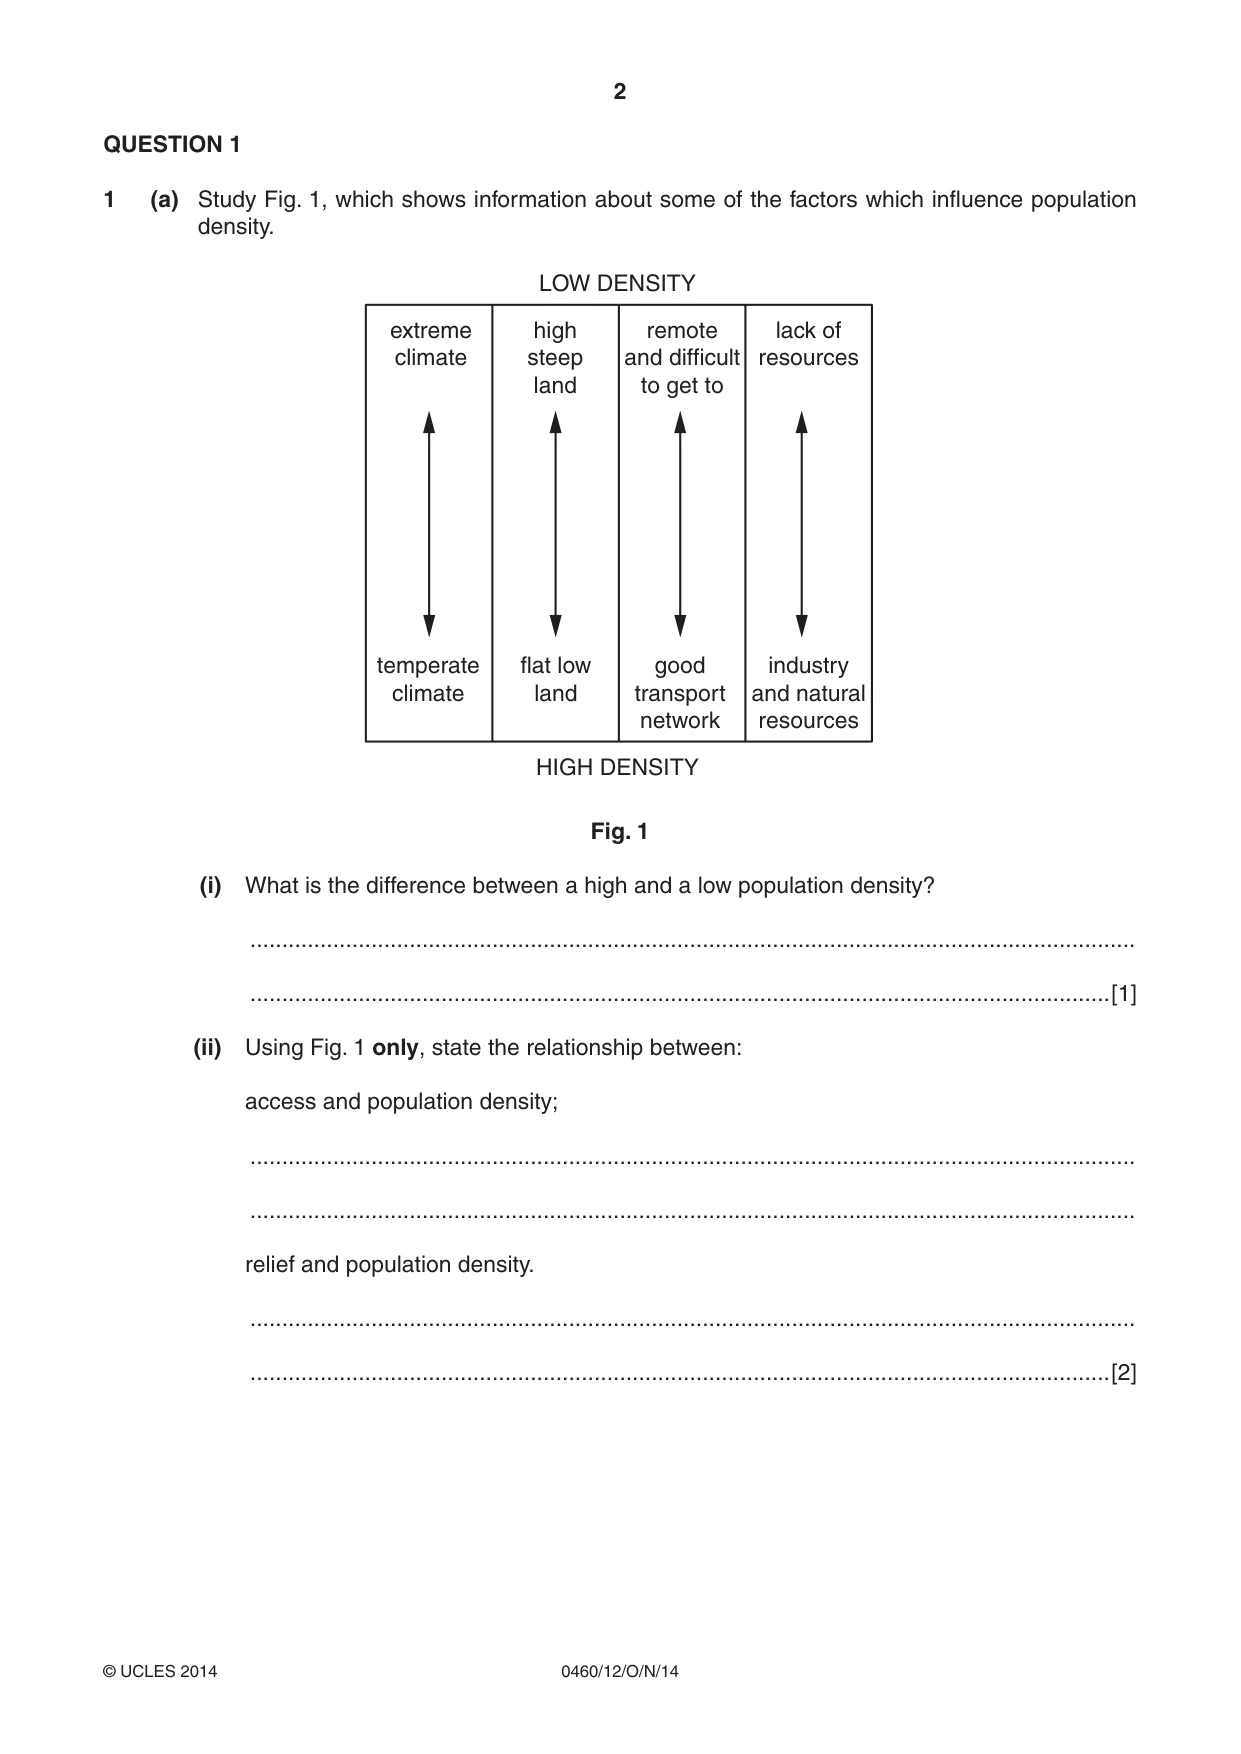
2 0460/12/O/N/14 © UCLES 2014 QUESTION 1 1 (a) Study Fig. 1, which shows information about some of the factors which influence population density. extreme climate high steep land remote and difficult to get to lack of resources temperate climate flat low land good transport network LOW DENSITY HIGH DENSITY industry and natural resources Fig. 1 (i) What is the difference between a high and a low population density? … …[1] (ii) Using Fig. 1 only, state the relationship between: access and population density; … … relief and population density. … …[2]
Question paper, page 3
3 0460/12/O/N/14 © UCLES 2014 [Turn over (iii) Explain how variations in climate can influence population density. … … … … … …[3] (iv) Explain how industry and natural resources can lead to a high population density in an area. … … … … … … … …[4]
Question paper, page 4
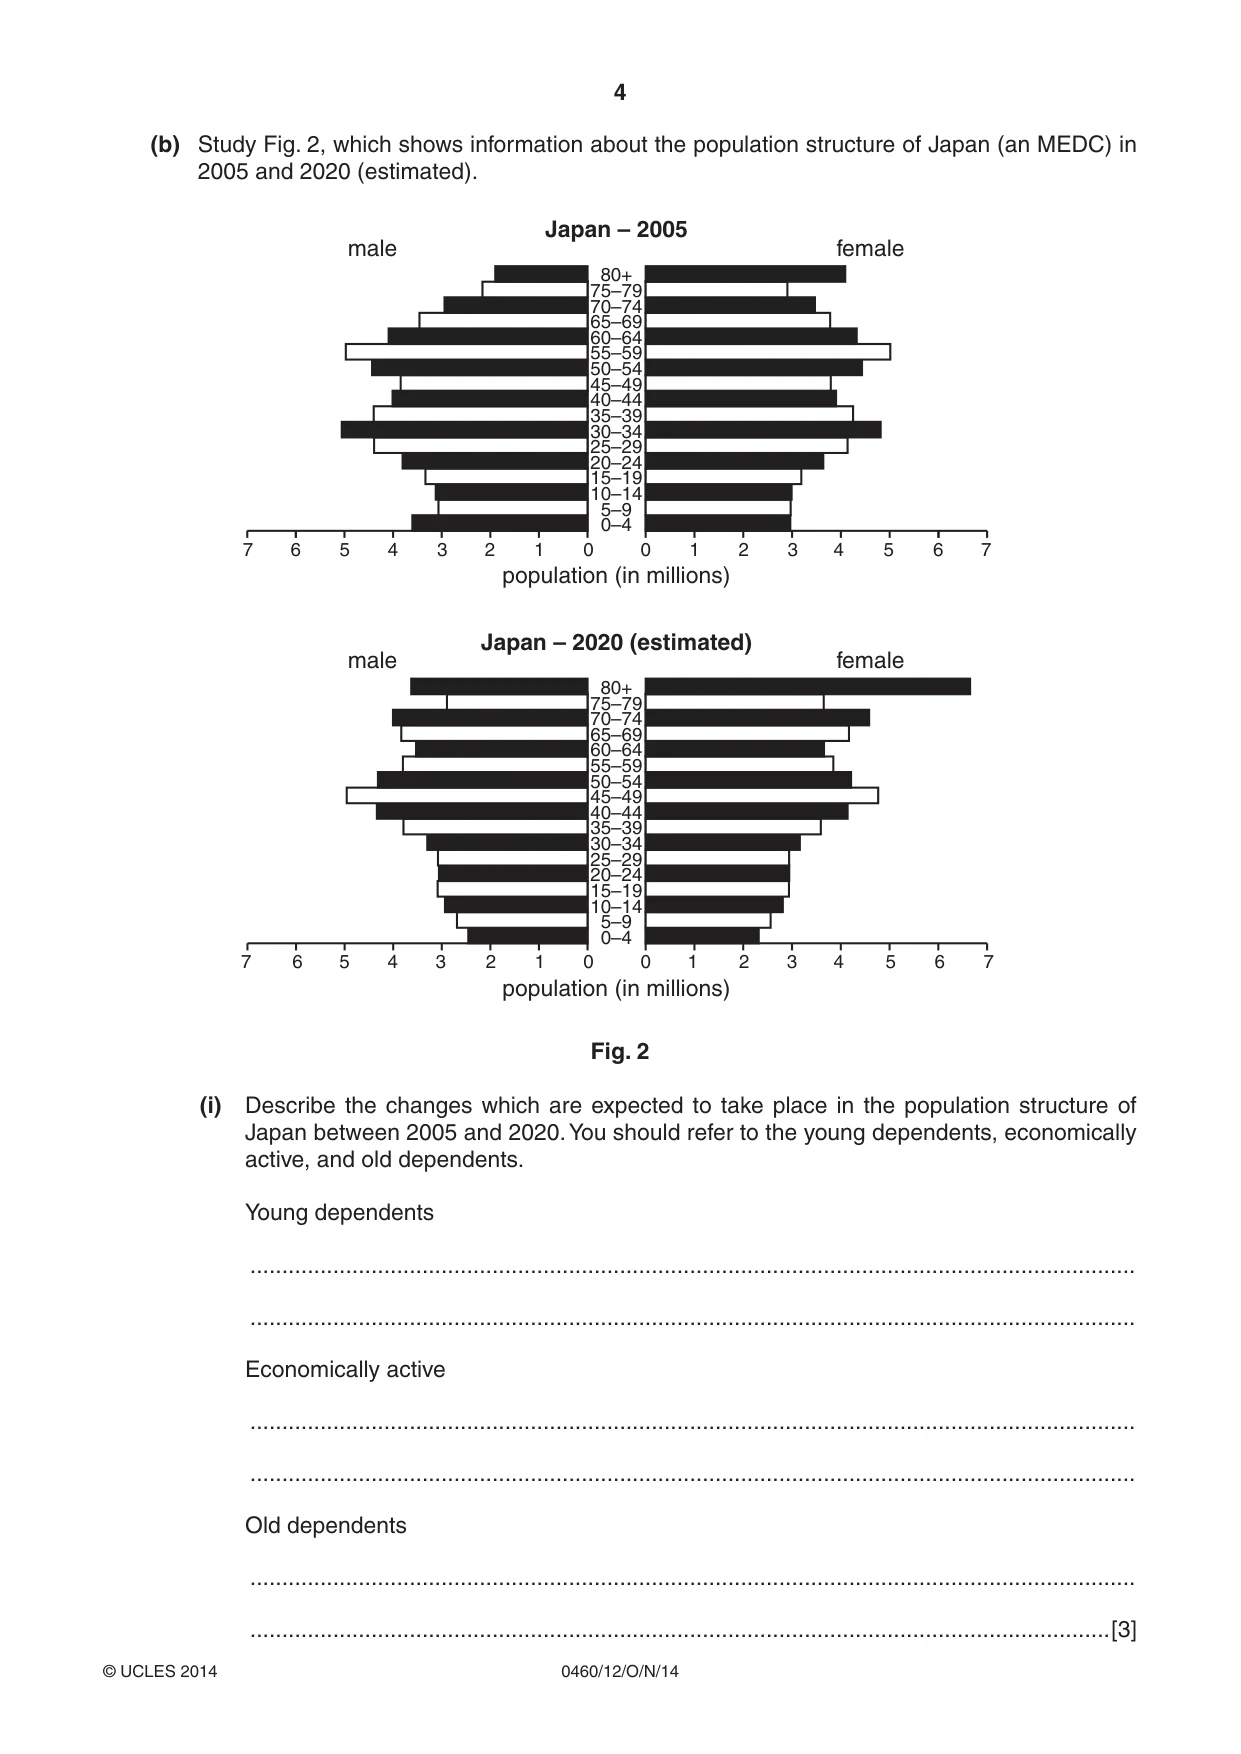
4 0460/12/O/N/14 © UCLES 2014 (b) Study Fig. 2, which shows information about the population structure of Japan (an MEDC) in 2005 and 2020 (estimated). 80+ 75–79 70–74 65–69 60–64 55–59 50–54 45–49 40–44 35–39 30–34 25–29 20–24 15–19 10–14 5–9 0–4 population (in millions) Japan – 2005 male female 5 5 6 7 6 7 4 4 3 3 2 2 1 1 0 0 80+ 75–79 70–74 65–69 60–64 55–59 50–54 45–49 40–44 35–39 30–34 25–29 20–24 15–19 10–14 5–9 0–4 population (in millions) Japan – 2020 (estimated) male female 5 5 6 7 6 7 4 4 3 3 2 2 1 1 0 0 Fig. 2 (i) Describe the changes which are expected to take place in the population structure of Japan between 2005 and 2020. You should refer to the young dependents, economically active, and old dependents. Young dependents … … Economically active … … Old dependents … …[3]
Question paper, page 5
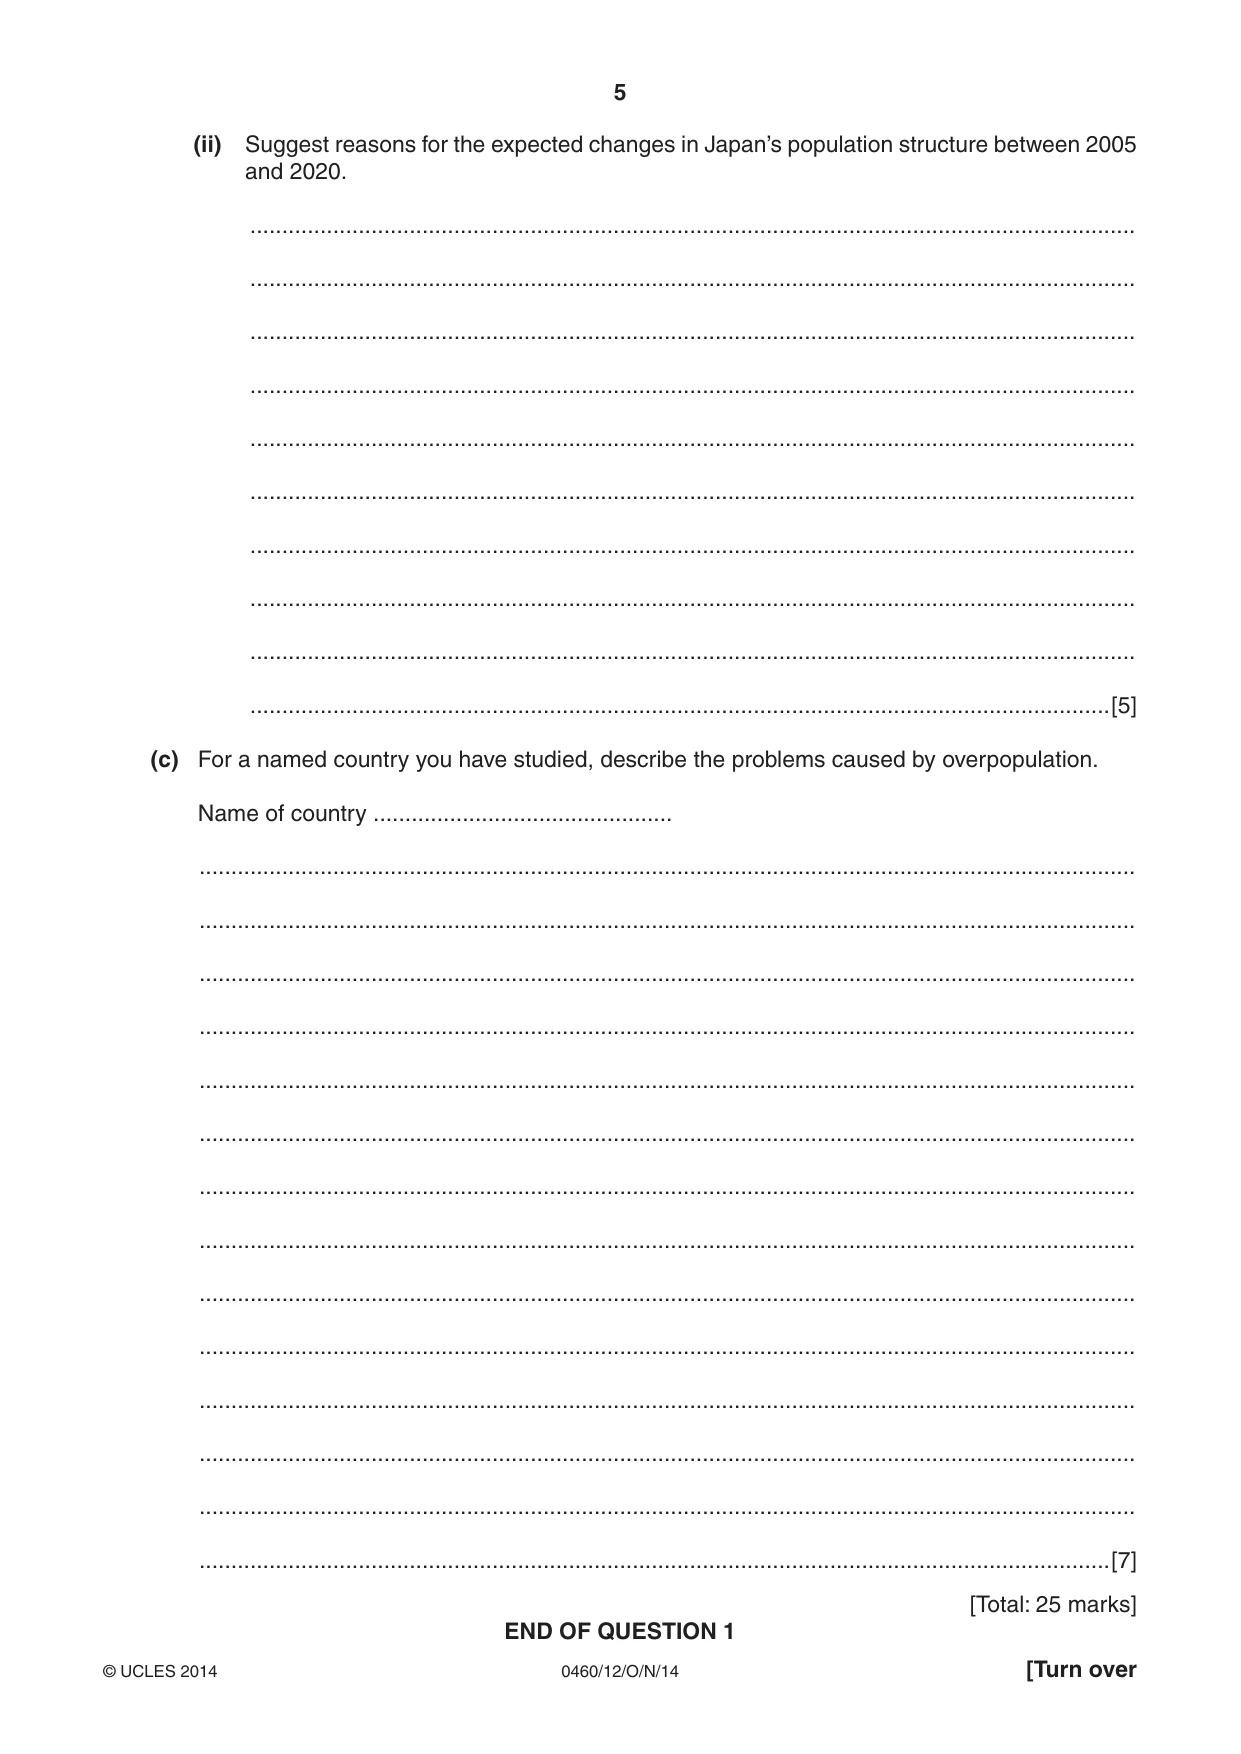
5 0460/12/O/N/14 © UCLES 2014 [Turn over (ii) Suggest reasons for the expected changes in Japan’s population structure between 2005 and 2020. … … … … … … … … … …[5] (c) For a named country you have studied, describe the problems caused by overpopulation. Name of country … … … … … … … … … … … … … … …[7] [Total: 25 marks] END OF QUESTION 1
Question paper, page 6
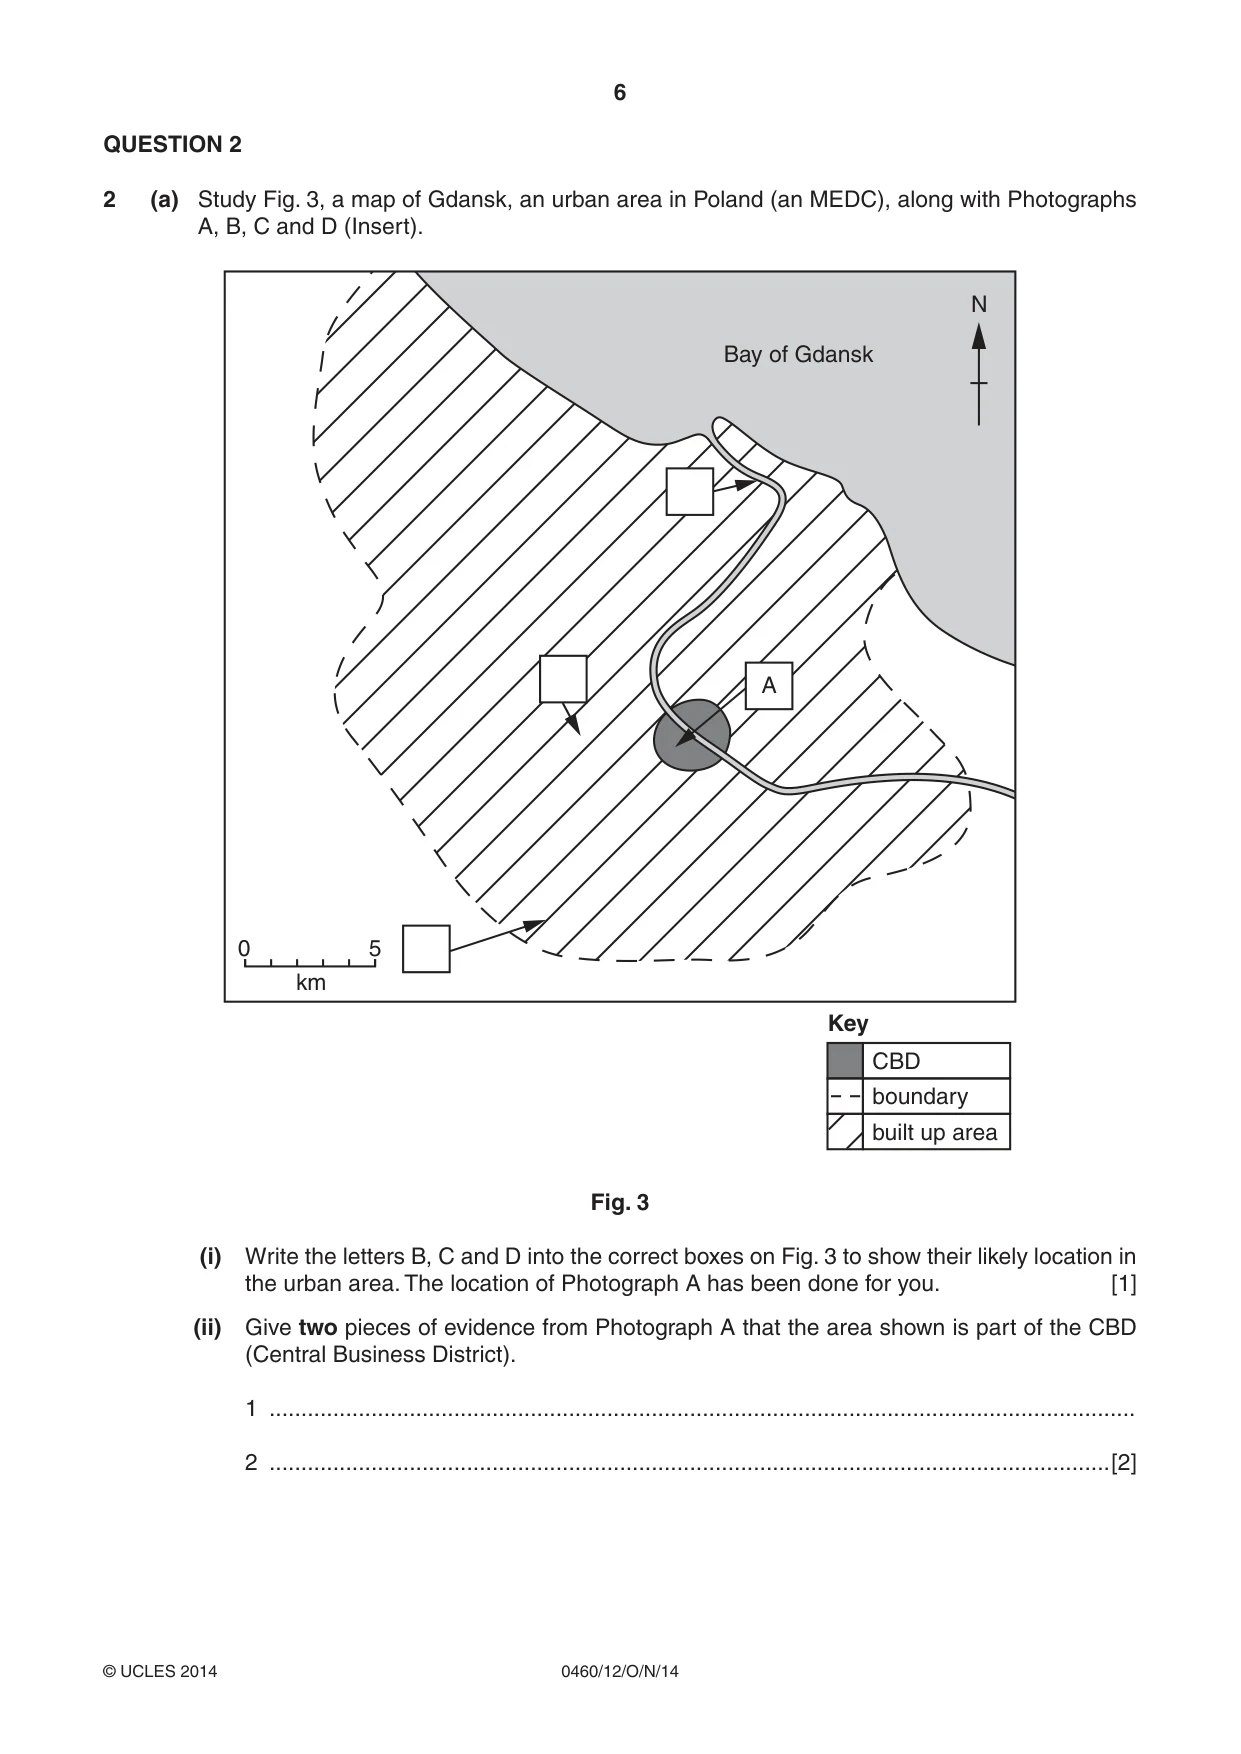
6 0460/12/O/N/14 © UCLES 2014 QUESTION 2 2 (a) Study Fig. 3, a map of Gdansk, an urban area in Poland (an MEDC), along with Photographs A, B, C and D (Insert). Bay of Gdansk 0 5 km A CBD boundary built up area Key N Fig. 3 (i) Write the letters B, C and D into the correct boxes on Fig. 3 to show their likely location in the urban area. The location of Photograph A has been done for you. [1] (ii) Give two pieces of evidence from Photograph A that the area shown is part of the CBD (Central Business District). 1 … 2 …[2]
Question paper, page 7
7 0460/12/O/N/14 © UCLES 2014 [Turn over (iii) Describe the causes of traffic congestion in the CBDs of major urban areas. … … … … … …[3] (iv) Explain how the problems of traffic congestion in cities can be solved. … … … … … … … …[4]
Question paper, page 8
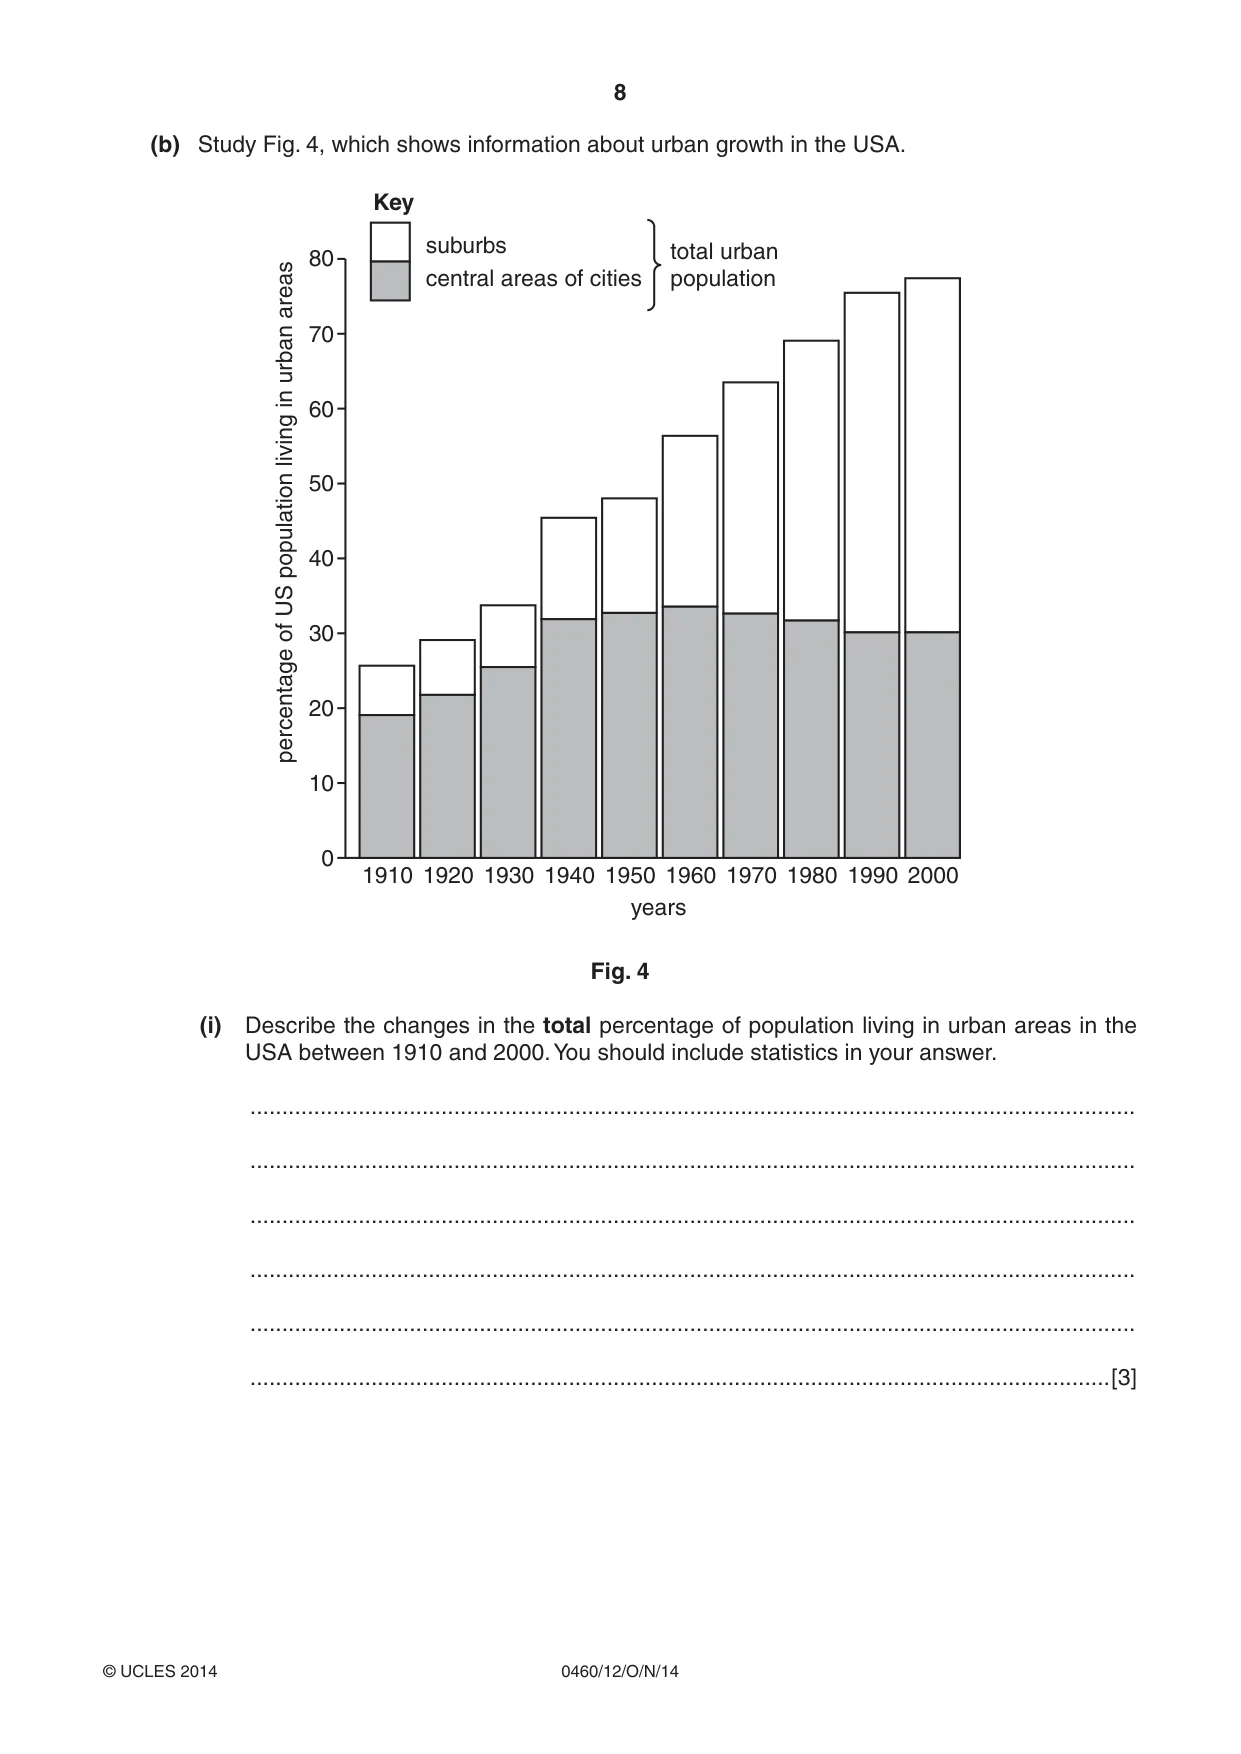
8 0460/12/O/N/14 © UCLES 2014 (b) Study Fig. 4, which shows information about urban growth in the USA. 0 10 20 30 40 50 60 percentage of US population living in urban areas 70 80 1910 1920 1930 1940 1950 years 1960 1970 1980 1990 2000 suburbs central areas of cities Key total urban population Fig. 4 (i) Describe the changes in the total percentage of population living in urban areas in the USA between 1910 and 2000. You should include statistics in your answer. … … … … … …[3]
Question paper, page 9
9 0460/12/O/N/14 © UCLES 2014 [Turn over (ii) Suggest why the percentage of the urban population living in the suburbs of cities in the USA has increased rapidly since 1910. … … … … … … … … … …[5]
Question paper, page 10
10 0460/12/O/N/14 © UCLES 2014 (c) For a named example of a town or city you have studied, describe the impacts of urban sprawl on the natural environment. Name of town or city … … … … … … … … … … … … … … … …[7] [Total: 25 marks] END OF QUESTION 2
Question paper, page 11
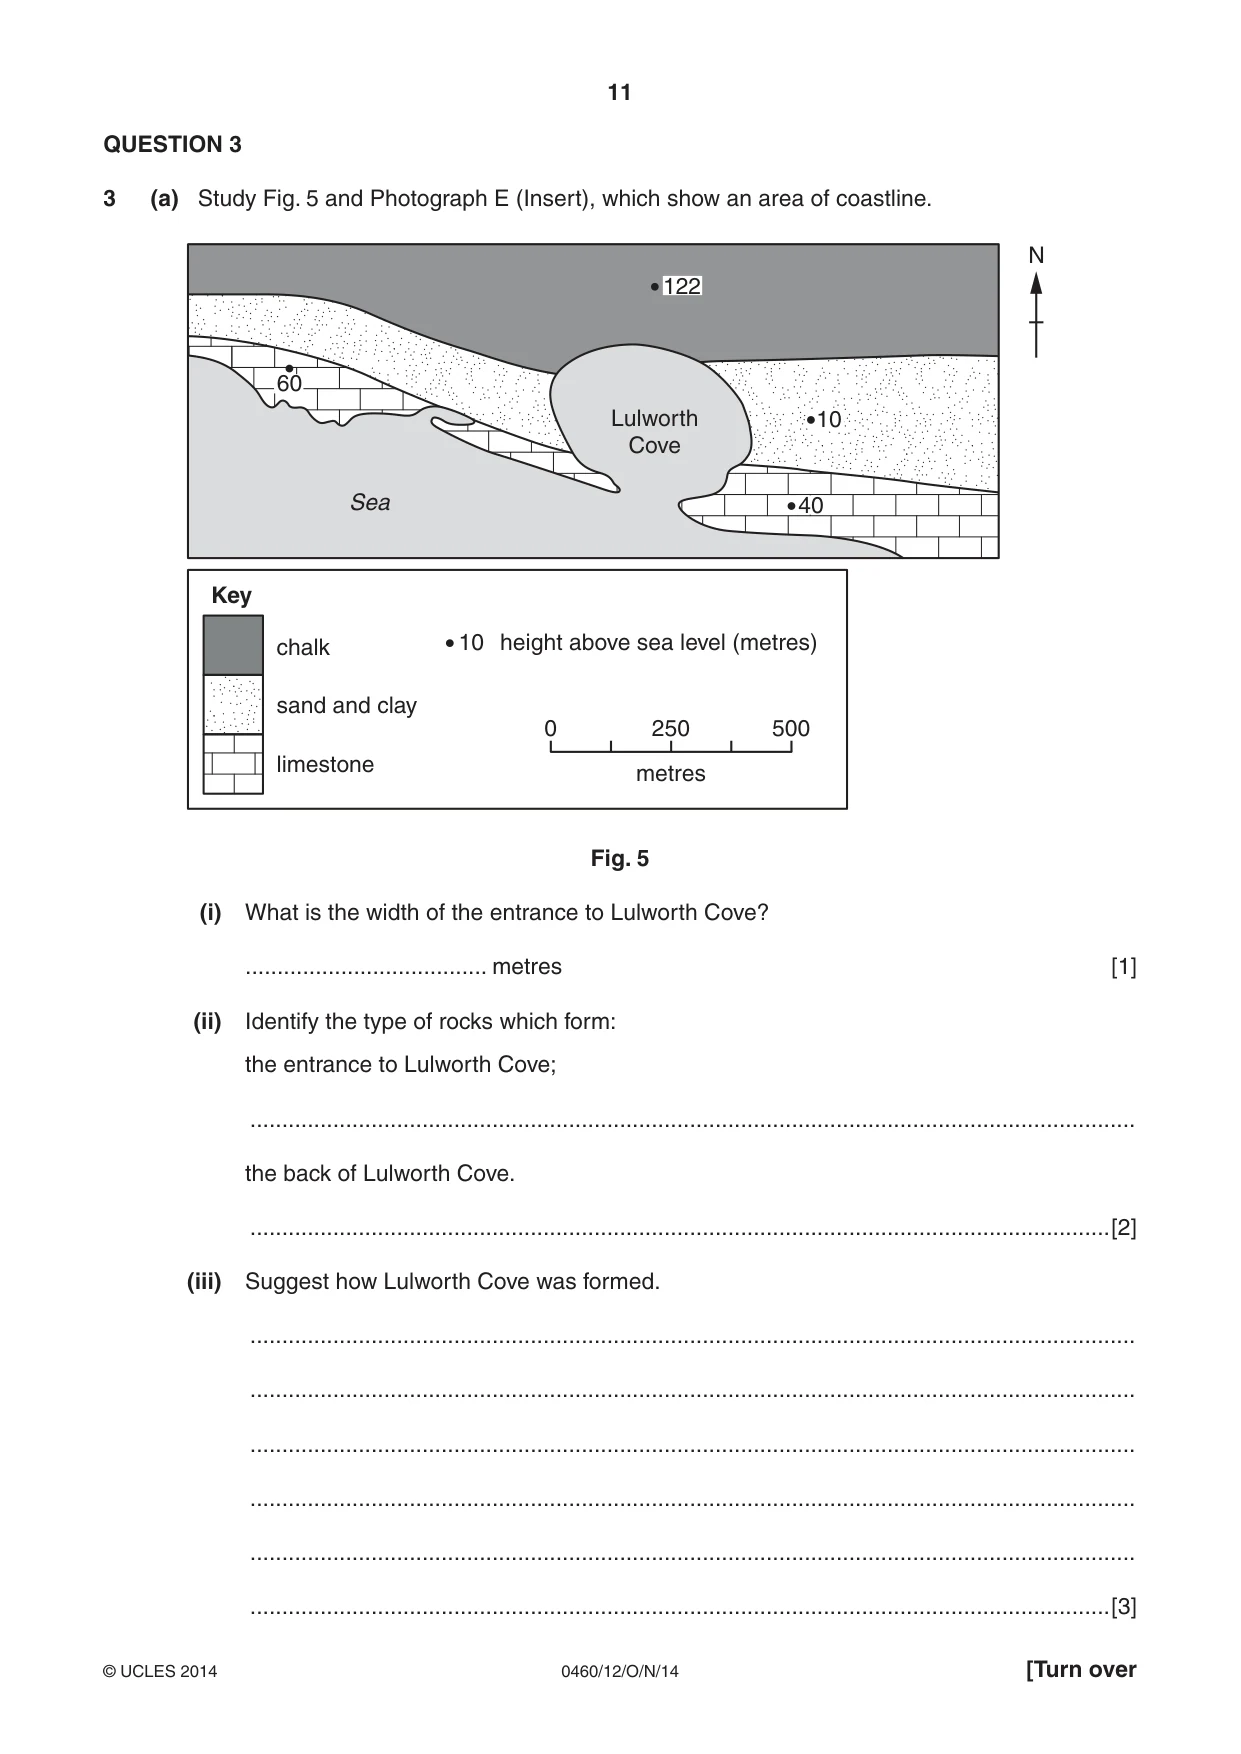
11 0460/12/O/N/14 © UCLES 2014 [Turn over QUESTION 3 3 (a) Study Fig. 5 and Photograph E (Insert), which show an area of coastline. N 0 250 metres 500 chalk sand and clay limestone height above sea level (metres) 10 Key 122 10 Lulworth Cove Sea 40 60 Fig. 5 (i) What is the width of the entrance to Lulworth Cove? … metres [1] (ii) Identify the type of rocks which form: the entrance to Lulworth Cove; … the back of Lulworth Cove. …[2] (iii) Suggest how Lulworth Cove was formed. … … … … … …[3]
Question paper, page 12
12 0460/12/O/N/14 © UCLES 2014 (iv) Explain why areas of coastline, such as the one shown in Photograph E, are important to many people. … … … … … … … …[4] (b) Study Photograph F (Insert), which shows a stack. (i) Describe three features of the stack shown in Photograph F. 1 … … 2 … … 3 … …[3]
Question paper, page 13
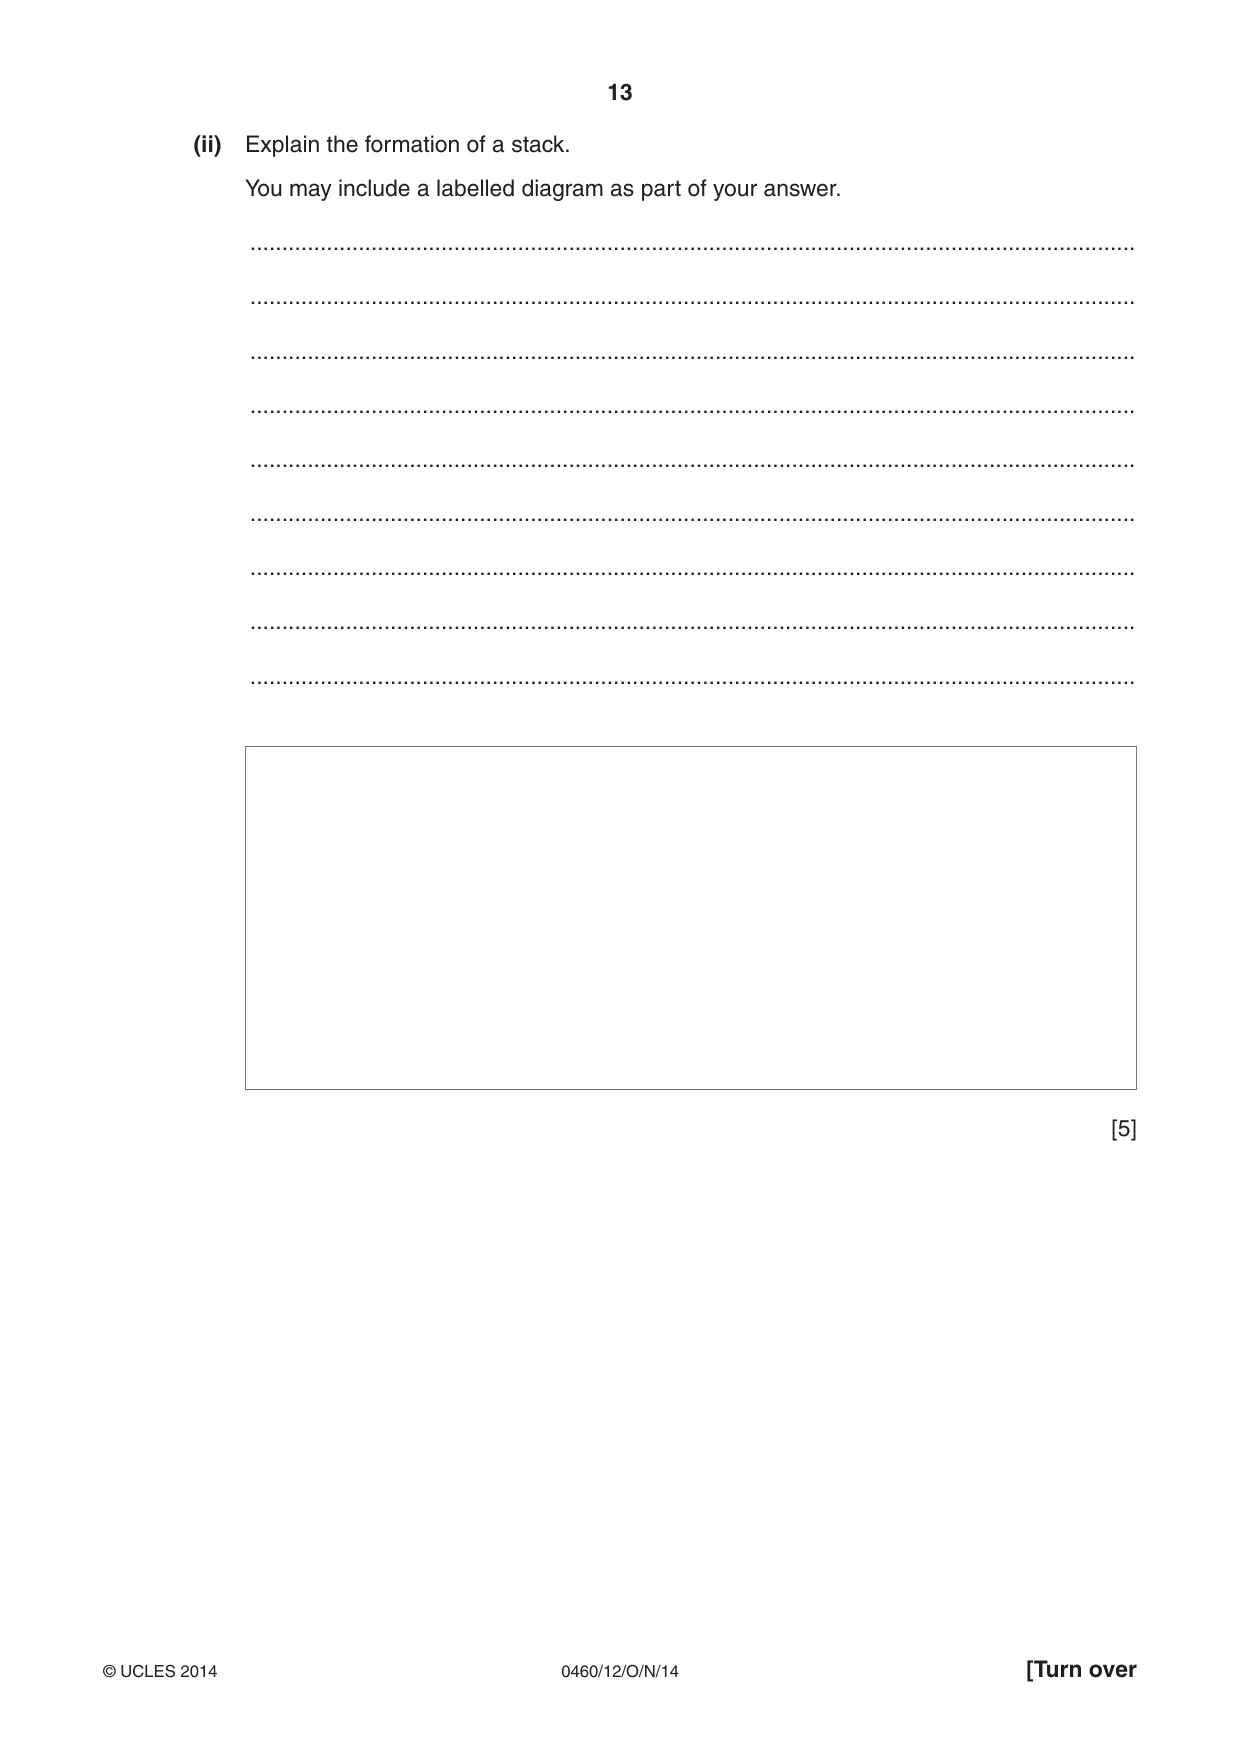
13 0460/12/O/N/14 © UCLES 2014 [Turn over (ii) Explain the formation of a stack. You may include a labelled diagram as part of your answer. … … … … … … … … … [5]
Question paper, page 14
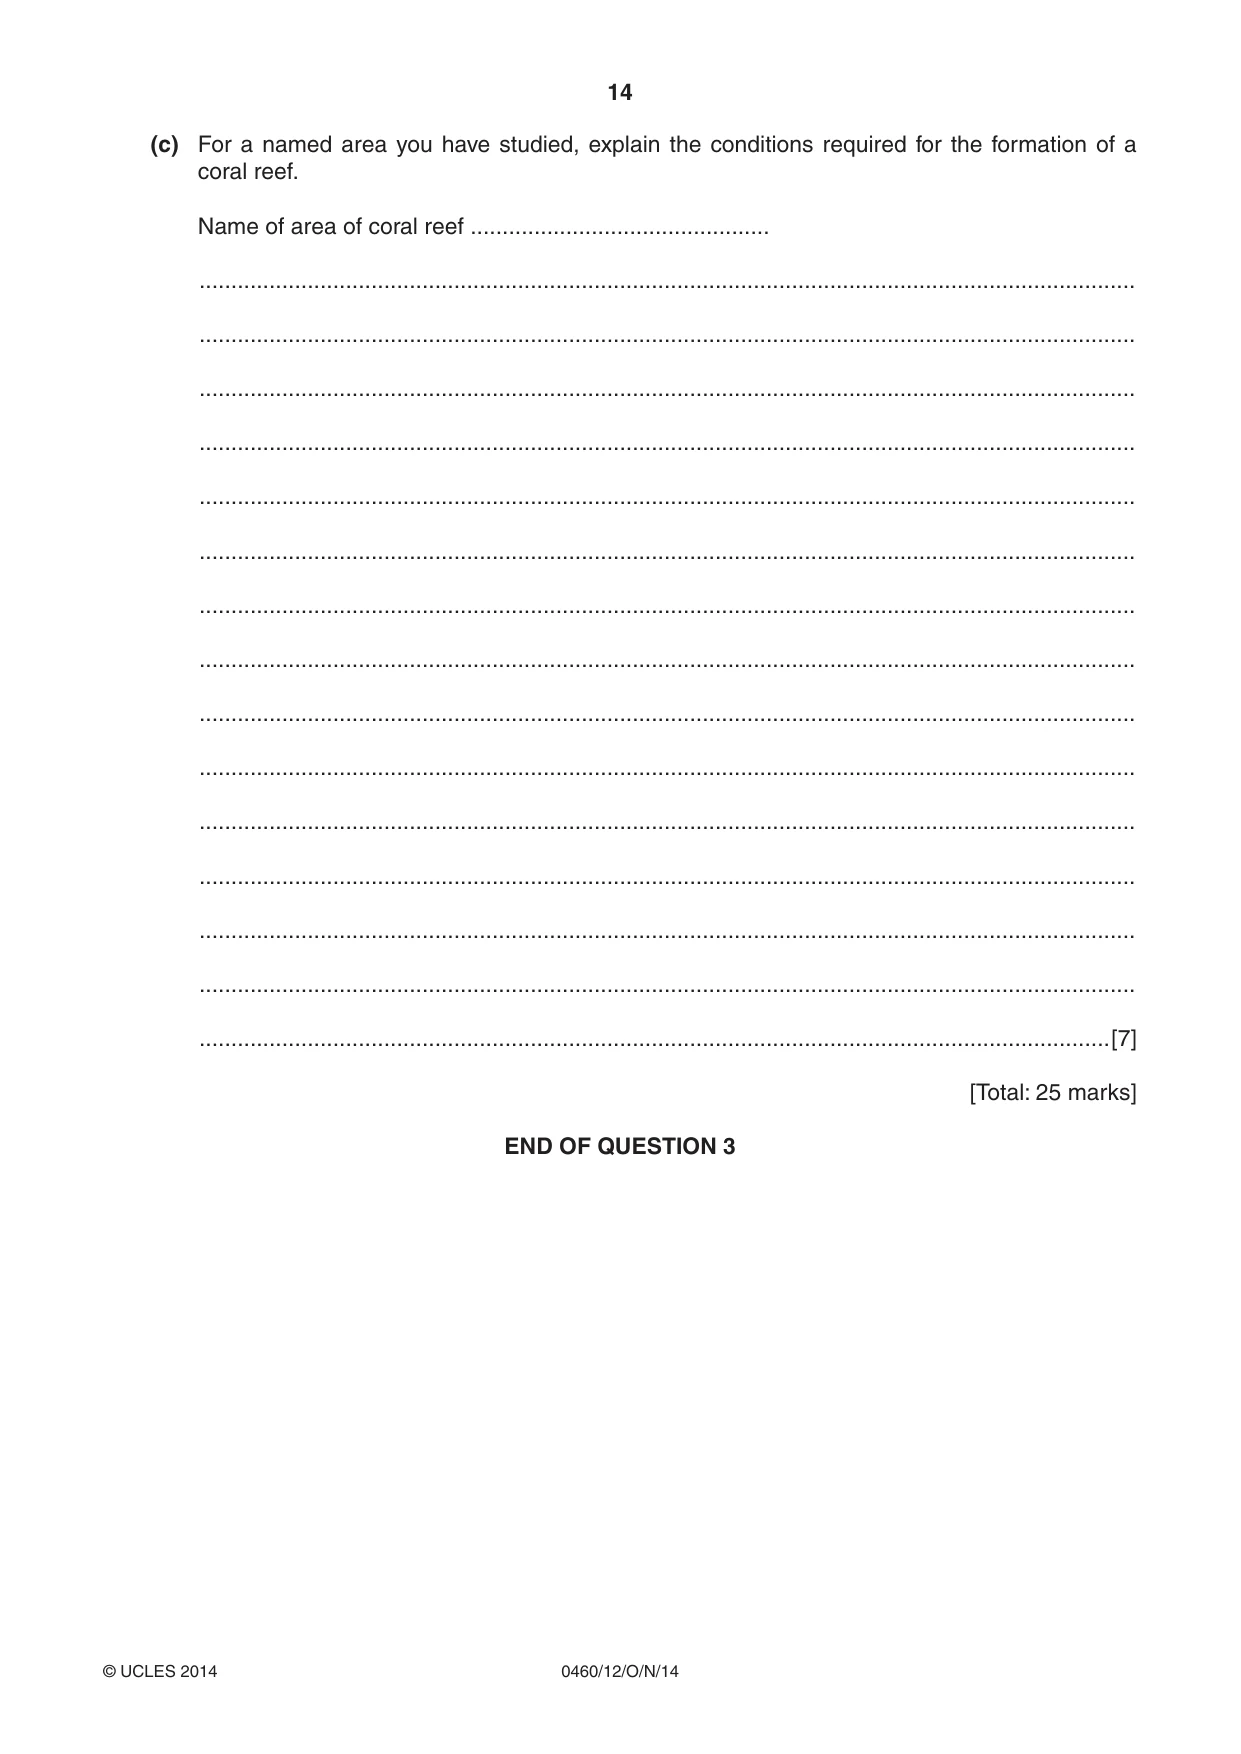
14 0460/12/O/N/14 © UCLES 2014 (c) For a named area you have studied, explain the conditions required for the formation of a coral reef. Name of area of coral reef … … … … … … … … … … … … … … … …[7] [Total: 25 marks] END OF QUESTION 3
Question paper, page 15
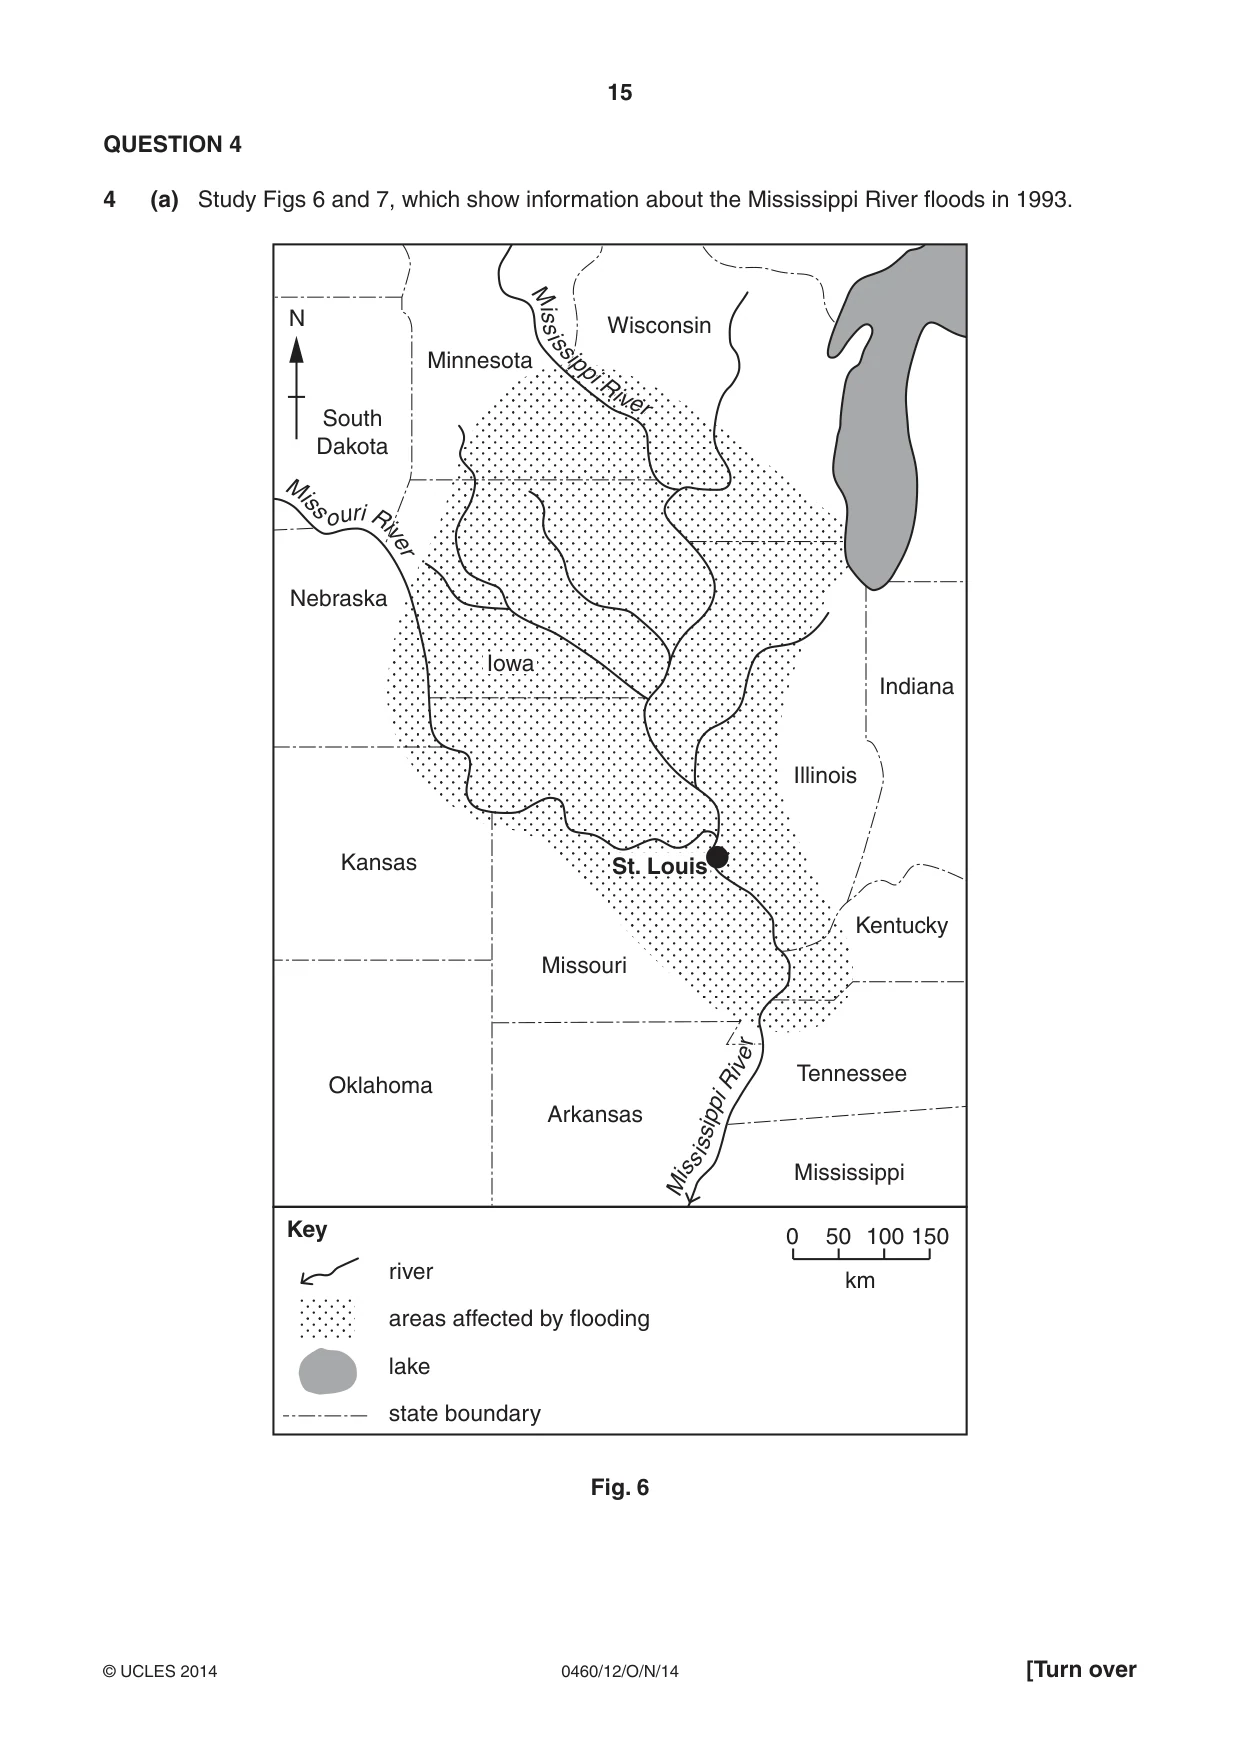
15 0460/12/O/N/14 © UCLES 2014 [Turn over QUESTION 4 4 (a) Study Figs 6 and 7, which show information about the Mississippi River floods in 1993. N M i s s o u r i R i v e r M i ss i ssip p i R iv e r M i s s i s si ppi R i v e r Wisconsin Minnesota South Dakota Nebraska Kansas Oklahoma Arkansas Mississippi Tennessee Kentucky Illinois Indiana Missouri Iowa St. Louis river areas affected by flooding lake state boundary 0 50 100 km 150 Key Fig. 6
Question paper, page 16
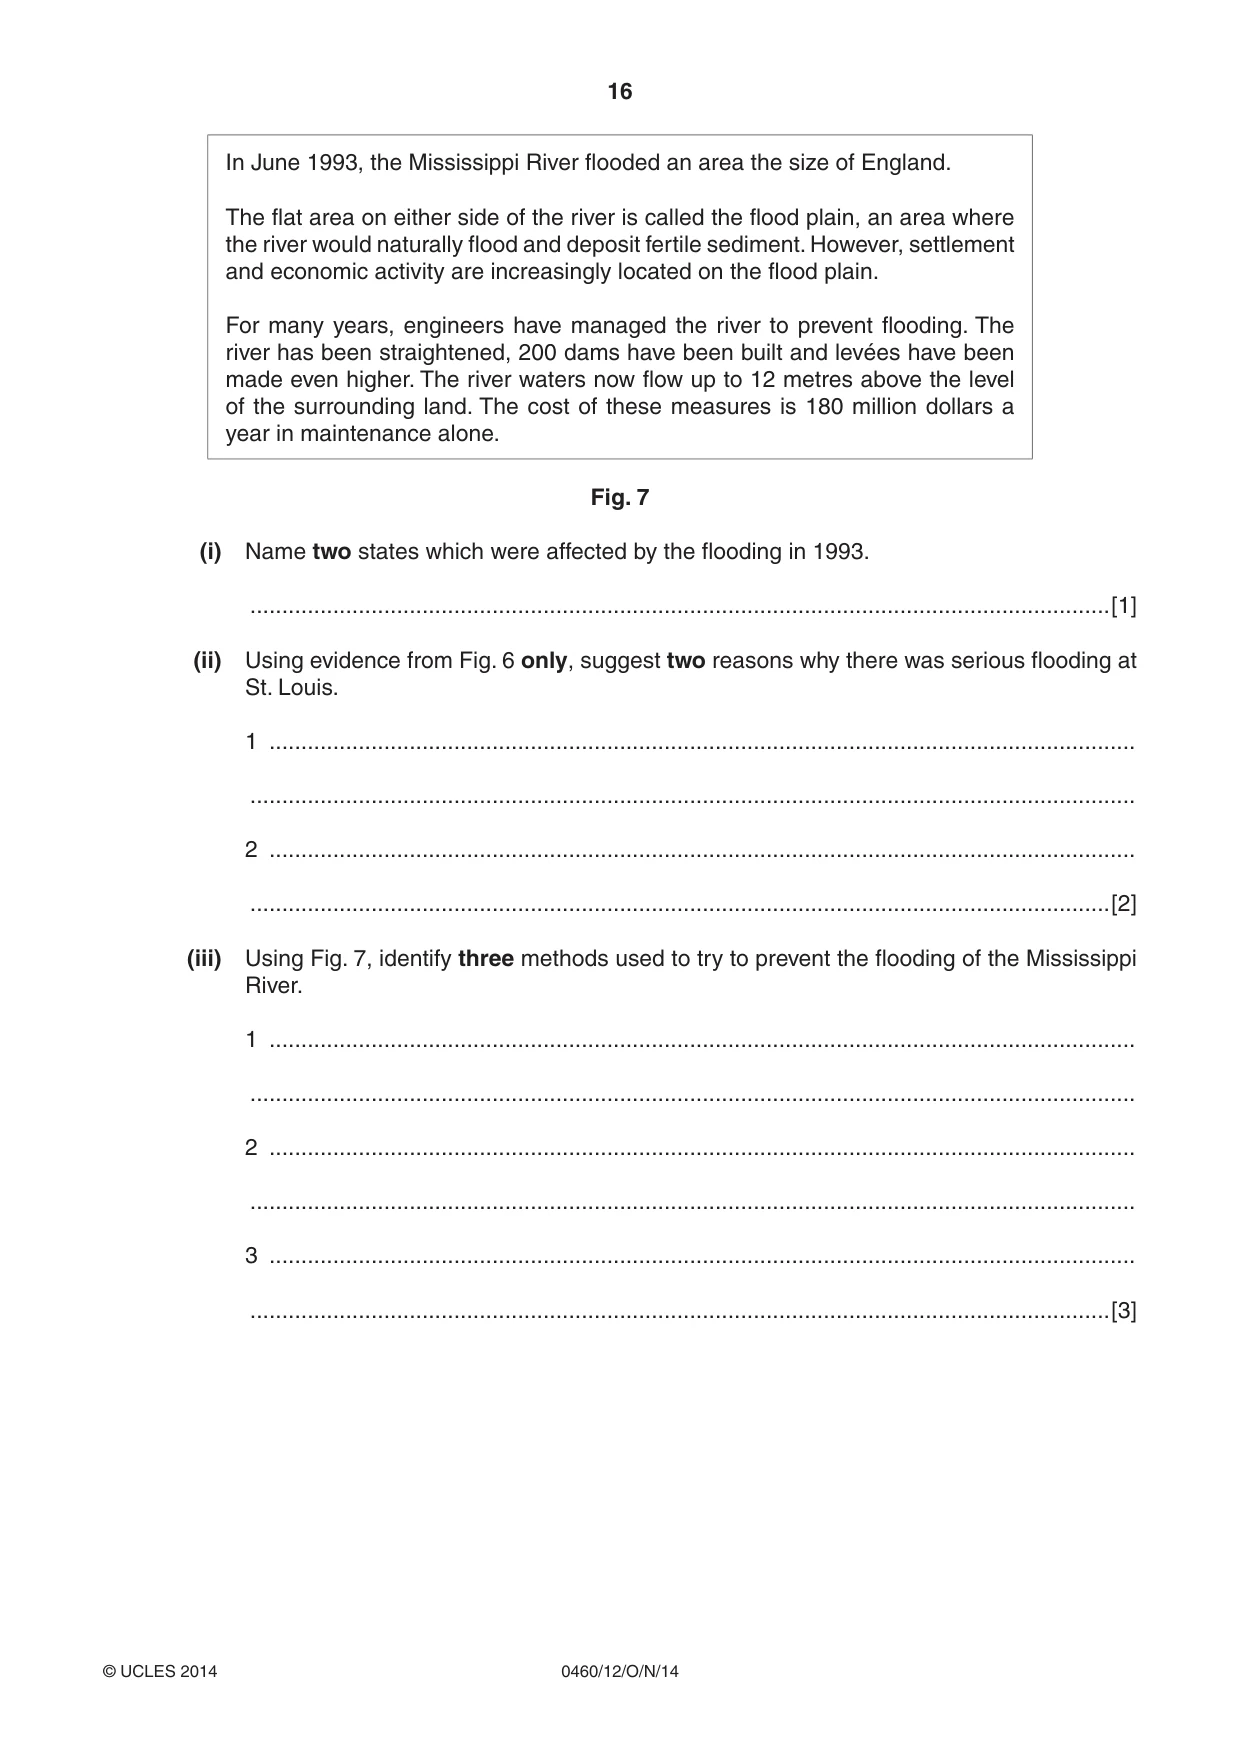
16 0460/12/O/N/14 © UCLES 2014 In June 1993, the Mississippi River flooded an area the size of England. The flat area on either side of the river is called the flood plain, an area where the river would naturally flood and deposit fertile sediment. However, settlement and economic activity are increasingly located on the flood plain. For many years, engineers have managed the river to prevent flooding. The river has been straightened, 200 dams have been built and levées have been made even higher. The river waters now flow up to 12 metres above the level of the surrounding land. The cost of these measures is 180 million dollars a year in maintenance alone. Fig. 7 (i) Name two states which were affected by the flooding in 1993. …[1] (ii) Using evidence from Fig. 6 only, suggest two reasons why there was serious flooding at St. Louis. 1 … … 2 … …[2] (iii) Using Fig. 7, identify three methods used to try to prevent the flooding of the Mississippi River. 1 … … 2 … … 3 … …[3]
Question paper, page 17
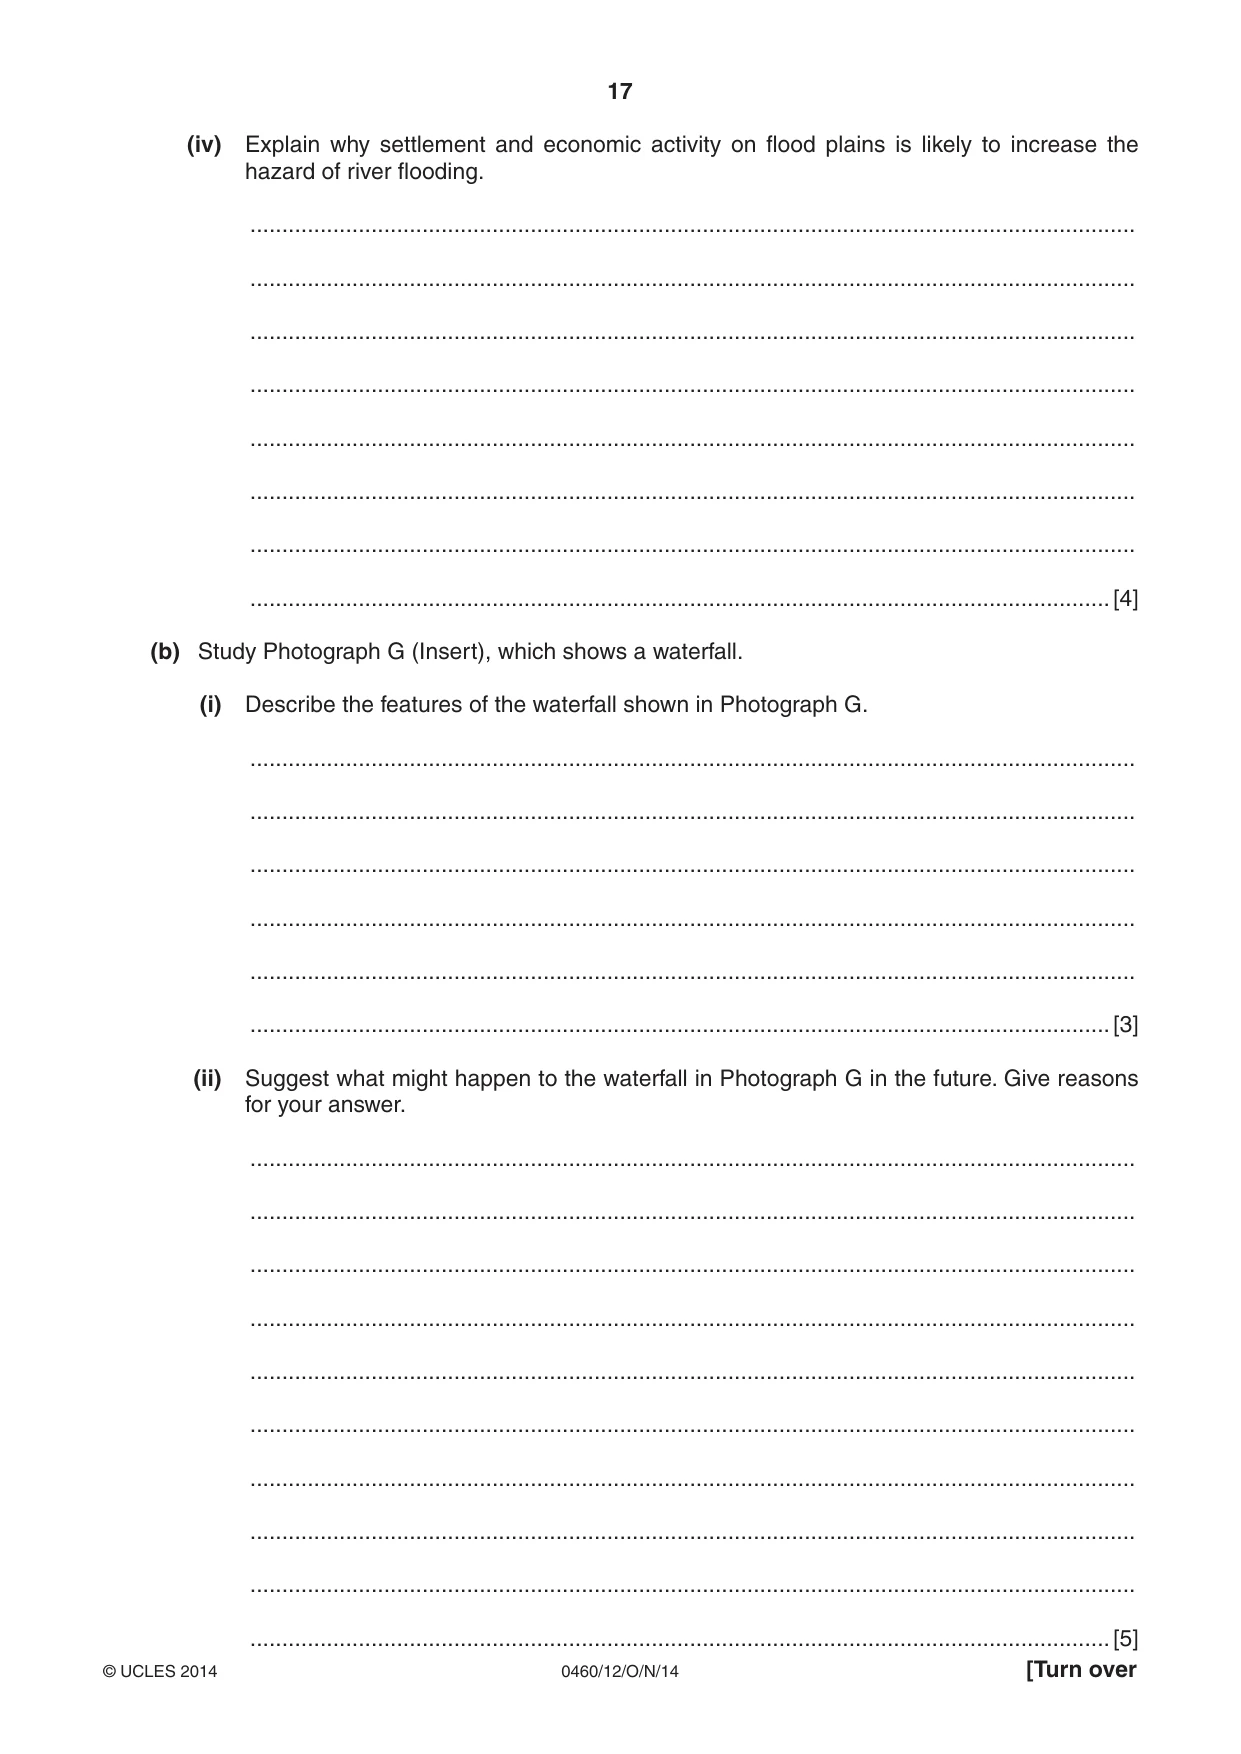
17 0460/12/O/N/14 © UCLES 2014 [Turn over (iv) Explain why settlement and economic activity on flood plains is likely to increase the hazard of river flooding. … … … … … … … …[4] (b) Study Photograph G (Insert), which shows a waterfall. (i) Describe the features of the waterfall shown in Photograph G. … … … … … …[3] (ii) Suggest what might happen to the waterfall in Photograph G in the future. Give reasons for your answer. … … … … … … … … … …[5]
Question paper, page 18
18 0460/12/O/N/14 © UCLES 2014 (c) Describe and explain one of the following types of weathering. You may use a diagram. Carbonation Exfoliation Weathering process chosen … … … … … … … … … … … … … … … … [7] [Total: 25 marks] END OF QUESTION 4
Question paper, page 19
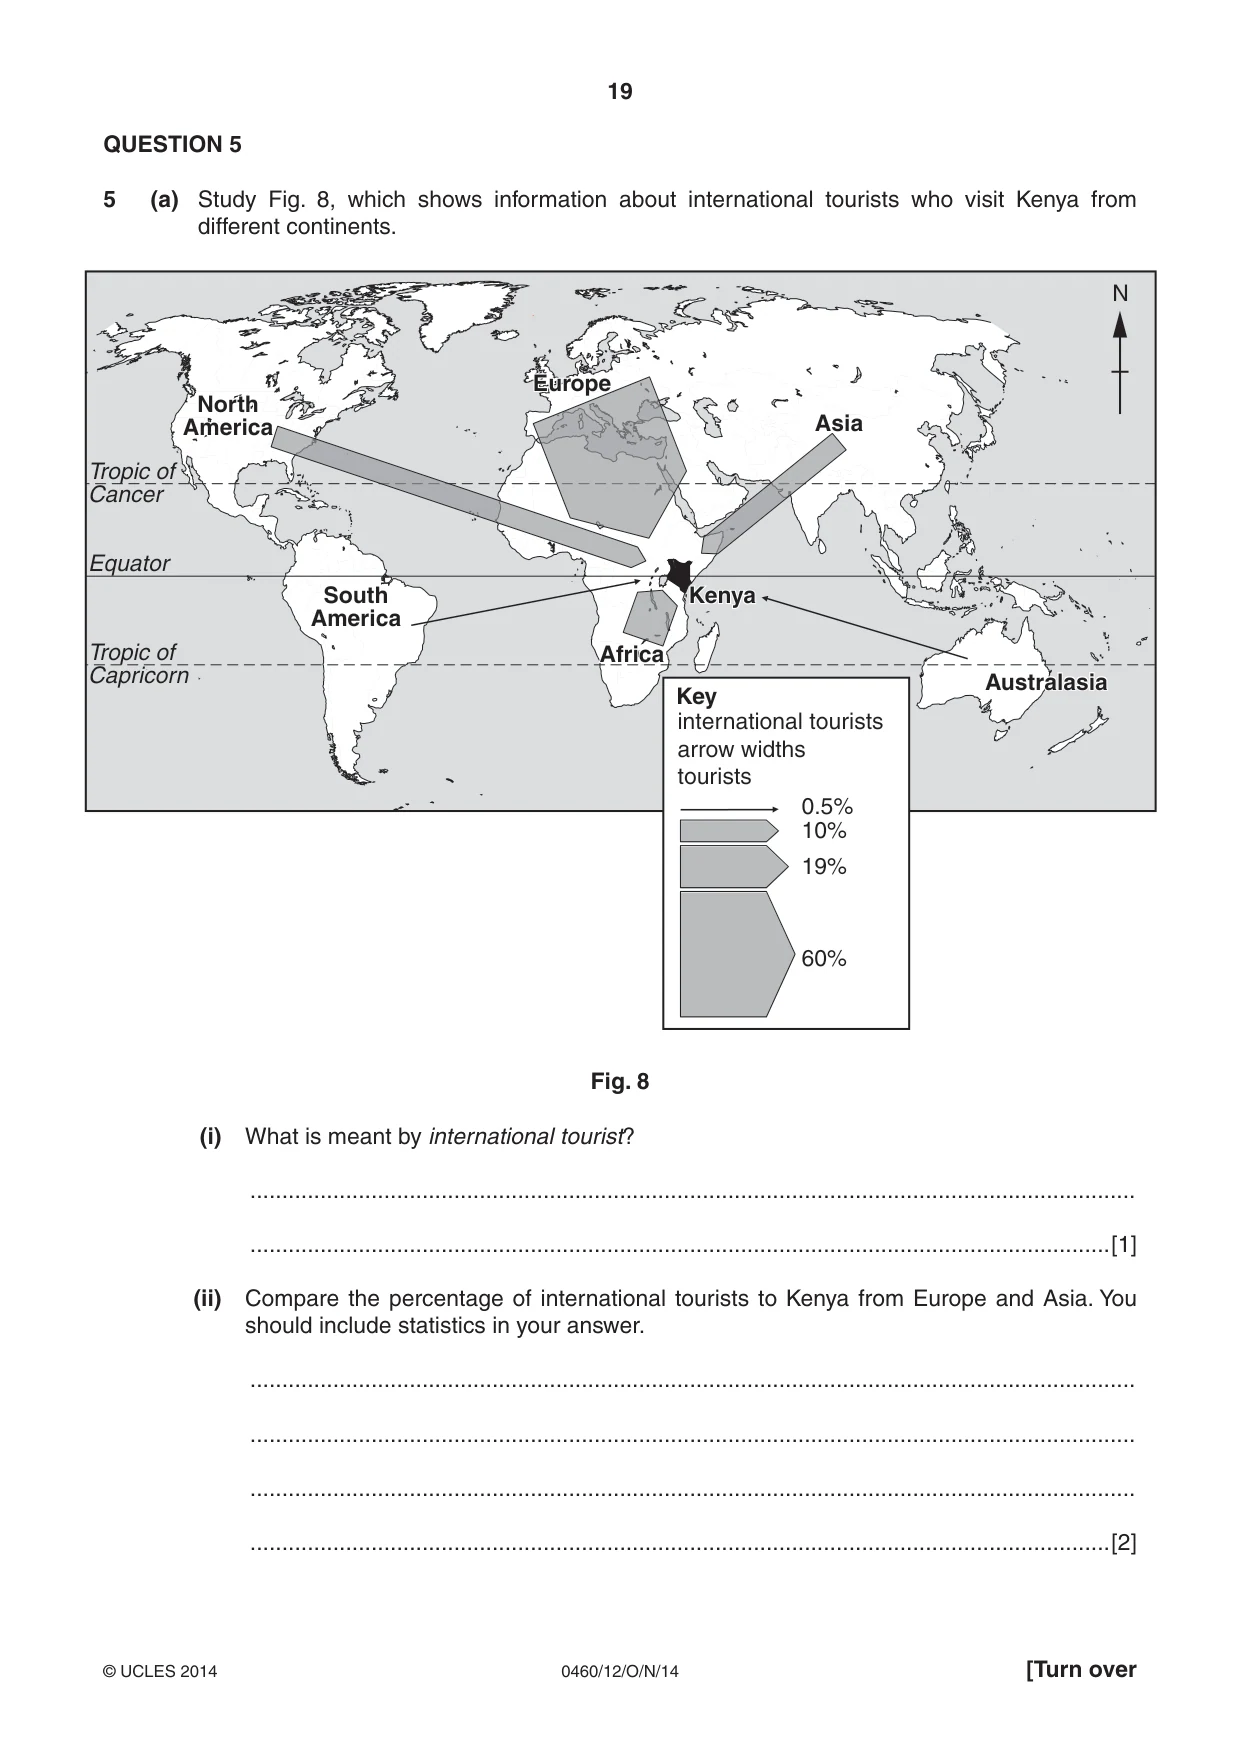
19 0460/12/O/N/14 © UCLES 2014 [Turn over QUESTION 5 5 (a) Study Fig. 8, which shows information about international tourists who visit Kenya from different continents. Key 0.5% international tourists arrow widths tourists Tropic of Cancer Tropic of Capricorn Equator 10% 19% 60% N South America Asia Europe North America Africa Australasia Kenya Fig. 8 (i) What is meant by international tourist? … …[1] (ii) Compare the percentage of international tourists to Kenya from Europe and Asia. You should include statistics in your answer. … … … …[2]
Question paper, page 20
20 0460/12/O/N/14 © UCLES 2014 (iii) Suggest reasons why the number of tourists to Kenya from different parts of the world varies. … … … … … …[3] (iv) Explain why international tourism has increased in the last 50 years. … … … … … … … …[4]
Question paper, page 21
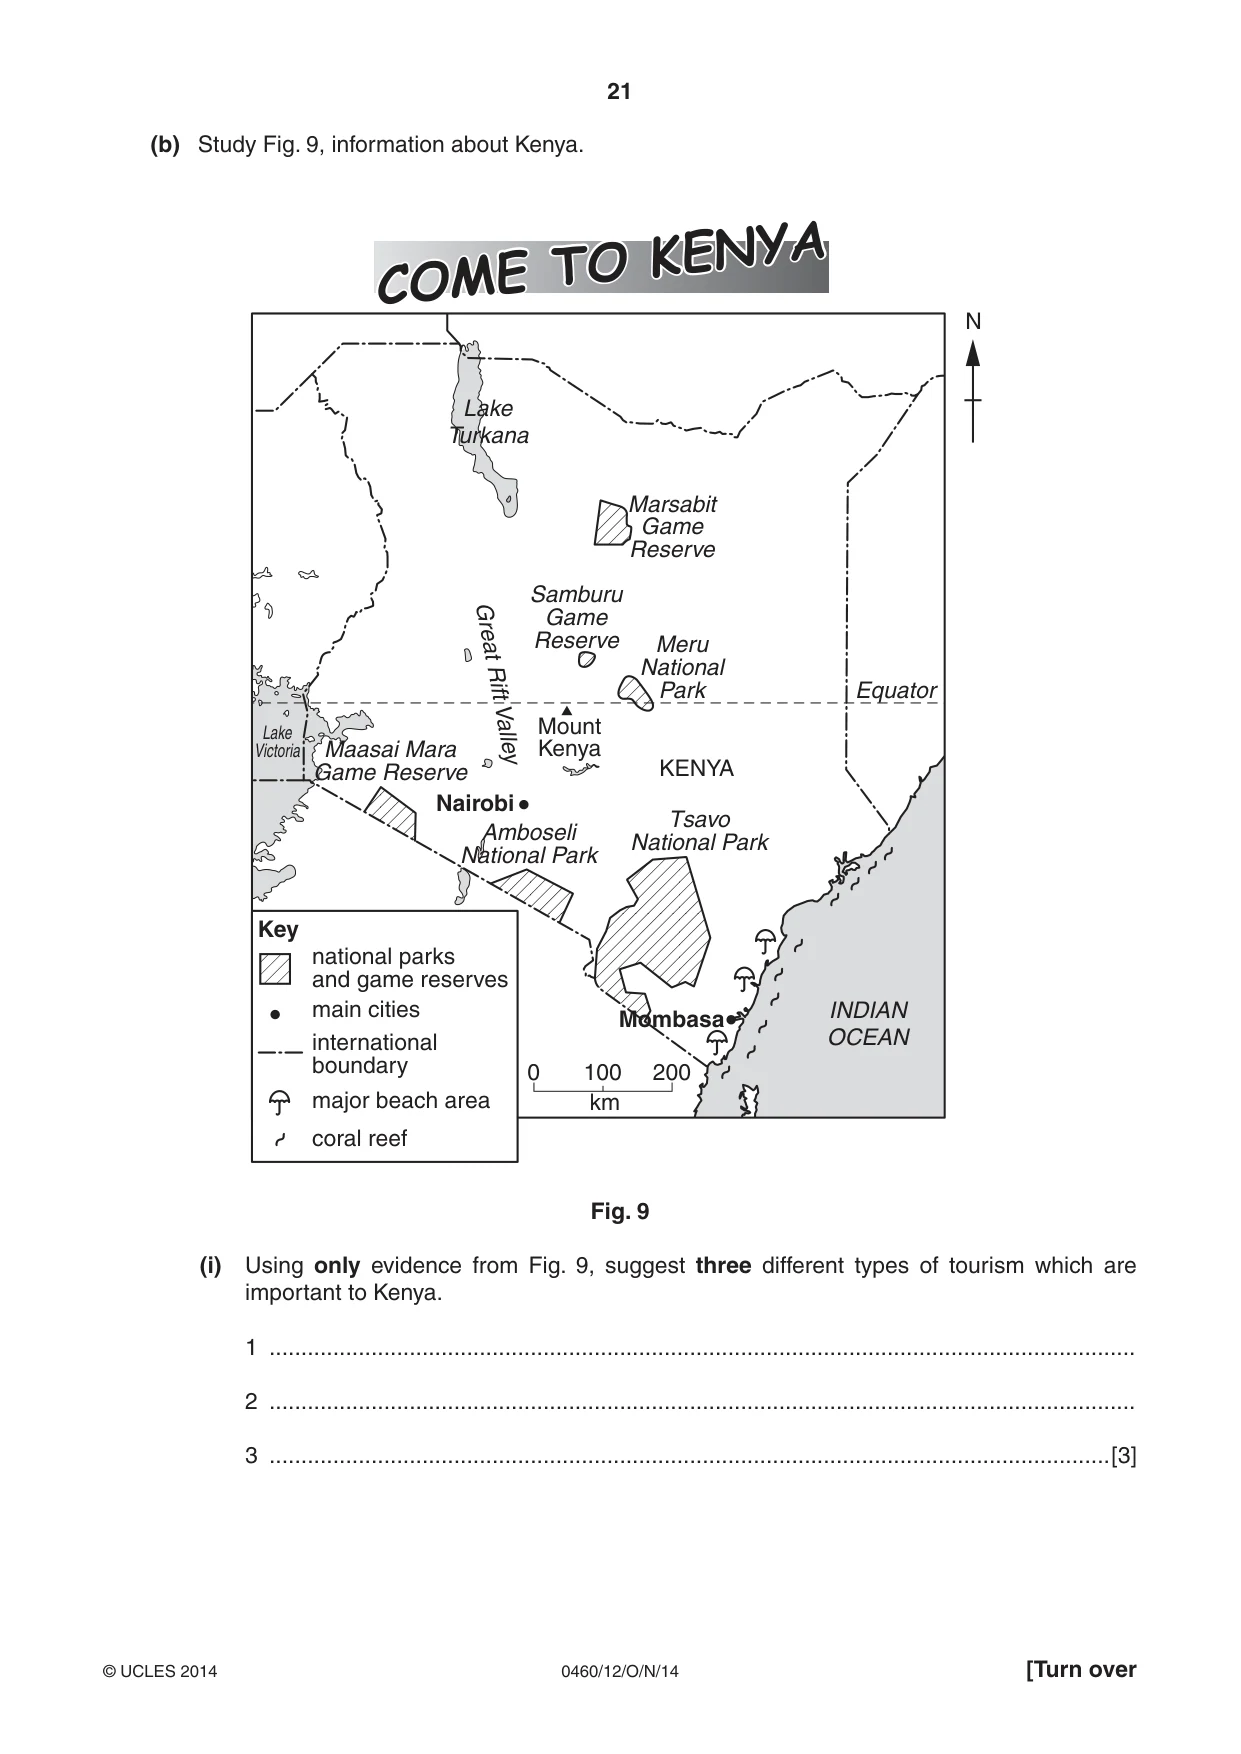
21 0460/12/O/N/14 © UCLES 2014 [Turn over (b) Study Fig. 9, information about Kenya. COME TO KENYA N Equator Mount Kenya KENYA 0 100 national parks and game reserves main cities international boundary major beach area coral reef Key 200 INDIAN OCEAN Lake Turkana Lake Victoria km Nairobi Mombasa Maasai Mara Game Reserve Samburu Game Reserve Marsabit Game Reserve Amboseli National Park Meru National Park Tsavo National Park Great Rift Valley Fig. 9 (i) Using only evidence from Fig. 9, suggest three different types of tourism which are important to Kenya. 1 … 2 … 3 …[3]
Question paper, page 22
22 0460/12/O/N/14 © UCLES 2014 (ii) Explain how the creation of game reserves and national parks in Kenya is likely to help tourism to be sustainable. … … … … … … … … … … [5]
Question paper, page 23
23 0460/12/O/N/14 © UCLES 2014 [Turn over (c) For a named area you have studied, describe the benefits and problems of tourism for local people. Name of area … … … … … … … … … … … … … … … [7] [Total: 25 marks] END OF QUESTION 5
Question paper, page 24
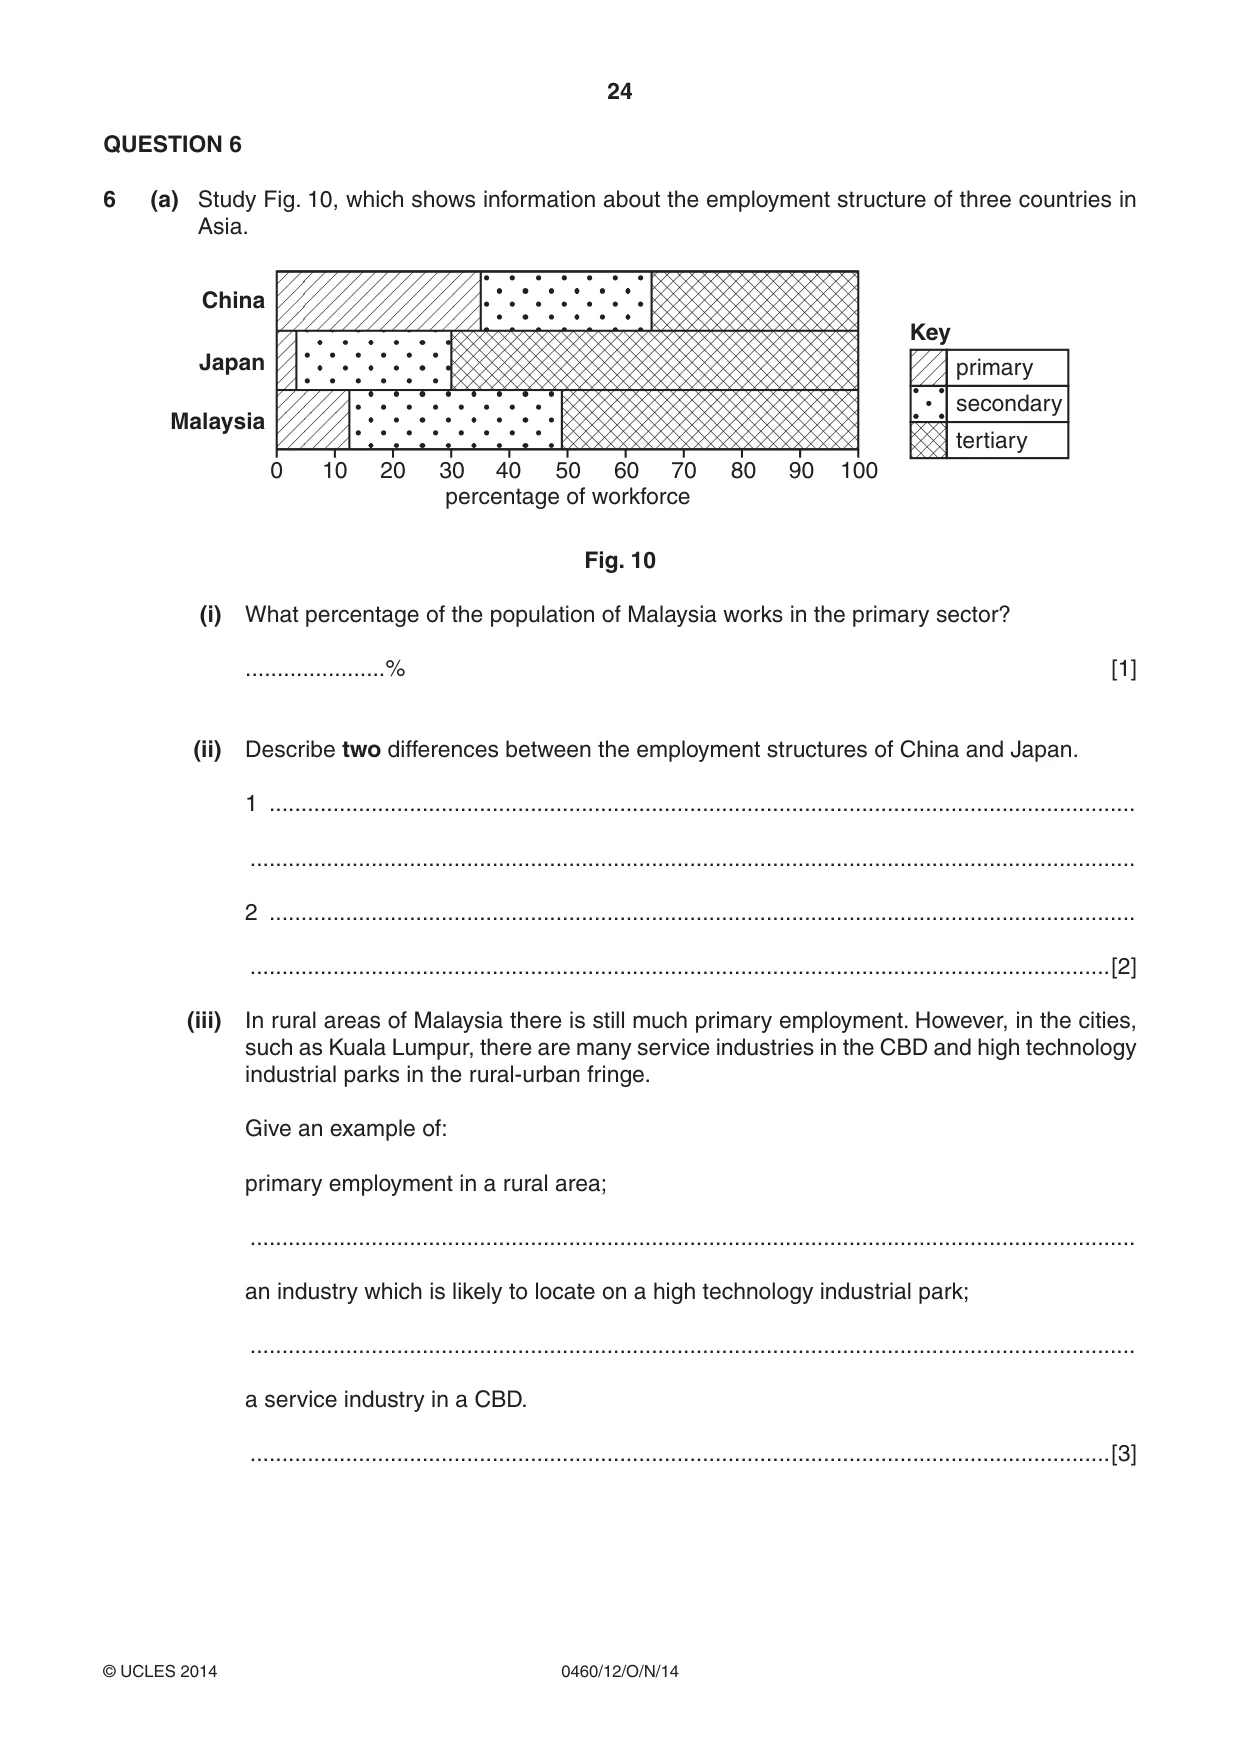
24 0460/12/O/N/14 © UCLES 2014 QUESTION 6 6 (a) Study Fig. 10, which shows information about the employment structure of three countries in Asia. 0 10 20 30 40 50 60 70 80 90 100 percentage of workforce China Japan Malaysia primary Key secondary tertiary Fig. 10 (i) What percentage of the population of Malaysia works in the primary sector? …% [1] (ii) Describe two differences between the employment structures of China and Japan. 1 … … 2 … …[2] (iii) In rural areas of Malaysia there is still much primary employment. However, in the cities, such as Kuala Lumpur, there are many service industries in the CBD and high technology industrial parks in the rural-urban fringe. Give an example of: primary employment in a rural area; … an industry which is likely to locate on a high technology industrial park; … a service industry in a CBD. …[3]
Question paper, page 25
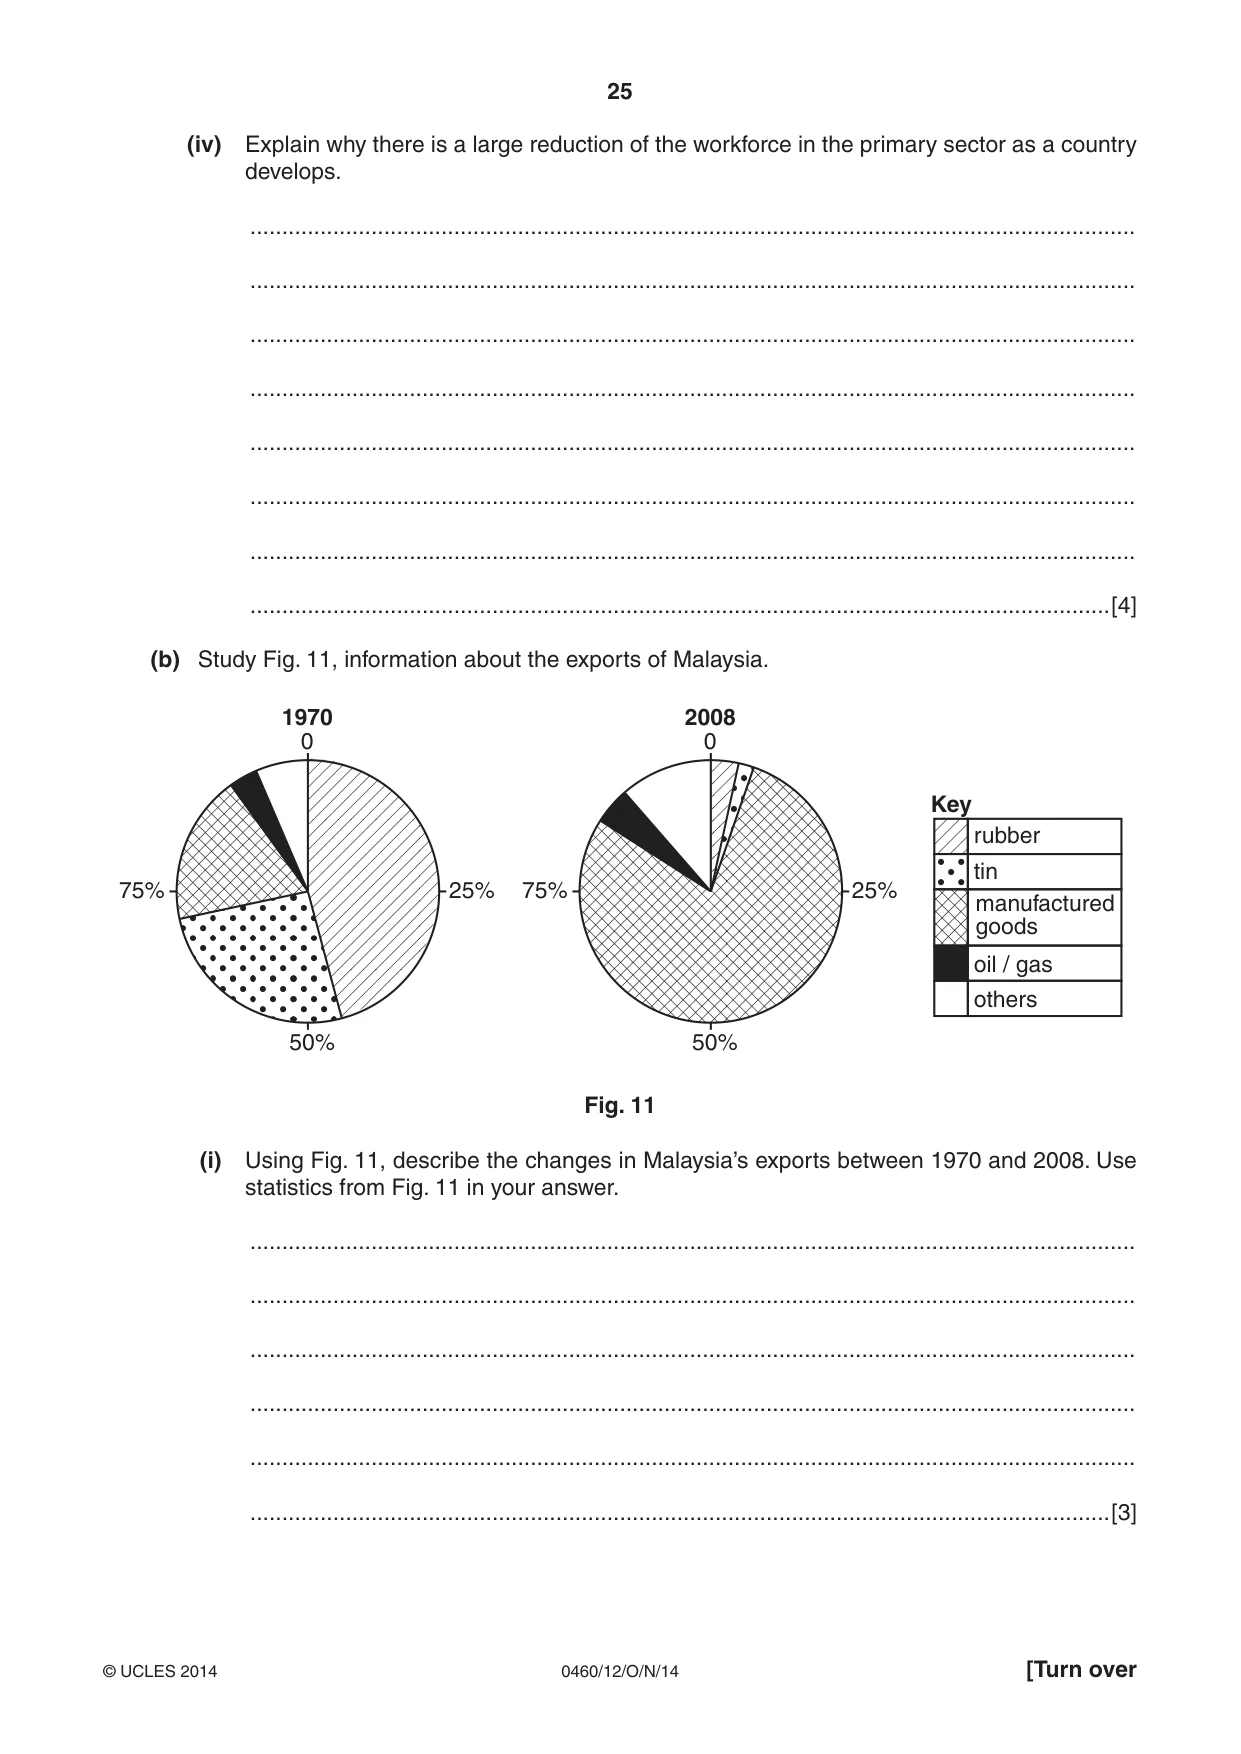
25 0460/12/O/N/14 © UCLES 2014 [Turn over (iv) Explain why there is a large reduction of the workforce in the primary sector as a country develops. … … … … … … … …[4] (b) Study Fig. 11, information about the exports of Malaysia. 0 25% 75% 50% 0 1970 2008 25% Key rubber tin oil / gas others manufactured goods 75% 50% Fig. 11 (i) Using Fig. 11, describe the changes in Malaysia’s exports between 1970 and 2008. Use statistics from Fig. 11 in your answer. … … … … … …[3]
Question paper, page 26
26 0460/12/O/N/14 © UCLES 2014 (ii) Explain why many high technology industries have grown up in newly industrialised countries (NICs). … … … … … … … … … …[5]
Question paper, page 27
27 0460/12/O/N/14 © UCLES 2014 [Turn over (c) For a named area you have studied, describe the impacts of agriculture on the natural environment. Area studied … … … … … … … … … … … … … … … …[7] [Total: 25 marks] END OF QUESTION 6
Question paper, page 28
28 0460/12/O/N/14 © UCLES 2014 Copyright Acknowledgements: Question 2 Fig. 4 Question 2 Photographs A–D Question 3 Photographs E & F Question 4 Photograph G © Michael Raw; Geography in Place: Homework Copymasters; Collins Educational; 1999; ISBN 0003267032. S. Sibley © UCLES. S. Sibley © UCLES. S. Sibley © UCLES. Permission to reproduce items where third-party owned material protected by copyright is included has been sought and cleared where possible. Every reasonable effort has been made by the publisher (UCLES) to trace copyright holders, but if any items requiring clearance have unwittingly been included, the publisher will be pleased to make amends at the earliest possible opportunity. Cambridge International Examinations is part of the Cambridge Assessment Group. Cambridge Assessment is the brand name of University of Cambridge Local Examinations Syndicate (UCLES), which is itself a department of the University of Cambridge. Additional Page If you use the following lines to complete the answer(s) to any question(s), the question number(s) must be clearly shown. … … … … … … … … … … … … … … … … … … … … …
Mark scheme, page 1
® IGCSE is the registered trademark of Cambridge International Examinations. CAMBRIDGE INTERNATIONAL EXAMINATIONS Cambridge International General Certificate of Secondary Education MARK SCHEME for the October/November 2014 series 0460 GEOGRAPHY 0460/12 Paper 1, maximum raw mark 75 This mark scheme is published as an aid to teachers and candidates, to indicate the requirements of the examination. It shows the basis on which Examiners were instructed to award marks. It does not indicate the details of the discussions that took place at an Examiners’ meeting before marking began, which would have considered the acceptability of alternative answers. Mark schemes should be read in conjunction with the question paper and the Principal Examiner Report for Teachers. Cambridge will not enter into discussions about these mark schemes. Cambridge is publishing the mark schemes for the October/November 2014 series for most Cambridge IGCSE®, Cambridge International A and AS Level components and some Cambridge O Level components.
Mark scheme, page 2
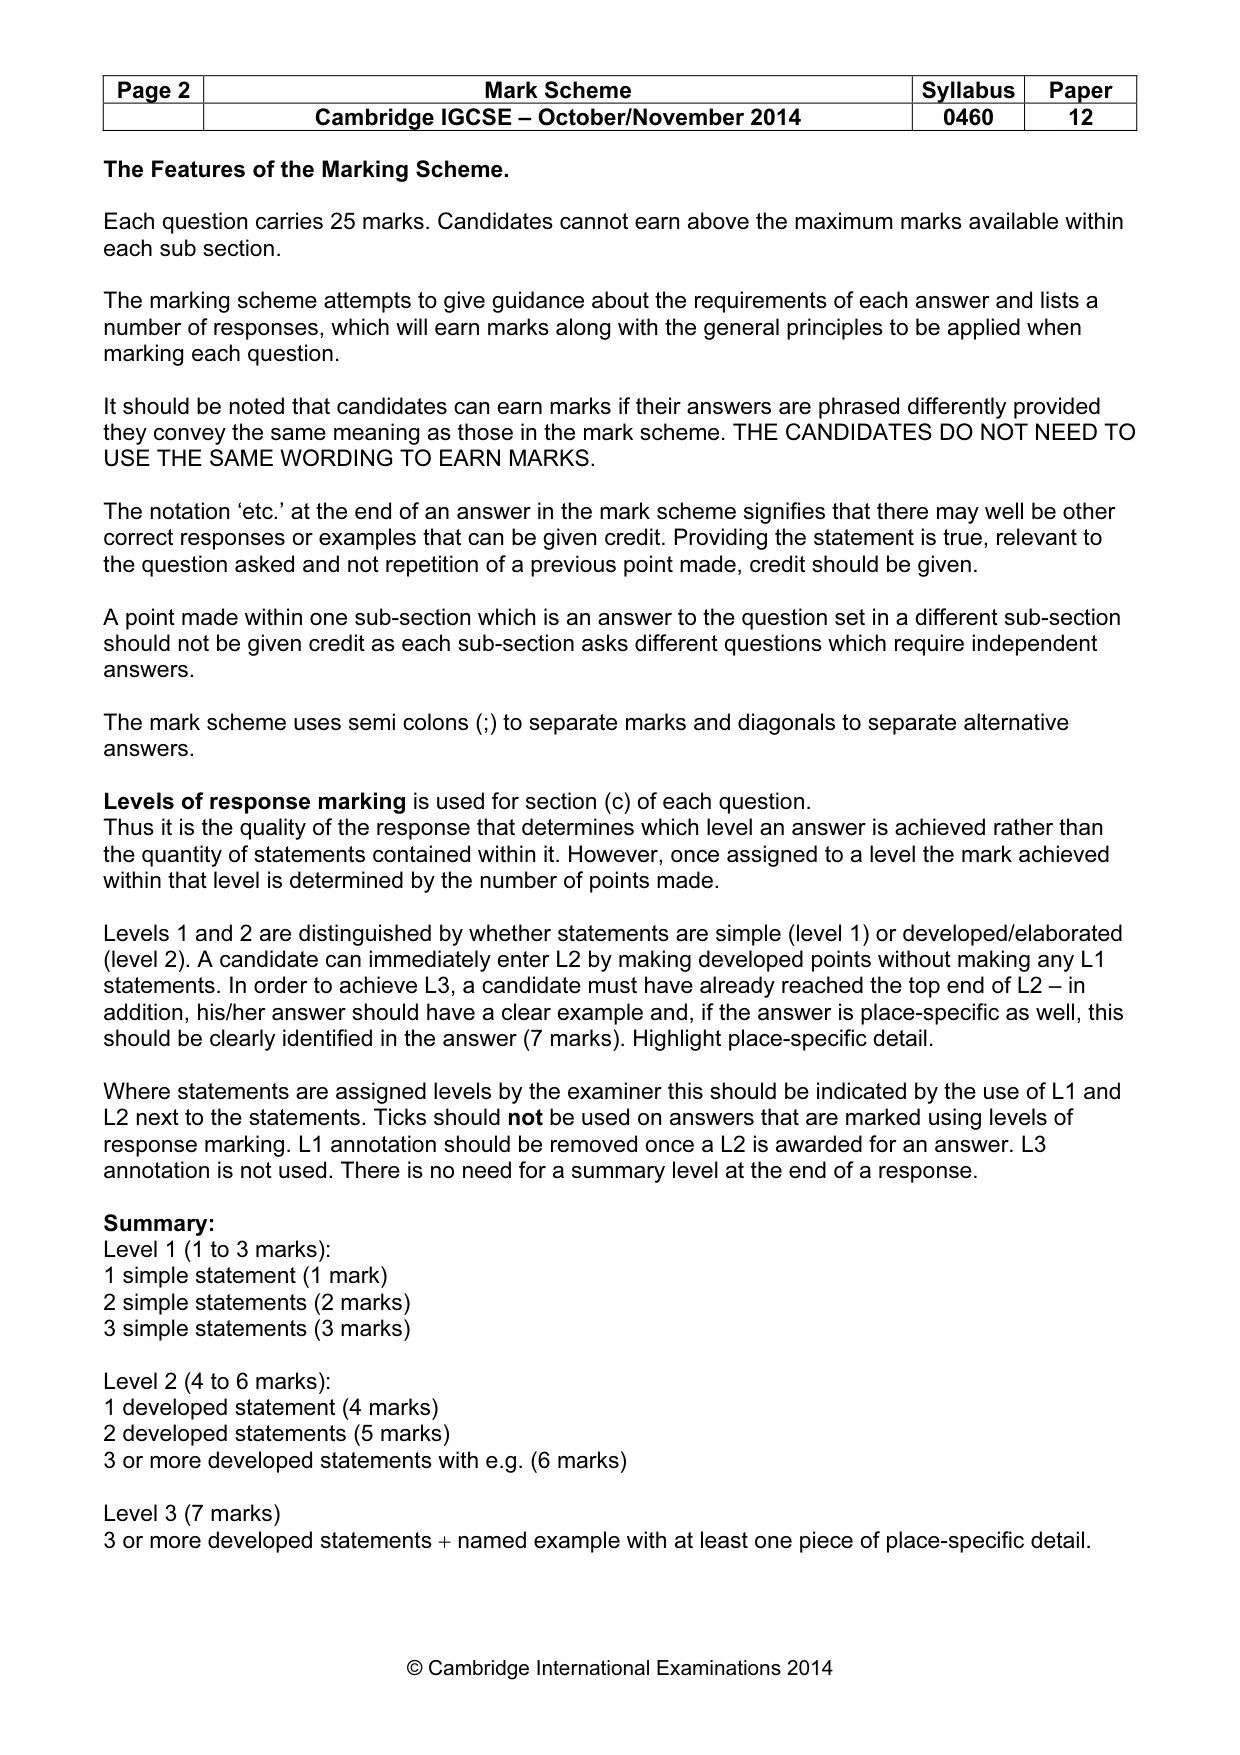
Page 2 Mark Scheme Syllabus Paper Cambridge IGCSE – October/November 2014 0460 12 © Cambridge International Examinations 2014 The Features of the Marking Scheme. Each question carries 25 marks. Candidates cannot earn above the maximum marks available within each sub section. The marking scheme attempts to give guidance about the requirements of each answer and lists a number of responses, which will earn marks along with the general principles to be applied when marking each question. It should be noted that candidates can earn marks if their answers are phrased differently provided they convey the same meaning as those in the mark scheme. THE CANDIDATES DO NOT NEED TO USE THE SAME WORDING TO EARN MARKS. The notation ‘etc.’ at the end of an answer in the mark scheme signifies that there may well be other correct responses or examples that can be given credit. Providing the statement is true, relevant to the question asked and not repetition of a previous point made, credit should be given. A point made within one sub-section which is an answer to the question set in a different sub-section should not be given credit as each sub-section asks different questions which require independent answers. The mark scheme uses semi colons (;) to separate marks and diagonals to separate alternative answers. Levels of response marking is used for section (c) of each question. Thus it is the quality of the response that determines which level an answer is achieved rather than the quantity of statements contained within it. However, once assigned to a level the mark achieved within that level is determined by the number of points made. Levels 1 and 2 are distinguished by whether statements are simple (level 1) or developed/elaborated (level 2). A candidate can immediately enter L2 by making developed points without making any L1 statements. In order to achieve L3, a candidate must have already reached the top end of L2 – in addition, his/her answer should have a clear example and, if the answer is place-specific as well, this should be clearly identified in the answer (7 marks). Highlight place-specific detail. Where statements are assigned levels by the examiner this should be indicated by the use of L1 and L2 next to the statements. Ticks should not be used on answers that are marked using levels of response marking. L1 annotation should be removed once a L2 is awarded for an answer. L3 annotation is not used. There is no need for a summary level at the end of a response. Summary: Level 1 (1 to 3 marks): 1 simple statement (1 mark) 2 simple statements (2 marks) 3 simple statements (3 marks) Level 2 (4 to 6 marks): 1 developed statement (4 marks) 2 developed statements (5 marks) 3 or more developed statements with e.g. (6 marks) Level 3 (7 marks) 3 or more developed statements + named example with at least one piece of place-specific detail.
Mark scheme, page 3
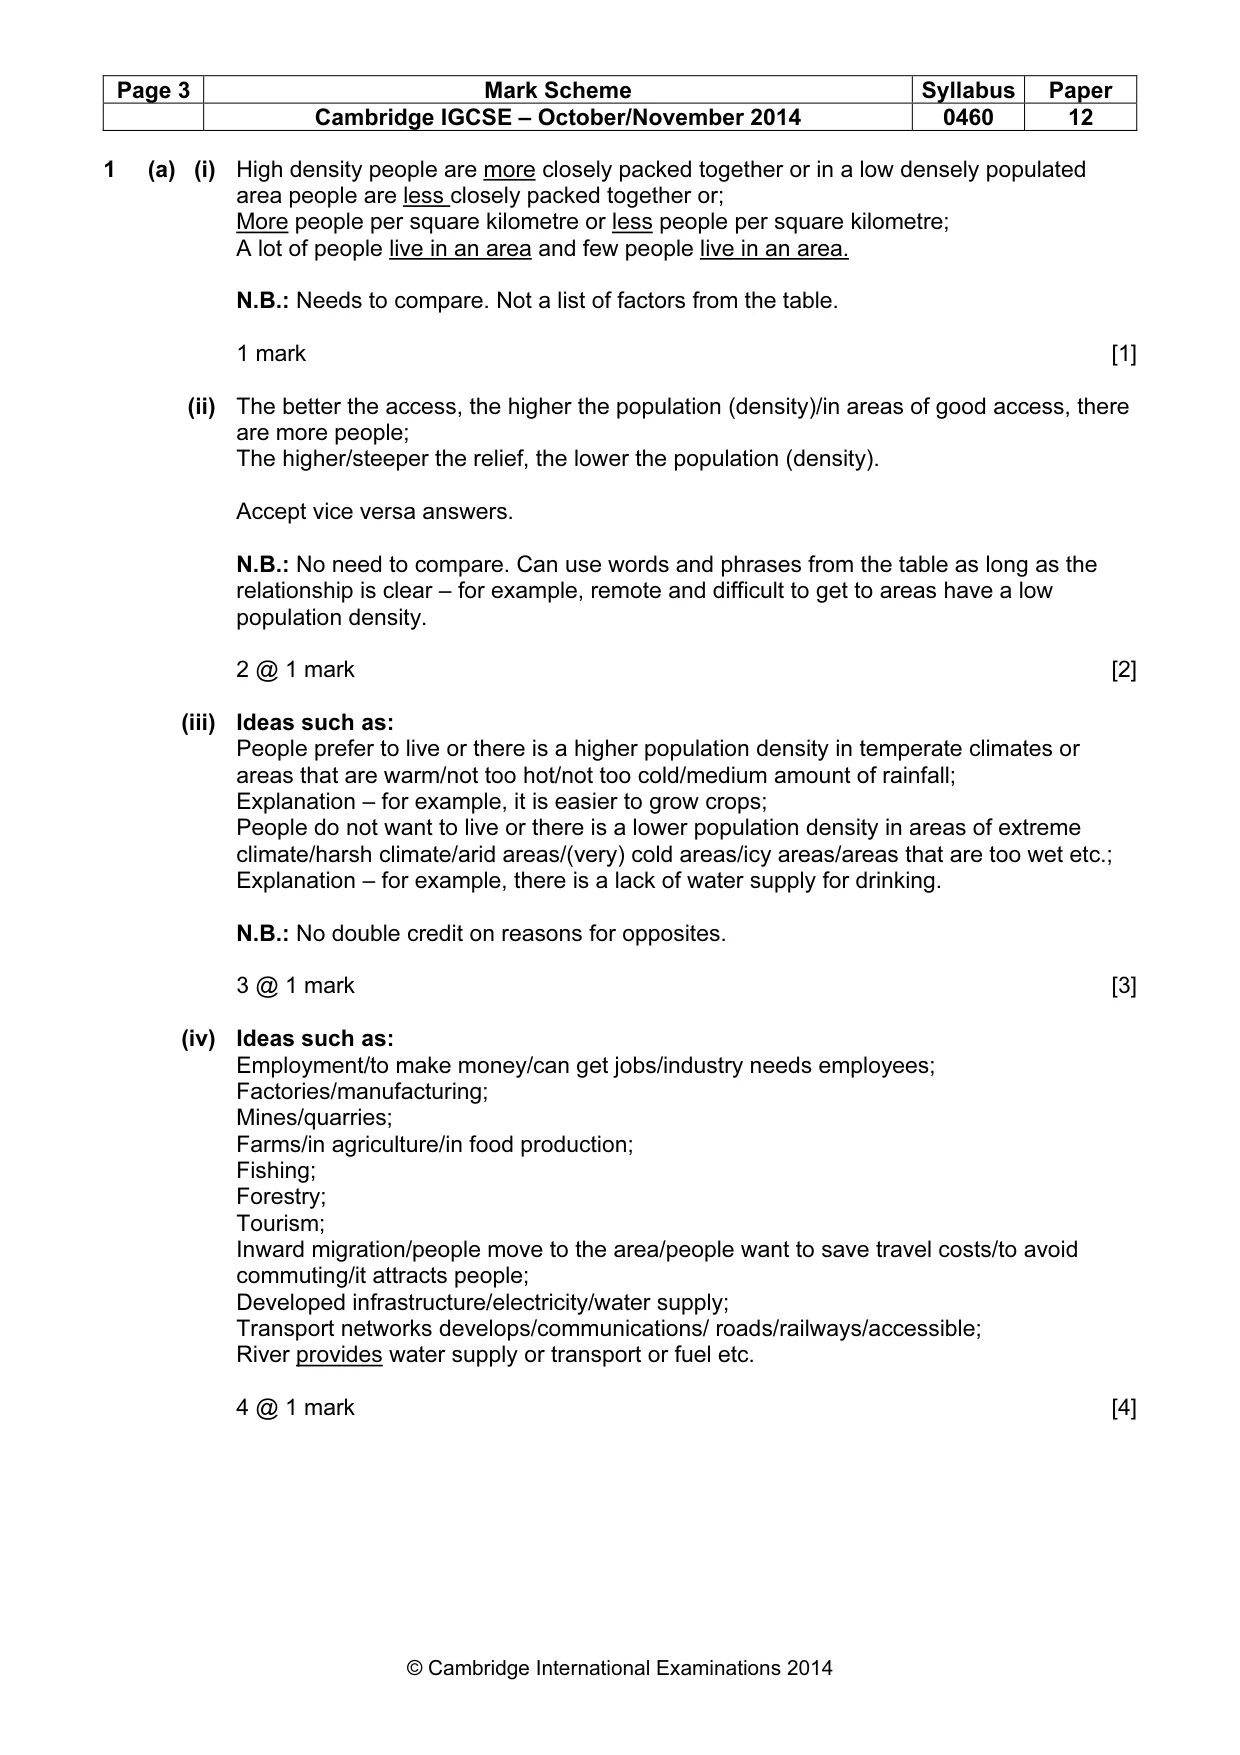
Page 3 Mark Scheme Syllabus Paper Cambridge IGCSE – October/November 2014 0460 12 © Cambridge International Examinations 2014 1 (a) (i) High density people are more closely packed together or in a low densely populated area people are less closely packed together or; More people per square kilometre or less people per square kilometre; A lot of people live in an area and few people live in an area. N.B.: Needs to compare. Not a list of factors from the table. 1 mark [1] (ii) The better the access, the higher the population (density)/in areas of good access, there are more people; The higher/steeper the relief, the lower the population (density). Accept vice versa answers. N.B.: No need to compare. Can use words and phrases from the table as long as the relationship is clear – for example, remote and difficult to get to areas have a low population density. 2 @ 1 mark [2] (iii) Ideas such as: People prefer to live or there is a higher population density in temperate climates or areas that are warm/not too hot/not too cold/medium amount of rainfall; Explanation – for example, it is easier to grow crops; People do not want to live or there is a lower population density in areas of extreme climate/harsh climate/arid areas/(very) cold areas/icy areas/areas that are too wet etc.; Explanation – for example, there is a lack of water supply for drinking. N.B.: No double credit on reasons for opposites. 3 @ 1 mark [3] (iv) Ideas such as: Employment/to make money/can get jobs/industry needs employees; Factories/manufacturing; Mines/quarries; Farms/in agriculture/in food production; Fishing; Forestry; Tourism; Inward migration/people move to the area/people want to save travel costs/to avoid commuting/it attracts people; Developed infrastructure/electricity/water supply; Transport networks develops/communications/ roads/railways/accessible; River provides water supply or transport or fuel etc. 4 @ 1 mark [4]
Mark scheme, page 4
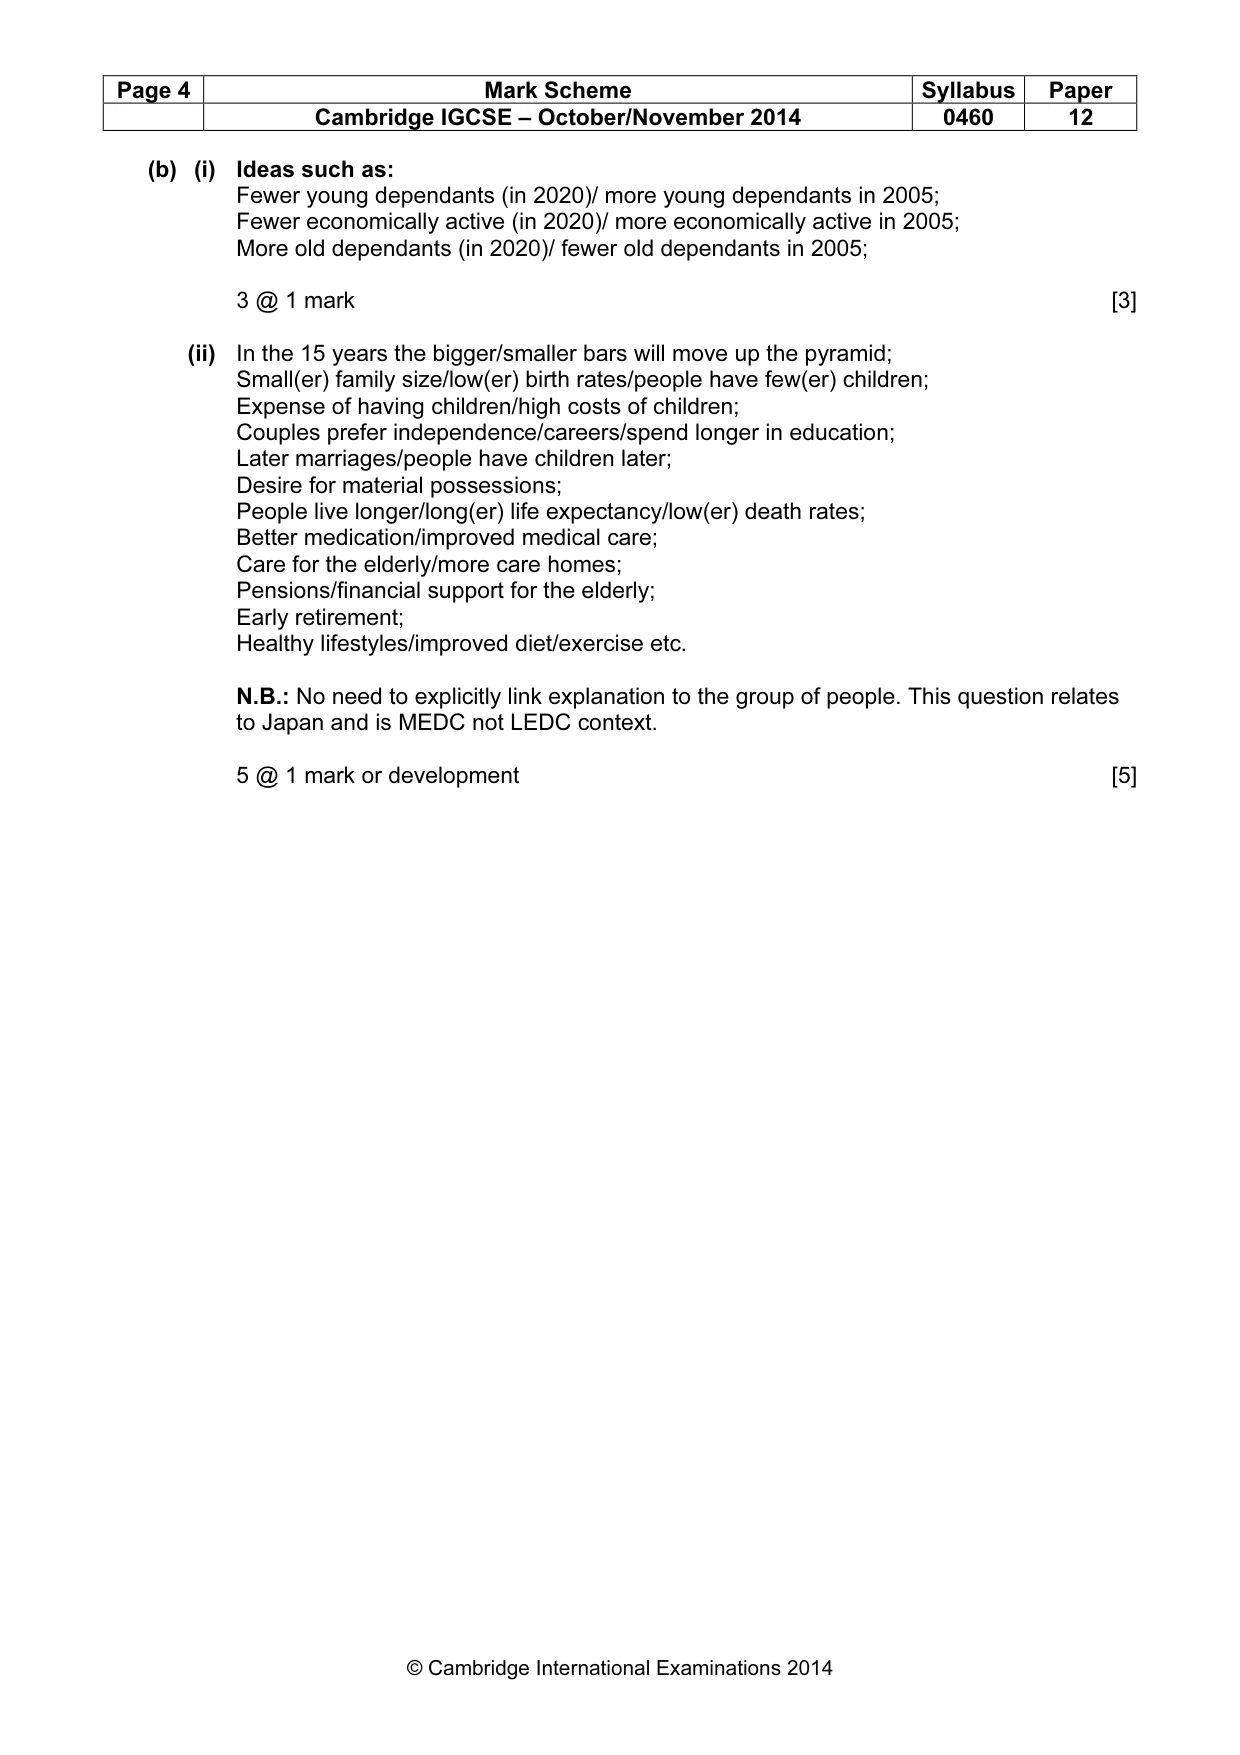
Page 4 Mark Scheme Syllabus Paper Cambridge IGCSE – October/November 2014 0460 12 © Cambridge International Examinations 2014 (b) (i) Ideas such as: Fewer young dependants (in 2020)/ more young dependants in 2005; Fewer economically active (in 2020)/ more economically active in 2005; More old dependants (in 2020)/ fewer old dependants in 2005; 3 @ 1 mark [3] (ii) In the 15 years the bigger/smaller bars will move up the pyramid; Small(er) family size/low(er) birth rates/people have few(er) children; Expense of having children/high costs of children; Couples prefer independence/careers/spend longer in education; Later marriages/people have children later; Desire for material possessions; People live longer/long(er) life expectancy/low(er) death rates; Better medication/improved medical care; Care for the elderly/more care homes; Pensions/financial support for the elderly; Early retirement; Healthy lifestyles/improved diet/exercise etc. N.B.: No need to explicitly link explanation to the group of people. This question relates to Japan and is MEDC not LEDC context. 5 @ 1 mark or development [5]
Mark scheme, page 5
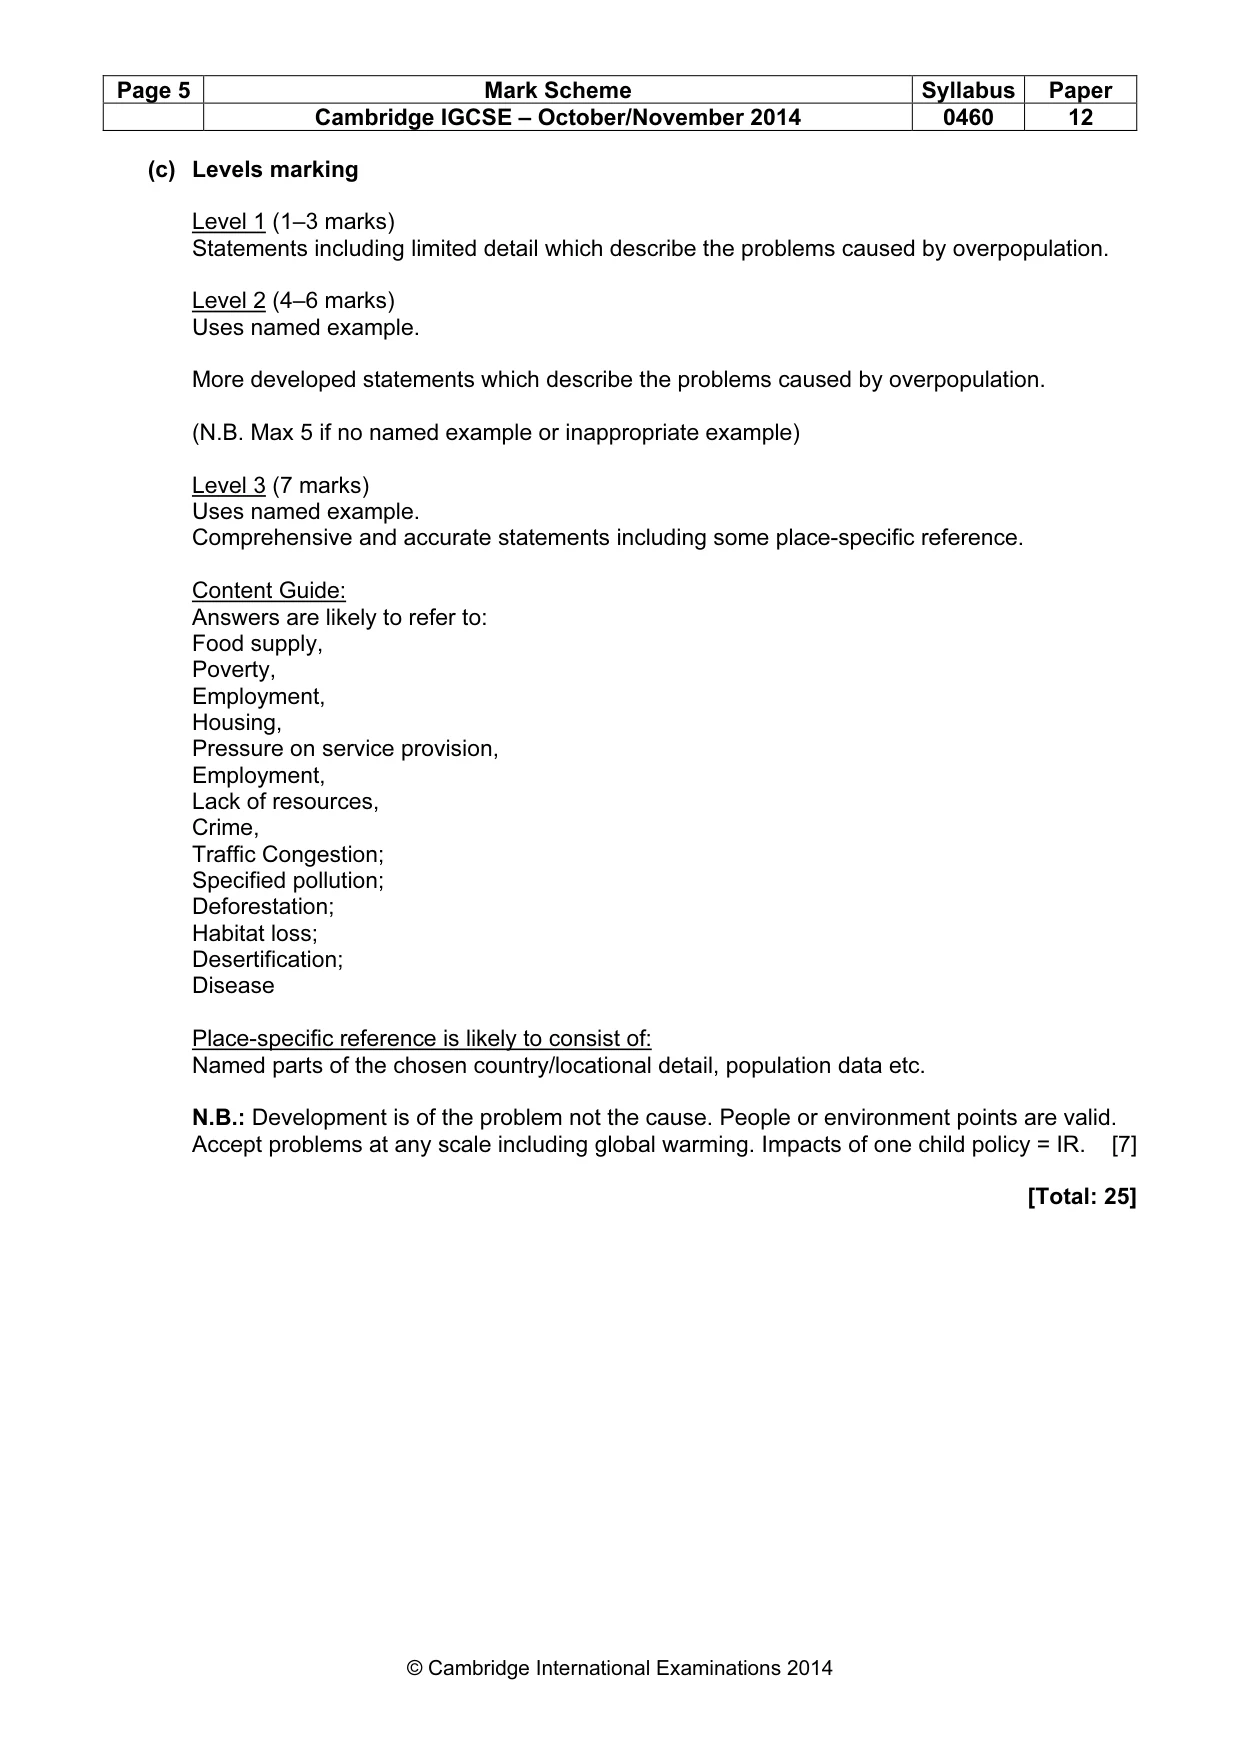
Page 5 Mark Scheme Syllabus Paper Cambridge IGCSE – October/November 2014 0460 12 © Cambridge International Examinations 2014 (c) Levels marking Level 1 (1–3 marks) Statements including limited detail which describe the problems caused by overpopulation. Level 2 (4–6 marks) Uses named example. More developed statements which describe the problems caused by overpopulation. (N.B. Max 5 if no named example or inappropriate example) Level 3 (7 marks) Uses named example. Comprehensive and accurate statements including some place-specific reference. Content Guide: Answers are likely to refer to: Food supply, Poverty, Employment, Housing, Pressure on service provision, Employment, Lack of resources, Crime, Traffic Congestion; Specified pollution; Deforestation; Habitat loss; Desertification; Disease Place-specific reference is likely to consist of: Named parts of the chosen country/locational detail, population data etc. N.B.: Development is of the problem not the cause. People or environment points are valid. Accept problems at any scale including global warming. Impacts of one child policy = IR. [7] [Total: 25]
Mark scheme, page 6
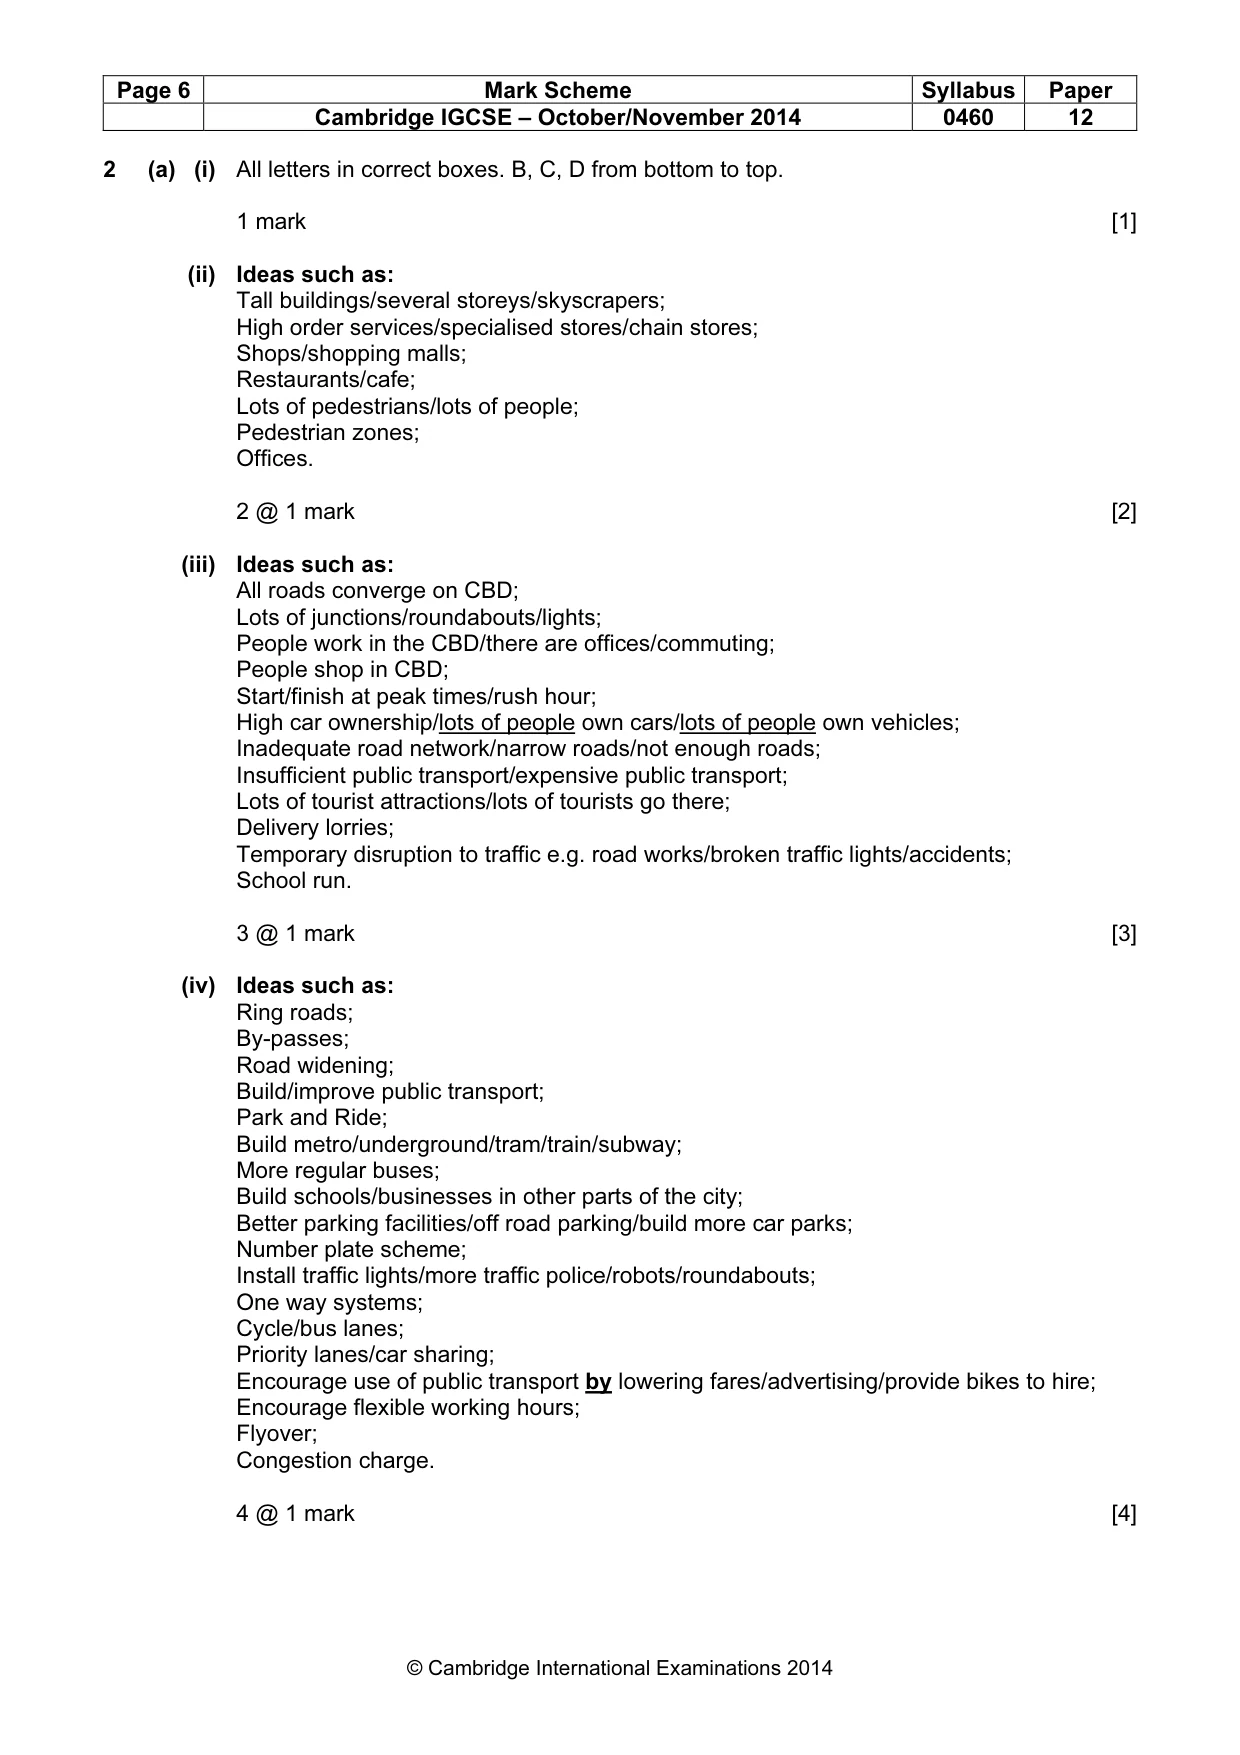
Page 6 Mark Scheme Syllabus Paper Cambridge IGCSE – October/November 2014 0460 12 © Cambridge International Examinations 2014 2 (a) (i) All letters in correct boxes. B, C, D from bottom to top. 1 mark [1] (ii) Ideas such as: Tall buildings/several storeys/skyscrapers; High order services/specialised stores/chain stores; Shops/shopping malls; Restaurants/cafe; Lots of pedestrians/lots of people; Pedestrian zones; Offices. 2 @ 1 mark [2] (iii) Ideas such as: All roads converge on CBD; Lots of junctions/roundabouts/lights; People work in the CBD/there are offices/commuting; People shop in CBD; Start/finish at peak times/rush hour; High car ownership/lots of people own cars/lots of people own vehicles; Inadequate road network/narrow roads/not enough roads; Insufficient public transport/expensive public transport; Lots of tourist attractions/lots of tourists go there; Delivery lorries; Temporary disruption to traffic e.g. road works/broken traffic lights/accidents; School run. 3 @ 1 mark [3] (iv) Ideas such as: Ring roads; By-passes; Road widening; Build/improve public transport; Park and Ride; Build metro/underground/tram/train/subway; More regular buses; Build schools/businesses in other parts of the city; Better parking facilities/off road parking/build more car parks; Number plate scheme; Install traffic lights/more traffic police/robots/roundabouts; One way systems; Cycle/bus lanes; Priority lanes/car sharing; Encourage use of public transport by lowering fares/advertising/provide bikes to hire; Encourage flexible working hours; Flyover; Congestion charge. 4 @ 1 mark [4]
Mark scheme, page 7
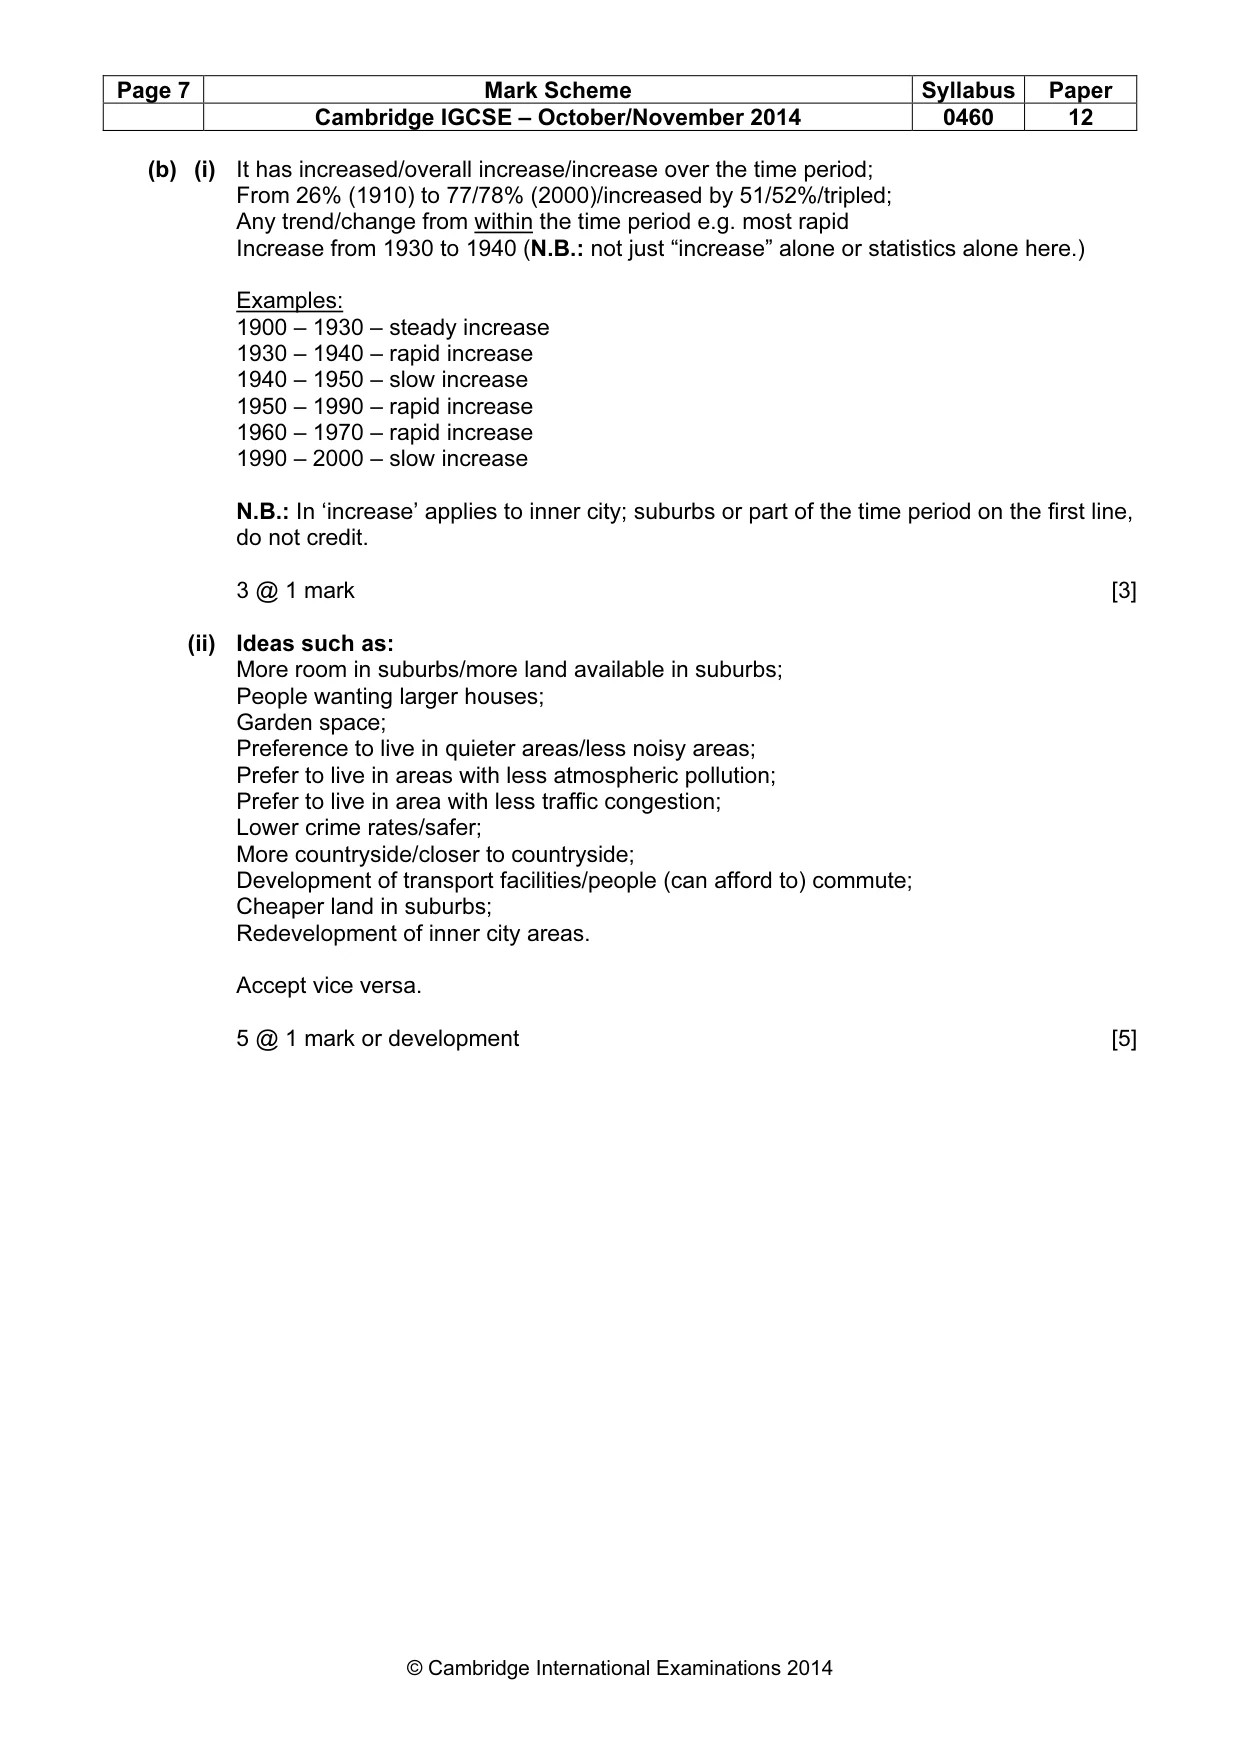
Page 7 Mark Scheme Syllabus Paper Cambridge IGCSE – October/November 2014 0460 12 © Cambridge International Examinations 2014 (b) (i) It has increased/overall increase/increase over the time period; From 26% (1910) to 77/78% (2000)/increased by 51/52%/tripled; Any trend/change from within the time period e.g. most rapid Increase from 1930 to 1940 (N.B.: not just “increase” alone or statistics alone here.) Examples: 1900 – 1930 – steady increase 1930 – 1940 – rapid increase 1940 – 1950 – slow increase 1950 – 1990 – rapid increase 1960 – 1970 – rapid increase 1990 – 2000 – slow increase N.B.: In ‘increase’ applies to inner city; suburbs or part of the time period on the first line, do not credit. 3 @ 1 mark [3] (ii) Ideas such as: More room in suburbs/more land available in suburbs; People wanting larger houses; Garden space; Preference to live in quieter areas/less noisy areas; Prefer to live in areas with less atmospheric pollution; Prefer to live in area with less traffic congestion; Lower crime rates/safer; More countryside/closer to countryside; Development of transport facilities/people (can afford to) commute; Cheaper land in suburbs; Redevelopment of inner city areas. Accept vice versa. 5 @ 1 mark or development [5]
Mark scheme, page 8
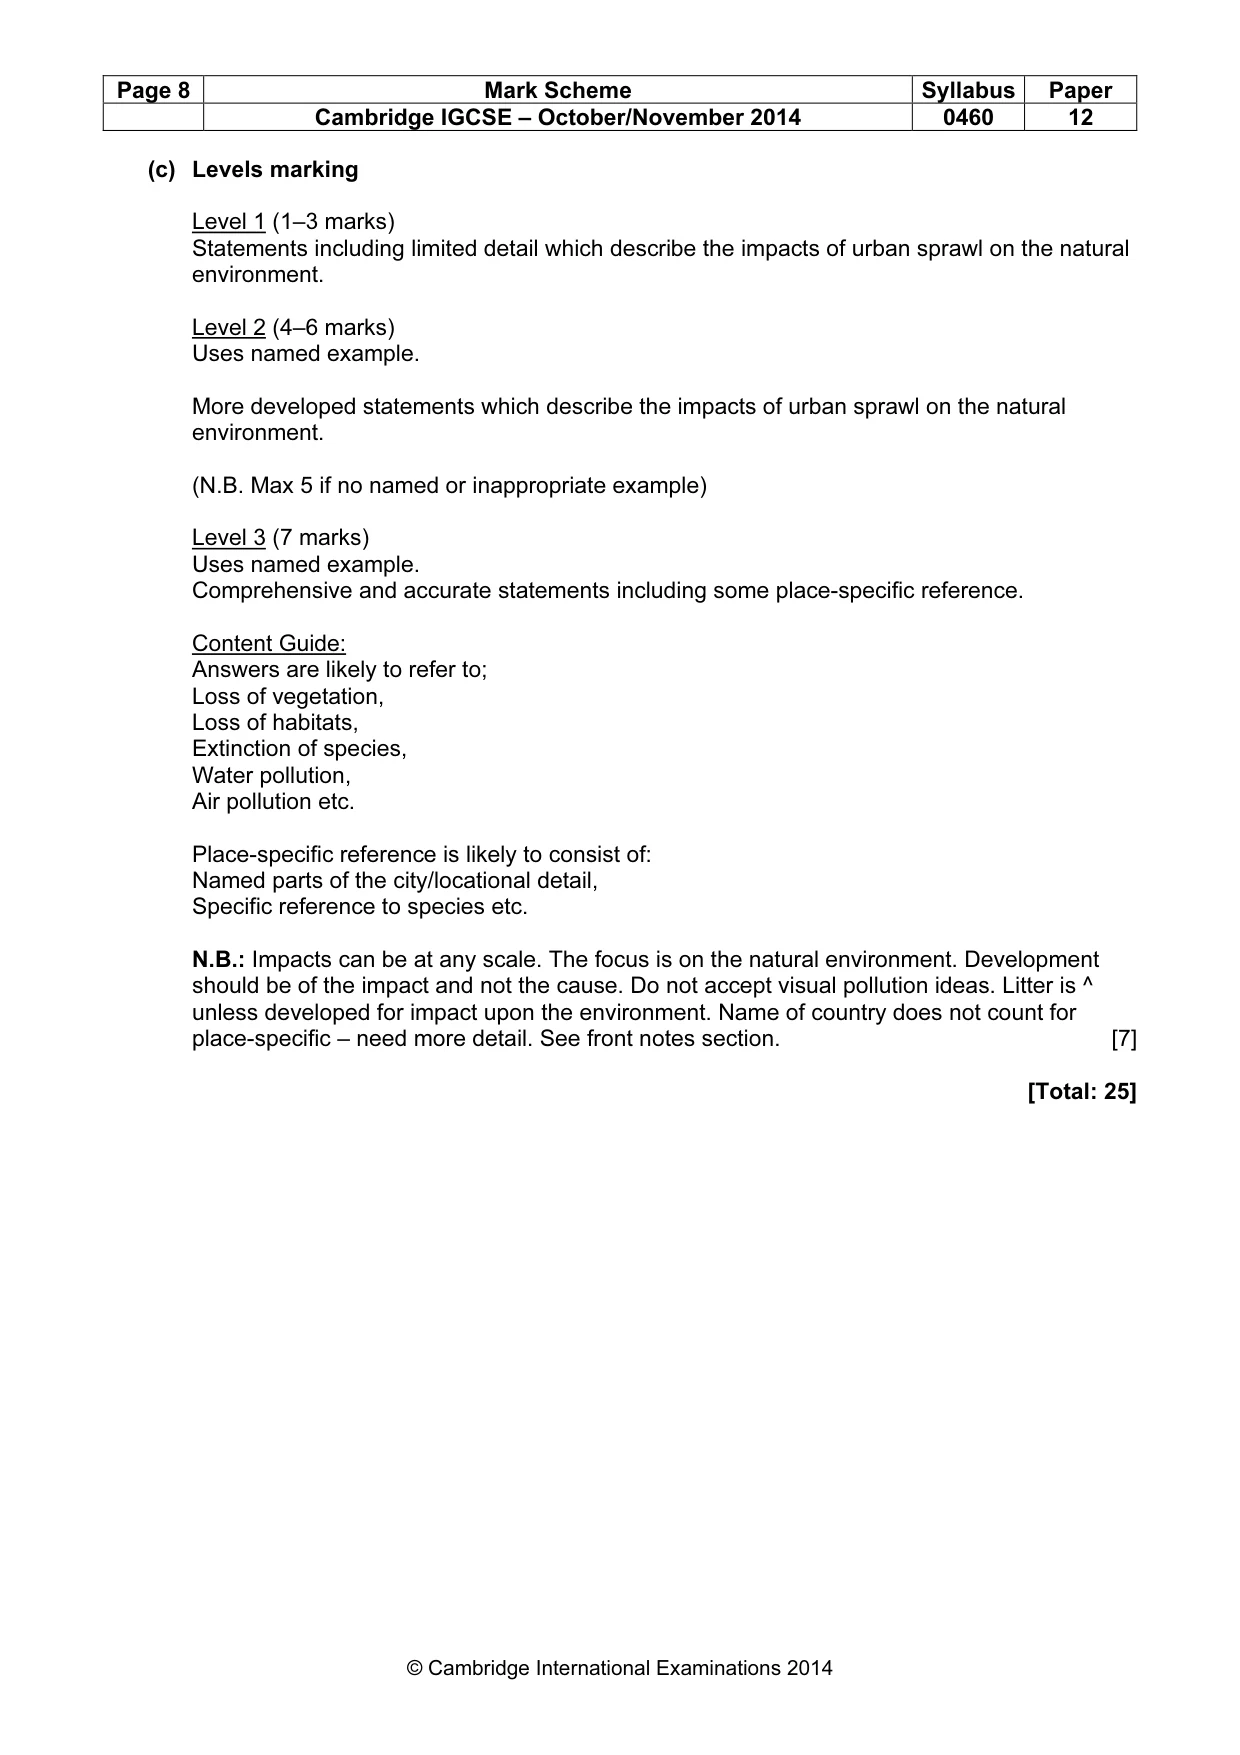
Page 8 Mark Scheme Syllabus Paper Cambridge IGCSE – October/November 2014 0460 12 © Cambridge International Examinations 2014 (c) Levels marking Level 1 (1–3 marks) Statements including limited detail which describe the impacts of urban sprawl on the natural environment. Level 2 (4–6 marks) Uses named example. More developed statements which describe the impacts of urban sprawl on the natural environment. (N.B. Max 5 if no named or inappropriate example) Level 3 (7 marks) Uses named example. Comprehensive and accurate statements including some place-specific reference. Content Guide: Answers are likely to refer to; Loss of vegetation, Loss of habitats, Extinction of species, Water pollution, Air pollution etc. Place-specific reference is likely to consist of: Named parts of the city/locational detail, Specific reference to species etc. N.B.: Impacts can be at any scale. The focus is on the natural environment. Development should be of the impact and not the cause. Do not accept visual pollution ideas. Litter is ^ unless developed for impact upon the environment. Name of country does not count for place-specific – need more detail. See front notes section. [7] [Total: 25]
Mark scheme, page 9
Page 9 Mark Scheme Syllabus Paper Cambridge IGCSE – October/November 2014 0460 12 © Cambridge International Examinations 2014 3 (a) (i) 120 – 130 metres – accept any figure within range given. 1 mark [1] (ii) Entrance = limestone – mark first in list Back = chalk – mark first in list 2 @ 1 mark [2] (iii) Ideas such as; Limestone eroded/limestone eroded by named process of erosion; Opens up line of weakness/fault in limestone/cave develops; Clay/soft/non-resistant rock eroded (to form cove/bay). N.B.: Must name type of rock on first line of mark scheme. 3 @ 1 mark [3] (iv) Ideas such as: Areas of beautiful scenery/good views/enjoy the scenery; Use by tourists/for leisure activities or example/income from tourism; Hiking/coastal paths; Fishing industry; Development of harbours/ports; People live there/residential/retirement. 4 @ 1 mark [4] (b) (i) Ideas such as; Bare rock/rocky/resistant/hard; Tall/great height; Narrow/narrower at base/wider at top/notch at bottom; Surrounded by sea/separate from main coastline; Layers of rock/sedimentary. 3 @ 1 mark [3] (ii) Ideas such as: Erosion or named process or description of process; (Max 1) Line of weakness/fault opened up; Cave formed; Due to erosion of back to back caves/cave erodes through headland; Natural arch developed; Weathering/further erosion/cannot hold weight; Collapse of arch; Stack remains isolated from cliff etc. N.B.: Credit appropriate points on the diagram but do not double credit. 5 @ 1 mark or development [5]
Mark scheme, page 10
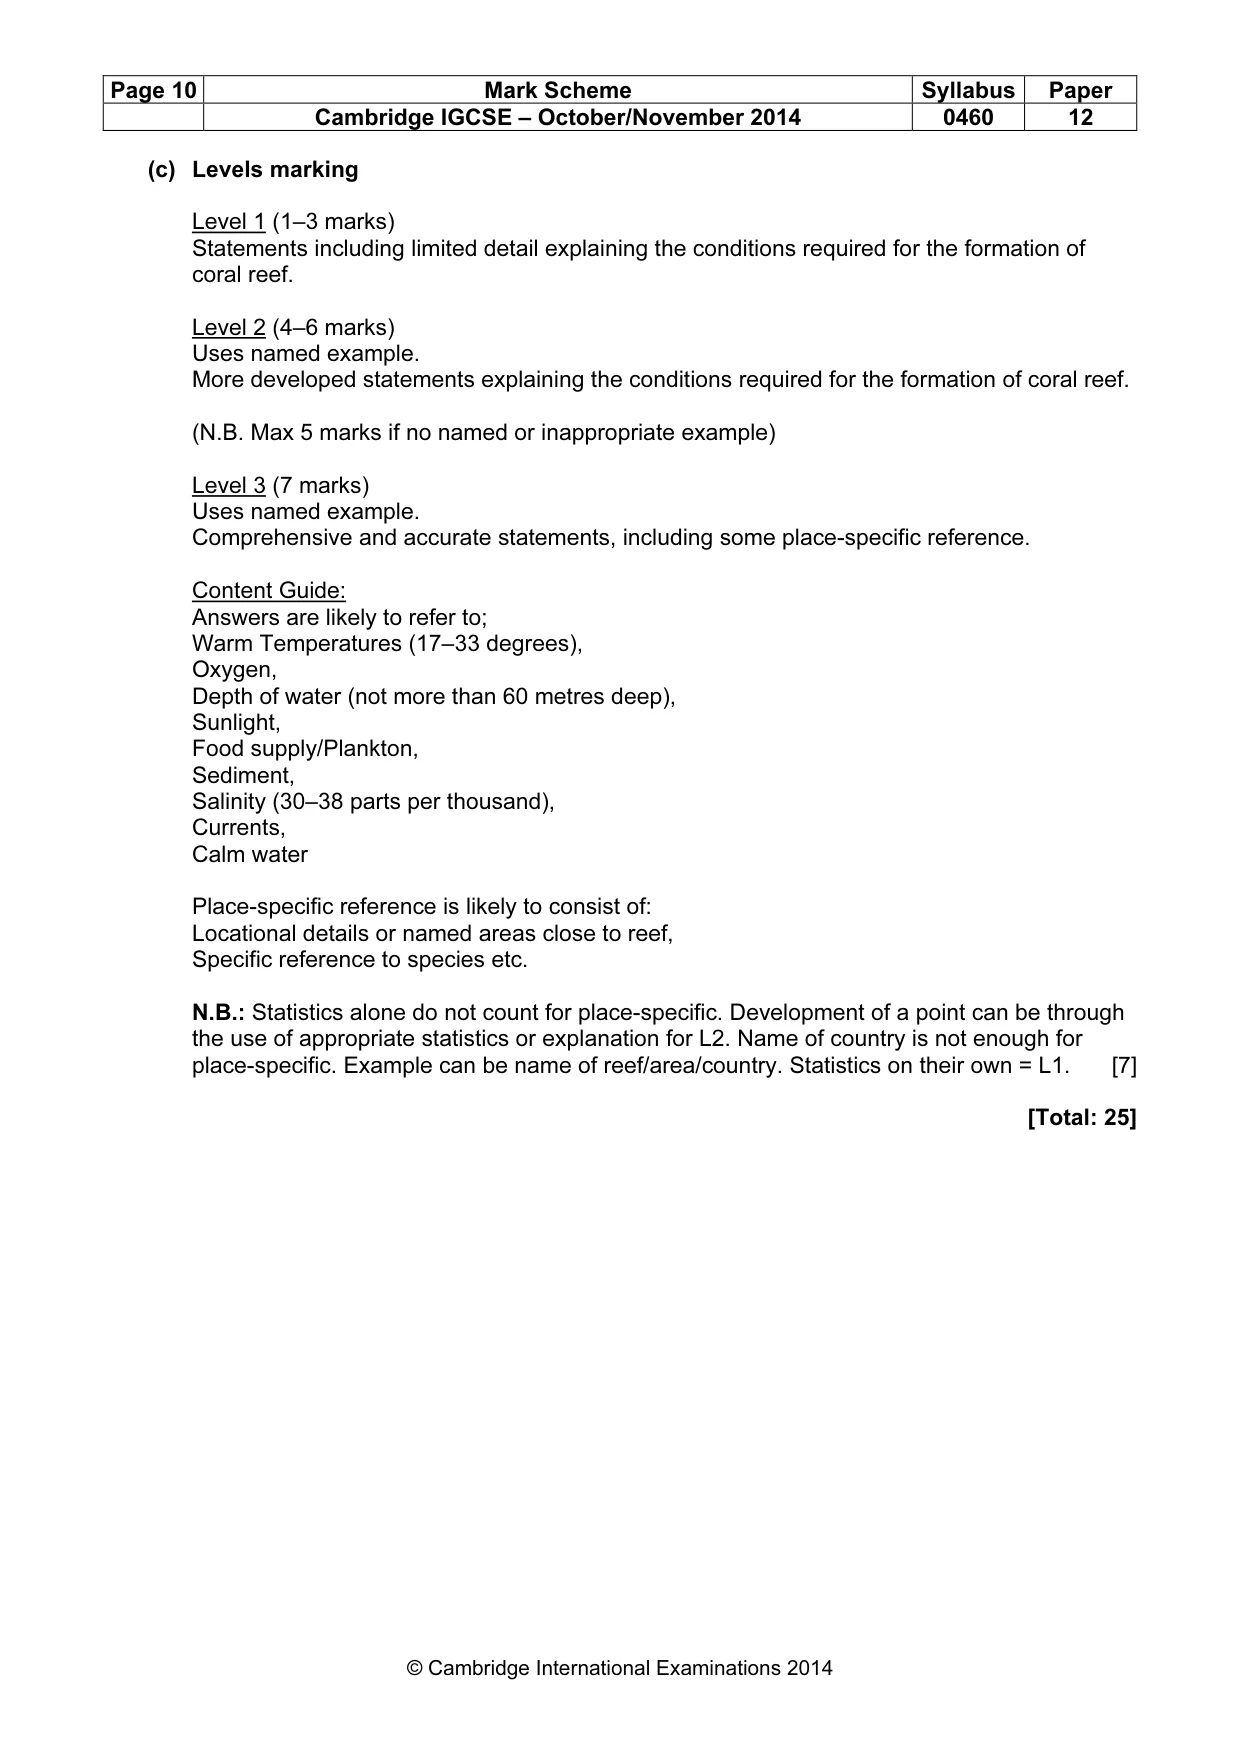
Page 10 Mark Scheme Syllabus Paper Cambridge IGCSE – October/November 2014 0460 12 © Cambridge International Examinations 2014 (c) Levels marking Level 1 (1–3 marks) Statements including limited detail explaining the conditions required for the formation of coral reef. Level 2 (4–6 marks) Uses named example. More developed statements explaining the conditions required for the formation of coral reef. (N.B. Max 5 marks if no named or inappropriate example) Level 3 (7 marks) Uses named example. Comprehensive and accurate statements, including some place-specific reference. Content Guide: Answers are likely to refer to; Warm Temperatures (17–33 degrees), Oxygen, Depth of water (not more than 60 metres deep), Sunlight, Food supply/Plankton, Sediment, Salinity (30–38 parts per thousand), Currents, Calm water Place-specific reference is likely to consist of: Locational details or named areas close to reef, Specific reference to species etc. N.B.: Statistics alone do not count for place-specific. Development of a point can be through the use of appropriate statistics or explanation for L2. Name of country is not enough for place-specific. Example can be name of reef/area/country. Statistics on their own = L1. [7] [Total: 25]
Mark scheme, page 11
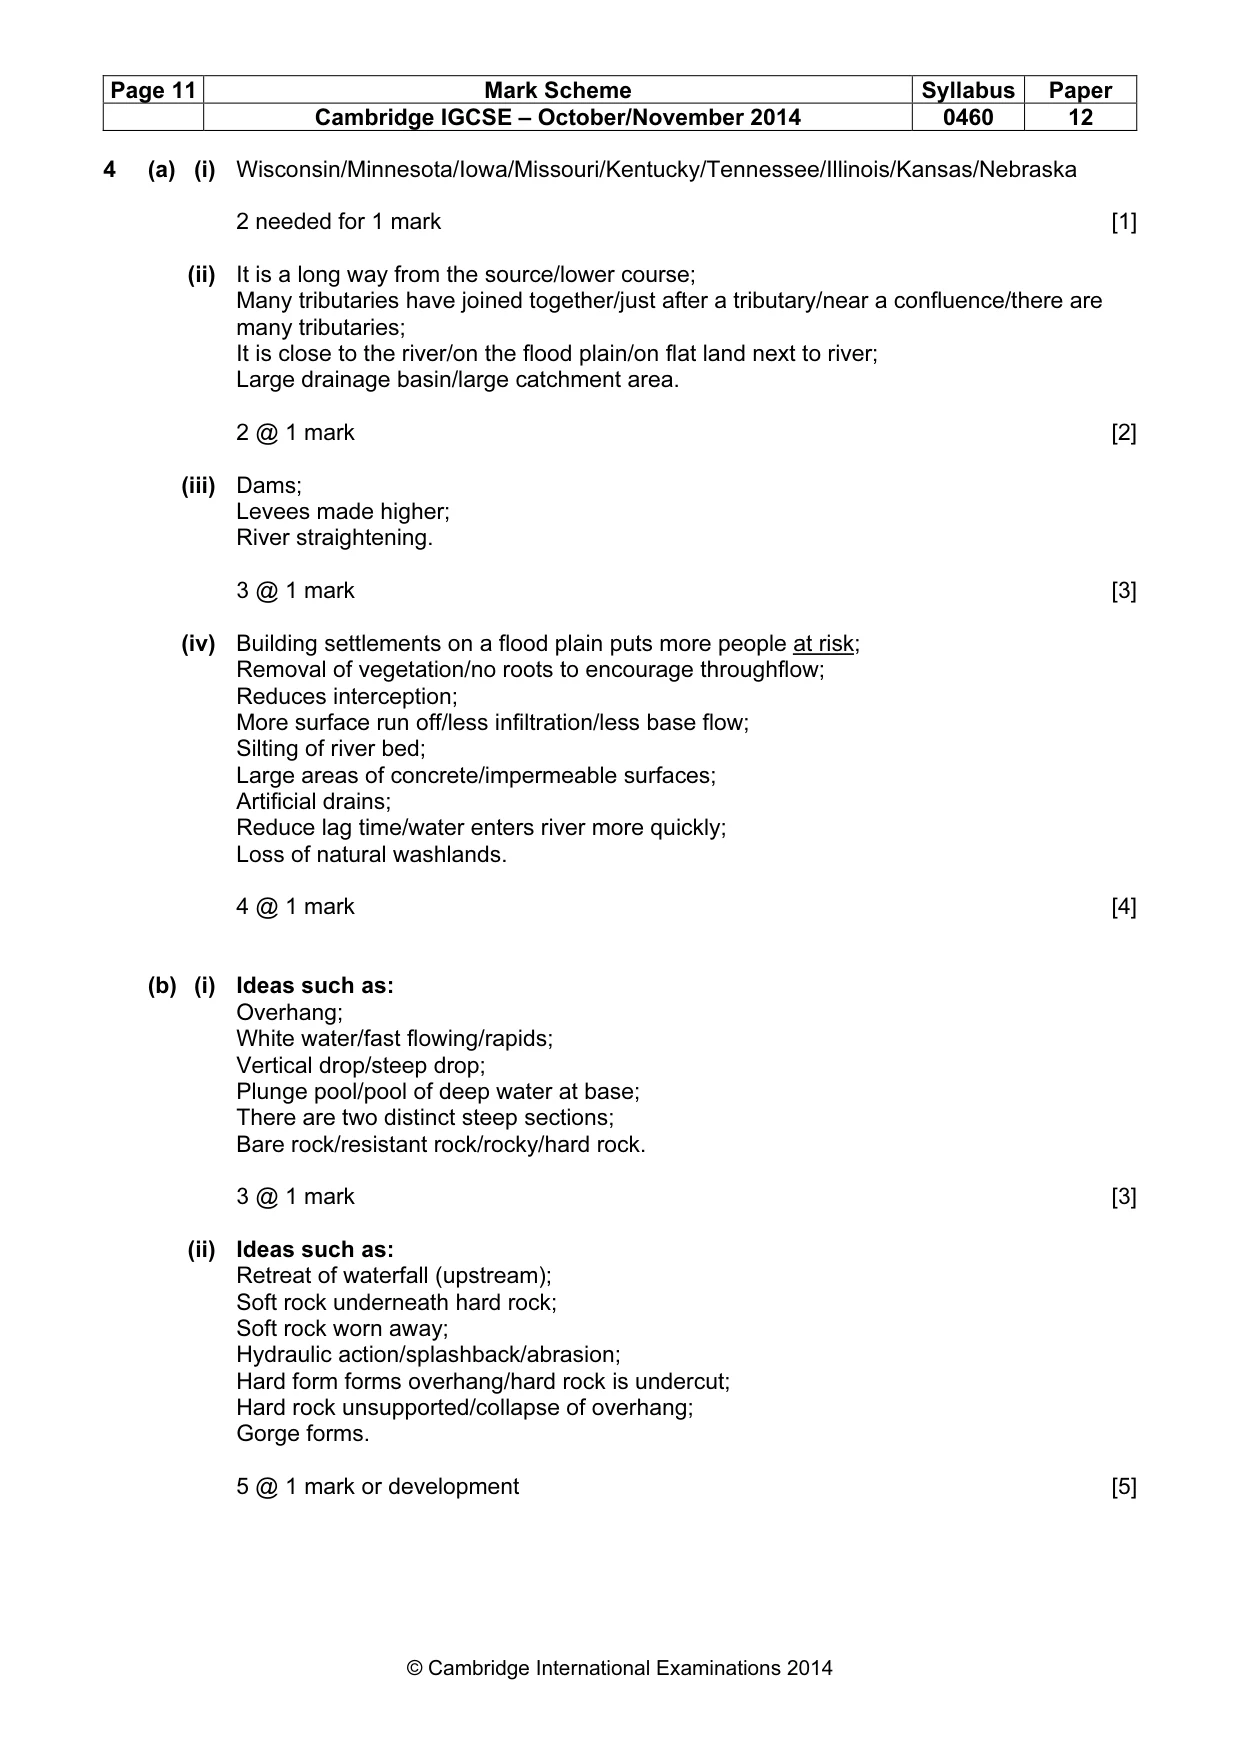
Page 11 Mark Scheme Syllabus Paper Cambridge IGCSE – October/November 2014 0460 12 © Cambridge International Examinations 2014 4 (a) (i) Wisconsin/Minnesota/Iowa/Missouri/Kentucky/Tennessee/Illinois/Kansas/Nebraska 2 needed for 1 mark [1] (ii) It is a long way from the source/lower course; Many tributaries have joined together/just after a tributary/near a confluence/there are many tributaries; It is close to the river/on the flood plain/on flat land next to river; Large drainage basin/large catchment area. 2 @ 1 mark [2] (iii) Dams; Levees made higher; River straightening. 3 @ 1 mark [3] (iv) Building settlements on a flood plain puts more people at risk; Removal of vegetation/no roots to encourage throughflow; Reduces interception; More surface run off/less infiltration/less base flow; Silting of river bed; Large areas of concrete/impermeable surfaces; Artificial drains; Reduce lag time/water enters river more quickly; Loss of natural washlands. 4 @ 1 mark [4] (b) (i) Ideas such as: Overhang; White water/fast flowing/rapids; Vertical drop/steep drop; Plunge pool/pool of deep water at base; There are two distinct steep sections; Bare rock/resistant rock/rocky/hard rock. 3 @ 1 mark [3] (ii) Ideas such as: Retreat of waterfall (upstream); Soft rock underneath hard rock; Soft rock worn away; Hydraulic action/splashback/abrasion; Hard form forms overhang/hard rock is undercut; Hard rock unsupported/collapse of overhang; Gorge forms. 5 @ 1 mark or development [5]
Mark scheme, page 12
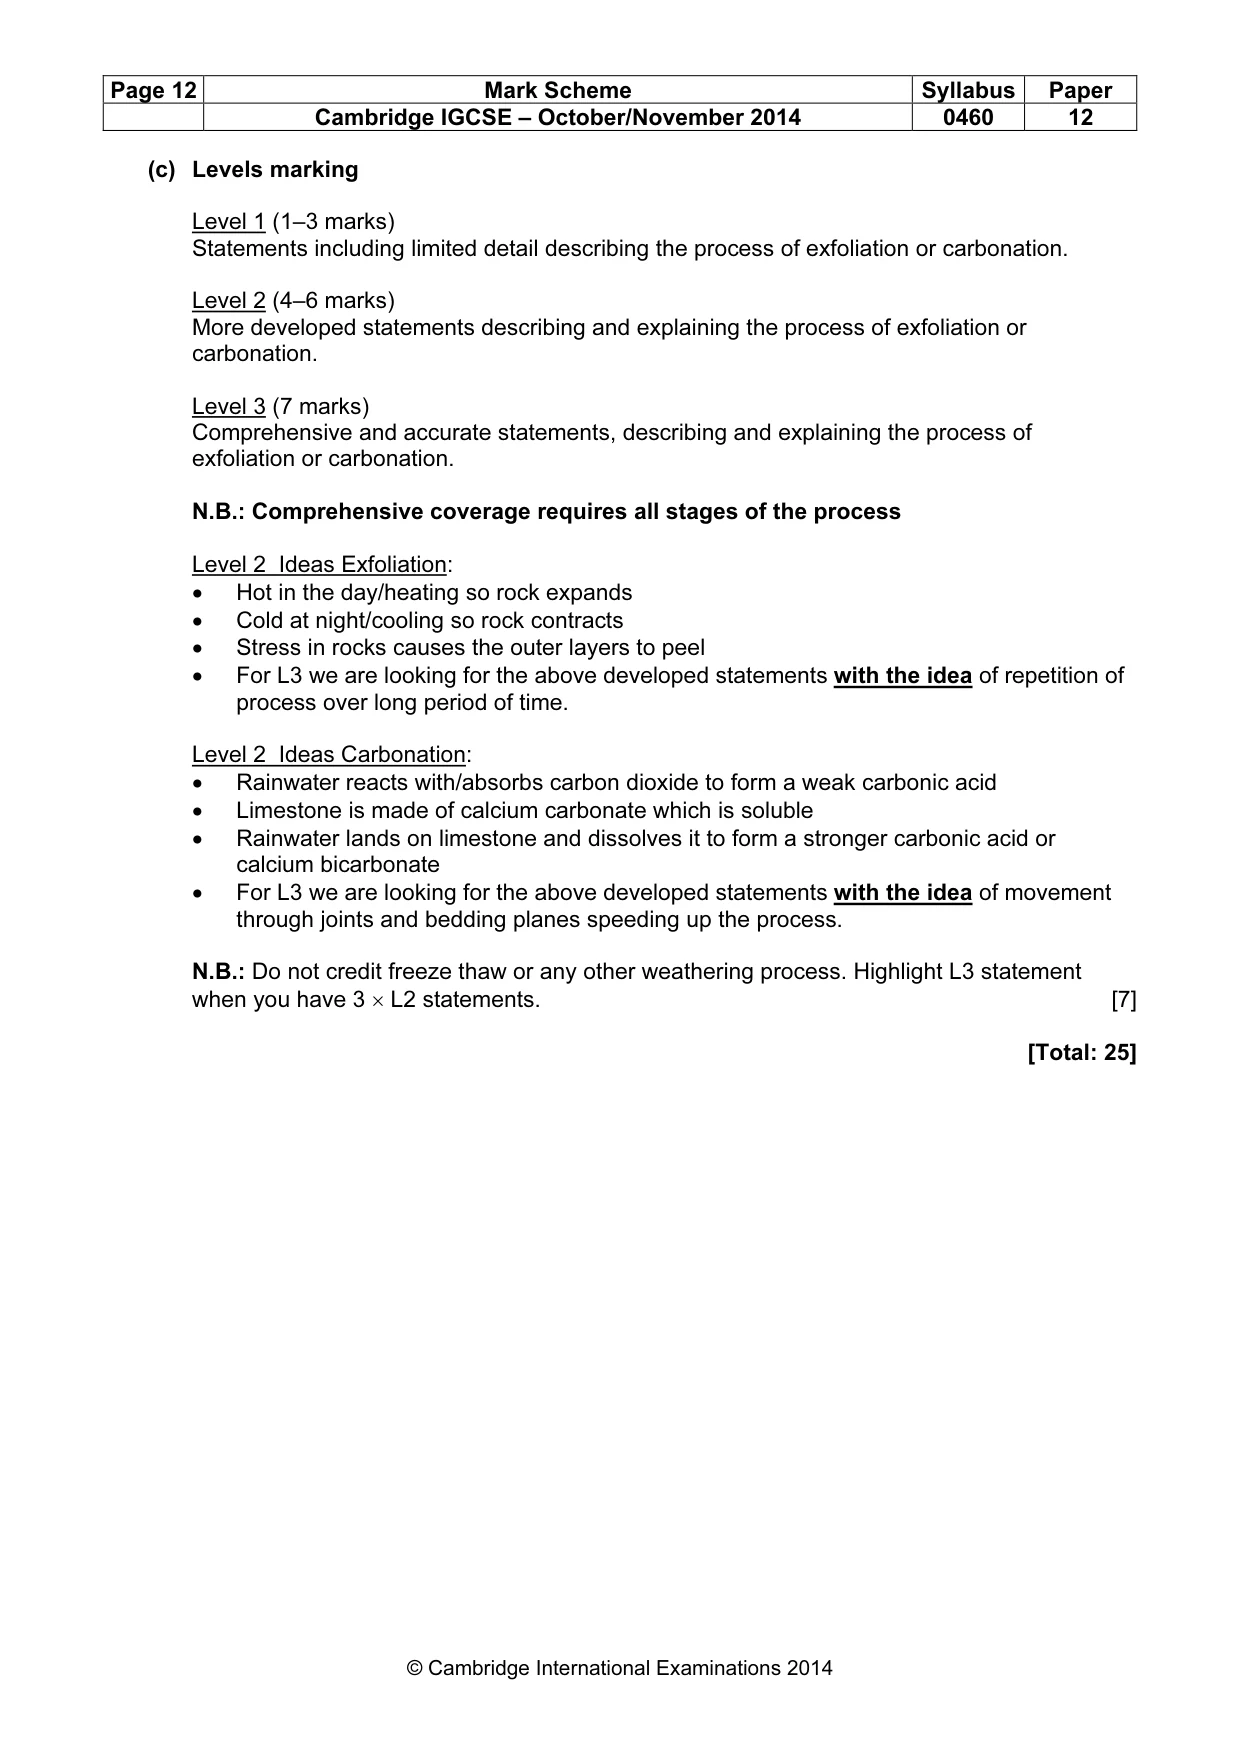
Page 12 Mark Scheme Syllabus Paper Cambridge IGCSE – October/November 2014 0460 12 © Cambridge International Examinations 2014 (c) Levels marking Level 1 (1–3 marks) Statements including limited detail describing the process of exfoliation or carbonation. Level 2 (4–6 marks) More developed statements describing and explaining the process of exfoliation or carbonation. Level 3 (7 marks) Comprehensive and accurate statements, describing and explaining the process of exfoliation or carbonation. N.B.: Comprehensive coverage requires all stages of the process Level 2 Ideas Exfoliation: • Hot in the day/heating so rock expands • Cold at night/cooling so rock contracts • Stress in rocks causes the outer layers to peel • For L3 we are looking for the above developed statements with the idea of repetition of process over long period of time. Level 2 Ideas Carbonation: • Rainwater reacts with/absorbs carbon dioxide to form a weak carbonic acid • Limestone is made of calcium carbonate which is soluble • Rainwater lands on limestone and dissolves it to form a stronger carbonic acid or calcium bicarbonate • For L3 we are looking for the above developed statements with the idea of movement through joints and bedding planes speeding up the process. N.B.: Do not credit freeze thaw or any other weathering process. Highlight L3 statement when you have 3 × L2 statements. [7] [Total: 25]
Mark scheme, page 13
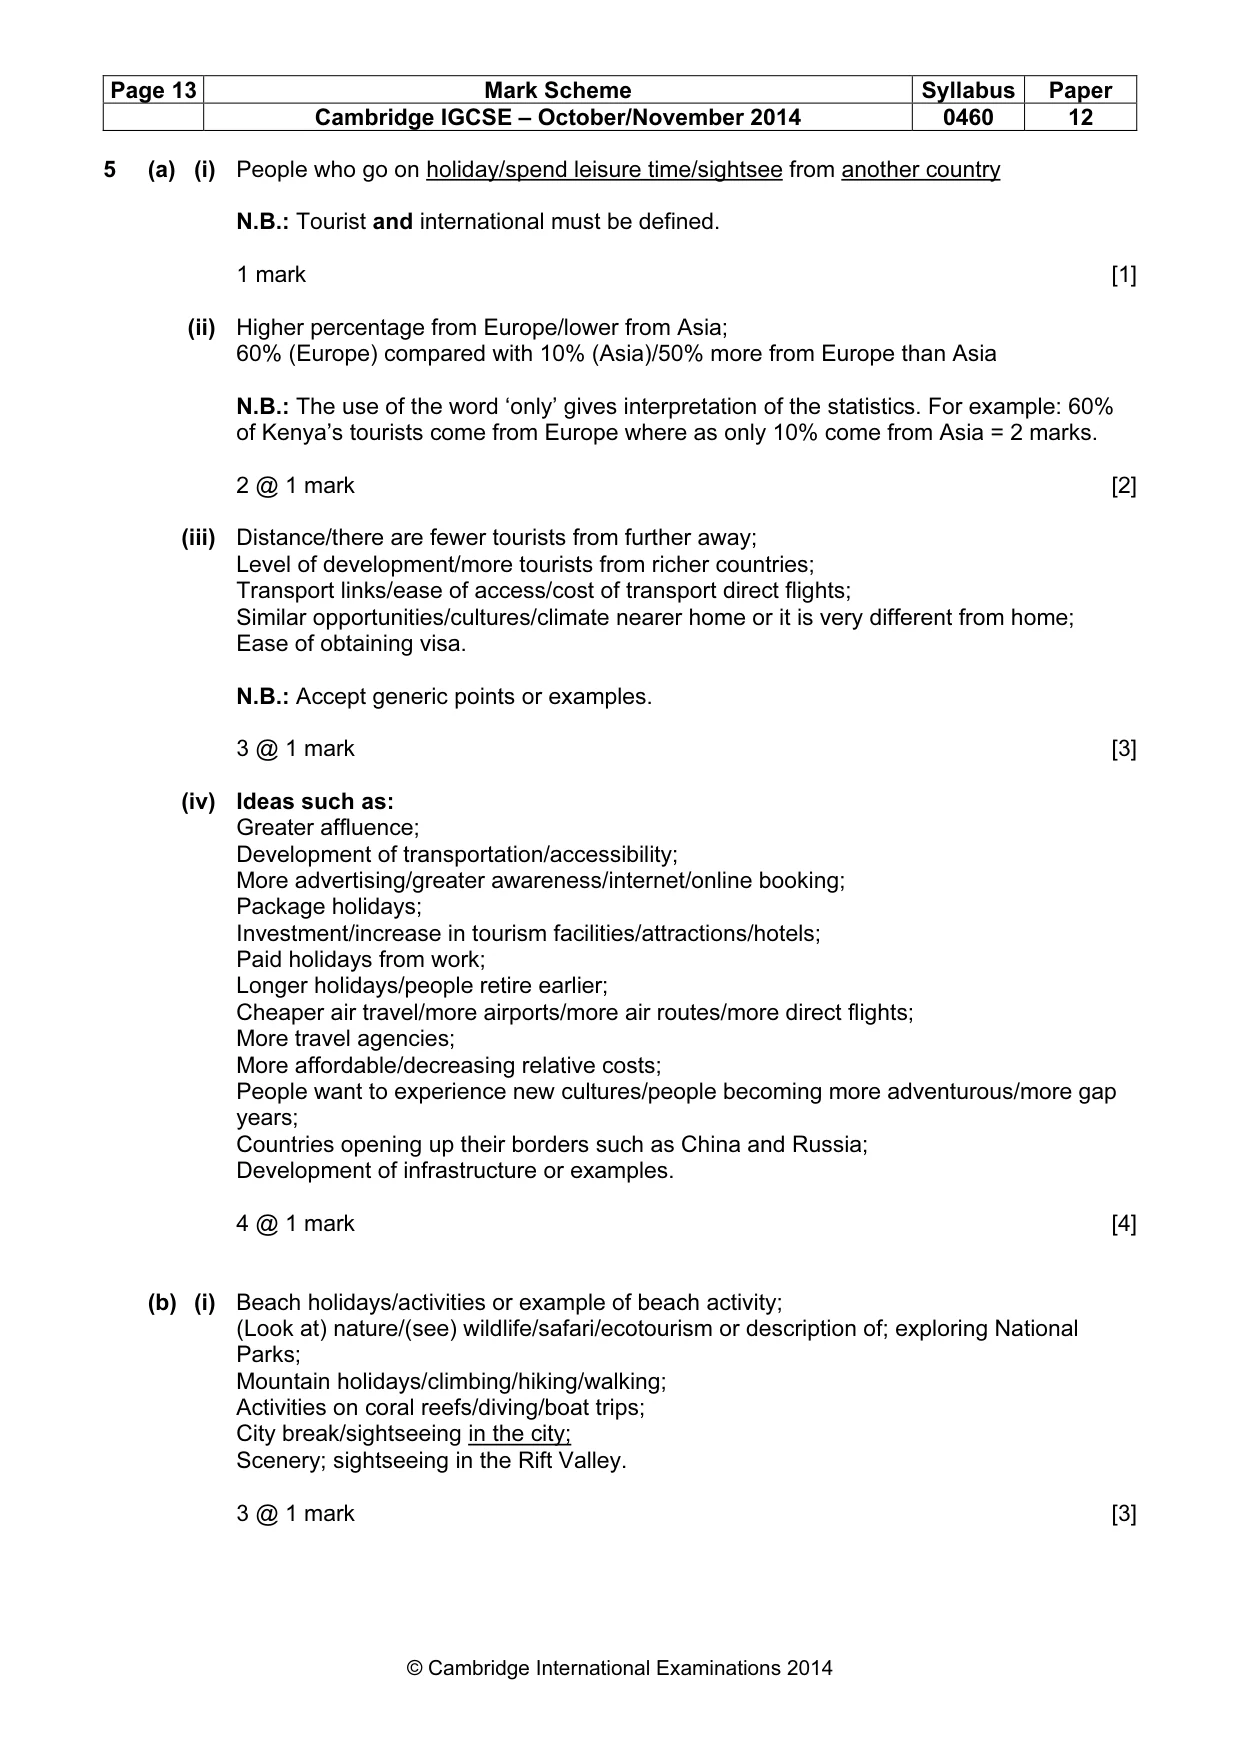
Page 13 Mark Scheme Syllabus Paper Cambridge IGCSE – October/November 2014 0460 12 © Cambridge International Examinations 2014 5 (a) (i) People who go on holiday/spend leisure time/sightsee from another country N.B.: Tourist and international must be defined. 1 mark [1] (ii) Higher percentage from Europe/lower from Asia; 60% (Europe) compared with 10% (Asia)/50% more from Europe than Asia N.B.: The use of the word ‘only’ gives interpretation of the statistics. For example: 60% of Kenya’s tourists come from Europe where as only 10% come from Asia = 2 marks. 2 @ 1 mark [2] (iii) Distance/there are fewer tourists from further away; Level of development/more tourists from richer countries; Transport links/ease of access/cost of transport direct flights; Similar opportunities/cultures/climate nearer home or it is very different from home; Ease of obtaining visa. N.B.: Accept generic points or examples. 3 @ 1 mark [3] (iv) Ideas such as: Greater affluence; Development of transportation/accessibility; More advertising/greater awareness/internet/online booking; Package holidays; Investment/increase in tourism facilities/attractions/hotels; Paid holidays from work; Longer holidays/people retire earlier; Cheaper air travel/more airports/more air routes/more direct flights; More travel agencies; More affordable/decreasing relative costs; People want to experience new cultures/people becoming more adventurous/more gap years; Countries opening up their borders such as China and Russia; Development of infrastructure or examples. 4 @ 1 mark [4] (b) (i) Beach holidays/activities or example of beach activity; (Look at) nature/(see) wildlife/safari/ecotourism or description of; exploring National Parks; Mountain holidays/climbing/hiking/walking; Activities on coral reefs/diving/boat trips; City break/sightseeing in the city; Scenery; sightseeing in the Rift Valley. 3 @ 1 mark [3]
Mark scheme, page 14
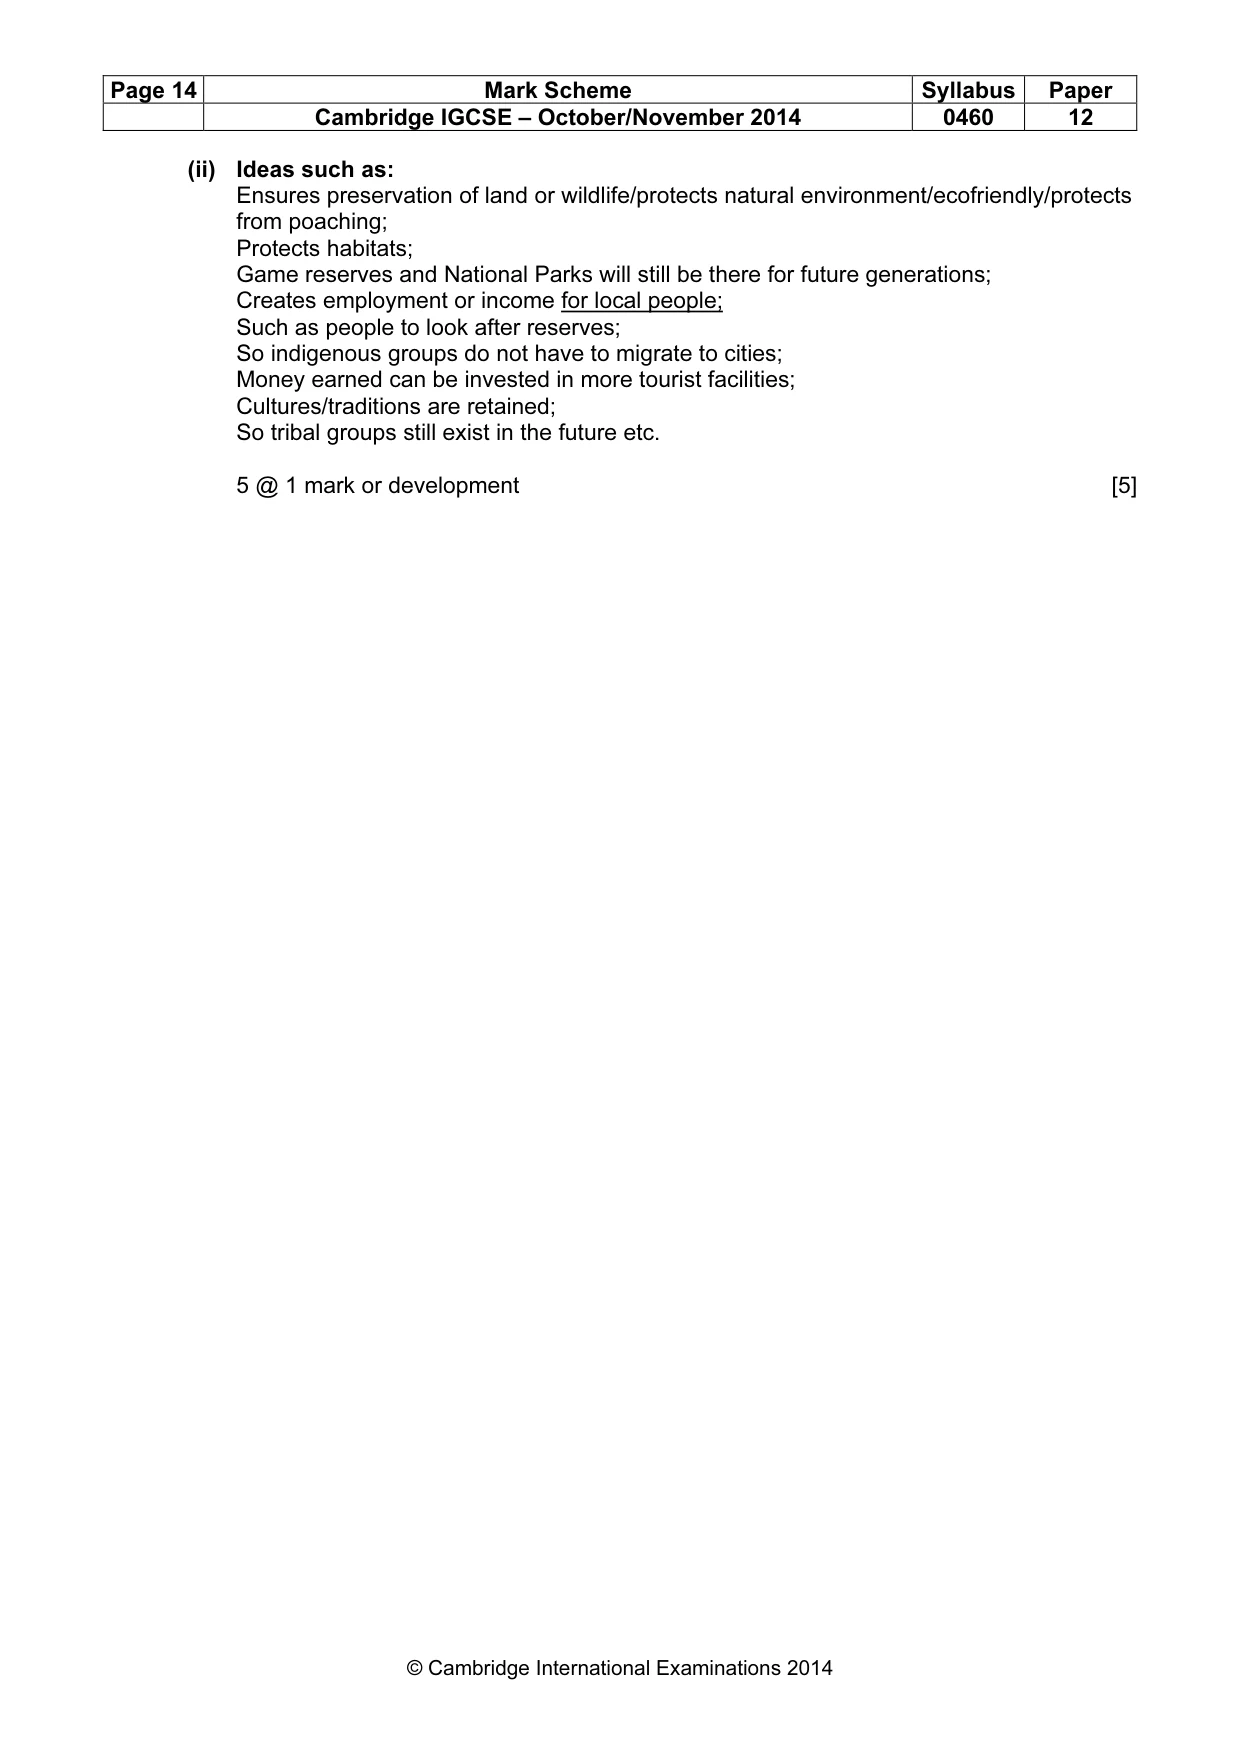
Page 14 Mark Scheme Syllabus Paper Cambridge IGCSE – October/November 2014 0460 12 © Cambridge International Examinations 2014 (ii) Ideas such as: Ensures preservation of land or wildlife/protects natural environment/ecofriendly/protects from poaching; Protects habitats; Game reserves and National Parks will still be there for future generations; Creates employment or income for local people; Such as people to look after reserves; So indigenous groups do not have to migrate to cities; Money earned can be invested in more tourist facilities; Cultures/traditions are retained; So tribal groups still exist in the future etc. 5 @ 1 mark or development [5]
Mark scheme, page 15
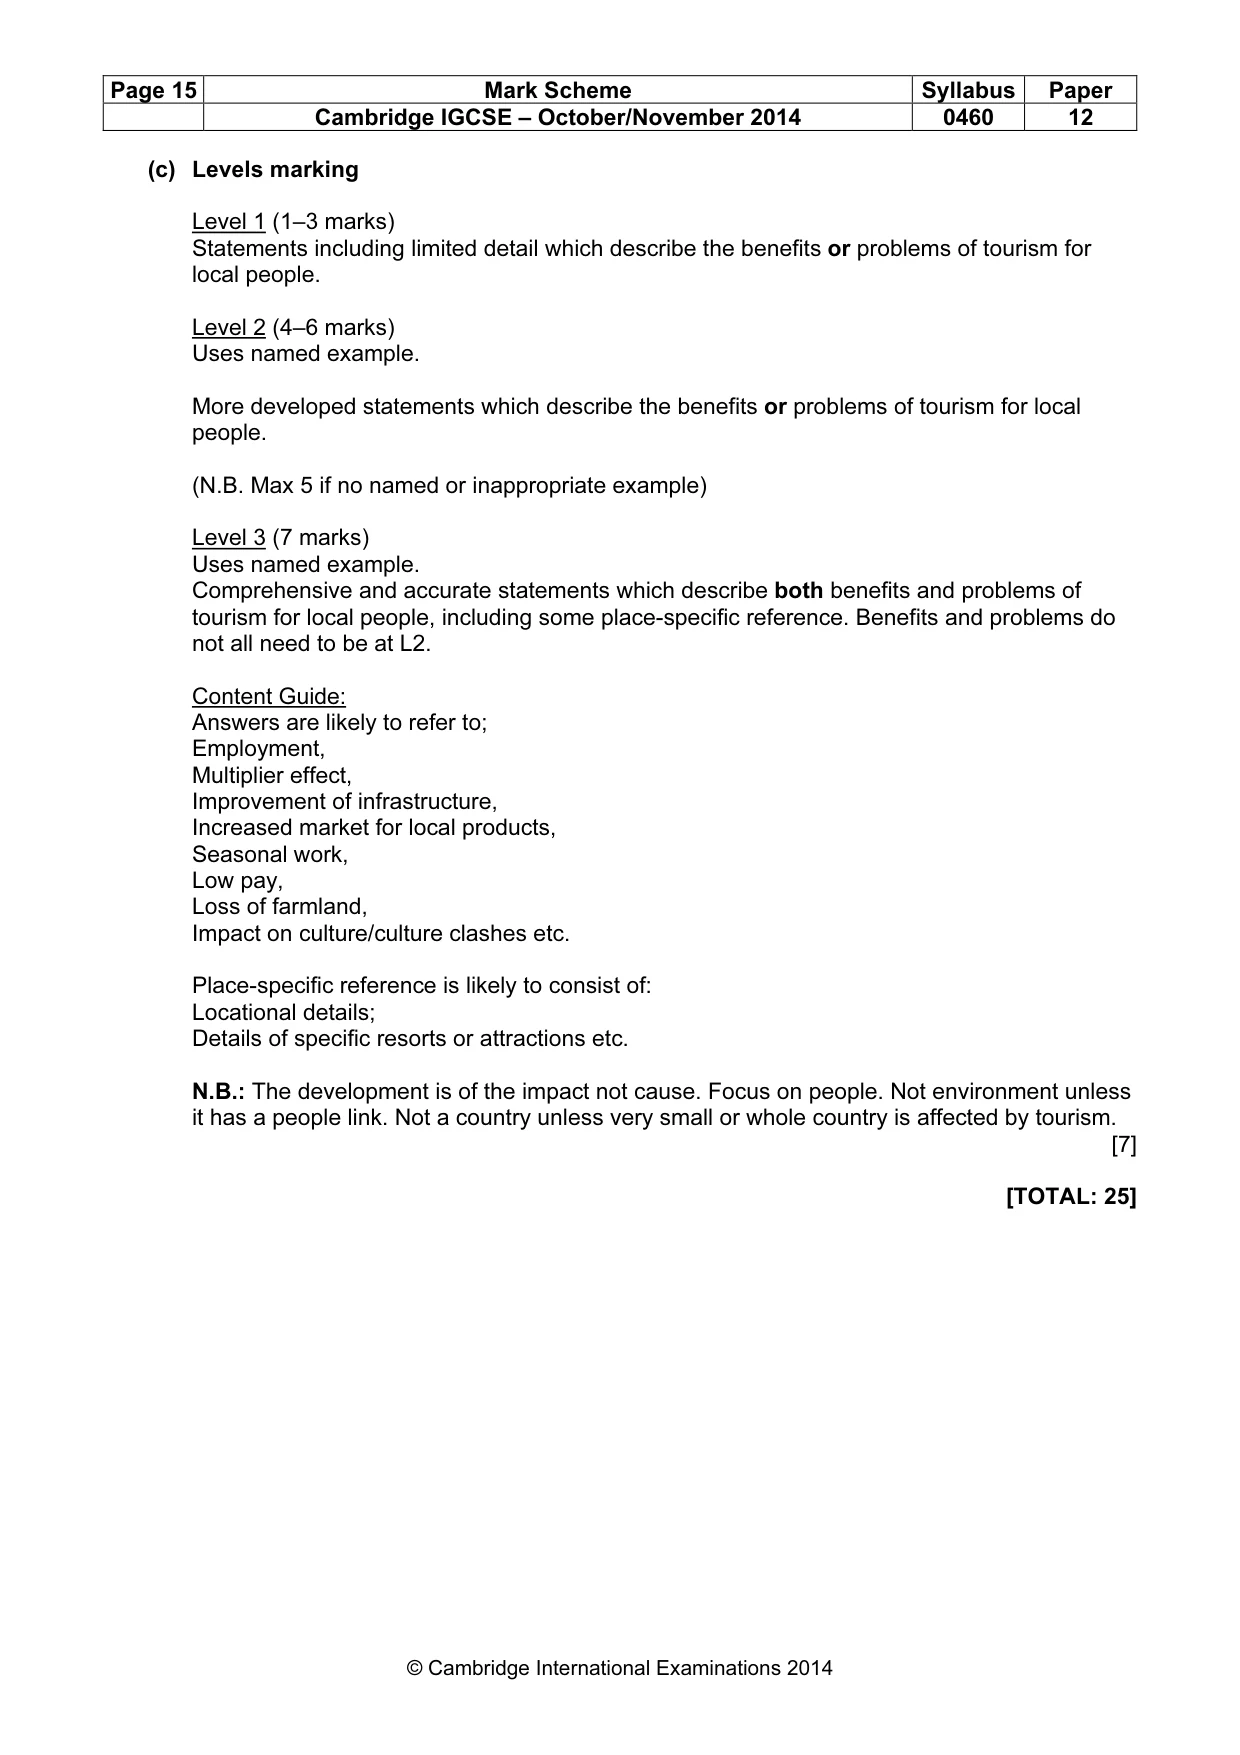
Page 15 Mark Scheme Syllabus Paper Cambridge IGCSE – October/November 2014 0460 12 © Cambridge International Examinations 2014 (c) Levels marking Level 1 (1–3 marks) Statements including limited detail which describe the benefits or problems of tourism for local people. Level 2 (4–6 marks) Uses named example. More developed statements which describe the benefits or problems of tourism for local people. (N.B. Max 5 if no named or inappropriate example) Level 3 (7 marks) Uses named example. Comprehensive and accurate statements which describe both benefits and problems of tourism for local people, including some place-specific reference. Benefits and problems do not all need to be at L2. Content Guide: Answers are likely to refer to; Employment, Multiplier effect, Improvement of infrastructure, Increased market for local products, Seasonal work, Low pay, Loss of farmland, Impact on culture/culture clashes etc. Place-specific reference is likely to consist of: Locational details; Details of specific resorts or attractions etc. N.B.: The development is of the impact not cause. Focus on people. Not environment unless it has a people link. Not a country unless very small or whole country is affected by tourism. [7] [TOTAL: 25]
Mark scheme, page 16
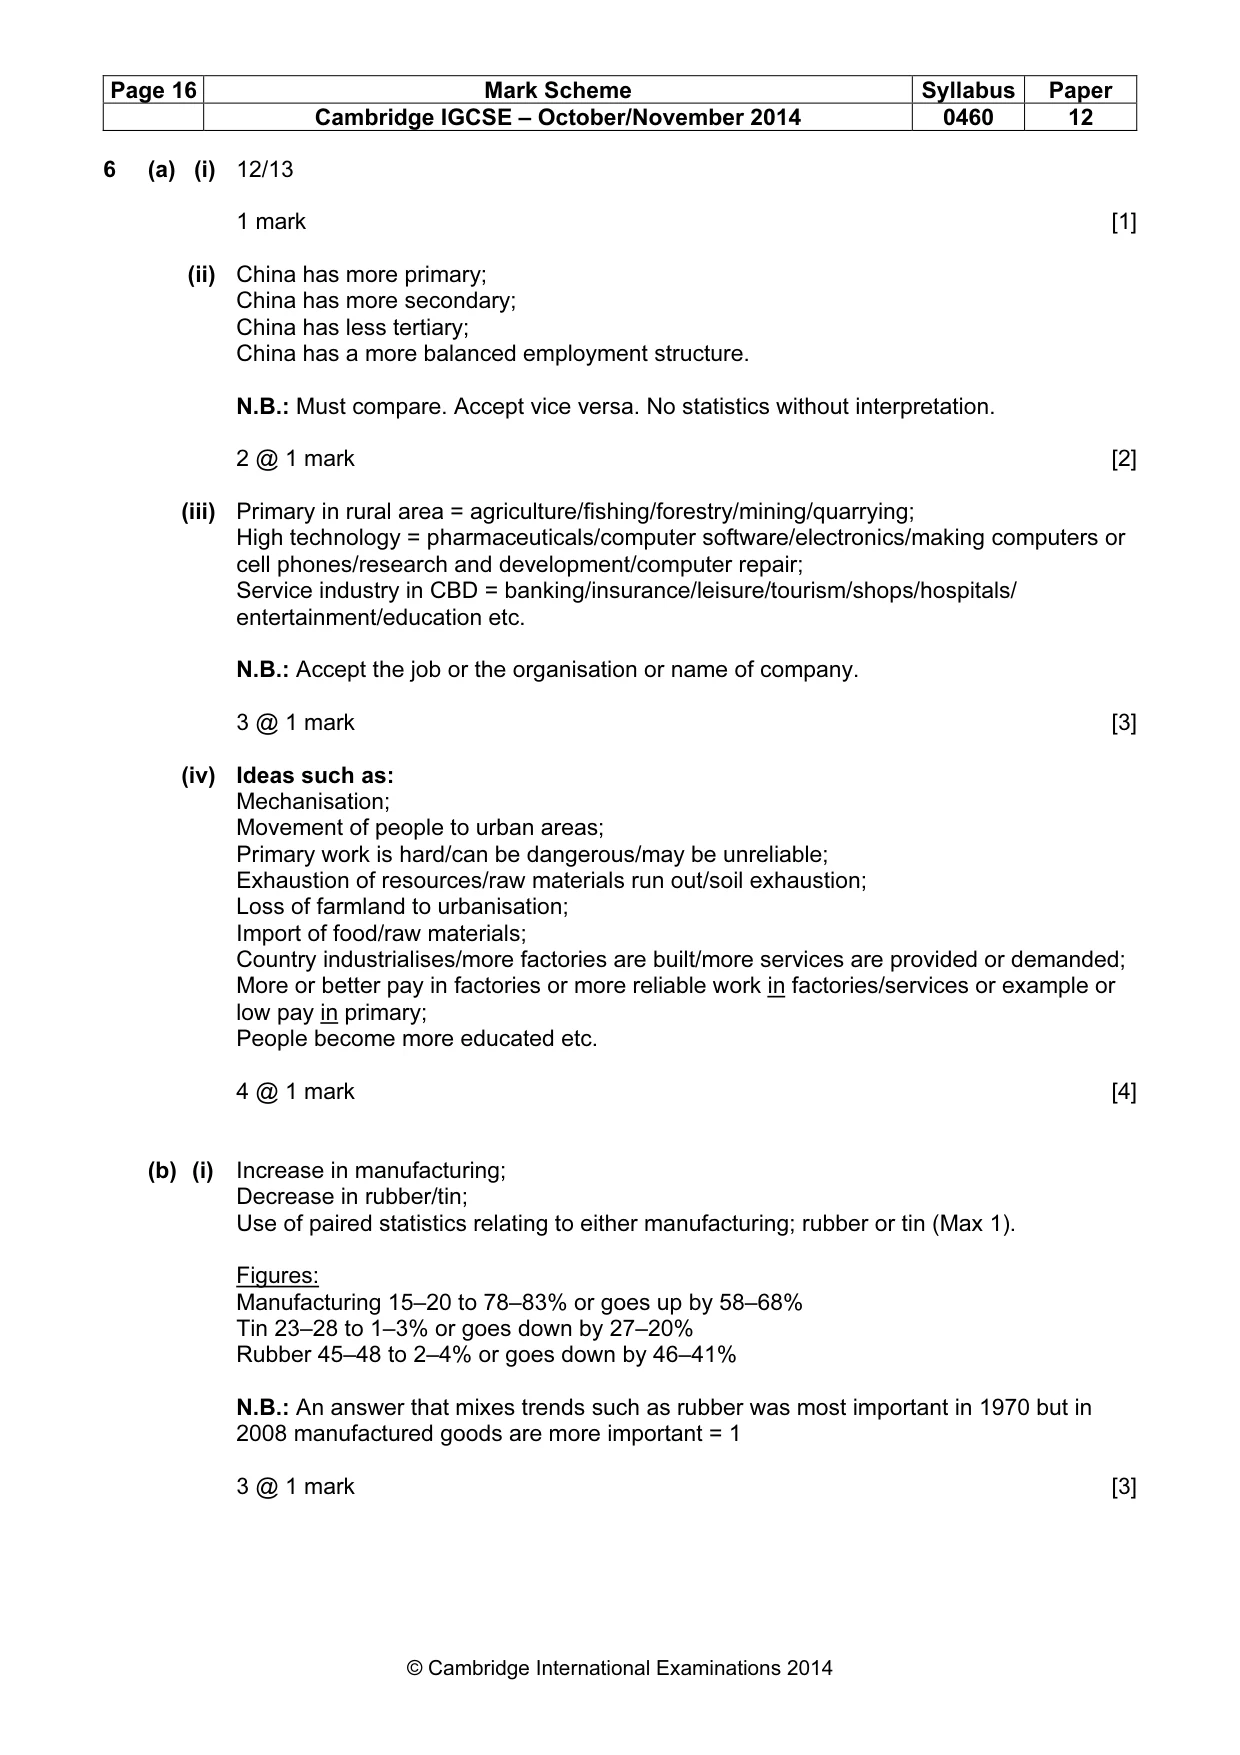
Page 16 Mark Scheme Syllabus Paper Cambridge IGCSE – October/November 2014 0460 12 © Cambridge International Examinations 2014 6 (a) (i) 12/13 1 mark [1] (ii) China has more primary; China has more secondary; China has less tertiary; China has a more balanced employment structure. N.B.: Must compare. Accept vice versa. No statistics without interpretation. 2 @ 1 mark [2] (iii) Primary in rural area = agriculture/fishing/forestry/mining/quarrying; High technology = pharmaceuticals/computer software/electronics/making computers or cell phones/research and development/computer repair; Service industry in CBD = banking/insurance/leisure/tourism/shops/hospitals/ entertainment/education etc. N.B.: Accept the job or the organisation or name of company. 3 @ 1 mark [3] (iv) Ideas such as: Mechanisation; Movement of people to urban areas; Primary work is hard/can be dangerous/may be unreliable; Exhaustion of resources/raw materials run out/soil exhaustion; Loss of farmland to urbanisation; Import of food/raw materials; Country industrialises/more factories are built/more services are provided or demanded; More or better pay in factories or more reliable work in factories/services or example or low pay in primary; People become more educated etc. 4 @ 1 mark [4] (b) (i) Increase in manufacturing; Decrease in rubber/tin; Use of paired statistics relating to either manufacturing; rubber or tin (Max 1). Figures: Manufacturing 15–20 to 78–83% or goes up by 58–68% Tin 23–28 to 1–3% or goes down by 27–20% Rubber 45–48 to 2–4% or goes down by 46–41% N.B.: An answer that mixes trends such as rubber was most important in 1970 but in 2008 manufactured goods are more important = 1 3 @ 1 mark [3]
Mark scheme, page 17
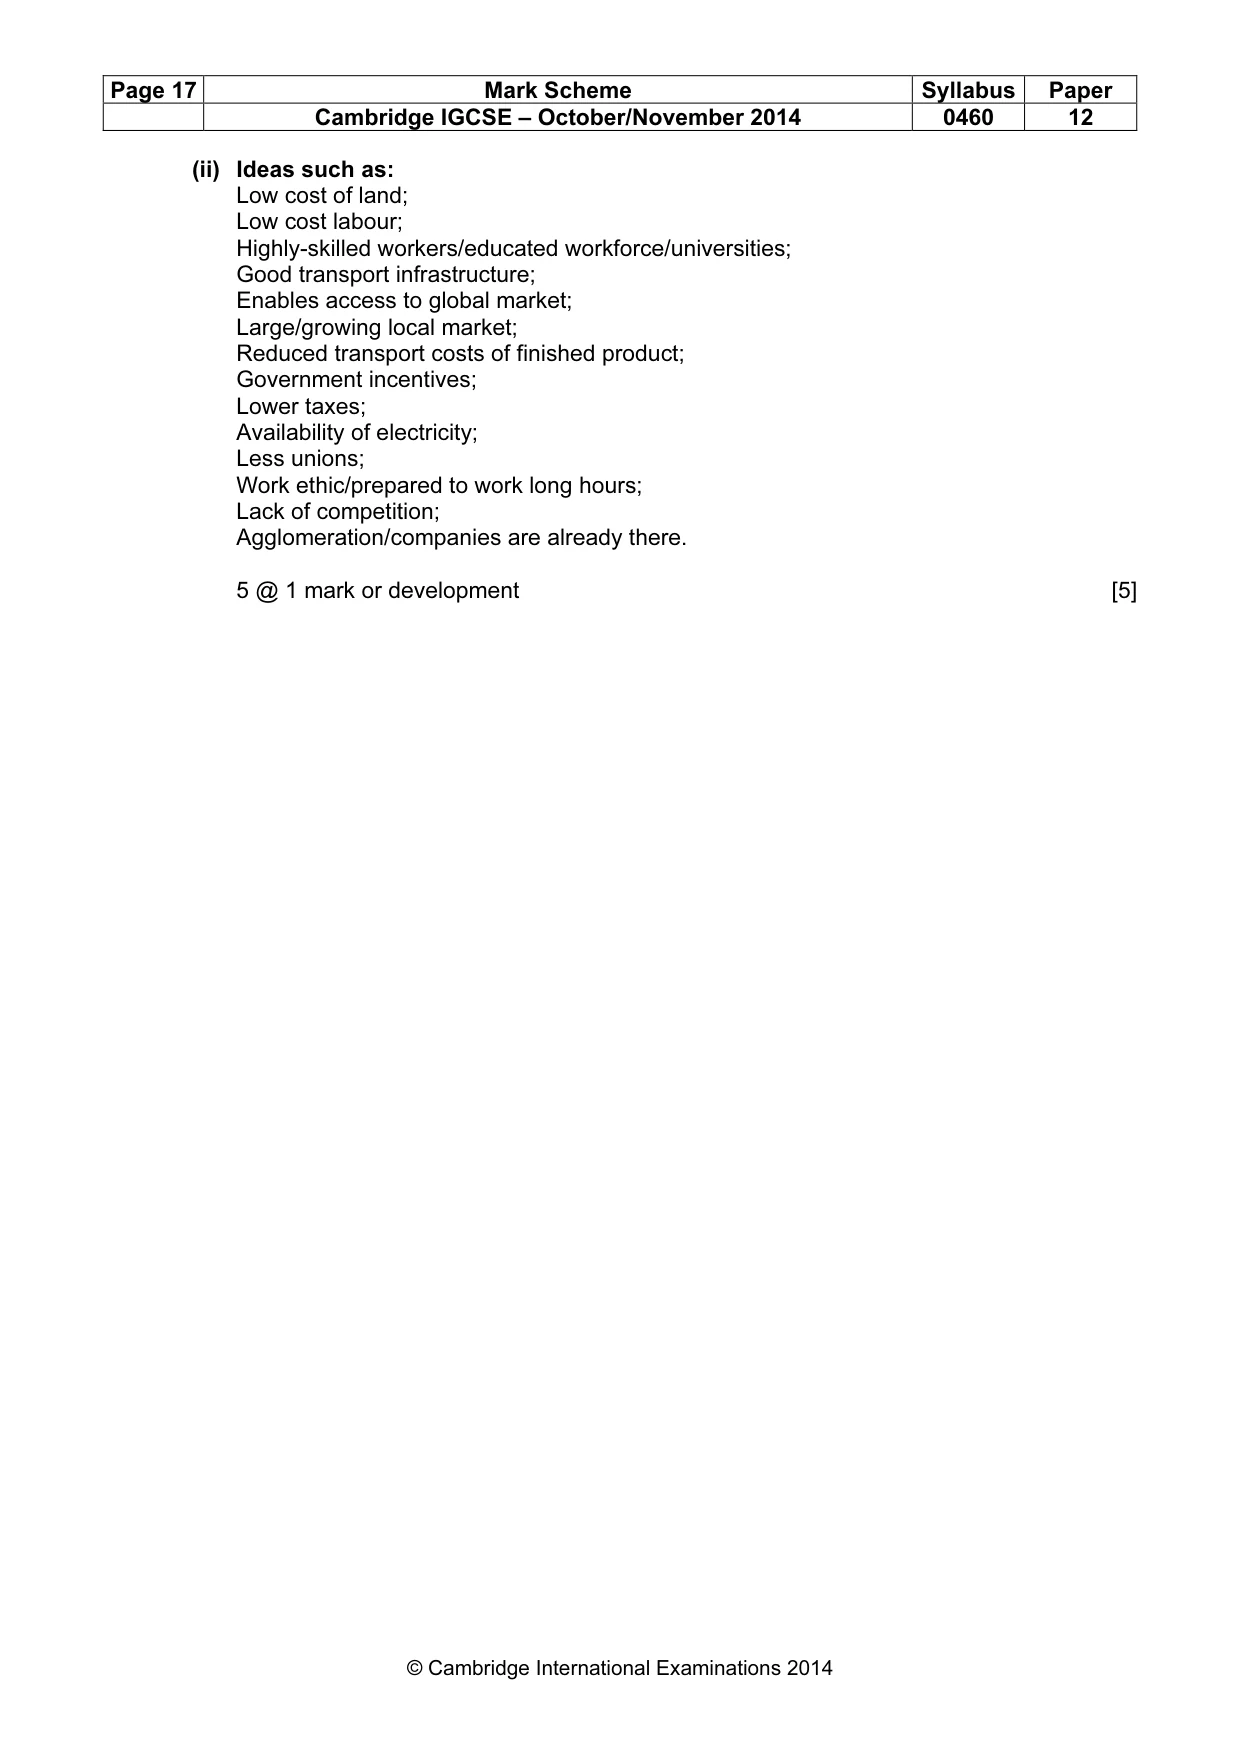
Page 17 Mark Scheme Syllabus Paper Cambridge IGCSE – October/November 2014 0460 12 © Cambridge International Examinations 2014 (ii) Ideas such as: Low cost of land; Low cost labour; Highly-skilled workers/educated workforce/universities; Good transport infrastructure; Enables access to global market; Large/growing local market; Reduced transport costs of finished product; Government incentives; Lower taxes; Availability of electricity; Less unions; Work ethic/prepared to work long hours; Lack of competition; Agglomeration/companies are already there. 5 @ 1 mark or development [5]
Mark scheme, page 18
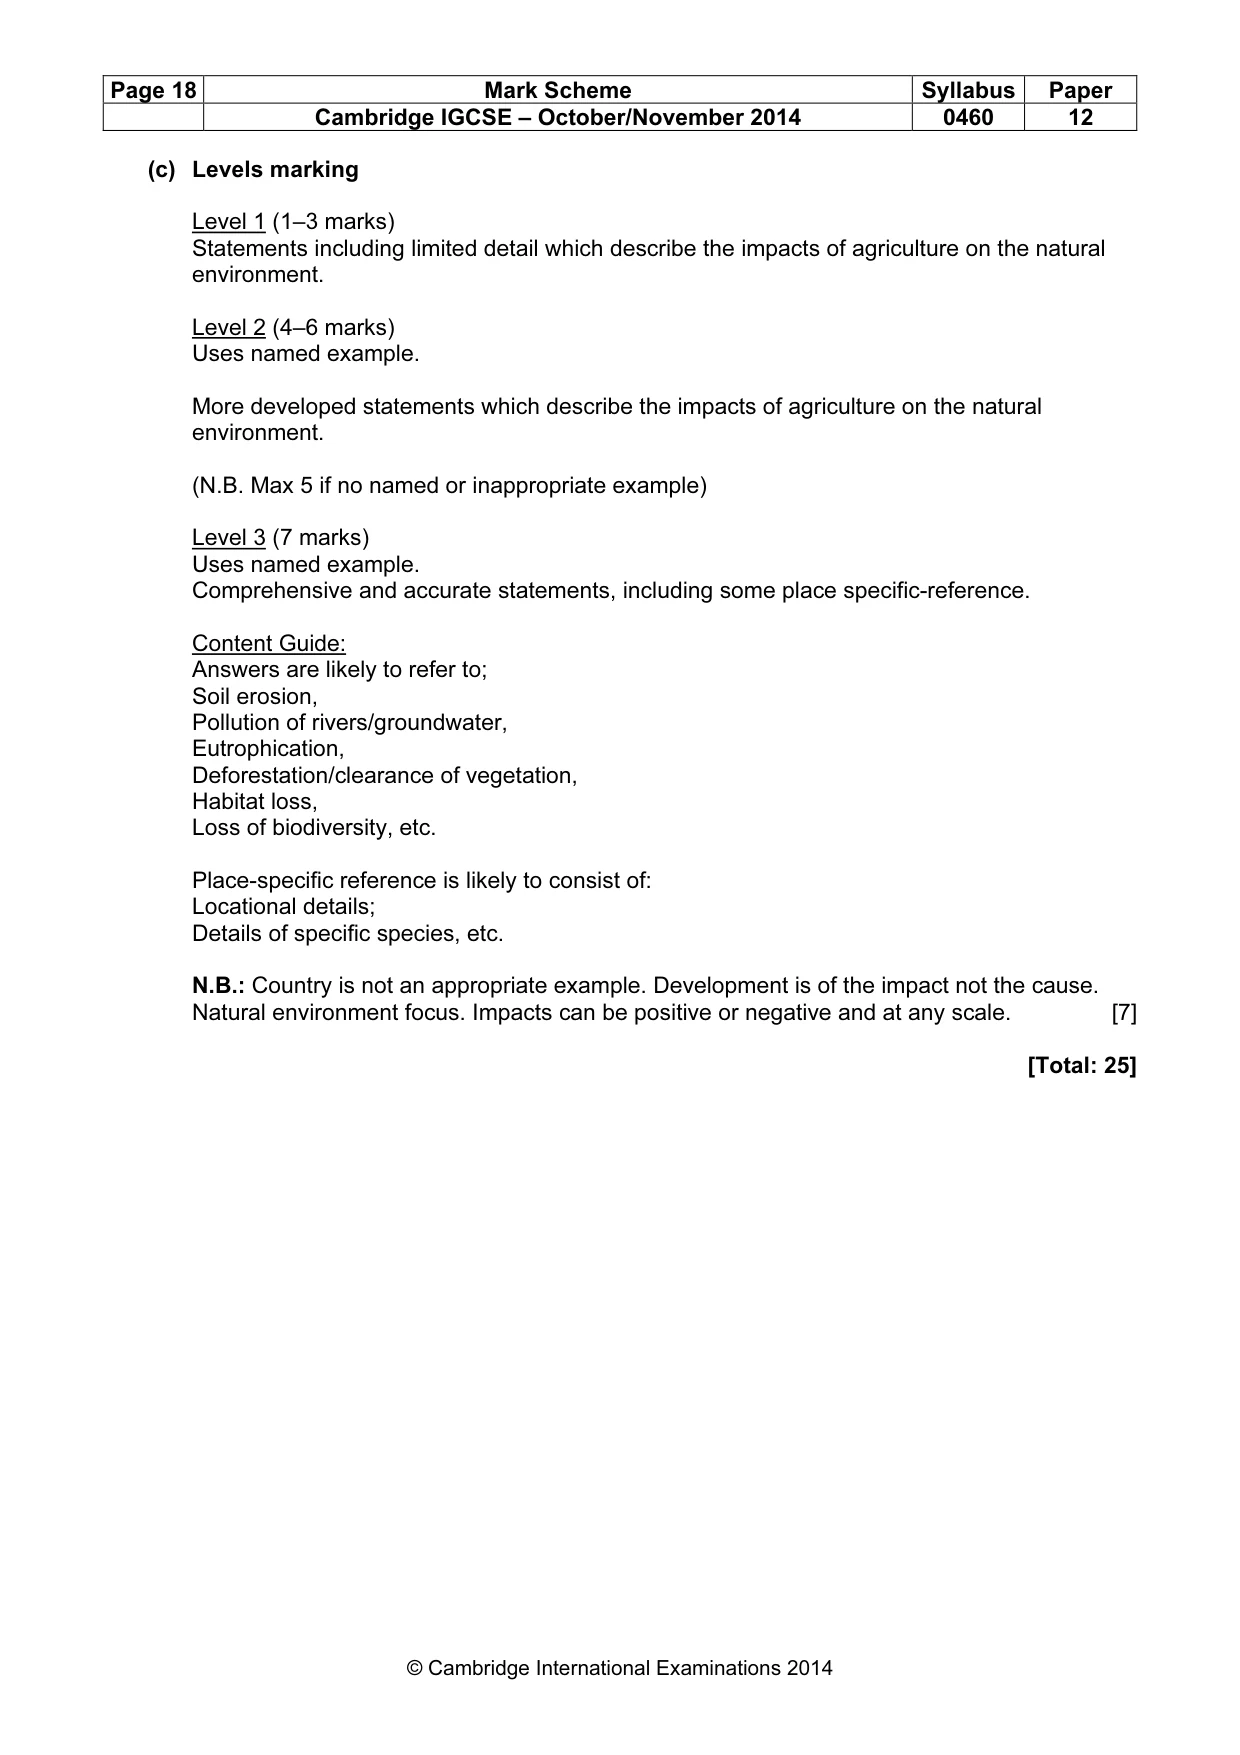
Page 18 Mark Scheme Syllabus Paper Cambridge IGCSE – October/November 2014 0460 12 © Cambridge International Examinations 2014 (c) Levels marking Level 1 (1–3 marks) Statements including limited detail which describe the impacts of agriculture on the natural environment. Level 2 (4–6 marks) Uses named example. More developed statements which describe the impacts of agriculture on the natural environment. (N.B. Max 5 if no named or inappropriate example) Level 3 (7 marks) Uses named example. Comprehensive and accurate statements, including some place specific-reference. Content Guide: Answers are likely to refer to; Soil erosion, Pollution of rivers/groundwater, Eutrophication, Deforestation/clearance of vegetation, Habitat loss, Loss of biodiversity, etc. Place-specific reference is likely to consist of: Locational details; Details of specific species, etc. N.B.: Country is not an appropriate example. Development is of the impact not the cause. Natural environment focus. Impacts can be positive or negative and at any scale. [7] [Total: 25]
What you needed in this session
Cambridge’s own grade thresholds for 2014 Oct/Nov, Paper 1 · Variant 2. A higher threshold means an easier paper — the bar moves with how the cohort did.