Cambridge IGCSE Geography 0460 — 2011 May/June Paper 1 · Variant 3
0460/13/M/J/11 · 75 marks · ≈84 min
The question paper and its mark scheme, free to read here and free to download. This is Cambridge’s own paper, exactly as it was sat.
Question paper24 pages





Mark scheme14 pages
Answers below. Sit the paper first if you are practising.
Paper as text
Question paper, page 1
This document consists of 24 printed pages and 1 Insert. DC (RCL/KM/SW) 31990/9 © UCLES 2011 [Turn over UNIVERSITY OF CAMBRIDGE INTERNATIONAL EXAMINATIONS International General Certificate of Secondary Education READ THESE INSTRUCTIONS FIRST Write your Centre number, candidate number and name in the spaces provided. Write in dark blue or black pen. You may use a soft pencil for any diagrams, graphs or rough working. Do not use staples, paper clips, highlighters, glue or correction fluid. DO NOT WRITE ON ANY BARCODES. Write your answer to each question in the space provided. If additional space is required, you should use the lined page at the end of this booklet. The question number(s) must be clearly shown. Answer three questions. Sketch maps and diagrams should be drawn whenever they serve to illustrate an answer. The Insert contains Photographs A and B for Question 2, Photograph C for Question 4 and Photograph D for Question 5. The Insert is not required by the Examiner. At the end of the examination, fasten all your work securely together. The number of marks is given in brackets [ ] at the end of each question or part question. GEOGRAPHY 0460/13 Paper 1 May/June 2011 1 hour 45 minutes Candidates answer on the Question Paper. Additional Materials: Ruler * 6 6 7 1 0 5 1 0 8 5 * www.theallpapers.com
Question paper, page 2
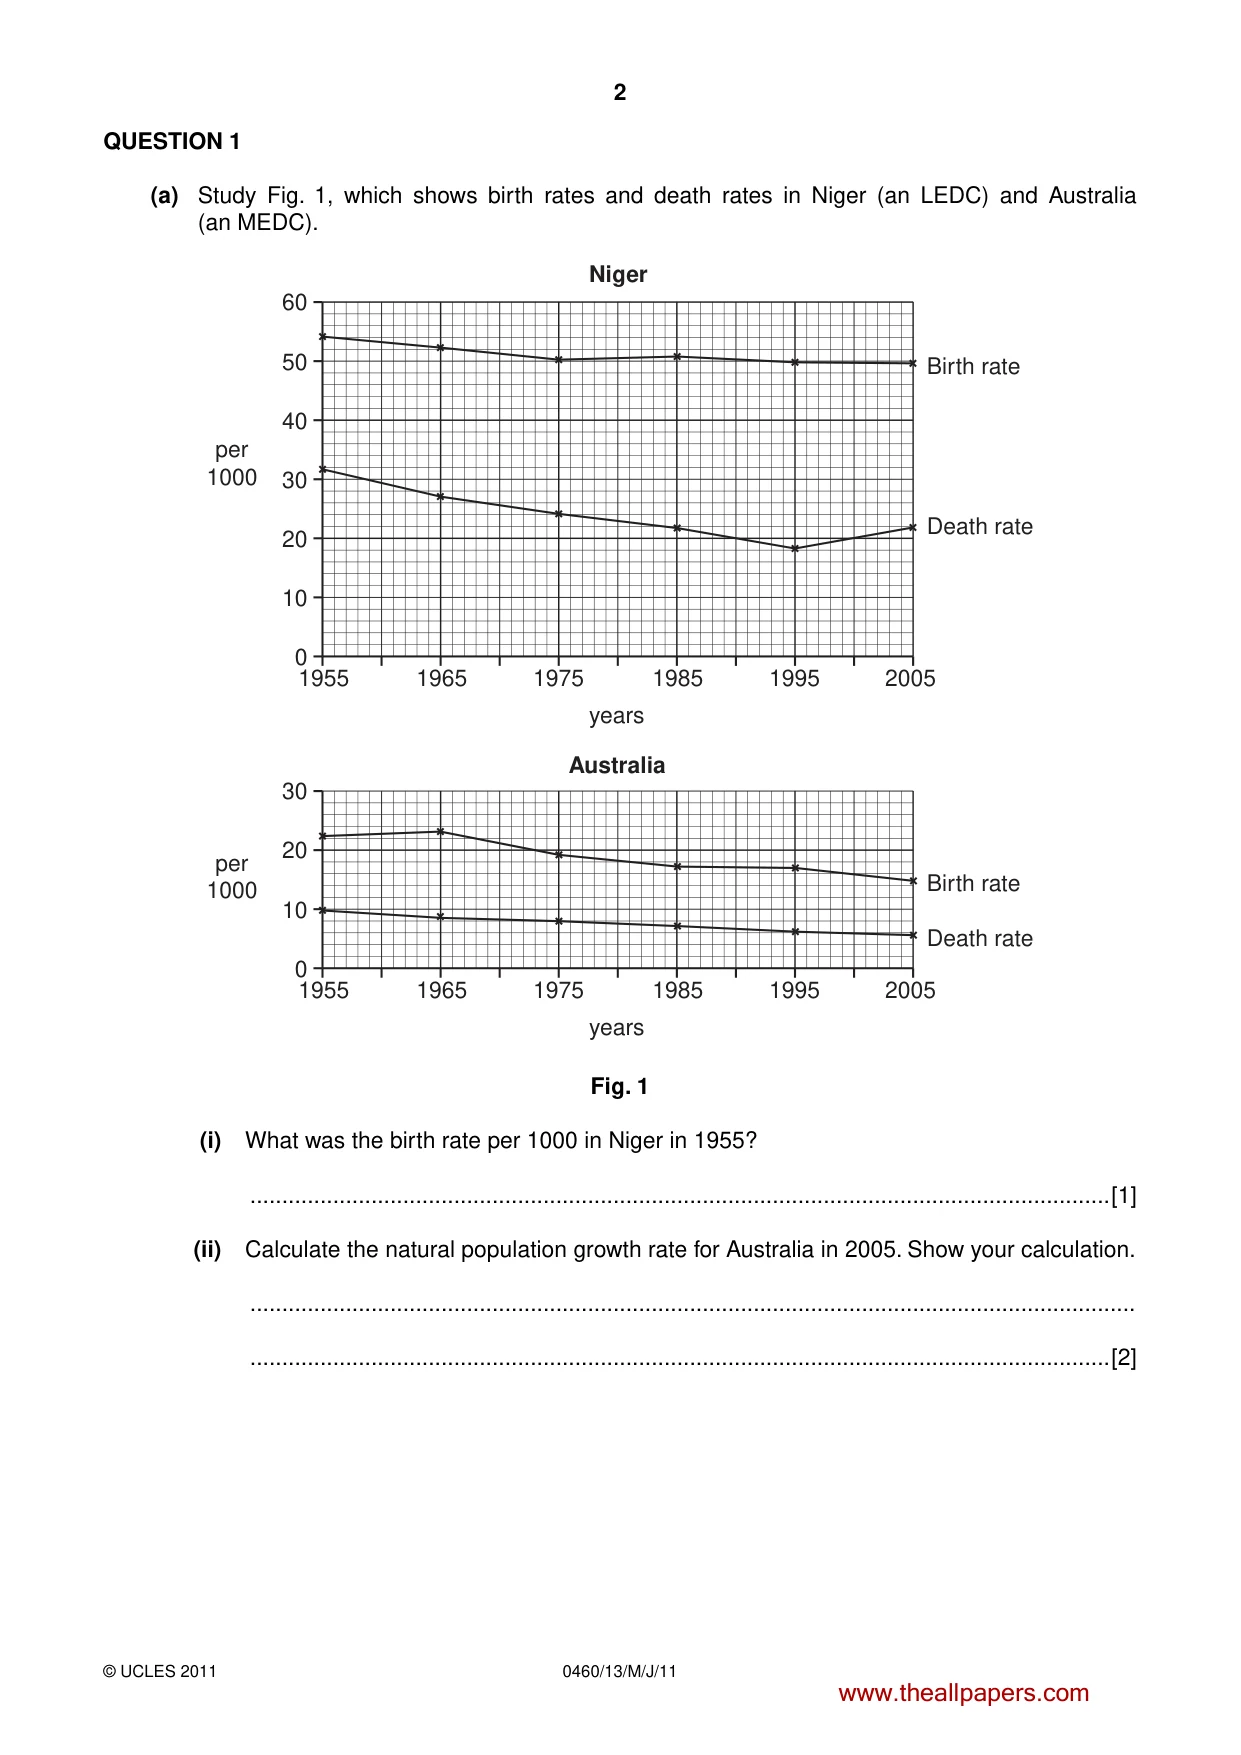
2 0460/13/M/J/11 © UCLES 2011 QUESTION 1 (a) Study Fig. 1, which shows birth rates and death rates in Niger (an LEDC) and Australia (an MEDC). per 1000 Birth rate Niger Death rate 1955 1965 1975 1985 years 1995 2005 Birth rate Australia Death rate 0 10 20 30 40 50 60 per 1000 1955 1965 1975 1985 years 1995 2005 0 10 20 30 Fig. 1 (i) What was the birth rate per 1000 in Niger in 1955? …[1] (ii) Calculate the natural population growth rate for Australia in 2005. Show your calculation. … …[2] www.theallpapers.com
Question paper, page 3
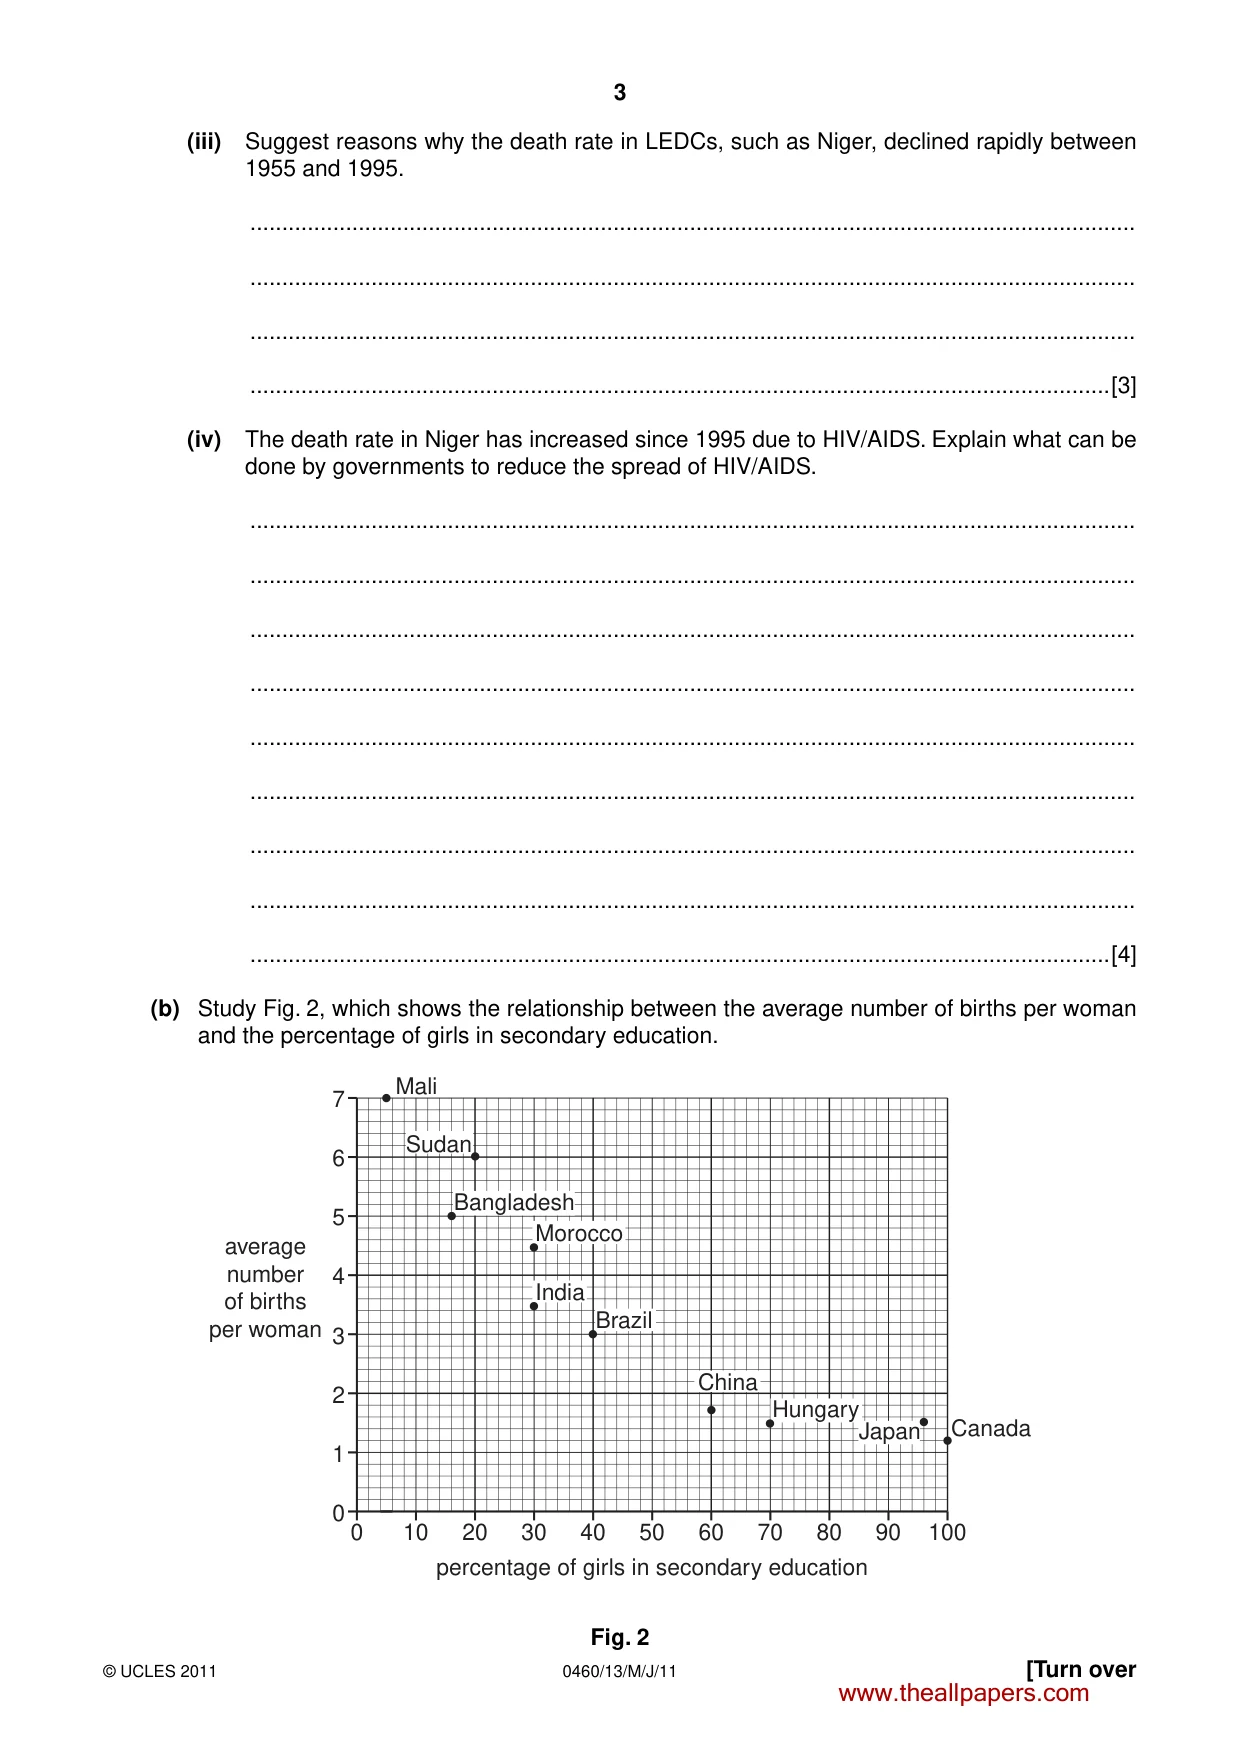
3 0460/13/M/J/11 © UCLES 2011 [Turn over (iii) Suggest reasons why the death rate in LEDCs, such as Niger, declined rapidly between 1955 and 1995. … … … …[3] (iv) The death rate in Niger has increased since 1995 due to HIV/AIDS. Explain what can be done by governments to reduce the spread of HIV/AIDS. … … … … … … … … …[4] (b) Study Fig. 2, which shows the relationship between the average number of births per woman and the percentage of girls in secondary education. 0 0 1 2 3 4 average number of births per woman 5 6 7 10 20 30 40 50 percentage of girls in secondary education 60 70 80 90 100 Mali Bangladesh Morocco India Brazil China Hungary Canada Japan Sudan Fig. 2 www.theallpapers.com
Question paper, page 4
4 0460/13/M/J/11 © UCLES 2011 (i) Describe the general relationship between the average number of births per woman and the percentage of girls in secondary education. Give data from Fig. 2 to support your answer. … … … … … … … …[3] (ii) Explain the advantages of educating girls and women in LEDCs. … … … … … … … … … …[5] www.theallpapers.com
Question paper, page 5
5 0460/13/M/J/11 © UCLES 2011 [Turn over (c) Name an example of a country which has attracted large numbers of international migrants. Explain the pull factors which have attracted people to your chosen country. Country chosen … … … … … … … … … … … … … … … …[7] [Total: 25 marks] END OF QUESTION 1 www.theallpapers.com
Question paper, page 6
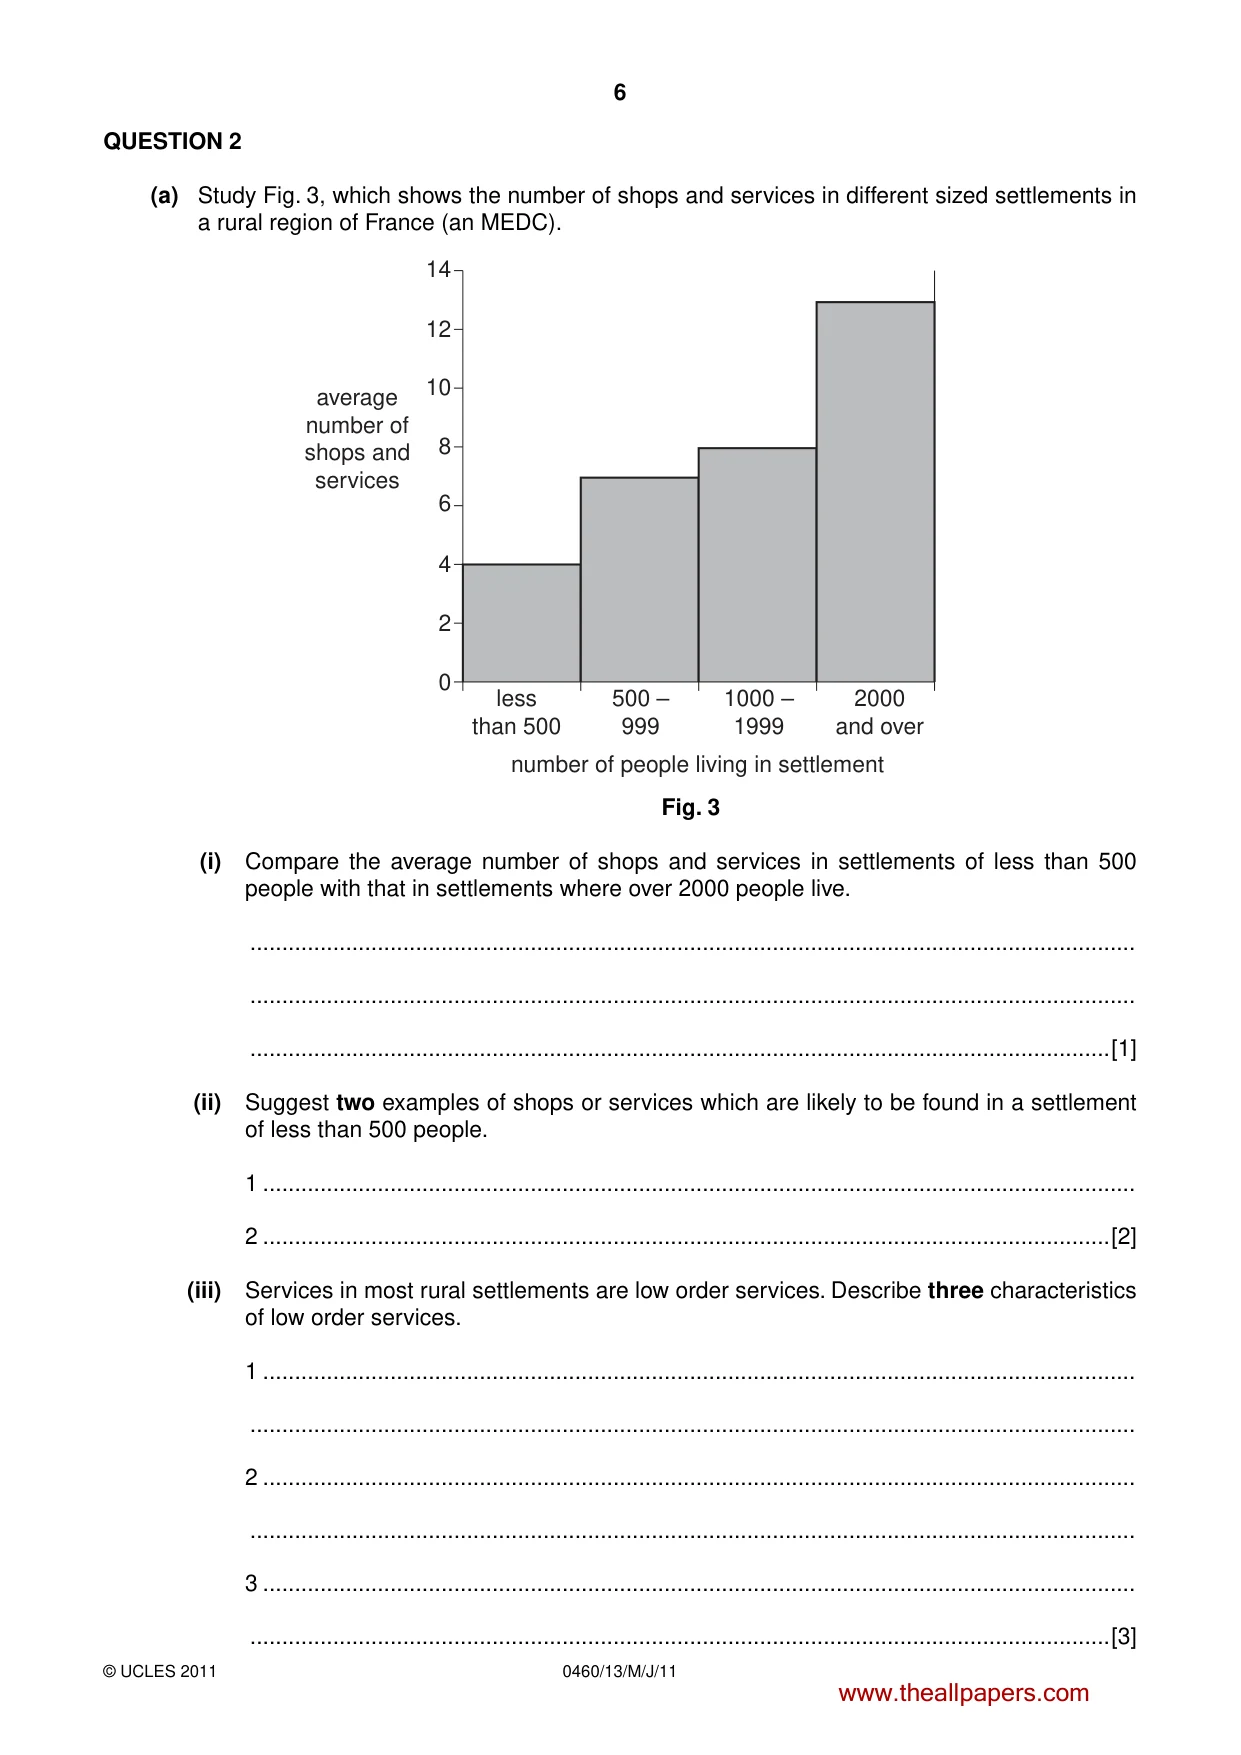
6 0460/13/M/J/11 © UCLES 2011 QUESTION 2 (a) Study Fig. 3, which shows the number of shops and services in different sized settlements in a rural region of France (an MEDC). 0 2 4 6 8 10 12 14 average number of shops and services less than 500 500 – 999 number of people living in settlement 1000 – 1999 2000 and over Fig. 3 (i) Compare the average number of shops and services in settlements of less than 500 people with that in settlements where over 2000 people live. … … …[1] (ii) Suggest two examples of shops or services which are likely to be found in a settlement of less than 500 people. 1 … 2 …[2] (iii) Services in most rural settlements are low order services. Describe three characteristics of low order services. 1 … … 2 … … 3 … …[3] www.theallpapers.com
Question paper, page 7
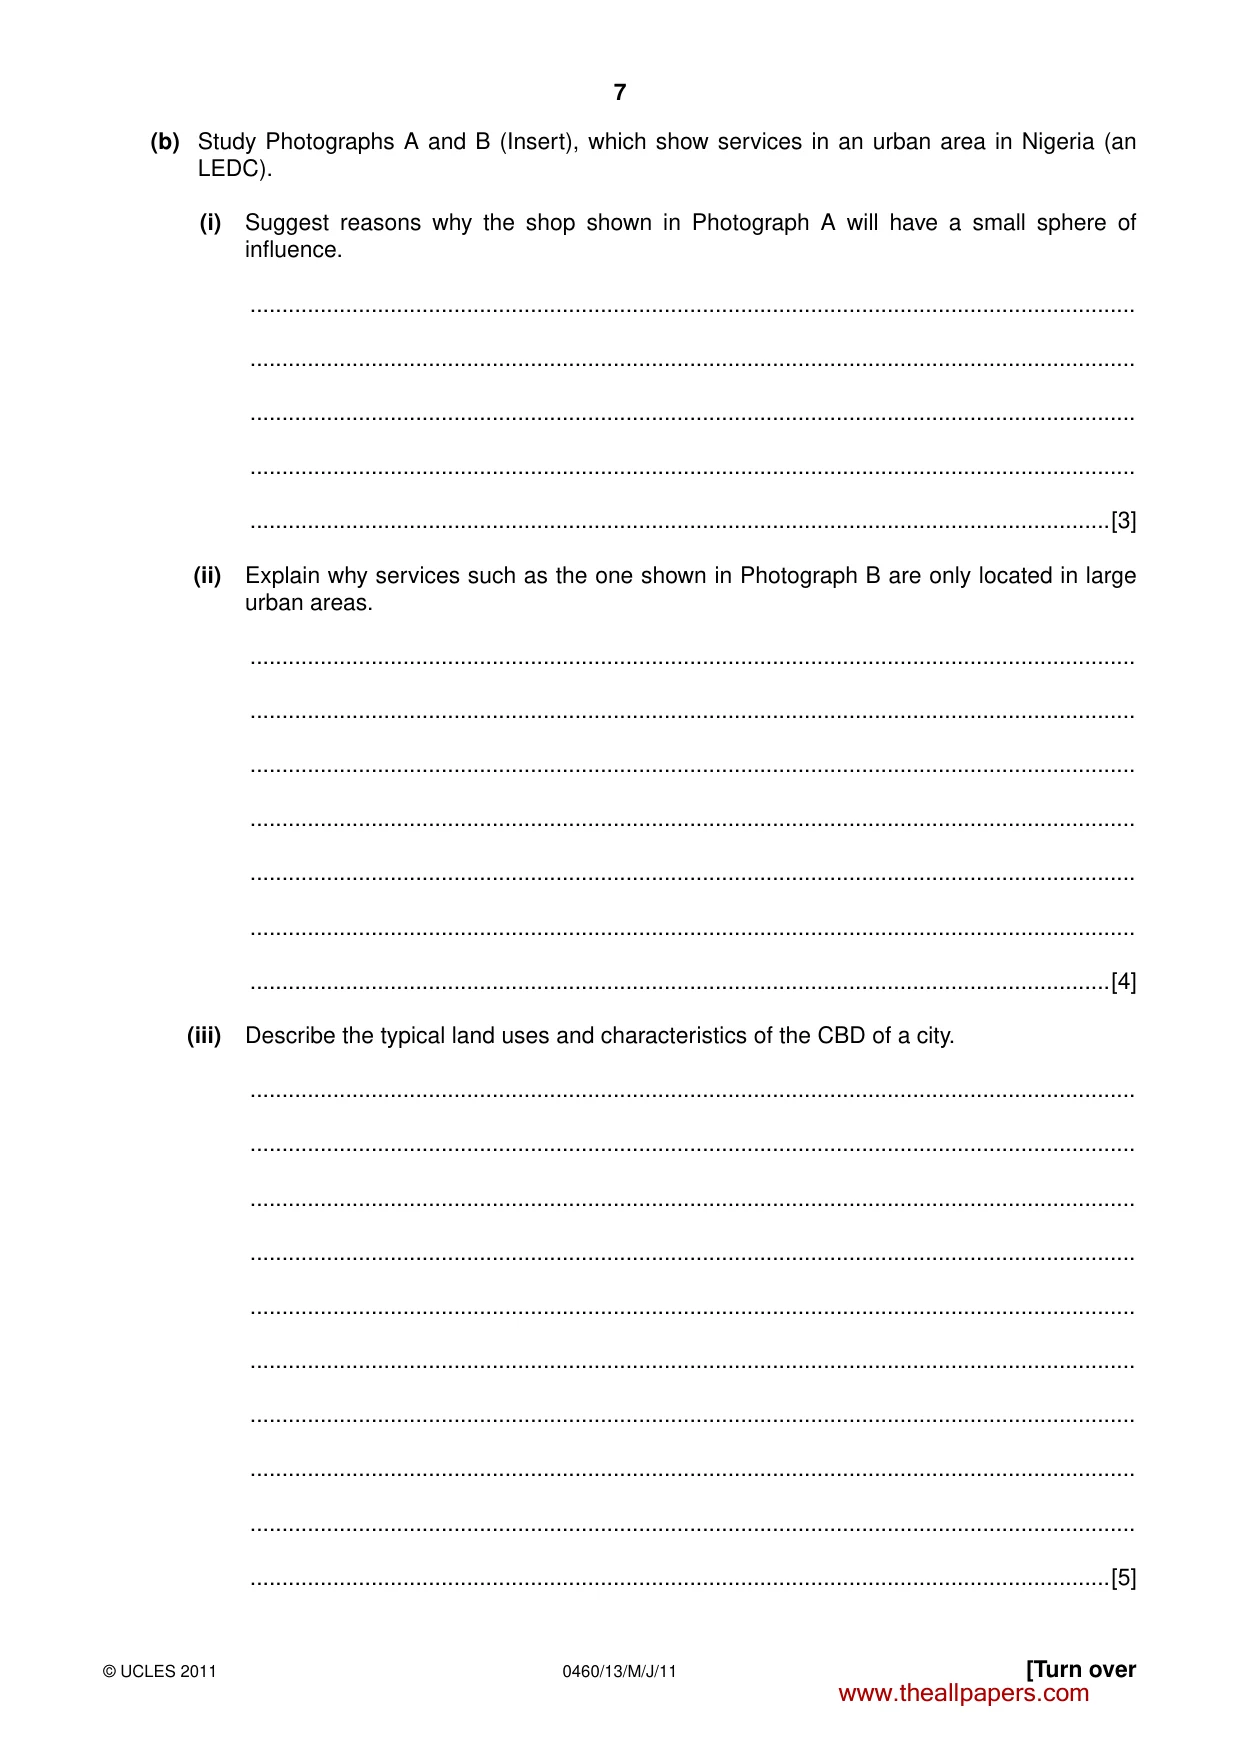
7 0460/13/M/J/11 © UCLES 2011 [Turn over (b) Study Photographs A and B (Insert), which show services in an urban area in Nigeria (an LEDC). (i) Suggest reasons why the shop shown in Photograph A will have a small sphere of influence. … … … … …[3] (ii) Explain why services such as the one shown in Photograph B are only located in large urban areas. … … … … … … …[4] (iii) Describe the typical land uses and characteristics of the CBD of a city. … … … … … … … … … …[5] www.theallpapers.com
Question paper, page 8
8 0460/13/M/J/11 © UCLES 2011 (c) Many settlements have grown over the years into large urban areas. For a named example of a large settlement, explain the reasons for its growth. Name of large settlement… … … … … … … … … … … … … … … …[7] [Total: 25 marks] END OF QUESTION 2 www.theallpapers.com
Question paper, page 9
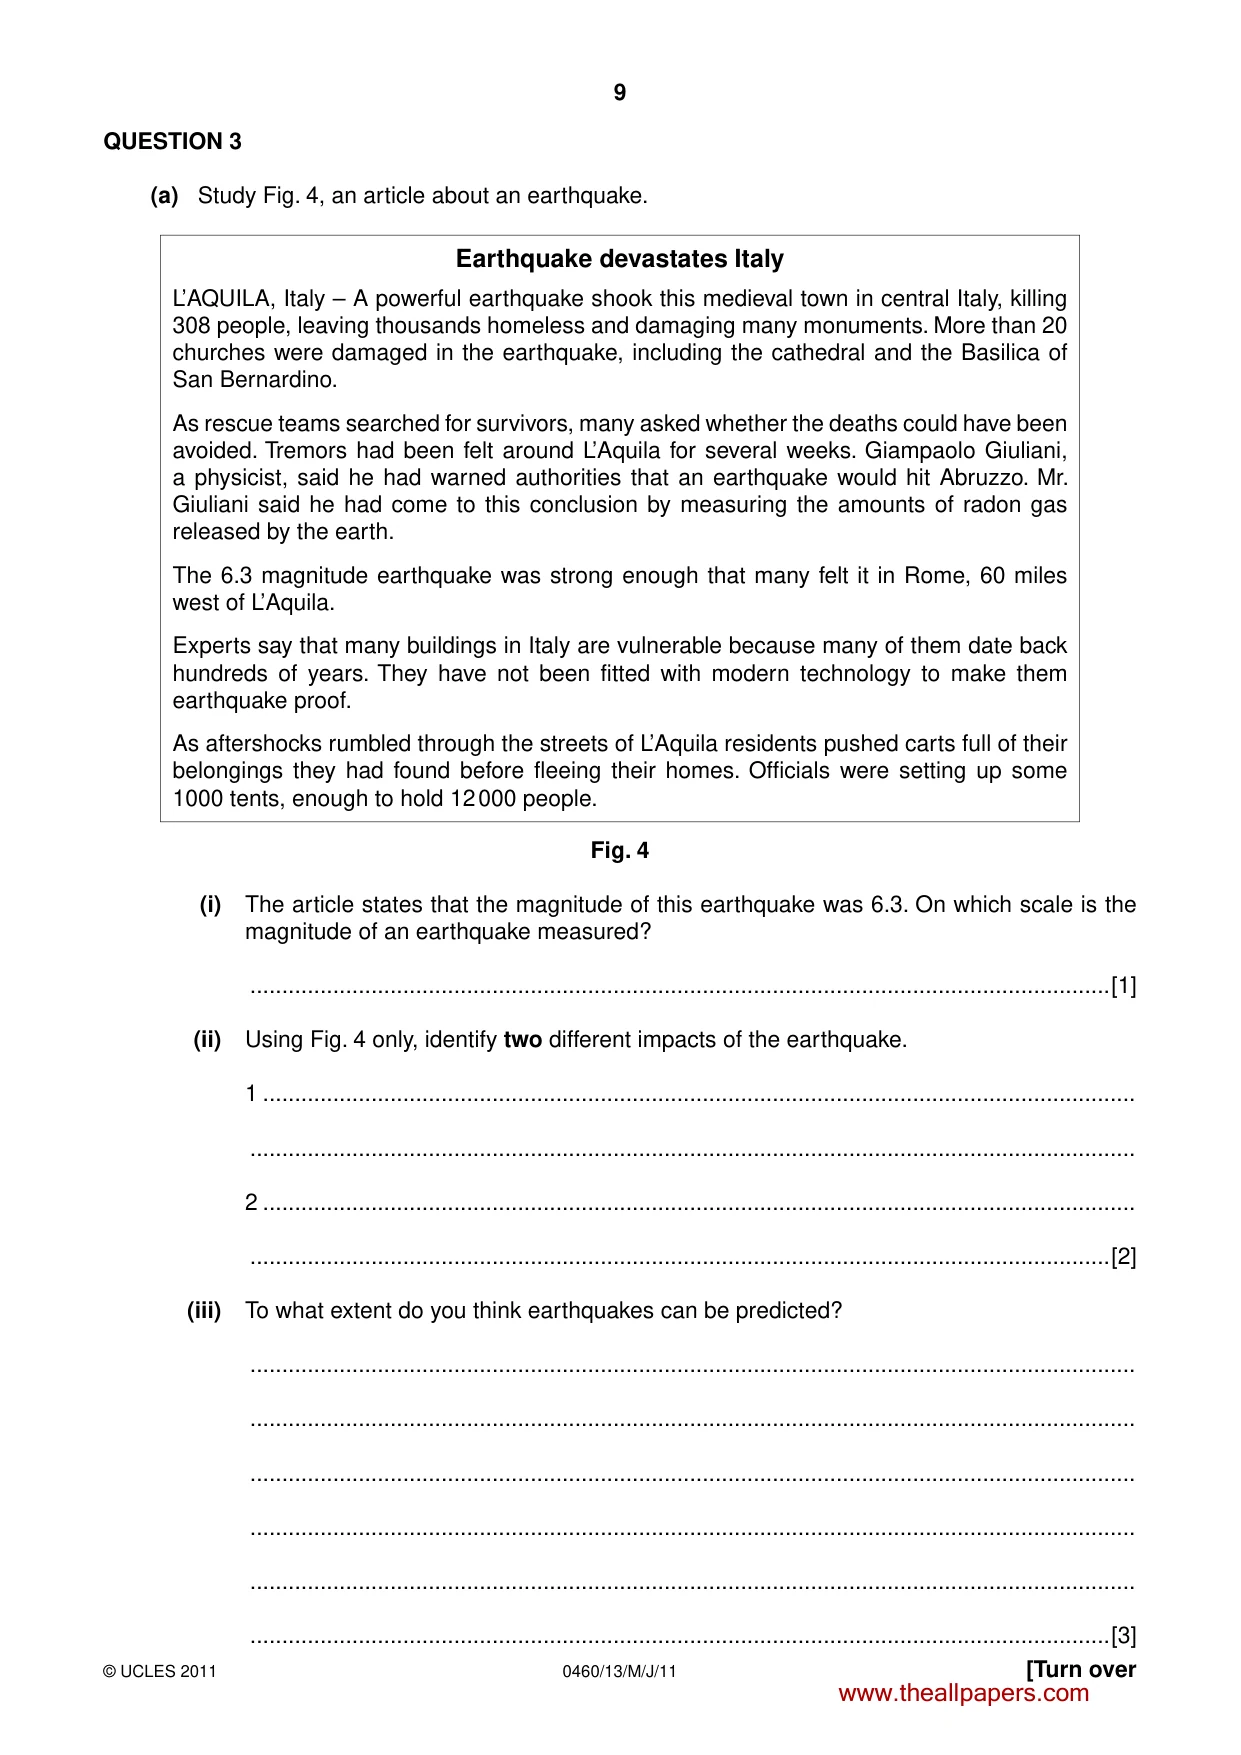
9 0460/13/M/J/11 © UCLES 2011 [Turn over QUESTION 3 (a) Study Fig. 4, an article about an earthquake. Earthquake devastates Italy L’AQUILA, Italy – A powerful earthquake shook this medieval town in central Italy, killing 308 people, leaving thousands homeless and damaging many monuments. More than 20 churches were damaged in the earthquake, including the cathedral and the Basilica of San Bernardino. As rescue teams searched for survivors, many asked whether the deaths could have been avoided. Tremors had been felt around L’Aquila for several weeks. Giampaolo Giuliani, a physicist, said he had warned authorities that an earthquake would hit Abruzzo. Mr. Giuliani said he had come to this conclusion by measuring the amounts of radon gas released by the earth. The 6.3 magnitude earthquake was strong enough that many felt it in Rome, 60 miles west of L’Aquila. Experts say that many buildings in Italy are vulnerable because many of them date back hundreds of years. They have not been fitted with modern technology to make them earthquake proof. As aftershocks rumbled through the streets of L’Aquila residents pushed carts full of their belongings they had found before fleeing their homes. Officials were setting up some 1000 tents, enough to hold 12 000 people. Fig. 4 (i) The article states that the magnitude of this earthquake was 6.3. On which scale is the magnitude of an earthquake measured? …[1] (ii) Using Fig. 4 only, identify two different impacts of the earthquake. 1 … … 2 … …[2] (iii) To what extent do you think earthquakes can be predicted? … … … … … …[3] www.theallpapers.com
Question paper, page 10
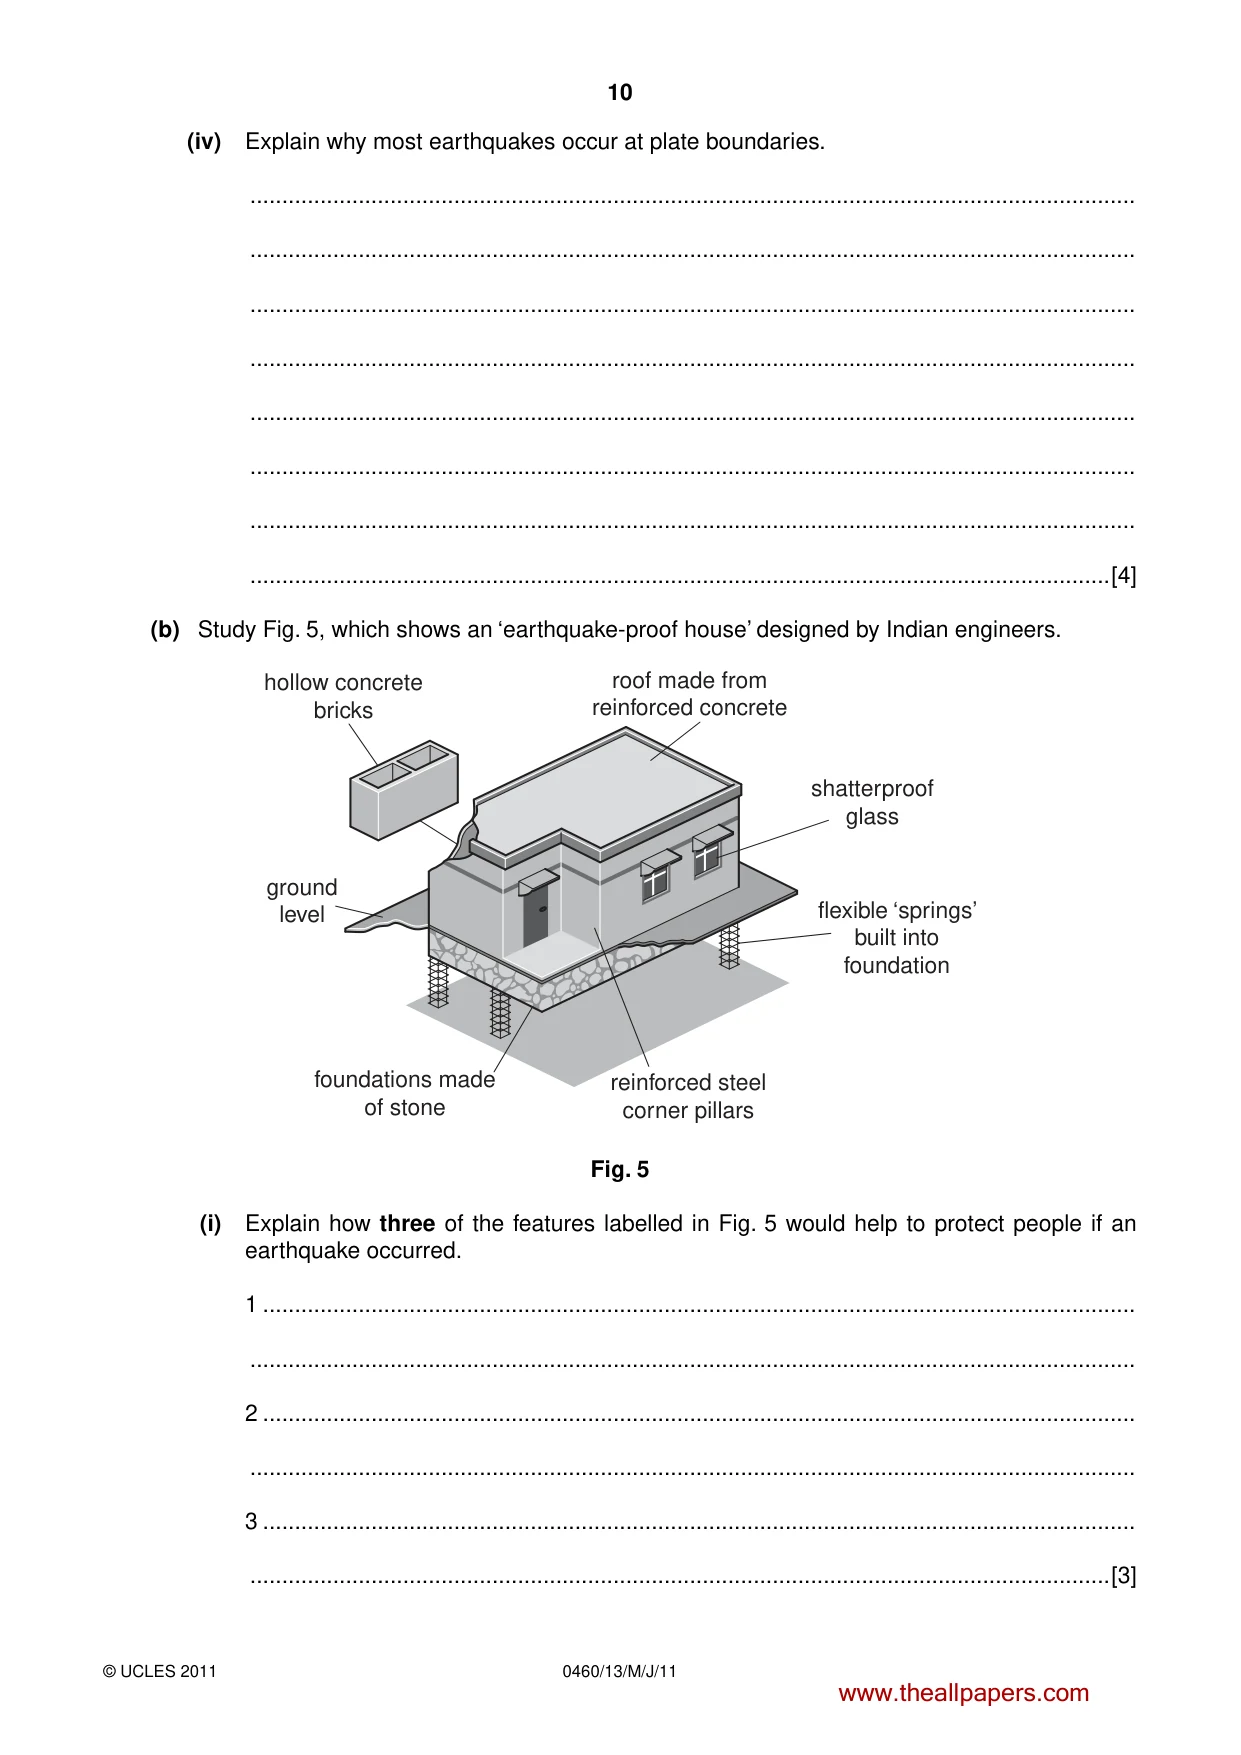
10 0460/13/M/J/11 © UCLES 2011 (iv) Explain why most earthquakes occur at plate boundaries. … … … … … … … …[4] (b) Study Fig. 5, which shows an ‘earthquake-proof house’ designed by Indian engineers. shatterproof glass flexible ‘springs’ built into foundation reinforced steel corner pillars foundations made of stone ground level hollow concrete bricks roof made from reinforced concrete Fig. 5 (i) Explain how three of the features labelled in Fig. 5 would help to protect people if an earthquake occurred. 1 … … 2 … … 3 … …[3] www.theallpapers.com
Question paper, page 11
11 0460/13/M/J/11 © UCLES 2011 [Turn over (ii) Why do many people live in areas which are at risk from earthquakes? … … … … … … … … …[5] (c) An earthquake is an example of a natural hazard. Choose an example of one of the following: a tropical storm, a drought. For a named area, describe the causes and effects of your chosen hazard. Hazard chosen… Area chosen … … … … … … … … … … … … … … …[7] [Total: 25 marks] END OF QUESTION 3 www.theallpapers.com
Question paper, page 12
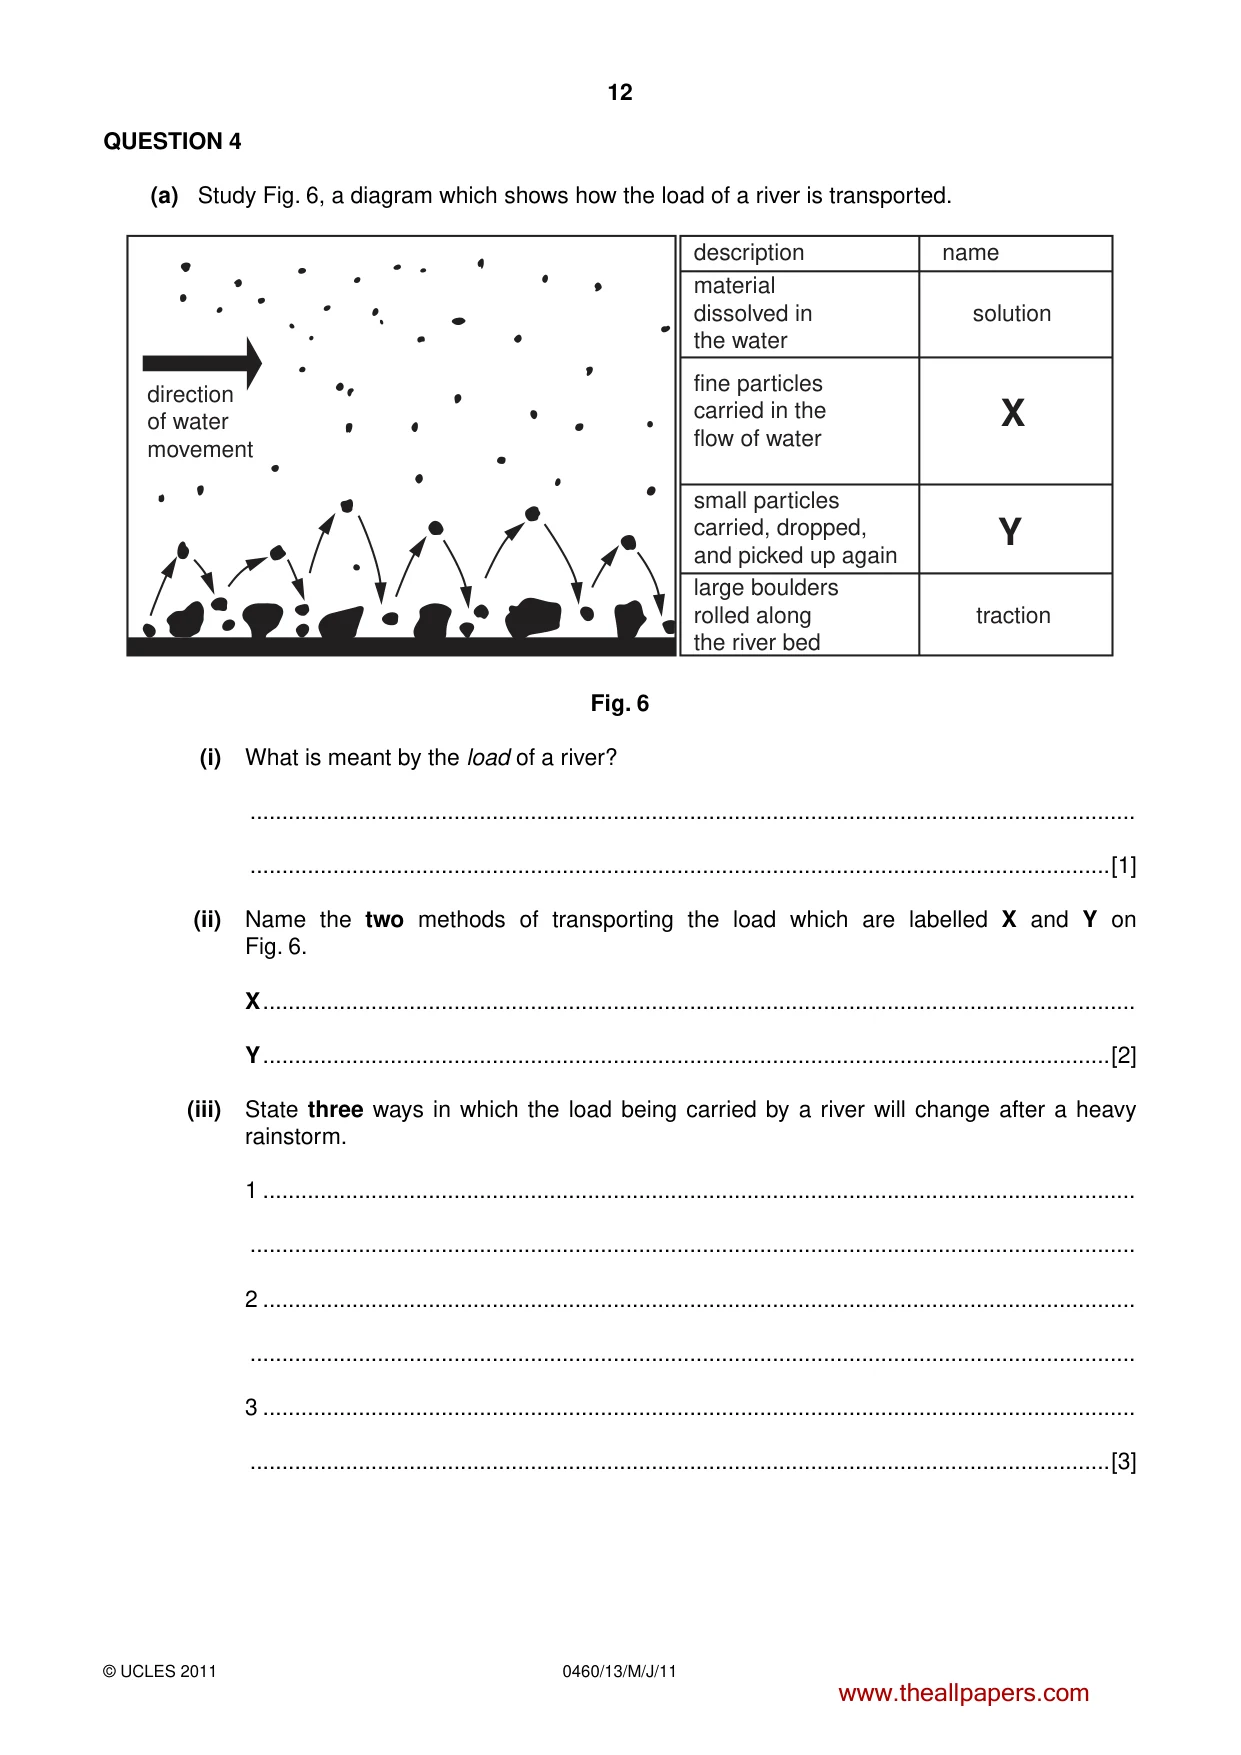
12 0460/13/M/J/11 © UCLES 2011 QUESTION 4 (a) Study Fig. 6, a diagram which shows how the load of a river is transported. description name material dissolved in the water solution fine particles carried in the flow of water direction of water movement X small particles carried, dropped, and picked up again Y large boulders rolled along the river bed traction Fig. 6 (i) What is meant by the load of a river? … …[1] (ii) Name the two methods of transporting the load which are labelled X and Y on Fig. 6. X … Y …[2] (iii) State three ways in which the load being carried by a river will change after a heavy rainstorm. 1 … … 2 … … 3 … …[3] www.theallpapers.com
Question paper, page 13
13 0460/13/M/J/11 © UCLES 2011 [Turn over (iv) State the location of two areas along a river’s course where deposition occurs. Explain why deposition occurs in each of these areas. Area 1 … … … Area 2 … … …[4] (b) Study Photograph C (Insert) which shows a waterfall. (i) Describe the natural features of the waterfall shown in Photograph C. … … … … … …[3] www.theallpapers.com
Question paper, page 14
14 0460/13/M/J/11 © UCLES 2011 (ii) Suggest how the waterfall in Photograph C was formed. You may draw a labelled diagram. … … … … … … … … … …[5] www.theallpapers.com
Question paper, page 15
15 0460/13/M/J/11 © UCLES 2011 [Turn over (c) For a named river you have studied, explain what has been done to reduce flooding. Name of river … … … … … … … … … … … … … … … …[7] [Total: 25 marks] END OF QUESTION 4 www.theallpapers.com
Question paper, page 16
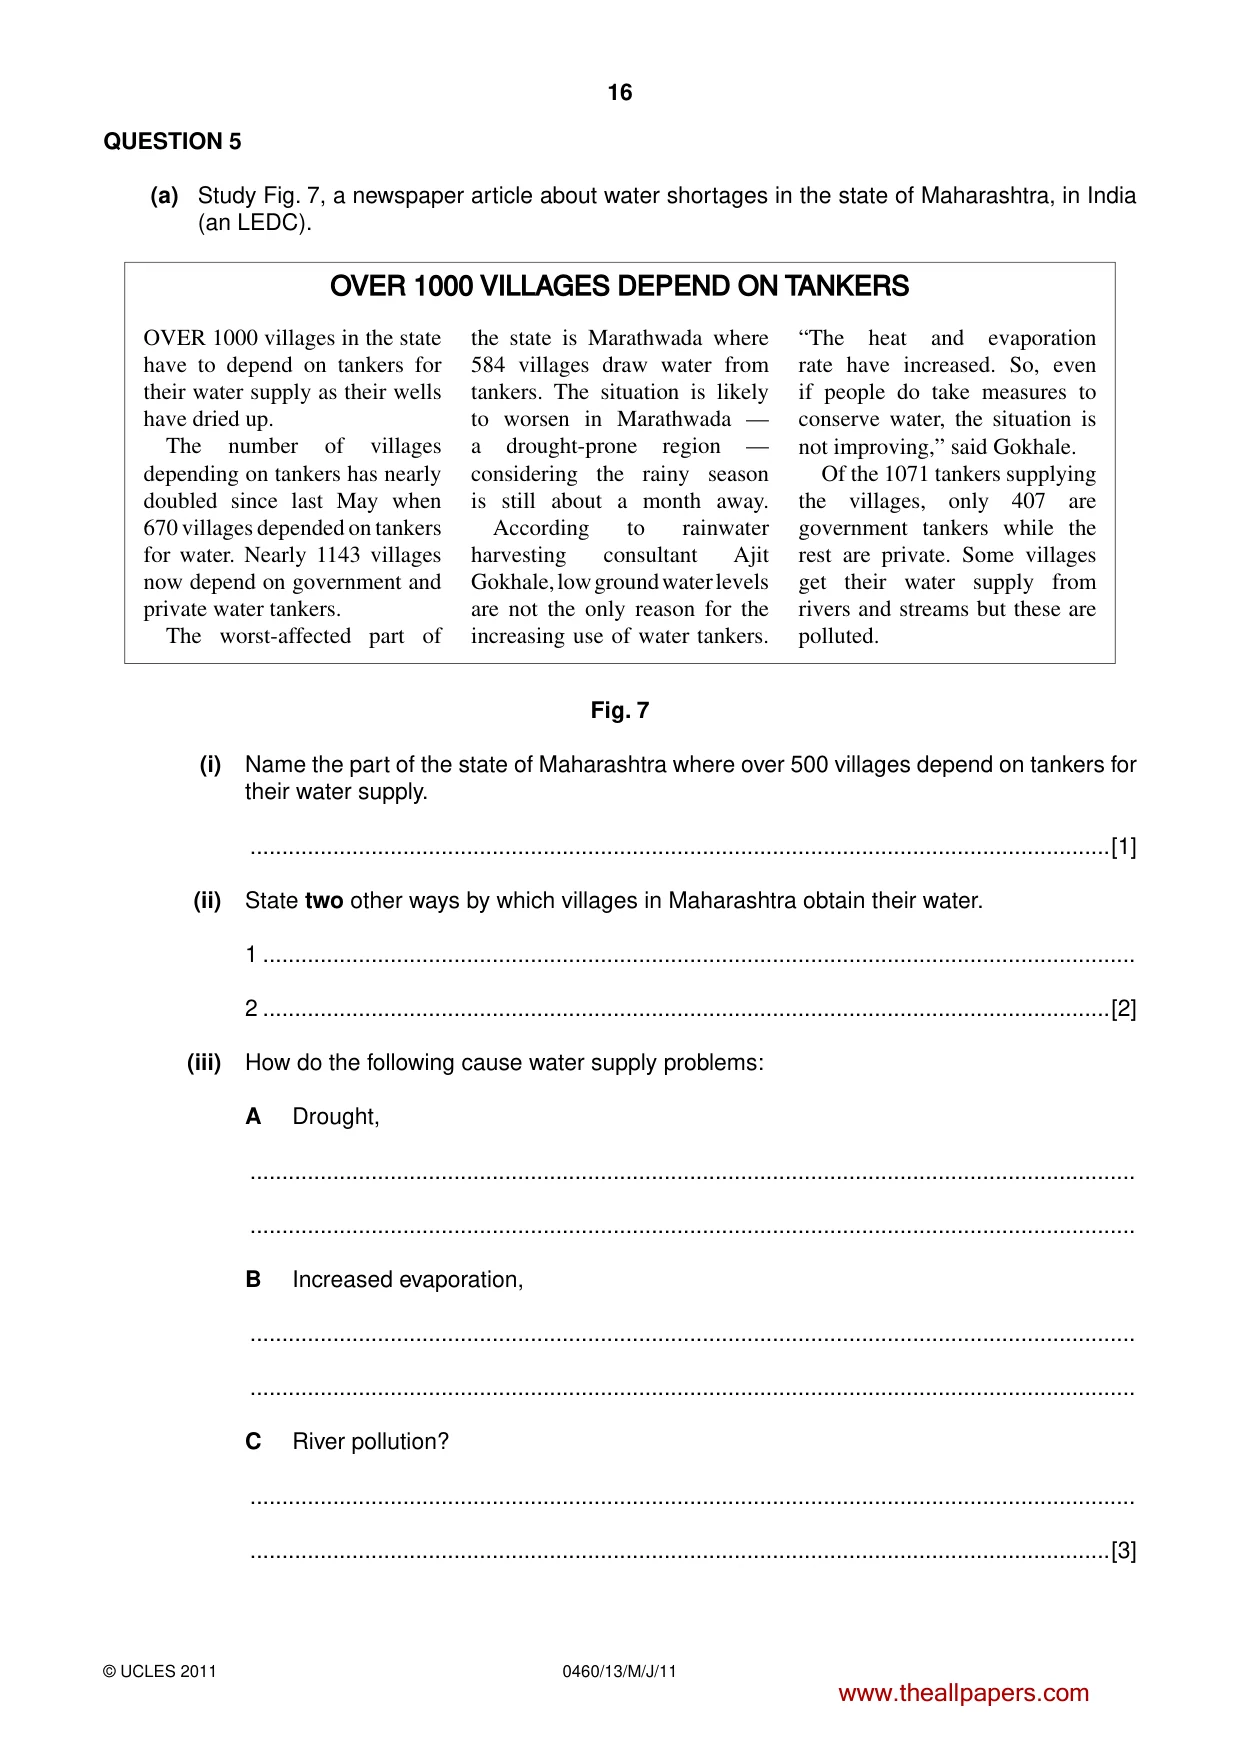
16 0460/13/M/J/11 © UCLES 2011 QUESTION 5 (a) Study Fig. 7, a newspaper article about water shortages in the state of Maharashtra, in India (an LEDC). OVER 1000 VILLAGES DEPEND ON TANKERS OVER 1000 VILLAGES DEPEND ON TANKERS OVER 1000 villages in the state have to depend on tankers for their water supply as their wells have dried up. The number of villages depending on tankers has nearly doubled since last May when 670 villages depended on tankers for water. Nearly 1143 villages now depend on government and private water tankers. The worst-affected part of the state is Marathwada where 584 villages draw water from tankers. The situation is likely to worsen in Marathwada — a drought-prone region — considering the rainy season is still about a month away. According to rainwater harvesting consultant Ajit Gokhale, low ground water levels are not the only reason for the increasing use of water tankers. “The heat and evaporation rate have increased. So, even if people do take measures to conserve water, the situation is not improving,” said Gokhale. Of the 1071 tankers supplying the villages, only 407 are government tankers while the rest are private. Some villages get their water supply from rivers and streams but these are polluted. Fig. 7 (i) Name the part of the state of Maharashtra where over 500 villages depend on tankers for their water supply. …[1] (ii) State two other ways by which villages in Maharashtra obtain their water. 1 … 2 …[2] (iii) How do the following cause water supply problems: A Drought, … … B Increased evaporation, … … C River pollution? … …[3] www.theallpapers.com
Question paper, page 17
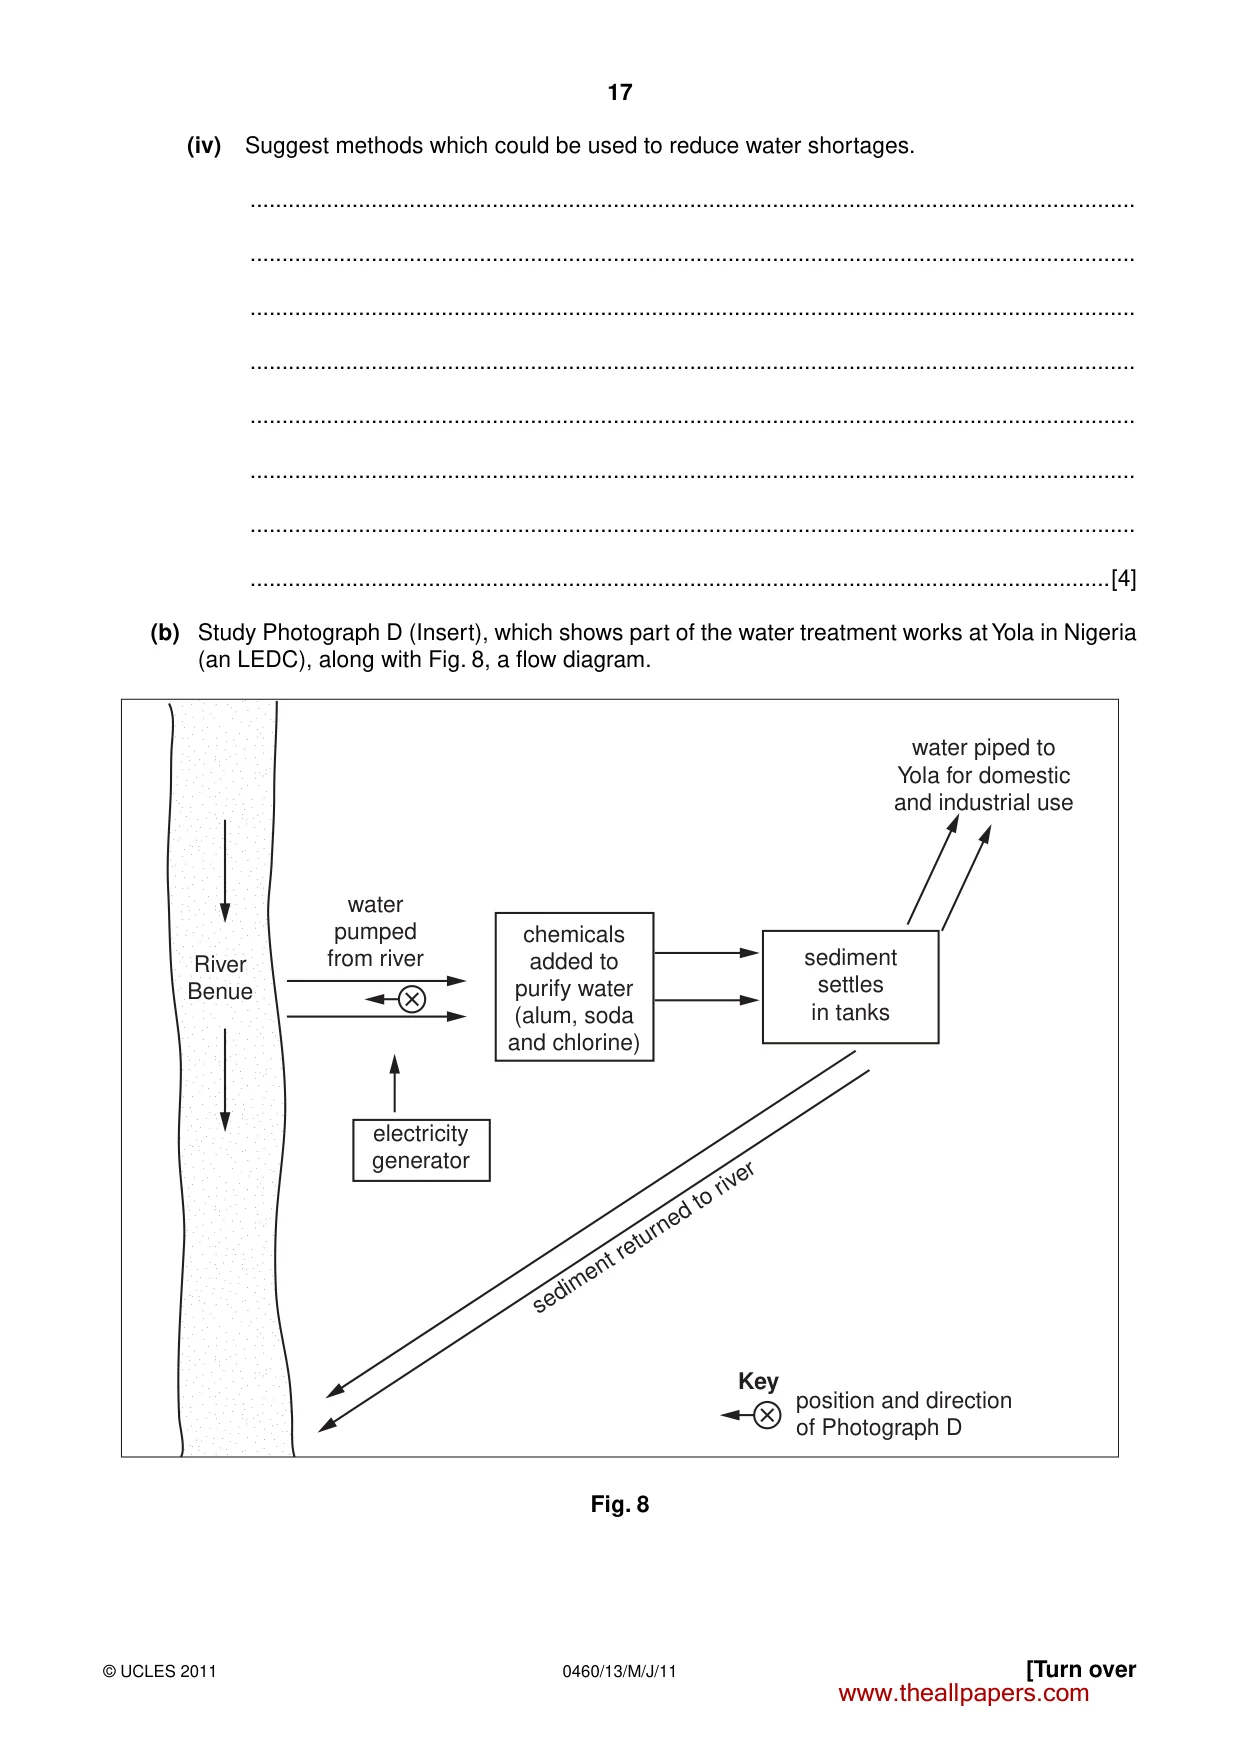
17 0460/13/M/J/11 © UCLES 2011 [Turn over (iv) Suggest methods which could be used to reduce water shortages. … … … … … … … …[4] (b) Study Photograph D (Insert), which shows part of the water treatment works at Yola in Nigeria (an LEDC), along with Fig. 8, a flow diagram. water pumped from river position and direction of Photograph D Key River Benue River Benue chemicals added to purify water (alum, soda and chlorine) sediment settles in tanks sediment returned to river electricity generator water piped to Yola for domestic and industrial use Fig. 8 www.theallpapers.com
Question paper, page 18
18 0460/13/M/J/11 © UCLES 2011 (i) Describe how the water from the River Benue is processed at Yola water treatment works. … … … … … …[3] (ii) Explain the benefits to local people of the water treatment works. … … … … … … … … … …[5] www.theallpapers.com
Question paper, page 19
19 0460/13/M/J/11 © UCLES 2011 [Turn over (c) Water may be polluted by human activities. For a named example which you have studied, describe the causes and effects of pollution of a river, lake or sea area. Example chosen … … … … … … … … … … … … … … … …[7] [Total: 25 marks] END OF QUESTION 5 www.theallpapers.com
Question paper, page 20
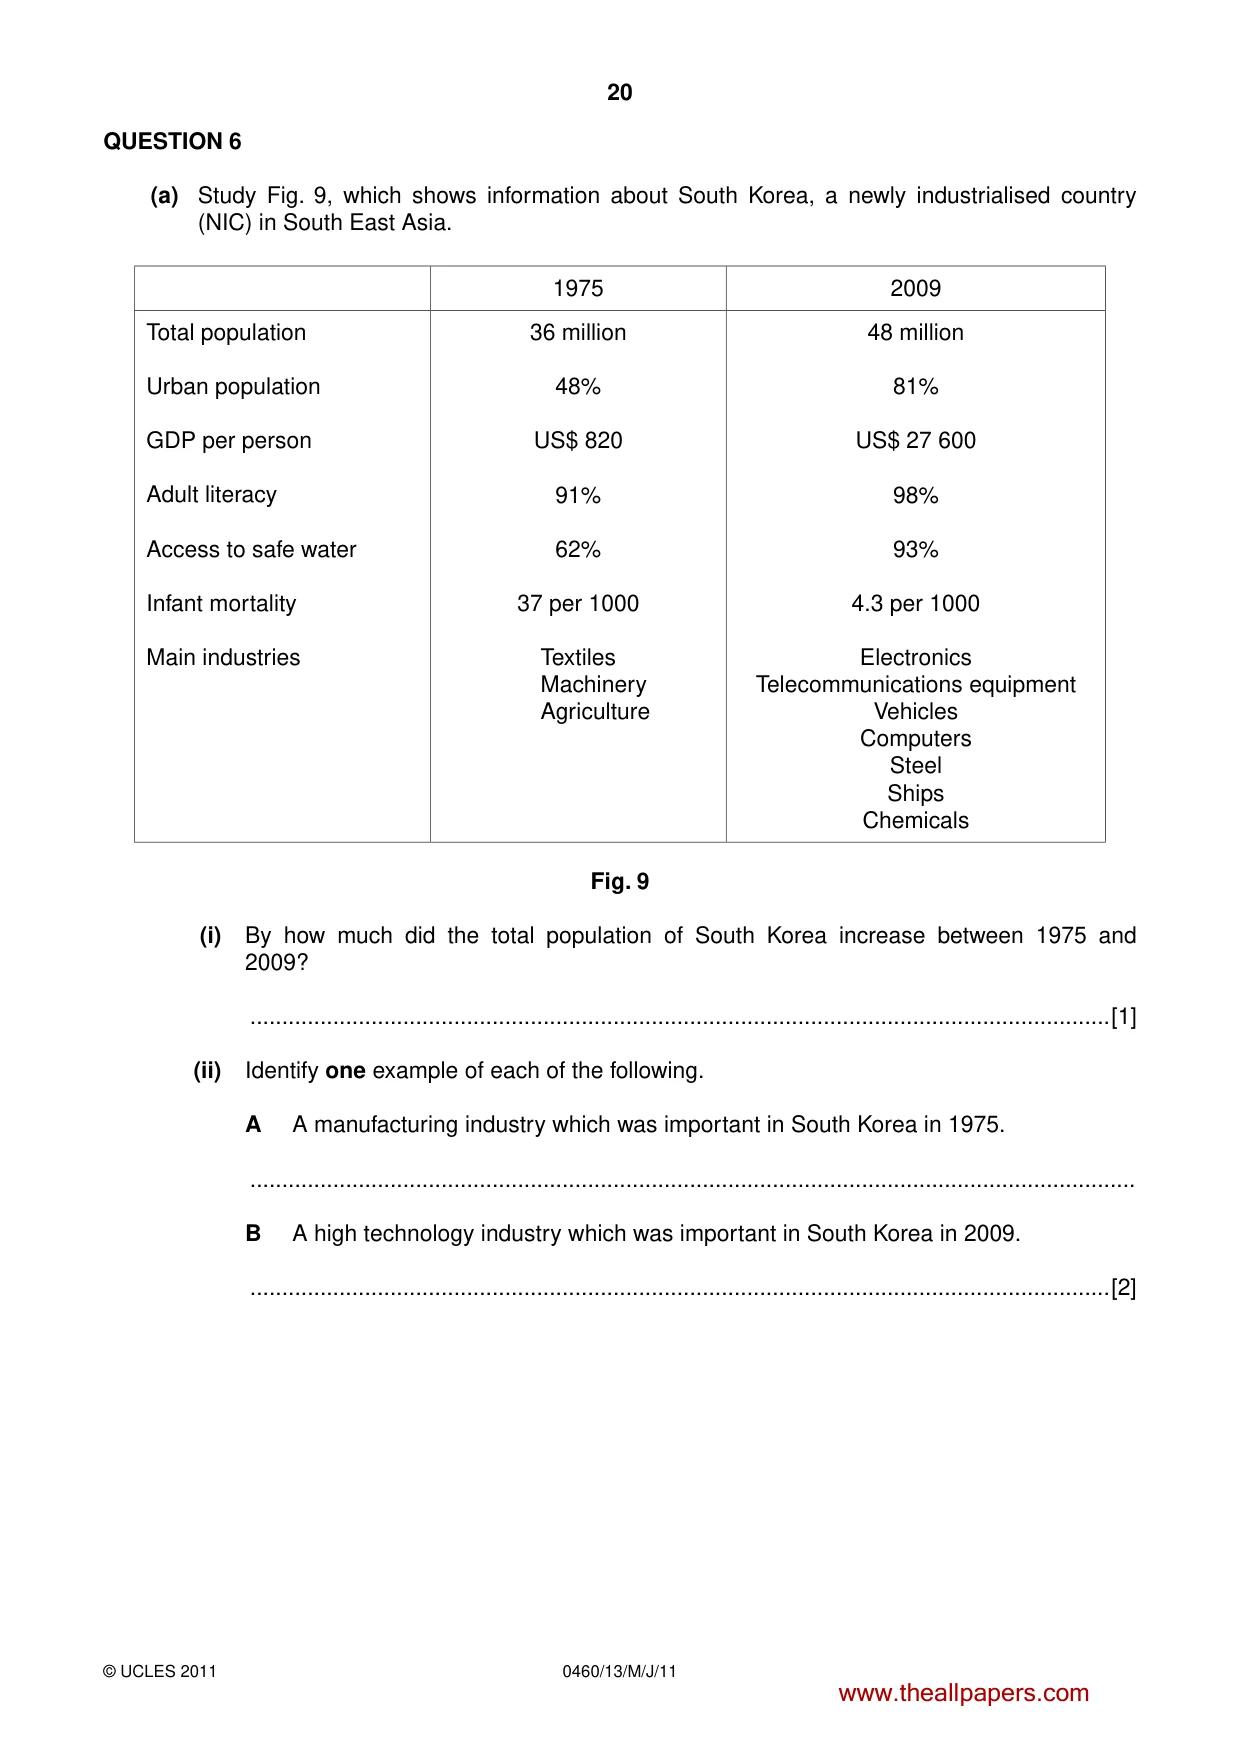
20 0460/13/M/J/11 © UCLES 2011 QUESTION 6 (a) Study Fig. 9, which shows information about South Korea, a newly industrialised country (NIC) in South East Asia. 1975 2009 Total population Urban population GDP per person Adult literacy Access to safe water Infant mortality Main industries 36 million 48% US$ 820 91% 62% 37 per 1000 Textiles Machinery Agriculture 48 million 81% US$ 27 600 98% 93% 4.3 per 1000 Electronics Telecommunications equipment Vehicles Computers Steel Ships Chemicals Fig. 9 (i) By how much did the total population of South Korea increase between 1975 and 2009? …[1] (ii) Identify one example of each of the following. A A manufacturing industry which was important in South Korea in 1975. … B A high technology industry which was important in South Korea in 2009. …[2] www.theallpapers.com
Question paper, page 21
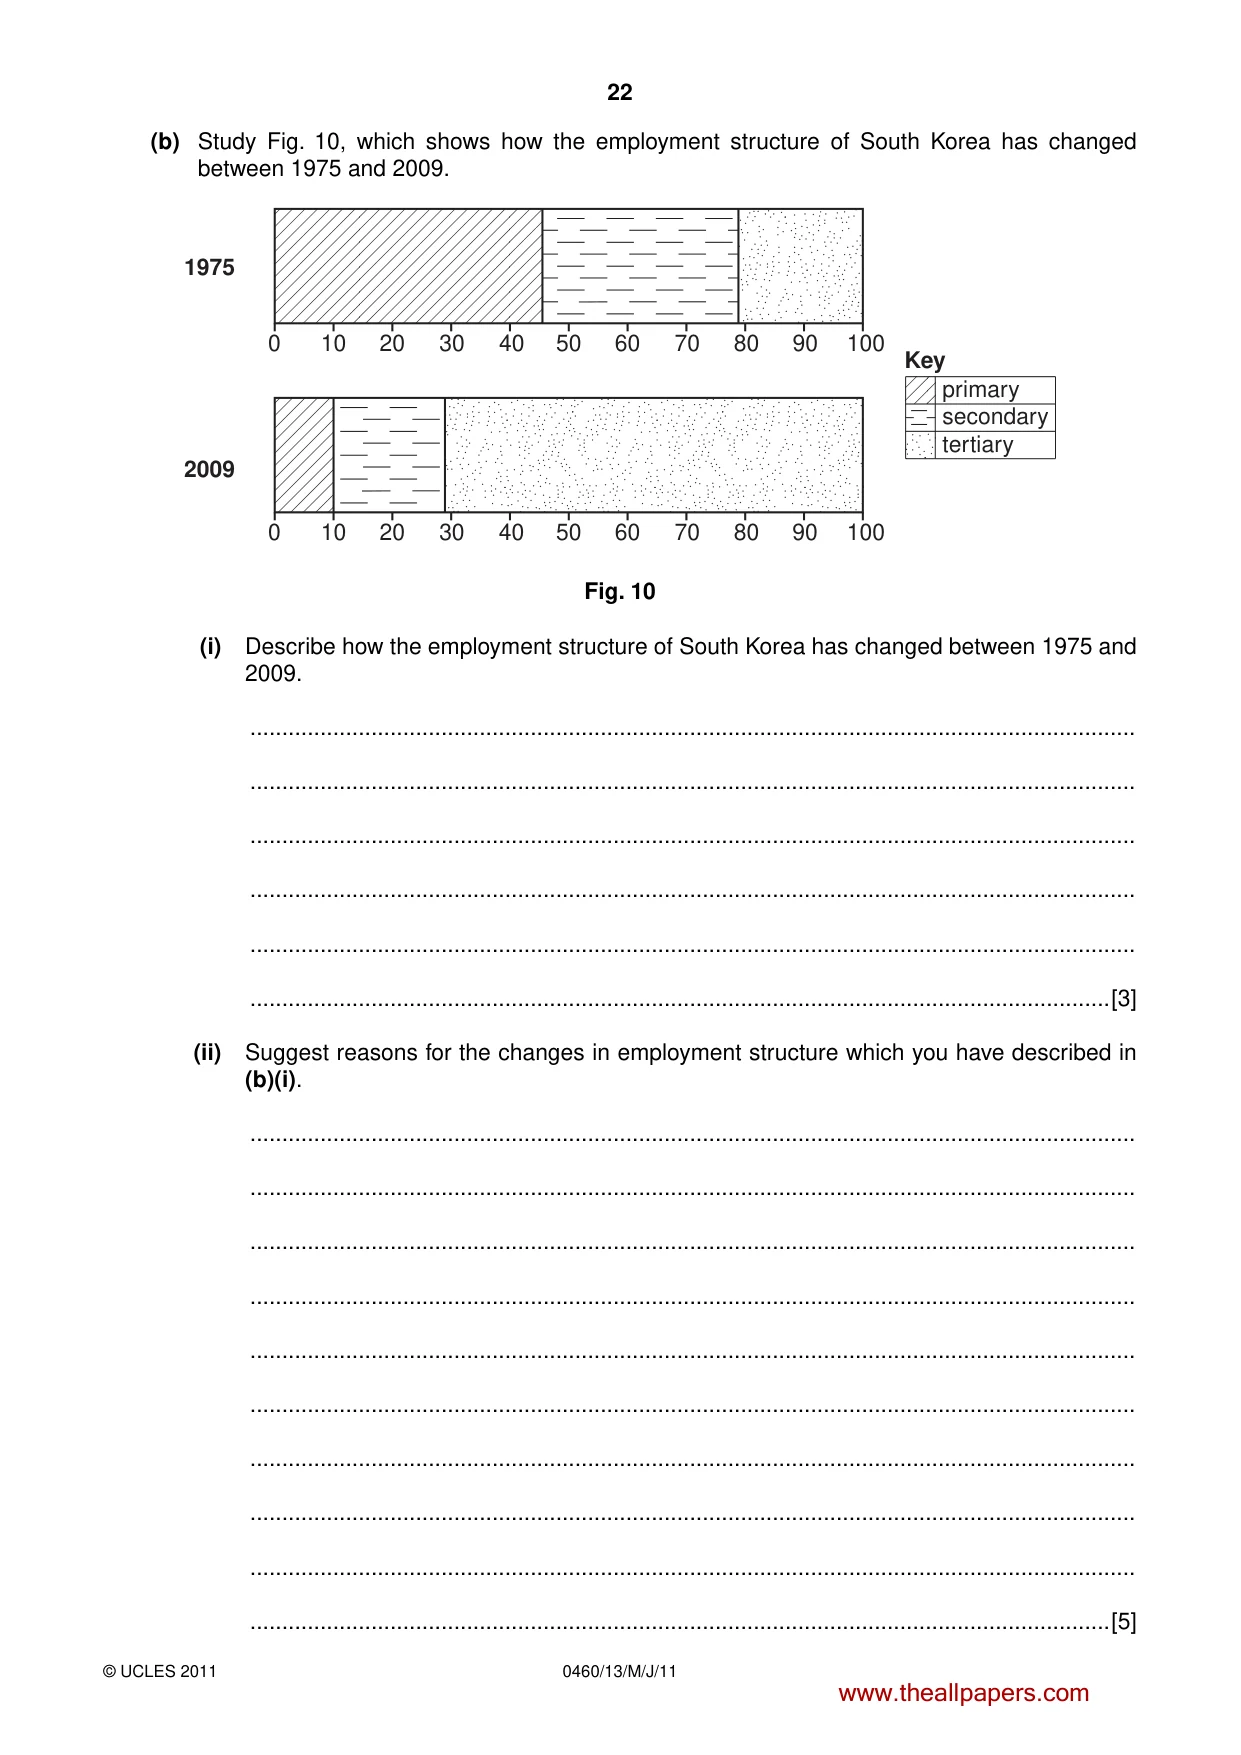
21 0460/13/M/J/11 © UCLES 2011 [Turn over (iii) Using only information from Fig. 9, state three different pieces of evidence which show that development has occurred in South Korea between 1975 and 2009. 1 … … 2 … … 3 … …[3] (iv) Explain why many large companies have located high technology industries in NICs, such as South Korea. … … … … … … … … …[4] www.theallpapers.com
Question paper, page 22
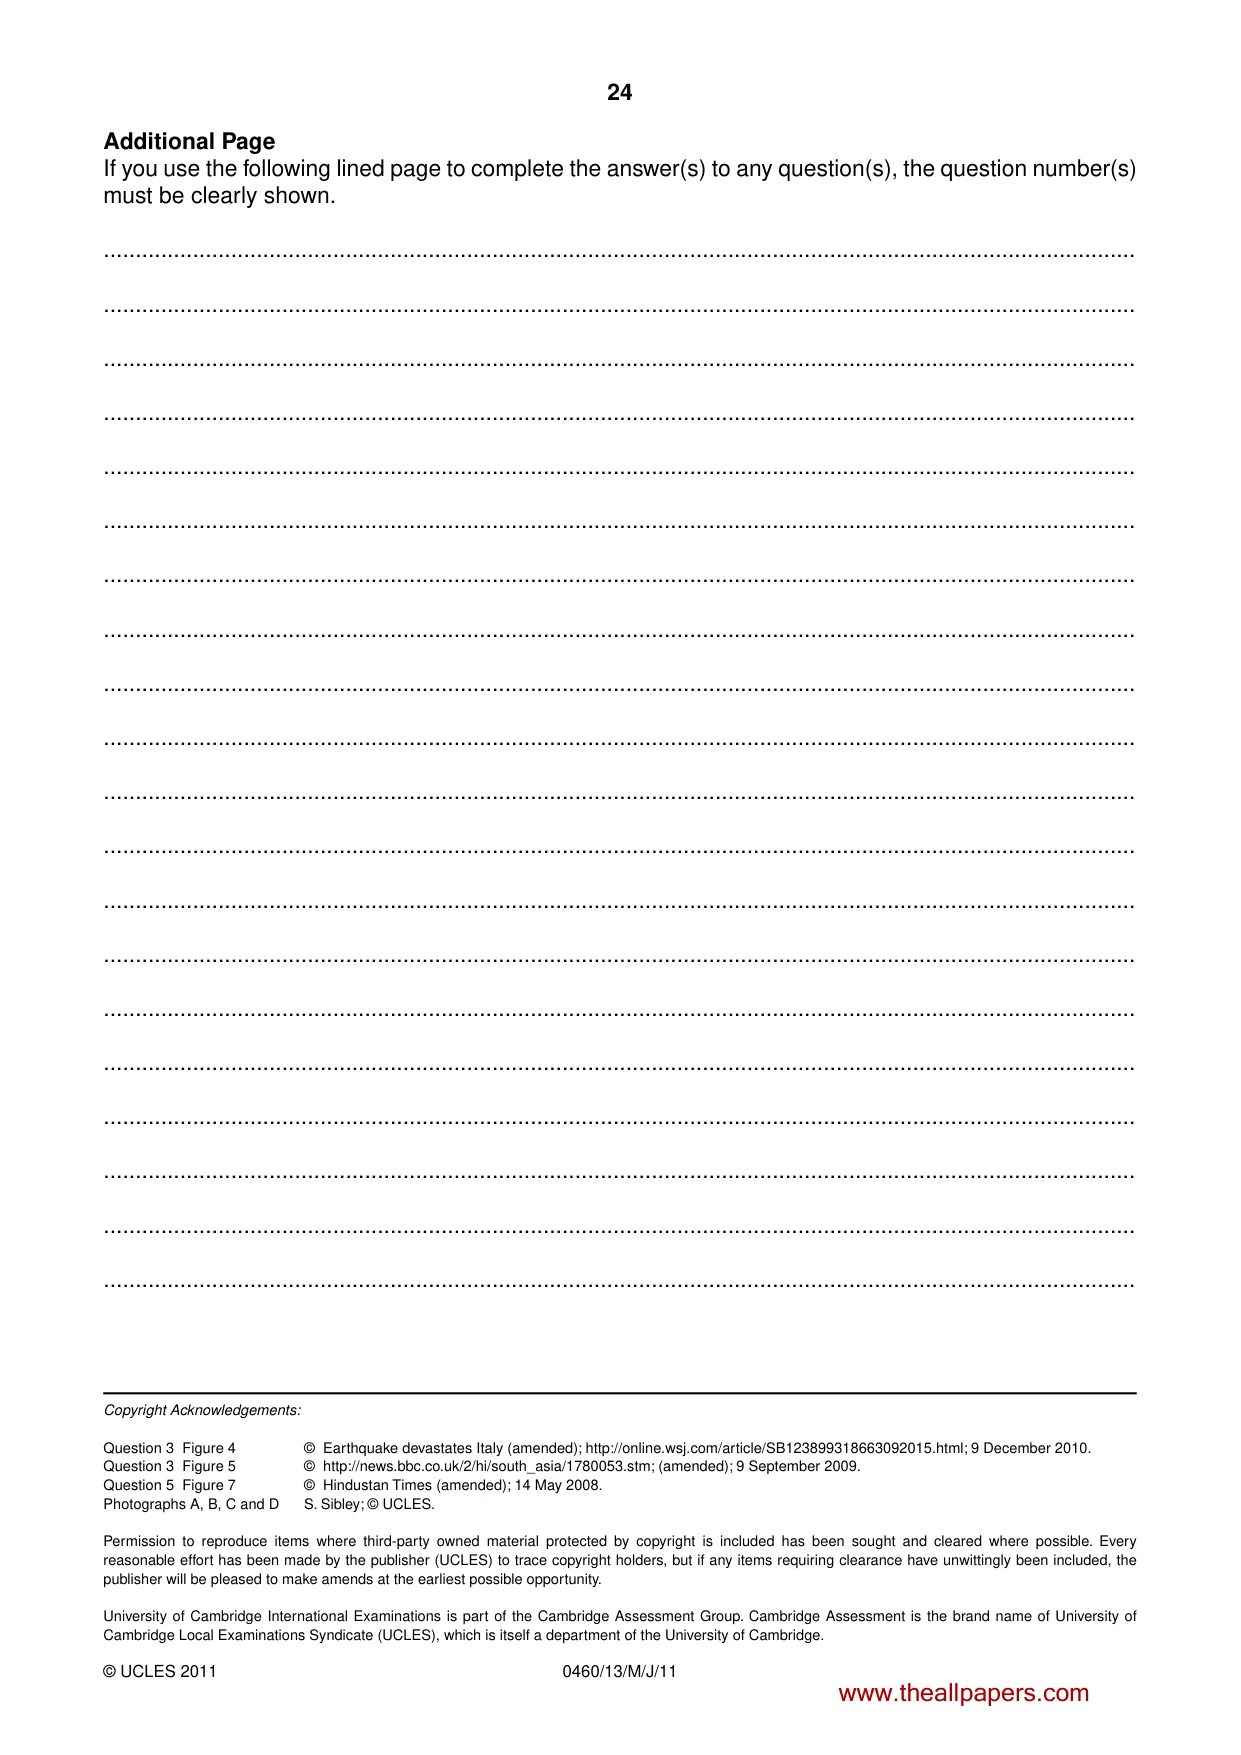
22 0460/13/M/J/11 © UCLES 2011 (b) Study Fig. 10, which shows how the employment structure of South Korea has changed between 1975 and 2009. 0 1975 Key primary secondary tertiary 2009 10 20 30 40 50 60 70 80 90 100 0 10 20 30 40 50 60 70 80 90 100 Fig. 10 (i) Describe how the employment structure of South Korea has changed between 1975 and 2009. … … … … … …[3] (ii) Suggest reasons for the changes in employment structure which you have described in (b)(i). … … … … … … … … … …[5] www.theallpapers.com
Question paper, page 23
23 0460/13/M/J/11 © UCLES 2011 (c) Give an example of a manufacturing or processing industry and name an area where this type of industry is located. Explain the factors which have attracted this type of industry to the area. Industry chosen … … … … … … … … … … … … … … … …[7] [Total: 25 marks] END OF QUESTION 6 www.theallpapers.com
Question paper, page 24
24 0460/13/M/J/11 © UCLES 2011 Additional Page If you use the following lined page to complete the answer(s) to any question(s), the question number(s) must be clearly shown. … … … … … … … … … … … … … … … … … … … … Copyright Acknowledgements: Question 3 Figure 4 © Earthquake devastates Italy (amended); http://online.wsj.com/article/SB123899318663092015.html; 9 December 2010. Question 3 Figure 5 © http://news.bbc.co.uk/2/hi/south_asia/1780053.stm; (amended); 9 September 2009. Question 5 Figure 7 © Hindustan Times (amended); 14 May 2008. Photographs A, B, C and D S. Sibley; © UCLES. Permission to reproduce items where third-party owned material protected by copyright is included has been sought and cleared where possible. Every reasonable effort has been made by the publisher (UCLES) to trace copyright holders, but if any items requiring clearance have unwittingly been included, the publisher will be pleased to make amends at the earliest possible opportunity. University of Cambridge International Examinations is part of the Cambridge Assessment Group. Cambridge Assessment is the brand name of University of Cambridge Local Examinations Syndicate (UCLES), which is itself a department of the University of Cambridge. www.theallpapers.com
Mark scheme, page 1
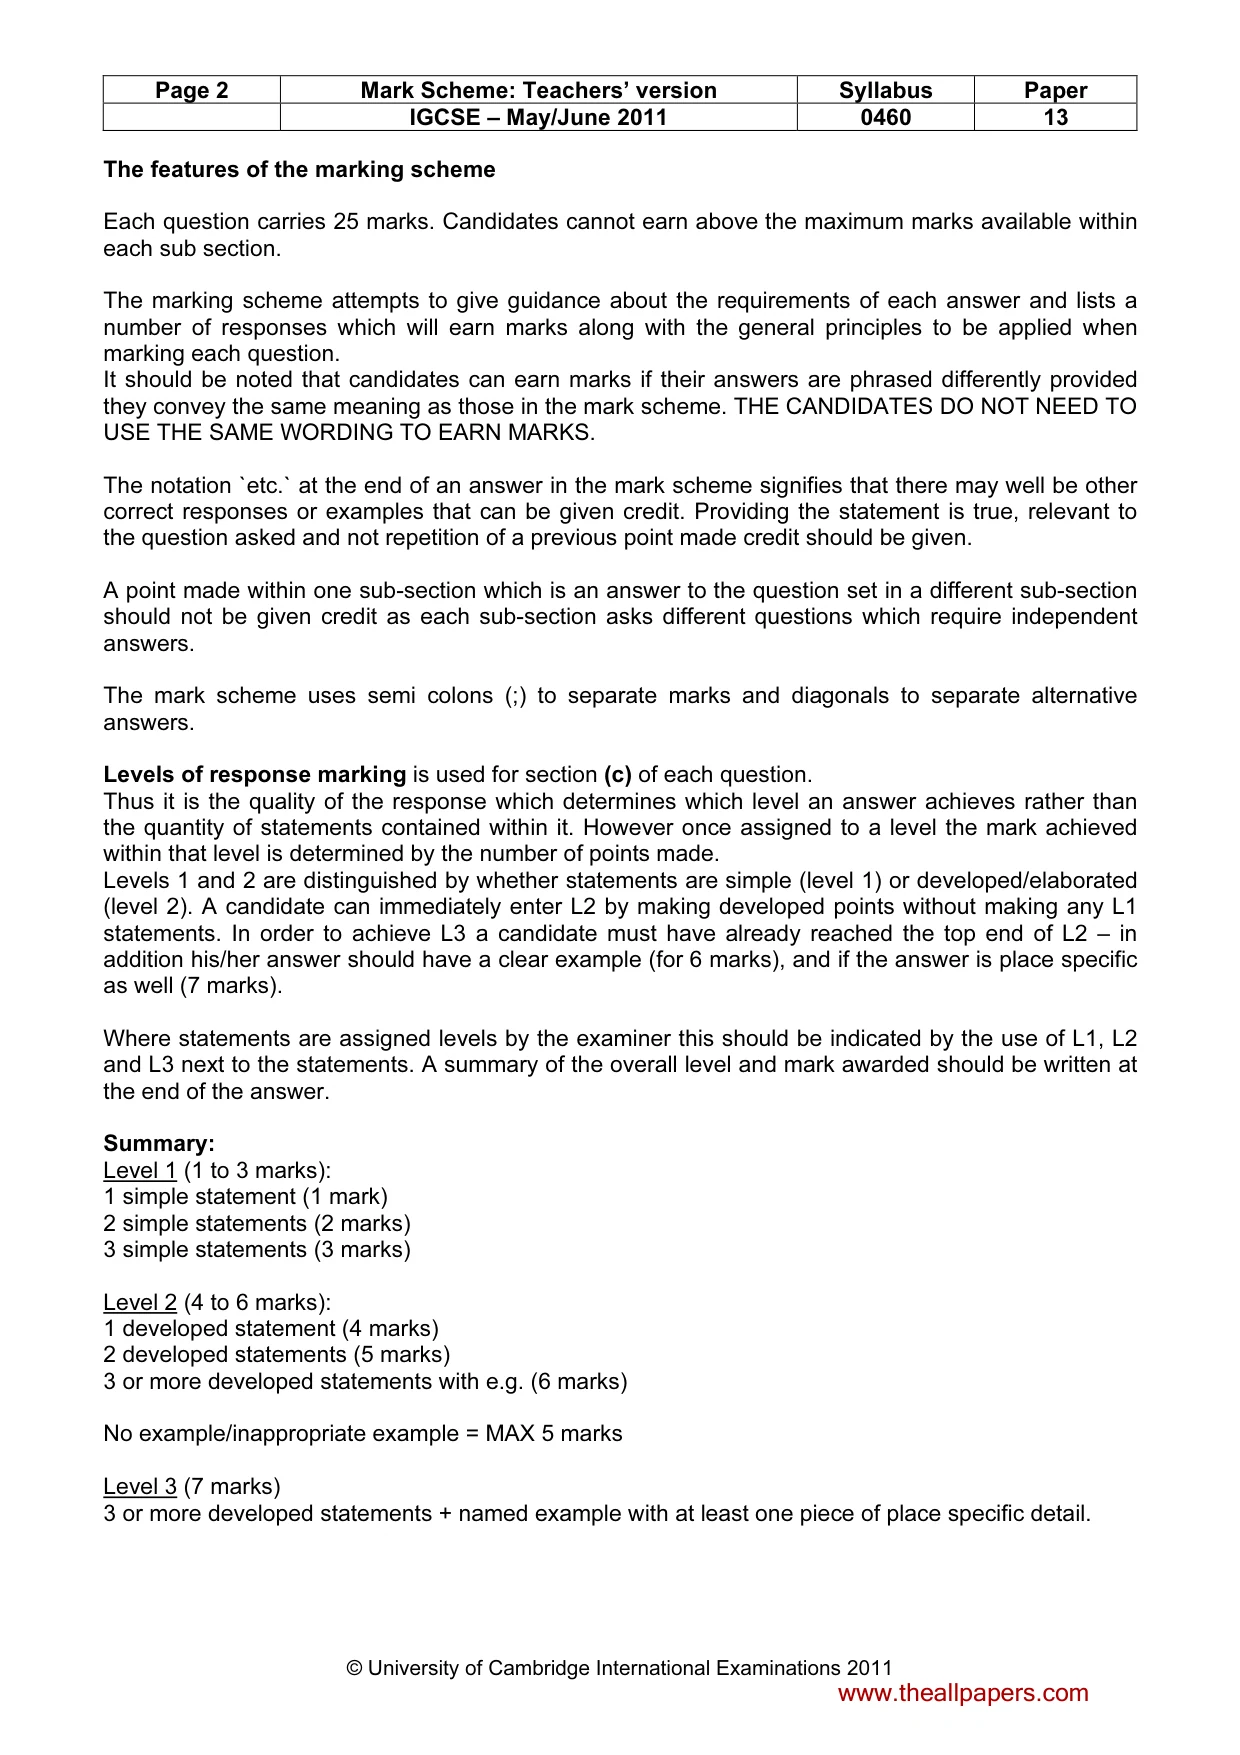
UNIVERSITY OF CAMBRIDGE INTERNATIONAL EXAMINATIONS International General Certificate of Secondary Education MARK SCHEME for the May/June 2011 question paper for the guidance of teachers 0460 GEOGRAPHY 0460/13 Paper 1, maximum raw mark 75 This mark scheme is published as an aid to teachers and candidates, to indicate the requirements of the examination. It shows the basis on which Examiners were instructed to award marks. It does not indicate the details of the discussions that took place at an Examiners’ meeting before marking began, which would have considered the acceptability of alternative answers. Mark schemes must be read in conjunction with the question papers and the report on the examination. • Cambridge will not enter into discussions or correspondence in connection with these mark schemes. Cambridge is publishing the mark schemes for the May/June 2011 question papers for most IGCSE, GCE Advanced Level and Advanced Subsidiary Level syllabuses and some Ordinary Level syllabuses. www.theallpapers.com
Mark scheme, page 2
Page 2 Mark Scheme: Teachers’ version Syllabus Paper IGCSE – May/June 2011 0460 13 © University of Cambridge International Examinations 2011 The features of the marking scheme Each question carries 25 marks. Candidates cannot earn above the maximum marks available within each sub section. The marking scheme attempts to give guidance about the requirements of each answer and lists a number of responses which will earn marks along with the general principles to be applied when marking each question. It should be noted that candidates can earn marks if their answers are phrased differently provided they convey the same meaning as those in the mark scheme. THE CANDIDATES DO NOT NEED TO USE THE SAME WORDING TO EARN MARKS. The notation `etc.` at the end of an answer in the mark scheme signifies that there may well be other correct responses or examples that can be given credit. Providing the statement is true, relevant to the question asked and not repetition of a previous point made credit should be given. A point made within one sub-section which is an answer to the question set in a different sub-section should not be given credit as each sub-section asks different questions which require independent answers. The mark scheme uses semi colons (;) to separate marks and diagonals to separate alternative answers. Levels of response marking is used for section (c) of each question. Thus it is the quality of the response which determines which level an answer achieves rather than the quantity of statements contained within it. However once assigned to a level the mark achieved within that level is determined by the number of points made. Levels 1 and 2 are distinguished by whether statements are simple (level 1) or developed/elaborated (level 2). A candidate can immediately enter L2 by making developed points without making any L1 statements. In order to achieve L3 a candidate must have already reached the top end of L2 – in addition his/her answer should have a clear example (for 6 marks), and if the answer is place specific as well (7 marks). Where statements are assigned levels by the examiner this should be indicated by the use of L1, L2 and L3 next to the statements. A summary of the overall level and mark awarded should be written at the end of the answer. Summary: Level 1 (1 to 3 marks): 1 simple statement (1 mark) 2 simple statements (2 marks) 3 simple statements (3 marks) Level 2 (4 to 6 marks): 1 developed statement (4 marks) 2 developed statements (5 marks) 3 or more developed statements with e.g. (6 marks) No example/inappropriate example = MAX 5 marks Level 3 (7 marks) 3 or more developed statements + named example with at least one piece of place specific detail. www.theallpapers.com
Mark scheme, page 3
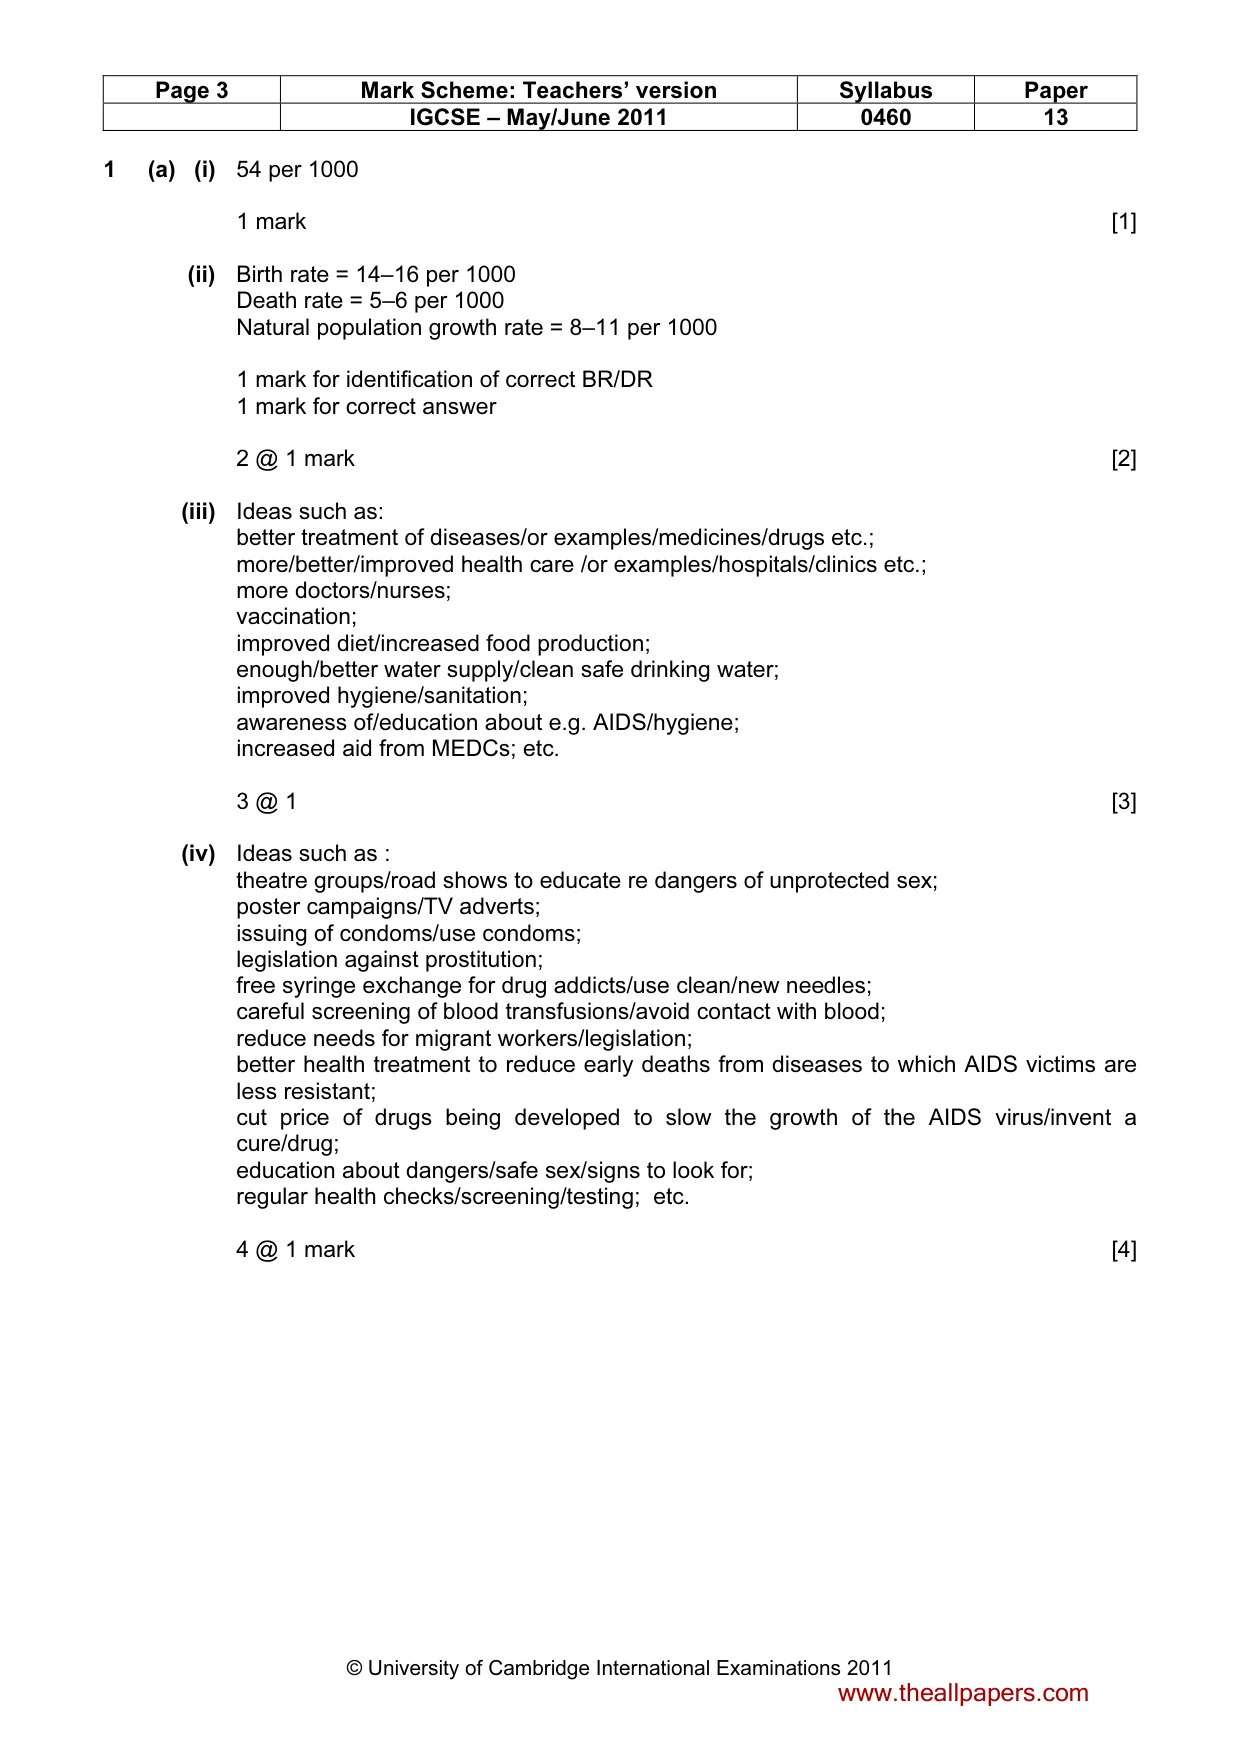
Page 3 Mark Scheme: Teachers’ version Syllabus Paper IGCSE – May/June 2011 0460 13 © University of Cambridge International Examinations 2011 1 (a) (i) 54 per 1000 1 mark [1] (ii) Birth rate = 14–16 per 1000 Death rate = 5–6 per 1000 Natural population growth rate = 8–11 per 1000 1 mark for identification of correct BR/DR 1 mark for correct answer 2 @ 1 mark [2] (iii) Ideas such as: better treatment of diseases/or examples/medicines/drugs etc.; more/better/improved health care /or examples/hospitals/clinics etc.; more doctors/nurses; vaccination; improved diet/increased food production; enough/better water supply/clean safe drinking water; improved hygiene/sanitation; awareness of/education about e.g. AIDS/hygiene; increased aid from MEDCs; etc. 3 @ 1 [3] (iv) Ideas such as : theatre groups/road shows to educate re dangers of unprotected sex; poster campaigns/TV adverts; issuing of condoms/use condoms; legislation against prostitution; free syringe exchange for drug addicts/use clean/new needles; careful screening of blood transfusions/avoid contact with blood; reduce needs for migrant workers/legislation; better health treatment to reduce early deaths from diseases to which AIDS victims are less resistant; cut price of drugs being developed to slow the growth of the AIDS virus/invent a cure/drug; education about dangers/safe sex/signs to look for; regular health checks/screening/testing; etc. 4 @ 1 mark [4] www.theallpapers.com
Mark scheme, page 4
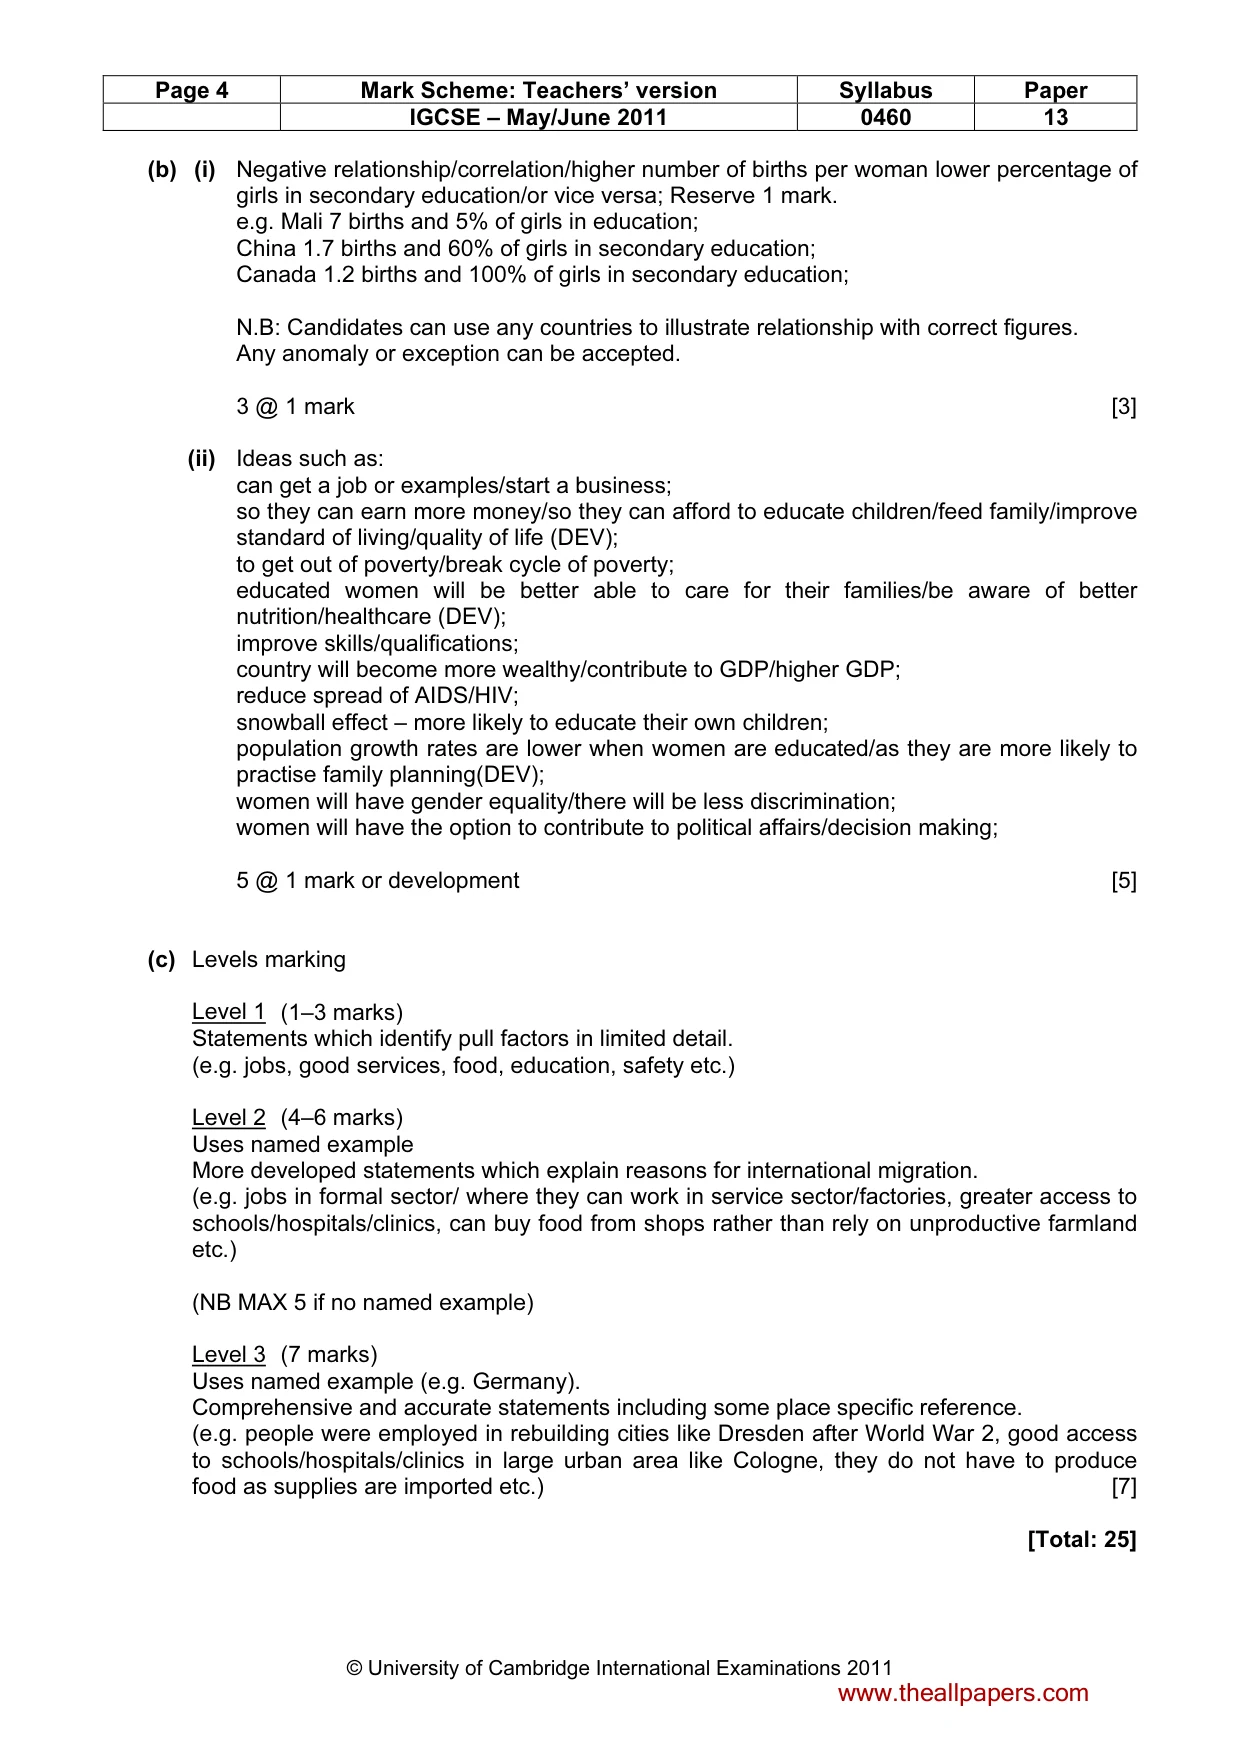
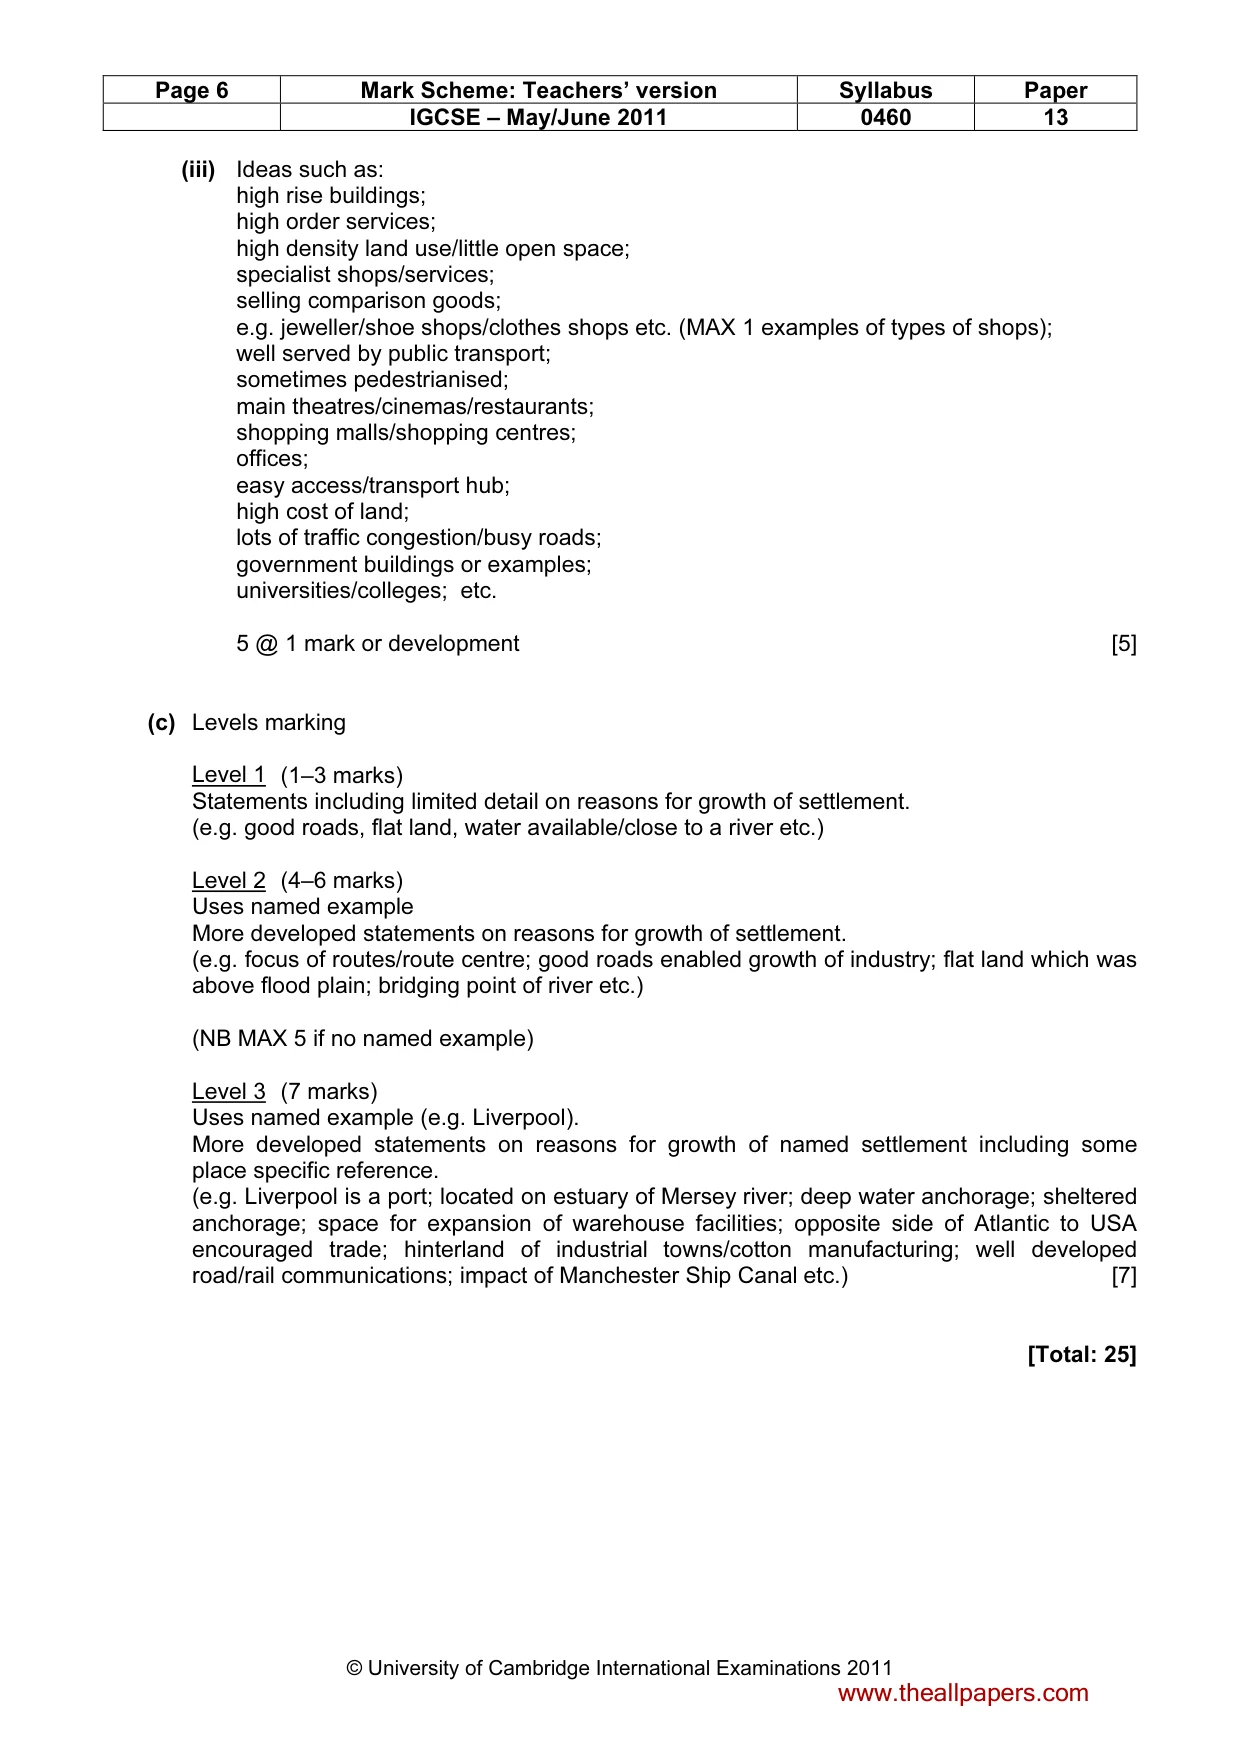
Page 4 Mark Scheme: Teachers’ version Syllabus Paper IGCSE – May/June 2011 0460 13 © University of Cambridge International Examinations 2011 (b) (i) Negative relationship/correlation/higher number of births per woman lower percentage of girls in secondary education/or vice versa; Reserve 1 mark. e.g. Mali 7 births and 5% of girls in education; China 1.7 births and 60% of girls in secondary education; Canada 1.2 births and 100% of girls in secondary education; N.B: Candidates can use any countries to illustrate relationship with correct figures. Any anomaly or exception can be accepted. 3 @ 1 mark [3] (ii) Ideas such as: can get a job or examples/start a business; so they can earn more money/so they can afford to educate children/feed family/improve standard of living/quality of life (DEV); to get out of poverty/break cycle of poverty; educated women will be better able to care for their families/be aware of better nutrition/healthcare (DEV); improve skills/qualifications; country will become more wealthy/contribute to GDP/higher GDP; reduce spread of AIDS/HIV; snowball effect – more likely to educate their own children; population growth rates are lower when women are educated/as they are more likely to practise family planning(DEV); women will have gender equality/there will be less discrimination; women will have the option to contribute to political affairs/decision making; 5 @ 1 mark or development [5] (c) Levels marking Level 1 (1–3 marks) Statements which identify pull factors in limited detail. (e.g. jobs, good services, food, education, safety etc.) Level 2 (4–6 marks) Uses named example More developed statements which explain reasons for international migration. (e.g. jobs in formal sector/ where they can work in service sector/factories, greater access to schools/hospitals/clinics, can buy food from shops rather than rely on unproductive farmland etc.) (NB MAX 5 if no named example) Level 3 (7 marks) Uses named example (e.g. Germany). Comprehensive and accurate statements including some place specific reference. (e.g. people were employed in rebuilding cities like Dresden after World War 2, good access to schools/hospitals/clinics in large urban area like Cologne, they do not have to produce food as supplies are imported etc.) [7] [Total: 25] www.theallpapers.com
Mark scheme, page 5
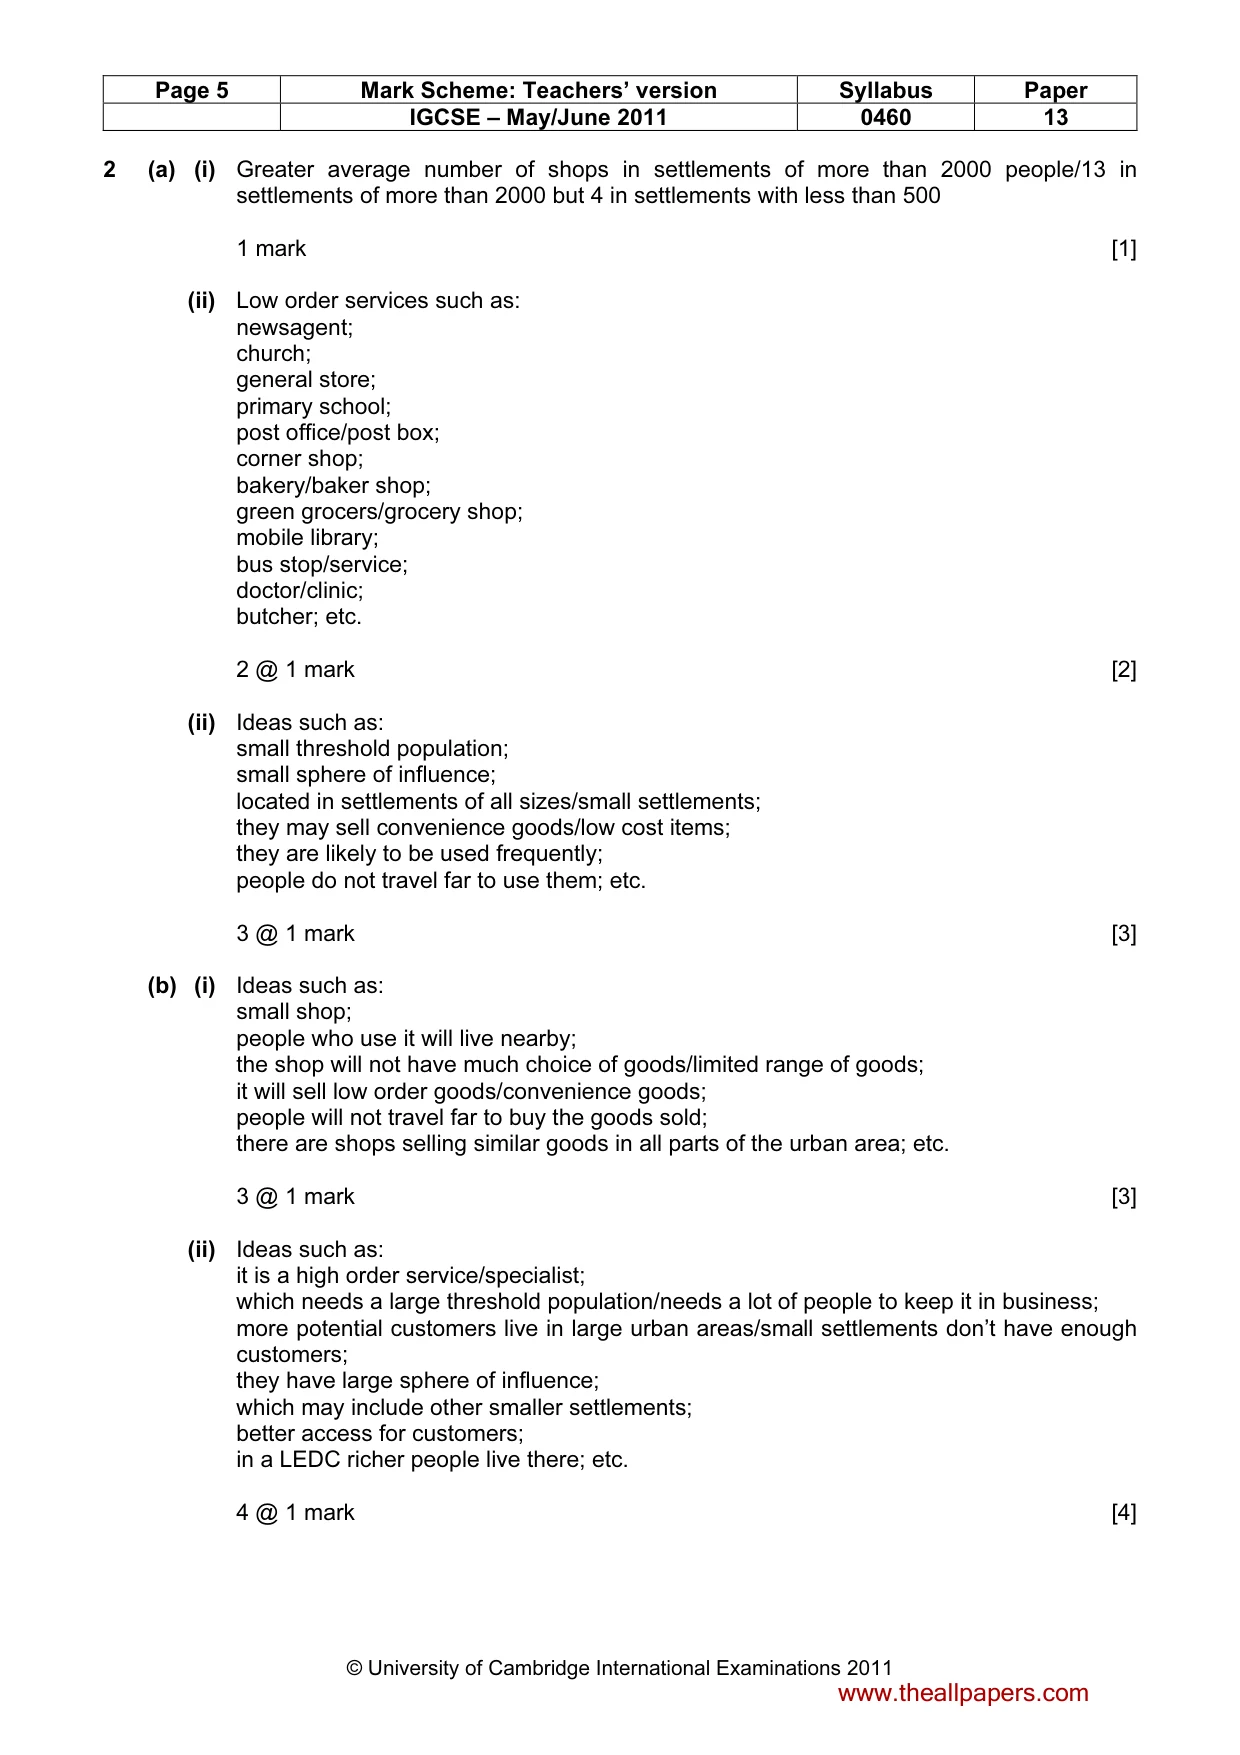
Page 5 Mark Scheme: Teachers’ version Syllabus Paper IGCSE – May/June 2011 0460 13 © University of Cambridge International Examinations 2011 2 (a) (i) Greater average number of shops in settlements of more than 2000 people/13 in settlements of more than 2000 but 4 in settlements with less than 500 1 mark [1] (ii) Low order services such as: newsagent; church; general store; primary school; post office/post box; corner shop; bakery/baker shop; green grocers/grocery shop; mobile library; bus stop/service; doctor/clinic; butcher; etc. 2 @ 1 mark [2] (ii) Ideas such as: small threshold population; small sphere of influence; located in settlements of all sizes/small settlements; they may sell convenience goods/low cost items; they are likely to be used frequently; people do not travel far to use them; etc. 3 @ 1 mark [3] (b) (i) Ideas such as: small shop; people who use it will live nearby; the shop will not have much choice of goods/limited range of goods; it will sell low order goods/convenience goods; people will not travel far to buy the goods sold; there are shops selling similar goods in all parts of the urban area; etc. 3 @ 1 mark [3] (ii) Ideas such as: it is a high order service/specialist; which needs a large threshold population/needs a lot of people to keep it in business; more potential customers live in large urban areas/small settlements don’t have enough customers; they have large sphere of influence; which may include other smaller settlements; better access for customers; in a LEDC richer people live there; etc. 4 @ 1 mark [4] www.theallpapers.com
Mark scheme, page 6
Page 6 Mark Scheme: Teachers’ version Syllabus Paper IGCSE – May/June 2011 0460 13 © University of Cambridge International Examinations 2011 (iii) Ideas such as: high rise buildings; high order services; high density land use/little open space; specialist shops/services; selling comparison goods; e.g. jeweller/shoe shops/clothes shops etc. (MAX 1 examples of types of shops); well served by public transport; sometimes pedestrianised; main theatres/cinemas/restaurants; shopping malls/shopping centres; offices; easy access/transport hub; high cost of land; lots of traffic congestion/busy roads; government buildings or examples; universities/colleges; etc. 5 @ 1 mark or development [5] (c) Levels marking Level 1 (1–3 marks) Statements including limited detail on reasons for growth of settlement. (e.g. good roads, flat land, water available/close to a river etc.) Level 2 (4–6 marks) Uses named example More developed statements on reasons for growth of settlement. (e.g. focus of routes/route centre; good roads enabled growth of industry; flat land which was above flood plain; bridging point of river etc.) (NB MAX 5 if no named example) Level 3 (7 marks) Uses named example (e.g. Liverpool). More developed statements on reasons for growth of named settlement including some place specific reference. (e.g. Liverpool is a port; located on estuary of Mersey river; deep water anchorage; sheltered anchorage; space for expansion of warehouse facilities; opposite side of Atlantic to USA encouraged trade; hinterland of industrial towns/cotton manufacturing; well developed road/rail communications; impact of Manchester Ship Canal etc.) [7] [Total: 25] www.theallpapers.com
Mark scheme, page 7
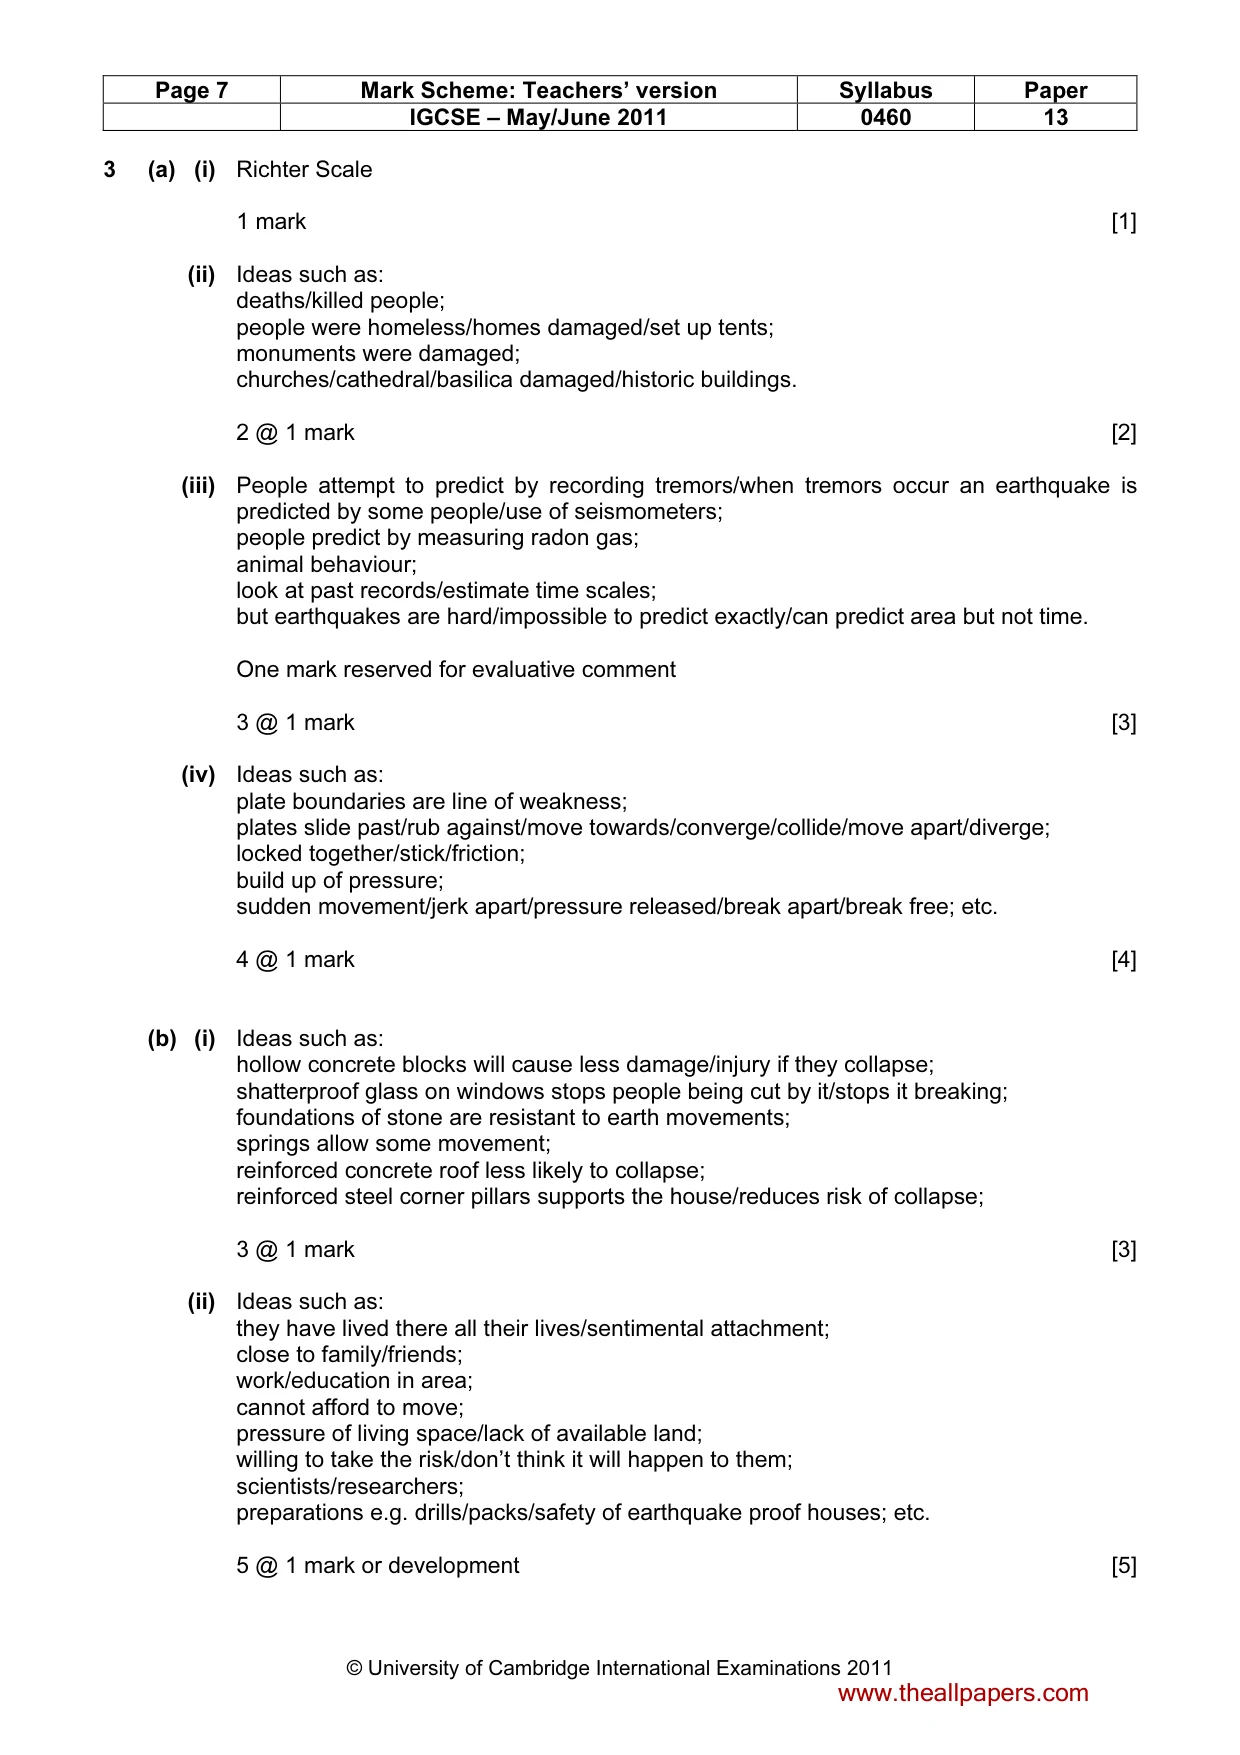
Page 7 Mark Scheme: Teachers’ version Syllabus Paper IGCSE – May/June 2011 0460 13 © University of Cambridge International Examinations 2011 3 (a) (i) Richter Scale 1 mark [1] (ii) Ideas such as: deaths/killed people; people were homeless/homes damaged/set up tents; monuments were damaged; churches/cathedral/basilica damaged/historic buildings. 2 @ 1 mark [2] (iii) People attempt to predict by recording tremors/when tremors occur an earthquake is predicted by some people/use of seismometers; people predict by measuring radon gas; animal behaviour; look at past records/estimate time scales; but earthquakes are hard/impossible to predict exactly/can predict area but not time. One mark reserved for evaluative comment 3 @ 1 mark [3] (iv) Ideas such as: plate boundaries are line of weakness; plates slide past/rub against/move towards/converge/collide/move apart/diverge; locked together/stick/friction; build up of pressure; sudden movement/jerk apart/pressure released/break apart/break free; etc. 4 @ 1 mark [4] (b) (i) Ideas such as: hollow concrete blocks will cause less damage/injury if they collapse; shatterproof glass on windows stops people being cut by it/stops it breaking; foundations of stone are resistant to earth movements; springs allow some movement; reinforced concrete roof less likely to collapse; reinforced steel corner pillars supports the house/reduces risk of collapse; 3 @ 1 mark [3] (ii) Ideas such as: they have lived there all their lives/sentimental attachment; close to family/friends; work/education in area; cannot afford to move; pressure of living space/lack of available land; willing to take the risk/don’t think it will happen to them; scientists/researchers; preparations e.g. drills/packs/safety of earthquake proof houses; etc. 5 @ 1 mark or development [5] www.theallpapers.com
Mark scheme, page 8
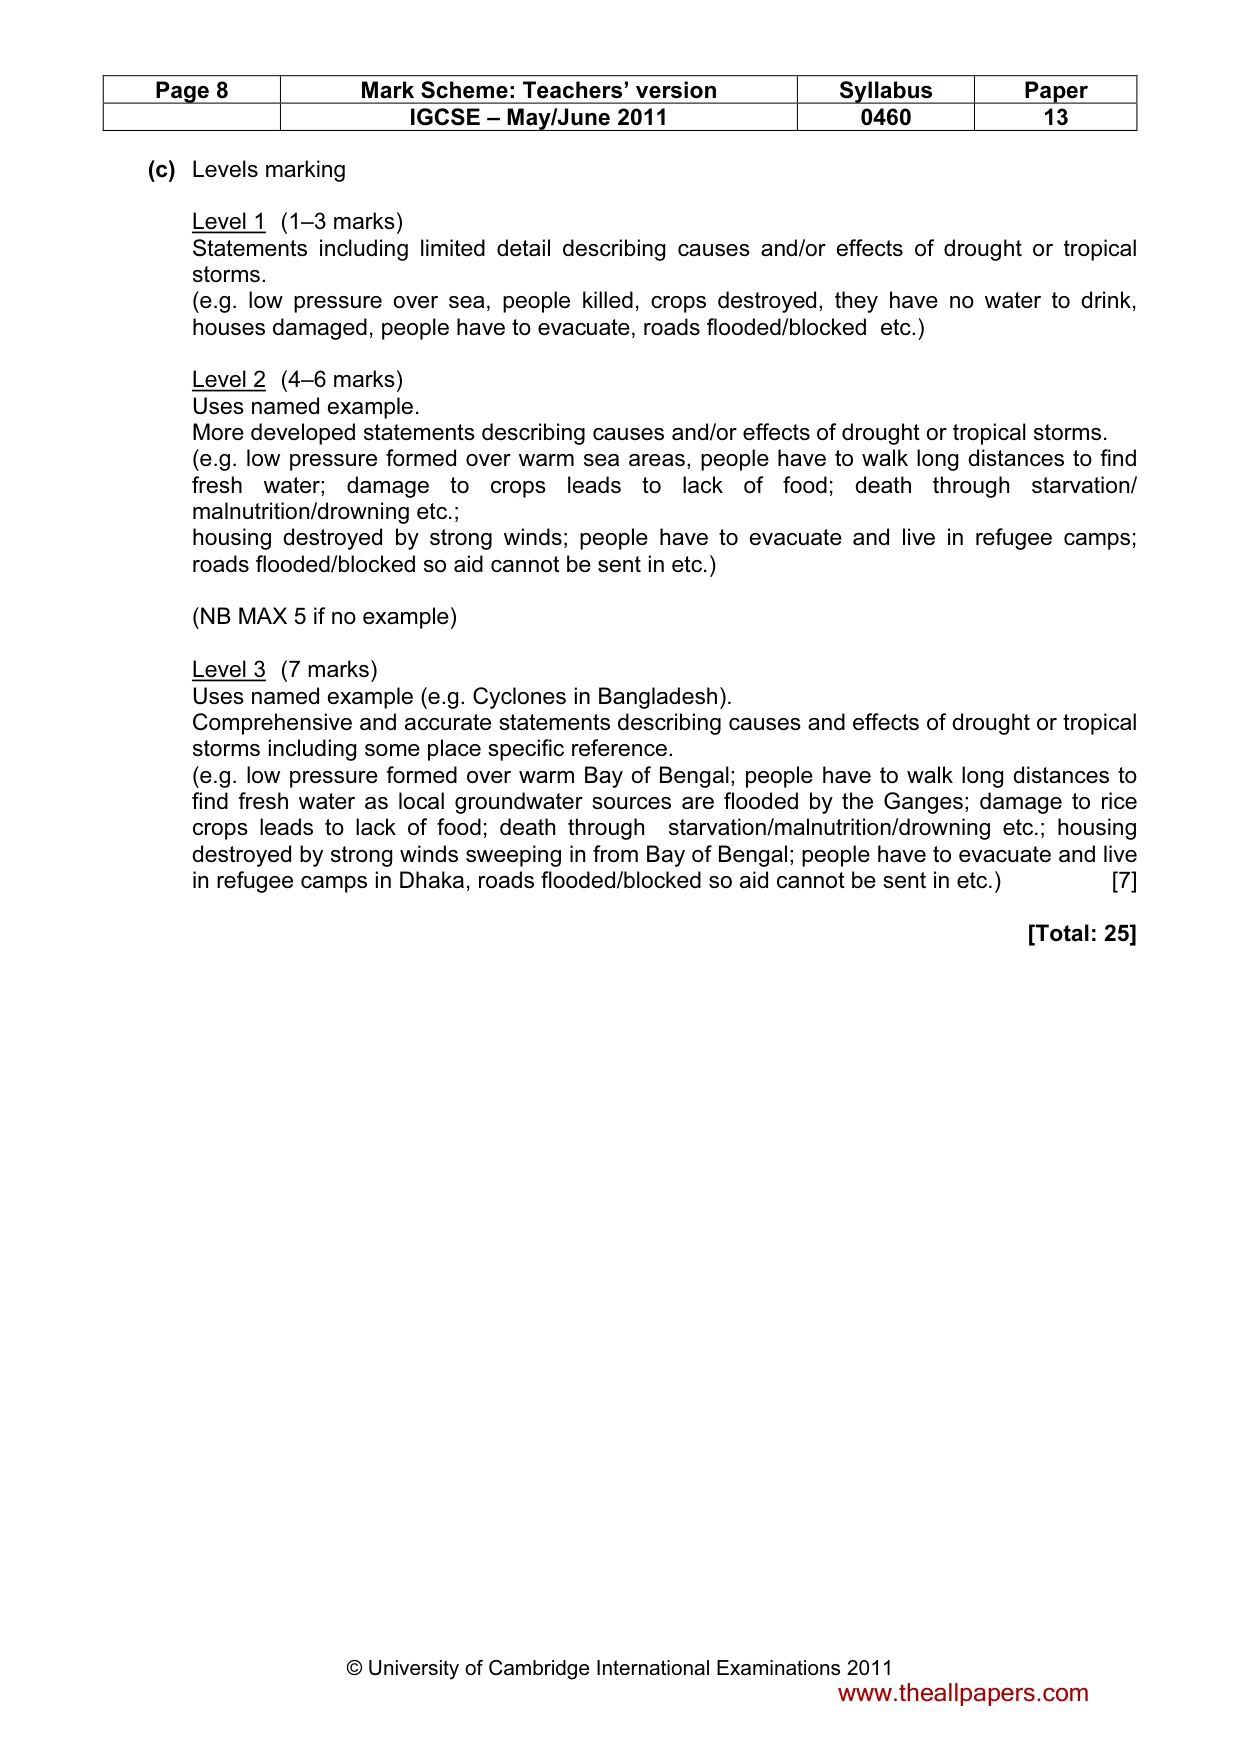
Page 8 Mark Scheme: Teachers’ version Syllabus Paper IGCSE – May/June 2011 0460 13 © University of Cambridge International Examinations 2011 (c) Levels marking Level 1 (1–3 marks) Statements including limited detail describing causes and/or effects of drought or tropical storms. (e.g. low pressure over sea, people killed, crops destroyed, they have no water to drink, houses damaged, people have to evacuate, roads flooded/blocked etc.) Level 2 (4–6 marks) Uses named example. More developed statements describing causes and/or effects of drought or tropical storms. (e.g. low pressure formed over warm sea areas, people have to walk long distances to find fresh water; damage to crops leads to lack of food; death through starvation/ malnutrition/drowning etc.; housing destroyed by strong winds; people have to evacuate and live in refugee camps; roads flooded/blocked so aid cannot be sent in etc.) (NB MAX 5 if no example) Level 3 (7 marks) Uses named example (e.g. Cyclones in Bangladesh). Comprehensive and accurate statements describing causes and effects of drought or tropical storms including some place specific reference. (e.g. low pressure formed over warm Bay of Bengal; people have to walk long distances to find fresh water as local groundwater sources are flooded by the Ganges; damage to rice crops leads to lack of food; death through starvation/malnutrition/drowning etc.; housing destroyed by strong winds sweeping in from Bay of Bengal; people have to evacuate and live in refugee camps in Dhaka, roads flooded/blocked so aid cannot be sent in etc.) [7] [Total: 25] www.theallpapers.com
Mark scheme, page 9
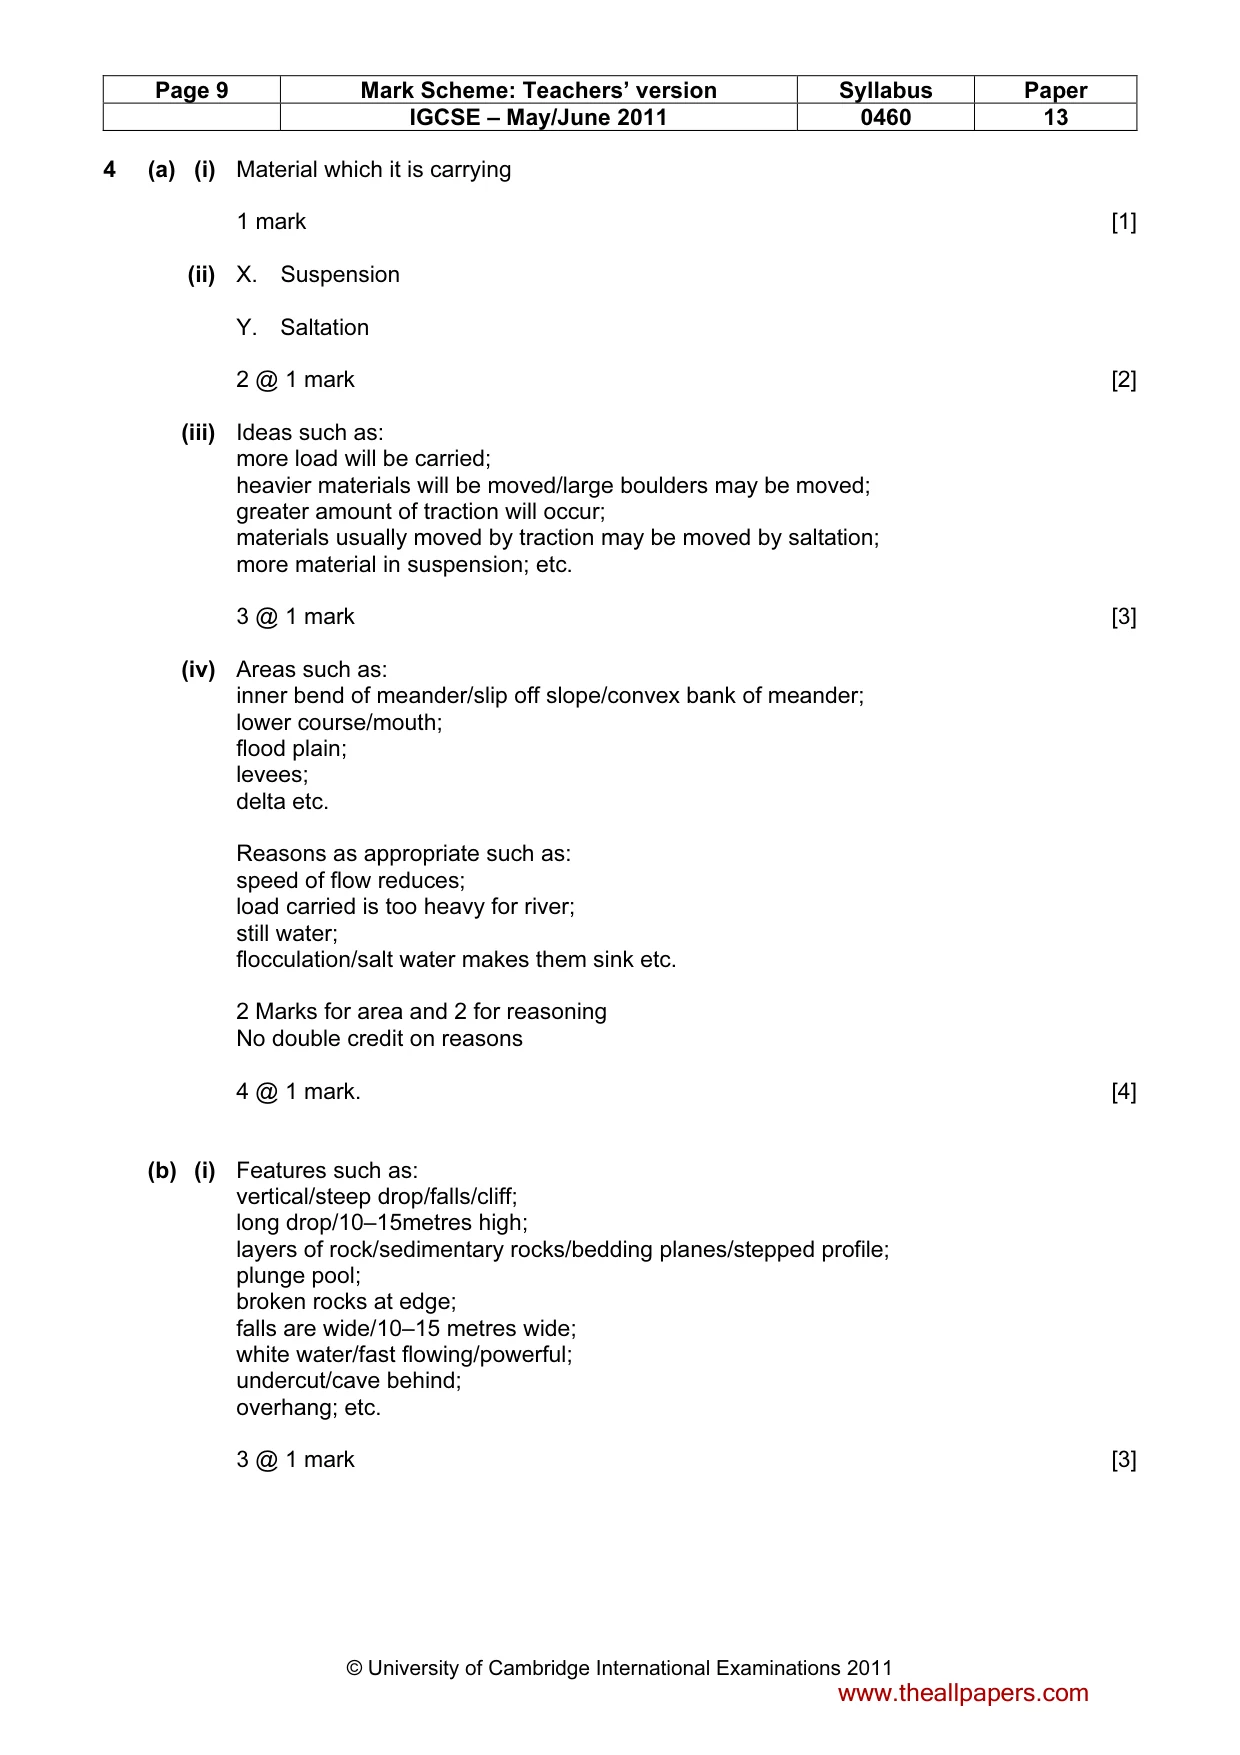
Page 9 Mark Scheme: Teachers’ version Syllabus Paper IGCSE – May/June 2011 0460 13 © University of Cambridge International Examinations 2011 4 (a) (i) Material which it is carrying 1 mark [1] (ii) X. Suspension Y. Saltation 2 @ 1 mark [2] (iii) Ideas such as: more load will be carried; heavier materials will be moved/large boulders may be moved; greater amount of traction will occur; materials usually moved by traction may be moved by saltation; more material in suspension; etc. 3 @ 1 mark [3] (iv) Areas such as: inner bend of meander/slip off slope/convex bank of meander; lower course/mouth; flood plain; levees; delta etc. Reasons as appropriate such as: speed of flow reduces; load carried is too heavy for river; still water; flocculation/salt water makes them sink etc. 2 Marks for area and 2 for reasoning No double credit on reasons 4 @ 1 mark. [4] (b) (i) Features such as: vertical/steep drop/falls/cliff; long drop/10–15metres high; layers of rock/sedimentary rocks/bedding planes/stepped profile; plunge pool; broken rocks at edge; falls are wide/10–15 metres wide; white water/fast flowing/powerful; undercut/cave behind; overhang; etc. 3 @ 1 mark [3] www.theallpapers.com
Mark scheme, page 10
Page 10 Mark Scheme: Teachers’ version Syllabus Paper IGCSE – May/June 2011 0460 13 © University of Cambridge International Examinations 2011 (ii) Explanation of how a waterfall is formed which may include ideas such as: river flows across band of resistant/hard rock; underlain by softer rock; softer rock is eroded by hydraulic action/hard rock takes longer to erode; undercut/hard rock becomes unsupported; overhang collapses; plunge pool forms/deepens due to pressure of falling water; gorge formation/headward erosion/retreats; faulting/geological fault; etc. NB Credit points made either on labelled diagrams or in written text 5 @ 1 mark or development [5] (c) Levels marking Level 1 (1–3 marks) Statements including limited detail describing what can be done to reduce flooding. (e.g. build higher banks, plant trees in drainage basin, build dams/reservoirs along course of river, straighten river etc.) Level 2 (4–6 marks) Uses named example. More developed statements describing what can be done to reduce flooding. (e.g. build higher banks so the river will have a greater capacity; raise banks especially in areas where river flows at a higher level than flood plain; plant trees so flow will not be so flashy/so less water will get to river as more evapo-transpiration occurs; build dams to regulate flow of water; straighten river so water is removed from drainage basin more quickly etc.) (NB MAX 5 marks if no named example) Level 3 (7 marks) Uses named example (e.g. River Mississippi). Comprehensive and accurate statements including some place specific reference. (e.g. built high levees so the river will have a greater capacity; raised banks protecting cities like Memphis where river flows at a higher level than flood plain; planting trees in Tennessee Valley so flow will not be so flashy/so less water will get to river as more evapo-transpiration occurs; much straightening of river/meanders cut off between New Orleans and Memphis etc.) [7] [Total: 25] www.theallpapers.com
Mark scheme, page 11
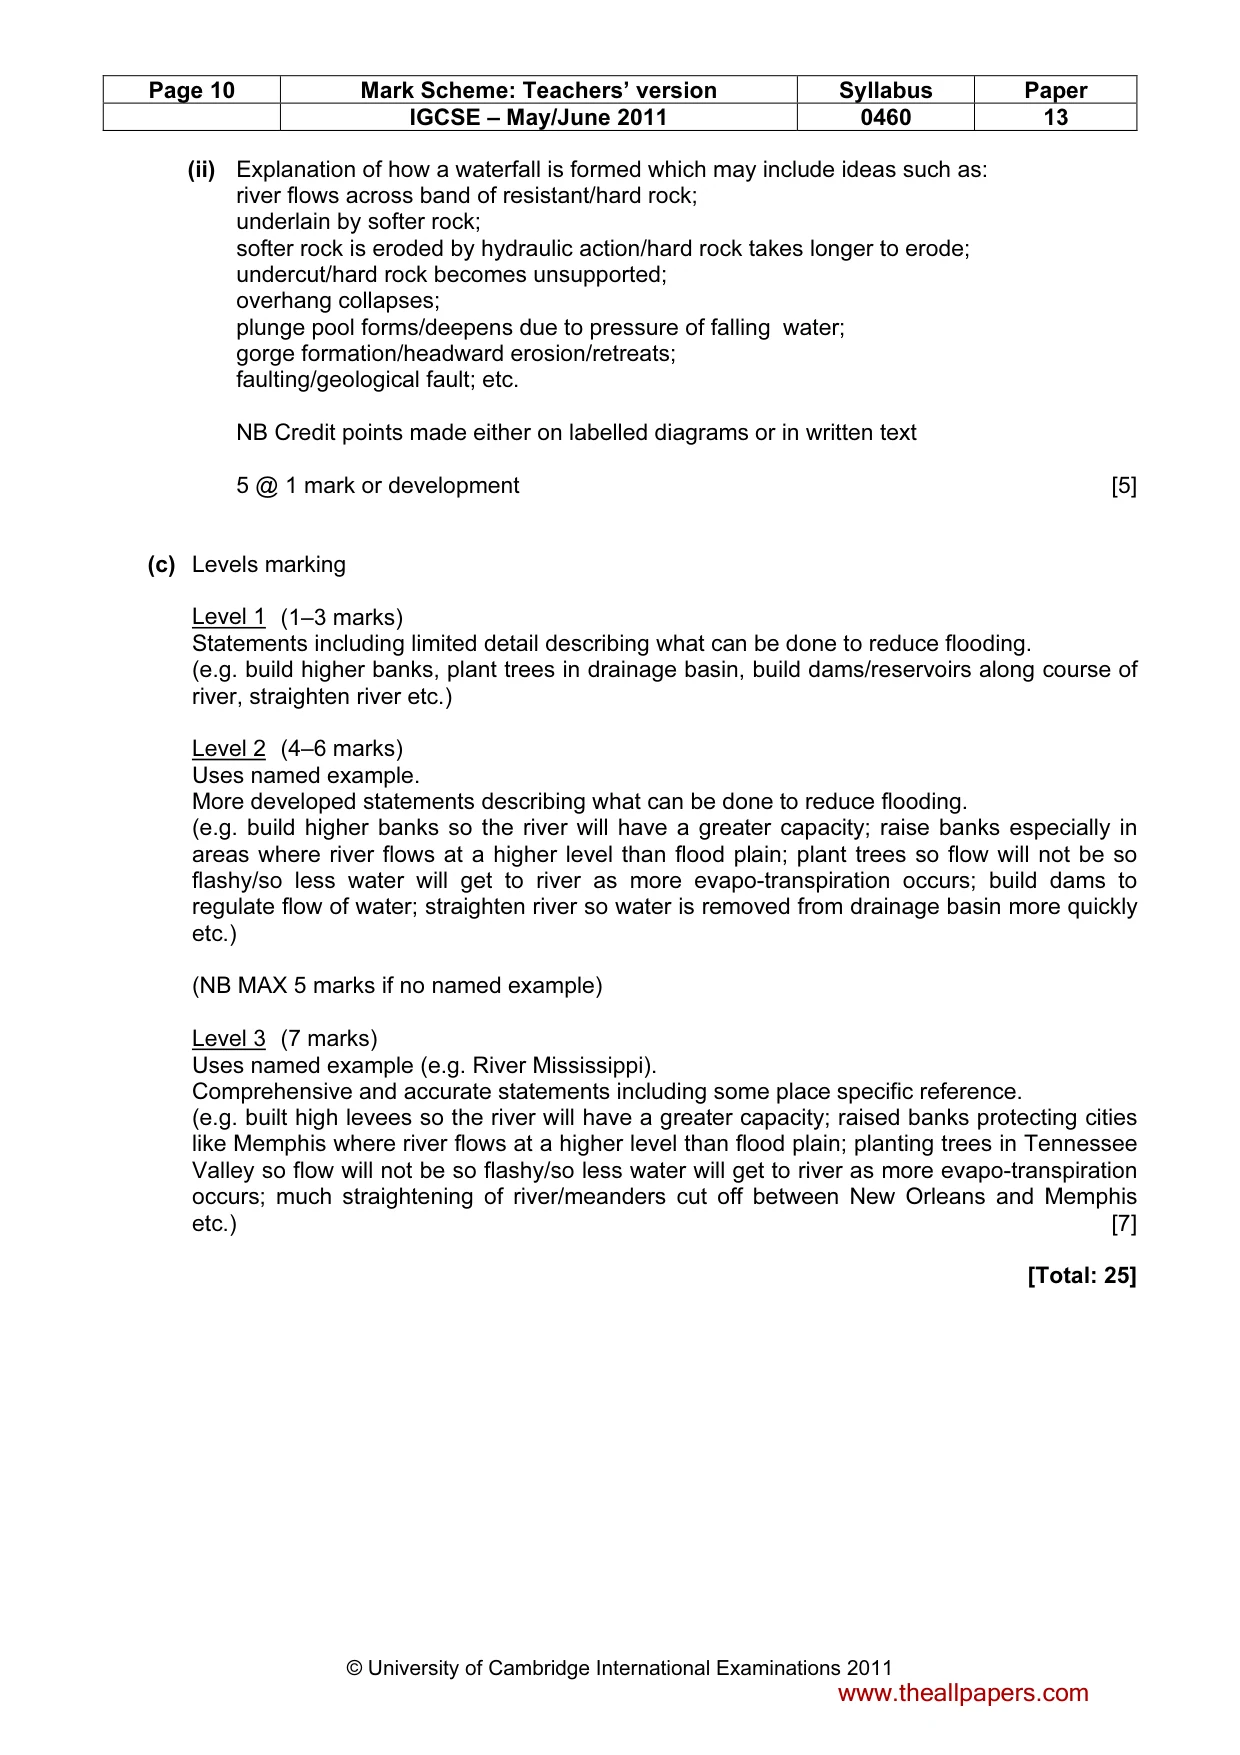
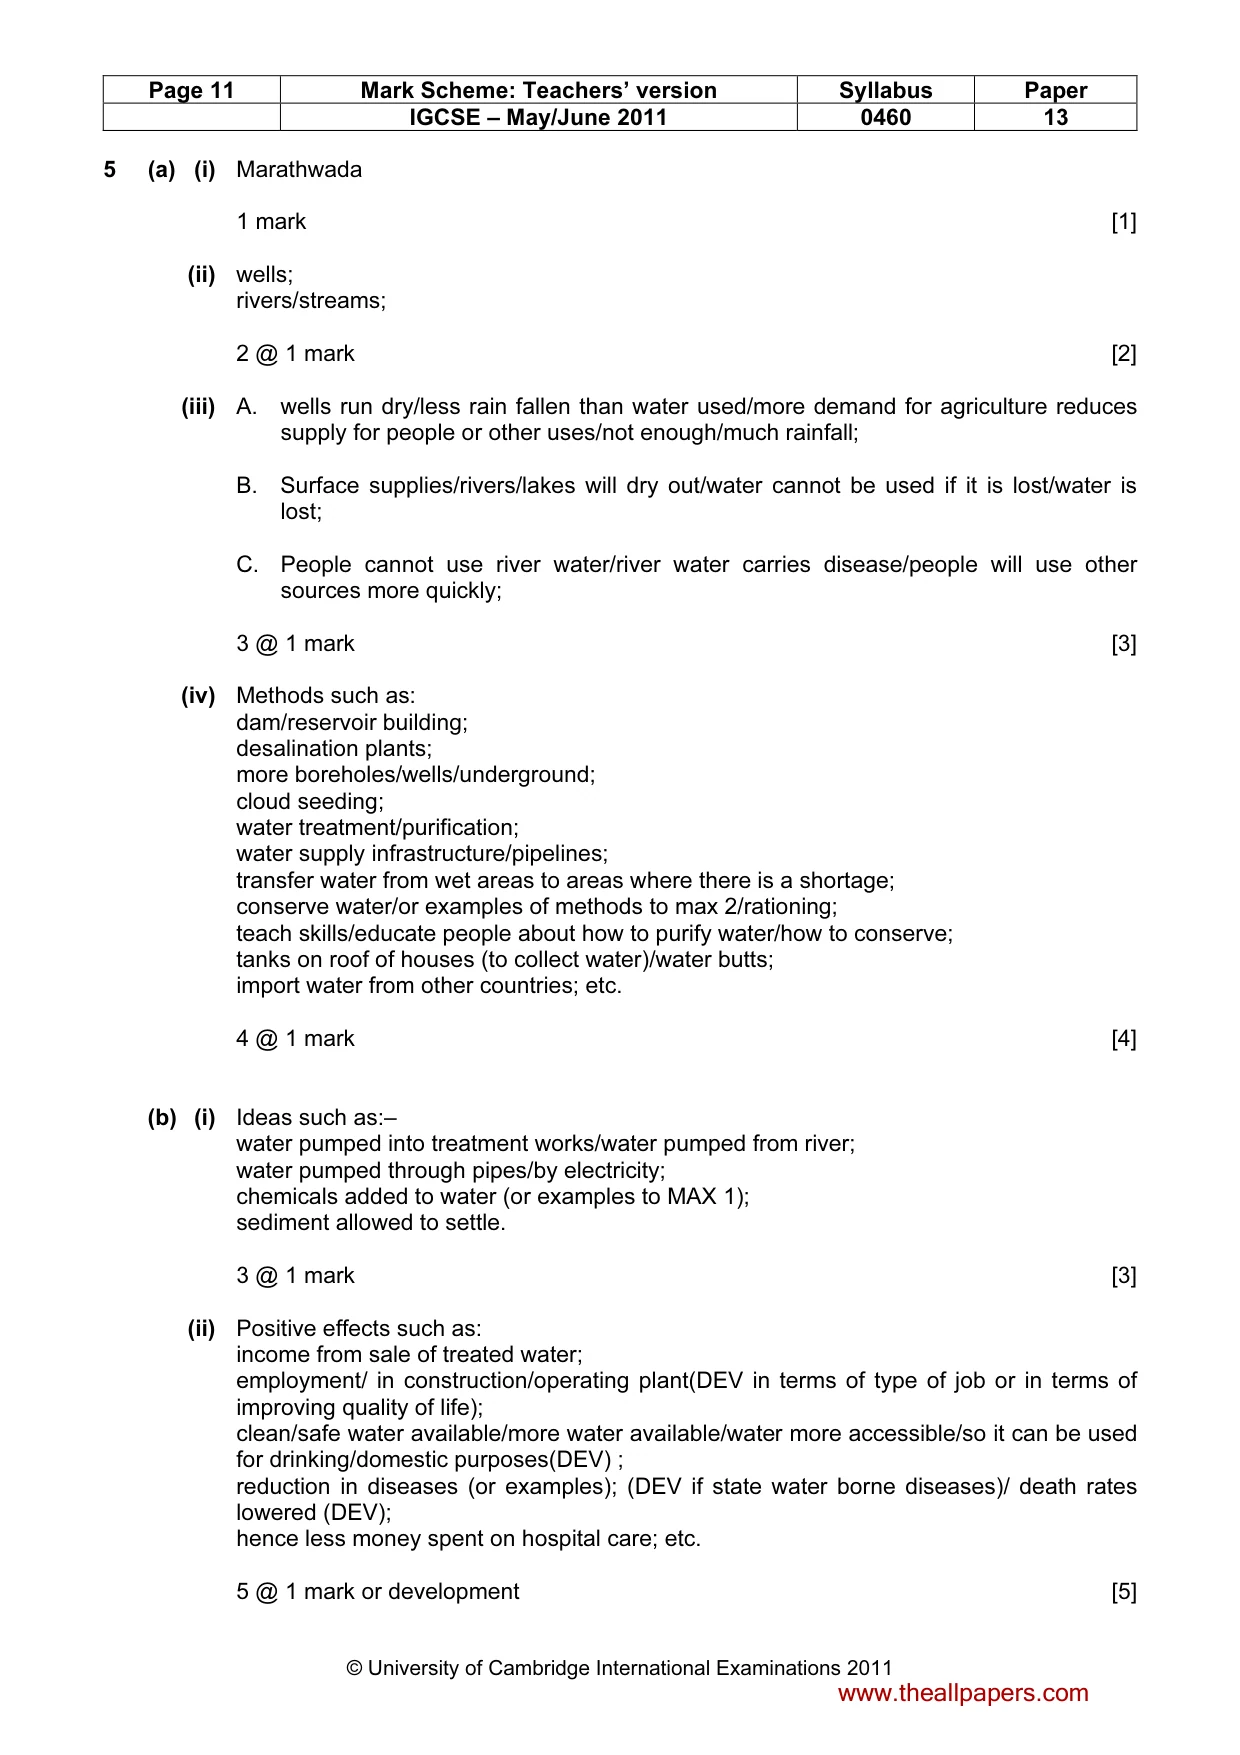
Page 11 Mark Scheme: Teachers’ version Syllabus Paper IGCSE – May/June 2011 0460 13 © University of Cambridge International Examinations 2011 5 (a) (i) Marathwada 1 mark [1] (ii) wells; rivers/streams; 2 @ 1 mark [2] (iii) A. wells run dry/less rain fallen than water used/more demand for agriculture reduces supply for people or other uses/not enough/much rainfall; B. Surface supplies/rivers/lakes will dry out/water cannot be used if it is lost/water is lost; C. People cannot use river water/river water carries disease/people will use other sources more quickly; 3 @ 1 mark [3] (iv) Methods such as: dam/reservoir building; desalination plants; more boreholes/wells/underground; cloud seeding; water treatment/purification; water supply infrastructure/pipelines; transfer water from wet areas to areas where there is a shortage; conserve water/or examples of methods to max 2/rationing; teach skills/educate people about how to purify water/how to conserve; tanks on roof of houses (to collect water)/water butts; import water from other countries; etc. 4 @ 1 mark [4] (b) (i) Ideas such as:– water pumped into treatment works/water pumped from river; water pumped through pipes/by electricity; chemicals added to water (or examples to MAX 1); sediment allowed to settle. 3 @ 1 mark [3] (ii) Positive effects such as: income from sale of treated water; employment/ in construction/operating plant(DEV in terms of type of job or in terms of improving quality of life); clean/safe water available/more water available/water more accessible/so it can be used for drinking/domestic purposes(DEV) ; reduction in diseases (or examples); (DEV if state water borne diseases)/ death rates lowered (DEV); hence less money spent on hospital care; etc. 5 @ 1 mark or development [5] www.theallpapers.com
Mark scheme, page 12
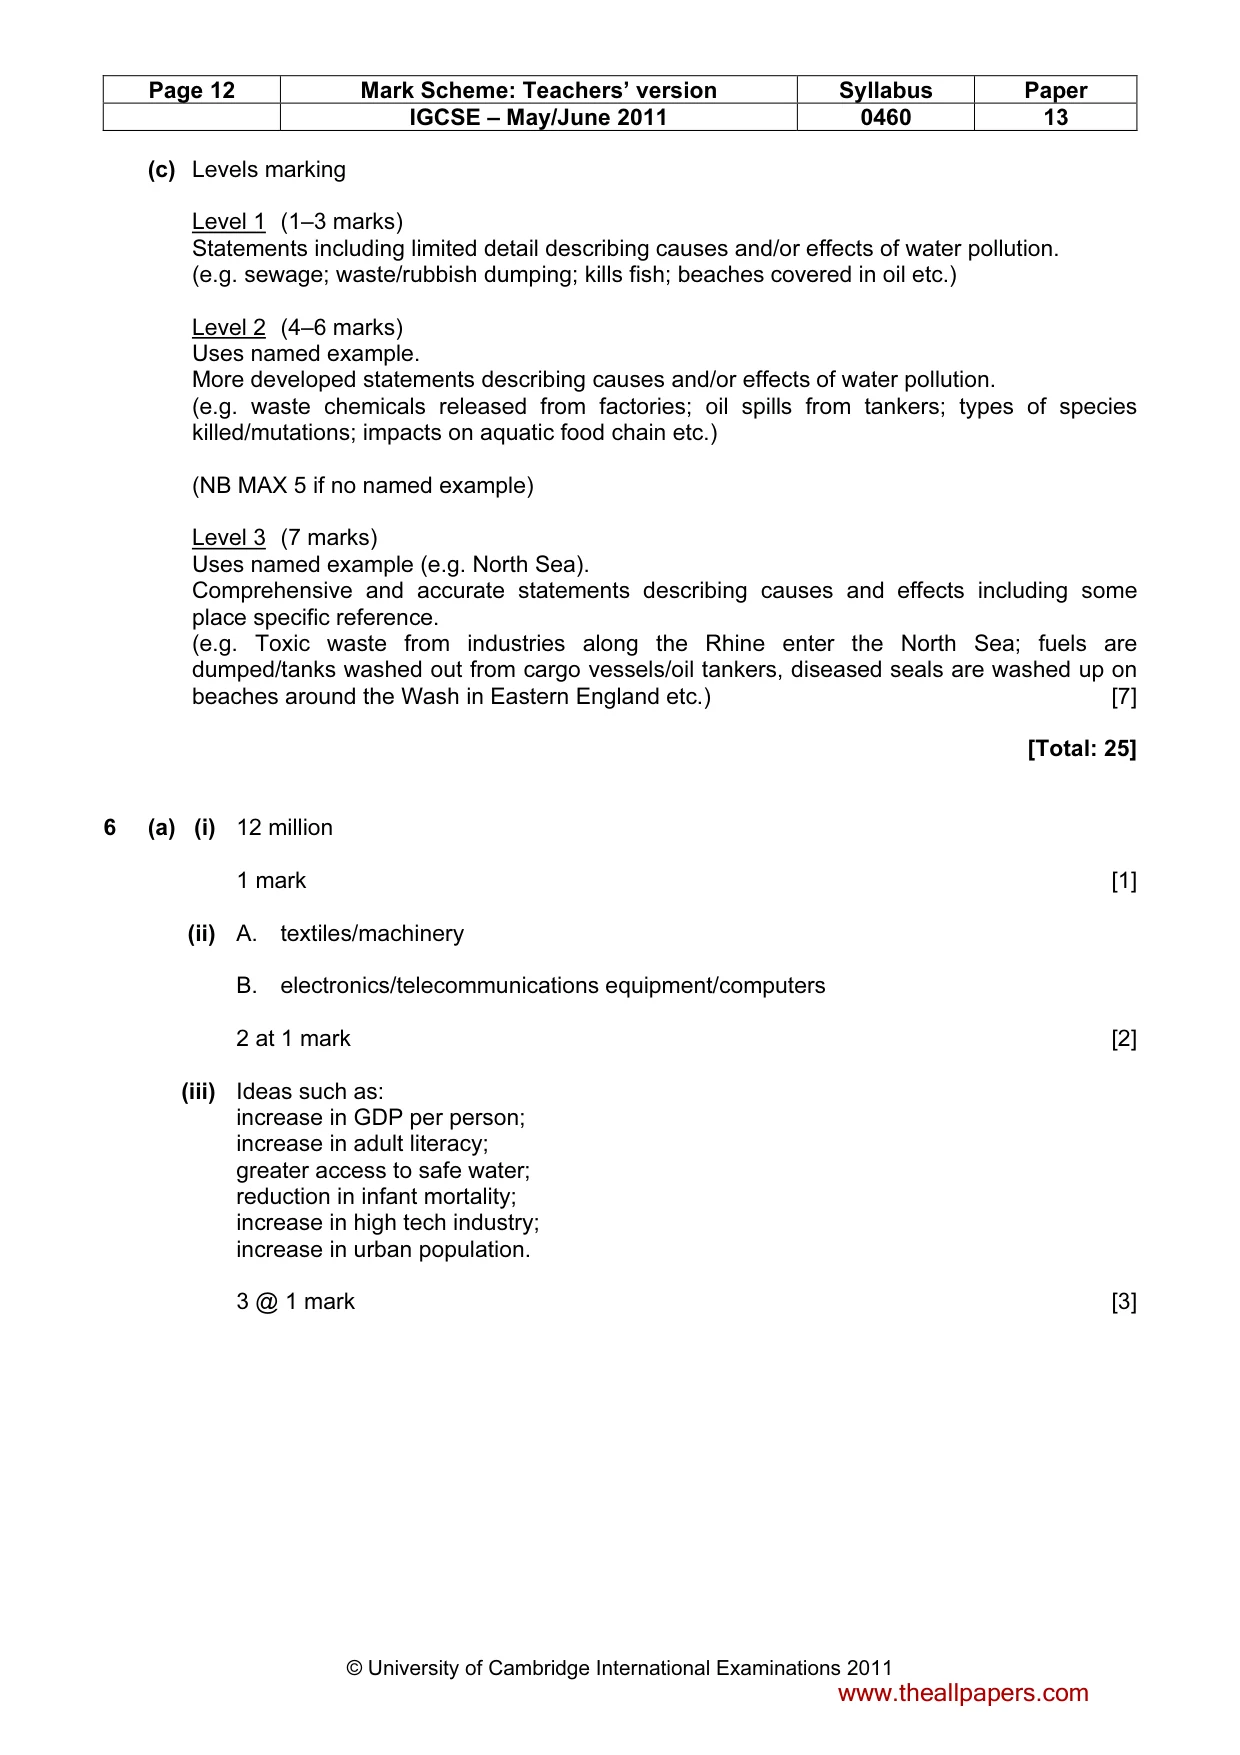
Page 12 Mark Scheme: Teachers’ version Syllabus Paper IGCSE – May/June 2011 0460 13 © University of Cambridge International Examinations 2011 (c) Levels marking Level 1 (1–3 marks) Statements including limited detail describing causes and/or effects of water pollution. (e.g. sewage; waste/rubbish dumping; kills fish; beaches covered in oil etc.) Level 2 (4–6 marks) Uses named example. More developed statements describing causes and/or effects of water pollution. (e.g. waste chemicals released from factories; oil spills from tankers; types of species killed/mutations; impacts on aquatic food chain etc.) (NB MAX 5 if no named example) Level 3 (7 marks) Uses named example (e.g. North Sea). Comprehensive and accurate statements describing causes and effects including some place specific reference. (e.g. Toxic waste from industries along the Rhine enter the North Sea; fuels are dumped/tanks washed out from cargo vessels/oil tankers, diseased seals are washed up on beaches around the Wash in Eastern England etc.) [7] [Total: 25] 6 (a) (i) 12 million 1 mark [1] (ii) A. textiles/machinery B. electronics/telecommunications equipment/computers 2 at 1 mark [2] (iii) Ideas such as: increase in GDP per person; increase in adult literacy; greater access to safe water; reduction in infant mortality; increase in high tech industry; increase in urban population. 3 @ 1 mark [3] www.theallpapers.com
Mark scheme, page 13
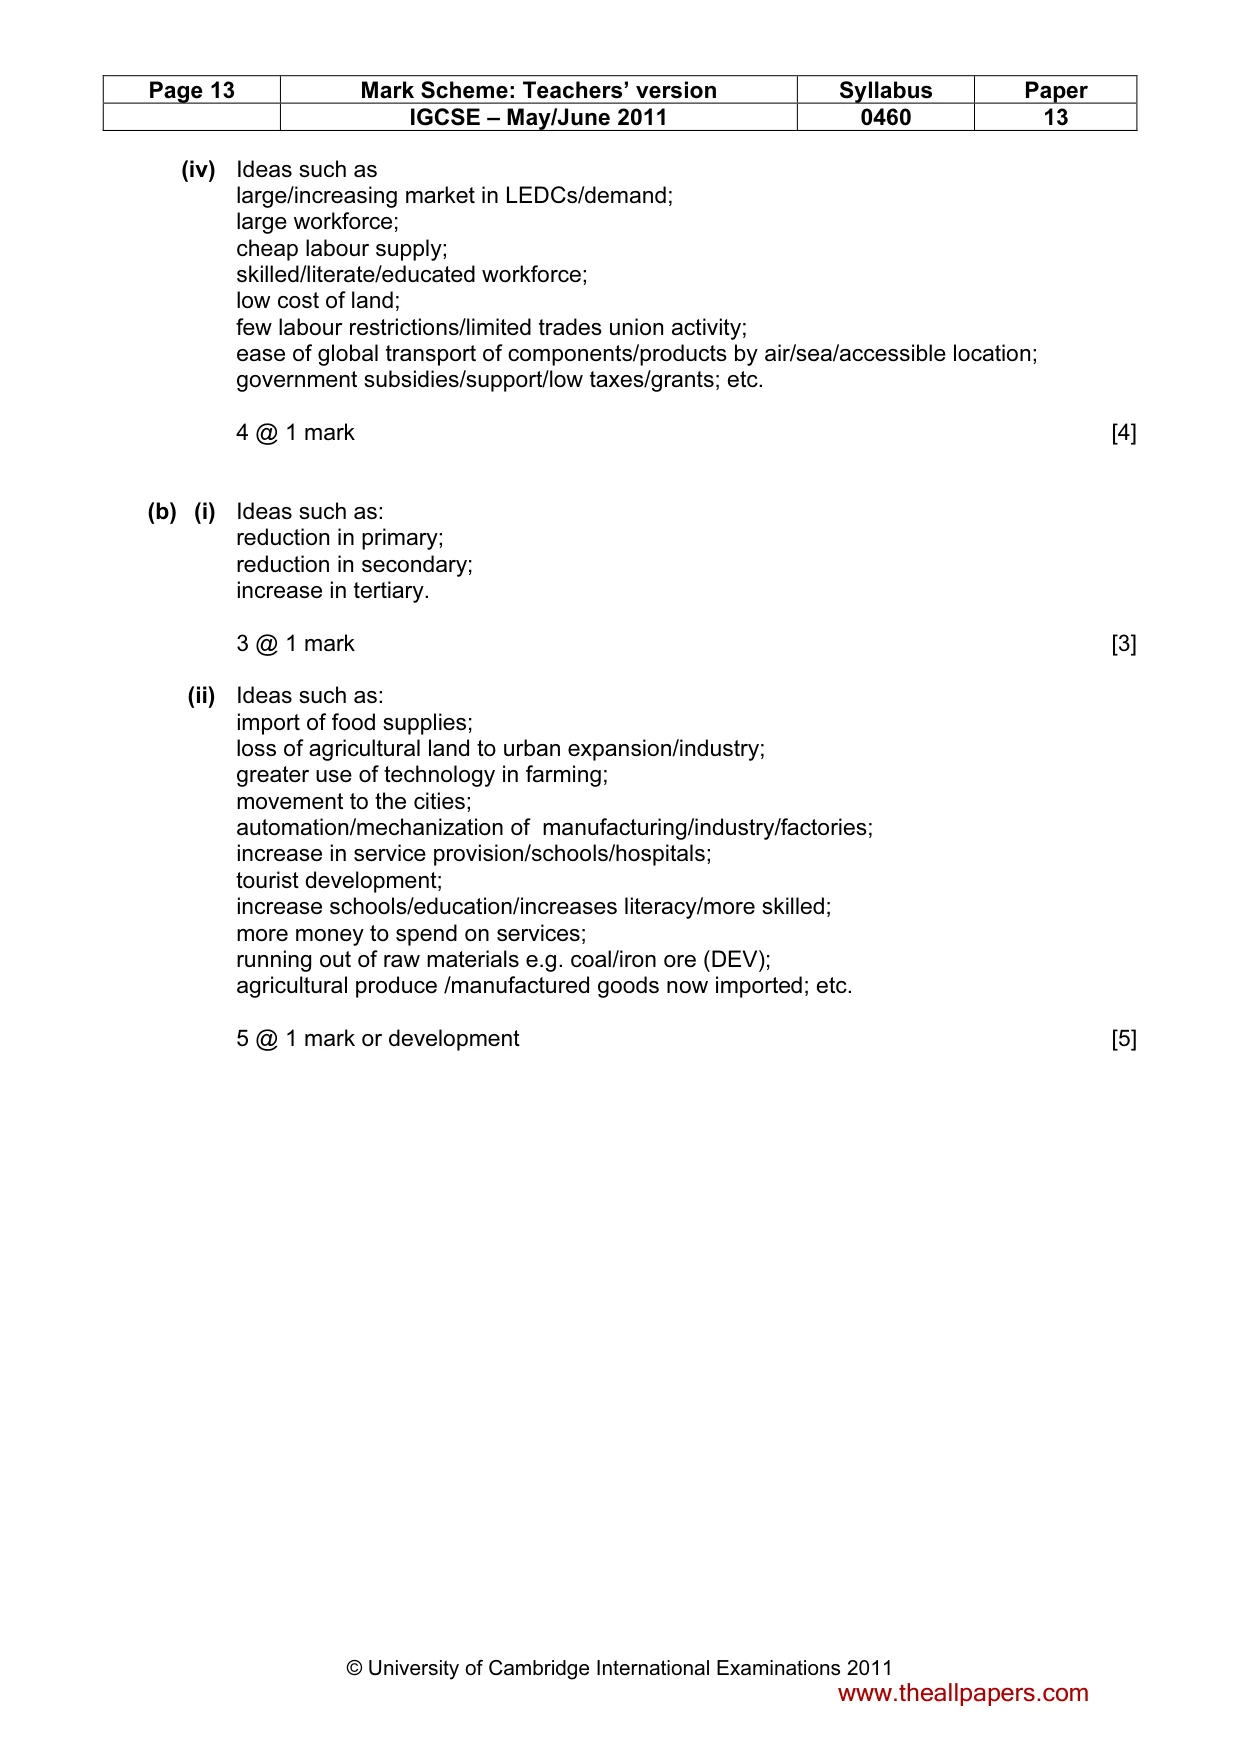
Page 13 Mark Scheme: Teachers’ version Syllabus Paper IGCSE – May/June 2011 0460 13 © University of Cambridge International Examinations 2011 (iv) Ideas such as large/increasing market in LEDCs/demand; large workforce; cheap labour supply; skilled/literate/educated workforce; low cost of land; few labour restrictions/limited trades union activity; ease of global transport of components/products by air/sea/accessible location; government subsidies/support/low taxes/grants; etc. 4 @ 1 mark [4] (b) (i) Ideas such as: reduction in primary; reduction in secondary; increase in tertiary. 3 @ 1 mark [3] (ii) Ideas such as: import of food supplies; loss of agricultural land to urban expansion/industry; greater use of technology in farming; movement to the cities; automation/mechanization of manufacturing/industry/factories; increase in service provision/schools/hospitals; tourist development; increase schools/education/increases literacy/more skilled; more money to spend on services; running out of raw materials e.g. coal/iron ore (DEV); agricultural produce /manufactured goods now imported; etc. 5 @ 1 mark or development [5] www.theallpapers.com
Mark scheme, page 14
Page 14 Mark Scheme: Teachers’ version Syllabus Paper IGCSE – May/June 2011 0460 13 © University of Cambridge International Examinations 2011 (c) Levels marking Level 1 (1–3 marks) Statements including limited detail explaining location of manufacturing/processing industry (e.g. large workforce; good transport links; cheap land; raw materials; energy supply; water supply etc.) Level 2 (4–6 marks) Uses named example More developed statements explaining location of manufacturing/processing industry (e.g. large workforce with engineering skills; good rail links to raw material supplies; located on coalfield for energy supply; water supply to use in processing etc.) (NB MAX 5 marks if no named example) Level 3 (7 marks) Uses named example (e.g. sugar refining in Baltimore USA) Comprehensive and accurate statements including some place specific reference. (e.g. good motorway links to markets in large cities such as New York and Washington; adjacent port facilities for import of sugar cane from Caribbean; government grants due to investment in declining industrial areas; large areas of flat land adjacent to waterside for storage of raw cane; large workforce in urban area which has high unemployment rate due to recent industrial decline etc.) [7] [Total: 25] www.theallpapers.com
What you needed in this session
Cambridge’s own grade thresholds for 2011 May/June, Paper 1 · Variant 3. A higher threshold means an easier paper — the bar moves with how the cohort did.