Cambridge IGCSE Geography 0460 — 2009 May/June Paper 5 · Variant 1
0460/51/M/J/09 · 60 marks · ≈68 min
The question paper and its mark scheme, free to read here and free to download. This is Cambridge’s own paper, exactly as it was sat.
Question paper1 pages
Mark scheme5 pages
Answers below. Sit the paper first if you are practising.

Paper as text
Question paper, page 1
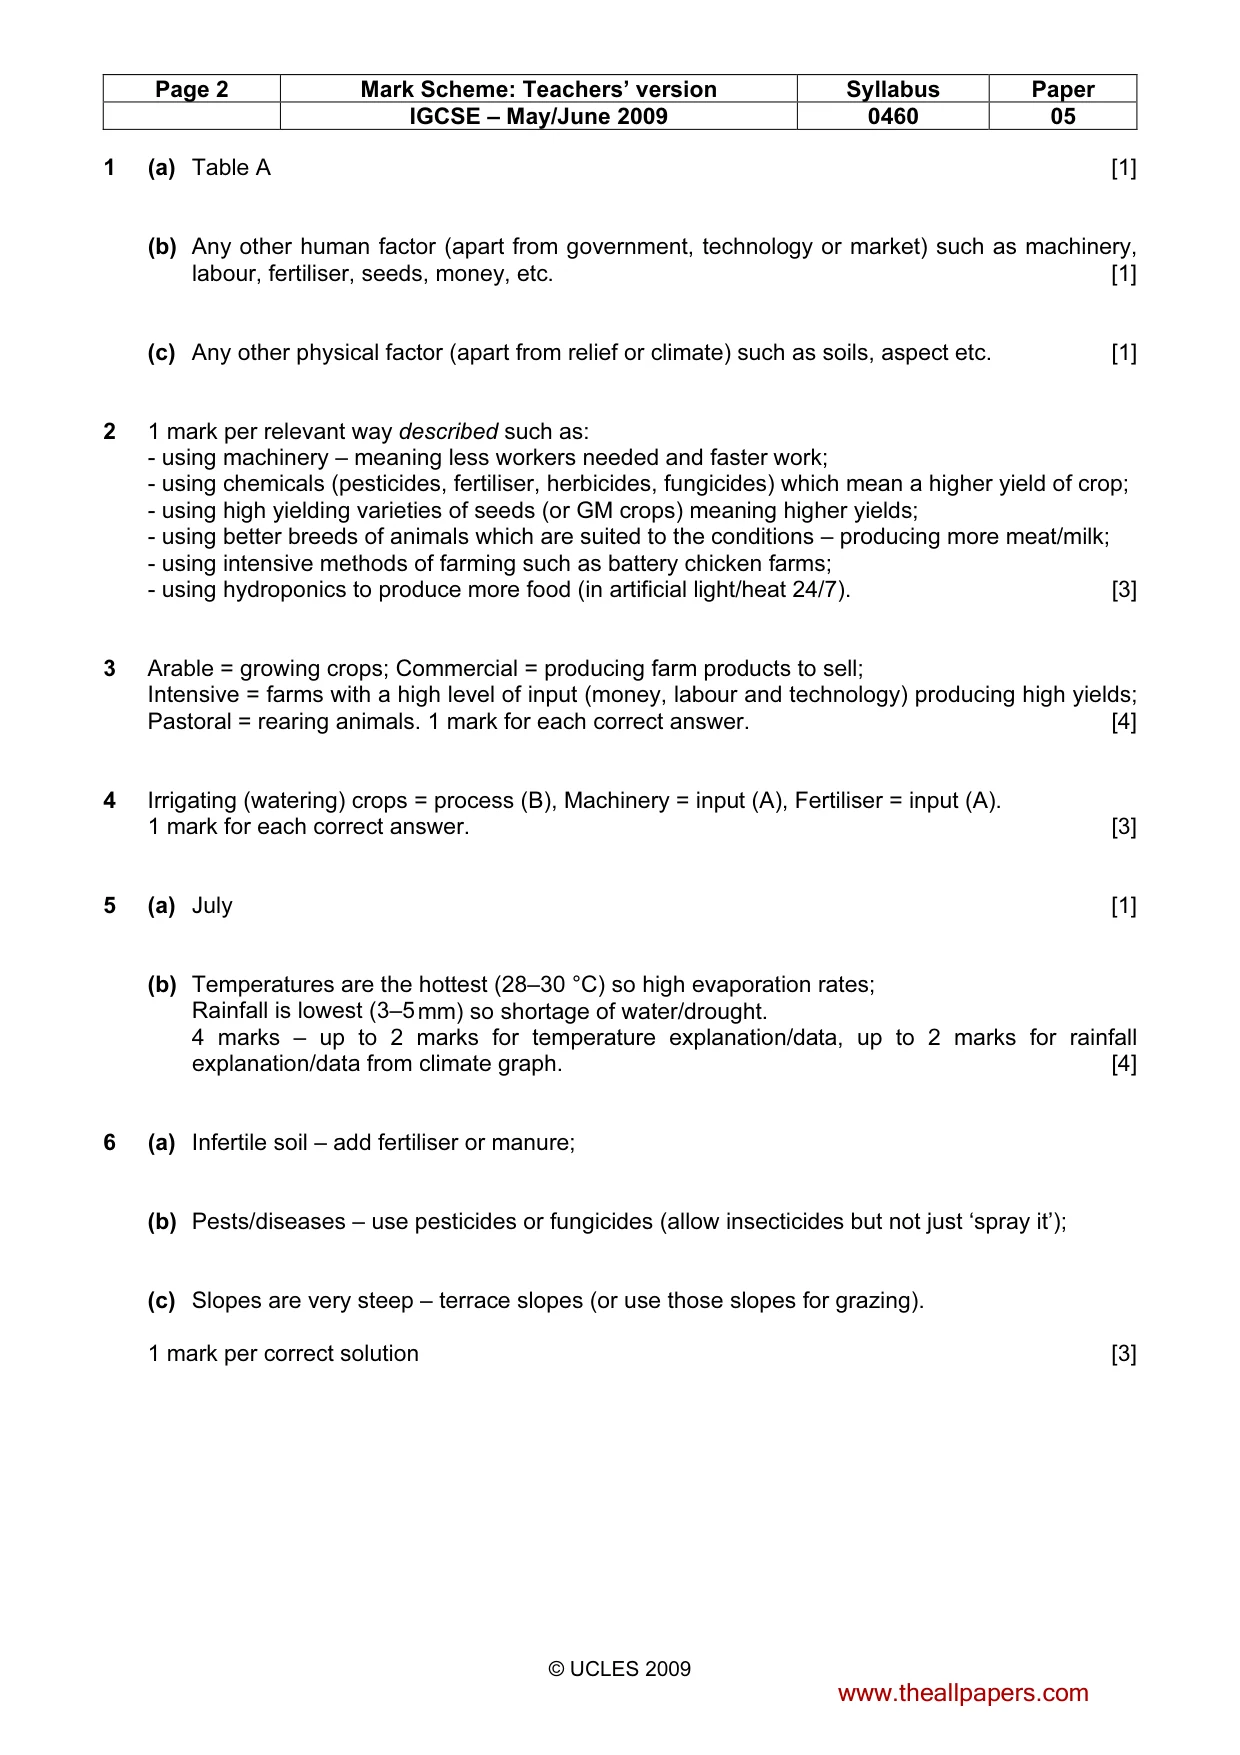
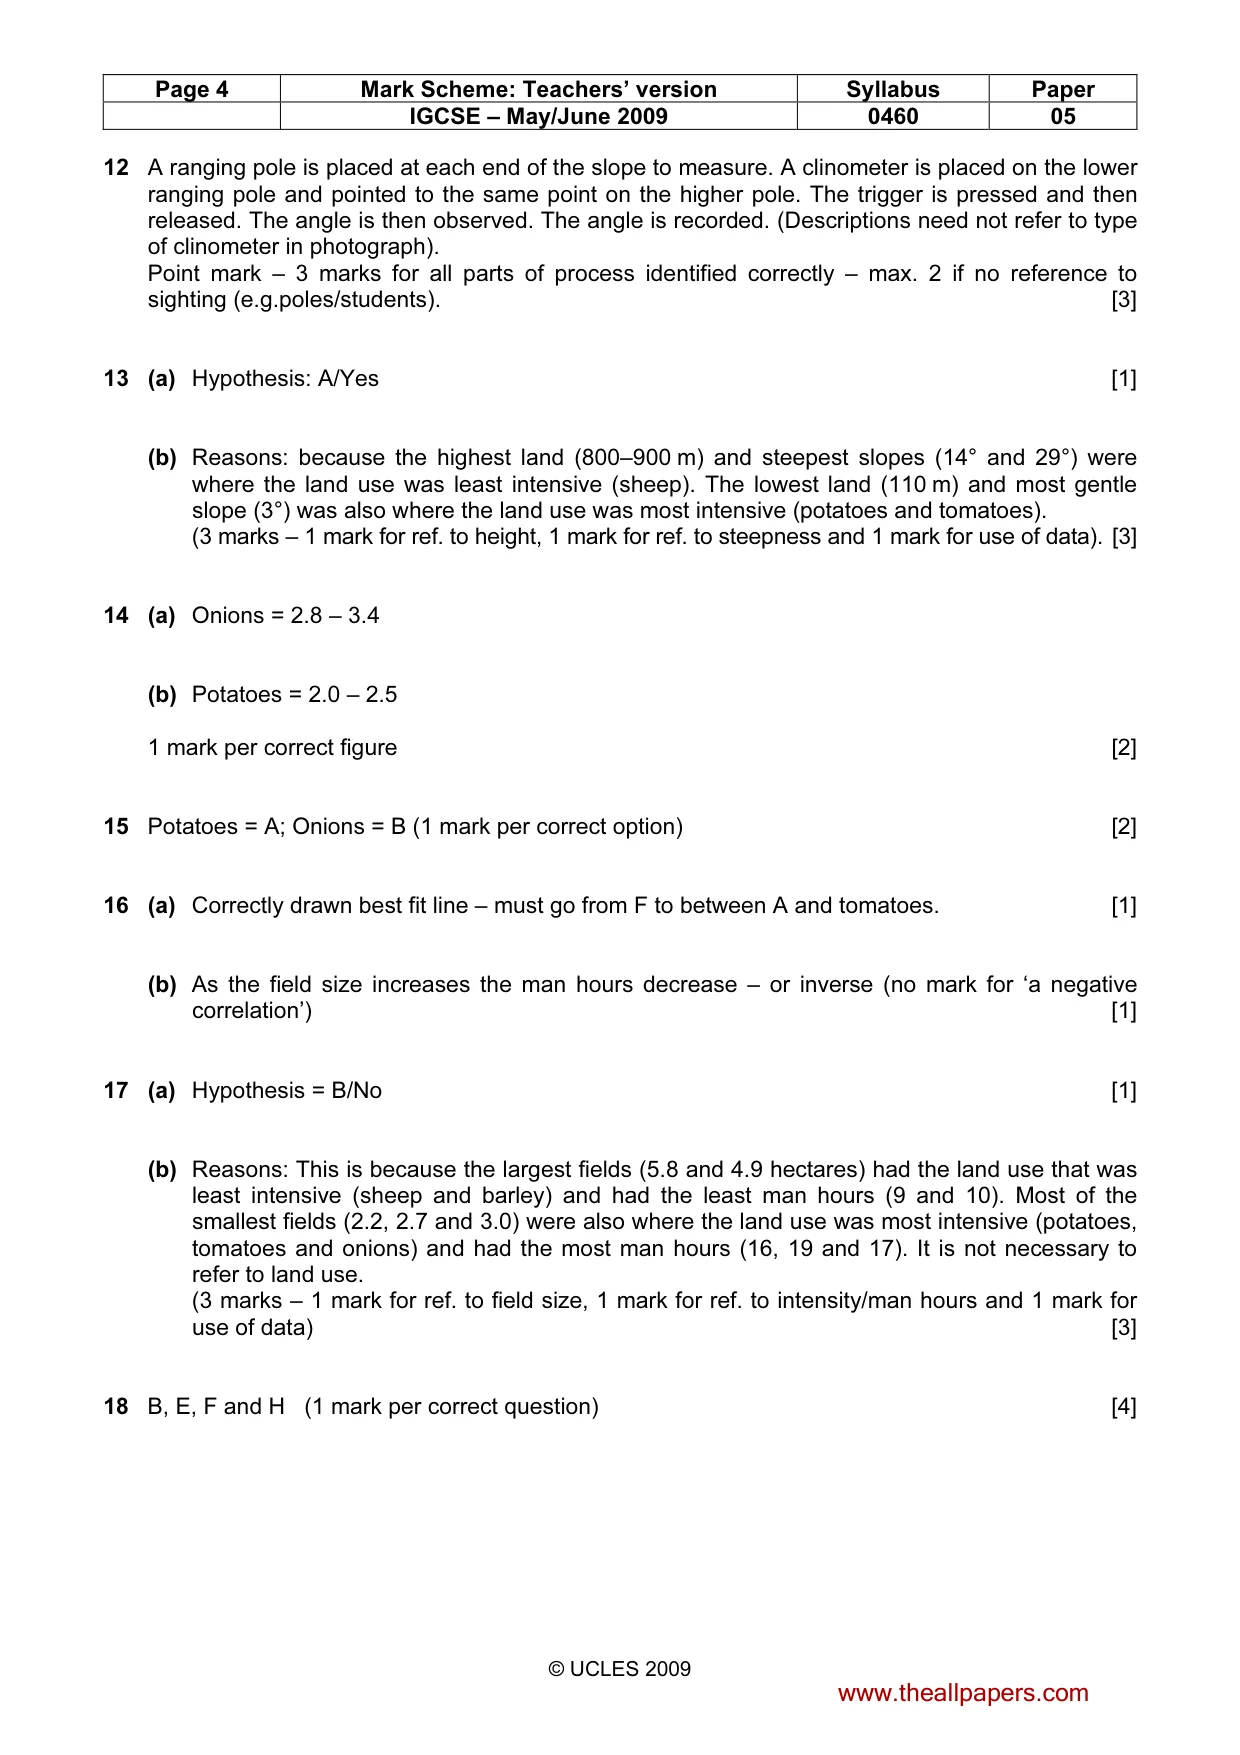
Opening and running the CIE IGCSE Geography Computer Based Test 0460/05 – June 2009 Technical Requirement: To run this test you will need: • A PC with an Internet browser and a sound card with headphones or speakers • Adobe Flash player version 8 or higher. If you do not have the Flash player installed on your machine, you can get it here: http://www.adobe.com/products/flashplayer/ To unzip the file You will need a copy of winzip. If you do not have one already, you can get it here: http://www.winzip.com 1. Save the zip file to a suitable location. 2. Double click the zip file and follow the wizard to install the contents to a suitable location To run the test Double click on the file Start Test.htm You will see this screen: In the Candidate Number box write Default (with a capital D) Do not write anything in the Password box Click Submit (If you get an error message, make sure you have written Default exactly as it written here. On the next screen, click Continue On the next screen click Start Test You will a screen like this: Candidates should read the Introduction and the Information File and may use the Notepad and Calculator tools. To close any of those windows, click the x in the top right hand corner of the window. To move through the questions, either click the next button or click the question number at the bottom of the screen. The test lasts for 90 minutes. There is a time counter at the top of the screen. www.theallpapers.com
Mark scheme, page 1
UNIVERSITY OF CAMBRIDGE INTERNATIONAL EXAMINATIONS International General Certificate of Secondary Education MARK SCHEME for the May/June 2009 question paper for the guidance of teachers 0460 GEOGRAPHY 0460/05 Paper 5 (Computer Based Alternative to Coursework), maximum raw mark 60 This mark scheme is published as an aid to teachers and candidates, to indicate the requirements of the examination. It shows the basis on which Examiners were instructed to award marks. It does not indicate the details of the discussions that took place at an Examiners’ meeting before marking began, which would have considered the acceptability of alternative answers. Mark schemes must be read in conjunction with the question papers and the report on the examination. • CIE will not enter into discussions or correspondence in connection with these mark schemes. CIE is publishing the mark schemes for the May/June 2009 question papers for most IGCSE, GCE Advanced Level and Advanced Subsidiary Level syllabuses and some Ordinary Level syllabuses. www.theallpapers.com
Mark scheme, page 2
Page 2 Mark Scheme: Teachers’ version Syllabus Paper IGCSE – May/June 2009 0460 05 © UCLES 2009 1 (a) Table A [1] (b) Any other human factor (apart from government, technology or market) such as machinery, labour, fertiliser, seeds, money, etc. [1] (c) Any other physical factor (apart from relief or climate) such as soils, aspect etc. [1] 2 1 mark per relevant way described such as: - using machinery – meaning less workers needed and faster work; - using chemicals (pesticides, fertiliser, herbicides, fungicides) which mean a higher yield of crop; - using high yielding varieties of seeds (or GM crops) meaning higher yields; - using better breeds of animals which are suited to the conditions – producing more meat/milk; - using intensive methods of farming such as battery chicken farms; - using hydroponics to produce more food (in artificial light/heat 24/7). [3] 3 Arable = growing crops; Commercial = producing farm products to sell; Intensive = farms with a high level of input (money, labour and technology) producing high yields; Pastoral = rearing animals. 1 mark for each correct answer. [4] 4 Irrigating (watering) crops = process (B), Machinery = input (A), Fertiliser = input (A). 1 mark for each correct answer. [3] 5 (a) July [1] (b) Temperatures are the hottest (28–30 °C) so high evaporation rates; Rainfall is lowest (3–5 mm) so shortage of water/drought. 4 marks – up to 2 marks for temperature explanation/data, up to 2 marks for rainfall explanation/data from climate graph. [4] 6 (a) Infertile soil – add fertiliser or manure; (b) Pests/diseases – use pesticides or fungicides (allow insecticides but not just ‘spray it’); (c) Slopes are very steep – terrace slopes (or use those slopes for grazing). 1 mark per correct solution [3] www.theallpapers.com
Mark scheme, page 3
Page 3 Mark Scheme: Teachers’ version Syllabus Paper IGCSE – May/June 2009 0460 05 © UCLES 2009 7 1 mark per way such as: - they reduce the impact of wind damage/storm damage to crops/provide shelter; - they increase the temperature/decrease the risk of frost/regulate temperature. [2] 8 (a) Barley = 14.1 or 14.2 (b) Potatoes = 8.6 – 8.7 1 mark per correct figure [2] 9 1 mark per correct sized bar Barley = 14.0 – 14.5 Potatoes = 8.5 – 9.0 [2] 10 (a) Berlin = 1400 km (allow 1380 – 1420) (b) Madrid = 620 km (allow 600 – 640) (c) Rome = 680 km (allow 660 – 700) 1 mark for each correct distance [3] 11 (a) Point 1 = potatoes [1] (b) Point 4 = 120 metres [1] (c) Point 7 = any number between 131 to 139 metres (inclusive) [1] (d) Point 7 = olives [1] 1 mark per correct land use/altitude www.theallpapers.com
Mark scheme, page 4
Page 4 Mark Scheme: Teachers’ version Syllabus Paper IGCSE – May/June 2009 0460 05 © UCLES 2009 12 A ranging pole is placed at each end of the slope to measure. A clinometer is placed on the lower ranging pole and pointed to the same point on the higher pole. The trigger is pressed and then released. The angle is then observed. The angle is recorded. (Descriptions need not refer to type of clinometer in photograph). Point mark – 3 marks for all parts of process identified correctly – max. 2 if no reference to sighting (e.g.poles/students). [3] 13 (a) Hypothesis: A/Yes [1] (b) Reasons: because the highest land (800–900 m) and steepest slopes (14° and 29°) were where the land use was least intensive (sheep). The lowest land (110 m) and most gentle slope (3°) was also where the land use was most intensive (potatoes and tomatoes). (3 marks – 1 mark for ref. to height, 1 mark for ref. to steepness and 1 mark for use of data). [3] 14 (a) Onions = 2.8 – 3.4 (b) Potatoes = 2.0 – 2.5 1 mark per correct figure [2] 15 Potatoes = A; Onions = B (1 mark per correct option) [2] 16 (a) Correctly drawn best fit line – must go from F to between A and tomatoes. [1] (b) As the field size increases the man hours decrease – or inverse (no mark for ‘a negative correlation’) [1] 17 (a) Hypothesis = B/No [1] (b) Reasons: This is because the largest fields (5.8 and 4.9 hectares) had the land use that was least intensive (sheep and barley) and had the least man hours (9 and 10). Most of the smallest fields (2.2, 2.7 and 3.0) were also where the land use was most intensive (potatoes, tomatoes and onions) and had the most man hours (16, 19 and 17). It is not necessary to refer to land use. (3 marks – 1 mark for ref. to field size, 1 mark for ref. to intensity/man hours and 1 mark for use of data) [3] 18 B, E, F and H (1 mark per correct question) [4] www.theallpapers.com
Mark scheme, page 5
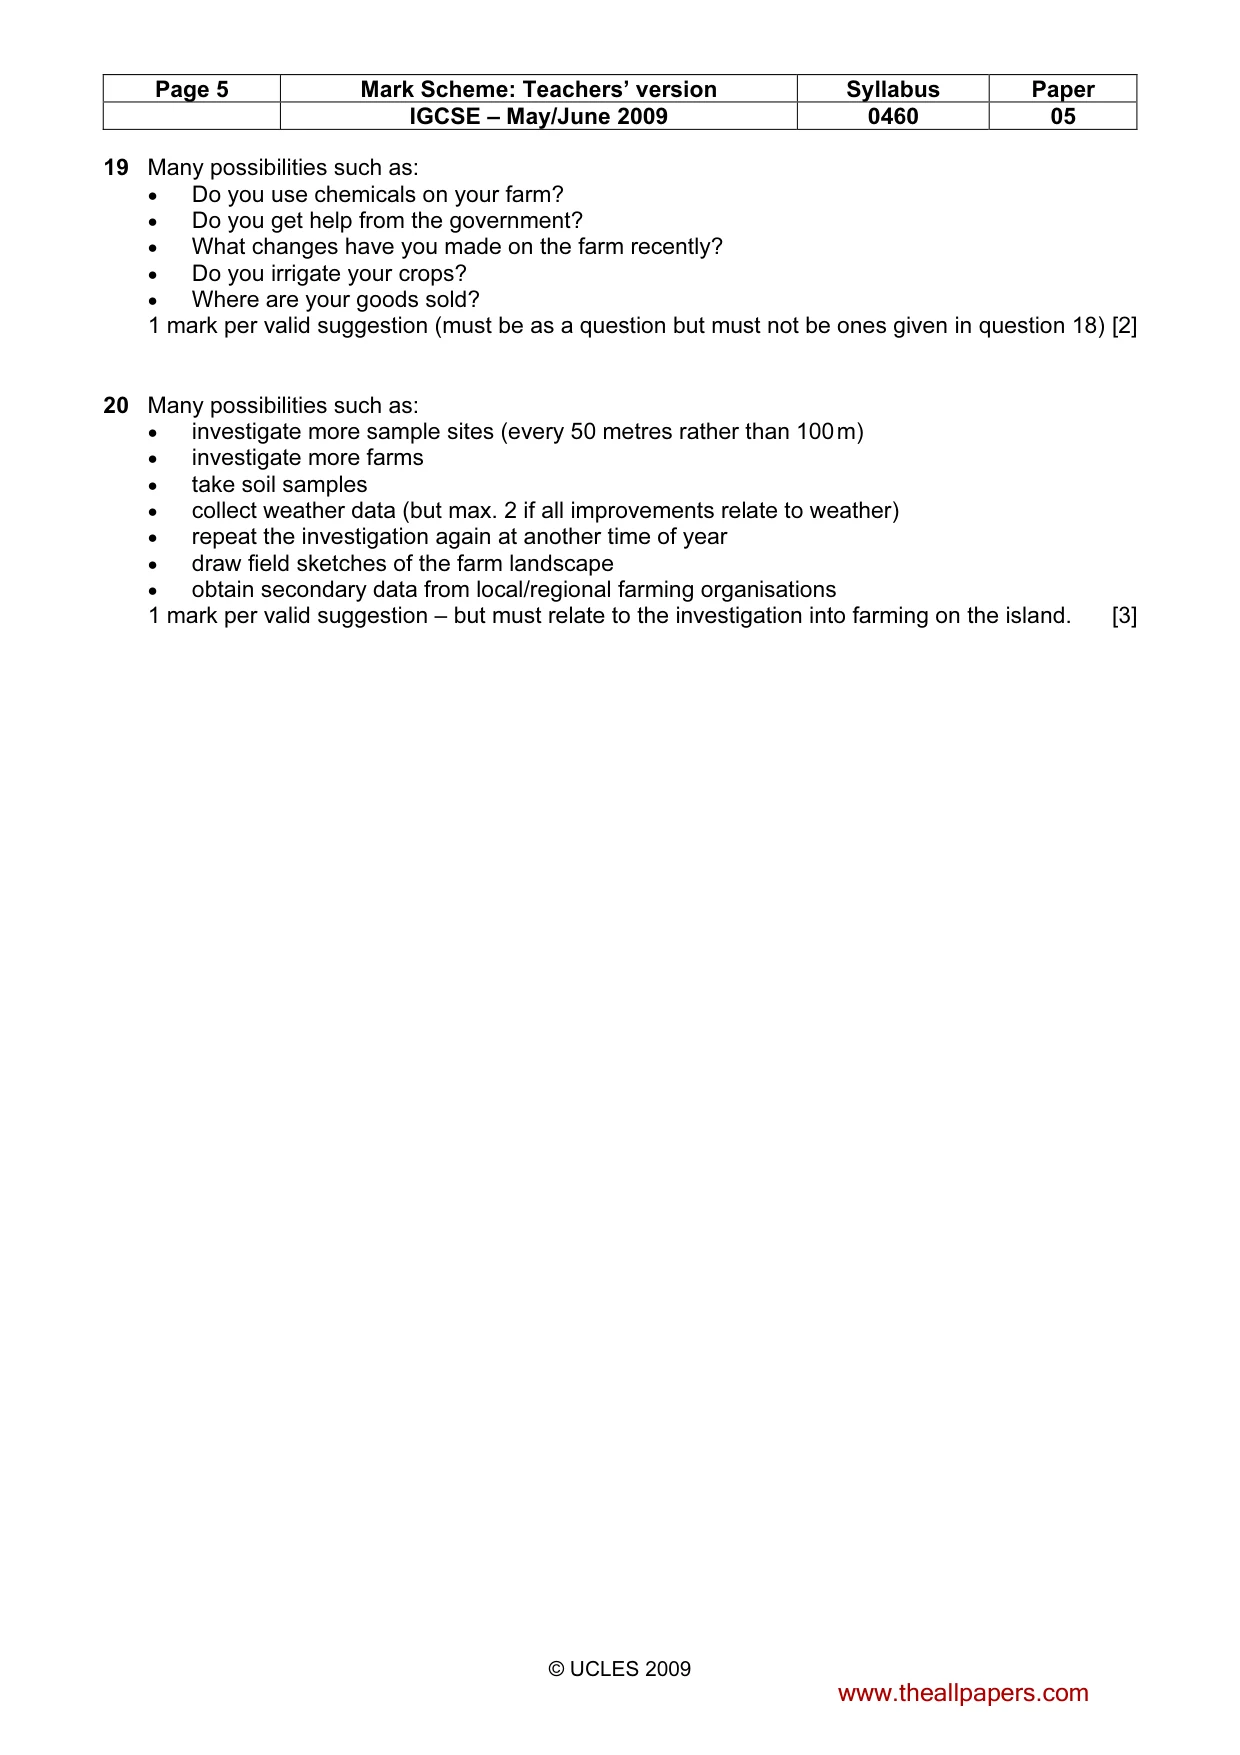
Page 5 Mark Scheme: Teachers’ version Syllabus Paper IGCSE – May/June 2009 0460 05 © UCLES 2009 19 Many possibilities such as: • Do you use chemicals on your farm? • Do you get help from the government? • What changes have you made on the farm recently? • Do you irrigate your crops? • Where are your goods sold? 1 mark per valid suggestion (must be as a question but must not be ones given in question 18) [2] 20 Many possibilities such as: • investigate more sample sites (every 50 metres rather than 100 m) • investigate more farms • take soil samples • collect weather data (but max. 2 if all improvements relate to weather) • repeat the investigation again at another time of year • draw field sketches of the farm landscape • obtain secondary data from local/regional farming organisations 1 mark per valid suggestion – but must relate to the investigation into farming on the island. [3] www.theallpapers.com
What you needed in this session
Cambridge’s own grade thresholds for 2009 May/June, Paper 5 · Variant 1. A higher threshold means an easier paper — the bar moves with how the cohort did.