Cambridge IGCSE Geography 0460 — 2002 Oct/Nov Paper 5 · Variant 1
0460/51/O/N/02
The question paper and its mark scheme, free to read here and free to download. This is Cambridge’s own paper, exactly as it was sat.
Question paper4 pages

Mark scheme2 pages
Answers below. Sit the paper first if you are practising.
Paper as text
Question paper, page 1
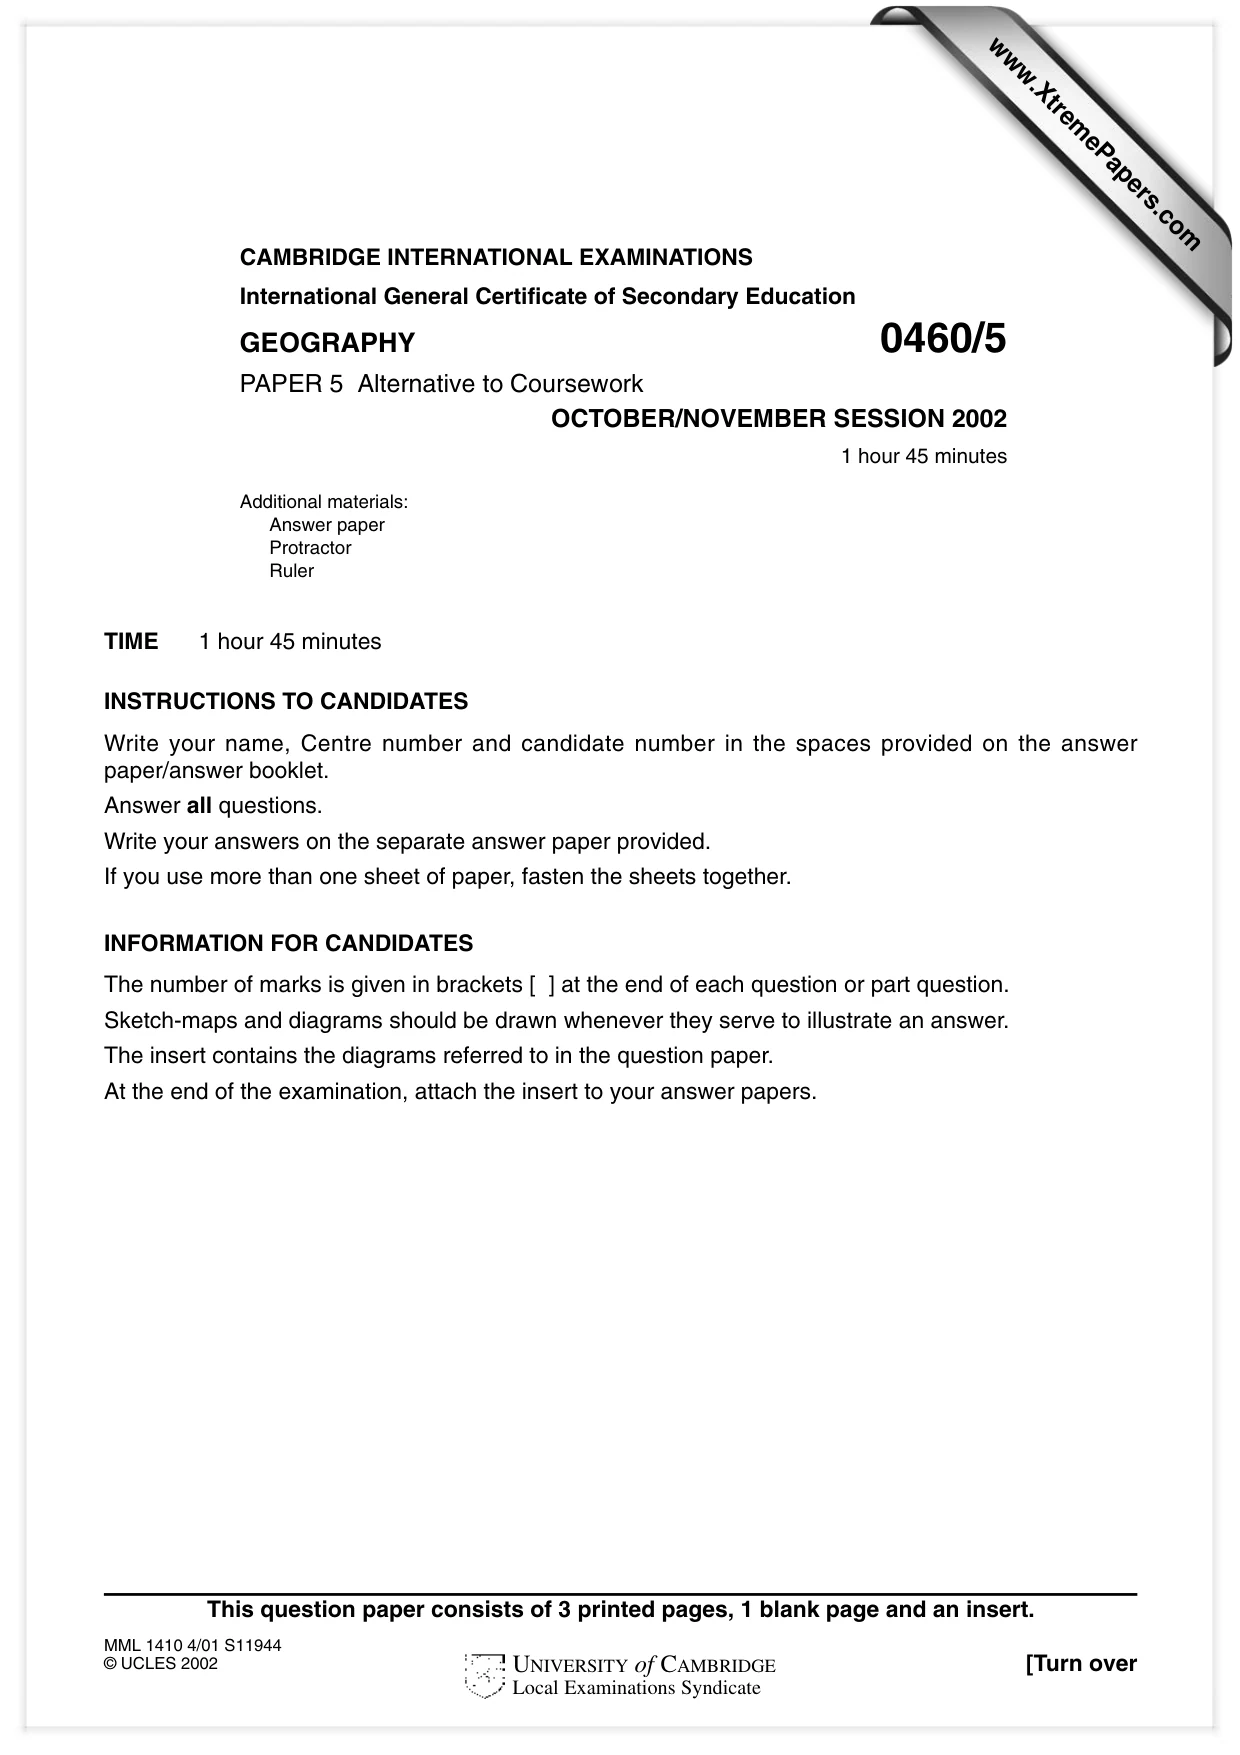
TIME 1 hour 45 minutes INSTRUCTIONS TO CANDIDATES Write your name, Centre number and candidate number in the spaces provided on the answer paper/answer booklet. Answer all questions. Write your answers on the separate answer paper provided. If you use more than one sheet of paper, fasten the sheets together. INFORMATION FOR CANDIDATES The number of marks is given in brackets [ ] at the end of each question or part question. Sketch-maps and diagrams should be drawn whenever they serve to illustrate an answer. The insert contains the diagrams referred to in the question paper. At the end of the examination, attach the insert to your answer papers. This question paper consists of 3 printed pages, 1 blank page and an insert. MML 1410 4/01 S11944 © UCLES 2002 [Turn over CAMBRIDGE INTERNATIONAL EXAMINATIONS International General Certificate of Secondary Education GEOGRAPHY 0460/5 PAPER 5 Alternative to Coursework OCTOBER/NOVEMBER SESSION 2002 1 hour 45 minutes Additional materials: Answer paper Protractor Ruler UNIVERSITY of CAMBRIDGE Local Examinations Syndicate www.XtremePapers.com
Question paper, page 2
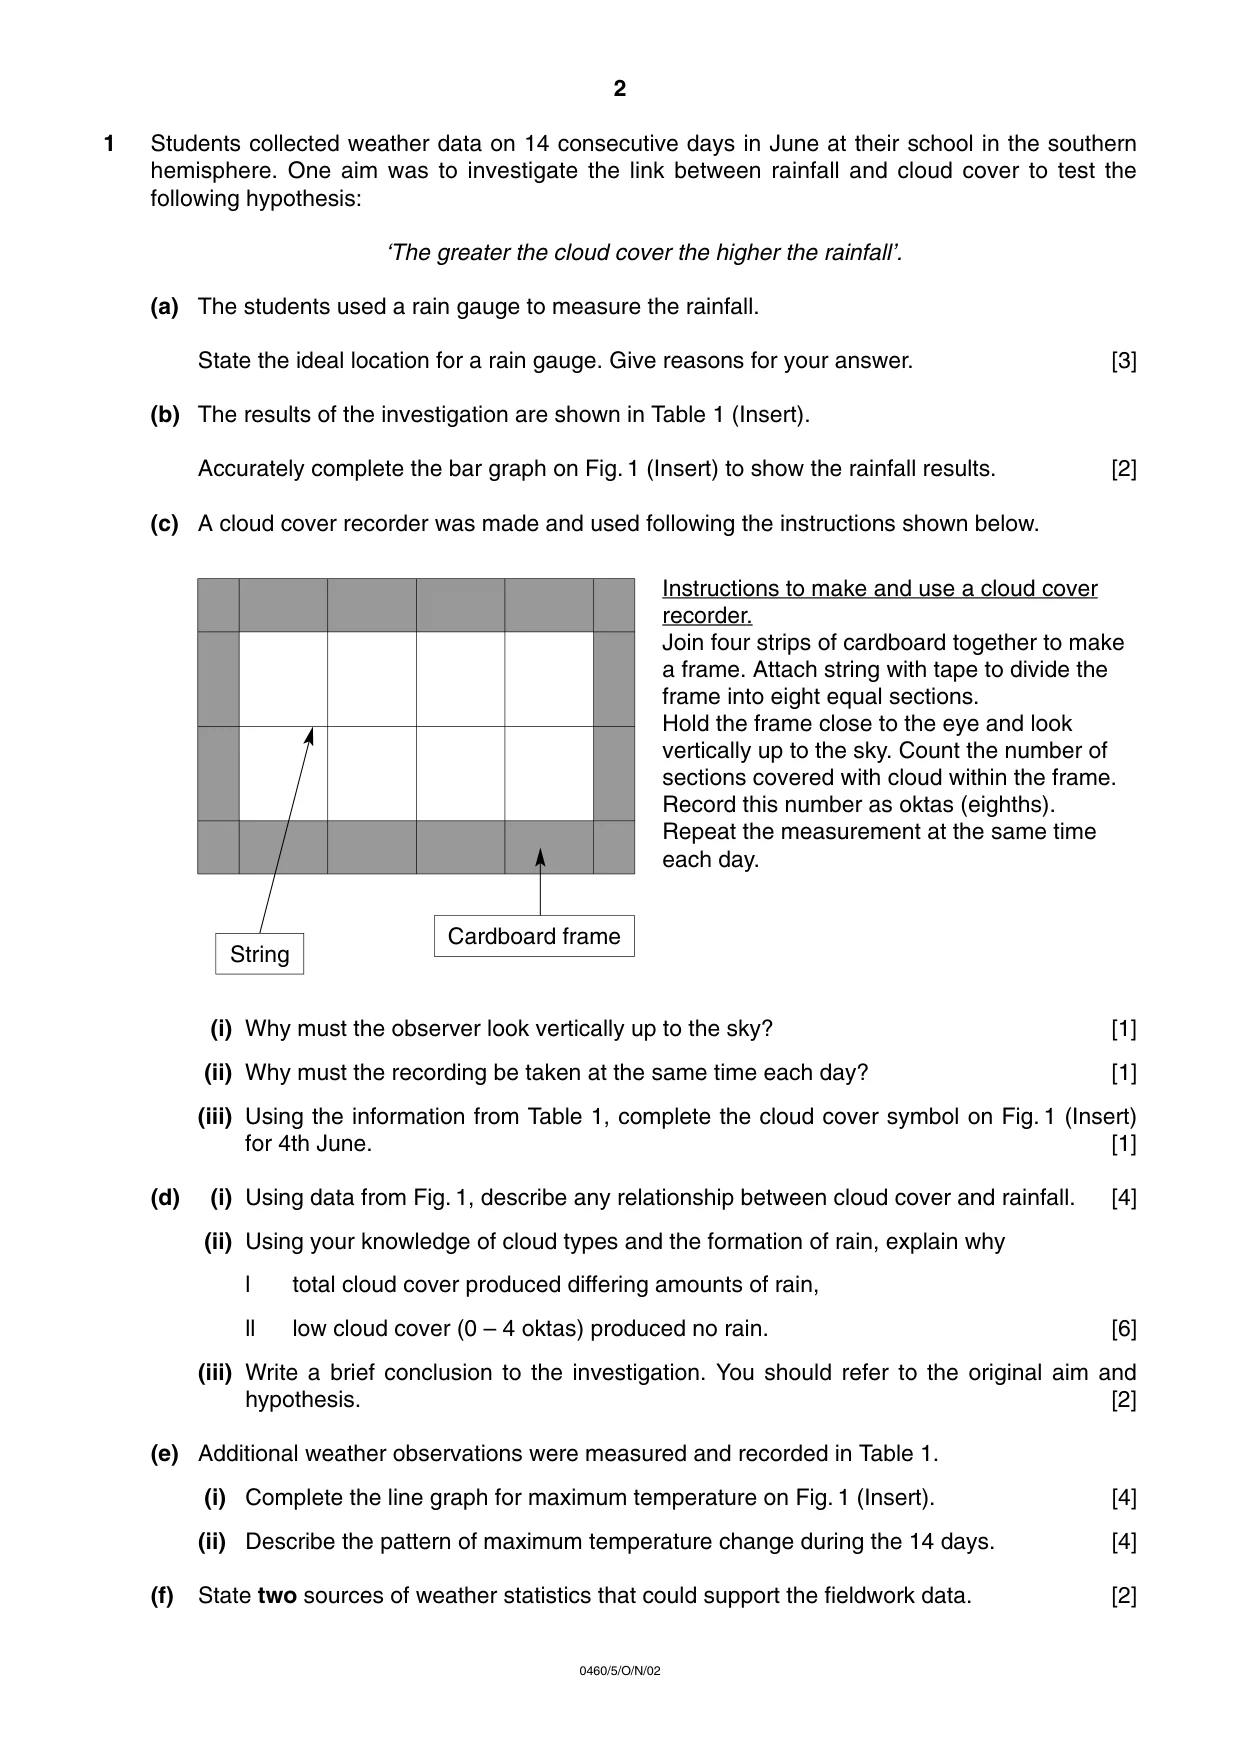
1 Students collected weather data on 14 consecutive days in June at their school in the southern hemisphere. One aim was to investigate the link between rainfall and cloud cover to test the following hypothesis: ‘The greater the cloud cover the higher the rainfall’. (a) The students used a rain gauge to measure the rainfall. State the ideal location for a rain gauge. Give reasons for your answer. [3] (b) The results of the investigation are shown in Table 1 (Insert). Accurately complete the bar graph on Fig. 1 (Insert) to show the rainfall results. [2] (c) A cloud cover recorder was made and used following the instructions shown below. (i) Why must the observer look vertically up to the sky? [1] (ii) Why must the recording be taken at the same time each day? [1] (iii) Using the information from Table 1, complete the cloud cover symbol on Fig. 1 (Insert) for 4th June. [1] (d) (i) Using data from Fig. 1, describe any relationship between cloud cover and rainfall. [4] (ii) Using your knowledge of cloud types and the formation of rain, explain why l total cloud cover produced differing amounts of rain, ll low cloud cover (0 – 4 oktas) produced no rain. [6] (iii) Write a brief conclusion to the investigation. You should refer to the original aim and hypothesis. [2] (e) Additional weather observations were measured and recorded in Table 1. (i) Complete the line graph for maximum temperature on Fig. 1 (Insert). [4] (ii) Describe the pattern of maximum temperature change during the 14 days. [4] (f) State two sources of weather statistics that could support the fieldwork data. [2] Instructions to make and use a cloud cover recorder. Join four strips of cardboard together to make a frame. Attach string with tape to divide the frame into eight equal sections. Hold the frame close to the eye and look vertically up to the sky. Count the number of sections covered with cloud within the frame. Record this number as oktas (eighths). Repeat the measurement at the same time each day. 2 0460/5/O/N/02 String Cardboard frame
Question paper, page 3
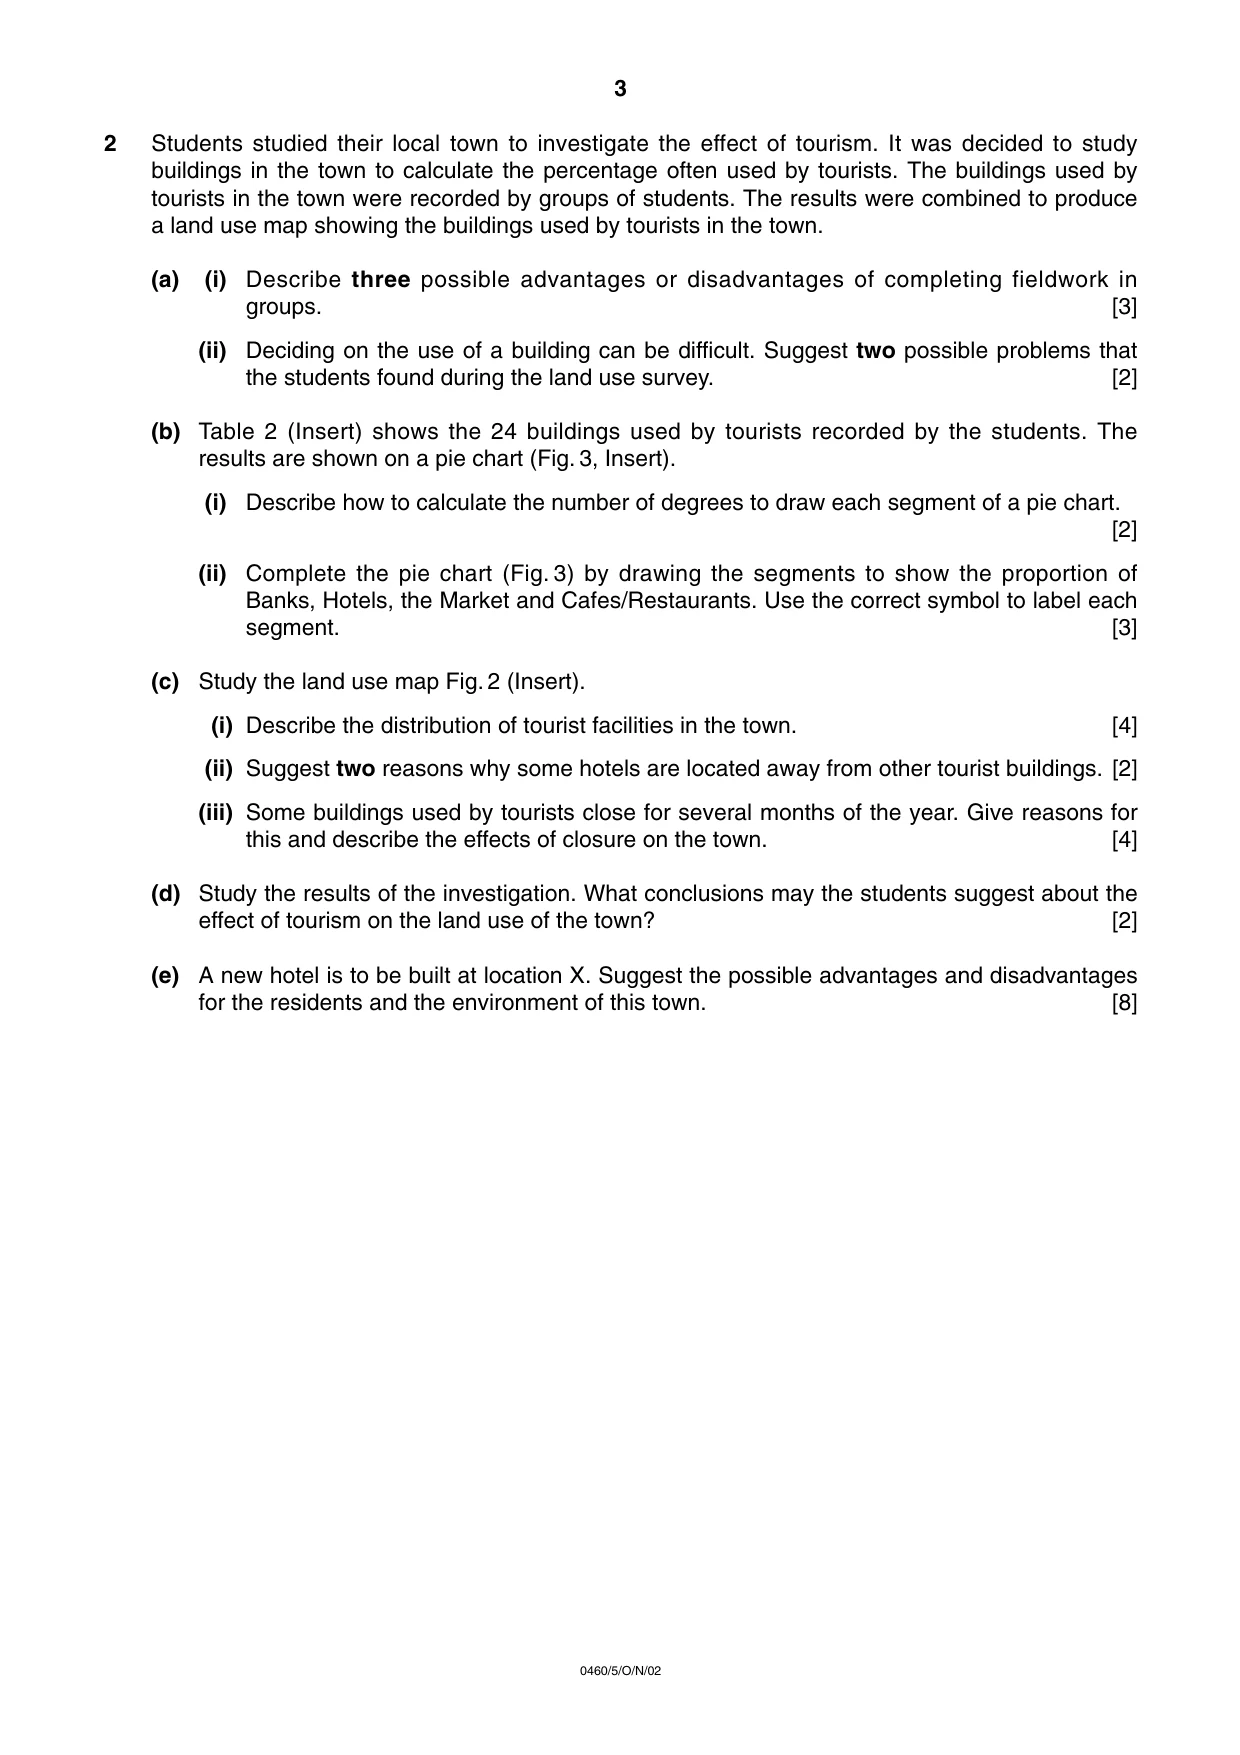
2 Students studied their local town to investigate the effect of tourism. It was decided to study buildings in the town to calculate the percentage often used by tourists. The buildings used by tourists in the town were recorded by groups of students. The results were combined to produce a land use map showing the buildings used by tourists in the town. (a) (i) Describe three possible advantages or disadvantages of completing fieldwork in groups. [3] (ii) Deciding on the use of a building can be difficult. Suggest two possible problems that the students found during the land use survey. [2] (b) Table 2 (Insert) shows the 24 buildings used by tourists recorded by the students. The results are shown on a pie chart (Fig. 3, Insert). (i) Describe how to calculate the number of degrees to draw each segment of a pie chart. [2] (ii) Complete the pie chart (Fig. 3) by drawing the segments to show the proportion of Banks, Hotels, the Market and Cafes/Restaurants. Use the correct symbol to label each segment. [3] (c) Study the land use map Fig. 2 (Insert). (i) Describe the distribution of tourist facilities in the town. [4] (ii) Suggest two reasons why some hotels are located away from other tourist buildings. [2] (iii) Some buildings used by tourists close for several months of the year. Give reasons for this and describe the effects of closure on the town. [4] (d) Study the results of the investigation. What conclusions may the students suggest about the effect of tourism on the land use of the town? [2] (e) A new hotel is to be built at location X. Suggest the possible advantages and disadvantages for the residents and the environment of this town. [8] 3 0460/5/O/N/02
Mark scheme, page 1
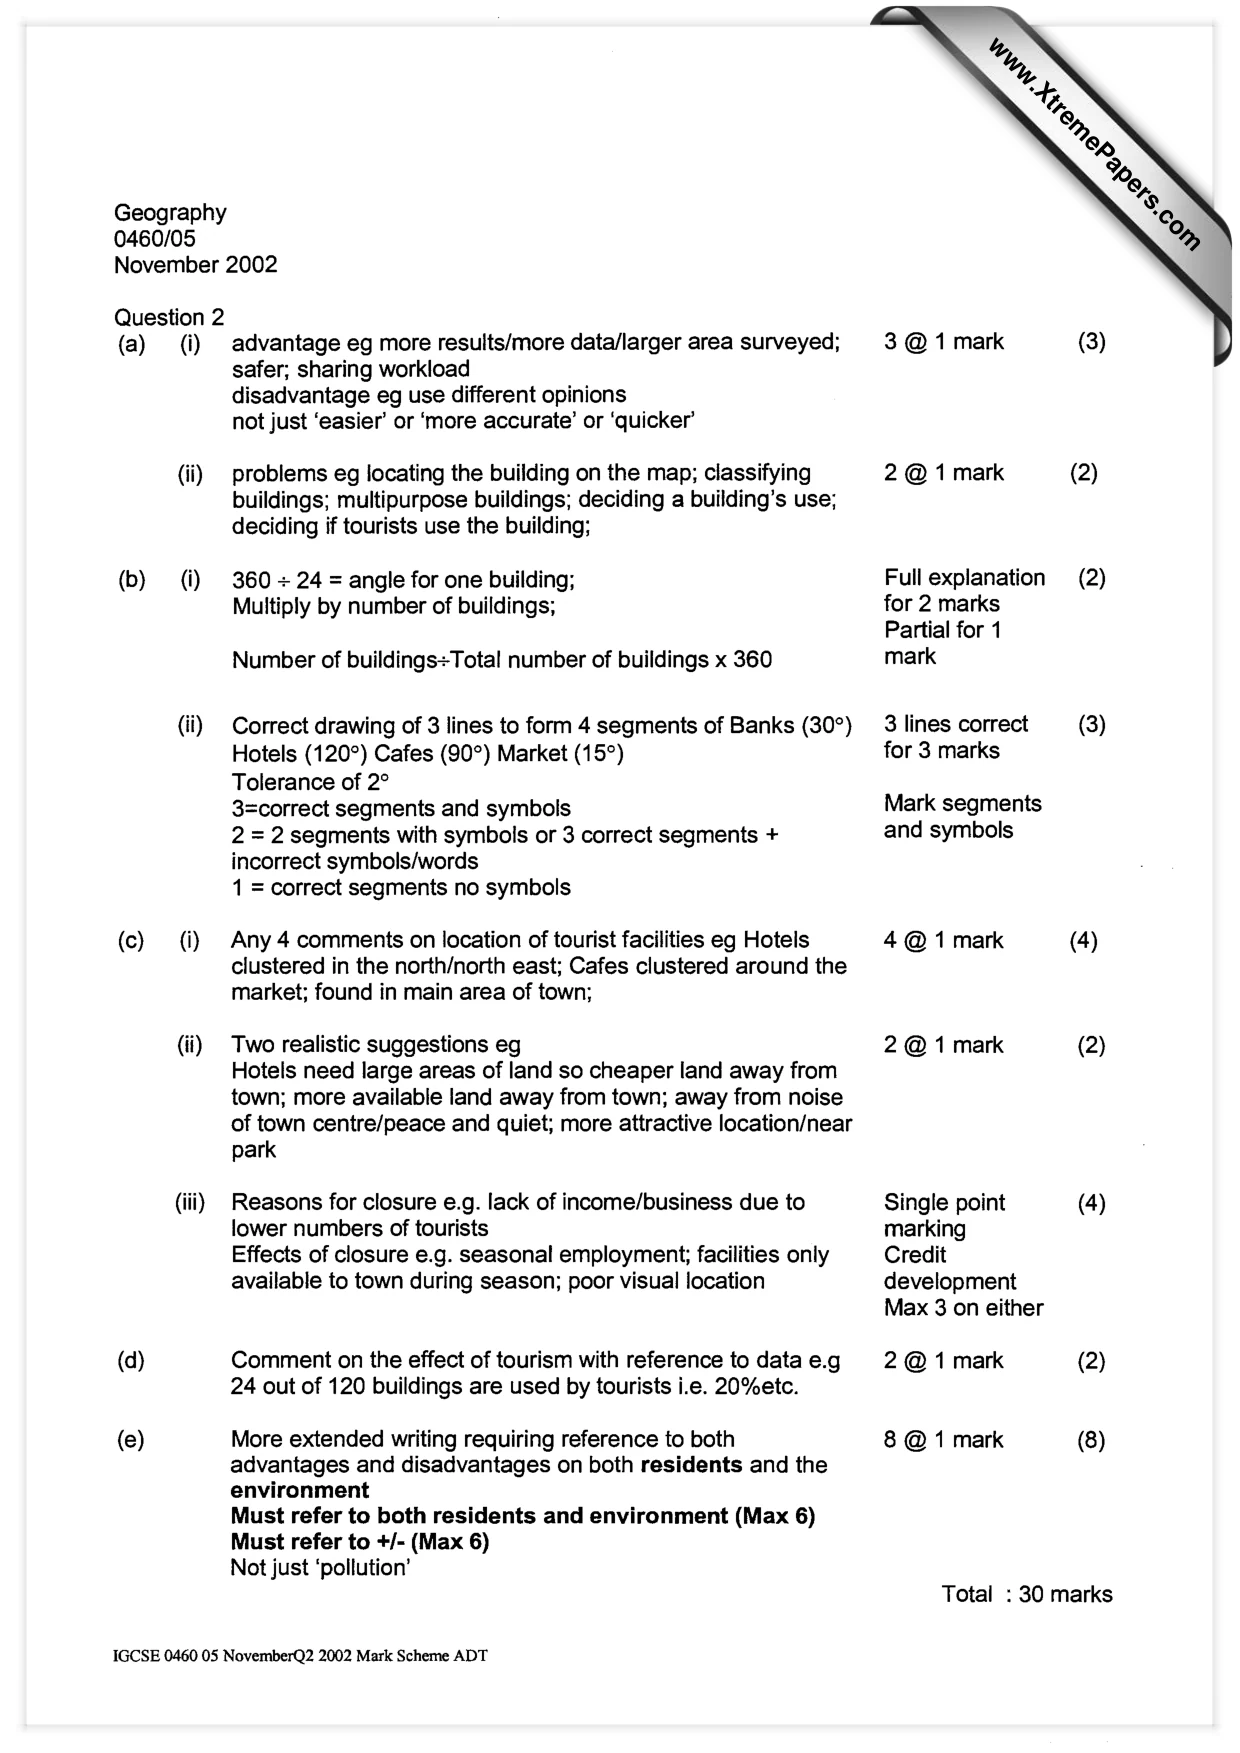
Geography 0460/05 November 2002 Question 2 (a) (i) advantage eg more results/more data/larger area surveyed; safer; sharing workload disadvantage eg use different opinions not just ‘easier’ or ‘more accurate’ or ‘quicker’ (ii) | problems eg locating the building on the map; classifying 2 @1 mark (2) buildings; multipurpose buildings; deciding a building’s use; deciding if tourists use the building; (b) (i) 360 + 24 = angle for one building; Full explanation (2) Multiply by number of buildings; for 2 marks Partial for 1 Number of buildings=Total number of buildings x 360 mark (ii) Correct drawing of 3 lines to form 4 segments of Banks (30°) 3 lines correct (3) Hotels (120°) Cafes (90°) Market (15°) for 3 marks Tolerance of 2° 3=correct segments and symbols Mark segments 2 = 2 segments with symbols or 3 correct segments + and symbols incorrect symbols/words 1 = correct segments no symbols (c) (i) Any 4 comments on location of tourist facilities eg Hotels 4 @ 1 mark (4) clustered in the north/north east; Cafes clustered around the market; found in main area of town; (ii) Two realistic suggestions eg 2 @1 mark (2) Hotels need large areas of land so cheaper land away from town; more available land away from town; away from noise of town centre/peace and quiet; more attractive location/near park (iii) Reasons for closure e.g. lack of income/business due to Single point (4) lower numbers of tourists marking Effects of closure e.g. seasonal employment; facilities only Credit available to town during season; poor visual location development Max 3 on either (d) Comment on the effect of tourism with reference to data e.g 2 @1 mark (2) 24 out of 120 buildings are used by tourists i.e. 20%etc. (e) More extended writing requiring reference to both 8 @ 1 mark (8) advantages and disadvantages on both residents and the environment Must refer to both residents and environment (Max 6) Must refer to +/- (Max 6) Not just ‘pollution’ Total : 30 marks IGCSE 0460 05 NovemberQ2 2002 Mark Scheme ADT
Mark scheme, page 2
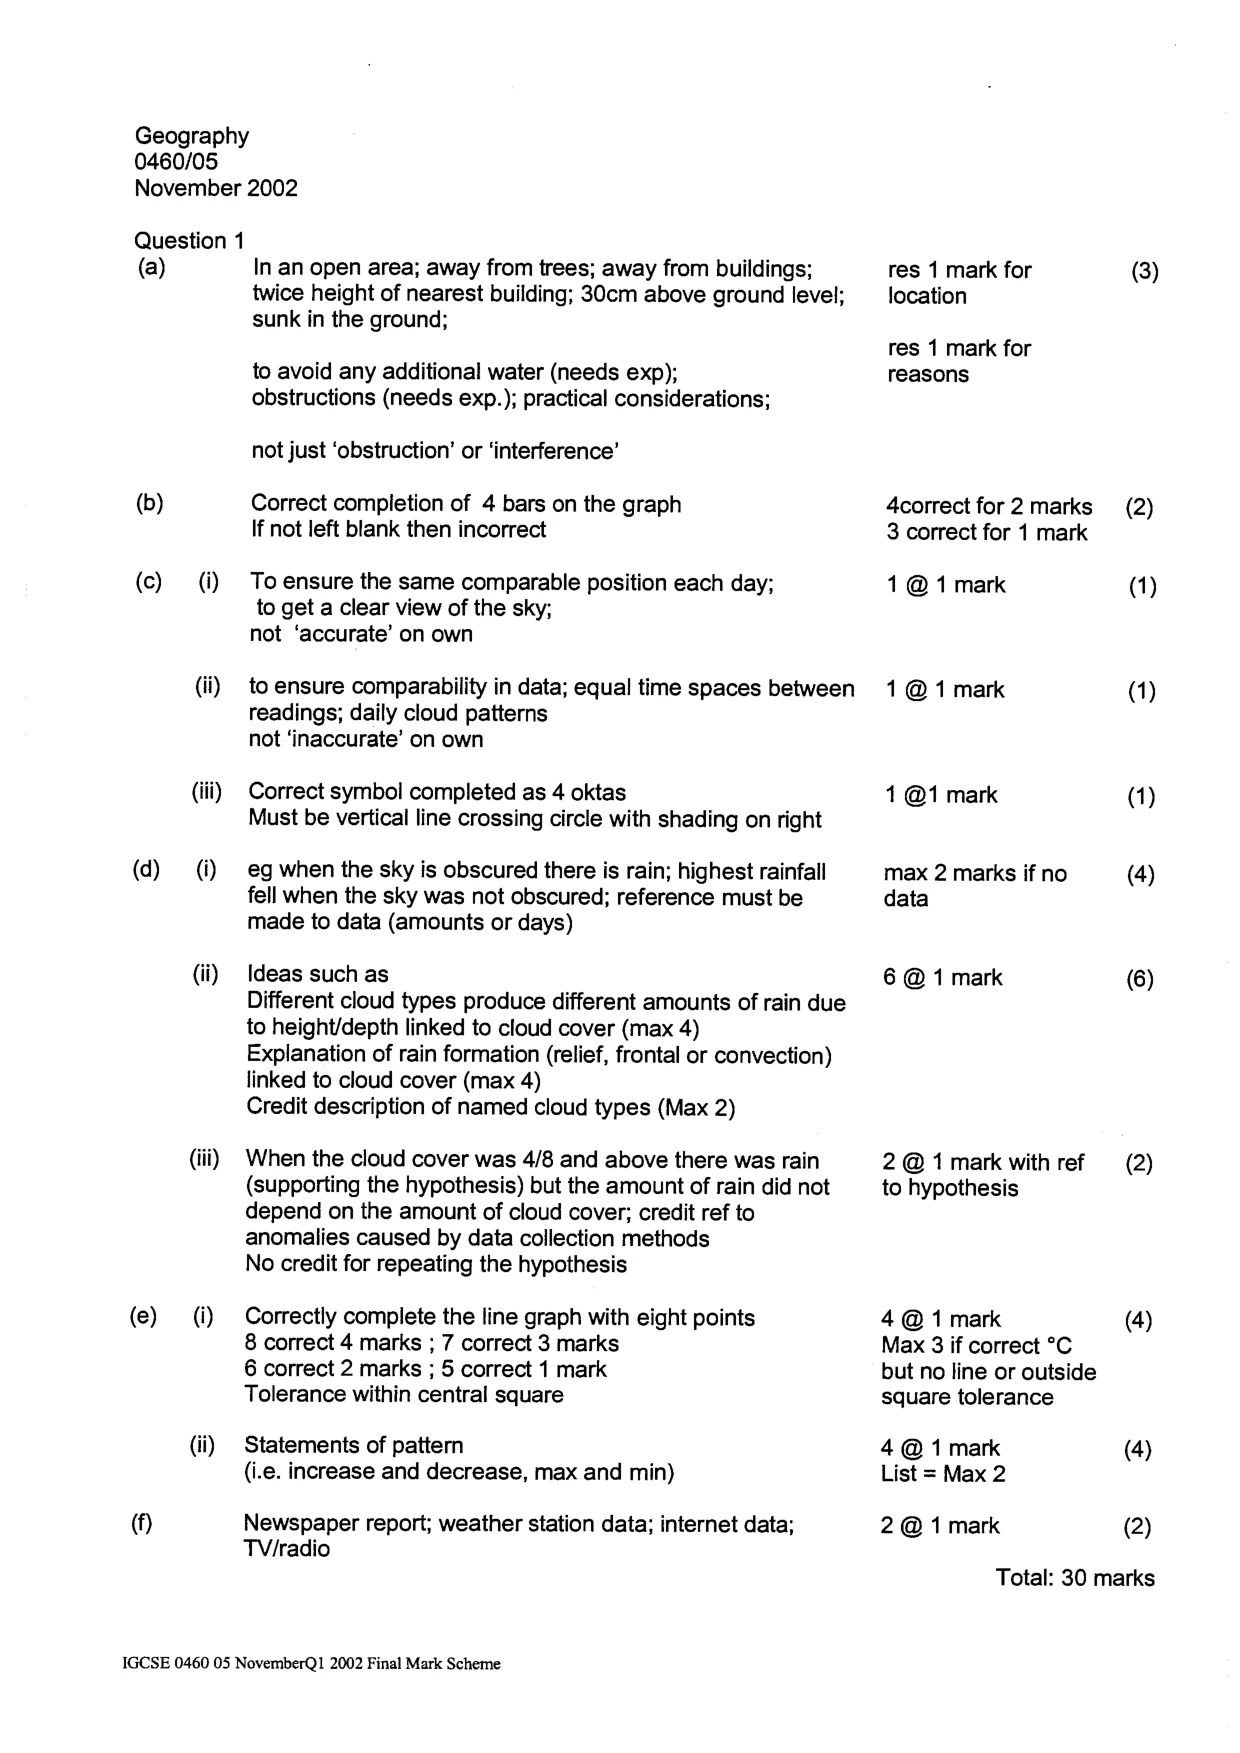
Geography 0460/05 November 2002 Question 1 (a) (b) () (i) (ii) (iii) @) (i) (ii) (iii) ee) (i) (ii) () In an open area; away from trees; away from buildings; twice height of nearest building; 30cm above ground level; sunk in the ground; to avoid any additional water (needs exp); obstructions (needs exp.); practical considerations; not just ‘obstruction’ or ‘interference’ Correct completion of 4 bars on the graph If not left blank then incorrect To ensure the same comparable position each day; to get a clear view of the sky; not ‘accurate’ on own to ensure comparability in data; equal time spaces between readings; daily cloud patterns not ‘inaccurate’ on own Correct symbol completed as 4 oktas Must be vertical line crossing circle with shading on right eg when the sky is obscured there is rain; highest rainfall fell when the sky was not obscured; reference must be made to data (amounts or days) Ideas such as Different cloud types produce different amounts of rain due to height/depth linked to cloud cover (max 4) Explanation of rain formation (relief, frontal or convection) linked to cloud cover (max 4) Credit description of named cloud types (Max 2) When the cloud cover was 4/8 and above there was rain (supporting the hypothesis) but the amount of rain did not depend on the amount of cloud cover; credit ref to anomalies caused by data collection methods No credit for repeating the hypothesis Correctly complete the line graph with eight points 8 correct 4 marks ; 7 correct 3 marks 6 correct 2 marks ; 5 correct 1 mark Tolerance within central square Statements of pattern (i.e. increase and decrease, max and min) Newspaper report; weather station data; internet data; TV/radio IGCSE 0460 05 NovemberQ1 2002 Final Mark Scheme res 1 mark for (3) location res 1 mark for reasons 4correct for2 marks (2) 3 correct for 1 mark 1@1 mark (1) 1@1 mark (1) 1 @1 mark (1) max 2 marks if no (4) data 6 @ 1 mark (6) 2@1mark withref (2) to hypothesis 4 @ 1 mark (4) Max 3 if correct °C but no line or outside square tolerance 4 @ 1 mark (4) List = Max 2 2 @ 1 mark (2) Total: 30 marks