Cambridge IGCSE Geography 0460 — 2003 Oct/Nov Paper 5 · Variant 1
0460/51/O/N/03
The question paper and its mark scheme, free to read here and free to download. This is Cambridge’s own paper, exactly as it was sat.
Question paper12 pages




Mark scheme
No mark scheme is in the library for this paper.
Paper as text
Question paper, page 1
This document consists of 3 printed pages, 1 blank page and an insert. SP (SM/SLC) S40798/2 © CIE 2003 [Turn over CAMBRIDGE INTERNATIONAL EXAMINATIONS International General Certificate of Secondary Education GEOGRAPHY 0460/05 Paper 5 Alternative to Coursework October/November 2003 1 hour 45 minutes Additional Materials: Answer Booklet/Paper Ruler READ THESE INSTRUCTIONS FIRST If you have been given an Answer Booklet, follow the instructions on the front cover of the Booklet. Write your Centre number, candidate number and name on all the work you hand in. Write in dark blue or black pen on both sides of the paper. Do not use staples, paper clips, highlighters, glue or correction fluid. Answer all questions. At the end of the examination, fasten all your work securely together. The number of marks is given in brackets [ ] at the end of each question or part question. Sketch maps and diagrams should be drawn whenever they serve to illustrate an answer. www.XtremePapers.com
Question paper, page 2
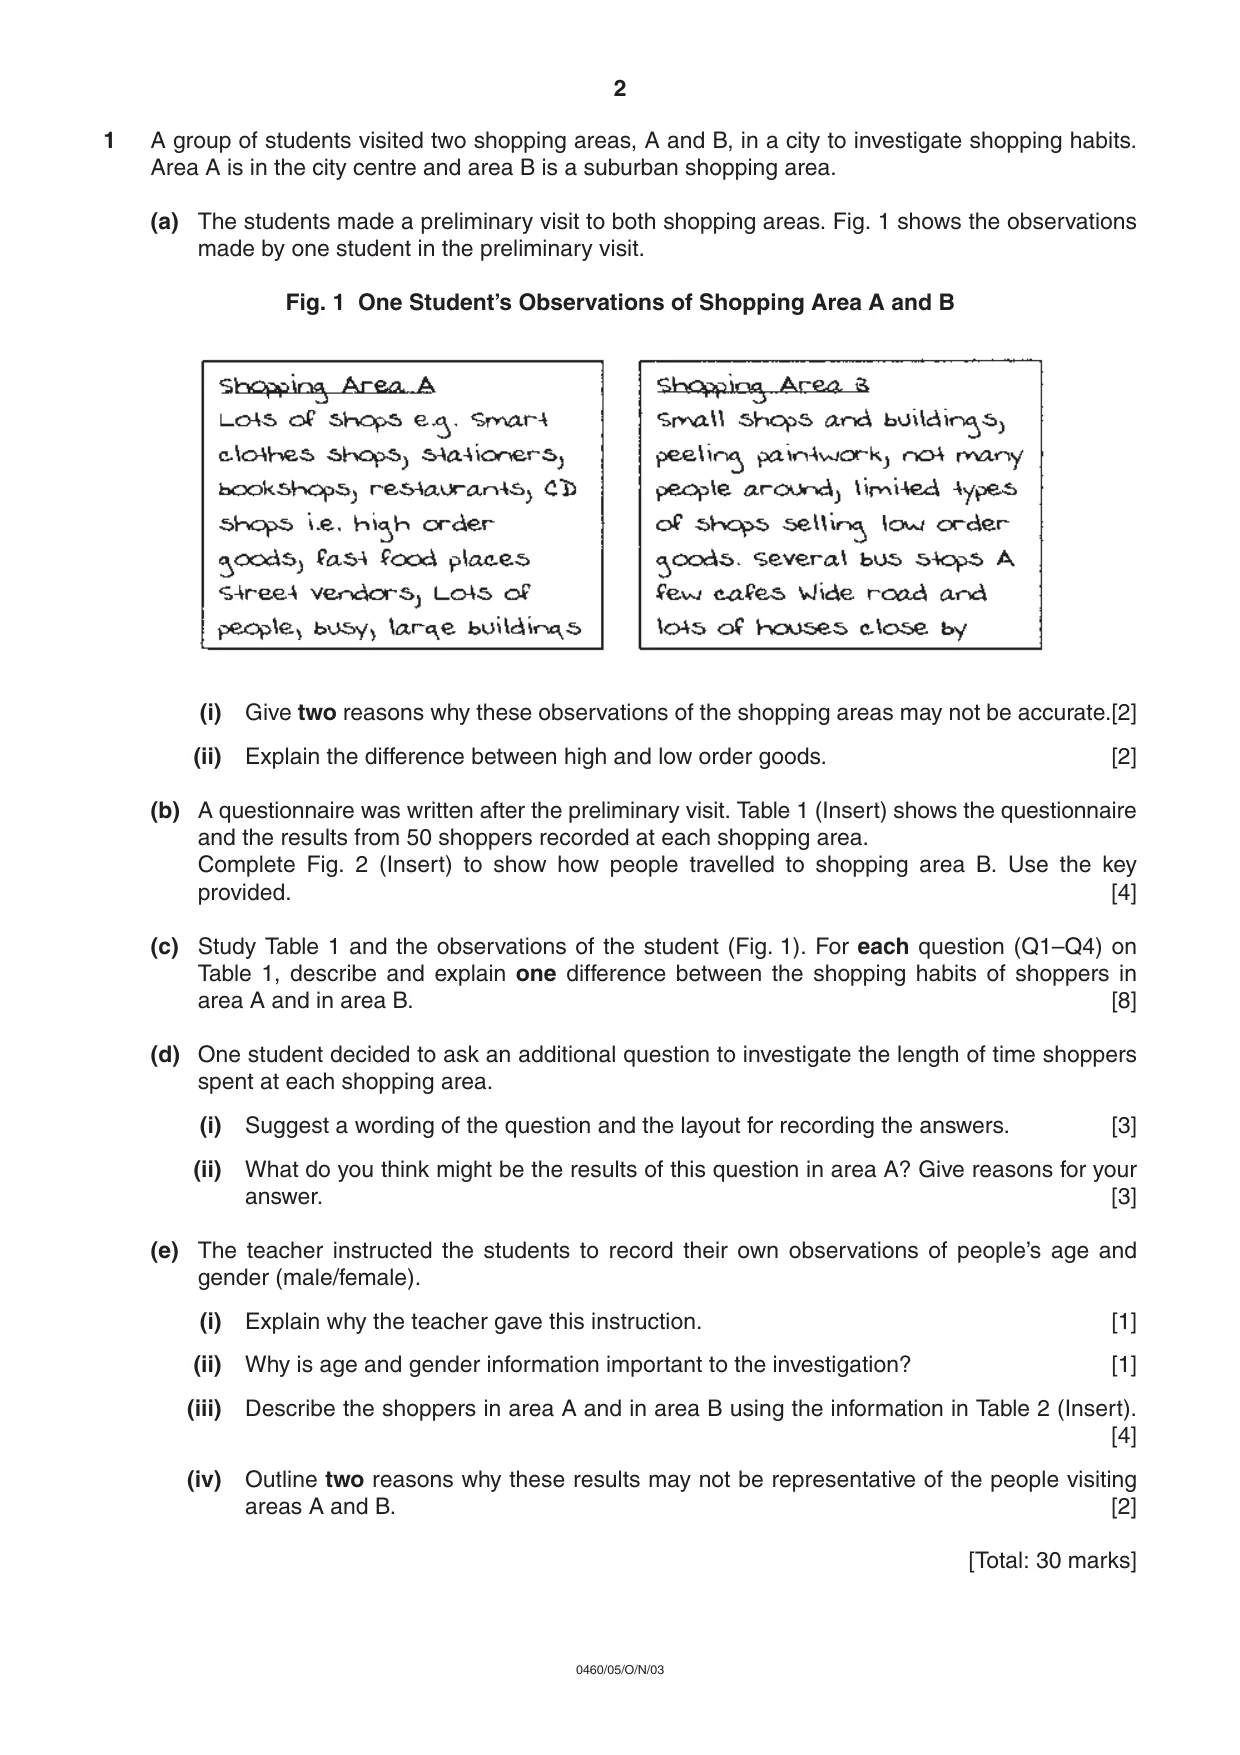
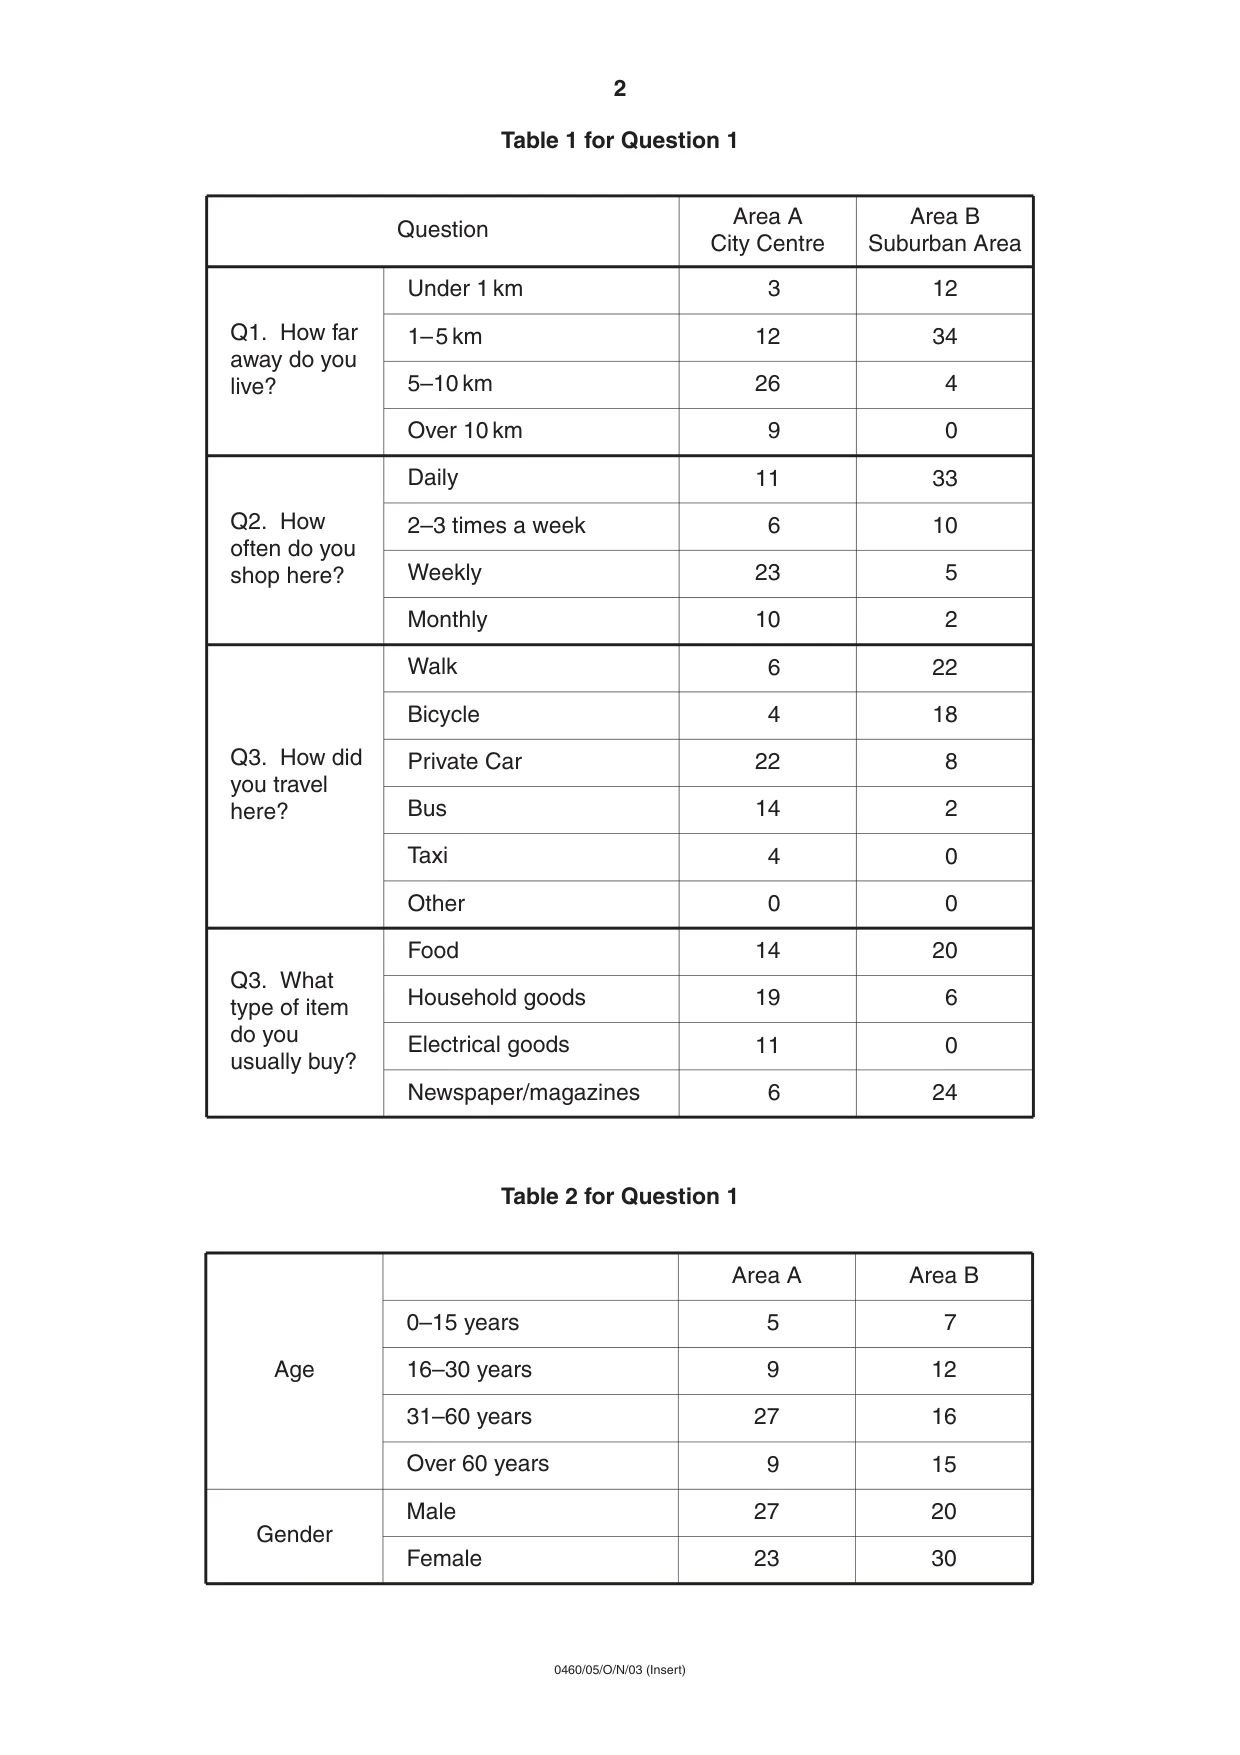
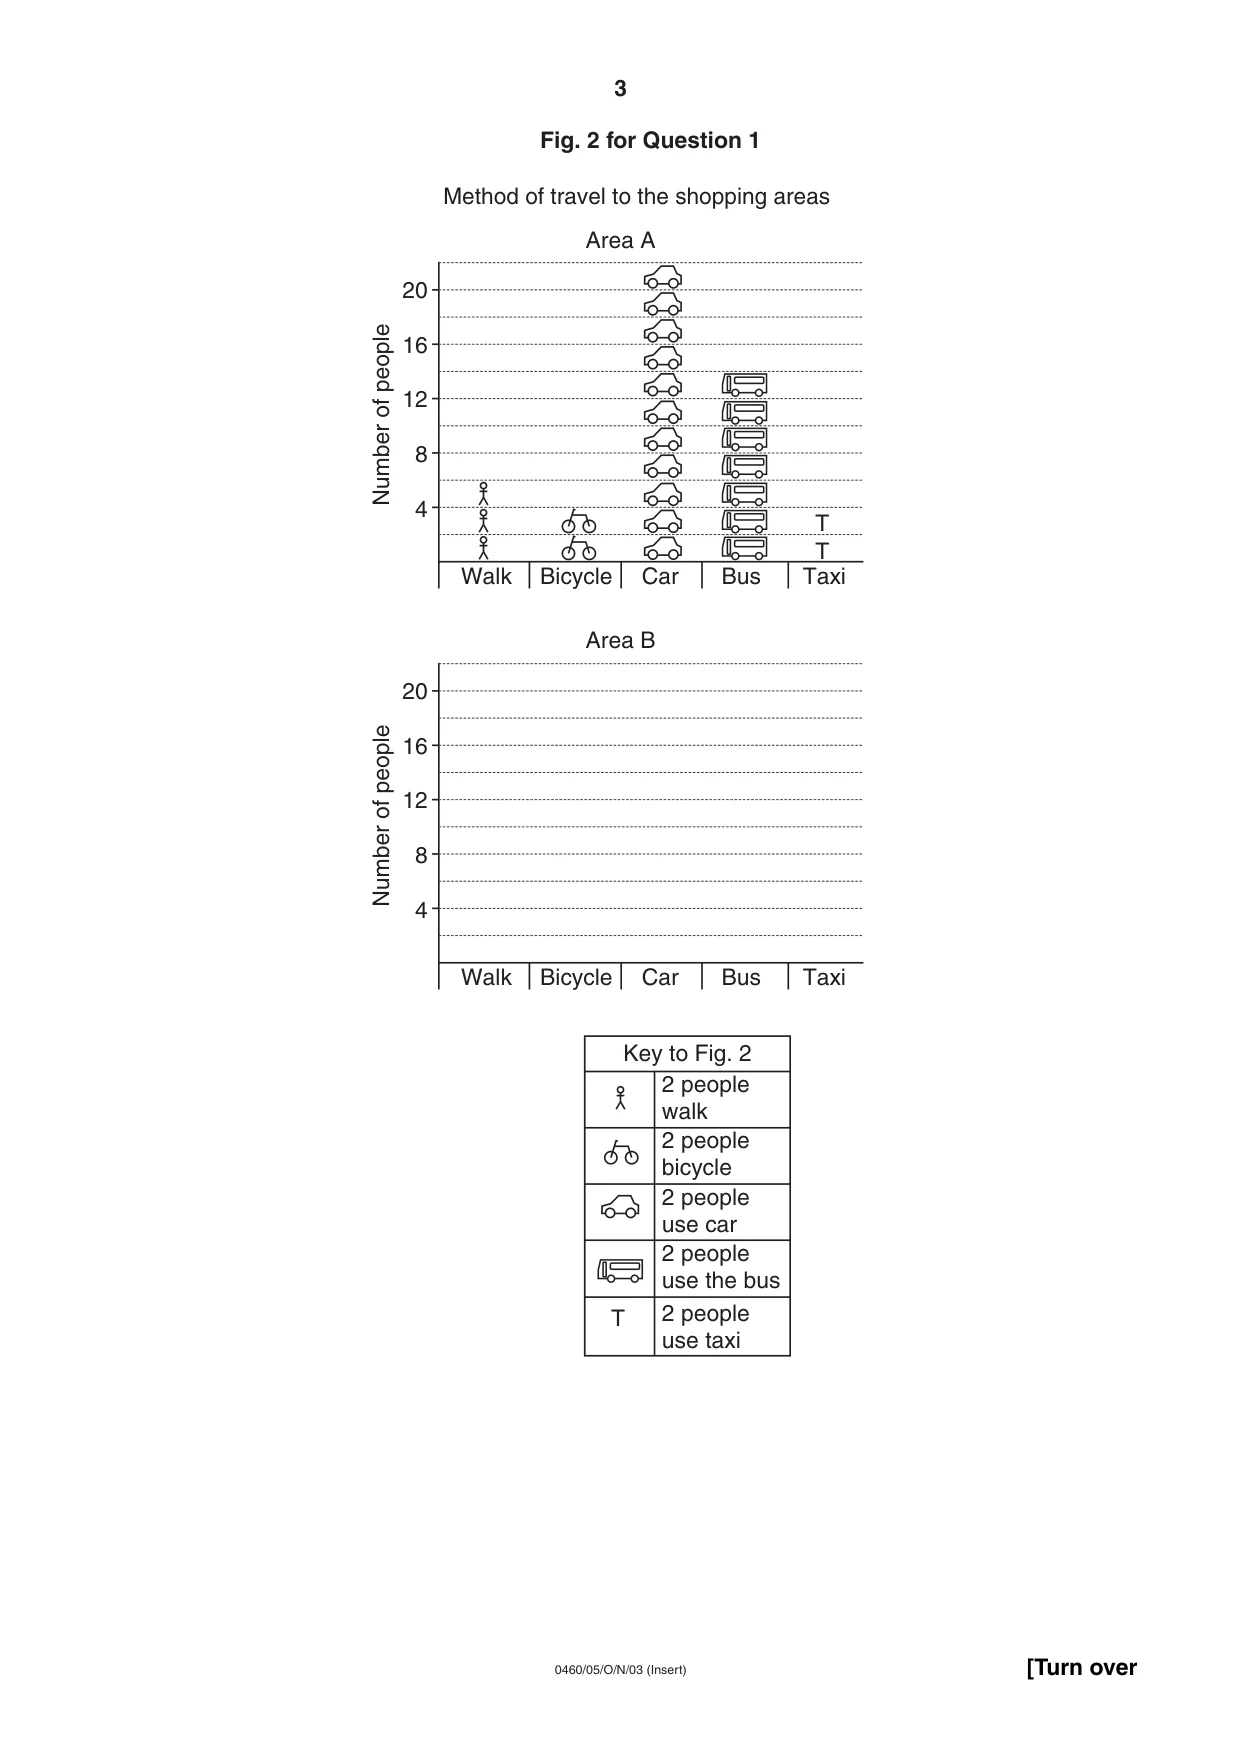
2 0460/05/O/N/03 1 A group of students visited two shopping areas, A and B, in a city to investigate shopping habits. Area A is in the city centre and area B is a suburban shopping area. (a) The students made a preliminary visit to both shopping areas. Fig. 1 shows the observations made by one student in the preliminary visit. Fig. 1 One Student’s Observations of Shopping Area A and B (i) Give two reasons why these observations of the shopping areas may not be accurate.[2] (ii) Explain the difference between high and low order goods. [2] (b) A questionnaire was written after the preliminary visit. Table 1 (Insert) shows the questionnaire and the results from 50 shoppers recorded at each shopping area. Complete Fig. 2 (Insert) to show how people travelled to shopping area B. Use the key provided. [4] (c) Study Table 1 and the observations of the student (Fig. 1). For each question (Q1–Q4) on Table 1, describe and explain one difference between the shopping habits of shoppers in area A and in area B. [8] (d) One student decided to ask an additional question to investigate the length of time shoppers spent at each shopping area. (i) Suggest a wording of the question and the layout for recording the answers. [3] (ii) What do you think might be the results of this question in area A? Give reasons for your answer. [3] (e) The teacher instructed the students to record their own observations of people’s age and gender (male/female). (i) Explain why the teacher gave this instruction. [1] (ii) Why is age and gender information important to the investigation? [1] (iii) Describe the shoppers in area A and in area B using the information in Table 2 (Insert). [4] (iv) Outline two reasons why these results may not be representative of the people visiting areas A and B. [2] [Total: 30 marks]
Question paper, page 3
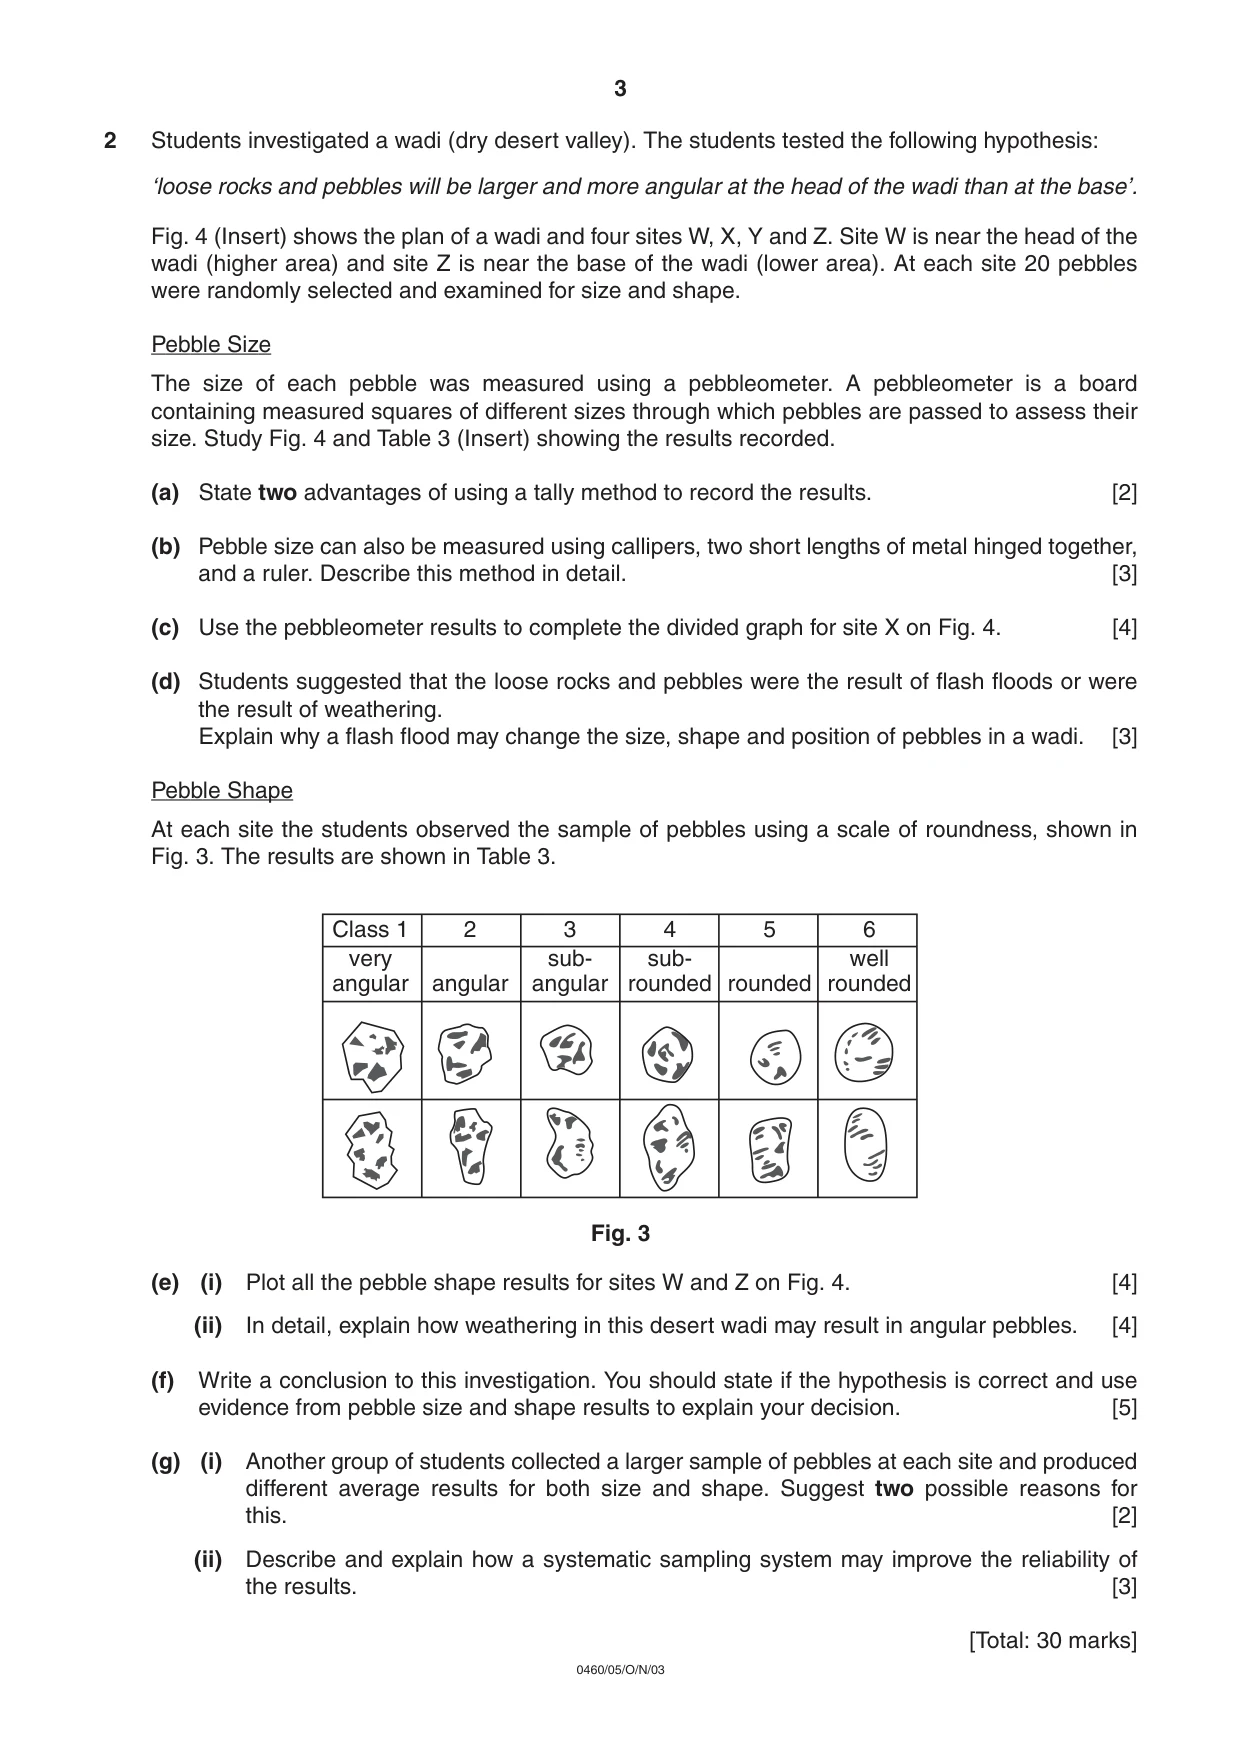
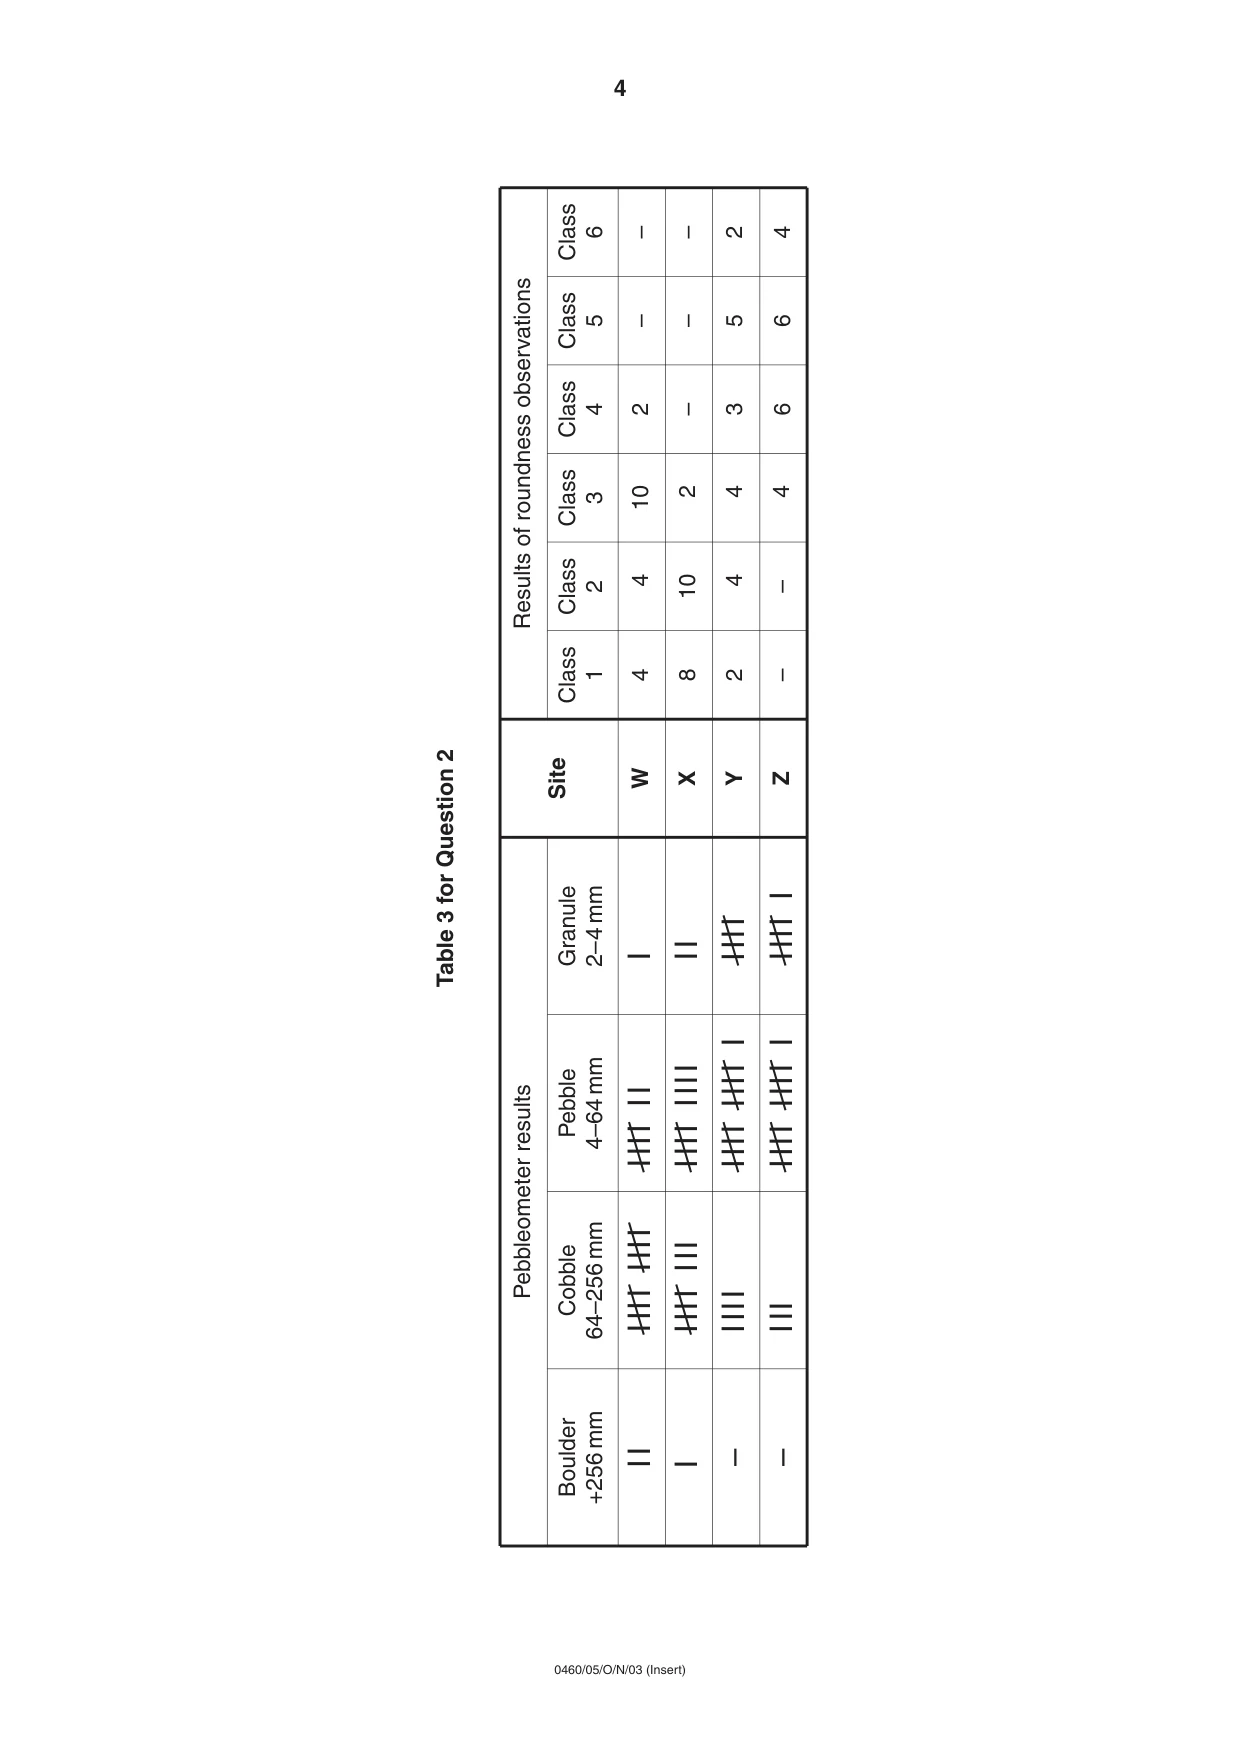
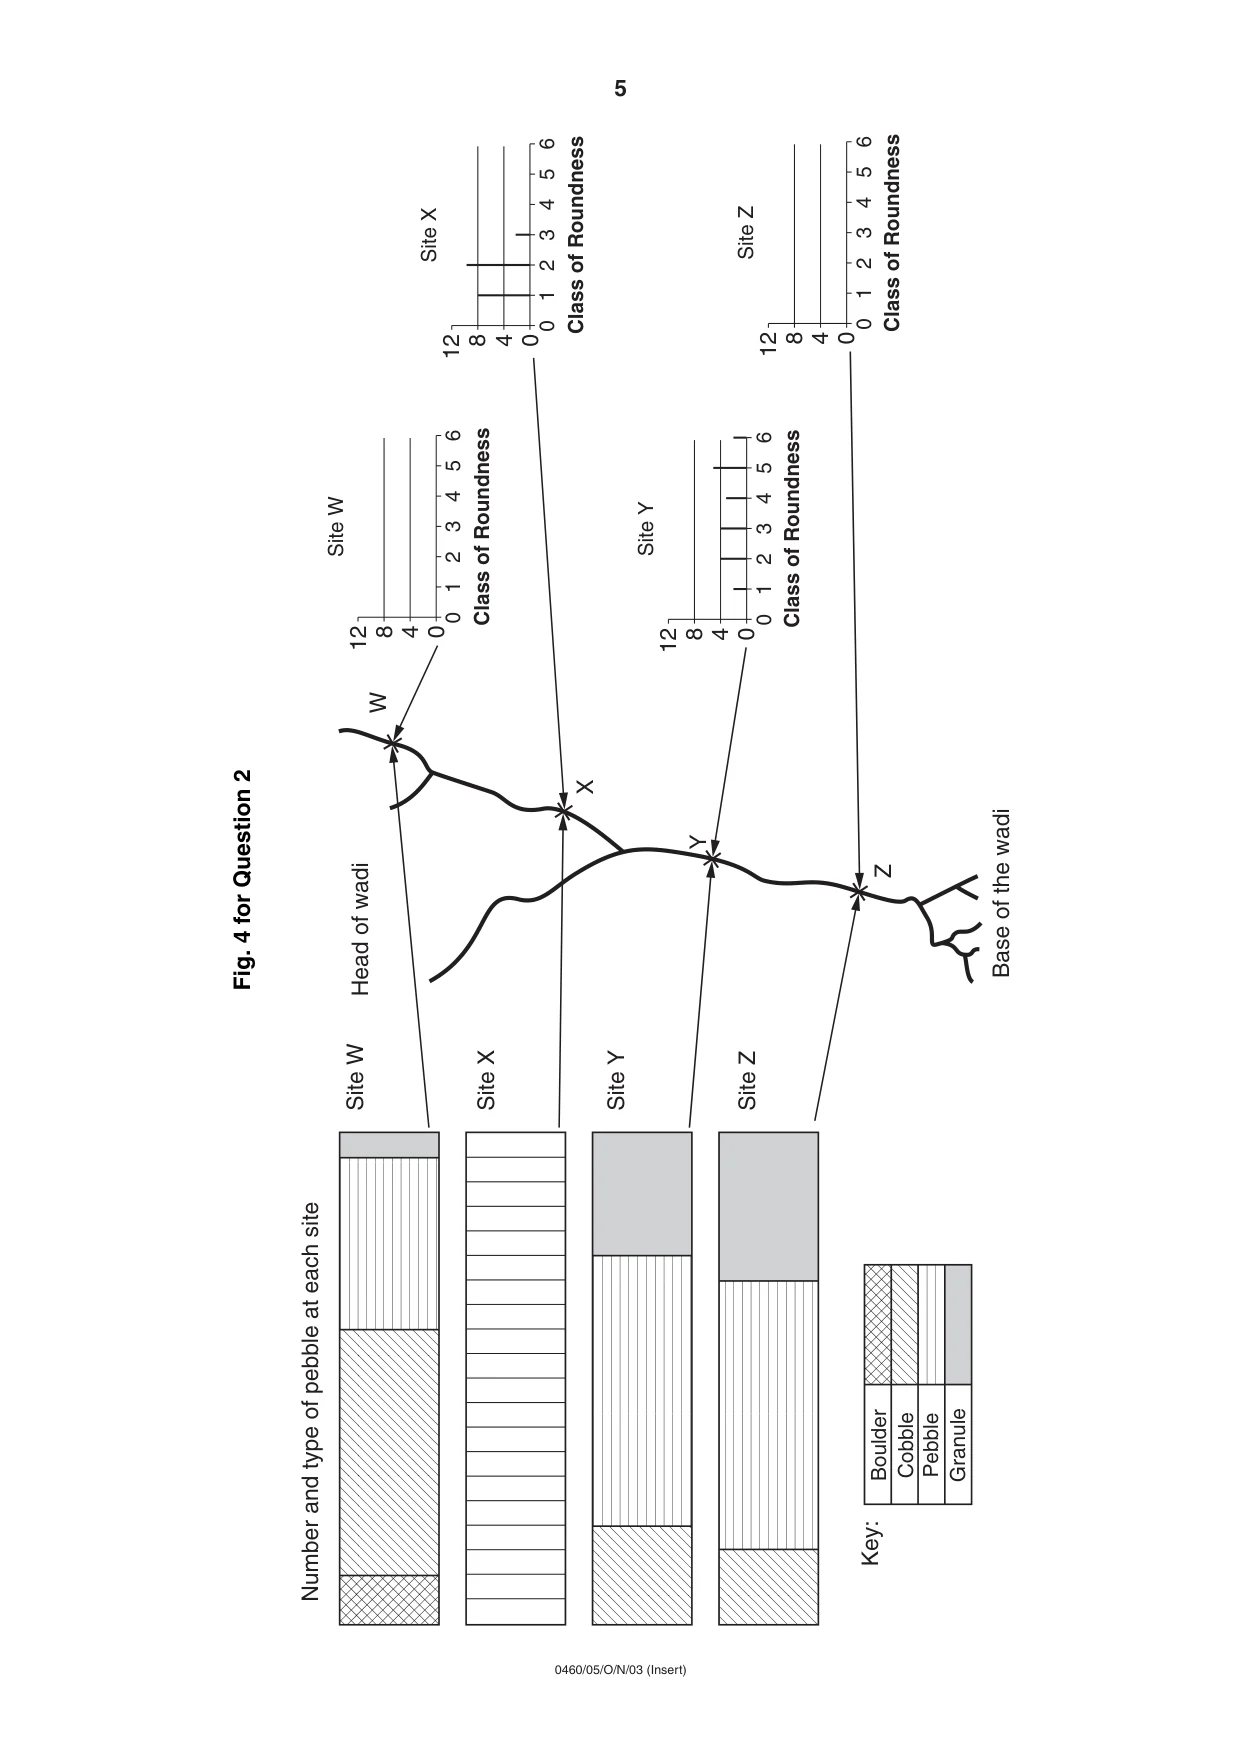
3 0460/05/O/N/03 2 Students investigated a wadi (dry desert valley). The students tested the following hypothesis: ‘loose rocks and pebbles will be larger and more angular at the head of the wadi than at the base’. Fig. 4 (Insert) shows the plan of a wadi and four sites W, X, Y and Z. Site W is near the head of the wadi (higher area) and site Z is near the base of the wadi (lower area). At each site 20 pebbles were randomly selected and examined for size and shape. Pebble Size The size of each pebble was measured using a pebbleometer. A pebbleometer is a board containing measured squares of different sizes through which pebbles are passed to assess their size. Study Fig. 4 and Table 3 (Insert) showing the results recorded. (a) State two advantages of using a tally method to record the results. [2] (b) Pebble size can also be measured using callipers, two short lengths of metal hinged together, and a ruler. Describe this method in detail. [3] (c) Use the pebbleometer results to complete the divided graph for site X on Fig. 4. [4] (d) Students suggested that the loose rocks and pebbles were the result of flash floods or were the result of weathering. Explain why a flash flood may change the size, shape and position of pebbles in a wadi. [3] Pebble Shape At each site the students observed the sample of pebbles using a scale of roundness, shown in Fig. 3. The results are shown in Table 3. Fig. 3 (e) (i) Plot all the pebble shape results for sites W and Z on Fig. 4. [4] (ii) In detail, explain how weathering in this desert wadi may result in angular pebbles. [4] (f) Write a conclusion to this investigation. You should state if the hypothesis is correct and use evidence from pebble size and shape results to explain your decision. [5] (g) (i) Another group of students collected a larger sample of pebbles at each site and produced different average results for both size and shape. Suggest two possible reasons for this. [2] (ii) Describe and explain how a systematic sampling system may improve the reliability of the results. [3] [Total: 30 marks] very angular Class 1 angular 2 sub- angular 3 sub- rounded 4 rounded 5 well rounded 6
Question paper, page 5
This document consists of 5 printed pages and 3 blank pages. SP (SM/SLC) S40798/1 © CIE 2003 [Turn over CAMBRIDGE INTERNATIONAL EXAMINATIONS International General Certificate of Secondary Education GEOGRAPHY 0460/05 Paper 5 Alternative to Coursework October/November 2003 1 hour 45 minutes INSERT READ THESE INSTRUCTIONS FIRST This insert contains Figs 2 and 4 and Tables 1, 2 and 3. Write your name, Centre number and Candidate number in the spaces at the top of this page and attach the insert to your answer paper/answer booklet. Centre Number Candidate Number Name
Question paper, page 6
2 0460/05/O/N/03 (Insert) Table 1 for Question 1 Table 2 for Question 1 Question Q1. How far away do you live? Q2. How often do you shop here? Q3. How did you travel here? Q3. What type of item do you usually buy? Under 1 km 1–5 km 5–10 km Over 10 km Daily 2–3 times a week Weekly Monthly Walk Bicycle Private Car Bus Taxi Other Food Household goods Electrical goods Newspaper/magazines Area A City Centre 3 12 34 4 0 12 26 9 11 33 10 5 2 22 18 8 2 0 0 20 6 0 24 6 23 10 6 4 22 14 4 0 14 19 11 6 Area B Suburban Area Age Gender 0–15 years 16–30 years 31–60 years Over 60 years Male Female Area A 5 9 27 9 27 23 Area B 7 12 16 15 20 30
Question paper, page 7
3 0460/05/O/N/03 (Insert) Fig. 2 for Question 1 Method of travel to the shopping areas 4 Walk Bicycle Car Area A Bus Taxi 8 12 16 Number of people 20 4 Walk Bicycle Car Bus Taxi 8 12 16 Number of people 20 Area B Key to Fig. 2 2 people walk 2 people bicycle 2 people use car 2 people use taxi 2 people use the bus T T T [Turn over
Question paper, page 8
4 0460/05/O/N/03 (Insert) Table 3 for Question 2 Pebbleometer results Site Results of roundness observations Class 1 4 W X Y Z 8 2 – 4 10 4 – 10 2 4 4 2 – 3 6 – – 5 6 – – 2 4 Class 2 Class 3 Class 4 Class 5 Class 6 Boulder +256 mm II IIII IIII IIII II IIII IIII IIII IIII I IIII I IIII II I IIII IIII I IIII III IIII III I – – Cobble 64–256 mm Pebble 4–64 mm Granule 2–4 mm
Question paper, page 9
5 0460/05/O/N/03 (Insert) Base of the wadi Head of wadi Boulder Cobble Pebble Granule Key: Site W Site X Site Y Site Z Number and type of pebble at each site 0 0 4 8 12 1 2 3 Class of Roundness Site W 4 5 6 0 0 4 8 12 1 2 3 Class of Roundness Site X 4 5 6 0 0 4 8 12 1 2 3 Class of Roundness Site Y 4 5 6 0 0 4 8 12 1 2 3 Class of Roundness Site Z 4 5 6 W X Y Z Fig. 4 for Question 2